

Motorola RF Planning Bible Diagram

RF Planning Bible: TP RF - Central
RF Planning Bible
The Few, The Proud
1

RF Planning Bible: TP RF - Central
Chapter 1: CELL SITE PLANNING............................................... 8
Chapter 2: SITE DATABASE CREATION ................................. 24
Chapter 3: RF ROLLOUT ............................................................. 34
Chapter 4: PRE-LAUNCH OPTIMIZATION .............................. 52
Chapter 5: INDOOR SOLUTIONS ............................................... 60
Chapter 6: PROPAGATION MODEL TUNING ......................... 86
Chapter 7: FREQUENCY PLANNING ........................................ 99
Chapter 8: FREQUENCY RETUNING / REDESIGN ............... 116
ATTACHEMENTS ..................................................................... 122
LNKS: .......................................................................................... 124
ABBREVIATIONS: .................................................................... 125
REFRENCES: .............................................................................. 127
2

RF Planning Bible: TP RF - Central
List of Figures:
Fig 1.1 Cell Site Planning Process ....................................................................................8
Fig 1.2: Coverage Prediction before planning coverage cell site ...................................10
Fig 1.3: Coverage Prediction after planning coverage cell site ......................................11
Fig 1.4: Google view showing coverage cell site............................................................11
Fig 1.5: MapInfo view of Capacity planned sites ...........................................................13
Fig 1.6: Google Earth View of Capacity Planned Sites ...................................................14
Fig 1.7: Coverage Where I am Template sheet ...............................................................16
Fig 1.8: MapInfo View of DCS only Site .......................................................................17
Fig 1.9: Google Earth View of DCS only Site ................................................................18
Fig 1.10: MapInfo view for Site Design Finalization .....................................................21
Fig 1.11: Google Earth view for Site Design Finalization .............................................21
Fig 2.1: Telenor Frequency band ......................................................................................25
Fig 2.2: Hexagonal Structure .............................................................................................26
Fig 2.3: Cells in practice ....................................................................................................26
Fig 2.4: Cell Pattern ...........................................................................................................27
Fig 2.5: interference ...........................................................................................................28
Fig 2.7 C/A .........................................................................................................................29
Fig 2.8: GSM specifications for C/I and C/A ...................................................................29
Fig 2.9: Frequency Re-use Pattern ....................................................................................30
Fig 3.1: View of SAR validation Candidates .................................................................36
Fig 3.2: Google Earth View of SAR validation Candidates ............................................37
Fig 3.3: Urban area Coverage ............................................................................................41
Fig 3.4: Urban Map Info View ..........................................................................................42
Fig 3.5: Urban Google Earth View ...................................................................................42
Fig 3.6: Sub-Urban area Coverage ....................................................................................43
Fig 3.7: Suburban Map Info View ....................................................................................44
Fig 3.8: Suburban Google Earth View ..............................................................................44
3

RF Planning Bible: TP RF - Central
Fig 3.9: Rural area Coverage .............................................................................................45
Fig 3.10: Rural Map Info View .........................................................................................45
Fig 3.11: Rural Google Earth View ..................................................................................46
Fig 3.13: Roads Map Info View ........................................................................................47
Fig 3.14: Roads Google Earth View .................................................................................47
Fig 3.15: Map Info view ....................................................................................................48
Fig 3.16: Google Earth view ..............................................................................................49
Fig 4.1: Pre-Launch Optimization Process Flow .............................................................54
Fig 5.1: Omni Directional Antennas .................................................................................64
Fig 5.2: Directional Antennas ............................................................................................64
Fig 5.4: Splitters Specifications .........................................................................................66
Fig 5.5: Power Couplers ....................................................................................................67
Fig 5.6: Couplers Specifications ......................................................................................68
Fig 5.8: Active solution layout ..........................................................................................69
Fig 5.9: Base station Master Unit ......................................................................................70
Fig 5.10: VAM ...................................................................................................................70
Fig 5.11: RF Combiner Module ........................................................................................71
Fig 5.12: RSSI of different servers with floor plans ........................................................72
Fig 5.13: Priority area marking for an indoor site location .............................................73
Fig 5.14: Improvement in indoor coverage .....................................................................74
Fig 5.15: Link Budget Calculations ..................................................................................78
Fig 5.16: RF indoor Plan for a floor ..................................................................................79
Fig 5.17: Measurements for Cable lengths .......................................................................79
Fig 5.18: Antenna Tree diagram........................................................................................80
Fig 5.19: Indoor Equipment List .......................................................................................81
Fig 5.20: Rx-Level Idle mode............................................................................................83
Fig 5.21: Rx-Qual Dedicated mode...................................................................................83
Fig 5.22: Spillage ...............................................................................................................84
Fig 6.1: Propagation Model parameters values ................................................................88
Fig 6.2: Propagation Model parameters ............................................................................89
4

RF Planning Bible: TP RF - Central
Fig 6.3: Site Selection ........................................................................................................91
Fig 6.4: CW Measurement process ...................................................................................92
Fig 6.5: Equipment used ....................................................................................................93
Fig 6.6: Model tuning process ...........................................................................................95
Fig 6.7: Analysis.................................................................................................................96
Fig 6.8: Error vs Log Graph (Before) ...............................................................................97
Fig 6.9: Error vs. Log Graph (After) ................................................................................97
Fig 6.10: RxLev vs. Log (distance)-Before ......................................................................97
Fig 6.11: RxLev vs. Log (distance)-After.........................................................................98
Fig 7.1: Frequency Planning ........................................................................................... 100
Fig 7.2: Cost Matrix Weight-age .................................................................................... 102
Fig 7.3: ILSA diagram .................................................................................................... 103
Fig 7.4: ILSA Setup ........................................................................................................ 103
Fig 7.5: Assigning carriers .............................................................................................. 104
Fig 7.6: Neighbour Plan in Site Database ...................................................................... 105
Fig 7.7: Neighbours in Map Window ............................................................................ 106
Fig 7.8: ILSA Frequency Planner................................................................................... 107
Fig7.9: ILSA Frequency Planner & Plan List Window ............................................... 107
Fig 7.10: ILSA Plan Status ............................................................................................ 108
Fig 7.11: Plan Cost Summary ........................................................................................ 108
Fig 7.12: ILSA FP Result .............................................................................................. 109
Fig 7.13: Creating Arrays ............................................................................................... 110
Fig 7.14: Worst Interferer ............................................................................................... 111
Fig 7.15: ILSA Cost/Interference Graph ....................................................................... 112
Fig 8.1: Pre- & Post-Activity City Coverage and Rx Level ......................................... 120
Fig 8.2: RxQual Plot of the Gujranwala city before and after the activity .................. 121
5

RF Planning Bible: TP RF - Central
6
RF Planning Bible: TP RF - Central
The Few The
Proud.pdf
Dedicated to:
RF Planning Central
7
RF Planning Bible: TP RF - Central
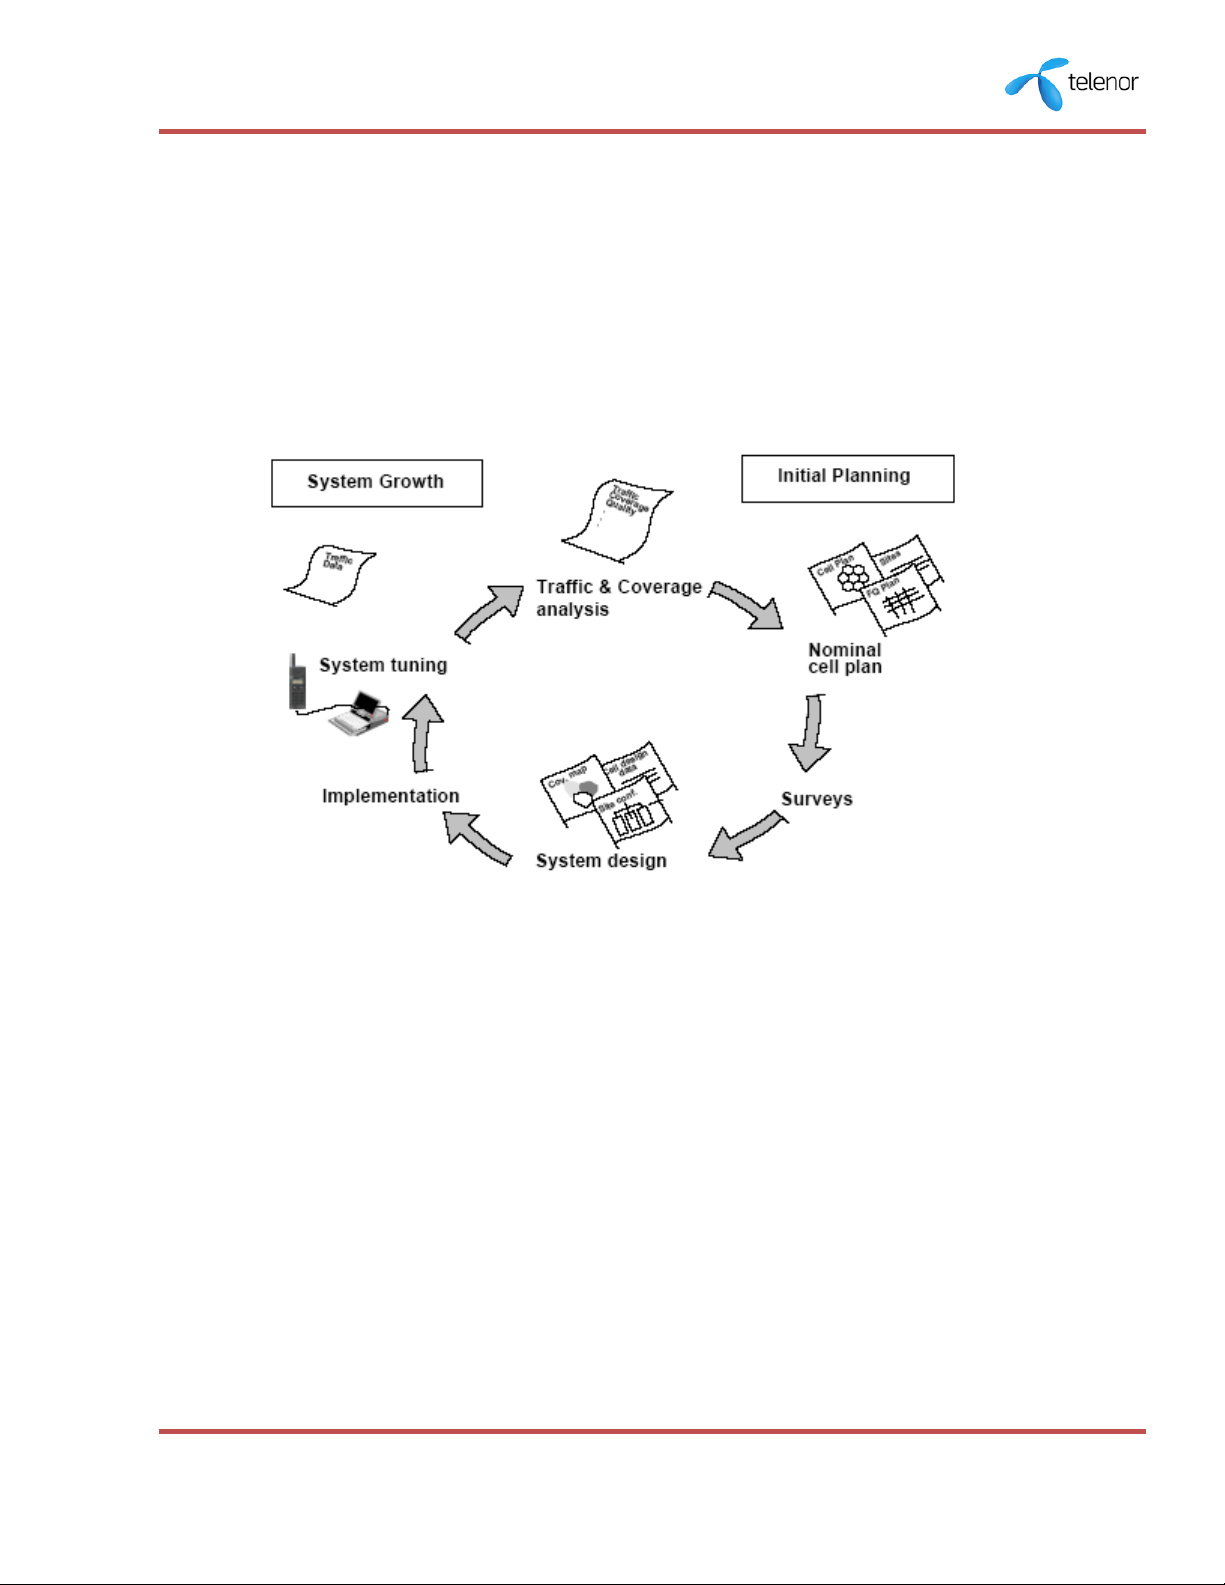
Chapter 1: CELL SITE PLANNING
Every cellular network needs cell site planning in order to ensure coverage
requirements, to maximize capacity requirements and to avoid interference. The cell
planning process consists of many different tasks, all together making it possible to
achieve a well working network. The major activities involved in the cell planning
process are represented below:
Fig 1.1 Cell Site Planning Process
Why Cell Site Planning?
A cell may be defined as an area of radio coverage from one BTS antenna system. It is
the smallest building block in a mobile network and is the reason why mobile networks
are often referred to as cellular networks. Cell site planning can briefly be described as
all the activities involved in determining which sites should be used for the radio
equipment, which equipment should be used, and how the equipment should be
configured. To ensure coverage, to cater the capacity requirements and to avoid
interference, each cellular network needs Cell Site Planning.
8

RF Planning Bible: TP RF - Central
Nominal Survey Point Identification
The cell site planning process is started by a coverage analysis, capacity analysis and
customer feedback. Coverage analysis identifies the poor coverage locations and
capacity analysis provides the high traffic cells in the cellular network. Sales and
Distribution team also plays a major role in analyzing the coverage and capacity issues
by providing the subscriber forecast of low coverage areas and growth rate distribution
of populated areas. Coverage holes and poor coverage areas are identified with the help
of ‘’ASSET’’ predictions (AIRCOM based tool used for coverage analysis) and a suitable
nominal survey point (longitude, latitude) is chosen for detailed area profiling visit
(Nominal Survey) to provide coverage to all the customers. Nominal Survey points are
also identified after monitoring the timing advance (TA) stats of the high traffic cells to
address the capacity issues. Also, the customer feed back is an important parameter to
determine the network quality in a certain region. Customer feedback is analyzed prior
to coverage or capacity issue and then addressed as discussed above.
All these analysis performed by RF Planner and feedback from the commercial form the
basis of new nominal survey plan. A new nominal survey plan consists of nominal
geographic coordinates for which detailed area profiling visits are required to evaluate
the feasibility of new cell sites.
Coverage Planning
In order to provide the coverage solutions in the cellular network, radio frequency
planning team extracts the latest coverage prediction from the AIRCOM based tool
‘’ASSET’’. This prediction is helpful in identifying the poor coverage areas in the cellular
network.
9
RF Planning Bible: TP RF - Central
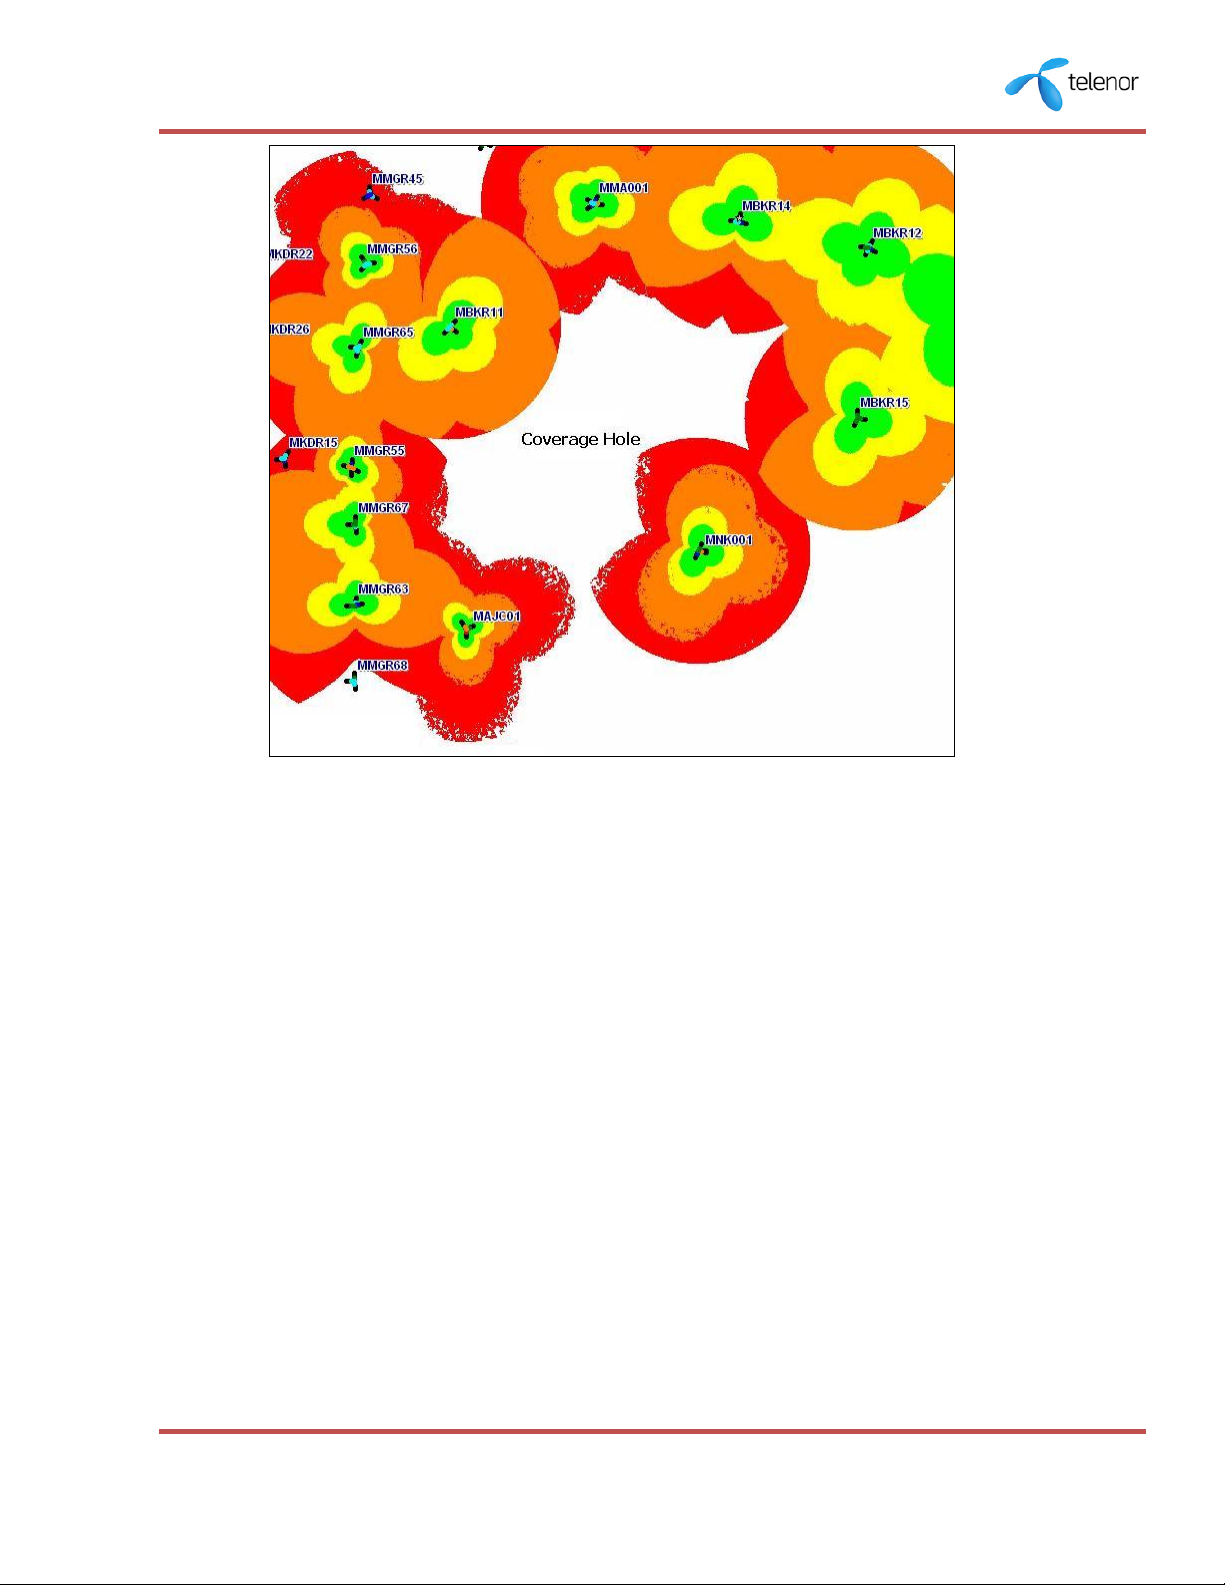
Fig 1.2: Coverage Prediction before planning coverage cell site
RF Planning Team updates the Asset database with the latest On Air and Planned sites.
Then, Path Loss Predictor is defined according to the requirements like filters,(On Air or
Planned), radius, area and resolution of the map to be used. All these requirements can
be defined with the help of Asset. The legend of the coverage for the selected ranges
can also be defined. Path Loss predictor is then run and the best server coverage is
displayed. The best server coverage prediction is then exported in .mif or .tab format
and can be viewed in MapInfo Professional. The feasibility of the new site is then
evaluated from coverage holes or poor coverage areas and nominal surveys (detailed
area profiling visits) are carried out to know the geographical terrain and expected
capacity (traffic load).Fig 1.2 shows the coverage hole in the cellular network while fig
1.3 shows the coverage prediction after planning new cell site.
10
RF Planning Bible: TP RF - Central
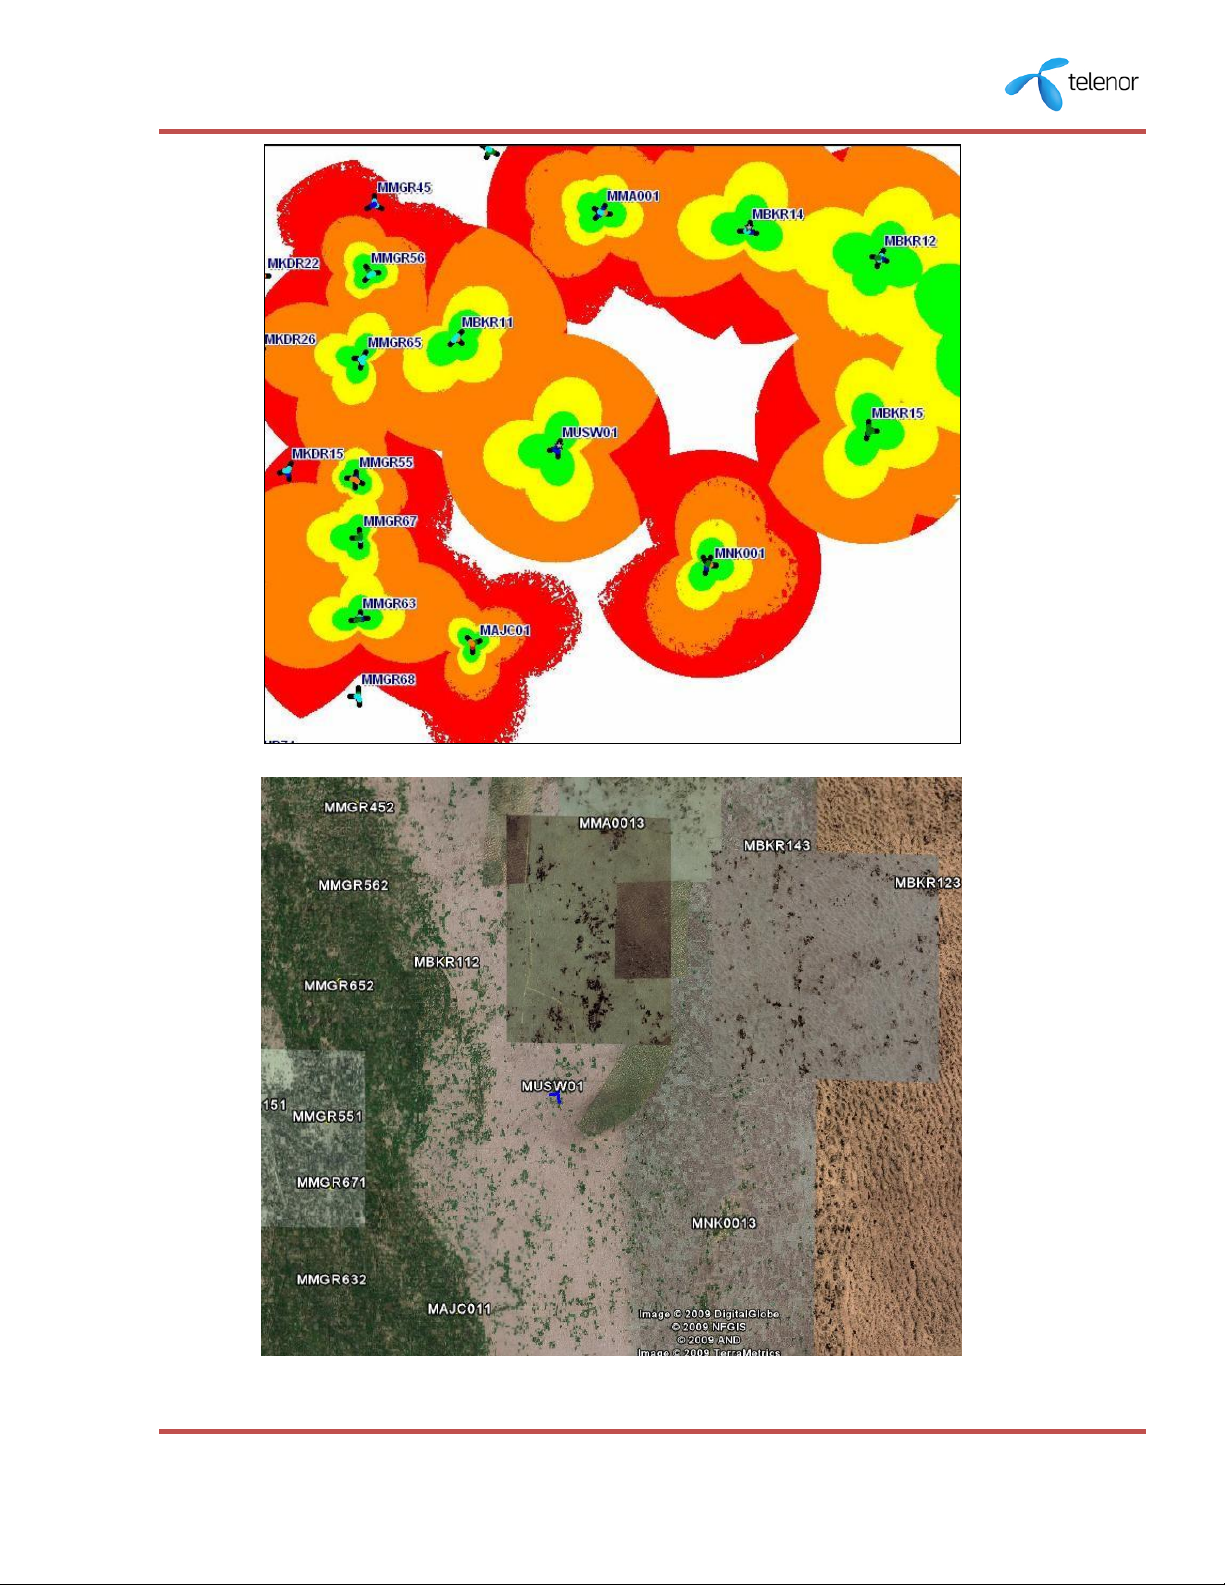
Fig 1.3: Coverage Prediction after planning coverage cell site
Fig 1.4: Google view showing coverage cell site
11

RF Planning Bible: TP RF - Central
Parameter
Formulae
GSM Traffic
Erl_C_F+Erl_C_H
DCS Traffic
Erl_I_F+Erl_I_H
Call Setup Block Rate
TASSFAIL_NoRadio/(TASSATT_F+TASSATT_H)
Total Time Slots(TS)
NRDEFTCH_C + NRDEFTCH_I
GSM Trxs
IF(ROUND(NRDEFTCH_C /8,0)- NRDEFTCH_C /8>=0,
ROUND(NRDEFTCH_C /8,0),ROUND(NRDEFTCH_C /8,0)+1)
DCS Trxs
IF(ROUND(NRDEFTCH_I/8,0)- NRDEFTCH_I
/8>=0,ROUND(NRDEFTCH_I/8,0),ROUND(NRDEFTCH_I/8,0)+1
Segment Trxs
IF(ROUND(Total_TS/8,0)- Total_TS /8>=0,ROUND(Total_TS
/8,0),ROUND(Total_TS /8,0)+1)
Offered Traffic*
(Total TS Erlang B Poison Prediction)*1.5
Carried Traffic
GSM Traffic+DCS Traffic
TCH Utilization
Carried Traffic/Offered Traffic*100
Capacity Planning
One of the basis for cell site planning is the traffic demand, i.e. how many subscribers
use the network and how much traffic they generate. The Erlang (E) is a unit of
measurement of traffic intensity.
To meet the capacity requirements, RF Planning Team monitors the traffic stats of the
network on weekly basis (averaged for one week) and identifies the
high traffic cells. The traffic stats are extracted for both Nokia and Siemens regions
separately depending upon the equipment installed vendor in that region. For Nokia and
Siemens region, traffic stats are extracted from the ‘’Nokia Optima Harmonized Tool’’
and ‘’Stat Mon Tool’’ respectively. Both these tools contain all the network parameters
data and are used for network planning and optimization. For capacity planning, GSM
Traffic, DCS Traffic, Call Setup Block Rate, Traffic Channel Utilization and Erlang/Trx are
our main area of interest.
For Nokia region, segment level busy hour stats are extracted from query ‘’Segment BH
Traffic’’ within the ‘’Nokia Optima Harmonized Tool’’ for the selective dates. Clutter
classification and Trx count for GSM and DCS in each segment are provided by
Optimization team. Site name, Azimuths, Longitude, Latitude, On-Air Date, Status are
taken from MapInfo weekly files.
For Siemens region, BH stat sheets of the days required are added into ‘’Stat Mon Tool’.
These stat sheets are available at the centralized server. Segment per Busy Hour (SPBH)
is run from trender tab within the tool by putting in the dates of the sheets added
earlier to get the GSM and DCS traffic. The other parameters are calculated as follows.
12
RF Planning Bible: TP RF - Central
Using Total_TS and Grade of Service(2%) , Erlang B Poisson traffic prediction will
give the Offered traffic and multiplying it by 1.5(assuming the half rate HR is
enabled on every segment) to give total Offered traffic.
Final Excel sheet of traffic stats and MapInfo tab file are then filtered for high traffic
areas. The cells having CS block rate > 5% and TCH utilization > 100 % are then evaluated
for the Trx expansions or new cell sites through Google Earth and MapInfo. Nominal
surveys are planned after monitoring the TA stats from where the maximum traffic is
generated for knowing the geographical terrain and the expected capacity (traffic load).
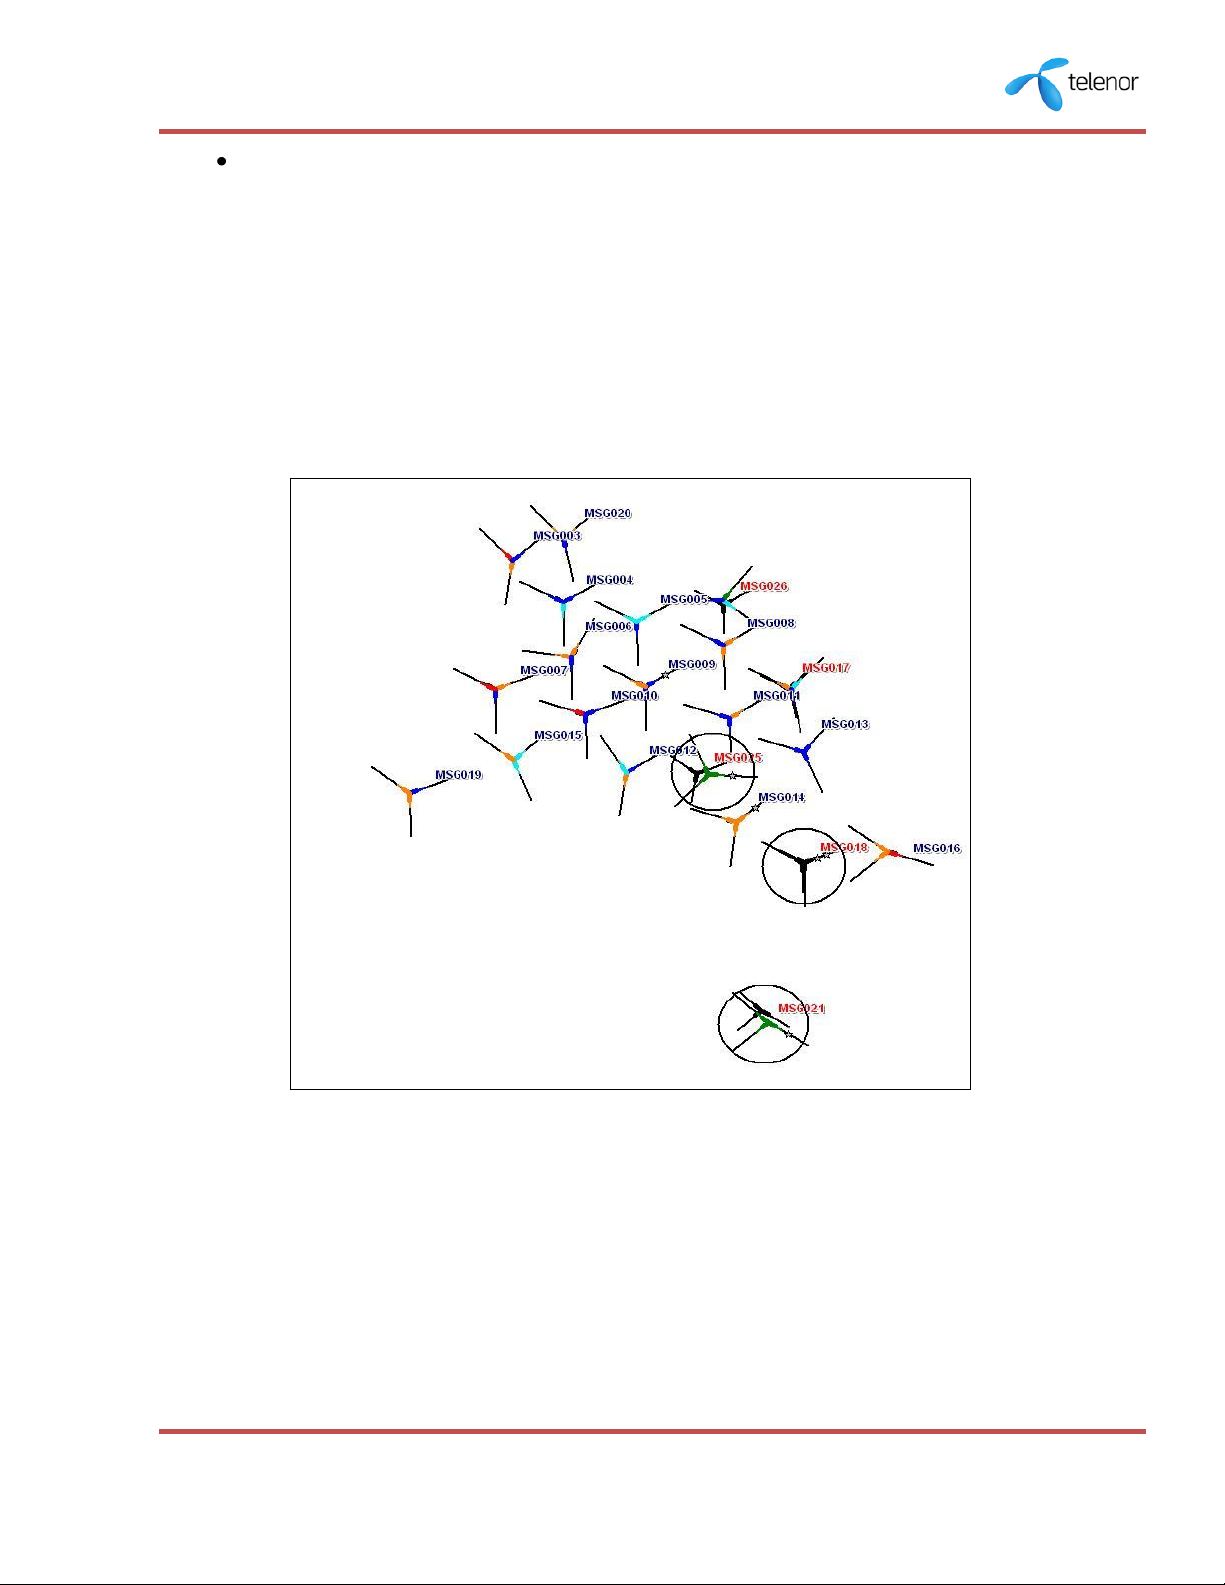
Fig 1.5: MapInfo view of Capacity planned sites
13
RF Planning Bible: TP RF - Central
Erlang B Table.pdf
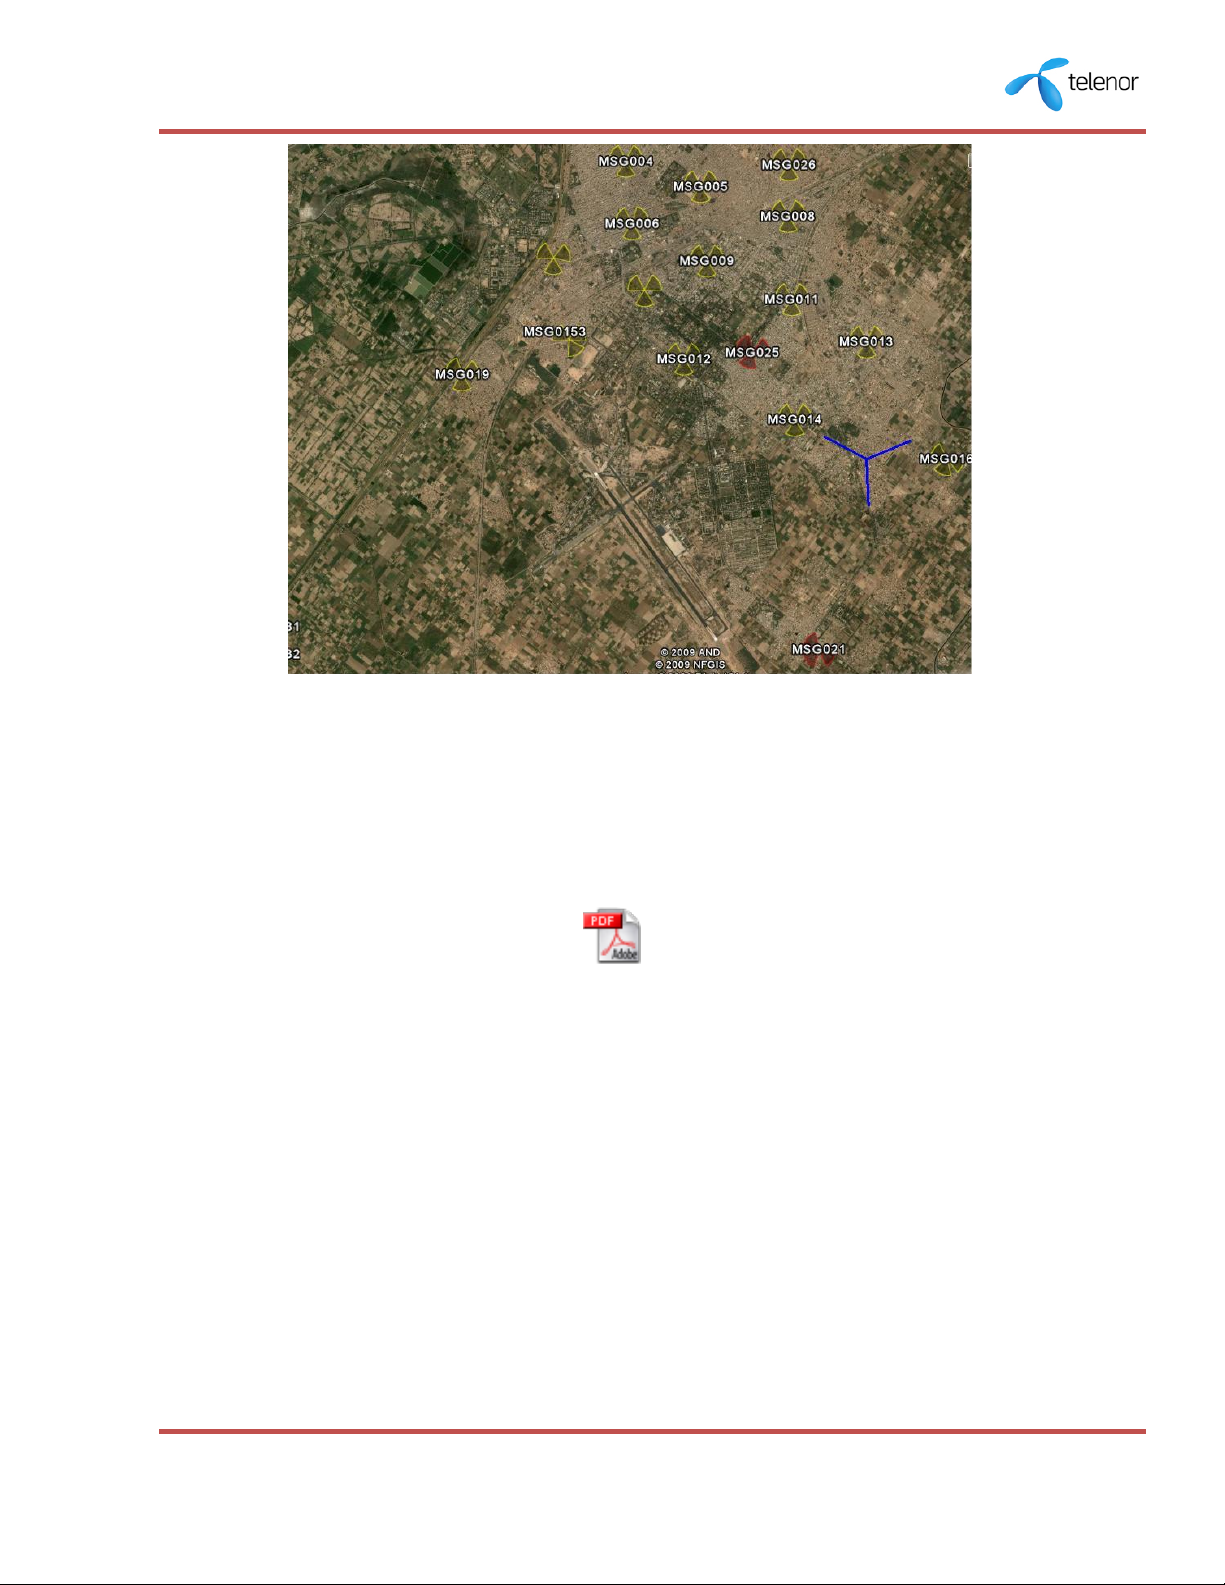
Fig 1.6: Google Earth View of Capacity Planned Sites
The cell site MSG018 and MSG021 are planned as a capacity sites to share the traffic of
neighboring cells MSG0142 and MSG0162 having TCH utilizations greater than 100%.
The nominal locations of these planned sites are decided by monitoring their TA stats
from the ’’Stat Mon Tool’’.
Feed Back & Complaints
A feedback or complaint is usually raised by Network user; a special team by the name
of Customer Liaison Team (CLT) is monitoring the track of all the customer complaints
and is in constant coordination with technical teams. The complaint is analyzed whether
it is related to RF Planning team or optimization team. If it is related to planning team, it
is then analyzed for coverage issue or capacity issue. The coverage related issues are
generally raised by network users, the area is then identified on MapInfo, and then by
using Coverage predictions RF planning team confirms of any coverage hole or poor
coverage. Once the coverage issue is confirmed, the RF Planning team analyzes the
14

RF Planning Bible: TP RF - Central
neighbor site design to check if the area can be served by existing site, if not it is
surveyed with market sales team or corporate relation team for a feasibility of new site.
If the area is feasible, new site is planned and placed in buffer so that it is re released
when new sites are to be planned. For capacity issue, cell utilization is checked, if the
utilization is 100% then, the configuration is taken into account. If there is no room for
an additional TRX, i.e. six radios in the cell, a new site is planned by using TA stats, and if
not, expansion is performed by incrementing the number of radio by 1, until the issue is
resolved. The team makes sure that the problem is resolved and also re -confirms the
status with the complainer. Capacity complaints can be raised from network user or
other departments specially RF Optimization.
Coverage Where am I?
Coverage where am I is a joint tool for Commercial and Technical teams to identify
important locations nationwide and monitor progress made against providing coverage
at these locations on monthly basis. Commercial team puts forward their feedback or
complaints of the coverage issues in the network and wants to know the RF comments
over these issues. RF team then provides the coverage status of those areas and
evaluates the feasibility of new site. All this feedback is maintained in the form of an
Excel sheet. RF team comments are required in Coverage Status, Priority, Site Status,
Site Name, New Site Count, Type, Timeliness and Comments fields of the Excel sheet,
i) The 'Coverage Status' field should only have following values: Covered,
Partially Covered & Not Covered. If a location like Motorway M1 requires
several sites, it will be considered 'Partially Covered' until all the
planned sites are on-air. The status will change to 'Covered' when no
more new sites are needed.
ii) The 'Site Status' field should only have following values: Planned, On-Air,
On-Hold Not Planned. The reasons for 'On-Hold' sites should be
mentioned in 'Comments' field. Also, the details about t he planned sites
stages (TSS done, SARF released, etc) can be mentioned in 'Comments'
field.
iii) The ‘Priority’ field should only have following values: P0, P1 & P2. The
definitions of these are as follows.
P0 = Highest priority. Site needed most urgently. Infrastructure is
complete or near completion and people / traffic is present.
P1 = Site needed. Infrastructure is complete or near completion and
15
iv) The ‘Site Name’ field contains the name of the serving sites in that area.
v) The ‘New Site Count ’field contains the number of planned sites in that
vi) The ‘Type’ field contains the type of the On Air sites or the type of the
vii) The ‘Timeliness’ field shows the completion period to provide coverage
RF Planning Bible: TP RF - Central
people / traffic is present.
P2 = Infrastructure will take 1-2 years in completion & traffic is not
present.
area.
sites to be installed.
in that area.
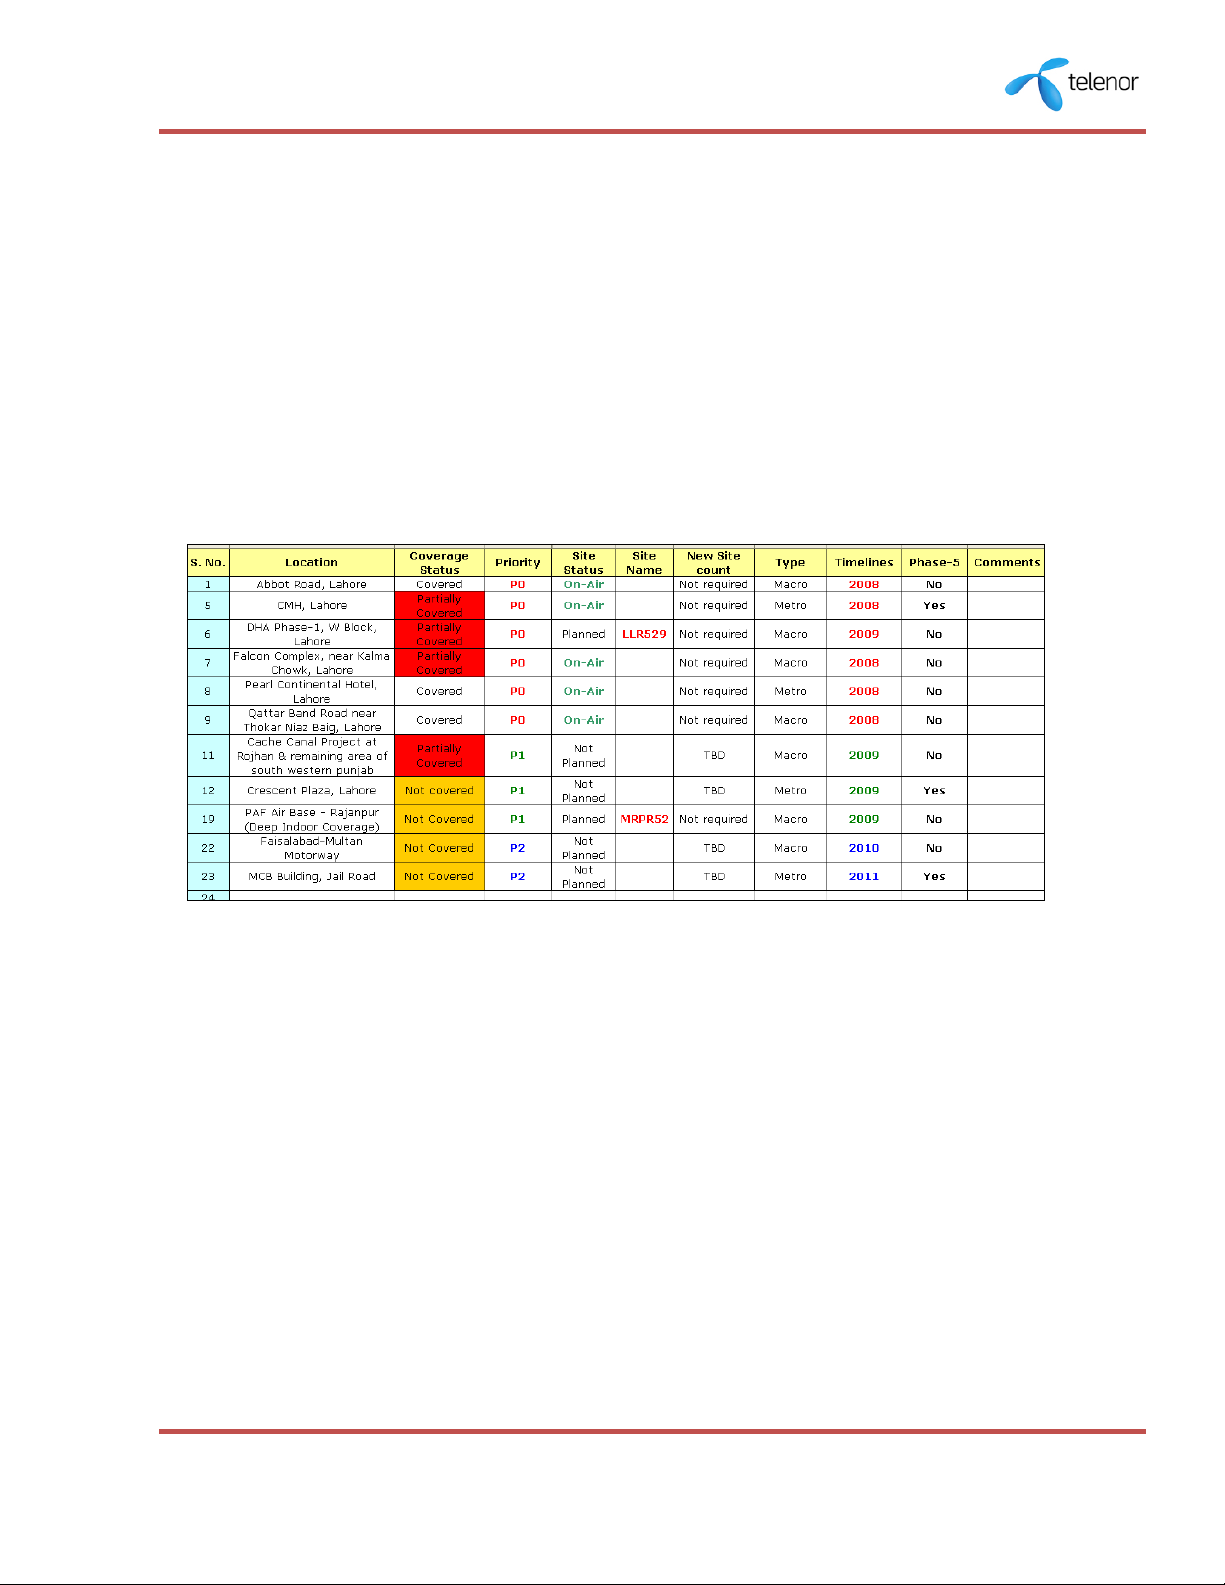
Fig 1.7: Coverage Where I am Template sheet
TD team will update the "Coverage Where I am" sheet identifying the status of sites in
the identified locations. This sheet will be updated every (2) months for all regions.
Monthly meeting will be held among all stake holders to review progress status. The
'Comments' in the sheet will specify updated site status obtained from Real Estate team,
in case if it is facing any acquisition related issues. Task force from Site Acquisition will
push for early resolution of issues on stuck sites. Commercial team will also identify
resources from their side to facilitate release of stuck sites.
Special Case: 1800 MHz Only Sites
RF Planning Team uses the Coverage Predictions, Traffic Stats Analysis and corporate
complaints feedback to mark probable locations (capacity/quality) on a monthly basis.
In case of a capacity site, RF planning team identifies the cells carrying high traffic from
16
RF Planning Bible: TP RF - Central
latest traffic stats and subscriber forecast provided by S&D. For design, the Inter Site
distance (from all the Sectors) must not be more than 600m & GOS < 0.5% in Dense
Urban & Urban environment. In case of a quality site, RF planning analyzes the statistical
reports and / or the forecasted yearly subscriber-base by S&D. RF planning team uses
coverage predictions to identify poor coverage locations which should not be more than
200m in the existing network in Dense Urban and Urban environment to provide deep
indoor coverage. Nominal surveys of all these locations are also carried out by RF team.
Fig 1.8: MapInfo View of DCS only Site
17
RF Planning Bible: TP RF - Central
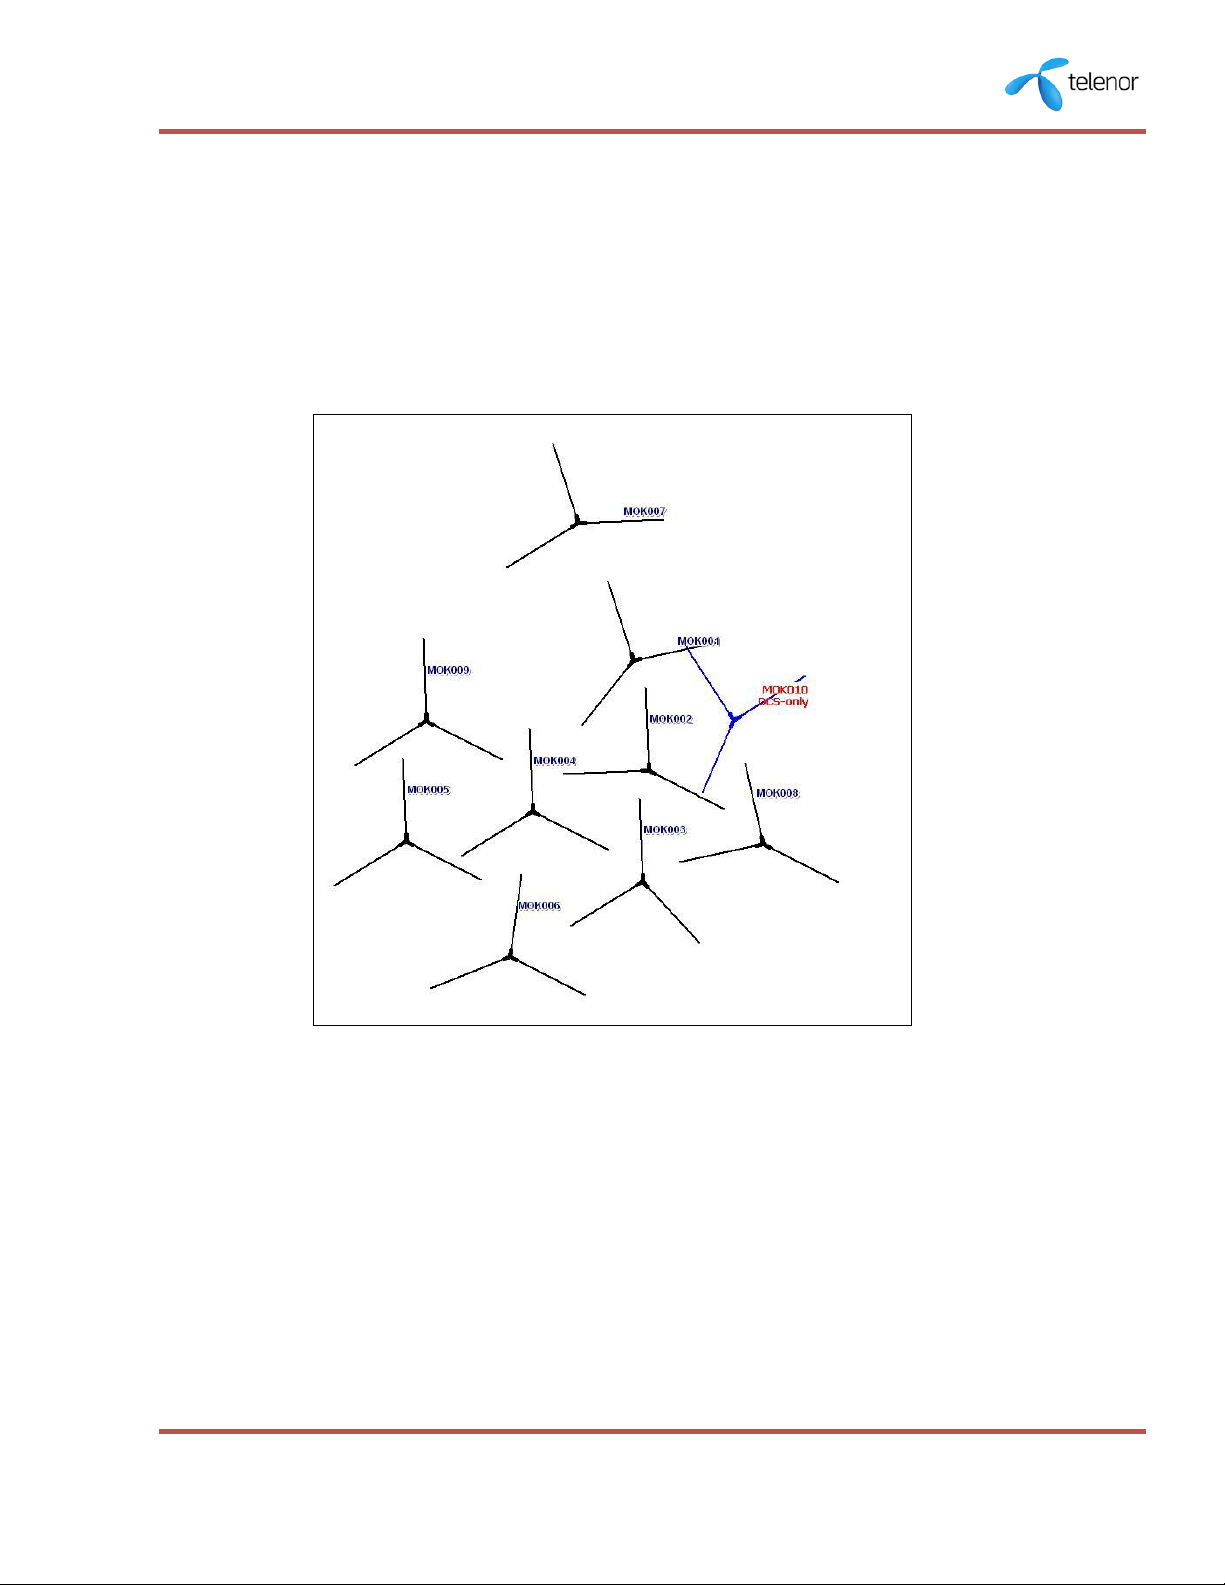
Fig 1.9: Google Earth View of DCS only Site
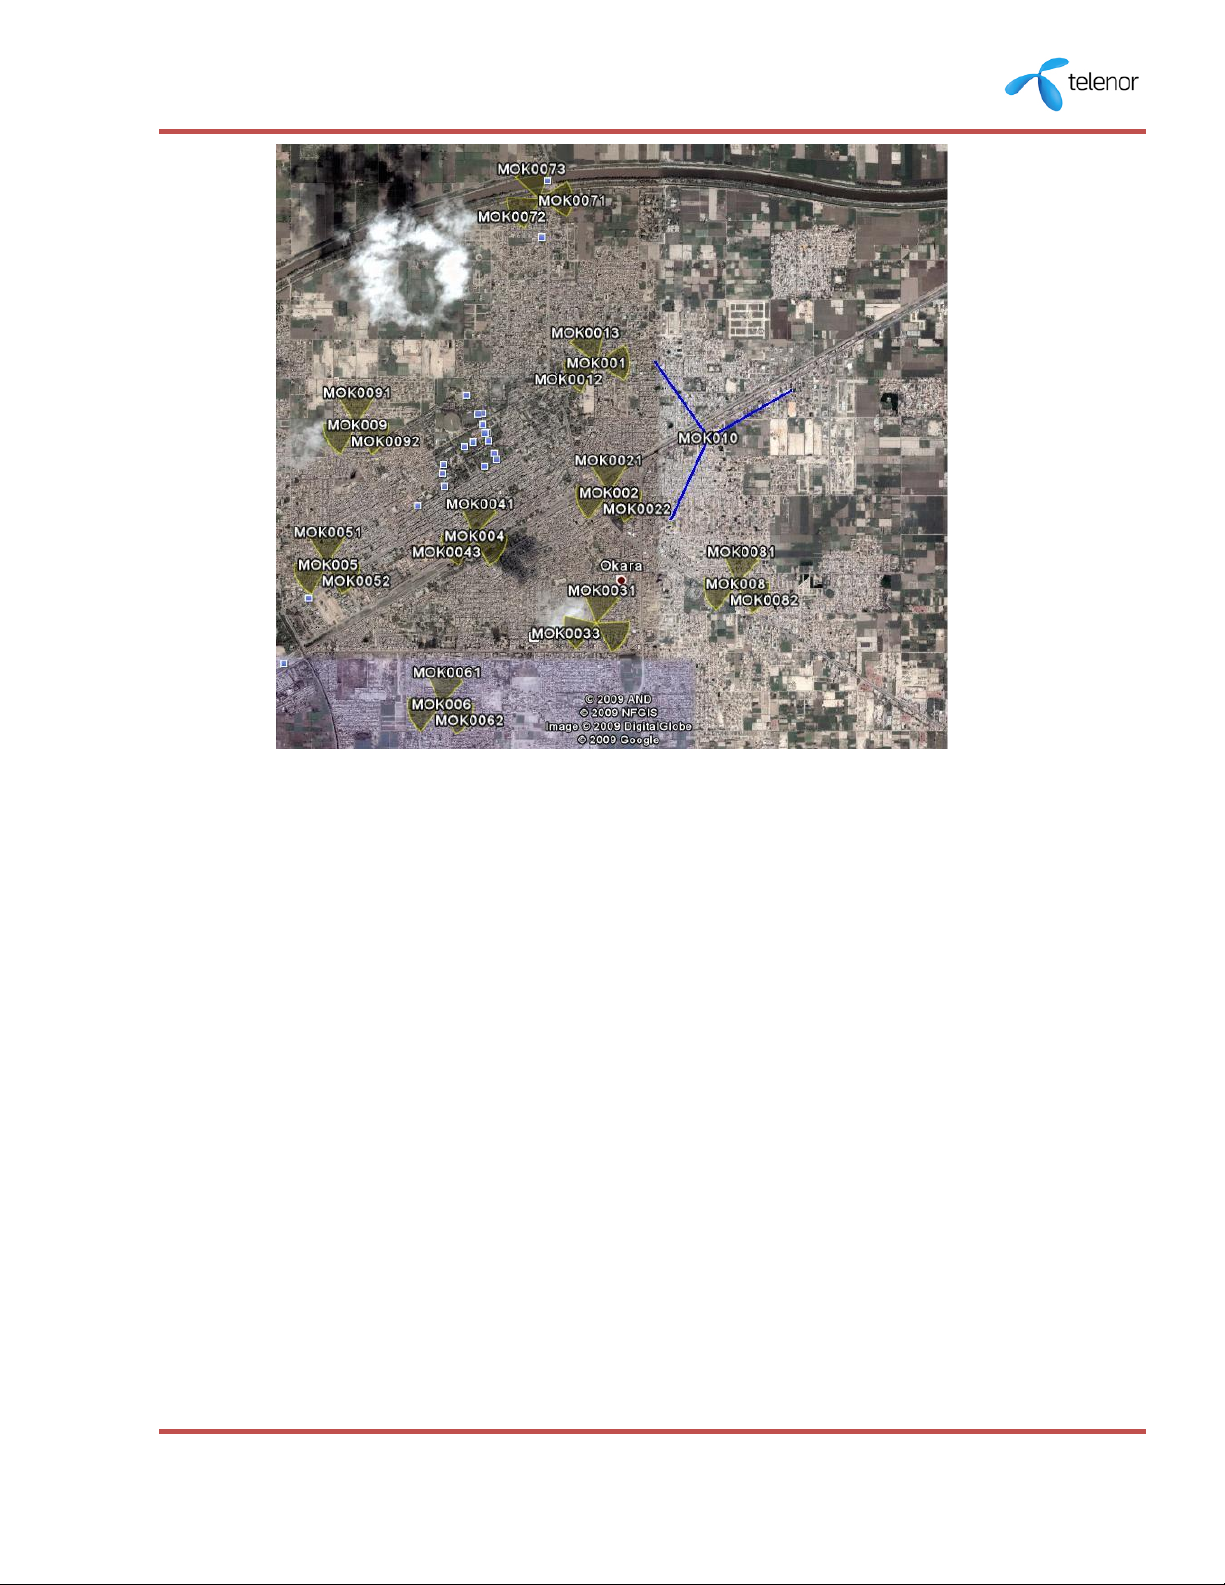
Fig 1.9 shows the DCS only site MOK010 in dense urban area to share the high traffic of
its neighboring cells. Google Earth view of the same area is showing the dense area and
the site azimuths for meeting the capacity requirements.
RF SURVEY REPORTING
A radio frequency (RF) site survey is the first step in the deployment of a Wireless
network and the most important step to ensure desired operation. A si te survey is a
task-by-task process by which the surveyor studies the facility to understand the RF
behavior, discovers RF coverage areas, estimates for RF capacity requirements, checks
for RF interference and determines the appropriate placement of Wireless equipment.
In a Wireless network, many issues can arise which can prevent the radio frequency (RF)
signal from reaching all parts of the facility. Examples of RF issues include multipath
distortion, shadowing effect, time dispersion and time alignment issues. In order to
address these, you need to find the regions where these issues occur. A site survey
helps you to do this. A site survey helps define the contours of RF coverage in a
particular facility. It helps to discover regions where multipath distortion can occur,
areas where RF interference is high and find solutions to eliminate such issues. A site
18

RF Planning Bible: TP RF - Central
survey that determines the RF coverage area in a facility also helps to choose the
number of Wireless devices that a firm needs to meet its business requirements. A site
survey should also determine the expected subscribers forecast. A proper site survey
provides detailed information that addresses coverage, interference sources, equipment
placement, power considerations and wiring requirements.
RF Planning team makes a consolidated excel sheet of nominal RF survey points
(geographical coordinates) on the basis of the coverage, capacity and feedback issues in
the network. Afterwards, the nominal site surveys are split according to the
geographical vicinity among RF resources. Based on the quantity of coordinates,
geographic terrain and distance from base, RF Survey schedule is made.
Performing Survey
A radio frequency planner should be equipped with a laptop, MapInfo, Google Earth,
Global Positioning System Equipment (GPS), Compass, Digital Camera, Binoculars, Map
Source and Global Mapper (optional) for performing the RF survey. Before going out for
the RF survey, latest coverage prediction should be analyzed for a coverage survey and
Traffic stats and TA trend for the neighboring sites should be analyzed for a capacity
survey and Google earth should be used for rough estimations and directions. Track
Mode of GPS should be in ON state.
Coverage Surveys are carried out in the areas where there is poor coverage and in these
kinds of surveys it is all about exploring the area to the maximum and finding out good
populations. Capacity surveys are carried out for the cells where there is high TCH
utilization or high CS blocking. Capacity surveys are all about to identify the high traffic
generating areas. The cells which are highly utilized or in which there are high blocking
that cells foot print (coverage area) should be surveyed for potential populations, which
are the candidates for capacity sites.
Following Observations should necessarily be made on nominal RF survey.
Any town, Village or city visited should be profiled with name, population and
available mobile operators in the area.
Snaps should be taken from the center of the village from average building
height taking true north as a reference with the help of magnetic compass and 8
snaps should be taken with Digital Camera that are separated apart with 45
degree angle.
19

RF Planning Bible: TP RF - Central
Snaps of the roads leading towards major towns or highways of the area should
be taken.
Average Building height should be noted.
All the villages of the area should be profiled with above mentioned details.
After performing the nominal RF surveys, *.DXF file of marked waypoints and tracks is
extracted from GPS with the help of Map Source and is imported to MapInfo. Then,
*.TAB file of MapInfo is made with the help of collected data and *.DXF file.
Reporting Survey including .Tab file
All RF Planners prepare their individual survey Tab file after performing the surveys.
Preparation of Tab file includes the tracks, polygons, location names and its
approximate population along with other useful information and landmarks.
Unnecessary points, lines and/or text should be avoided while preparing Survey Tabs as
this will increase the file size. If it contains any unwanted points, lines and any
overlapping entities, the Tab file should be cleaned to simplify the geometry. The basic
file set for viewing the MapInfo Tab file consists of a minimum of four files, the *.DAT,
*.TAB, *.ID and *.MAP. If any one of these is missing, the Tab file will fail to open in
MapInfo.
Site Design Finalization
All RF Planners report and discuss their RF survey findings with the senior team
members. The senior team member analyzes their findings, *.TAB files and snaps of the
villages and make decisions for planning new sites of the performed surveys. The best
location for new site is then selected for providing the good coverage and balancing the
traffic load of neighboring cells. Antenna type, Site type, Antenna azimuths, Antenna
heights and Antenna tilts are then decided with the mutual discussion of RF surveyor
and senior team member depending upon the clutter type and population spread of the
area under consideration.
20

RF Planning Bible: TP RF - Central
Fig 1.10: MapInfo view for Site Design Finalization
Fig 1.11: Google Earth view for Site Design Finalization
Fig 1.11 shows the detailed area profiling visit (Nominal Survey) of a certain region and
the proposed design for a new cell site to cater the maximum traffic. The site should
always be planned in the middle of populated area to distribute the traffic equally on all
cells. The azimuths are planned in such a way that all the cells carry good traffic from
the neighboring populated area. Fig. 10 shows the Google Earth view to verify the
nominal cell site plan.
21

RF Planning Bible: TP RF - Central
Ph5 Master RF Plan V
3.1 (30-10-2008)(Central).xls
RF Master Plan Release
A nominal cell site plan in the form of an excel sheet is produced after the site design
finalization process. Then, the unique site names are added in nominal plan sheet and
consolidated nominal sheet is floated which form the basis for new master plan.
Nominal cell plans are the first cell plans produced and these form the basis of further
planning.
Site Name Identification
The nominal cell site plan contains all the site data without site IDs. A cell site name
consists of seven letters and unique throughout the network. The 1st letter indicates the
planning phase of the site and the 2nd letter indicates the planning region of the site. For
3rd, 4th and 5th letters for site name, universal site naming sheet with all the site names
in the network is filtered out in ascending order to find the unique site name. The 6th
and 7th letter of the site name should be digits. The selected Site IDs and Segment
names are then added in the nominal cell site plan sheet. The finalized nominal cell site
plan sheet contains the Site Name, Segment Name, Phase, Longitude, Latitude, Search
Ring, City Name, Azimuth, Tilt, Antenna Height, Antenna Type, Site Type, Date Released,
Category, Tower Type and Cells to be relieved fields in it. All these fields are then
appended in the last release master plan. The feeder cable length, and number of
antennas required for one site are also added in master plan sheet. Finally, the site
priorities are added in master plan sheet and the new version of the master plan is
floated to the concerned departments.
Nominal Sites Database
Nominal Site Database is created from Master Plan sheet. The following fields are taken
from the master plan sheet. Site Name, Longitude, Latitude, Antenna Height, Antenna
Tilt, Antenna Azimuth, Tower Height, Date Released, Trx configuration, Site Type
(Coverage/Capacity) and Search ring. Site names of new sites should be rechecked from
22

RF Planning Bible: TP RF - Central
Nominal Database record and update in Nominal Record. Consolidated Nominal Sites
Database is also floated within the department.
23

RF Planning Bible: TP RF - Central
Chapter 2: SITE DATABASE CREATION
Introduction
Site Database creation for new Sites
24
RF Planning Bible: TP RF - Central
Introduction:
Site database is process of creating frequency parameters of new sites which are required
as by GSM architecture.
In GSM Frequency planning is important to minimize the interference which improves the
quality while giving the coverage and capacity. Objective is to use the allocated frequency
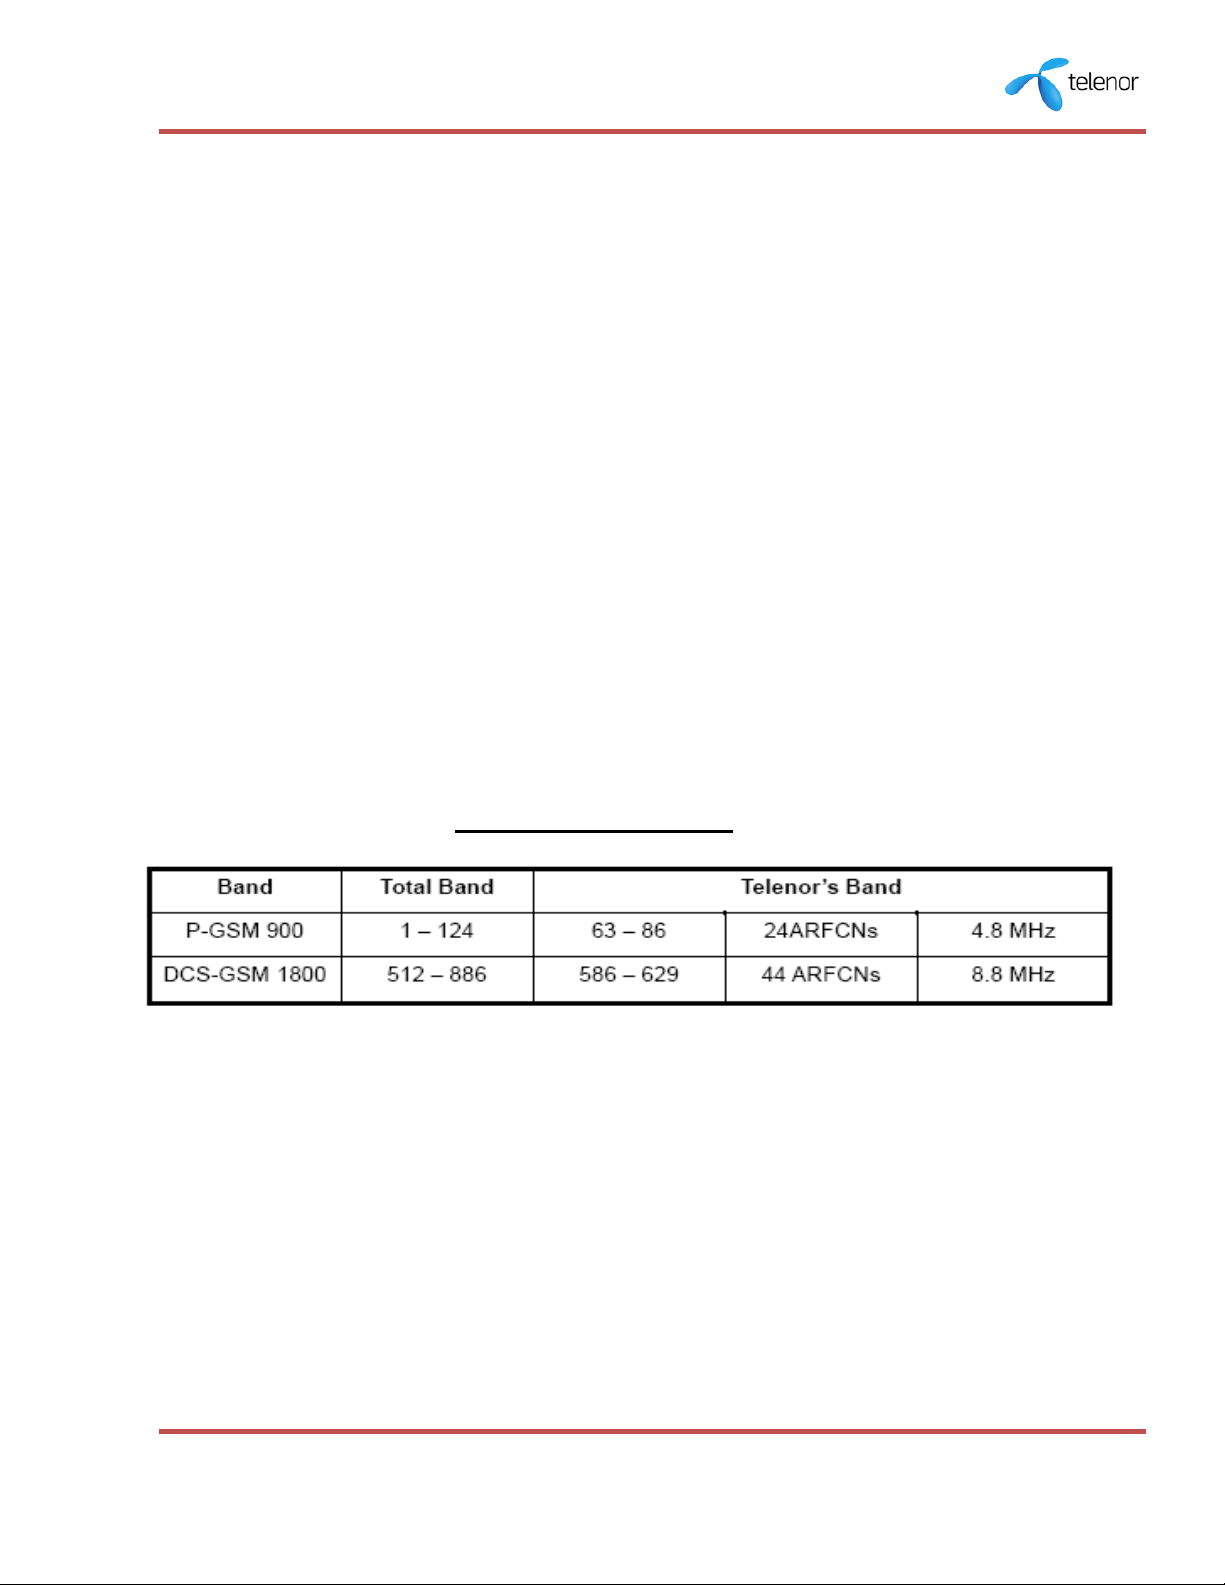
spectrum efficiently. There are limited frequencies available to Telenor Pakistan (24 ARFCN
for 900 band and 44 ARFCN for 1800 band) and the number of calls that the network can
support is limited by the amount of radio frequencies allocated to that network However, a
cellular network can overcome this constraint and maximize the number of subscribers that
it can service by using frequency re-use.
Frequency re-use means that two radio channels within the same network can use exactly
the same pair of frequencies provided that there is a sufficient geographical distance (the
frequency reuse distance) between them so they will not interfere with each other. The
tighter frequency re-use plan, the greater the capacity potential of the network.
Telenor Frequency band
Fig 2.1: Telenor Frequency band
Why Frequency Planning is Important
In theory, hexagons are used to represent cell (Coverage area), sites can be planned
Omni or directional (2, 3, 4 Sectors) antennas.
Why Hexagons:
The border between the coverage area of two cells is the set of points at which the
signal strength from both antennas is the same. In reality, the environment will
determine this line, but for simplicity, it is represented as a straight line. If six BTS’s are
25

RF Planning Bible: TP RF - Central
placed around an original BTS, the coverage area – that is, the cell – takes on a
hexagonal shape.
Fig 2.2: Hexagonal Structure
Omni directional cell: An Omni-directional cell (or Omni cell) is served by a BTS with an
antenna which transmits equally in all directions (360 degrees).
Sector cell: A sector cell is the area of coverage from an antenna, which transmits, in a
given direction only. For example, this may be equal to 120 degrees or 180 degrees of
an equivalent Omni- directional cell. One BTS can serve one of these sector cells with a
collection of BTS’s at a site serving more than one, leading to terms such as twosectored sites and more commonly, three-sectored sites.
Fig 2.3: Cells in practice
In reality, hexagons are extremely simplified models of radio coverage patterns because
radio propagation is highly dependent on terrain and other factors. The problems of
path loss,
26
RF Planning Bible: TP RF - Central
Shadowing and multipath fading all affect the coverage of an area. For example, time
dispersion is a problem caused by the reception of radio signals, which are reflected off
far away objects. The carrier-to-reflection (C/R) ratio is defined as the ratio between the
direct signal (C) and the reflected signal (R).
Also, due to the problem of time alignment the maximum distance an MS can be from a
BTS is 35 km. This is the maximum radius of a GSM cell. In areas where large coverage
with small capacity is required, it is possible to allocate two consecutive TDMA time
slots to one subscriber on a call. This enables a maximum distance from the BTS of
70km.
Cell size mainly depends on the amount of traffic they are expected to carry so for cell
patterns the major contributing factor is the population density.
Fig 2.4: Cell Pattern
Interference
Frequency re-use is essential not only because of providing capacity but also for providing
quality.
If there are two carriers within the same cell coverage area it will lead to cause inter symbol
interference (ISI). Interference can be avoided by considering the following factors.
Careful frequency allocation to new cell site
Proper choice for site location
Antenna installation planning
Frequency hopping
Power control
DTX
27
RF Planning Bible: TP RF - Central
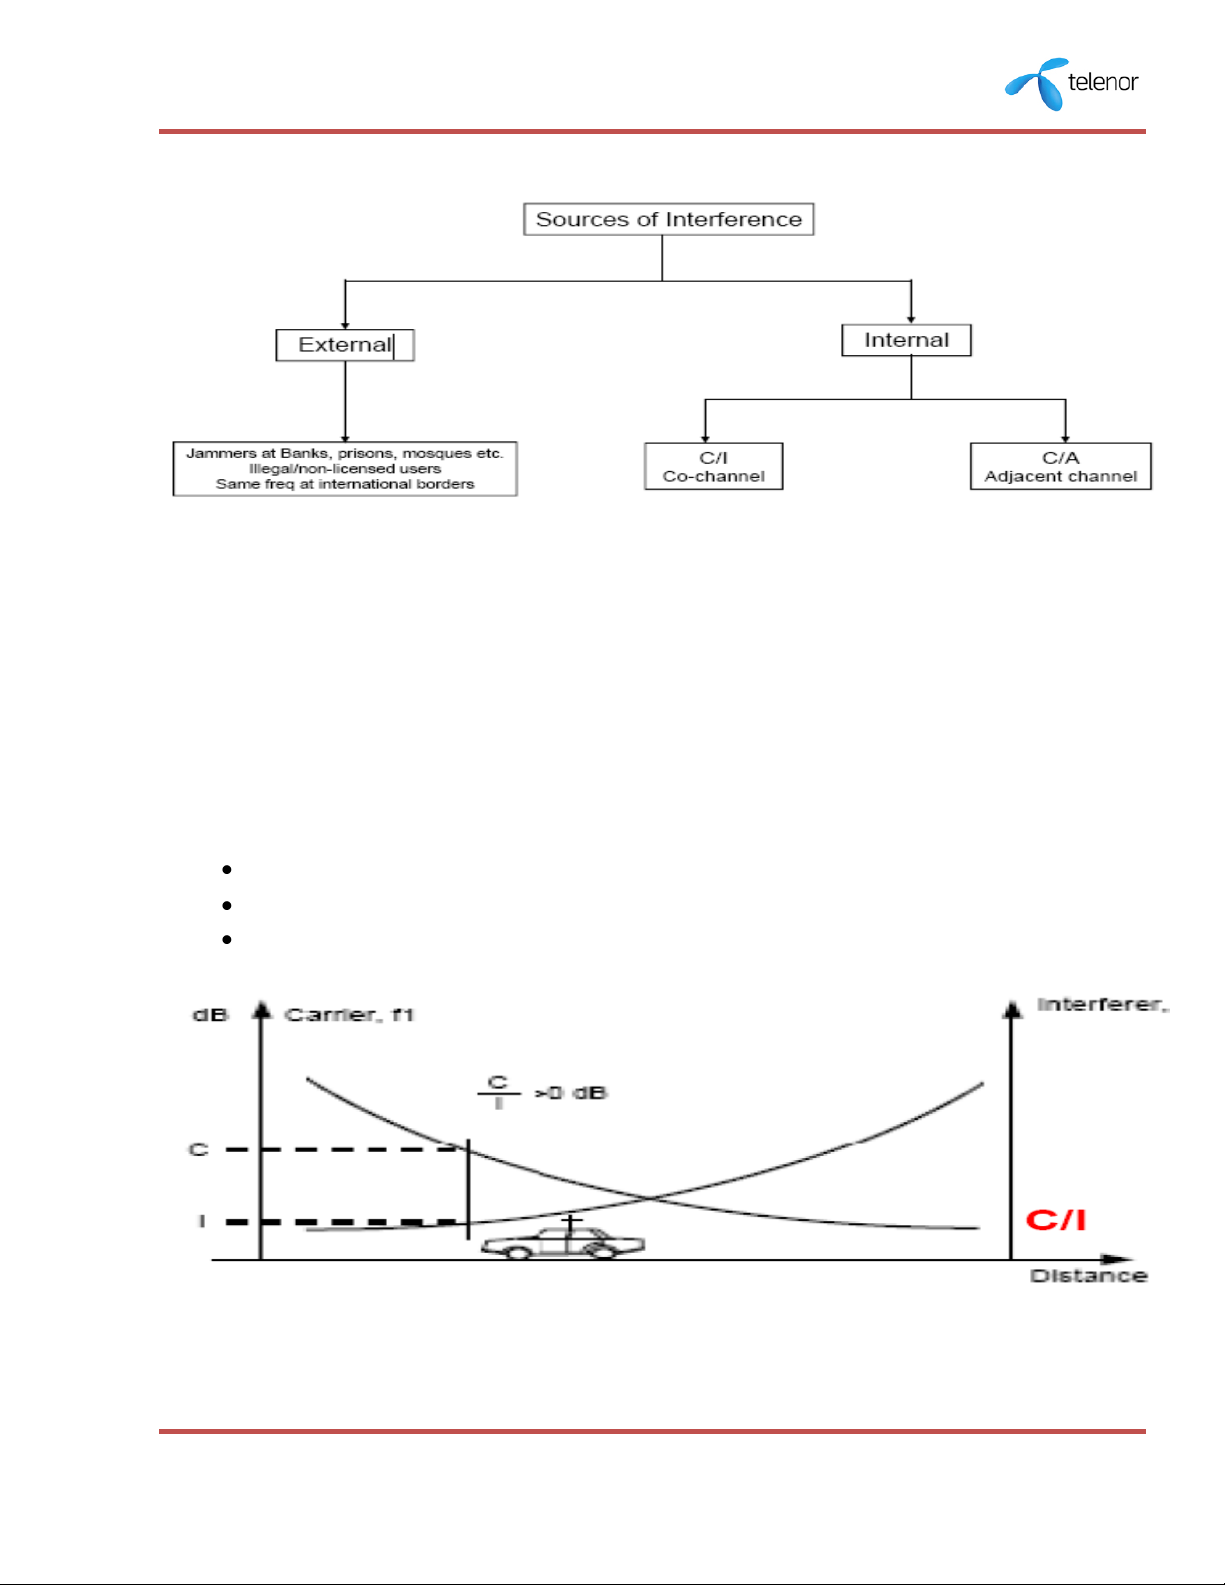
Fig 2.5: interference
There are two major types of interference which are explained below:
Co-Channel Interference C/I
Co-channel interference is caused by the use of a frequency close to the exact same
frequency. The former will interfere with the latter, leading to the terms interferi ng
frequency (I) and carrier frequency (C).
This C/I ratio is influenced by the following factors:
The location of the MS
Local geography and type of local scatters
BTS antenna type, site elevation and position
Fig 2.6 C/I
28
RF Planning Bible: TP RF - Central
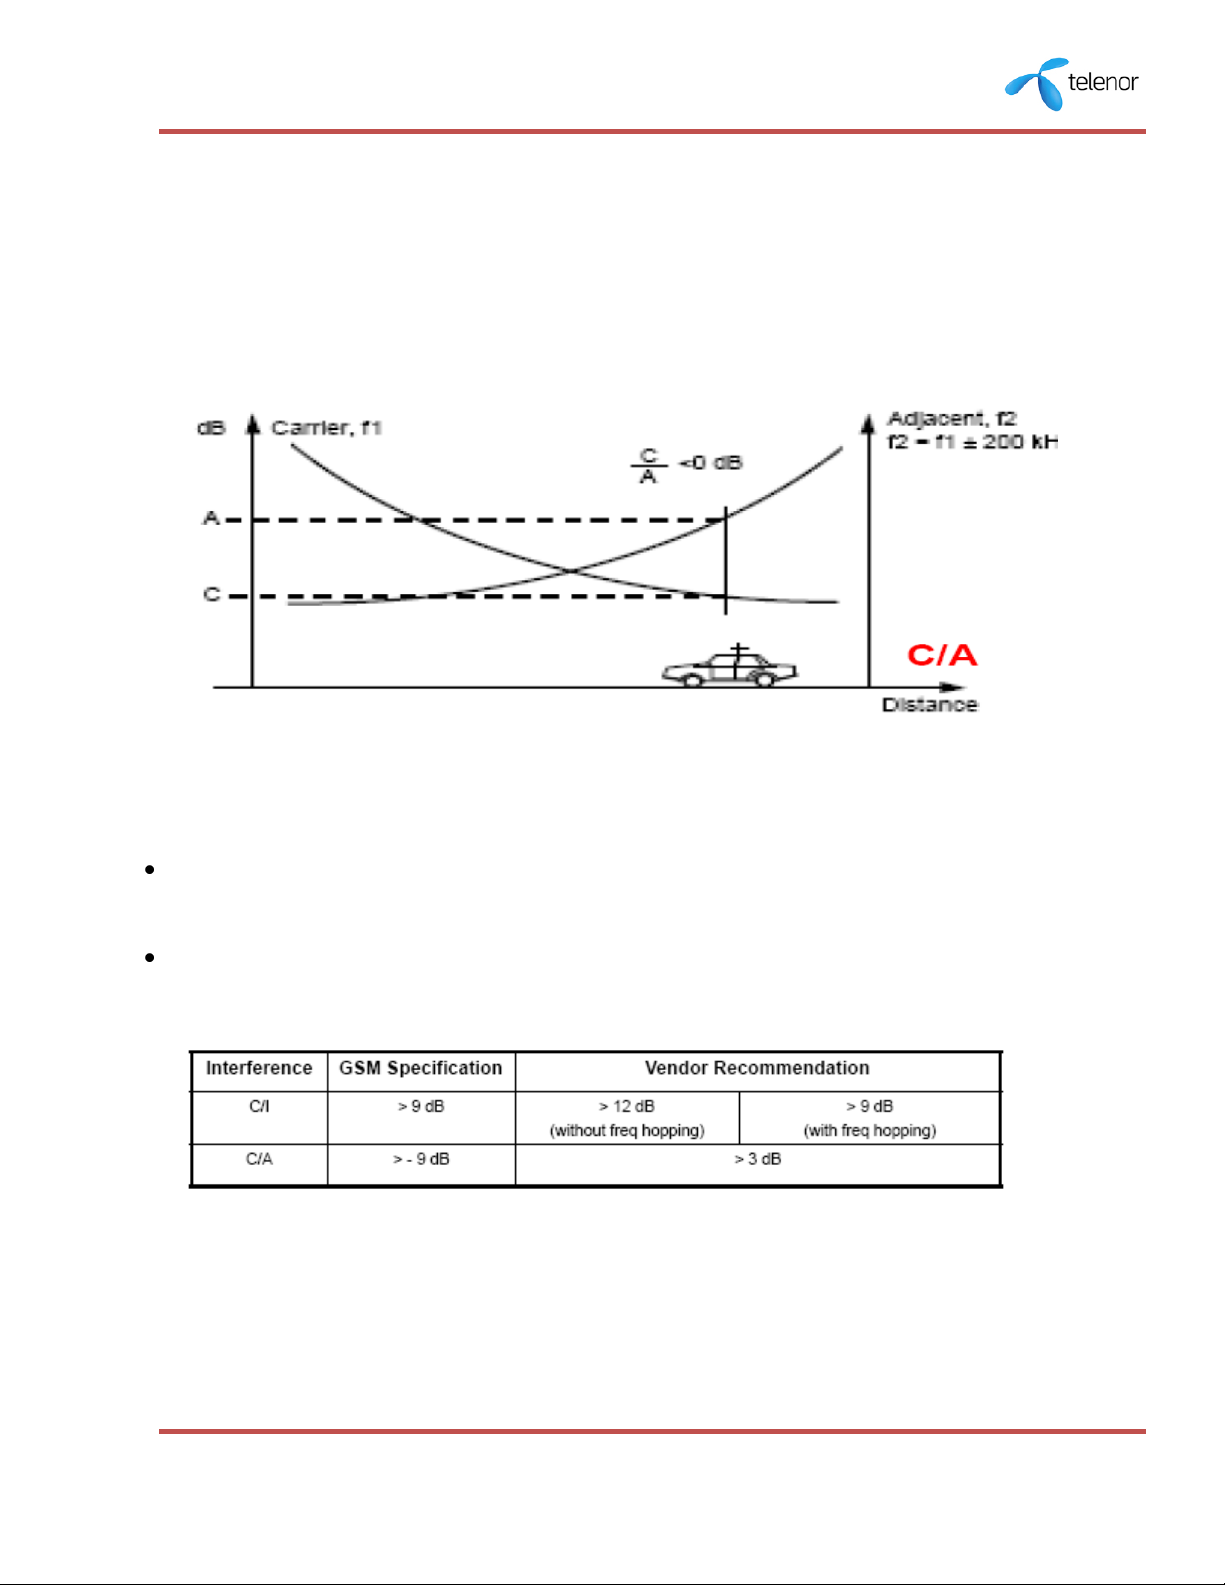
Adjacent-Channel Interference C/A:
Adjacent frequencies (A), that is frequencies shifted 200 kHz from the carrier frequency (C),
must be avoided in the same cell and preferably in neighboring cells also. Although adjacent
frequencies are at different frequencies to the carrier frequency they can still cause
interference and quality problems.
Fig 2.7 C/A
GSM Specification for C/I and A/I:
The GSM specification recommends that the carrier-to interference (C/I) ratio is greater
than 9 decibels (dB).
The GSM specification states that the carrier-to-adjacent ratio (C/A) must be larger than
-9dB.
Fig 2.8: GSM specifications for C/I and C/A
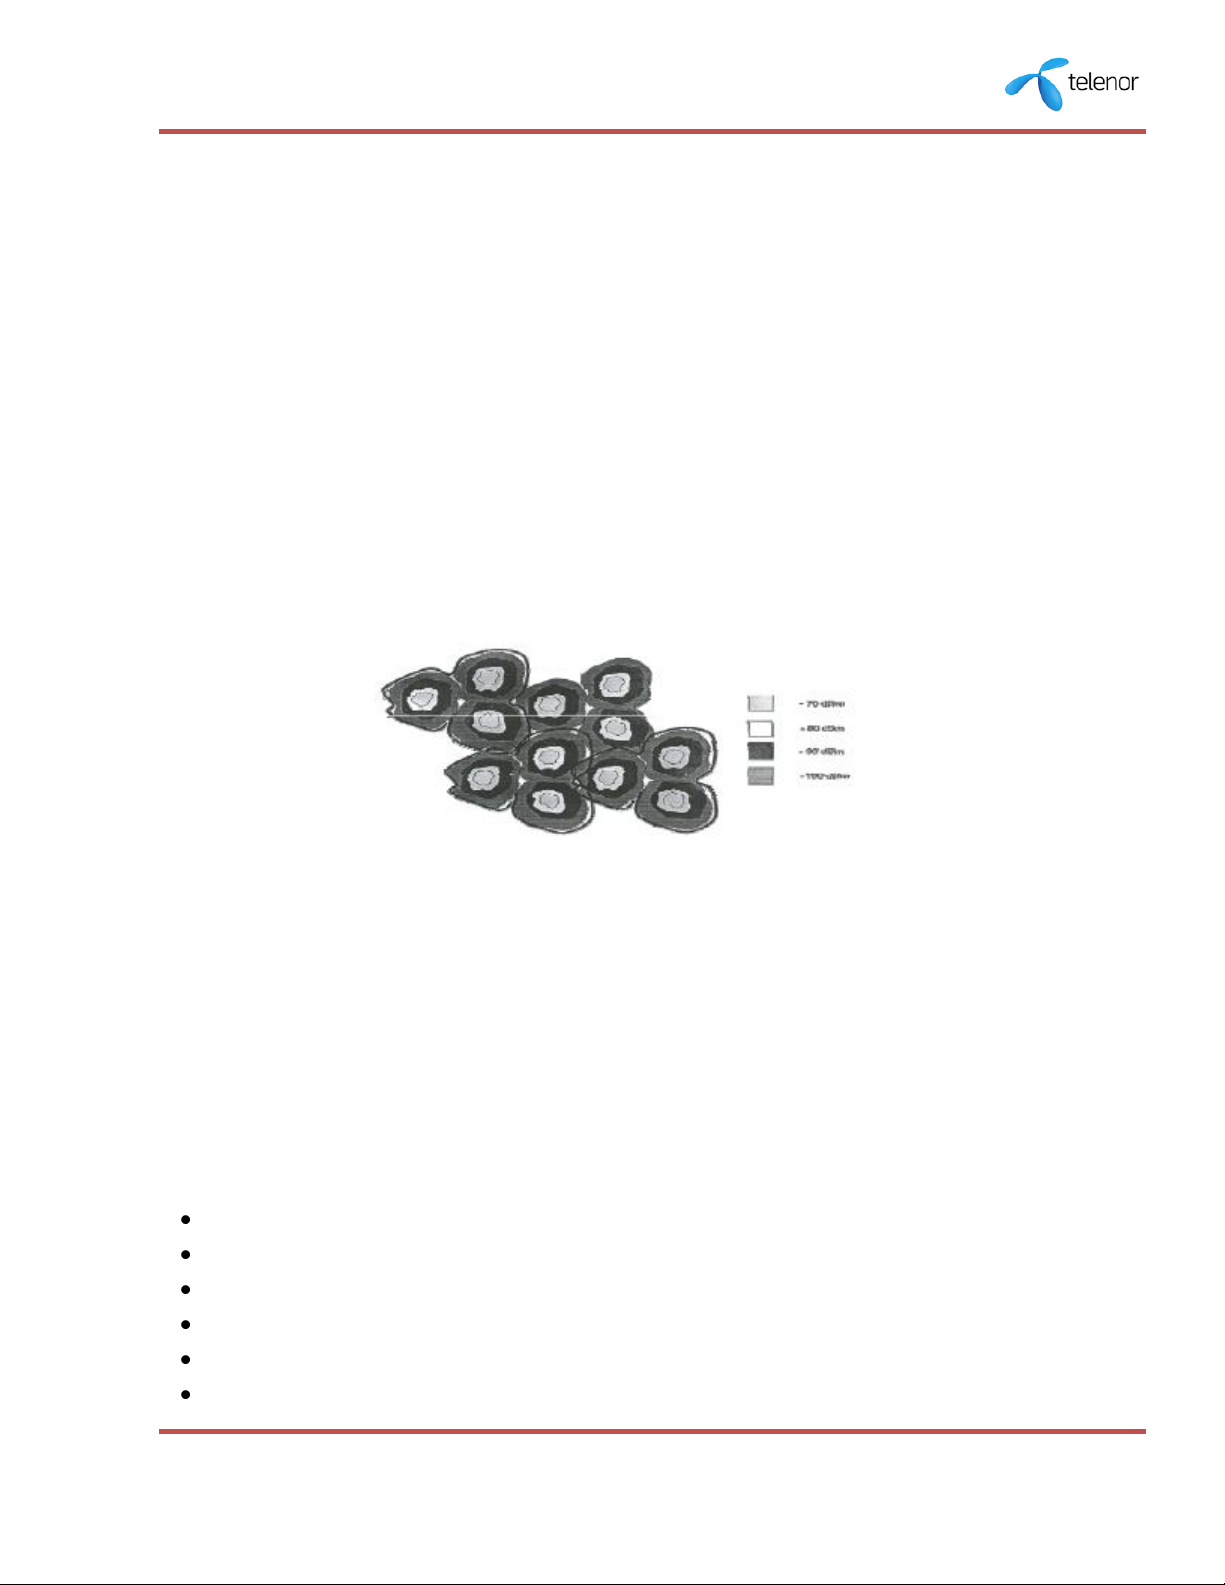
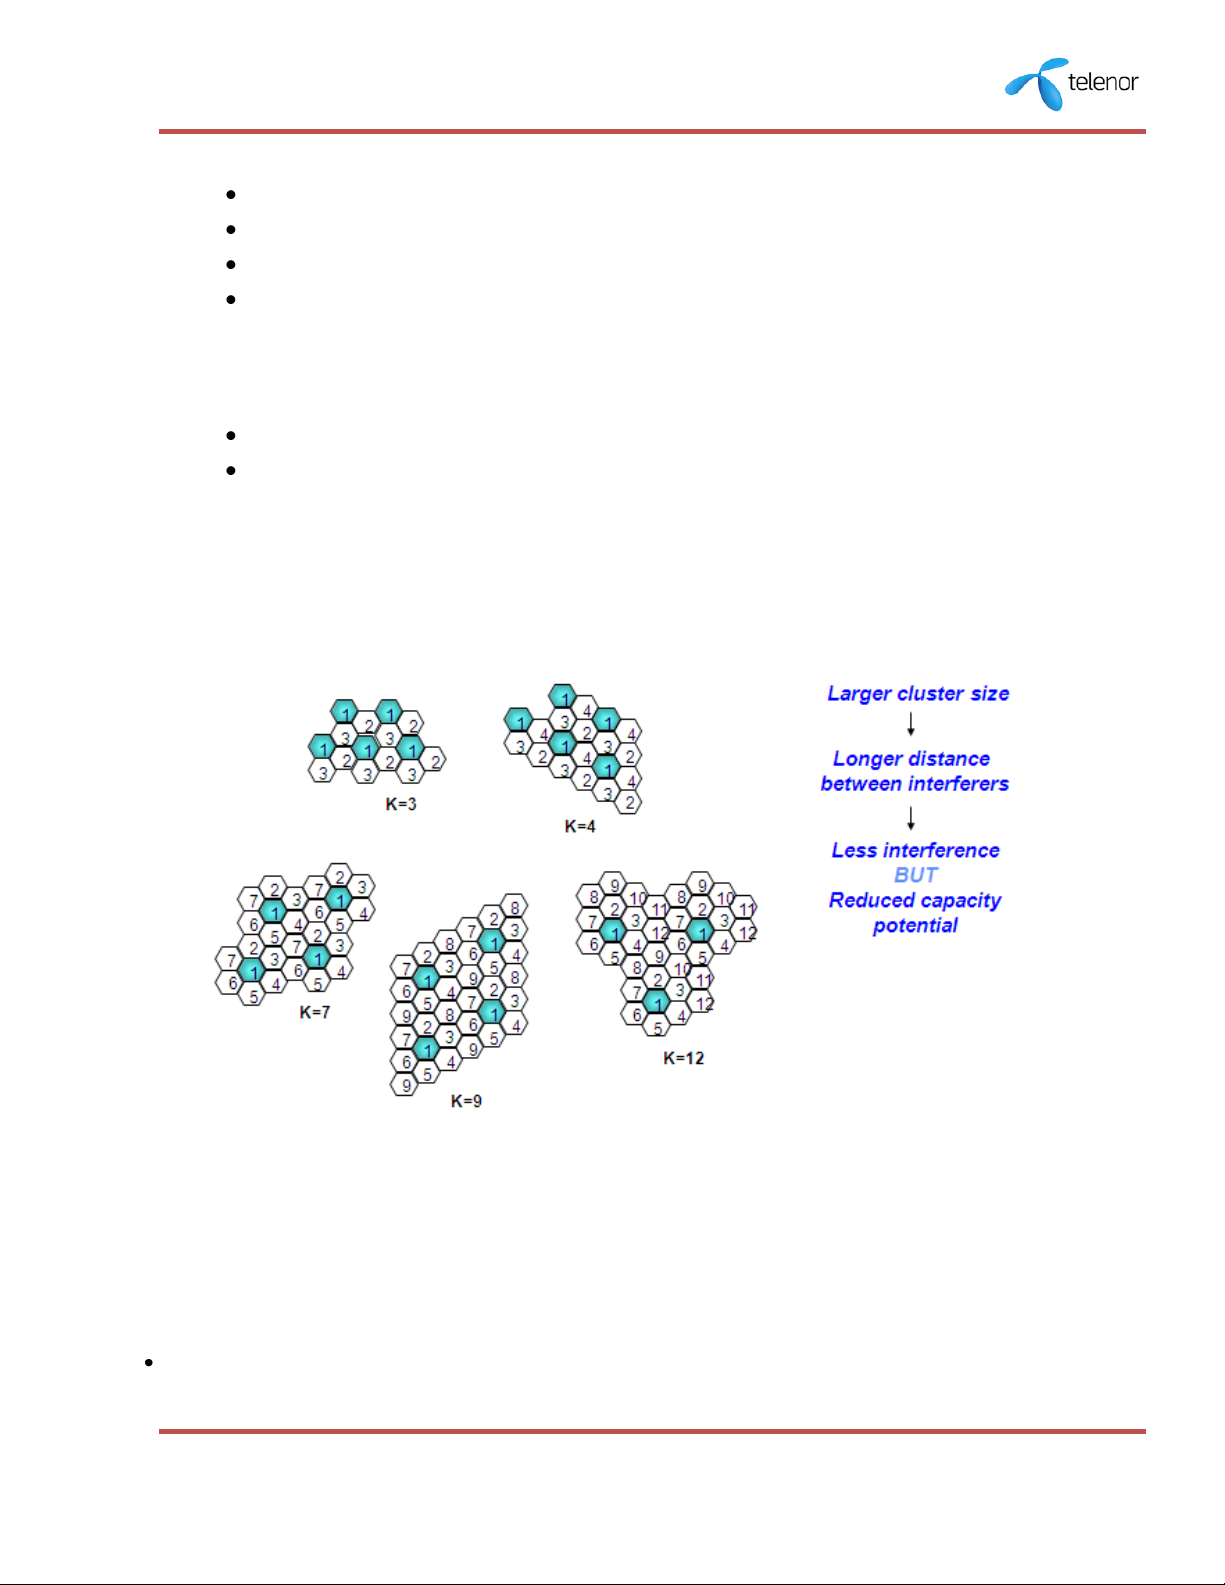
Frequency Re-use
The re-use patterns recommended for GSM are the 4/12 and the 3/9 pattern. 4/12
means that there are four three-sector sites supporting twelve cells using twelve
frequency groups.
29
RF Planning Bible: TP RF - Central
Affected by interference between cells
Type of geographic terrain (radio propagation conditions)
Antenna height / tilting
Antenna types
Omni directional antenna
120 deg Directional
60 deg Directional
Transmission output power
Radio Link Control features
Frequency Hopping
Dynamic Power Control
DTX / VAD
Fig 2.9: Frequency Re-use Pattern
Site Database Creation for New Sites:
Site database creation for new sites is initiated by creating cell ids for new cells.
Current Cell IDs for different region are maintained in separate files for reference.
30
 Loading...