

Page 1

Outdoor-Air Processing unit
GUF-50/100RD3
GUF-50/100RDH3
Page 2

CONTENTS
CHAPTER 1 Product Section
1. Summary .......................................................................................................................................... 2
2. Main Functions of OA Processing Unit.............................................................................................. 3
3. Model Line-Up .................................................................................................................................. 4
4. Summary of Types ............................................................................................................................ 4
5. Specifications .................................................................................................................................... 5
6. Outline Drawings .............................................................................................................................. 7
7. Electric Wiring Diagrams .................................................................................................................. 8
8. Characteristic Curves ........................................................................................................................ 10
9. Construction and Principle of Heat Recovery Unit (Lossnay Core) .................................................. 11
10. Total Heat Recovery Characteristics ................................................................................................ 13
11. Principle and Features of Permeable Film Humidifier ...................................................................... 14
12. Cooling and Heating Characteristics ................................................................................................ 18
13. Filter Characteristics.......................................................................................................................... 33
14. Noise Characteristics ........................................................................................................................ 35
15. Reference Documents ...................................................................................................................... 36
CHAPTER 2 Air Conditioning System Design Section
1. Guide to a Comfortable Air Conditioning System.............................................................................. 48
2. Features of the OA Processing Unit.................................................................................................. 49
3. Air Conditioning and Ventilation ........................................................................................................ 50
4. Characteristics .................................................................................................................................. 61
5. Lossnay Core Effect .......................................................................................................................... 64
6. Humidifying........................................................................................................................................ 70
7. Humidifying Effect of the OA Processing Unit ..................................................................................72
8. Water Quality and Service Life of Humidifier .................................................................................... 75
9. Dust Removal.................................................................................................................................... 77
10. Sound ................................................................................................................................................ 82
11. Precautions when Using.................................................................................................................... 87
CHAPTER 3 Control System Design Section
1. System Selection .............................................................................................................................. 92
2. Precautions when Designing Systems .............................................................................................. 99
3. Cable Installation .............................................................................................................................. 100
4. System Designs ................................................................................................................................ 104
5. Control of OA Processing Unit .......................................................................................................... 106
6. Automatic Ventilation Switching ........................................................................................................ 107
7. Operation with Cooling/Heating ........................................................................................................ 110
8. Feature Settings ................................................................................................................................ 115
9. How to Operate ................................................................................................................................ 120
10. System Component .......................................................................................................................... 126
11.Troubleshooting ................................................................................................................................ 129
12. Remote Controller Check Code List.................................................................................................. 130
13. Circuit Test Point................................................................................................................................ 131
Page 3

CHAPTER 1
Product Section
Page 4
2
CHAPTER 1 ● Product Section
1. Summary
Introducing state-of-the-art comprehensive air conditioning that provides precise control for individual
rooms.
RDH3 series : Lossnay Ventilation and efficient humiditying.
RD3 series : Lossnay Ventilation and the Air conditioner.
(1)When the load is light. → Main Air conditioner.
(2)When the load is heavy. → Supplemental Air conditioner.
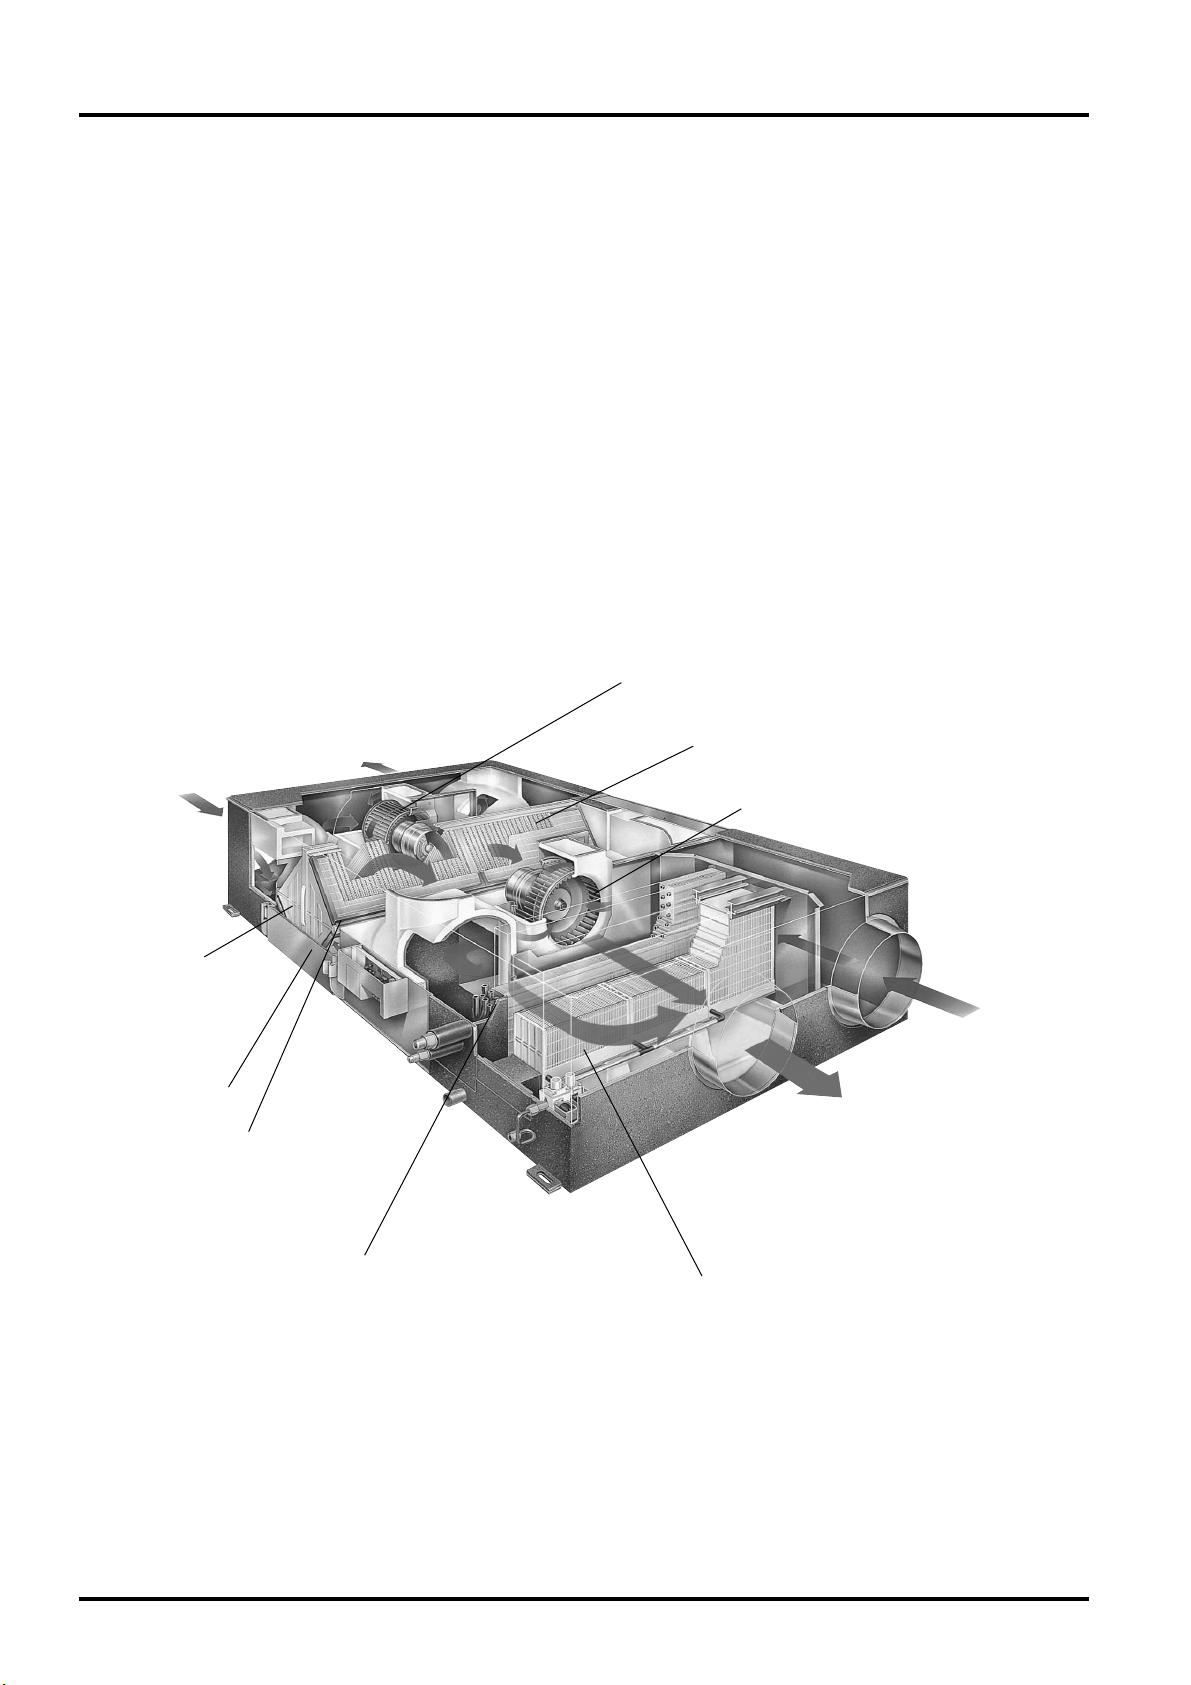
Introducing the latest advancement for total air conditioning comfort – the Outdoor Air processing unit (hereafter
OA processing unit). It uses the latest technology to provide comprehensive air conditioning control including
ventilation, heat recovery, humidifying, heat processing and dust removal*. Control can be performed for each
room, giving the flexibility to create the best comfort for each type of living space.
Note: (Dust removal) ......This function is enabled by using the optional high-efficiency filter.
The exhaust fan
High-efficiency filters (Option)
The supply fan
Maintenance cover
EA (Exhaust air)
The heat of room air is recovered
(sensible and latent heat) by
Lossnay Core, and exhausted to
the outside of the room by the
exhaust fan.
OA (Outdoor air)
Fresh outdoor air in a
quantity corresponding to
the required ventilation
rare is taken in by the
supply fan.
Lossnay Core
Temperature and humidity are
recovered between supply air
and exhaust air.
Air filter
Prevents clogs in the
Lossnay Core.
Direct Expansion coil
The outdoor air taken in is cooled or
heated by Direct Expansion coil.
Permeable-film humidifier
Outdoor air taken in is humidified by the permeable film
humidifier as required for more comfortable air conditioning.
Not available on GUF-50/100RD3.
SA (Supply air)
The fresh outdoor air processed is supplied to
the inside of rooms.
RA (Return air)
Contaminated room
air is sucked by the
exhaust fan.
Page 5

3
CHAPTER 1 ● Product Section
2. Main Functions of OA Processing Unit
2.1 Common Functions of Humidifying/Non-Humidifying Type
(GUF-RDH3/RD3)
●
Ventilation
Ensures proper ventilation by simultaneous forced air induction and exhaust.
Dual intake fans are used to simultaneously force both supply air diffuser and exhaust. This means that even
sealed buildings will be ensured of proper ventilation.
●
Heat recovery
Heat recovery system that provides energy-saving operation.
The unit has a built-in static type total heat recovery unit Lossnay Core. There is no mixing of the intake and
exhaust air as they pass through the Lossnay Core. Recover of both temperature (sensible heat) and humidity
(latent heat) – in other words total heat recovery – is performed with minimal loss to the heating or cooling effect,
ensuring energy-saving operation.
●
Dust removal*
High-efficiency filter provides 65% filtration using colorimetric method (Optional parts)
The high-efficiency filter provides up to 3,000 hours of maintenance free operation and is capable of 65% filtration
(colorimetric method). It can be installed inside of the OA processing unit itself, so no additional installation space
is required. In addition, the high-efficiency filter can be installed after the OA processing unit has been installed.
Note: This function is enabled by using the optional high-efficiency filter.
●
Free Cooling
When the air conditioning system is operating in its cooling mode and the temperature of the air outdoors drops
below the temperature indoors (e.g.a summer night), the OA processing unit detects this and automatically
switches to a mode of operation which bypasses the heat-exchange element. Bringing in cool air from outside
serves to help reduce the air conditioner’s cooling load.
2.2 Functions of Humidifying Type (GUF-RDH3)
●
Humidifier
Total introduction of permeable-film humidifier that functions using natural evaporation.
The humidifier installed in the OA processing unit was designed exclusively by Mitsubishi Electric. It is the
permeable-film humidifier that functions using natural evaporation. This design total eliminates the spreading of
impurities such as breaching powder and silicon dioxide. This means that this system can provide a clean supply
air diffuser free of white exhaust.
●
Heat processing
Efficient heat processing and compact design allows for design freedom.
By including the direct expansion coil, approximately 25% of the air conditioning load can be heat processed by
the OA processing unit. This means that the air conditioning unit itself can be more compact. And since it totally
processes the outdoor air loads, it is possible to separate outdoor air loads and indoor air loads, allowing the
freedom for easier installation designs. In addition, air passes through the permeable film humidifier that
increases its heat and ensures proper humidity content.
2.3 Functions of Non-Humidifying Type (GUF-RD3)
●
Air conditioning
The high-performance direct-expansion coil and the air conditioning and Lossnay Core allow a single OA
processing unit to provide low-energy heating and cooling ventilation.
Page 6
Model 50
Rated air flow volume
500 m3/h
4
CHAPTER 1 ● Product Section
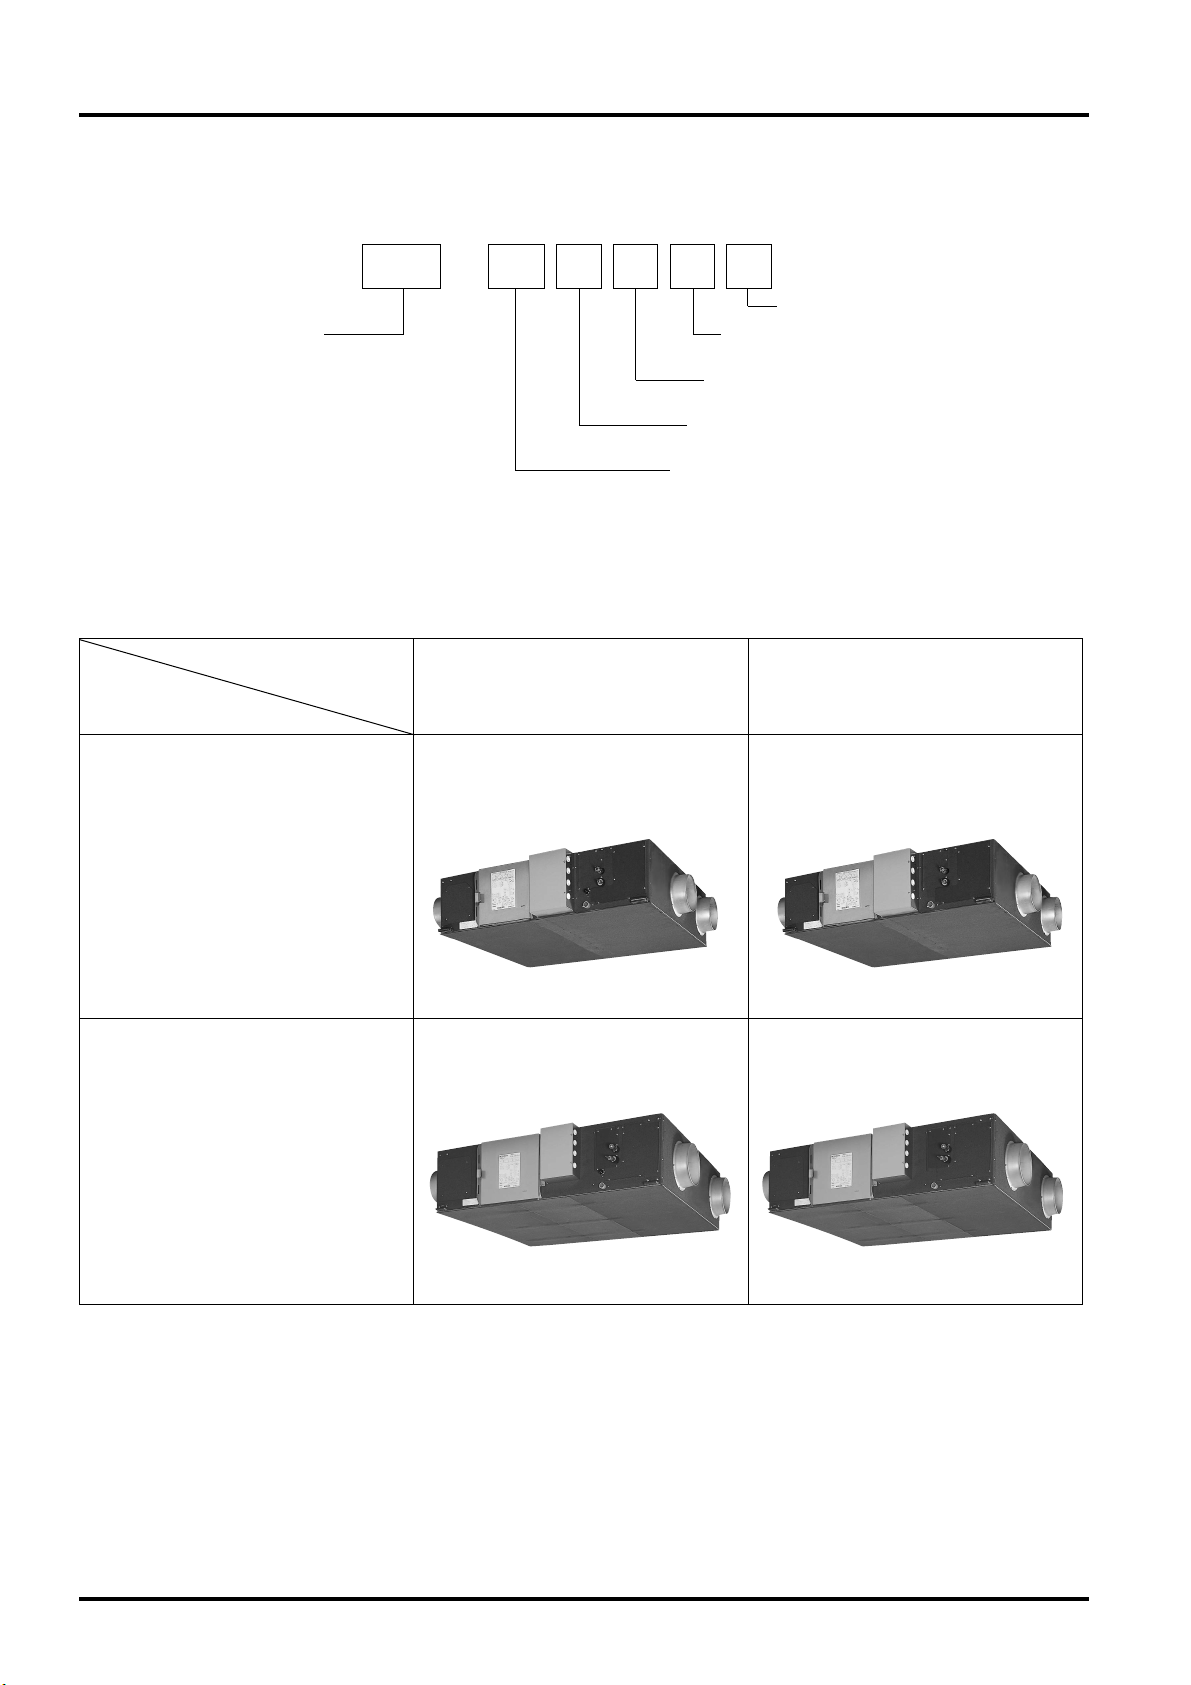
3. Model Line-Up
4. Summary of Types
Outdoor Air
processing unit
H: with humidifier
D: with direct-expansion coil
R: Ceiling recessed
Air volume
50: 500 m
3
/h
100:1,000 m3/h
GUF
–
50 R D H
Humidifying type
Direct-expansion coil and
permeable-film humidifier
Non-humidifying type
Direct-expansion coil
Model 100
Rated air flow volume
1,000 m3/h
Ventilation, Heat recovery,
Humidifying, Heat processing
and (Dust removal)
Ventilation, Heat recovery,
Air conditioning and
(Dust removal)
GUF-50RD3
Ventilation, Heat recovery,
Humidifying, Heat processing
and (Dust removal)
GUF-100RDH3
Ventilation, Heat recovery and
(Dust removal)
GUF-100RD3
Note: (Dust removal) ......This function is enabled by using the optional high-efficiency filter.
GUF-50RDH3
3
3: Development Version
Page 7
GUF-50RDH3 GUF-100RDH3
Lossnay ventilation By-pass ventilation Lossnay ventilation By-pass ventila
tion
High Low High Low High Low High Low
Single phase 220 V - 240 V 50 Hz Single phase 220 V - 240 V 50 Hz
1.15 0.70 1.15 0.70 2.20 1.76 2.25 1.77
235-265 150-165 235-265 150-165 480-505 385-400 490-515 385-410
(P)32 (P)63
5.29 (DX coil:3.63, Lossnay:1.66) 10.81 (DX coil:7.32, Lossnay:3.49)
6.42 (DX coil:4.17, Lossnay:2.25) 13.00 (DX coil:8.30, Lossnay:4.70)
2.7 (heating) 5.4 (heating)
Supply air: Centrifugal fan [Sirocco fan] × 1 Exhaust air: Centrifugal fan [Sirocco fan] × 1
500 400 500 400 1,000 800 1,000 800
125 80 125 80 135 86 135 86
Totally enclosed capacitor permanent split-phase induction motor, 4 poles, 2 units
33.5-34.5 29.5-30.5 35-36 29.5-30.5 38-39 34-35 38-39 35-36
317 398
1,016 1,231
1,288 1,580
57 (filled with water 61) 98 (filled with water 106)
LEV control
12.7 15.88
6.35 9.52
VP25
Permeable film humidifier
Minimum pressure: 2.0 × 10
4
Pa Maximum pressure: 49.0 × 10⁴Pa
R1/2 of External thread
Non-woven fabrics filter: Gravitational method 82%
+
High-efficiency filter: Colorimetric method 65% (optional parts)
Non-woven fabrics filter: Gravitational method 82%
5
CHAPTER 1 ● Product Section
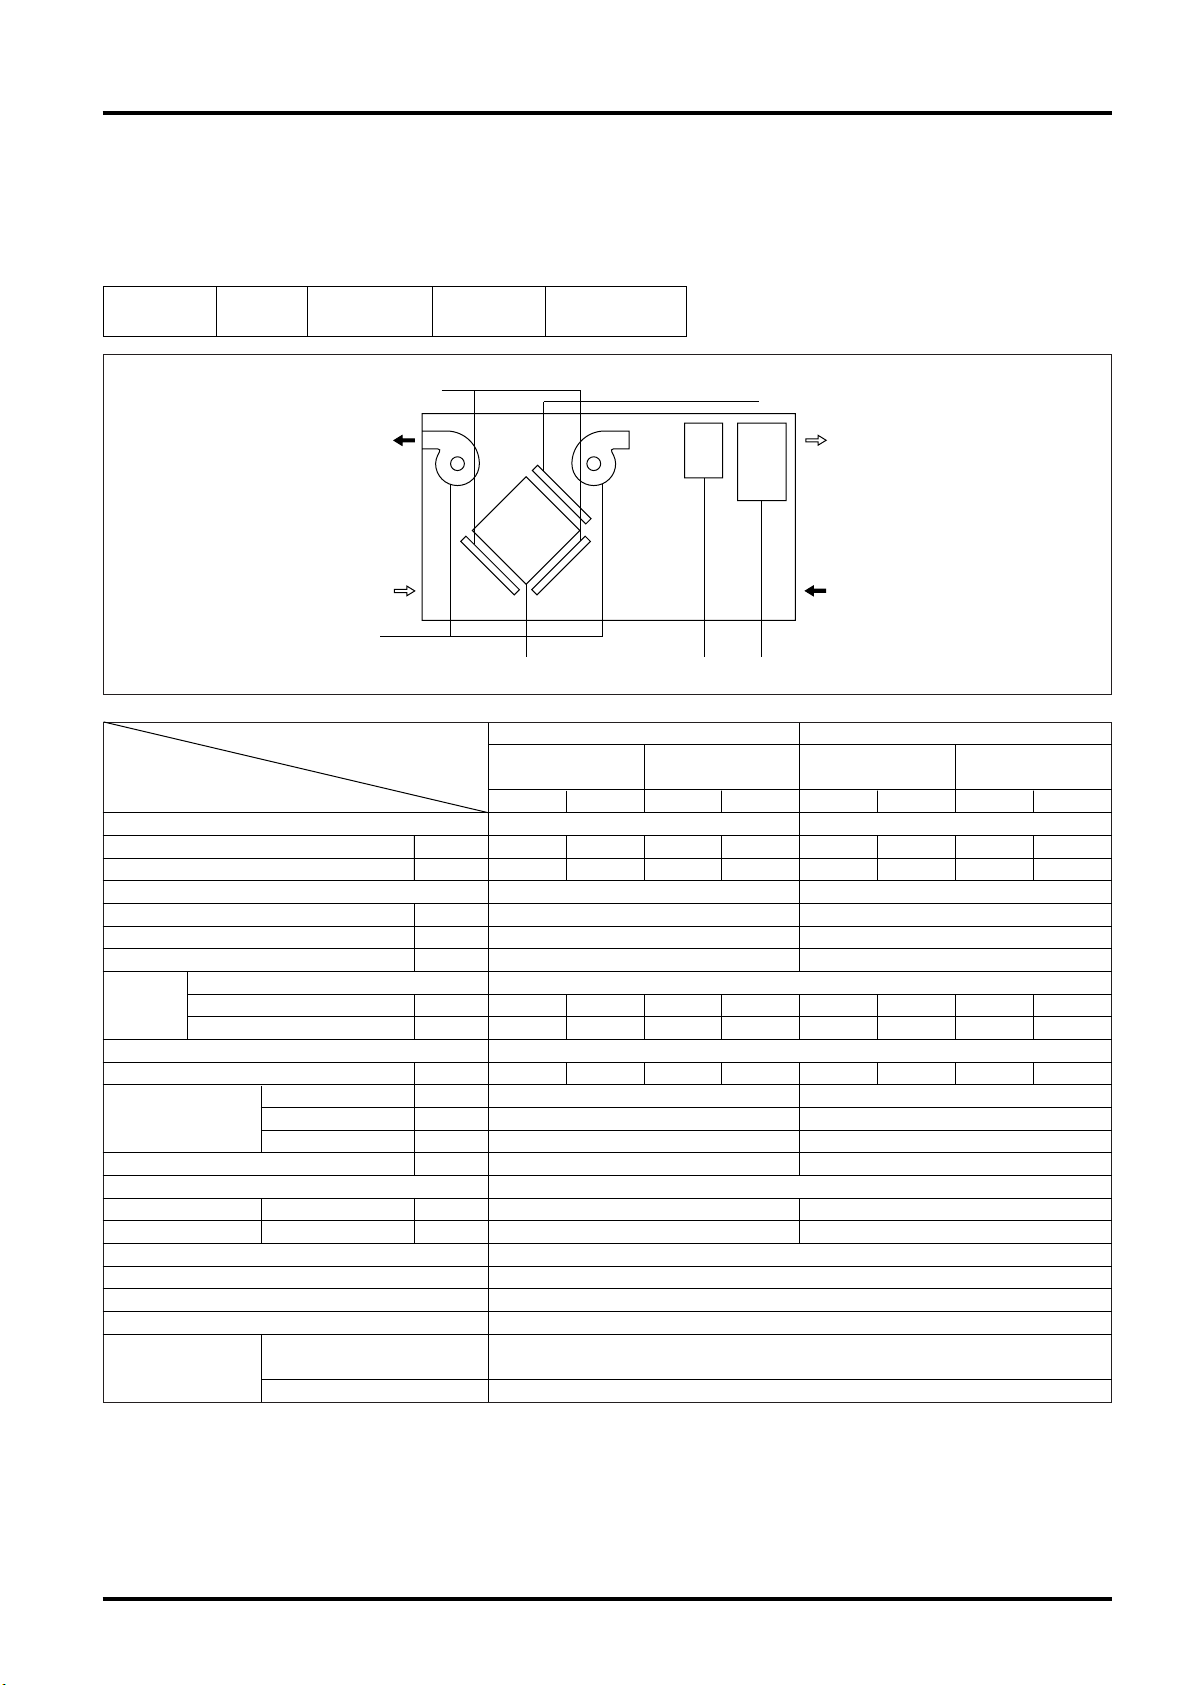
5. Specifications
5.1 Humidifying Type
Fan
EA
OA
SA
RA
Lossnay Core Direct Expansion coil Humidifier
High-efficiency filter
(Optional parts)
Air filter
Ventilation
Heat
recovery
Humidifying
Heat
processing
(
Dust removal
)*
Model
Items
Power source
Current
Input
Capacity equivalent to the indoor unit
Cooling capacity
Heating capacity
Humidifying capacity
Fan
Fan motor
Noise level
Maximum
dimensions
Weight
Refrigerant control
Refrigerant pipe
dimensions
Drain pipe dimension
Type of humidifier
Water supply pressure
Water supply pipe dimension
Filter
Width
Height
Depth
Gas
Liquid
A
W
kW
kW
kg/h
m
3
/h
Pa
dB (A)
mm
mm
mm
kg
ø mm
ø mm
Note: (Dust removal) ......This function is enabled by using the optional high-efficiency filter.
Supply air
Type × No. of fans
Air volume
External static pressure
Exhaust air
Page 8
6
CHAPTER 1 ● Product Section
GUF-50RD3 GUF-100RD3
Lossnay ventilation By-pass ventilation Lossnay ventilation By-pass ventilation
High Low High Low High Low High Low
Single phase 220 V - 240 V 50 Hz Single phase 220 V - 240 V 50 Hz
1.15 0.70 1.15 0.70 2.20 1.73 2.25 1.77
235-265 150-165 235-265 150-165 480-505 370-395 490-515 385-410
(P)32 (P)63
5.29 (DX coil:3.63, Lossnay:1.66) 10.81 (DX coil:7.32, Lossnay:3.49)
6.42 (DX coil:4.17, Lossnay:2.25) 13.00 (DX coil:8.30, Lossnay:4.70)
Supply air diffuser: Centrifugal fan [Sirocco fan] × 1 Exhaust air: Centrifugal fan [Sirocco fan] × 1
500 400 500 400 1,000 800 1,000 800
140 90 140 90 140 90 140 90
Totally enclosed capacitor permanent split-phase induction motor, 4 poles, 2 units
33.5-34.5 29.5-30.5
35-36
29.5-30.5 38-39 34-35
38-39
35-36
317 398
1,016 1,231
1,288 1,580
54 92
LEV control
12.7 15.88
6.35 9.52
VP25
Non-woven fabrics filter: Gravitational method 82%
+
High-efficiency filter: Colorimetric method 65% (optional parts)
Non-woven fabrics filter: Gravitational method 82%
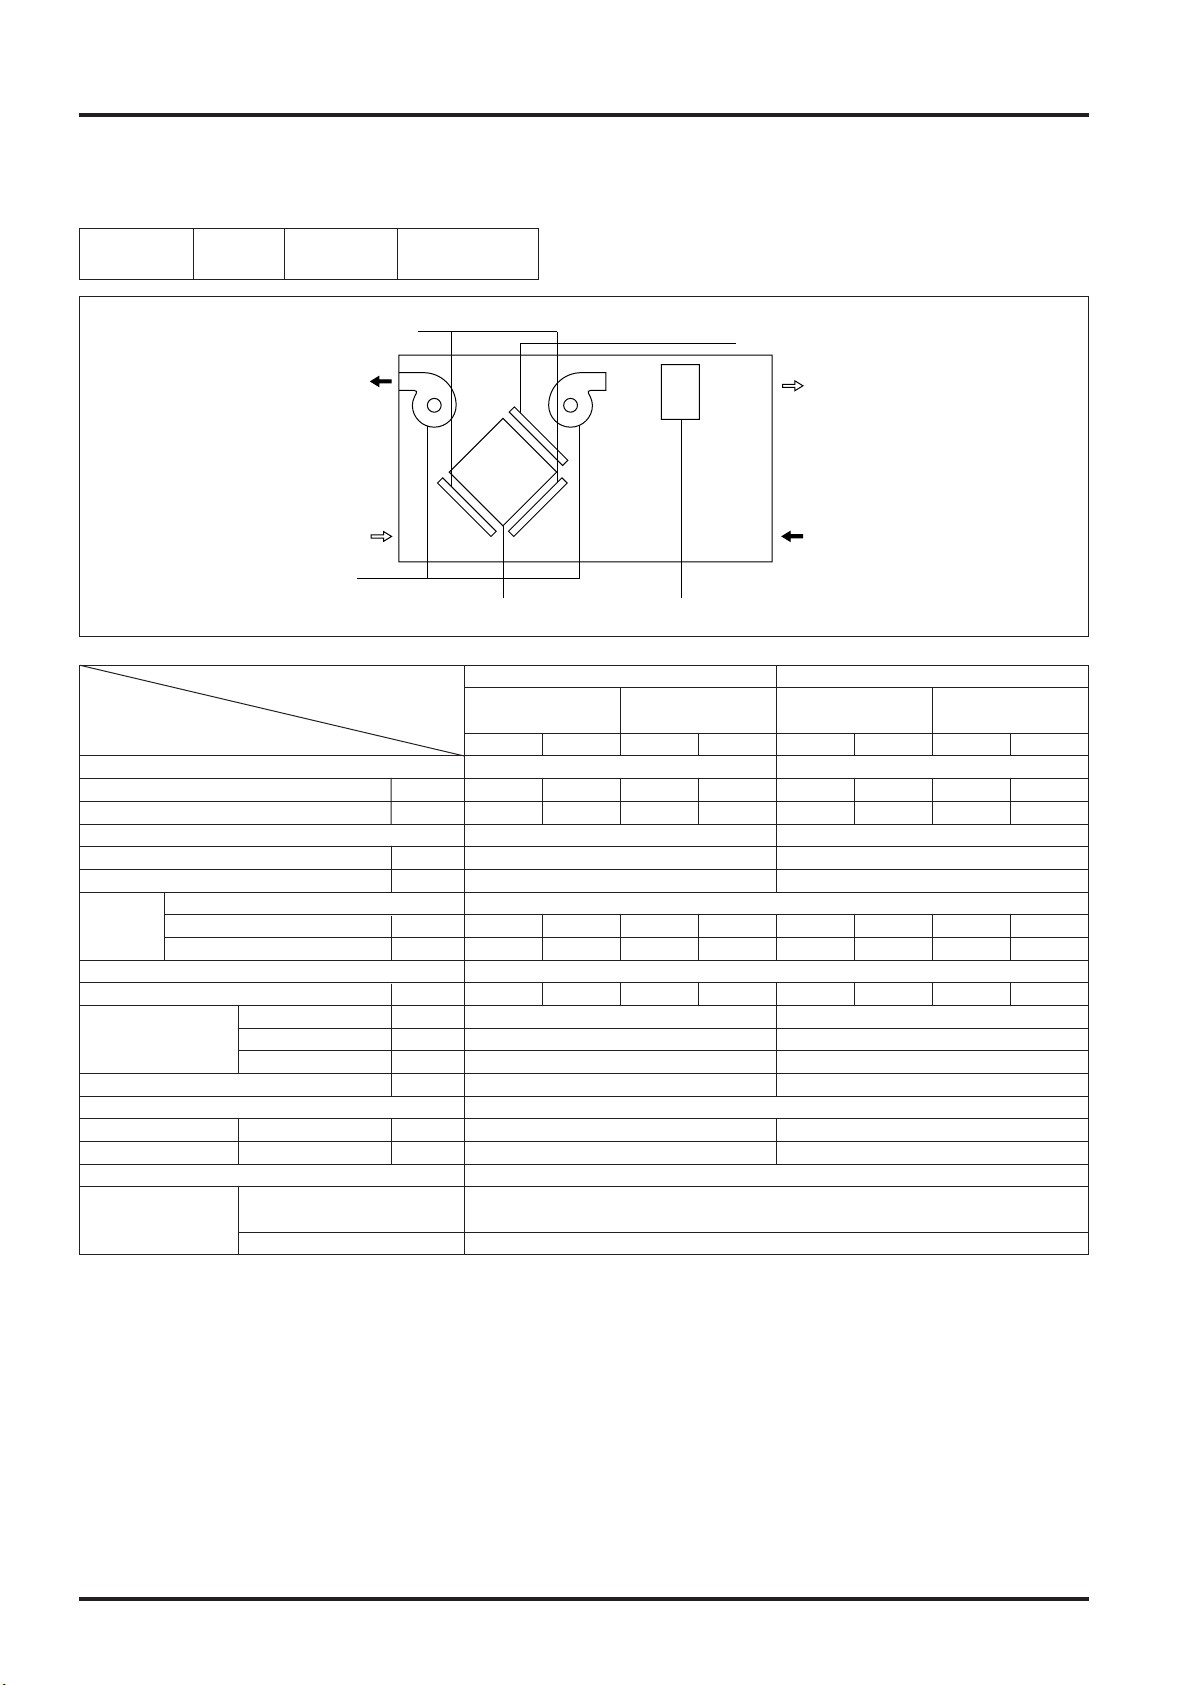
5.2 Non-Humidifying Type
Ventilation
Heat
recovery
Air
conditioning
(
Dust removal
)*
Model
Items
Power source
Current
Input
Capacity equivalent to the indoor unit
Cooling capacity
Heating capacity
Fan
Fan motor
Noise level
Maximum
dimensions
Weight
Refrigerant control
Refrigerant pipe
dimensions
Drain pipe dimension
Filter
Width
Height
Depth
Gas
Liquid
A
W
kW
kW
m
3
/h
Pa
dB(A)
mm
mm
mm
kg
ø mm
ø mm
Note: (Dust removal) ......This function is enabled by using the optional high-efficiency filter.
Supply air
Type × No. of fans
Exhaust air
Fan
EA
OA
SA
RA
Lossnay Core Direct Expansion coil
High-efficiency filter
(Optional parts)
Air filter
Air volume
External static pressure
Page 9
!
!
"#$
% &'
% &(
)*
+
,
)
,
-
-
,
. /
)
,
%!
)
0
+
"
12
324
5
622
#2
7
8989
6$2:#$2
322
/
;
&
&
7
CHAPTER 1 ● Product Section
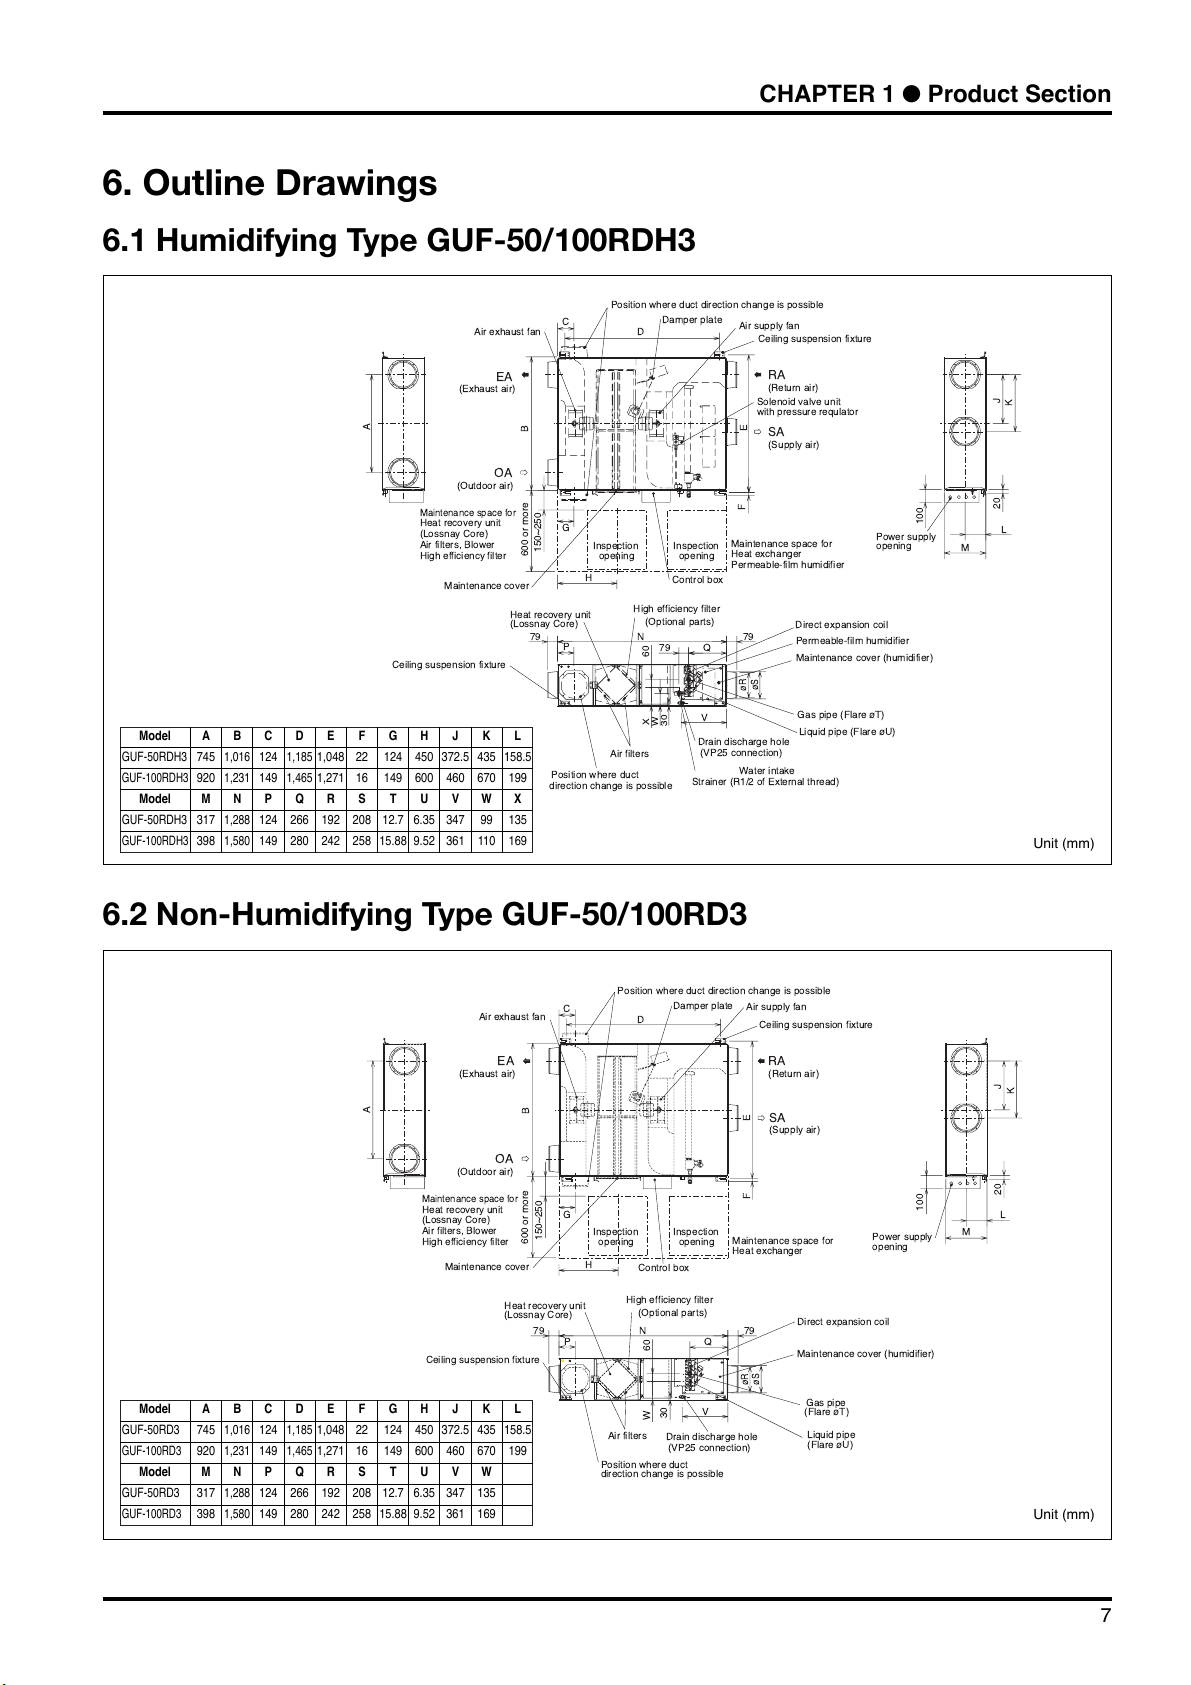
6. Outline Drawings
6.1 Humidifying Type GUF-50/100RDH3
6.2 Non-Humidifying Type GUF-50/100RD3
Unit (mm)
! "
#
$
%
% $
&
%
#
$
'()
* +
,)-
#. / 01
2 / 03
&
% $
4
4
.
$$
*
56
7
86
,
9: ;
'66
'-6<)-6
#
/
2
"
866
0
0
9:9: =
%
>
)6 ?
Unit (mm)
Model A
GUF-50RDH3
745
1,016
124
1,185
1,048 22 124 450 372.5 435 158.5
GUF-100RDH3
920
1,231
149
1,465
1,271 16 149 600 460 670 199
BCDEFGHJ KL
Model M
GUF-50RDH3
317
1,288
124 266 192 208 12.7 6.35 347 99 135
GUF-100RDH3
398
1,580
149 280 242 258 15.88 9.52 361 110 169
NPQRSTUVWX
Model A
GUF-50RD3
745
1,016
124
1,185
1,048 22 124 450 372.5 435 158.5
GUF-100RD3
920
1,231
149
1,465
1,271 16 149 600 460 670 199
BCDEFGHJ KL
Model M
GUF-50RD3
317
1,288
124 266 192 208 12.7 6.35 347 135
GUF-100RD3
398
1,580
149 280 242 258 15.88 9.52 361 169
NPQRSTUVW
Page 10
LED3
SW4
SW5
BROWN
S
B
A
2
1
7
8
9
10
11
12
BROWN
BROWN
BLUE
RED
BLUE
BROWN
/ YELLOW
PURPLE
FAN1
FAN4
TR
CN3TCNT
CND1 CND2
GREEN
BLACK
YELLOW
YELLOW
TH4 (RA)
TH1 (OA)
YELLOW
YELLOW
WHITE
WHITE
RED
PINK
PINK
YELLOW
GREY
GREY
YELLOW
YELLOW
ORANGE
ORANGE
RED
WHITE
WHITE
ORANGE
PURPLE
ORANGE
BLUE
WHITE
RED
BLACK
PINK
GREEN/ YELLOW
GREEN/ YELLOW
BLACK
PINK
ORANGE
WHITE
RED
GREEN/ YELLOW
CN22
CN29
CN21
SW1
SW2
SW3
SW12
LED1
LED2
SW11
SW14
CN20
SV1
SV2
L S
W. S
GM
M1
M2
RED
RED
PURPLE
PURPLE
BROWN
RED
PURPLE
ORANGE
PINK
WHITE
CN60
CN70
CNL
CN27
CN4D
RED
RED
FAN2
FAN3
FUSE1
PAR-F27MEA
PAR-20MAA
Remote Controller
Uncharged a-contact
Humidistat
240VAC more than
10mA
31
Operation monitor output
AC240V 1A AC220V 100mA
DC 24V 1A DC 5V 100mA
MAX MIN
Malfunction monitor output
MAX MIN
AC240V 1A AC220V 100mA
DC 24V 1A DC 5V 100mA
Shield wire
M-NET Remote controller
Fresh Master
To Outdoor Unit , BC Controller
X09
X08
M-NET transmissiion cable
DB901
1
6
7
1
5
5
1
ZNR901ZNR902
DSA1
X05
X04
X07
X06
X03
X02
BREAKER (16A)
RSV (1kΩ)
pipe
Liquid
TH2
pipe
Gas
TH3
SUPPLY FAN
EXHAUST FAN
PINK
PINK
C
C
TM2
TM3
TM1
LEV
1
220-240V ~50Hz
POWER SUPPLY
N
L
PE
N
L
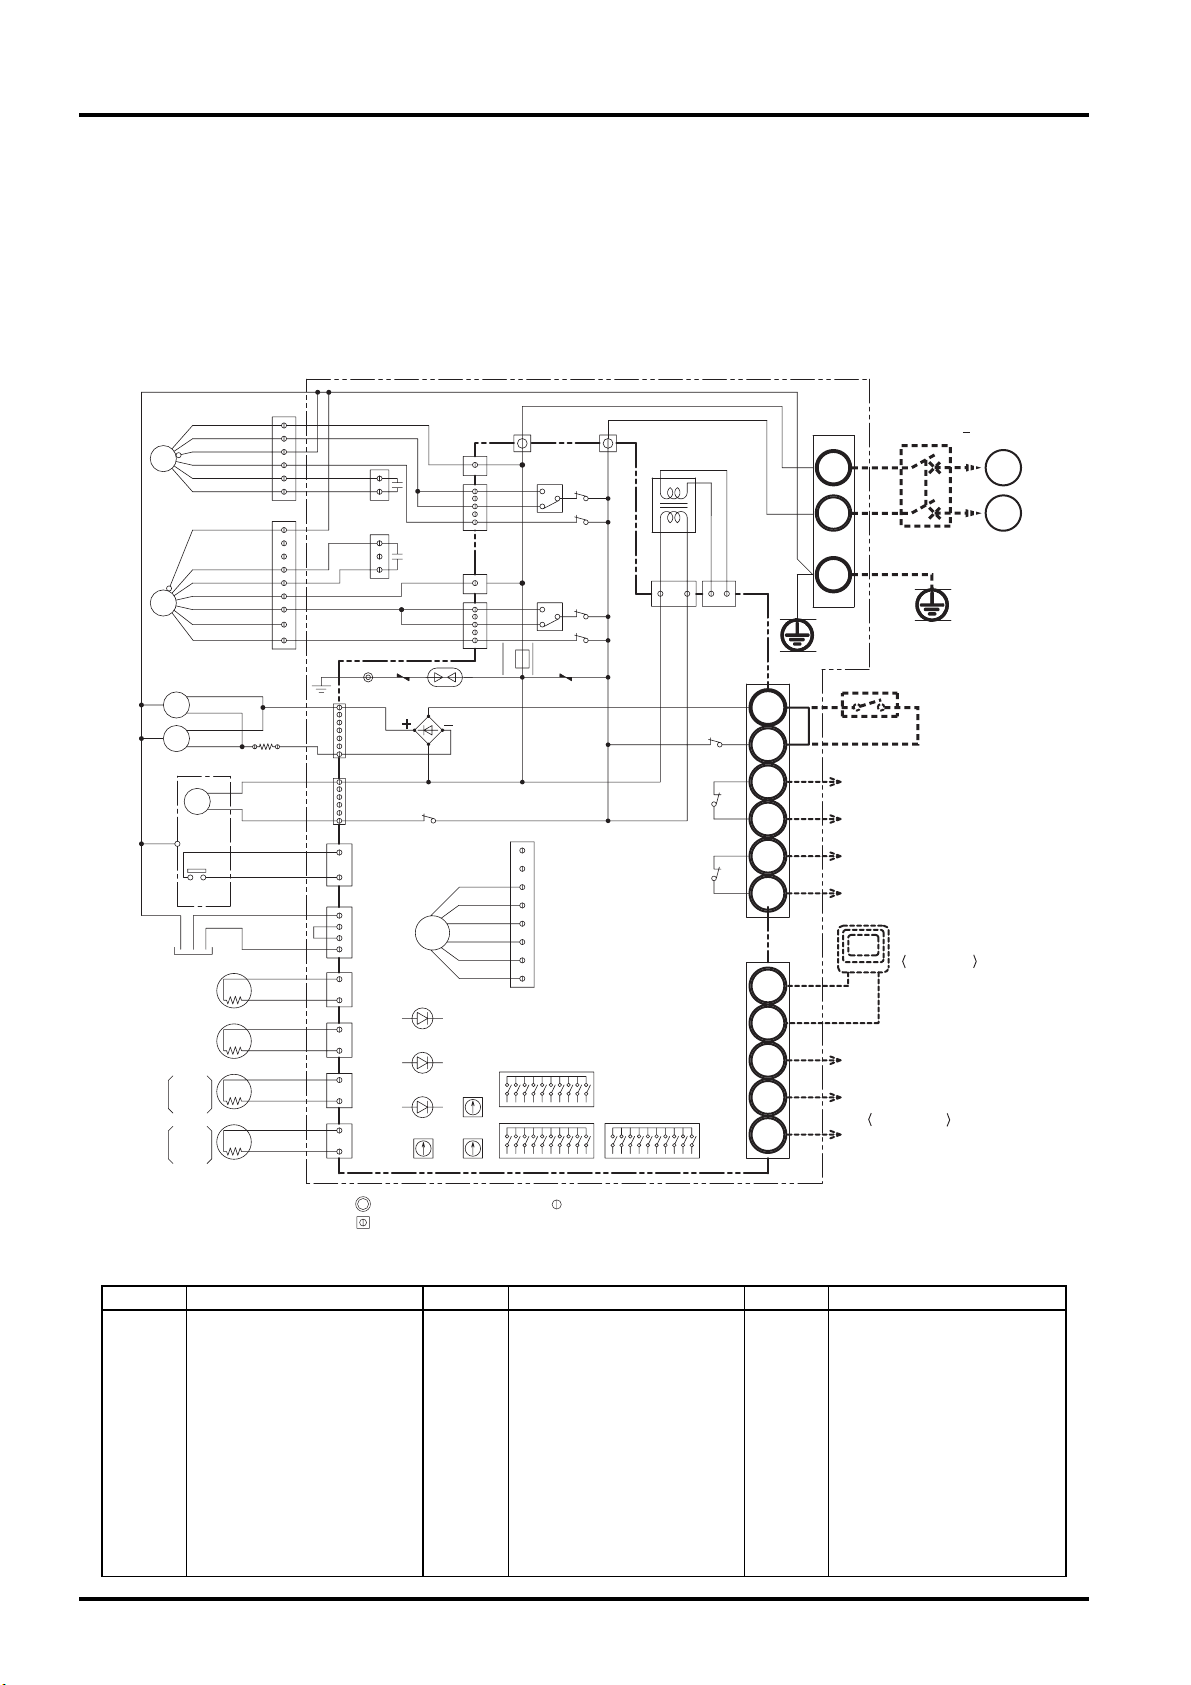
MARK : indicates terminal block, : connector
: board insertion connector or fastening connector of control board.
Symbol Explanation
M1
M2
C
W. S
SV1
SV2
TH1
TH2
TH3
TH4
LEV
RSV
Fan motor (exhaust)
Fan motor (supply)
Capacitor
Water sensor
Solenoid valve (pressure regulator)
Solenoid valve (exhaust)
Thermistor (outdoor air temp. detection)
Thermistor (pipe temp. detection/liquid)
Thermistor (pipe temp. detection/gas)
Thermistor (room air temp. detection)
Electronic linear expansion valve
Resistance (solenoid valve)
TM1
TM2
TM3
SW1
SW2
SW3
SW4
SW5
SW11
SW12
SW14
Terminal block (power supply)
Terminal block (transmission)
Terminal block (humidistat, monitor)
Switch (function selection)
Switch (capacity code setting)
Switch (function selection)
Switch
Switch
Switch (1st digit address set)
Switch (2nd digit address set)
Switch (branch NO. set)
1, 2
A, B
S
CND1, CND2
X02-X09
TR
GM
LS
LED1
LED2
LED3
Remote controller terminal
M-NET transmission terminal
Shield
Connector (power supply)
Relay
Transformer
Damper motor
Limit switch
Power supply monitor
MA remote controller
Power supply monitor
M-NET Power supply monitor
Symbol Name Symbol Name Symbol Name
250V 6.3A
8
CHAPTER 1 ● Product Section
7. Electric Wiring Diagrams
7.1 Humidifying Type GUF-50/100RDH3
●
TM1, TM2, TM3 shown in dotted lines are field work.
●
Be sure to connect the grounding wire.
●
Breakers and controller switches should be provided by the customer.
Page 11
9
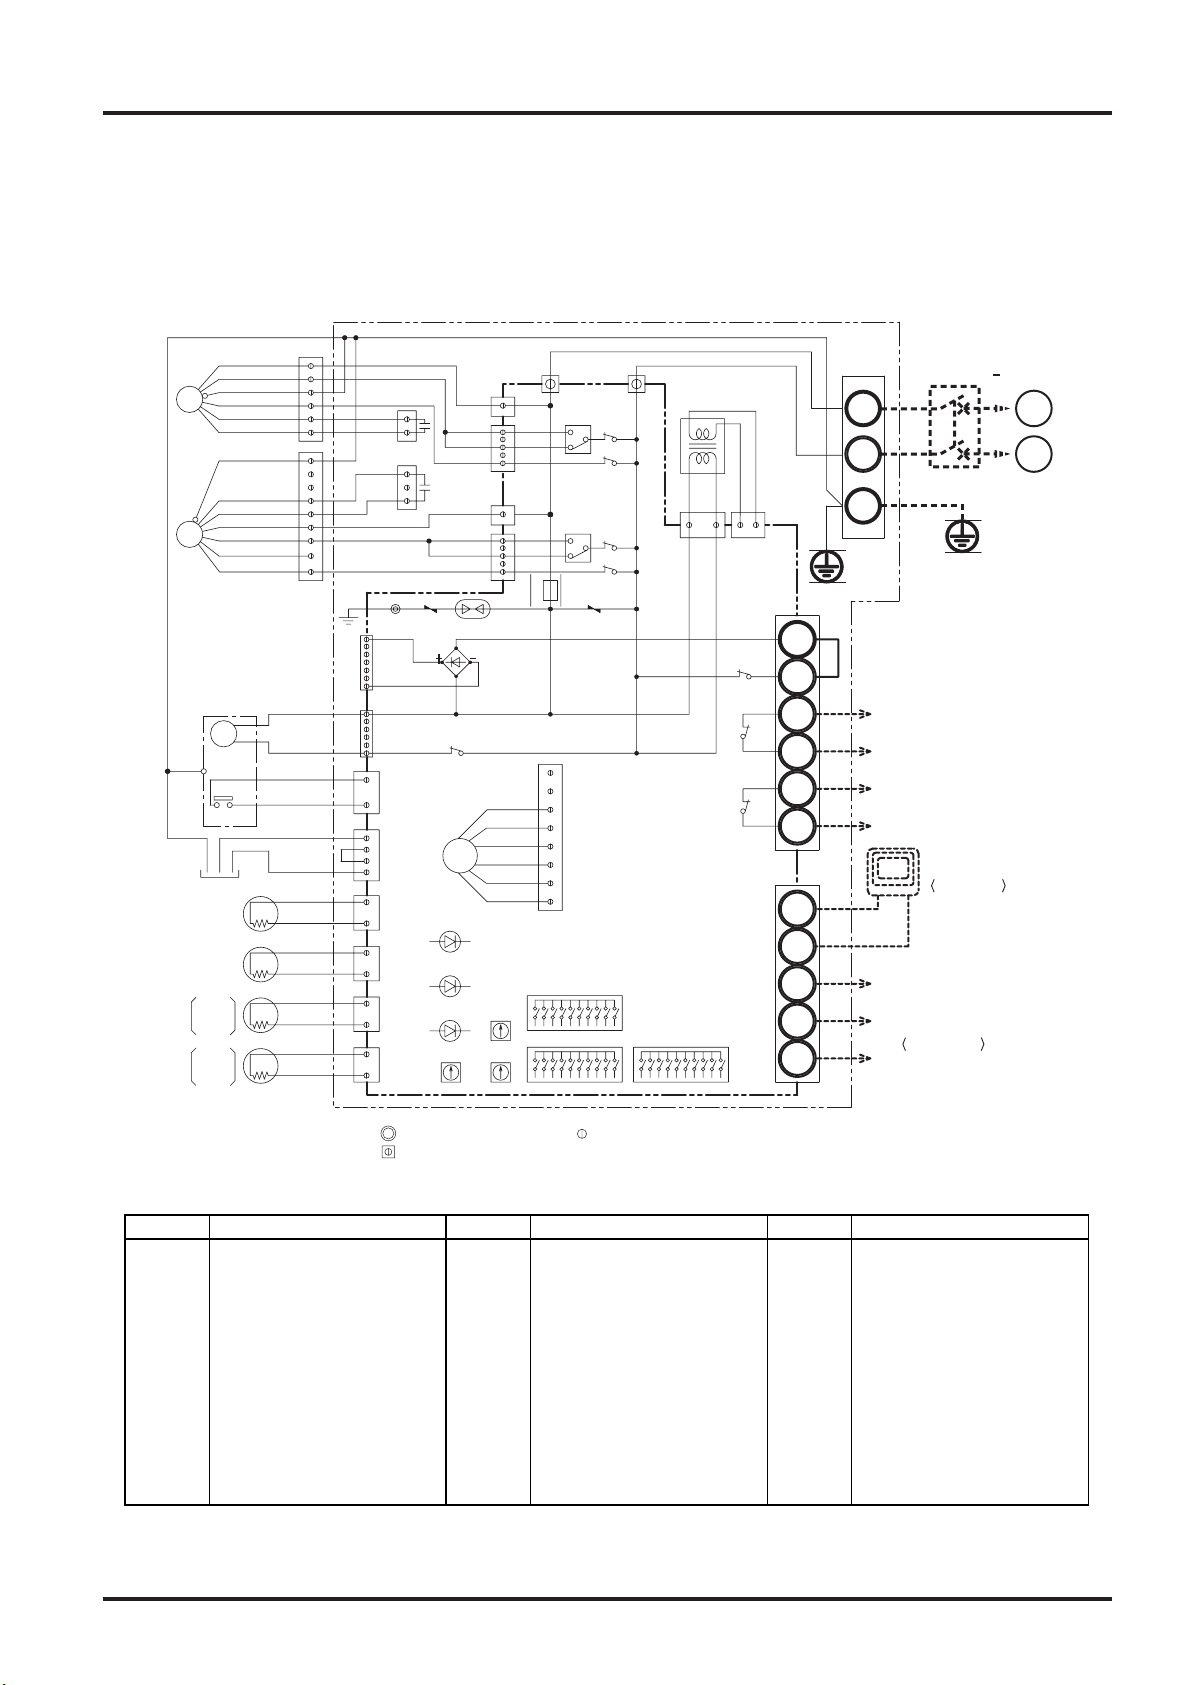
CHAPTER 1 ● Product Section
7.2 Non-Humidifying Type GUF-50/100RD3
●
TM1, TM2 shown in dotted lines are field work.
●
Be sure to connect the grounding wire.
●
Breakers and controller switches should be provided by the customer.
Symbol Explanation
M1
M2
C
W.S
TH1
TH2
TH3
TH4
LEV
Fan motor (exhaust
)
Fan motor (supply)
Capacitor
Water sensor
Thermistor (outdoor air temp. detection
)
Thermistor (pipe temp. detection/liquid)
Thermistor (pipe temp. detection/gas)
Thermistor (room air temp. detection
)
Electronic linear expansion valve
TM1
TM2
TM3
SW1
SW2
SW3
SW4
SW5
SW11
SW12
SW14
Terminal block (power supply)
Terminal block (transmission)
Terminal block (humidistat, monitor)
Switch (function selection)
Switch (capacity code setting)
Switch (function selection)
Switch
Switch
Switch (1st digit address set)
Switch (2nd digit address set)
Switch (branch NO. set)
1, 2
A, B
S
CND1, CND2
X02-X09
TR
GM
LS
LED1
LED2
LED3
Remote controller terminal
M-NET transmission terminal
Shield
Connector (power supply)
Relay
Transformer
Damper motor
Limit switch
Power supply monitor
MA remote controller
Power supply monitor
M-NET Power supply monitor
Symbol Name Symbol Name Symbol Name
PINK
PINK
C
C
FUSE1
PAR-F27MEA
PAR-20MAA
Remote Controller
N
L
PE
N
1
Operation monitor output
AC240V 1A AC220V 100mA
DC 24V 1A DC 5V 100mA
MAX MIN
Malfunction monitor output
MAX MIN
AC240V 1A AC220V 100mA
DC 24V 1A DC 5V 100mA
Shield wire
M-NET Remote controller
Fresh Master
To Outdoor Unit , BC Controller
X09
X08
M-NET transmission cable
DB901
7
5
1
5
1
ZNR901
ZNR902
DSA1
X05
X04
X07
X06
X03
X02
BREAKER (16A)
220-240V ~50Hz
POWER SUPPLY
L
pipe
Liquid
TH2
pipe
Gas
TH3
SUPPLY FAN
EXHAUST FAN
MARK : indicates terminal block, : connector
: board insertion connector or fastening connector of control board.
LED3
SW4
SW5
BROWN
S
B
A
2
7
8
9
10
11
BROWN
BROWN
BLUE
RED
BLUE
BROWN
/YELLOW
PURPLE
FAN1
FAN4
TR
CN3TCNT
CND1 CND2
GREEN
1
12
BLACK
YELLOW
YELLOW
TH4 (RA)
TH1 (OA)
YELLOW
YELLOW
WHITE
WHITE
RED
PINK
PINK
YELLOW
GREY
GREY
YELLOW
YELLOW
ORANGE
ORANGE
RED
WHITE
WHITE
ORANGE
PURPLE
ORANGE
BLUE
WHITE
RED
BLACK
PINK
GREEN/ YELLOW
GREEN/ YELLOW
BLACK
PINK
ORANGE
WHITE
RED
GREEN/ YELLOW
CN22
CN29
CN21
SW1
SW2
SW3
SW12
LED1
LED2
SW11
SW14
CN20
L S
W. S
GM
M1
M2
BROWN
RED
PURPLE
ORANGE
PINK
WHITE
LEV
CN60
CN70
CNL
CN27
CN4D
FAN2
FAN3
3
1
6
1
TM3
TM1
TM2
250V 6.3A
Page 12
10
CHAPTER 1 ● Product Section
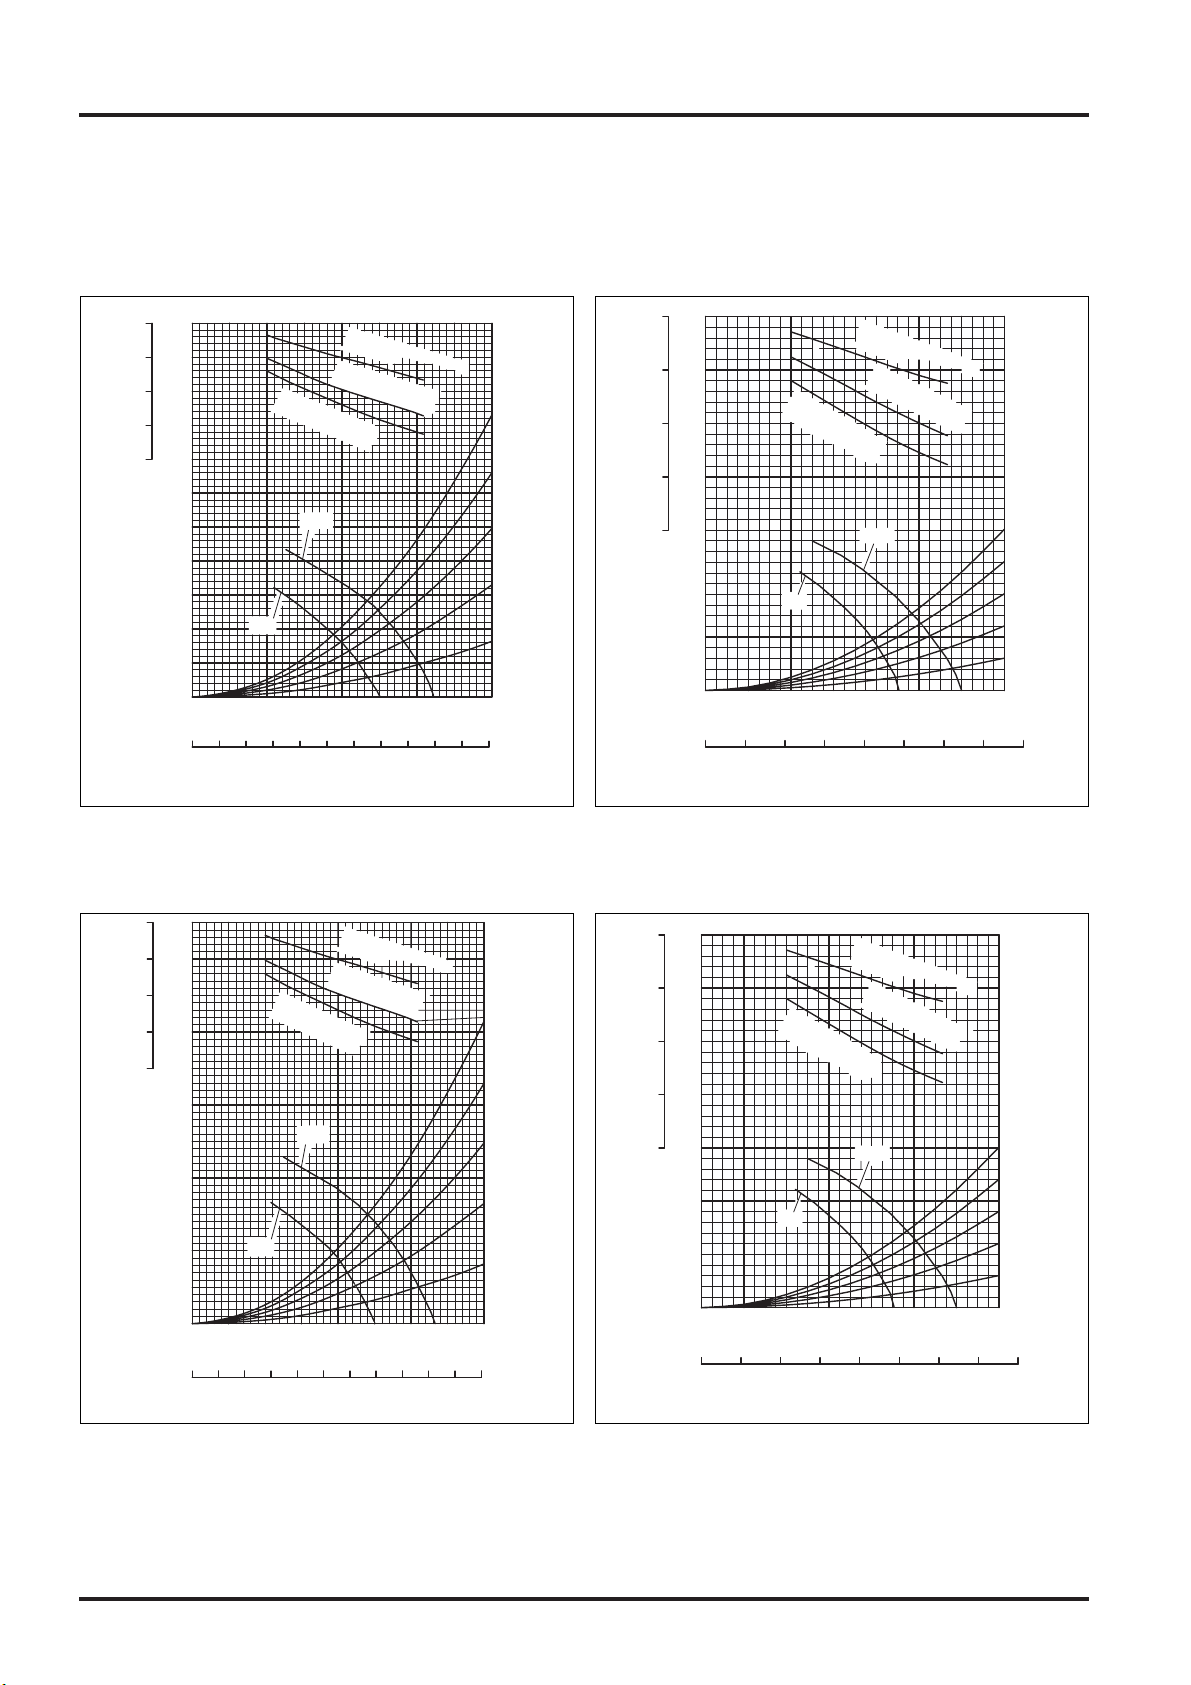
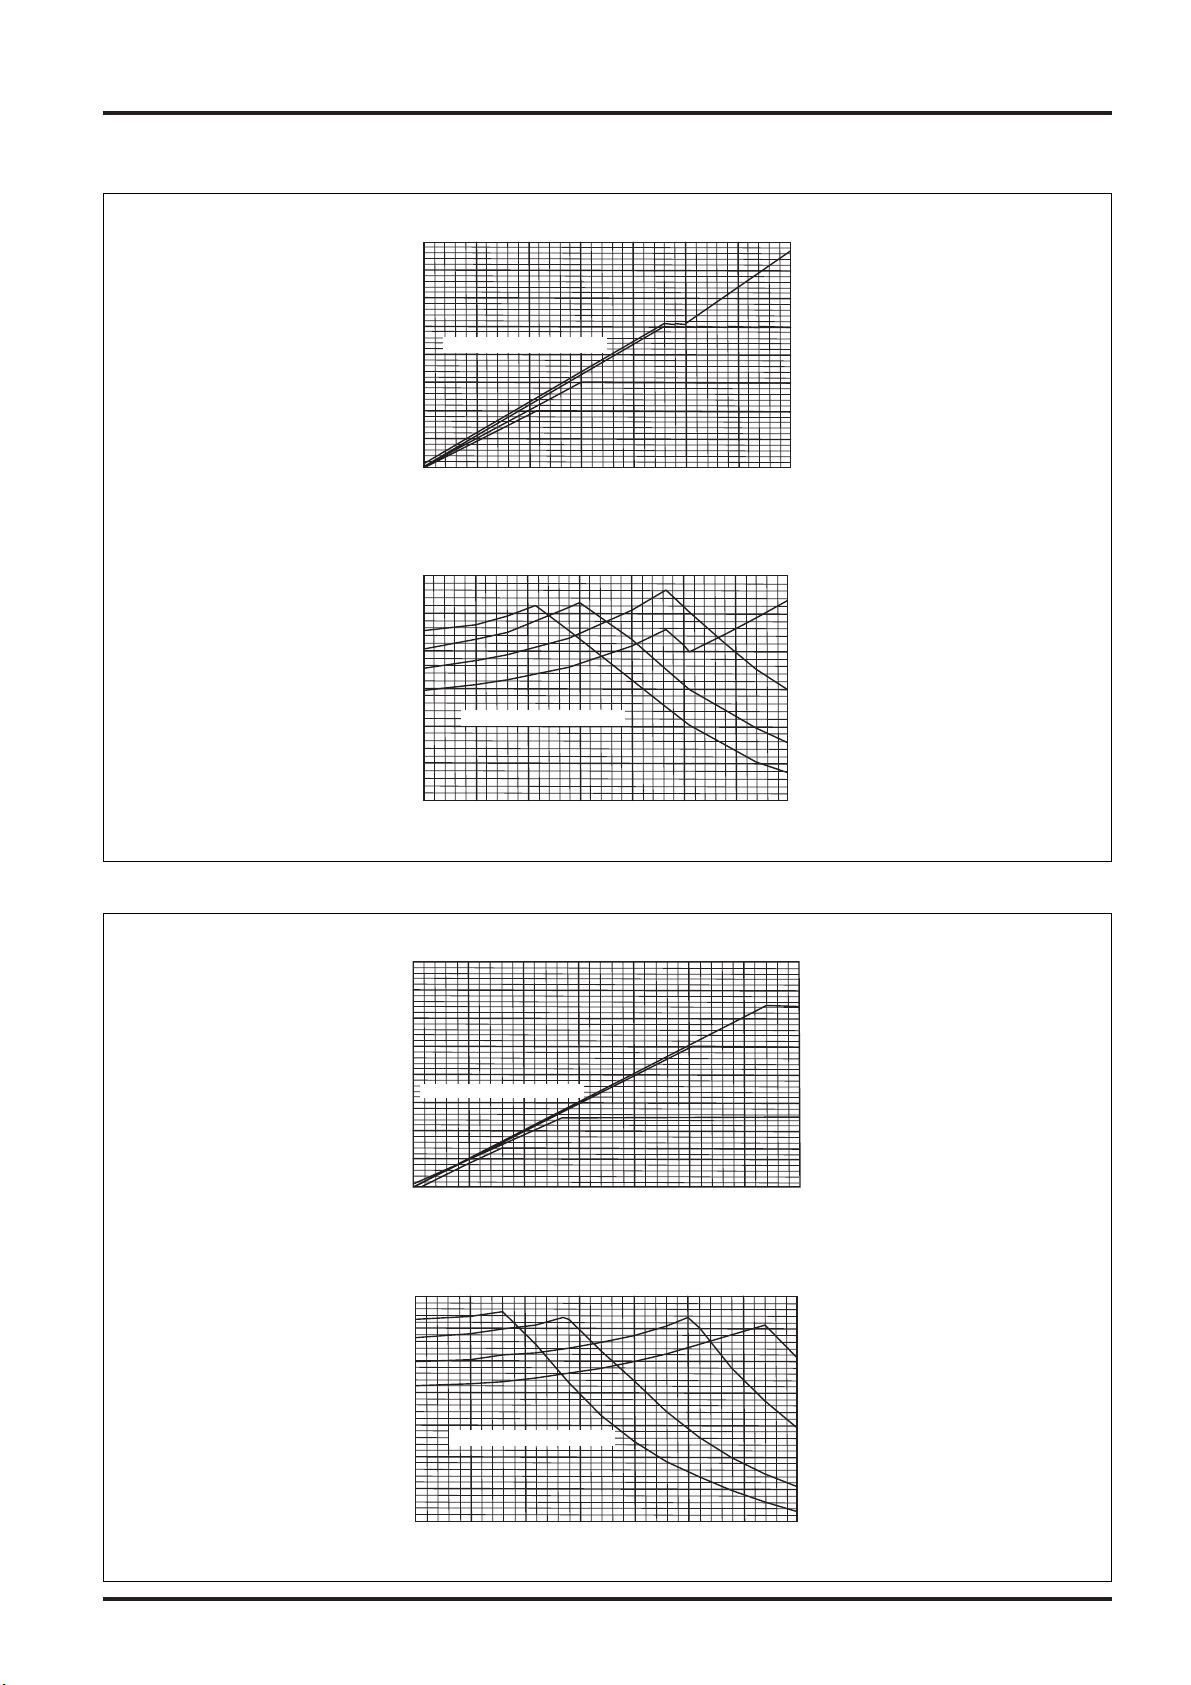
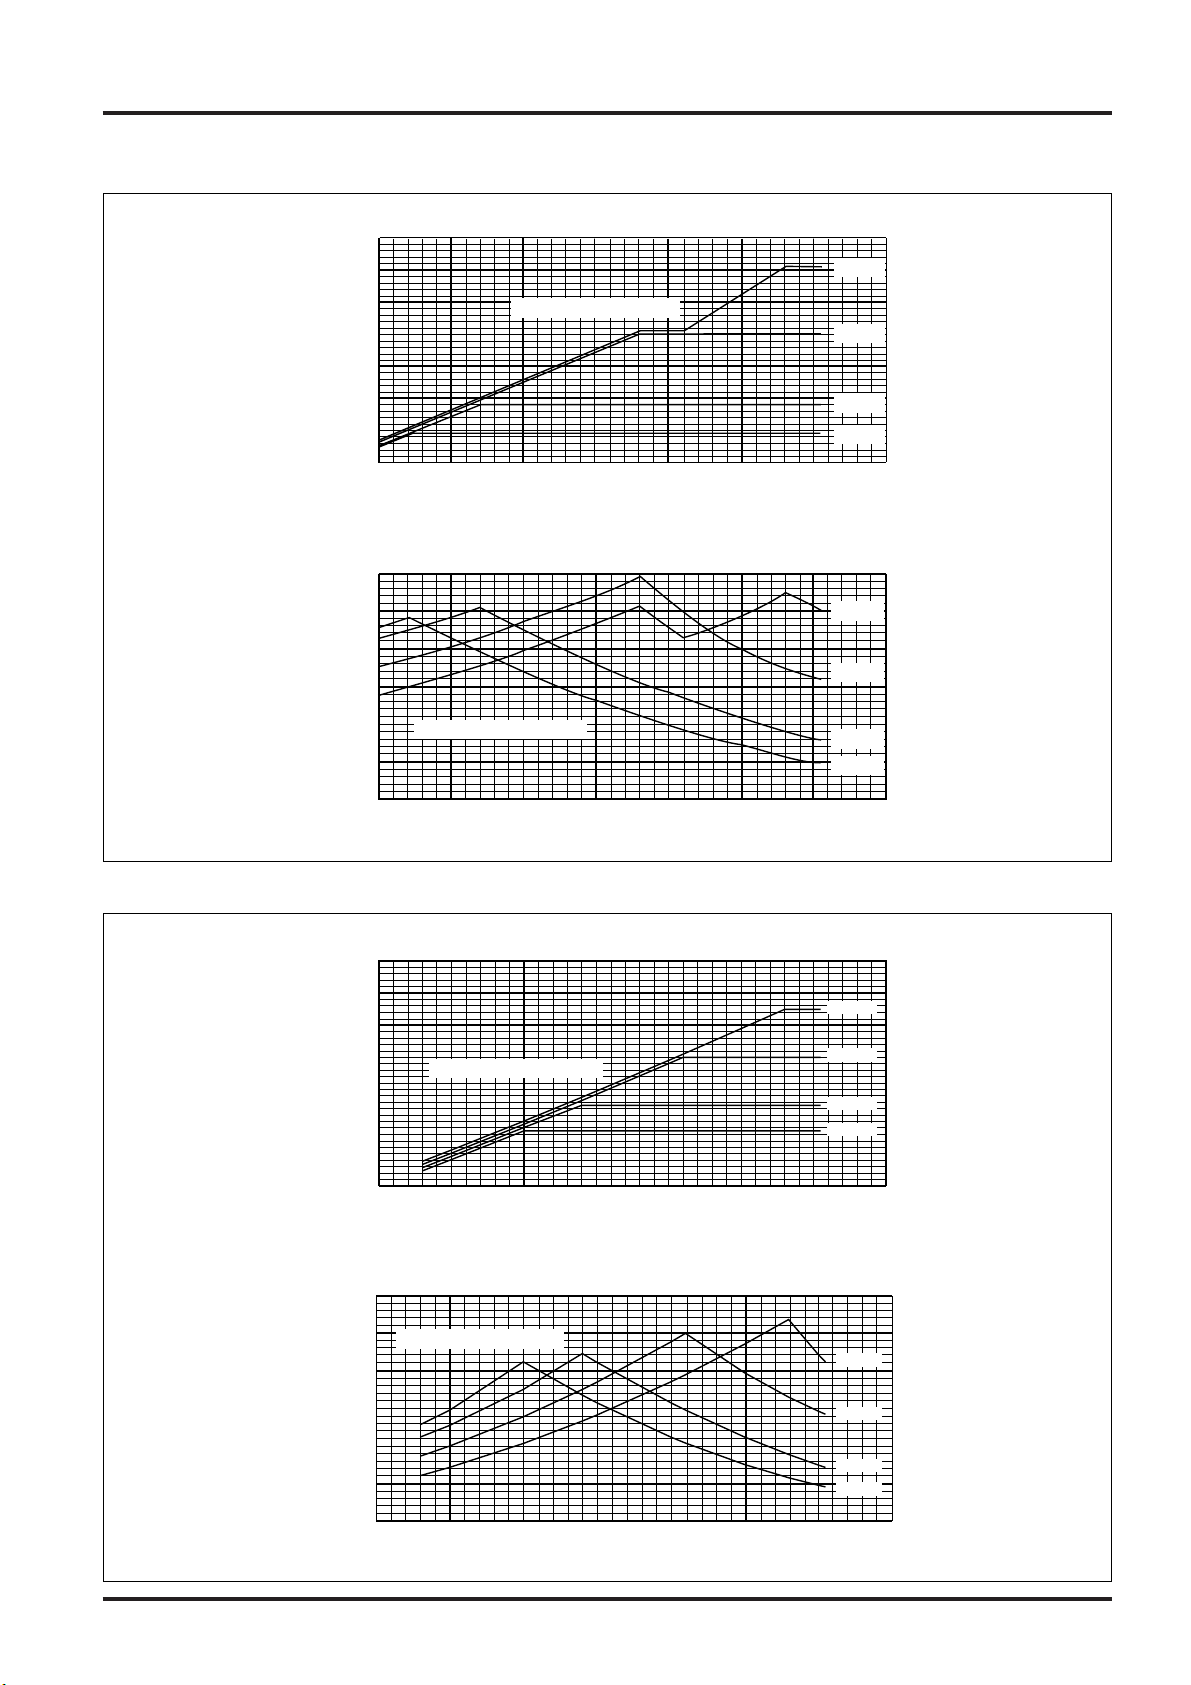
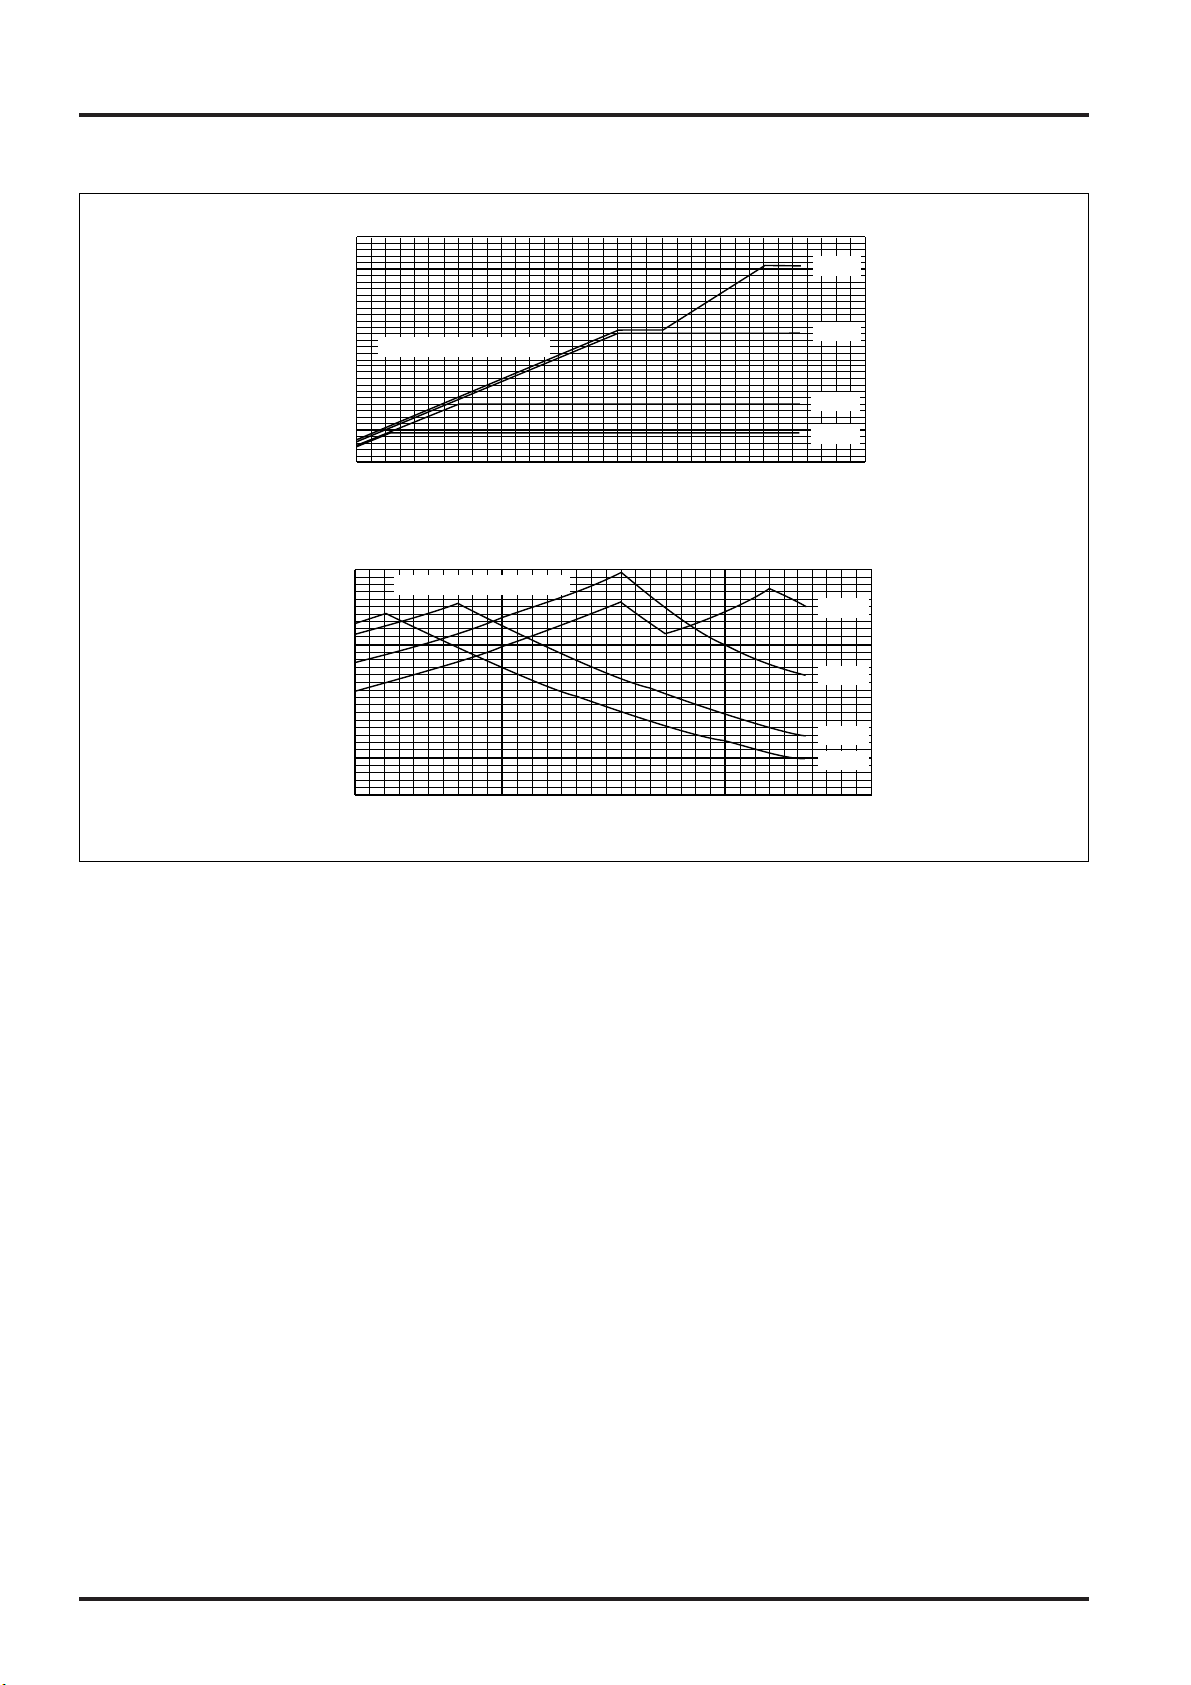
8. Characteristic Curves
8.1 Humidifying Type
8.2 Non-Humidifying Type
Low
High
Enthalpy exchange
efficiency (Cooling)
Enthalpy exchange
efficiency (Heating)
Temperature exchange
efficiency
300
0
(Pa)
External static pressure
Exchange efficiency
500
200
400
50
60
70
80
90
400
Air volume (L/s)
35025020015010050 3000
1400
(m
3
/h)
12001000800600400200
100m
80m
60m
40m
20m
250mm dia
pipe length
100
(%)
Low
High
Enthalpy exchange
efficiency (Cooling)
Enthalpy exchange
efficiency (Heating)
Temperature exchange
efficiency
020 220180 2006040 80 100 120 140 160
Air volume (L/s)
(m
3
/h)
200mm dia
pipe length
(Pa)
External static pressure
90
50
60
70
80
Exchange efficiency
3
2
1
4
m06
001
m
m04
m02
00
00
00
m08
060040020 080
00
0
(%)
GUF-100RDH3GUF-50RDH3
Low
High
Enthalpy exchange
efficiency (Cooling)
Enthalpy exchange
efficiency (Heating)
Temperature exchange
efficiency
300
0
(Pa)
External static pressure
Exchange efficiency
500
100
200
400
50
60
70
80
90
400
Air volume (L/s)
35025020015010050 3000
1400
(m
3
/h)
12001000800600400200
100m
80m
60m
40m
20m
pipe length
250mm dia.
(%)
Low
High
Enthalpy exchange
efficiency (Cooling)
Enthalpy exchange
efficiency (Heating)
Temperature exchange
efficiency
Air volume (L/s)
220160140120100802004060 200180
(m
3
/h)
060
00
00
00
00
External static pressure
(Pa)
4
08
07
06
05
09
Exchange efficiency
0
080020 040
80m
20m
40m
m
100
60m
1
2
3
pipe length
200mm dia.
(%)
GUF-100RD3GUF-50RD3
Page 13
11
CHAPTER 1 ● Product Section
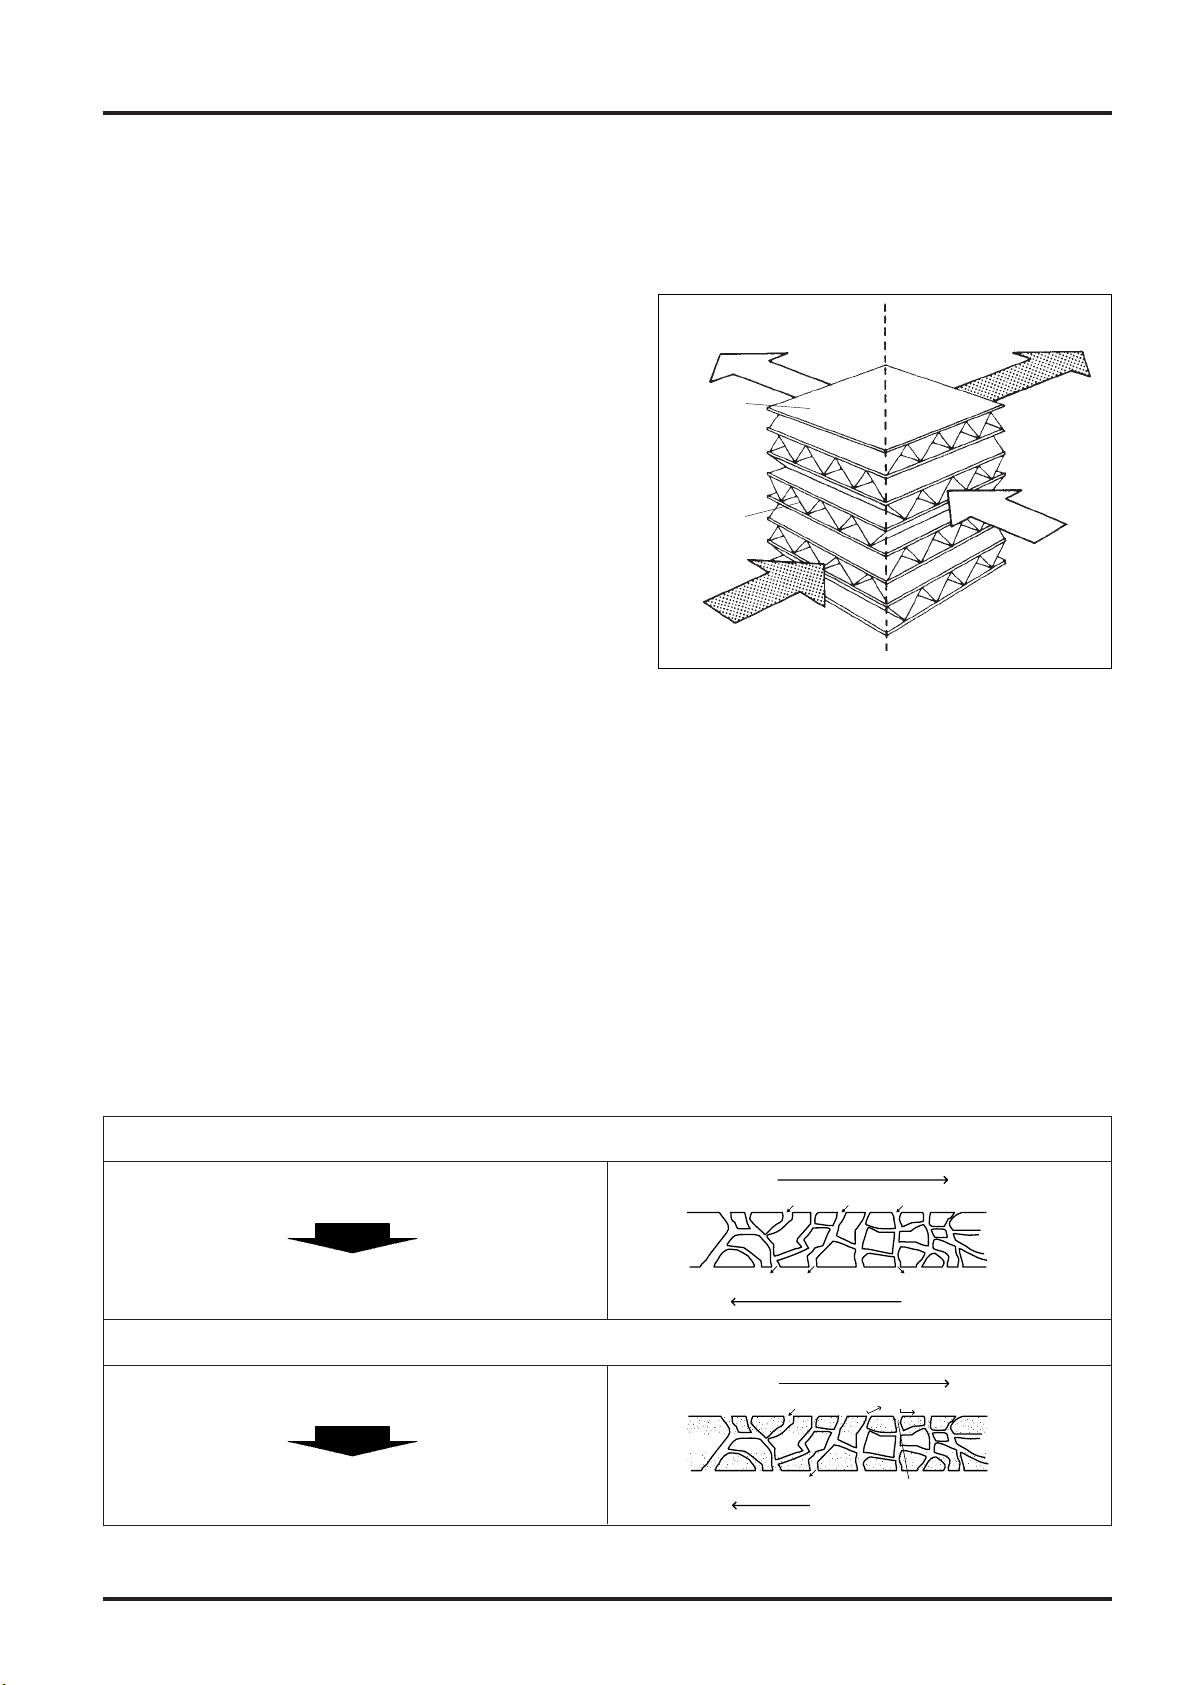
9. Construction and Principle of Heat Recovery Unit (Lossnay Core)
●
Simple construction
The Lossnay Core is a cross-flow total heat recovery unit
constructed of plates and fins made of treated paper.
The fresh air and exhaust air passages are completely
separated allowing the fresh air to be introduced without
mixing with the exhaust air.
●
Principle
The Lossnay Core uses the heat transfer properties and
moisture permeability of the treated paper. Total heat
(sensible heat plus latent heat) is transferred from the stale
exhaust air to the fresh air being introduced into the system
when they pass through the Lossnay Core.
Try this simple experiment. Roll a piece of paper into a tube
and blow through it. Your hand holding the paper will
immediately feel warm. If cold air is blown through the tube,
your hand will immediately feel cool. This means heat is
transferred through paper. Lossnay Core is a total heat
recovery unit that utilizes these special properties of paper.
●
Treated paper
The paper partition plates are specially treated so that the Lossnay Core is an appropriate heat recovery unit for
the ventilator. This paper differs from ordinary paper, and has the following unique properties.
(1) The paper is incombustible and is strong.
(2) The paper has selective hydroscopicity and moisture permeability that permits the passage of water vapor
only (including some water-soluble gases).
(3) The paper has gas barrier properties that does not pass gases such as CO
2
.
A comparison of the ordinary paper and the Lossnay Core plates is as shown in the table.
Ordinary paper
Water vapor is transferred, but gas elements that are easily
dissolved in water such as CO2, NO2 are also transferred.
The contaminated air passes through the plates during
ventilation and returns to the room.
Treated paper
Water vapor is transferred, but gas elements such as CO
2, NO2
are not transferred.
The contaminated air does not return to the room when
ventilated.
SA
Supply air diffuser
(Fresh cold or warm air)
Partition
plate
(Treated
paper)
Spacer plate
(Treated paper)
RA
Return air
(Stale cold or warm air)
Indoors Outdoors
EA
Exhaust air
(Stale air)
OA
Outdoor air
(Fresh air)
Highly humid air
Water vapor
Water vapor
CO
2 NO2
CO2 NO2
CO2 NO2Water vapor
Water vapor
Treatment
(Selective permeable film)
(Incombustible specifications)
Low humid air
Highly humid air
Cellulose
fibers
Low humid air
Page 14
12
CHAPTER 1 ● Product Section
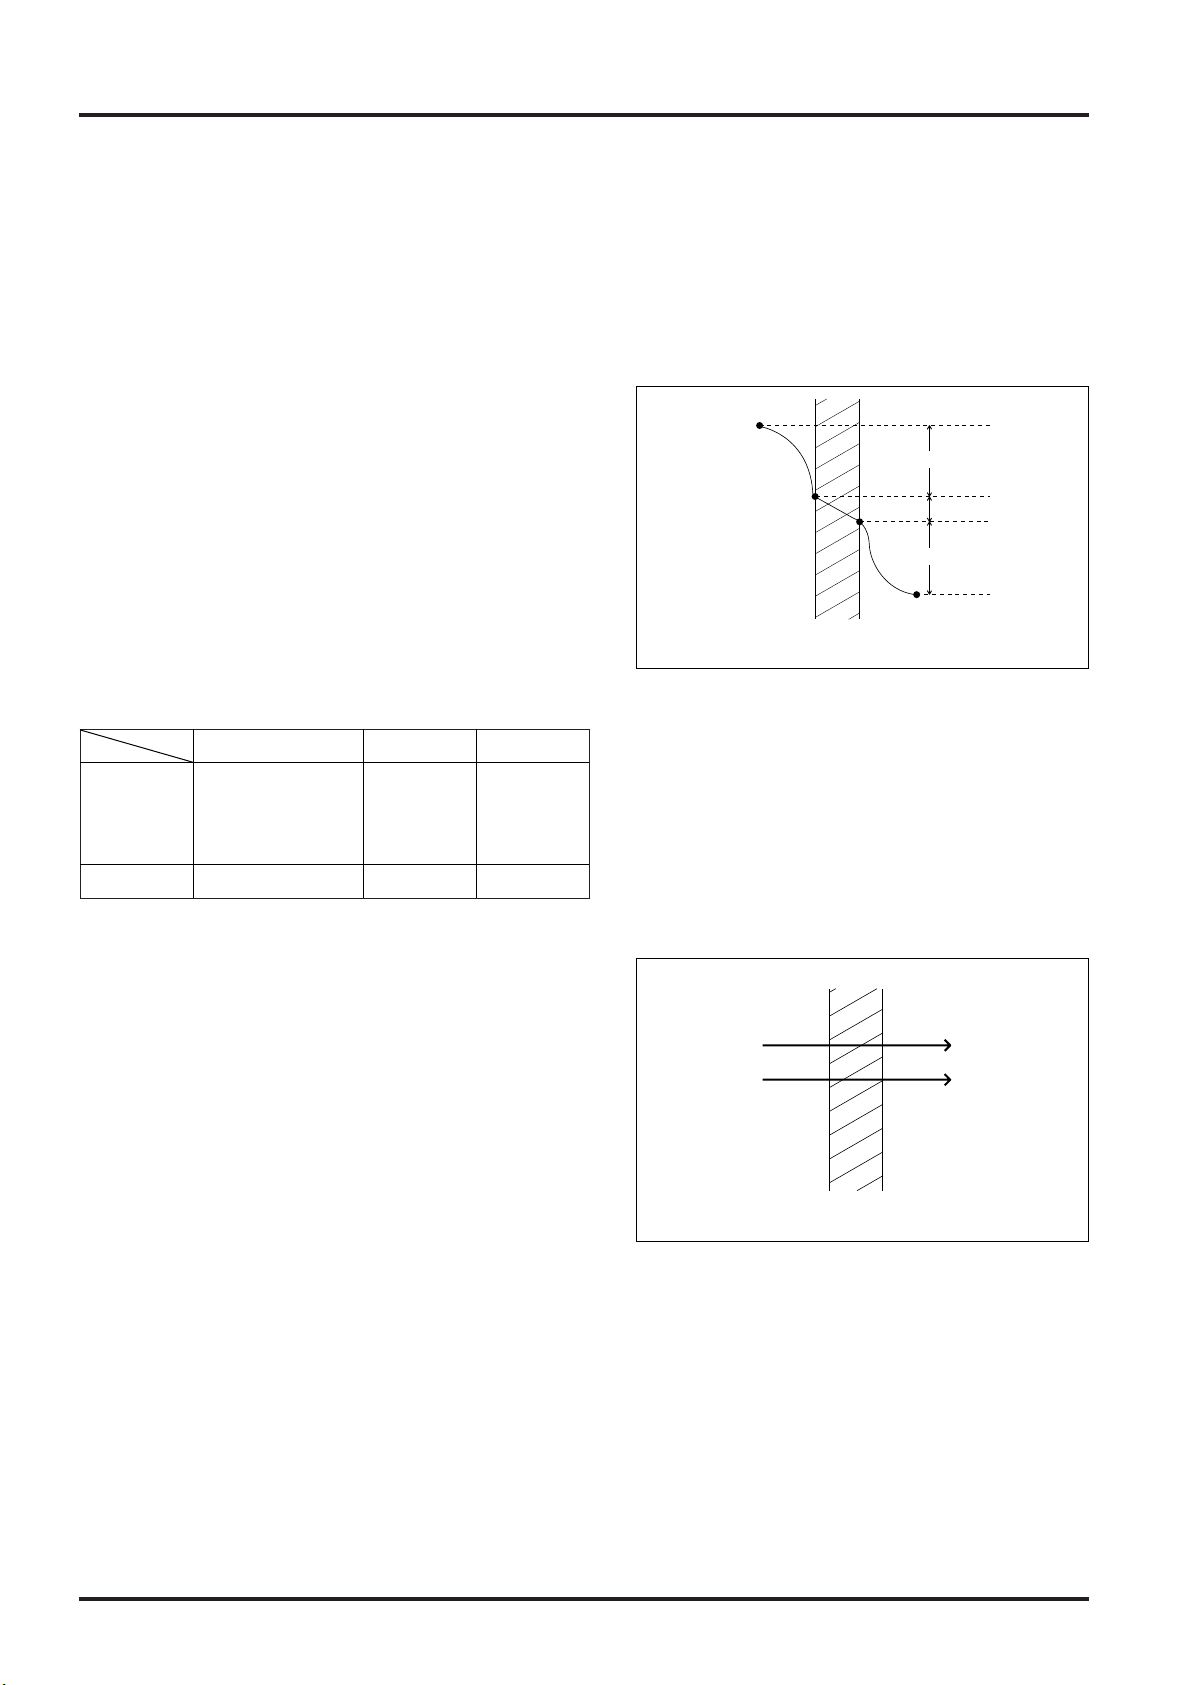
●
Total heat recovery mechanism
Sensible heat and latent heat
The heat that enters and leaves in accordance with changing temperature (rise or drop) is called sensible heat.
The heat that enters and leaves due to the changes in the physical properties of the matter (evaporation,
condensation) is called latent heat.
(1) Heat (sensible heat) exchange
1) Heat conduction and heat passage is performed
through a partition plate from the high temperature to
low temperature side.
2) As shown on the right, the heat exchange efficiency is
affected by the resistance of the boundary layer, and for
the Lossnay Core there is little difference when
compared to materials such as copper or aluminium
which also have high thermal conductivity.
Heat resistance coefficients
Treated paper Cu Al
Ra1 10 10 10
Rp 1 0.00036 0.0006
Ra2 10 10 10
Total 21 20.00036 20.0006
(2) Humidity (latent heat) exchange
●
Water vapor is moved through the partition plate from
the high humidity to the low humidity side by means
of the differential pressure in the vapor.
t1
t2
Ra1
Ra2
Rp
Partition plate
Ra1+Ra2
»Rp
High humidity side
Low humidity side
Partition plate
Page 15
13
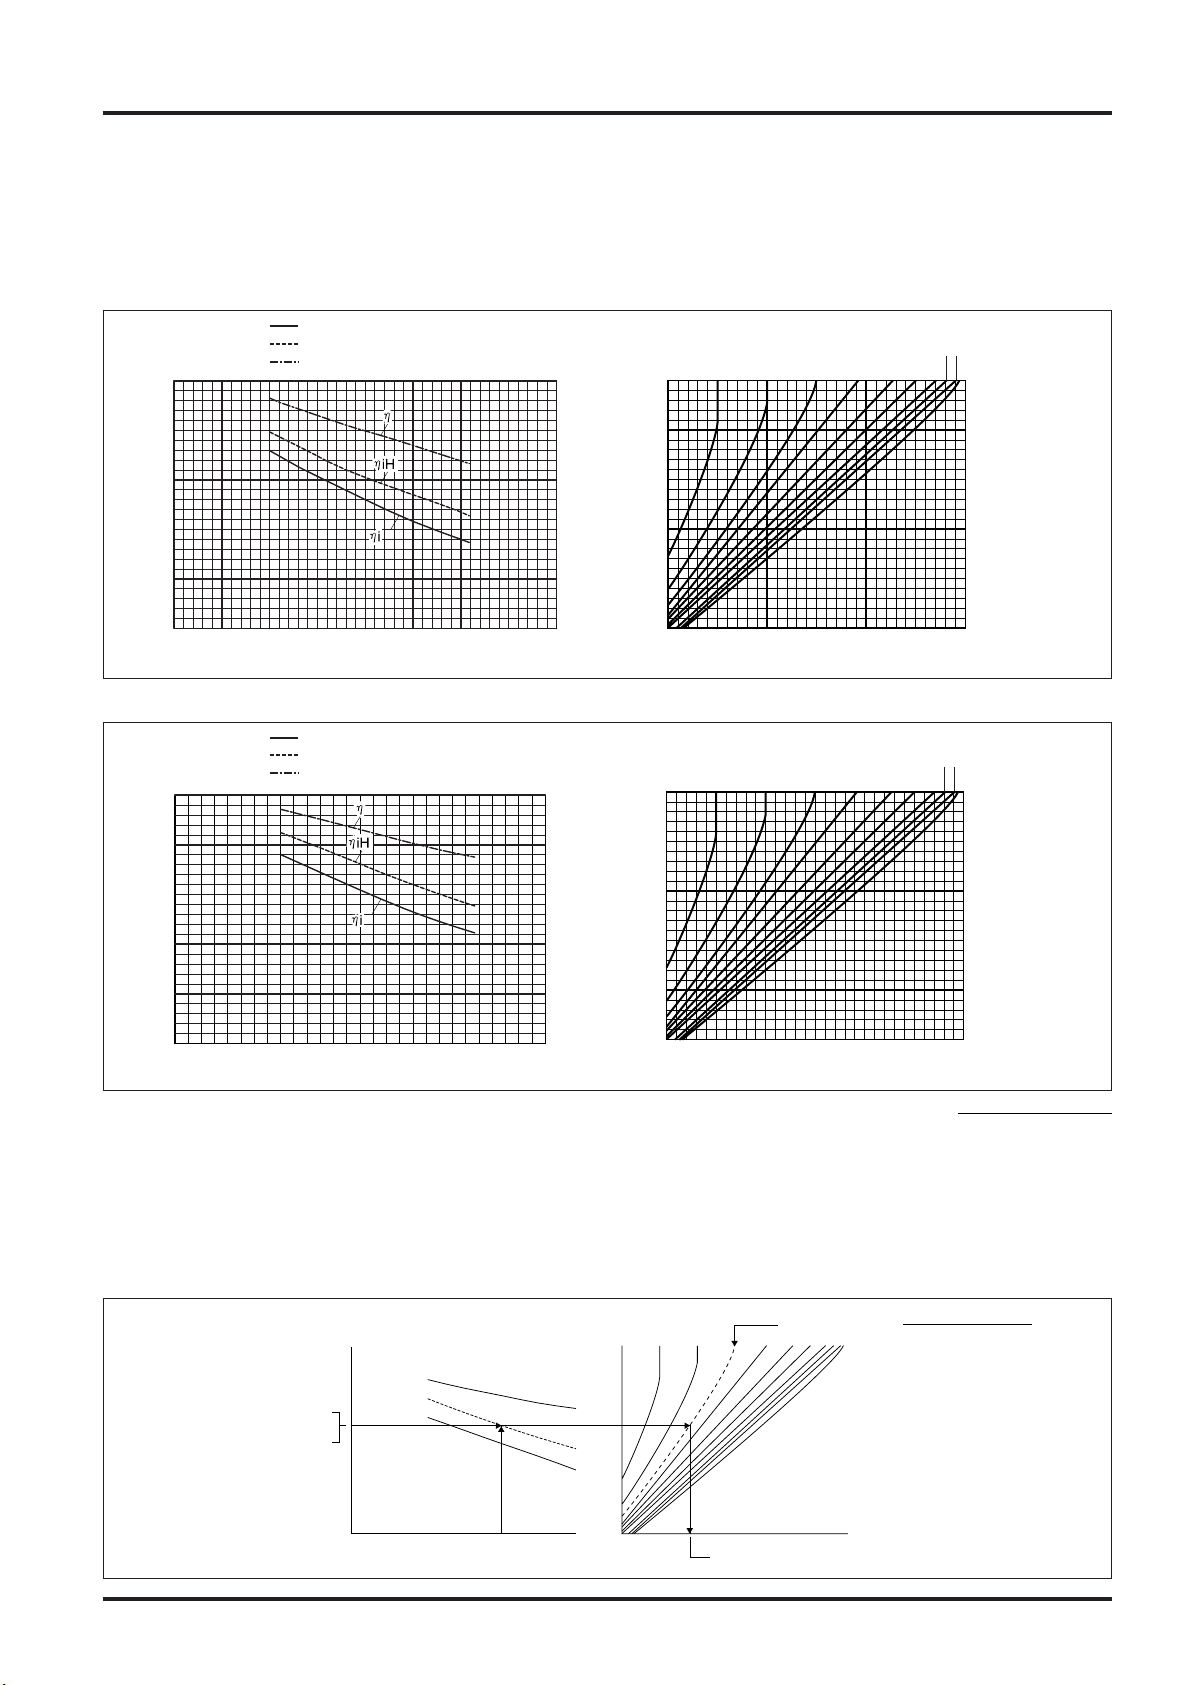
CHAPTER 1 ● Product Section
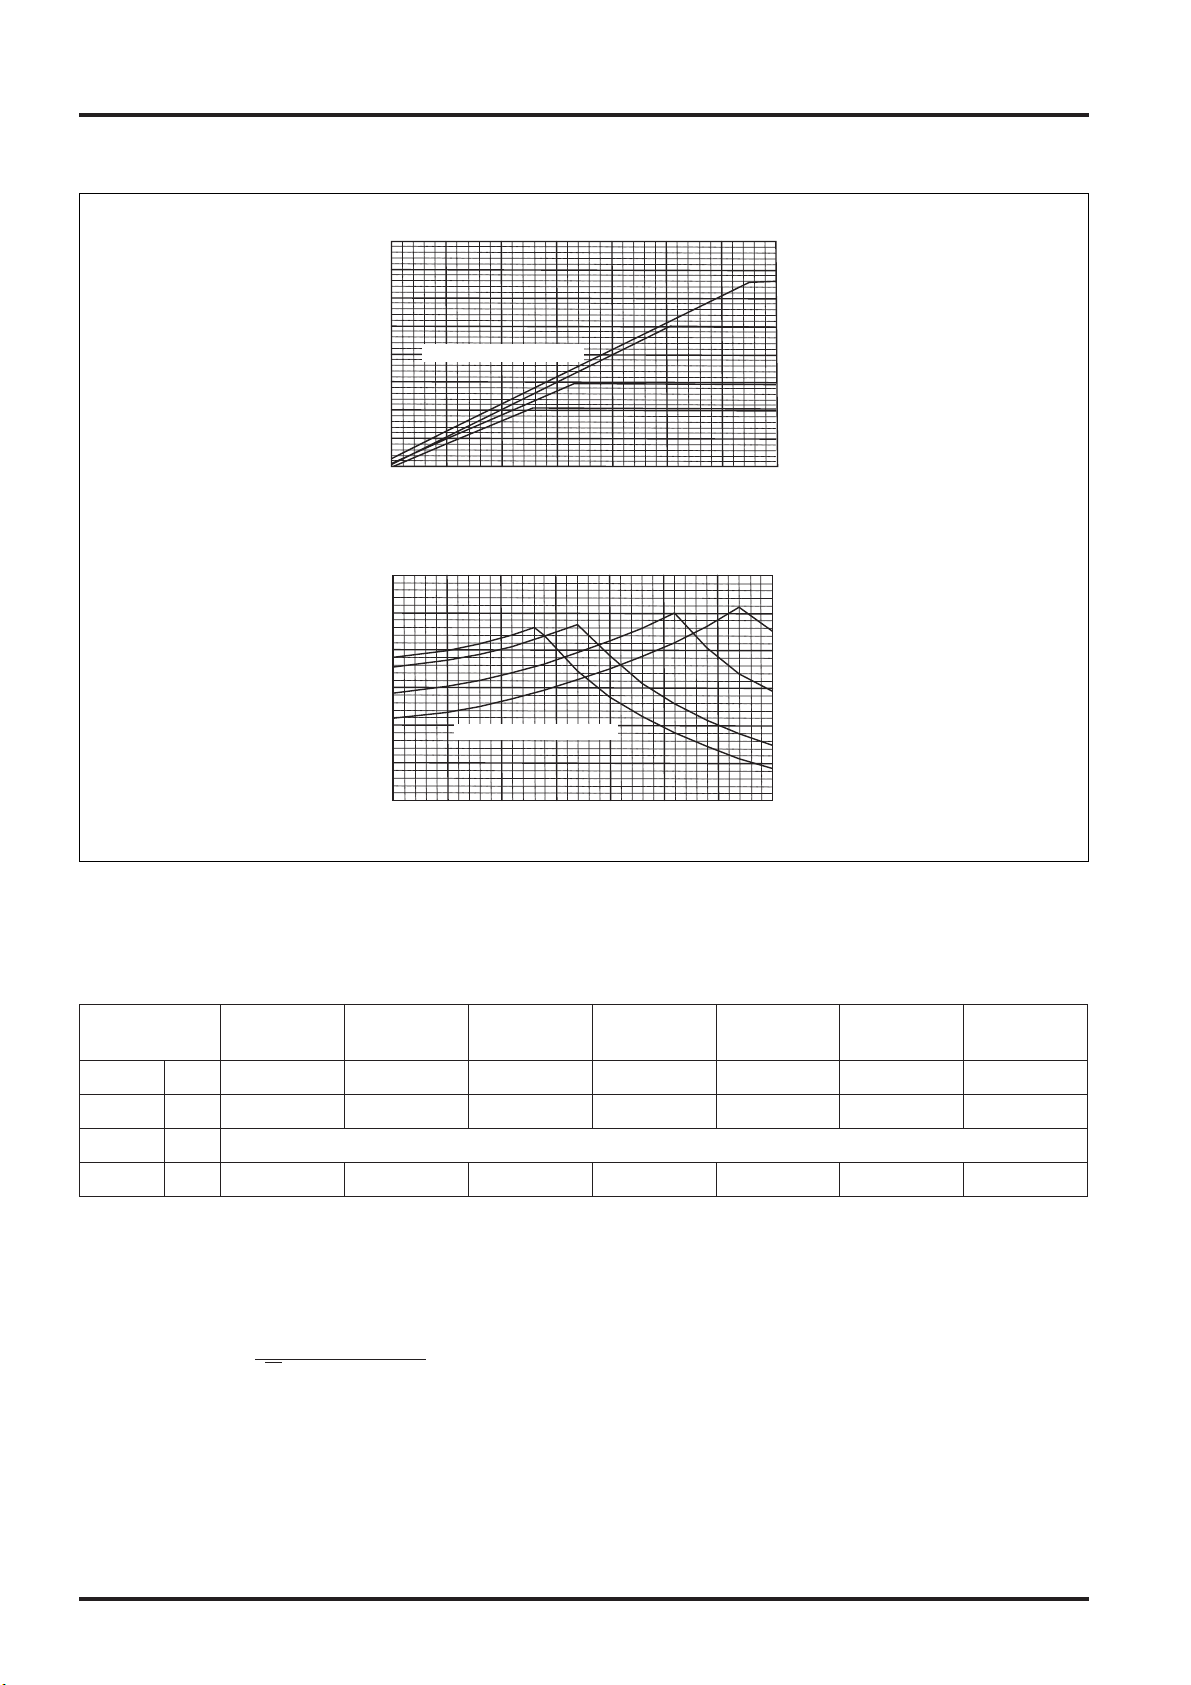
10. Total Heat Recovery Characteristics
10.1 Lossnay Core Heat Recovery Characteristic
90
50 60 70 80 90 100
80
70
60
50
40
Exchange efficiency (%)
0
800
200 400 600
90
50
40
60
70
80
tt
cc
Exchange efficiency (%)
SA Air volume (m3/h)
1400120010008006004002000
tt
90
50
40
60
70
80
cc
90
50 60 70 80 90 100
80
70
60
50
40
Exchange efficiency (%)
SA Air volume (m3/h)
*Air volume ratio =
Exhaust air flow volume
Suplly air flow volume
●
Obtaining the efficiency when supply air and exhaust air volumes differ
The efficiency obtained from the intake side air volume in each characteristic curve can be corrected with the air
volume ratio in the chart on the right.
If the intake side and exhaust side duct lengths differ greatly or if a differential air volume is required, obtain the
intake side efficiency from the chart on the right.
Efficiency when there is
no air volume difference
between exhaust side
and supply side.
Efficiency of supply air flow after correction
Air volume ratio =
Exhaust air volume
Supply air volume
GUF-50RDH3/50RD3
GUF-100RDH3/100RD3
0.5 0.6 0.7 0.8 0.9 1.0 1.1 1.4
1.2 1.3
Exchange efficiency (%)
ηt : Heat exchange efficiency after correction (%)
ηt : Heat exchange efficiency after correction (%)
0.5 0.6 0.7 0.8 0.9 1.01.1 1.4
1.2 1.3
Enthalpy exchange efficiency (Cooling) : ηic
Characteristics curve Enthalpy exchange efficiency (Heating) : ηiH
Temperature exchange efficiency : ηt
Enthalpy exchange efficiency (Cooling) : ηic
Characteristics curve Enthalpy exchange efficiency (Heating) : ηiH
Temperature exchange efficiency : ηt
Efficiency correction curve
Efficiency correction curve
← Air volume ratio*
← Air volume ratio*
Page 16
14
CHAPTER 1 ● Product Section
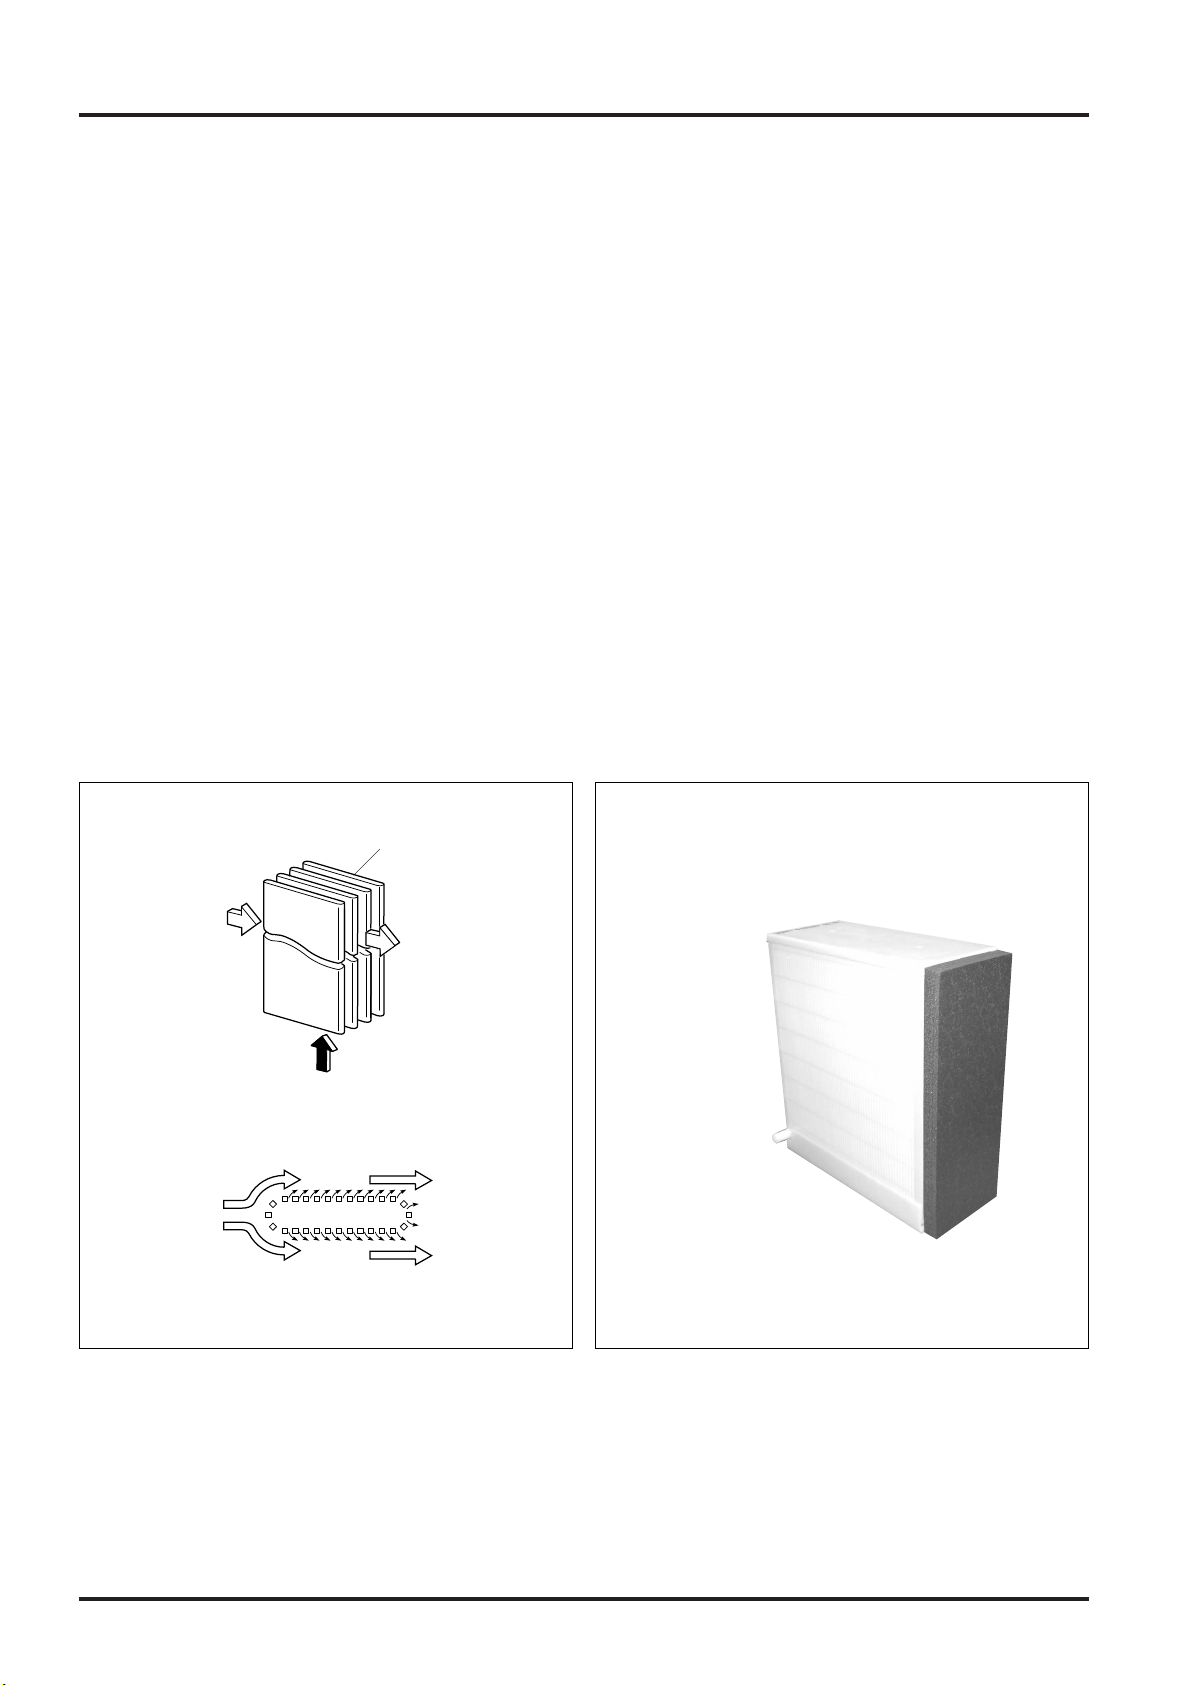
11. Principle and Features of Permeable Film Humidifier
11.1 Principles and Construction of Permeable Film Humidifier
Basic
A permeable film type humidifier uses the basic characteristics of natural evaporation. In this model, those
characteristics have been dramatically improved. The main points of the improvement are that the water is
wrapped in an ultra-water-repellant porous film (the permeable film) that forms a surface for releasing the water
vapor and that the surface are of this evaporating surface has been dramatically increased.
Principle
As shown in Fig. 1, there are tubes filled with water. Space is provided between these tubes for air to pass
through, forming a “layered strip” design that ensures rectangular- shaped flow passages. Since the permeable
film of the tube (ultra-water repellant porous film) allows water moisture to pass through in an evaporated state,
the water in the tube is released from the surface of the tube in an evaporated state and is included with the
passing air as shown in Fig. 1 (b). As can be seen by looking Fig. 2, spacers have been placed between the
tubes of permeable film to form layered openings for air to pass through. This provides an extremely large
humidifying surface area – 8.5 times larger than natural evaporation type humidifiers of the same size and offering
an increase of humidifying performance that is 6 times greater.
Fig. 1 Principles behind permeable film humidifier Fig. 2 Humidifying module
Output air from
Lossnay Core
Output air from
Lossnay Core
Permeable film
Humidified air
outlet
Water
Water
Humidified air outlet
(a) Water cross section of layered humidifying section.
(b) Cross section of layered humidifying section.
Water supply by pressure
reduction solenoid valve
Water supply port
Humidifier element
Page 17
15
CHAPTER 1 ● Product Section
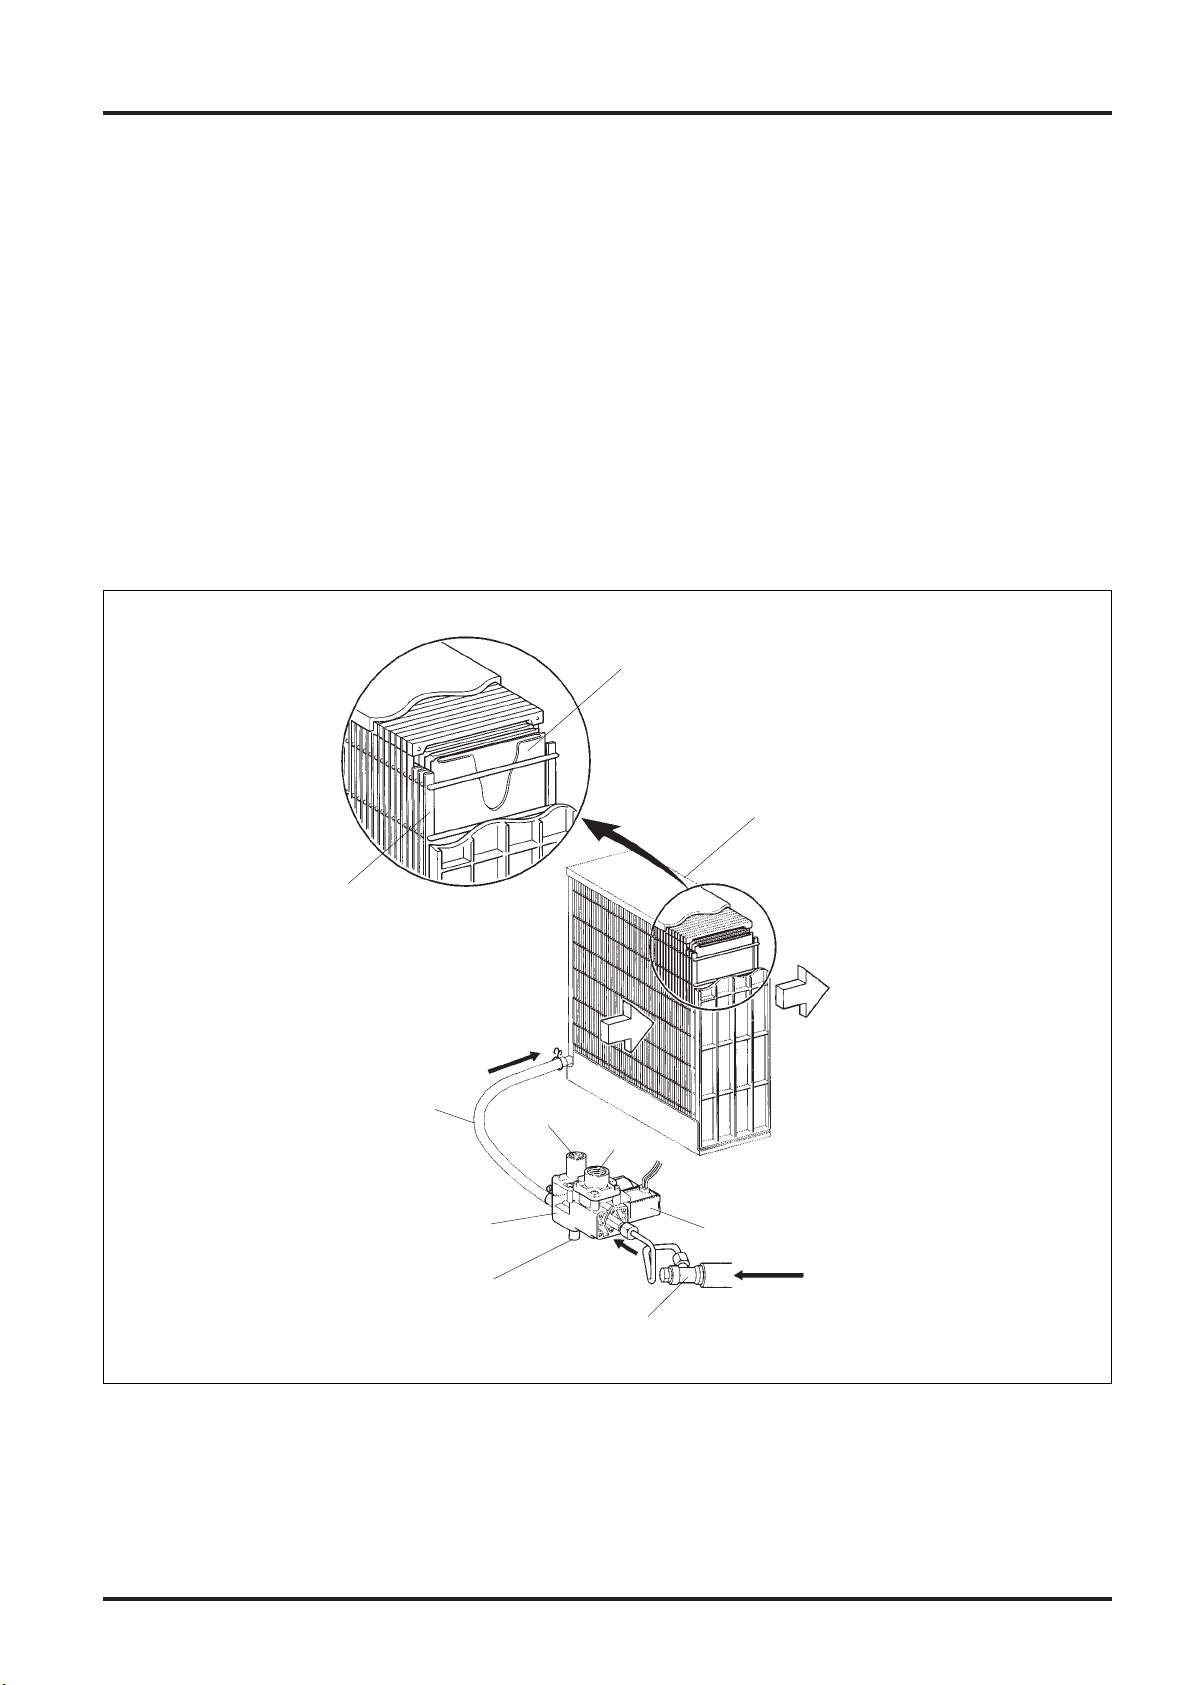
Construction
1) The water supply unit is comprised of strainer, pressure reduction solenoid valve and supply pipe. This
design ensures stable water pressure and water volume are supplied to the humidifier unit.
The strainer removes foreign material as water passes through the water supply piping. The solenoid valve
opens to allow the water to be supplied while the pressure reduction valve ensures that water pressure is
maintained at 7 kPa or less as water is supplied to the humidifier unit.
(If the water pressure exceeds 7 kPa, the safety valve opens and the water is discharged to a drain.)
2) As explained in the operating principles for the humidifying unit, the tube-shaped permeable film is arranged
in a layered construction and spacers have been provided to create opening for the air to pass through.
Water is supplied to these tubes and then evaporates from their surfaces into the air.
Note that any impurities in the water settle to the bottom of the tube and, due to the extremely large surface
area of the permeable film, have almost no affect on the creation of humidity.
Basic design of a permeable film humidifier
Spacer
Permeable film tube
Humidifier unit
Humidified air outlet
Supply air diffuser
from Lossnay Core
Water supply piping
Pressure reduction solenoid valve
Drain port
Safety
valve
Pressure
reduction valve
Solenoid valve
Strainer
Water
Page 18
16
CHAPTER 1 ● Product Section
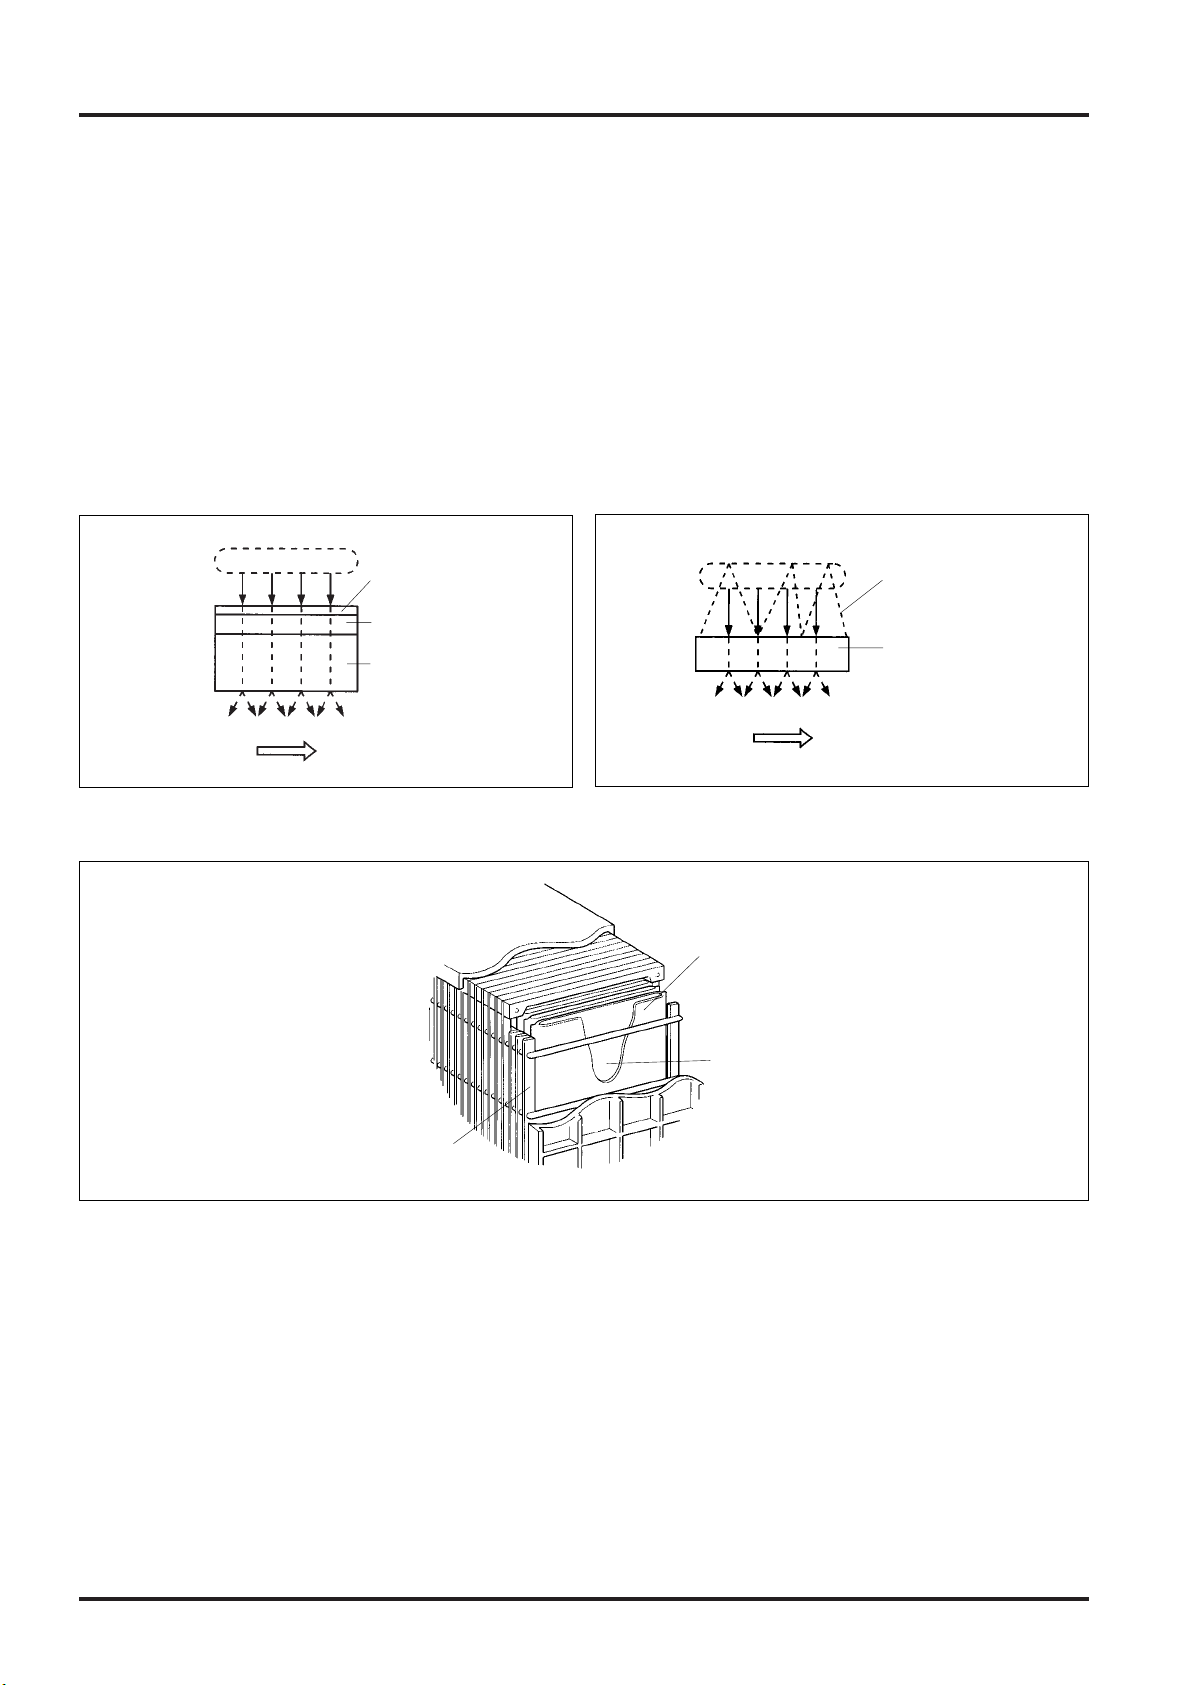
11.2 Features of Permeable Film Humidifier
Design of the new type permeable film type humidifier
The previous type of permeable film had a selective-type permeable layer that only allowed water vapor to pass
through surfaces in contact with water and base cloth with a layer of porous PTFE with extremely fine pores with
1/20,000 water droplets and 1,000 times water vapor (0.1 to 1 µm) that allowed evaporation without air or water
passing through. The new type permeable film does not have the base cloth used in the previous permeable
membrane. Instead, it has an ultra water-resistant porous permeable film that reduces the resistance to
permeation by 1/2 when compared with the previous type and a 3-dimensional fabric that ensures water passages
inside the permeable film tube, dramatically improving the ability for water vapor only to permeate.
●
New type permeable film type
●
New unit
●
3-dimensional fabric
The 3-dimensional fabric inside the new type of permeable film tube is comprised of spiral-like threads that are
attached upright in the tube. These act as a type of reinforcing material for ensuring the passage of water inside
the permeable film tubes.
This 3-dimensional fabric used in the new type permeable film type humidifier keep the permeable film tubes from
collapsing and ensure that the water supplied at a constant pressure from the water supply port at the base of the
humidifier seeps to the ends of the humidifying surface.
Water
Selective-type
permeable layer
PTFE layer
Base cloth
Water vapor
Air
Water
3-dimentional fabric
Water-resistant porous
permeable film
Water vapor
Air
Permeaable film tube
3-dimentional fabric
Spacer
●
Previous permeable film
Page 19
17
CHAPTER 1 ● Product Section
0246–6
6
5.8
5.6
5.4
5.2
5
4.8
4.6
4.4
4.2
4
–4 –2
RA 22°C40%
RA 21°C40%
RA 21°C50%
RA 20°C40%
RA 20°C50%
RA 22°C50%
0246–6
3
2.9
2.8
2.7
2.6
2.5
2.4
2.3
2.2
–4 –2
RA 22°C40%
RA 21°C40%
RA 22°C50%
RA 21°C50%
RA 20°C40%
RA 20°C50%
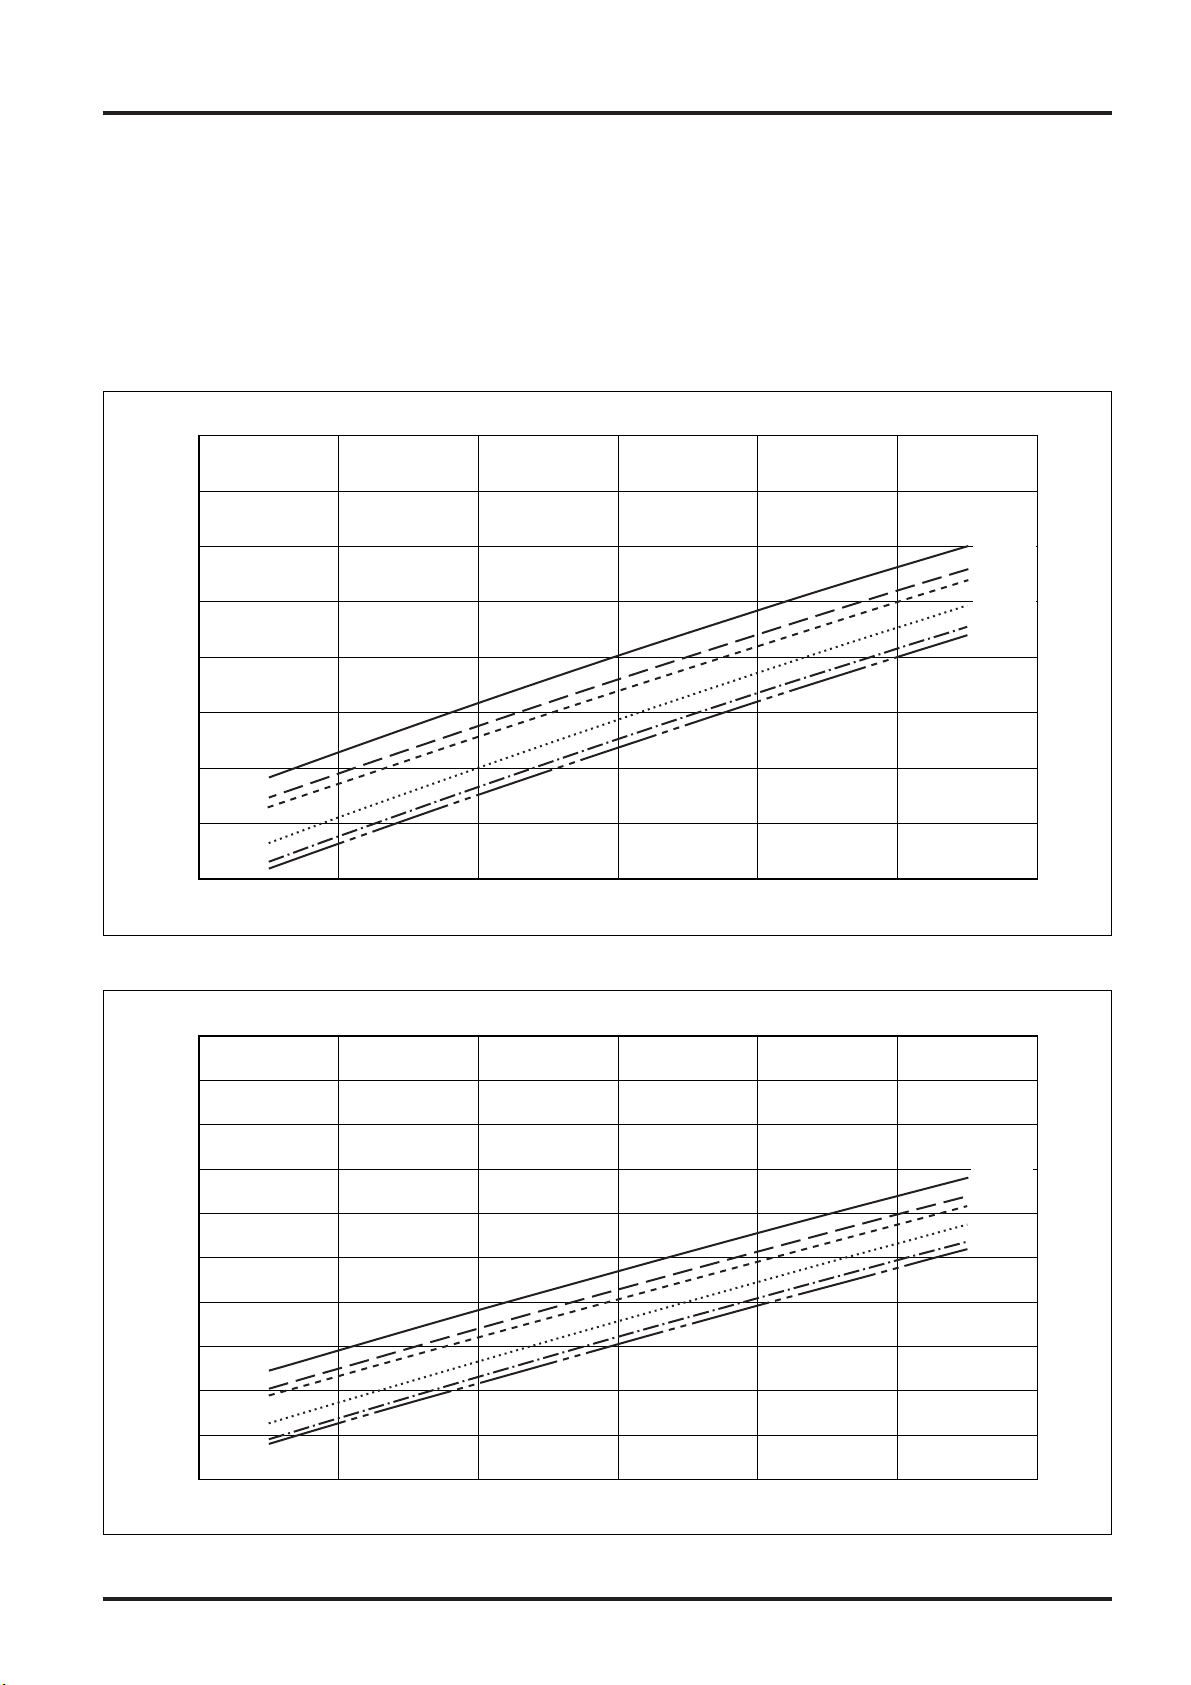
Reference
Quick reference graph for amount of humidifying
Conditions:
●
The air flow is the rated air flow (GUF-50RDH3: 500 m3/h GUF-100RDH3: 1,000 m3/h )
●
The connections to the outdoor unit are an OA processing unit and indoor unit for a total capacity of 100%.
●
The relative humidity of the outdoor air is 50%.
Amount of humidifying (kg/h)
Outdoor Air temperature (°C)
GUF-50RDH3
GUF-100RDH3
Amount of humidifying (kg/h)
Outdoor Air temperature (°C)
Page 20
18
CHAPTER 1 ● Product Section
Note: When using a combination of City Multi and Air Multi units, there is a need to calculate the total value of
performance capacity of the indoor units connected to each outdoor unit as a parameter. This information
can be found in the technical documentation for the units. Refer to the City Multi Data Book for details.
Dry bulb Wet bulb Relative
Enthalpy
temperature temperature humidity
Outdoor air 35°CDB 24°CWB 40% 71.6kJ/kg
Indoor air 27°CDB 19.5°CWB 50% 55.7kJ/kg
Heat exchange inlet air
50 28.8°CDB 21.3°CWB 51.7% 61.7kJ/kg
(Lossnay Core outlet temperature)
100 28.7°CDB 21.2°CWB 51.4% 61.2kJ/kg
Outdoor air 7°CDB 6°CWB 85% 20.5kJ/kg
Indoor air 21°CDB 14.6°CWB 50% 40.6kJ/kg
Heat exchange inlet air
50 17.8°CDB 12.0°CWB 49.9% 33.9kJ/kg
(Lossnay Core outlet temperature)
100 18.1°CDB 12.3°CWB 50.5% 34.7kJ/kg
CoolingHeating
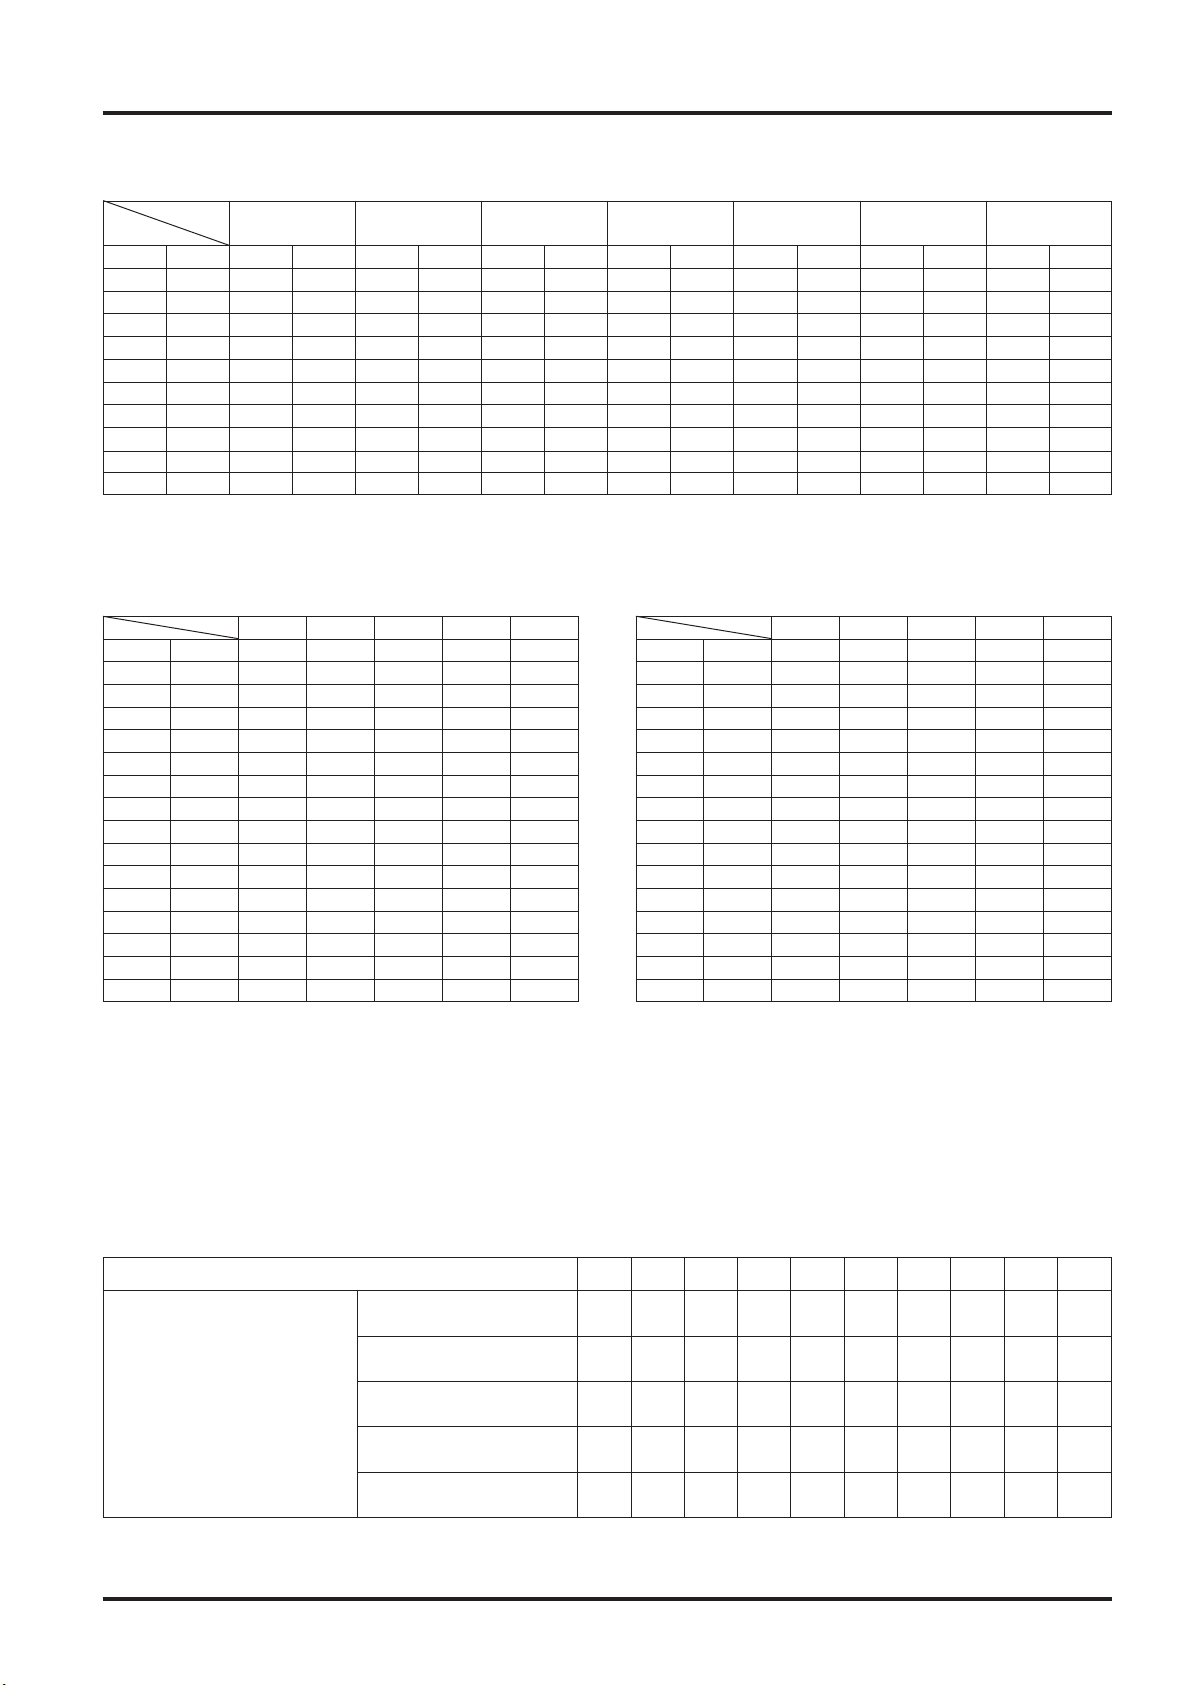
Model number Model 50 Model 100
City Multi indoor unit equivalent 32 63
Cooling capacity 3.63kW 7.32kW
Heating capacity 4.17kW 8.30kW
12. Cooling and Heating Characteristics
12.1 Direct Expansion Coil Characteristics
12.1.1 Rated operating conditions <At rated air flow>
12.1.2 Standard cooling and heating performance
12.1.3 Cooling Capacity (In combination with PUHY, PURY)
GUF-50RD3
CA:Capacity (kW)
SHC:Sensible heat capacity (kW)
21.5°CDB
15°CWB
23°CDB
16°CWB
25°CDB
18°CWB
27°CDB
19.5°CWB
28°CDB
20°CWB
30°CDB
22°CWB
32°CDB
24°CWB
DB
OA
20.0 12.0 3.3 2.0 3.4 2.1 3.4 2.1 3.5 2.1 3.6 2.2 3.7 2.3 3.8 2.3
22.5 14.0 3.3 2.0 3.4 2.1 3.5 2.1 3.6 2.2 3.6 2.2 3.7 2.3 3.8 2.3
25.0 16.0 3.3 2.0 3.4 2.1 3.5 2.1 3.5 2.1 3.6 2.2 3.8 2.3 3.8 2.3
27.5 18.0 3.3 2.0 3.4 2.1 3.5 2.1 3.5 2.1 3.6 2.3 3.7 2.2 3.8 2.2
30.0 20.0 3.4 2.1 3.4 2.1 3.5 2.1 3.5 2.1 3.6 2.2 3.7 2.2 3.8 2.2
32.5 22.0 3.4 2.0 3.4 2.0 3.4 2.1 3.5 2.1 3.7 2.2 3.7 2.2 3.8 2.2
35.0 24.0 3.3 1.9 3.4 2.0 3.4 2.1 3.6 2.2 3.6 2.2 3.7 2.1 3.8 2.2
37.5 26.0 3.3 1.9 3.4 2.0 3.4 2.1 3.6 2.1 3.6 2.1 3.7 2.1 3.7 2.1
40.0 28.0 3.3 1.9 3.3 1.9 3.5 2.0 3.6 2.1 3.5 2.0 3.7 2.1 3.7 2.1
43.0 30.0 3.3 1.9 3.3 1.9 3.5 2.0 3.6 2.0 3.5 1.9 3.6 2.0 3.6 2.0
WBRACA SHC CA SHC CA SHC CA SHC CA SHC CA SHC CA SHC
Page 21
19
CHAPTER 1 ● Product Section
GUF-100RD3
CA:Capacity (kW)
SHC:Sensible heat capacity (kW)
21.5°CDB
15°CWB
23°CDB
16°CWB
25°CDB
18°CWB
27°CDB
19.5°CWB
28°CDB
20°CWB
30°CDB
22°CWB
32°CDB
24°CWB
DB
20.0 12.0 6.9 4.3 7.0 4.5 7.0 4.5 7.3 4.6 7.4 4.6 7.6 4.9 7.9 4.9
22.5 14.0 6.9 4.3 7.0 4.4 7.2 4.4 7.4 4.5 7.4 4.5 7.6 4.9 7.8 4.8
25.0 16.0 6.9 4.3 7.1 4.4 7.2 4.4 7.3 4.5 7.3 4.5 7.7 4.7 7.8 4.8
27.5 18.0 6.9 4.3 7.1 4.4 7.2 4.4 7.2 4.4 7.3 4.6 7.6 4.7 7.9 4.7
30.0 20.0 6.9 4.2 7.0 4.2 7.1 4.3 7.2 4.5 7.3 4.5 7.6 4.7 7.9 4.7
32.5 22.0 6.9 4.2 7.0 4.2 7.1 4.3 7.2 4.4 7.4 4.5 7.6 4.6 7.8 4.6
35.0 24.0 6.9 4.2 7.0 4.2 7.0 4.2 7.3 4.4 7.4 4.5 7.7 4.5 7.7 4.4
37.5 26.0 6.8 4.0 6.9 4.2 7.1 4.3 7.4 4.5 7.4 4.5 7.6 4.4 7.6 4.4
40.0 28.0 6.8 4.0 6.9 4.1 7.2 4.3 7.3 4.4 7.3 4.4 7.6 4.4 7.6 4.4
43.0 30.0 6.8 4.0 6.9 4.1 7.2 4.2 7.2 4.2 7.3 4.2 7.5 4.3 7.5 4.3
WB CA SHC CA SHC CA SHC CA SHC CA SHC CA SHC CA SHC
12.1.4 Heating Capacity (In combination with PUHY, PURY)
GUF-50RD3
OA
RA
15
SHC20SHC21SHC25SHC27SHC
-14.6 -15.0
DB WB
2.8 2.8 2.8 2.8 2.8
-11.5 -12.0 3.0 3.0 3.0 3.0 3.0
-9.5 -10.0 3.2 3.2 3.2 3.1 3.1
-6.9 -7.5 3.4 3.4 3.4 3.3 3.3
-4.3 -5.0 3.6 3.6 3.6 3.5 3.5
-1.8 -2.5 3.8 3.8 3.8 3.7 3.7
1.0 0 4.0 4.0 4.0 3.9 3.9
3.5 2.5 4.2 4.2 4.2 4.1 4.0
6.0 5.0 4.2 4.2 4.2 4.2 4.0
7.0 6.0 4.2 4.2 4.2 4.0 4.0
8.8 7.5 4.4 4.4 4.4 4.0 4.0
11.5 10.0 4.7 4.2 4.2 4.0 4.0
14.0 12.5 5.0 4.2 4.2 4.0 3.3
16.5 15.0 5.0 4.2 4.2 3.3 3.3
17.0 15.5 5.0 4.2 4.2 3.3 3.3
GUF-100RD3
15
SHC20SHC21SHC25SHC27SHC
-14.6 -15.0 5.6 5.6
-11.5 -12.0 6.0 6.0
-9.5 -10.0 6.3 6.3
-6.9 -7.5 6.7 6.7
-4.3 -5.0 7.1 7.1
-1.8 -2.5 7.5 7.5
1.0 0 7.9 7.9
3.5 2.5 8.3 8.3
6.0 5.0 8.3 8.3
7.0 6.0 8.3 8.3
8.8 7.5 8.7 8.7
11.5 10.0 9.3 8.3
14.0 12.5 9.9 8.3
16.5 15.0 10.0 8.3
17.0 15.5 10.0 8.3
5.6
6.0
6.3
6.7
7.1
7.5
7.9
8.3
8.3
8.3
8.7
8.3
8.3
8.3
8.3
5.6
6.0
6.3
6.7
7.1
7.5
7.8
8.2
8.3
8.0
8.0
8.0
8.0
6.5
6.5
5.6
5.9
6.3
6.7
7.1
7.5
7.8
8.0
8.0
8.0
8.0
8.0
6.5
6.5
6.5
*The above data shows an assumed value obtained by calculation.
*The above data shows an assumed value obtained by calculation.
OA
RA
OA
RA
DB WB
Outdoor inlet air temp (°C)
Correction factor
PUHY-P200/P250YGM-A
PURY-P200/P250YGM-A
PUHY-P300YGM-A
PURY-P300YGM-A
PUHY-P350YGM-A
PURY-P350YGM-A
PUHY-P400YGM-A
PURY-P400YGM-A
PUHY-P450/P500YGM-A
PURY-P450/P500YGM-A
64210-2-4-6-8-10
1.0 0.95 0.84 0.83 0.83 0.87 0.90 0.95 0.95 0.95
1.0 0.93 0.82 0.80 0.82 0.86 0.90 0.90 0.95 0.95
1.0 0.93 0.85 0.83 0.84 0.86 0.90 0.90 0.95 0.95
1.0 0.95 0.90 0.87 0.88 0.89 0.90 0.95 0.95 0.95
1.0 0.98 0.89 0.86 0.89 0.90 0.92 0.95 0.95 0.95
12.2 Correction at frosting and defrosting
When a decrease in heating capacity due to frosted and defrosting operations is considered, the value multiplied
by the correction factor in the table below represents the heating capacity. Refer to the City Multi Data Book for
details.
12.2.1
R410A refrigerant unit
Correction factor table
Page 22
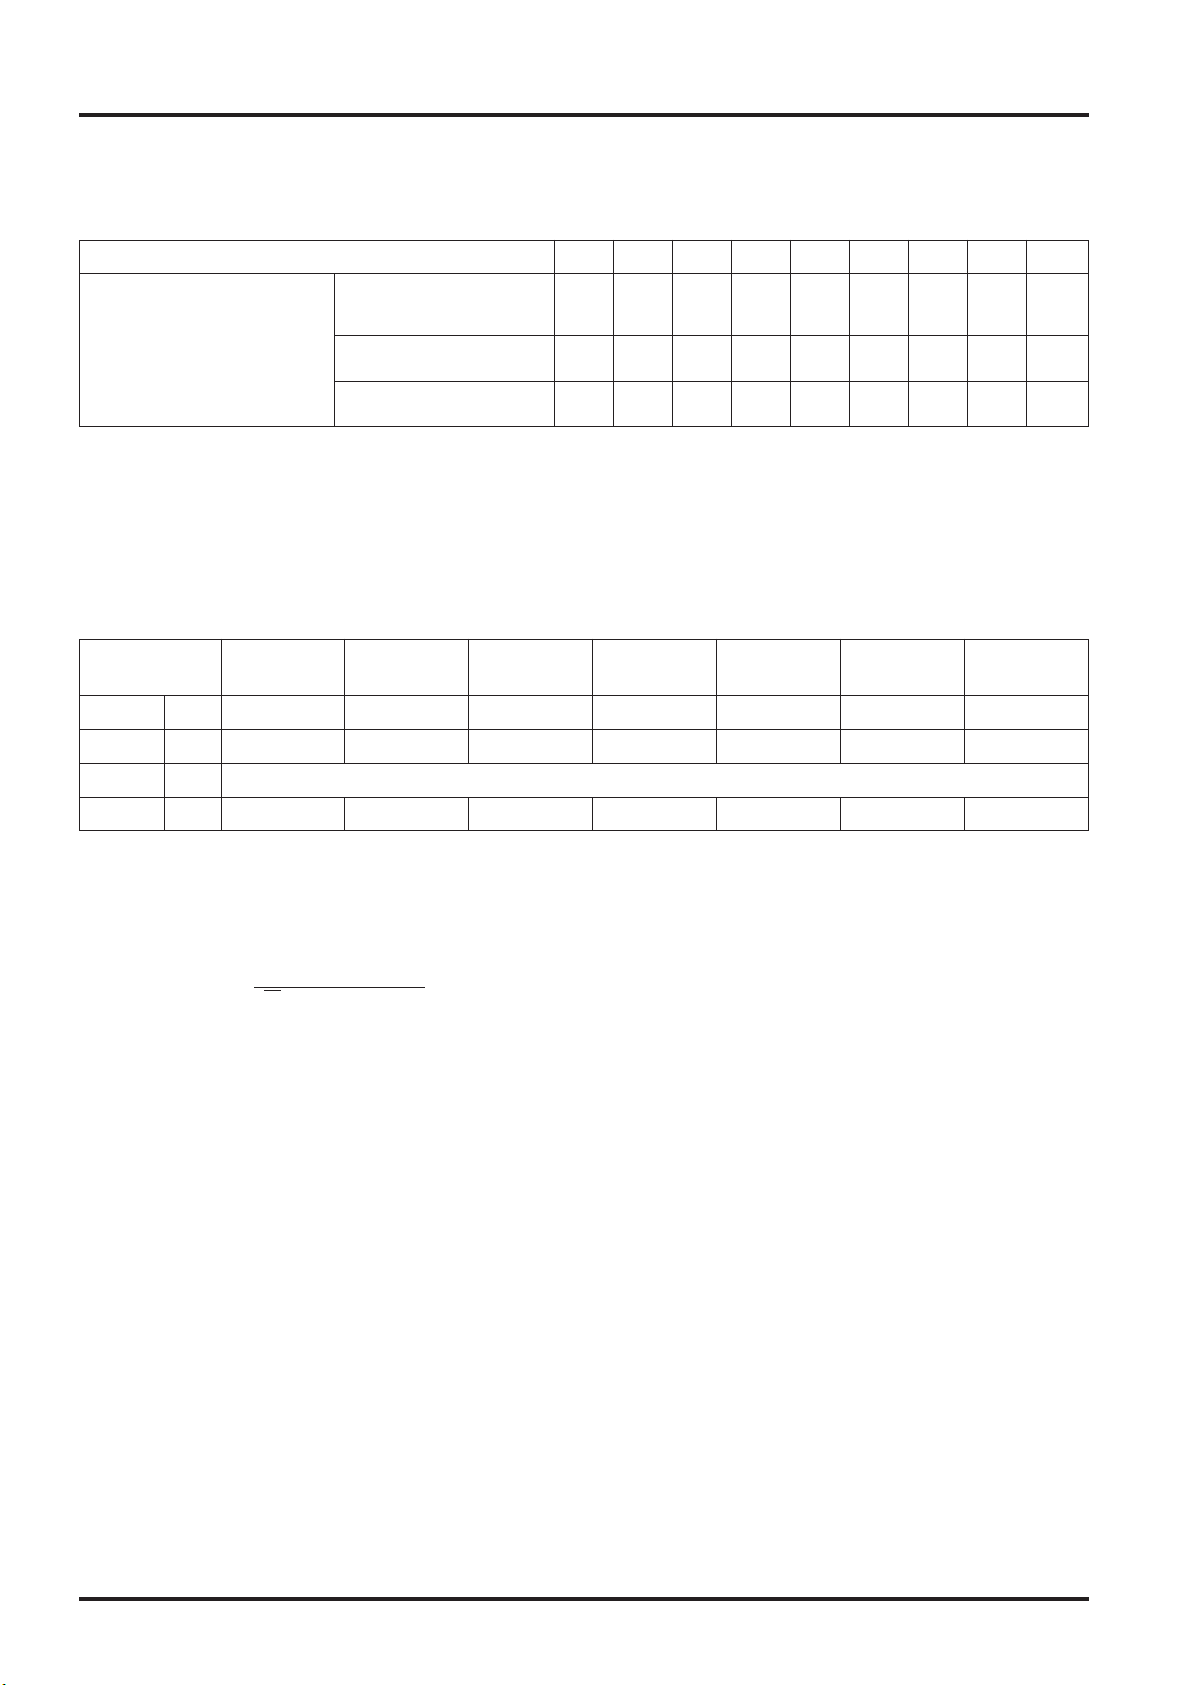
12.3 Correction by temperature
12.3.1
R410A refrigerant unit
(1) Cooling
Standard specifications
●
Calculation
Capacity’ = Capacity × Ratio
Input’ = Input × Ratio
Current’ =
Input’ × 1,000
3 × Source × 0.91
* Capacity’
Input’ After correction
Current’
√
}
PUHY-
P200YGM-A
PUHY-
P250YGM-A
PUHY-
P300YGM-A
PUHY-
P350YGM-A
PUHY-
P400YGM-A
PUHY-
P450YGM-A
PUHY-
P500YGM-A
Capacity
6.14
380/400/415
10.3/9.8/9.4
22.4
7.72
13.0/12.3/11.9
28.0
9.57
16.1/15.3/14.7
33.5
11.39
19.2/18.2/17.6
40.0
13.42
22.6/21.5/20.7
45.0
13.61
22.9/21.8/21.0
50.0
15.59
26.3/25.0/24.0
56.0
kW
kW
V
A
Input
Source
Current
20
CHAPTER 1 ● Product Section
12.2.2 R22
refrigerant unit
Corection factor table
Outdoor inlet air temp (°C)
Correction factor
PUHY-200/250YEM-A
PUHY-200/250YEMC-A
PURY-200/250YEMC-A
PUHY-315YEM-A
PUHY-315YEMC-A
PUHY-400/500YEM-A
PUHY-400/500YEMC-A
6420-2-4 -6 -8 -10
1.0 0.95 0.84 0.83 0.87 0.90 0.95 0.95 0.95
1.0 0.93 0.82 0.82 0.86 0.90 0.90 0.95 0.95
1.0 0.98 0.89 0.89 0.86 0.90 0.92 0.95 0.95
Page 23
21
CHAPTER 1 ● Product Section
The ratio of cooling power input
PUHY-P200/P250YGM-A
The ratio of cooling capacity
The ratio of cooling power input
PUHY-P300/P350/P400YGM-A
The ratio of cooling capacity
0.8
0.7
0.9
1.0
1.1
1.2
1.3
-5 0 5 10 15 20 25 30 35 40 45
Ratio
Indoor Temperature (˚CWB)
Outdoor Temperature (˚CDB)
24˚CWB
16˚CWB
18˚CWB
20˚CWB
22˚CWB
15˚CWB
0.8
0.7
0.9
1.0
1.1
1.2
1.3
-5 0 5 10 15 20 25 30 35 40 45
Ratio
Indoor Temperature (˚CWB)
Outdoor Temperature (˚CDB)
24˚CWB
16˚CWB
18˚CWB
20˚CWB
22˚CWB
15˚CWB
Ratio
Outdoor Temperature (˚CDB)
Indoor Temperature (˚CWB)
0.8
0.7
0.9
1.0
1.1
1.2
1.4
1.3
-5 0 5 10 15 20 25 30 35 40 45
24˚CWB
16˚CWB
18˚CWB
20˚CWB
22˚CWB
15˚CWB
0.8
0.7
0.6
0.9
1.0
1.1
1.2
Ratio
Indoor Temperature (˚CWB)
Outdoor Temperature (˚CDB)
24˚CWB
16˚CWB
18˚CWB
20˚CWB
22˚CWB
15˚CWB
-5 0 5 10 15 20 25 30 35 40 45
Page 24
22
CHAPTER 1 ● Product Section
(2) Heating
Standard specifications
●
Calculation
Capacity’ = Capacity × Ratio
Input’ = Input × Ratio
Current’ =
Input’ × 1,000
3 × Source × 0.91
* Capacity’
Input’ After correction
Current’
√
}
PUHY-
P200YGM-A
PUHY-
P250YGM-A
PUHY-
P300YGM-A
PUHY-
P350YGM-A
PUHY-
P400YGM-A
PUHY-
P450YGM-A
PUHY-
P500YGM-A
Capacity
5.98
380/400/415
10.0/9.5/9.2
25.0
7.62
12.8/12.2/11.7
31.5
9.10
15.3/14.5/14.0
37.5
11.02
18.6/17.6/17.0
45.0
12.43
20.9/19.9/19.2
50.0
13.86
23.3/22.2/21.4
56.0
15.89
26.8/25.4/24.5
63.0
kW
kW
V
A
Input
Source
Current
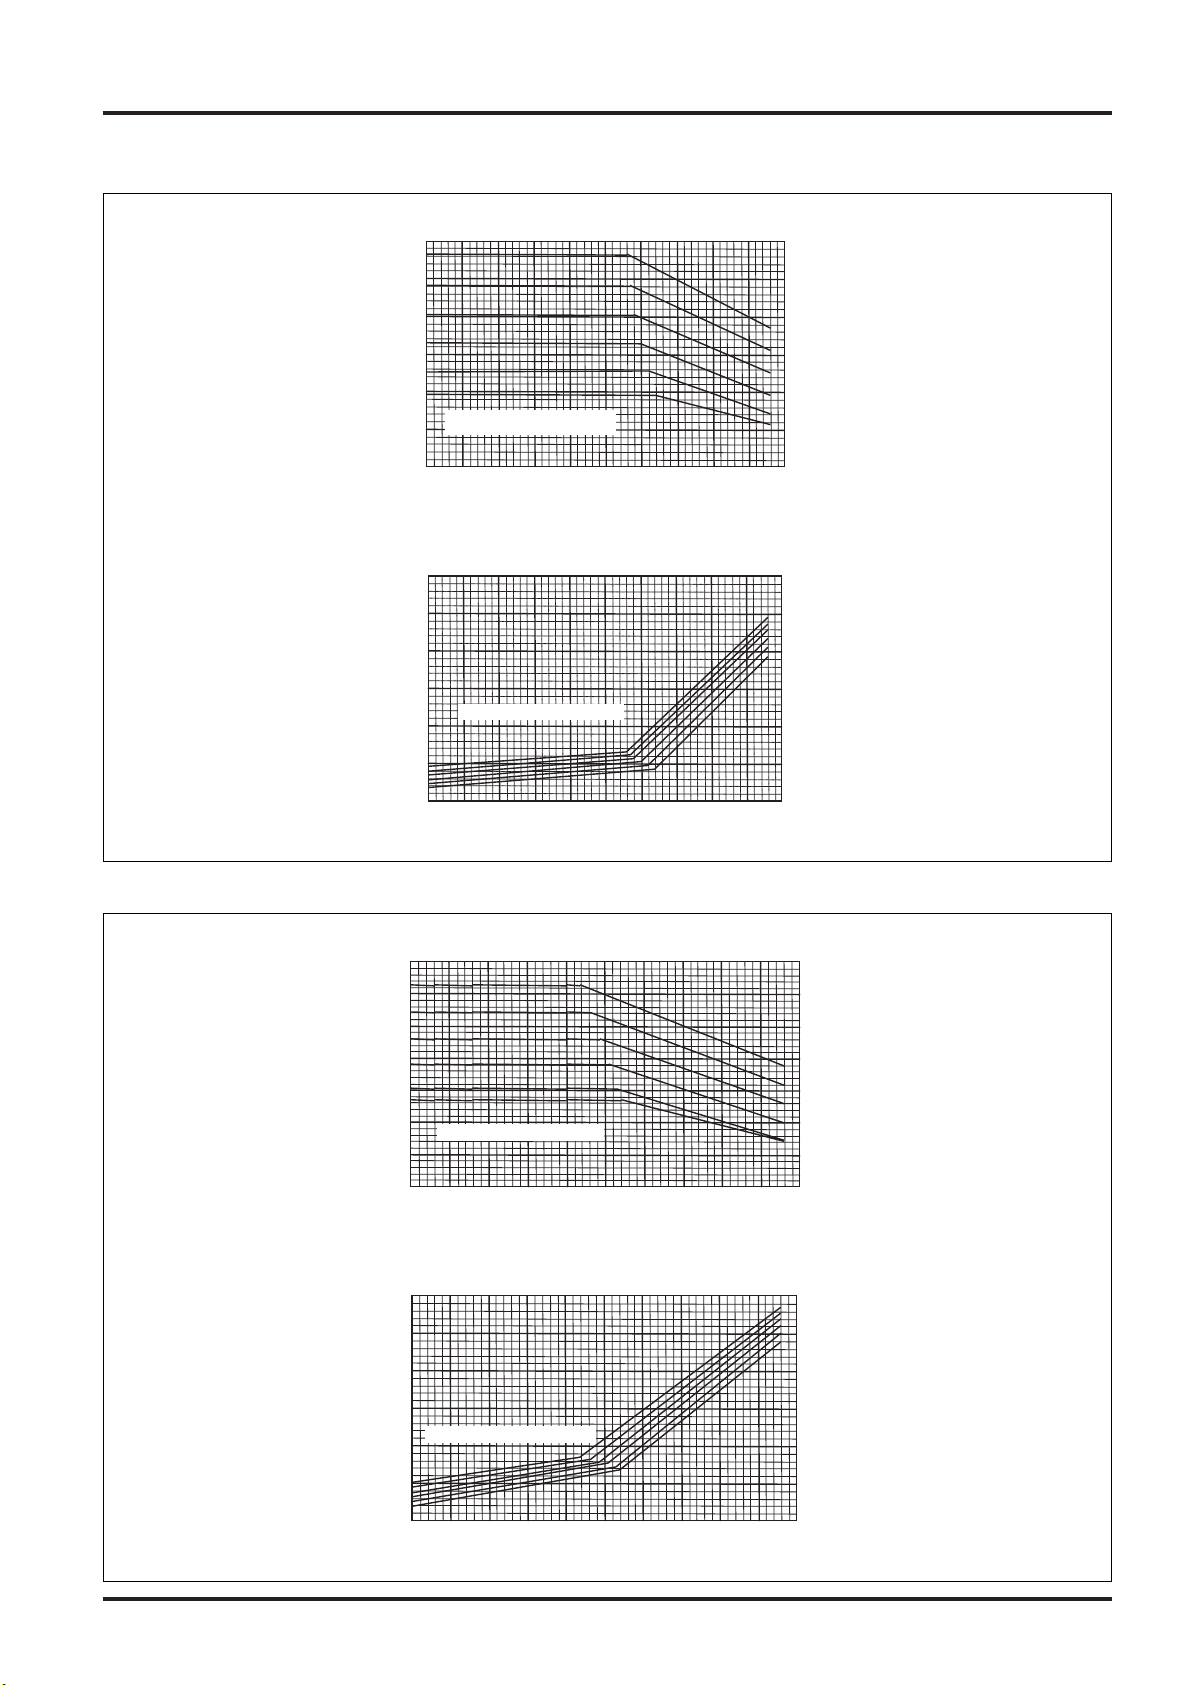
The ratio of cooling power input
PUHY-P450/P500YGM-A
The ratio of cooling capacity
0.8
0.7
0.9
1.0
1.1
1.2
1.3
1.4
Ratio
Indoor Temperature (˚CWB)
Outdoor Temperature (˚CDB)
24˚CWB
16˚CWB
18˚CWB
20˚CWB
22˚CWB
15˚CWB
-5 0 5 10 15 20 25 30 35 40 45
0.8
0.7
0.5
0.6
0.9
1.0
1.1
1.2
Ratio
Indoor Temperature (˚CWB)
Outdoor Temperature (˚CDB)
24˚CWB
16˚CWB
18˚CWB
20˚CWB
22˚CWB
15˚CWB
-5 501015202530354045
Page 25
23
CHAPTER 1 ● Product Section
The ratio of heating power input
PUHY-P200/P250YGM-A
The ratio of heating capacity
The ratio of heating power input
PUHY-P300/P350/P400YGM-A
The ratio of heating capacity
0.6
0.7
0.5
0.8
0.9
1.0
1.1
1.2
1.3
-20 -15 -10 -5 0 5 10 15
Ratio
Outdoor Temperature (˚CWB)
15˚CDB
20˚CDB
25˚CDB
27˚CDB
Indoor Temperature (˚CDB)
0.6
0.7
0.5
0.8
0.9
1.0
1.1
-20 -15 -10 -5 0 5 10 15
Ratio
Outdoor Temperature (˚CWB)
15˚CDB
20˚CDB
25˚CDB
27˚CDB
Indoor Temperature (˚CDB)
0.8
0.9
0.7
1.0
1.1
1.2
1.3
0.6
0.5
-20 -15 -10 -5 0 5 10 15
Ratio
Outdoor Temperature (˚CWB)
15˚CDB
20˚CDB
25˚CDB
27˚CDB
Indoor Temperature (˚CDB)
0.8
0.9
0.7
1.0
1.1
0.6
0.5
0.4
-20 -15 -10 -5 0 5 10 15
Ratio
Outdoor Temperature (˚CWB)
15˚CDB
20˚CDB
25˚CDB
27˚CDB
Indoor Temperature (˚CDB)
Page 26
24
CHAPTER 1 ● Product Section
●
Calculation
Capacity’ = Capacity × Ratio
Input’ = Input × Ratio
Current’ =
Input’ × 1,000
3 × Source × 0.91
* Capacity’
Input’ After correction
Current’
√
}
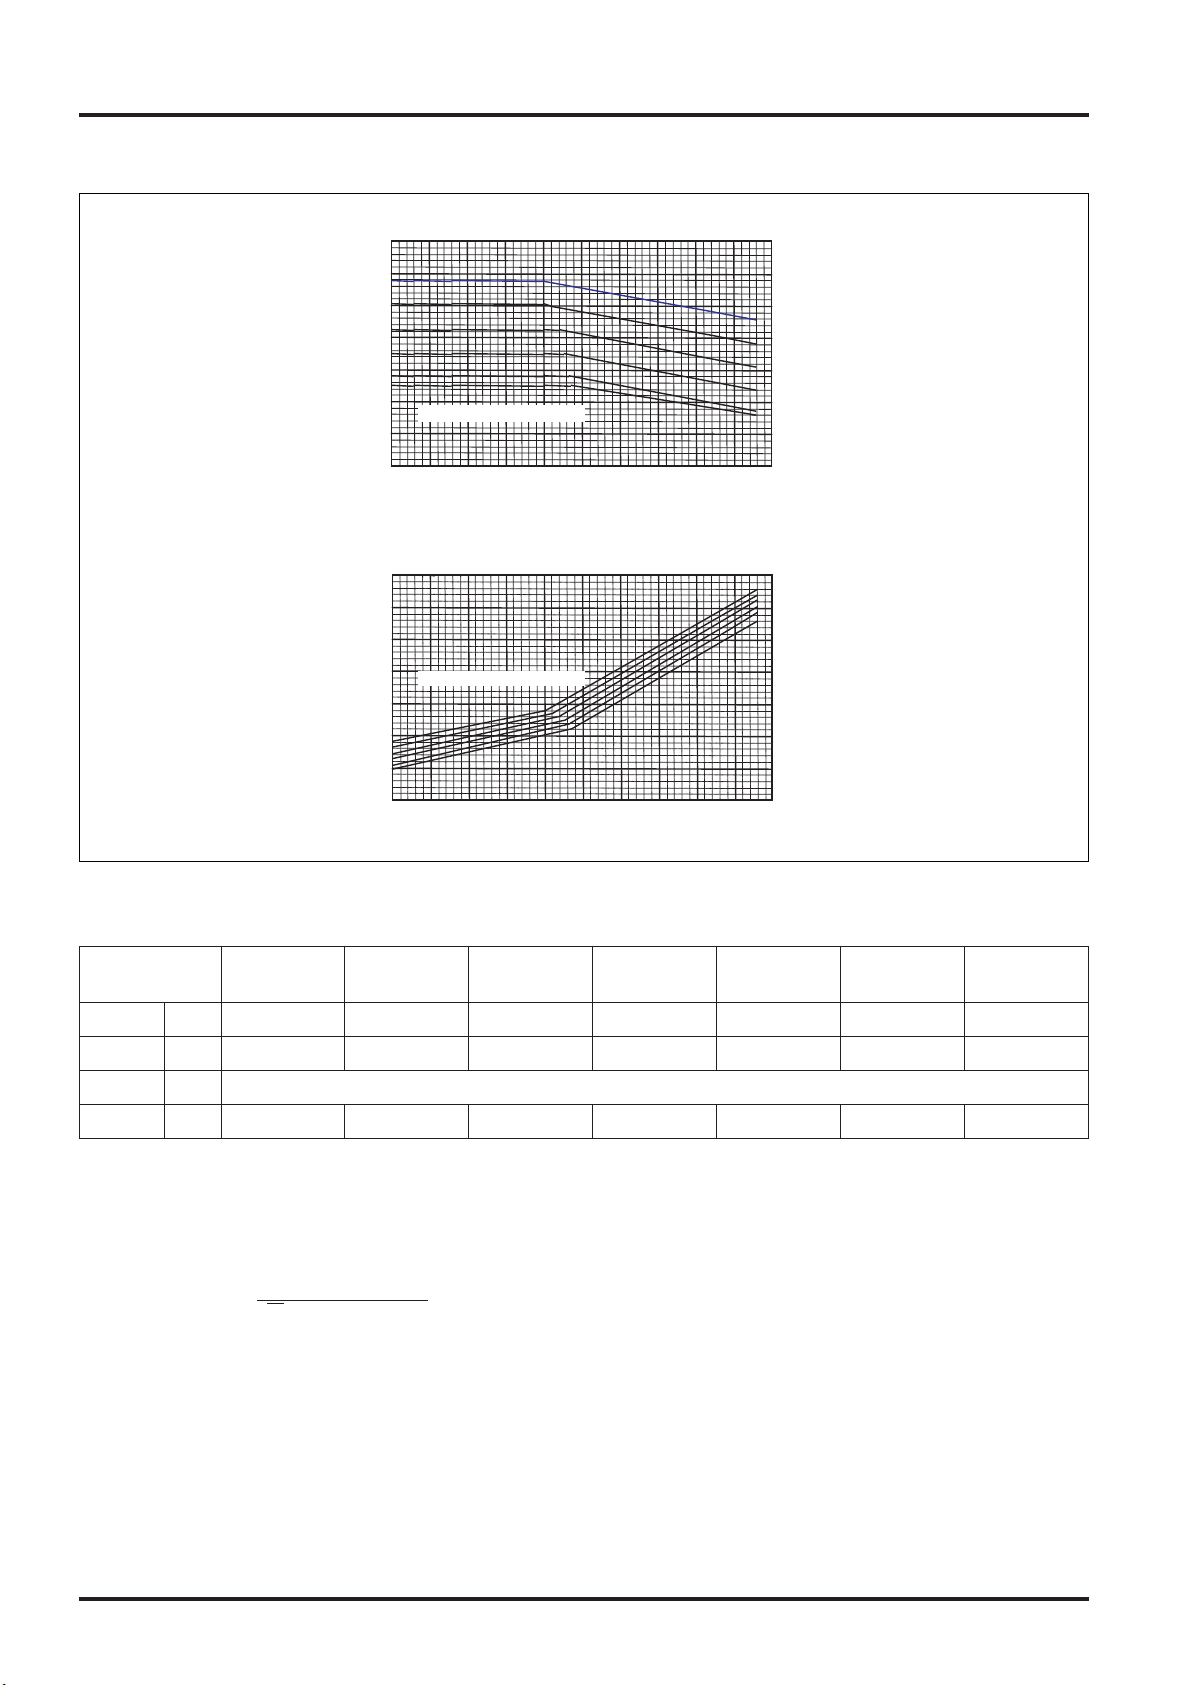
12.3.2 R22 refrigerant unit
(1) Cooling
Standard specifications
PUHY-
200YEMC-A
PUHY-
250YEMC-A
PUHY-
315YEMC-A
PUHY-
400YEMC-A
PUHY-
500YEMC-A
PURY-
200YEMC-A
PURY-
250YEMC-A
Capacity
7.13
380/400/415
12.0/11.4/11.0
24.6
8.37
14.1/13.4/12.9
28.0
12.05
19.9/18.9/18.2
35.5
15.87
26.7/25.4/24.5
45.0
18.98
32.0/30.4/29.3
56.0
9.65
16.2/15.4/14.9
24.6
10.56
17.8/16.9/16.3
28.0
kW
kW
V
A
Input
Source
Current
The ratio of heating power input
PUHY-P450/P500YGM-A
The ratio of heating capacity
0.8
0.9
0.7
1.0
1.1
1.2
1.3
0.6
0.5
-20 -15 -10 -5 0 5 10 15
Ratio
Outdoor Temperature (˚CWB)
15˚CDB
20˚CDB
25˚CDB
27˚CDB
Indoor Temperature (˚CDB)
0.8
0.9
0.7
1.0
1.1
0.6
0.5
-20 -15 -10 -5 0 5 10 15
Ratio
Outdoor Temperature (˚CWB)
15˚CDB
20˚CDB
25˚CDB
27˚CDB
Indoor Temperature (˚CDB)
Page 27
25
CHAPTER 1 ● Product Section
The ratio of cooling power input
PUHY-200/250/315YEMC-A
The ratio of cooling capacity
The ratio of cooling power input
PUHY-400/500YEMC-A
The ratio of cooling capacity
Ratio
Outdoor Temperature (˚CDB)
0.80
0.90
1.00
1.10
1.20
1.30
-5 5 15 25 35 45 50010203040
Indoor Temperature (˚CWB)
16˚CWB
18˚CWB
19˚CWB
20˚CWB
22˚CWB
24˚CWB
15˚CWB
Outdoor Temperature (˚CDB)
Ratio
0.50
0.70
0.90
1.10
1.30
0.40
0.60
0.80
1.00
1.20
-5 0 5 10 15 20 25 30 35 45 5040
Indoor Temperature (˚CWB)
19˚CWB
20˚CWB
22˚CWB
24˚CWB
15˚CWB
16˚CWB
18˚CWB
Ratio
Outdoor Temperature (˚CDB)
0.80
0.90
1.00
1.10
1.20
1.30
-5 5 15 25 35
45 50010203040
Indoor Temperature (˚CWB)
16˚CWB
18˚CWB
20˚CWB
22˚CWB
24˚CWB
15˚CWB
0.50
0.70
0.90
1.10
1.30
0.40
0.60
0.80
1.00
1.20
-5 0 5 10 15 20 25 30 35 40 45 50
Outdoor Temperature (˚CDB)
Ratio
Indoor Temperature (˚CWB)
24˚CWB
22˚CWB
20˚CWB
18˚CWB
16˚CWB
15˚CWB
Page 28
26
CHAPTER 1 ● Product Section
●
Calculation
Capacity’ = Capacity × Ratio
Input’ = Input × Ratio
Current’ =
Input’ × 1,000
3 × Source × 0.91
* Capacity’
Input’ After correction
Current’
√
}
(2) Heating
Standard specifications
PUHY-
200YEMC-A
PUHY-
250YEMC-A
PUHY-
315YEMC-A
PUHY-
400YEMC-A
PUHY-
500YEMC-A
PURY-
200YEMC-A
PURY-
250YEMC-A
Capacity
6.66
380/400/415
11.2/10.6/10.2
25.0
8.77
14.8/14.0/13.5
31.5
10.91
18.2/17.3/16.6
39.1
14.31
24.1/22.9/22.1
50.0
17.92
30.2/28.7/27.7
63.0
7.66
12.9/12.2/11.8
25.0
9.74
16.4/15.6/15.0
31.5
kW
kW
V
A
Input
Source
Current
The ratio of cooling power input
PURY-200/250YEMC-A
The ratio of cooling capacity
0.80
0.90
1.00
1.10
1.20
1.30
-5 5 15 25 35 45010203040
Ratio
Indoor Temperature (˚CWB)
Outdoor Temperature (˚CDB)
16˚CWB
18˚CWB
19˚CWB
20˚CWB
22˚CWB
24˚CWB
15˚CWB
0.50
0.70
0.90
1.10
1.30
0.40
0.60
0.80
1.00
1.20
-5 0 5 10 15 20 25 30 35 40 45
Outdoor Temperature (˚CDB)
Ratio
19˚CWB
20˚CWB
22˚CWB
24˚CWB
15˚CWB
16˚CWB
18˚CWB
Indoor Temperature (˚CWB)
Page 29
27
CHAPTER 1 ● Product Section
The ratio of heating power input
PUHY-200/250/315YEMC-A
The ratio of heating capacity
The ratio of heating power input
PUHY-400/500YEMC-A
The ratio of heating capacity
0.60
0.70
0.80
0.90
1.00
1.10
1.20
1.30
-15 -10 -5 0 5 10 15 20
Ratio
Indoor Temperature (˚CDB)
15˚CDB
20˚CDB
25˚CDB
27˚CDB
Outdoor Temperature (˚CWB)
Outdoor Temperature (˚CWB)
Ratio
0.50
0.60
0.70
0.80
0.90
1.00
1.10
-15 -10 -5 0 5 10 15 20
15˚CDB
20˚CDB
25˚CDB
27˚CDB
Indoor Temperature (˚CDB)
0.60
0.70
0.80
0.90
1.00
1.10
1.20
1.30
-15 -10 -5 0 5 10 15 20
Outdoor Temperature (˚CWB)
Ratio
Indoor Temperature (˚CDB)
15˚CDB
20˚CDB
25˚CDB
27˚CDB
0.50
0.60
0.70
0.80
0.90
1.00
1.10
-15 -10 -5 0 5 10 15 20
Ratio
Indoor Temperature (˚CDB)
15˚CDB
20˚CDB
25˚CDB
27˚CDB
Outdoor Temperature (˚CWB)
Page 30
28
CHAPTER 1 ● Product Section
The ratio of heating power input
PURY-200/250YEMC-A
The ratio of heating capacity
0.60
0.70
0.80
0.90
1.00
1.10
1.20
1.30
-15 -10 -5 0 5 10 15 20
Ratio
Outdoor Temperature (˚CWB)
Indoor Temperature (˚CDB)
15˚CDB
20˚CDB
25˚CDB
27˚CDB
0.50
0.60
0.70
0.80
0.90
1.00
1.10
-15 -10 -5 0 5 10 15 20
Ratio
Outdoor Temperature (˚CWB)
Indoor Temperature (˚CDB)
15˚CDB
20˚CDB
25˚CDB
27˚CDB
Page 31

29
CHAPTER 1 ● Product Section
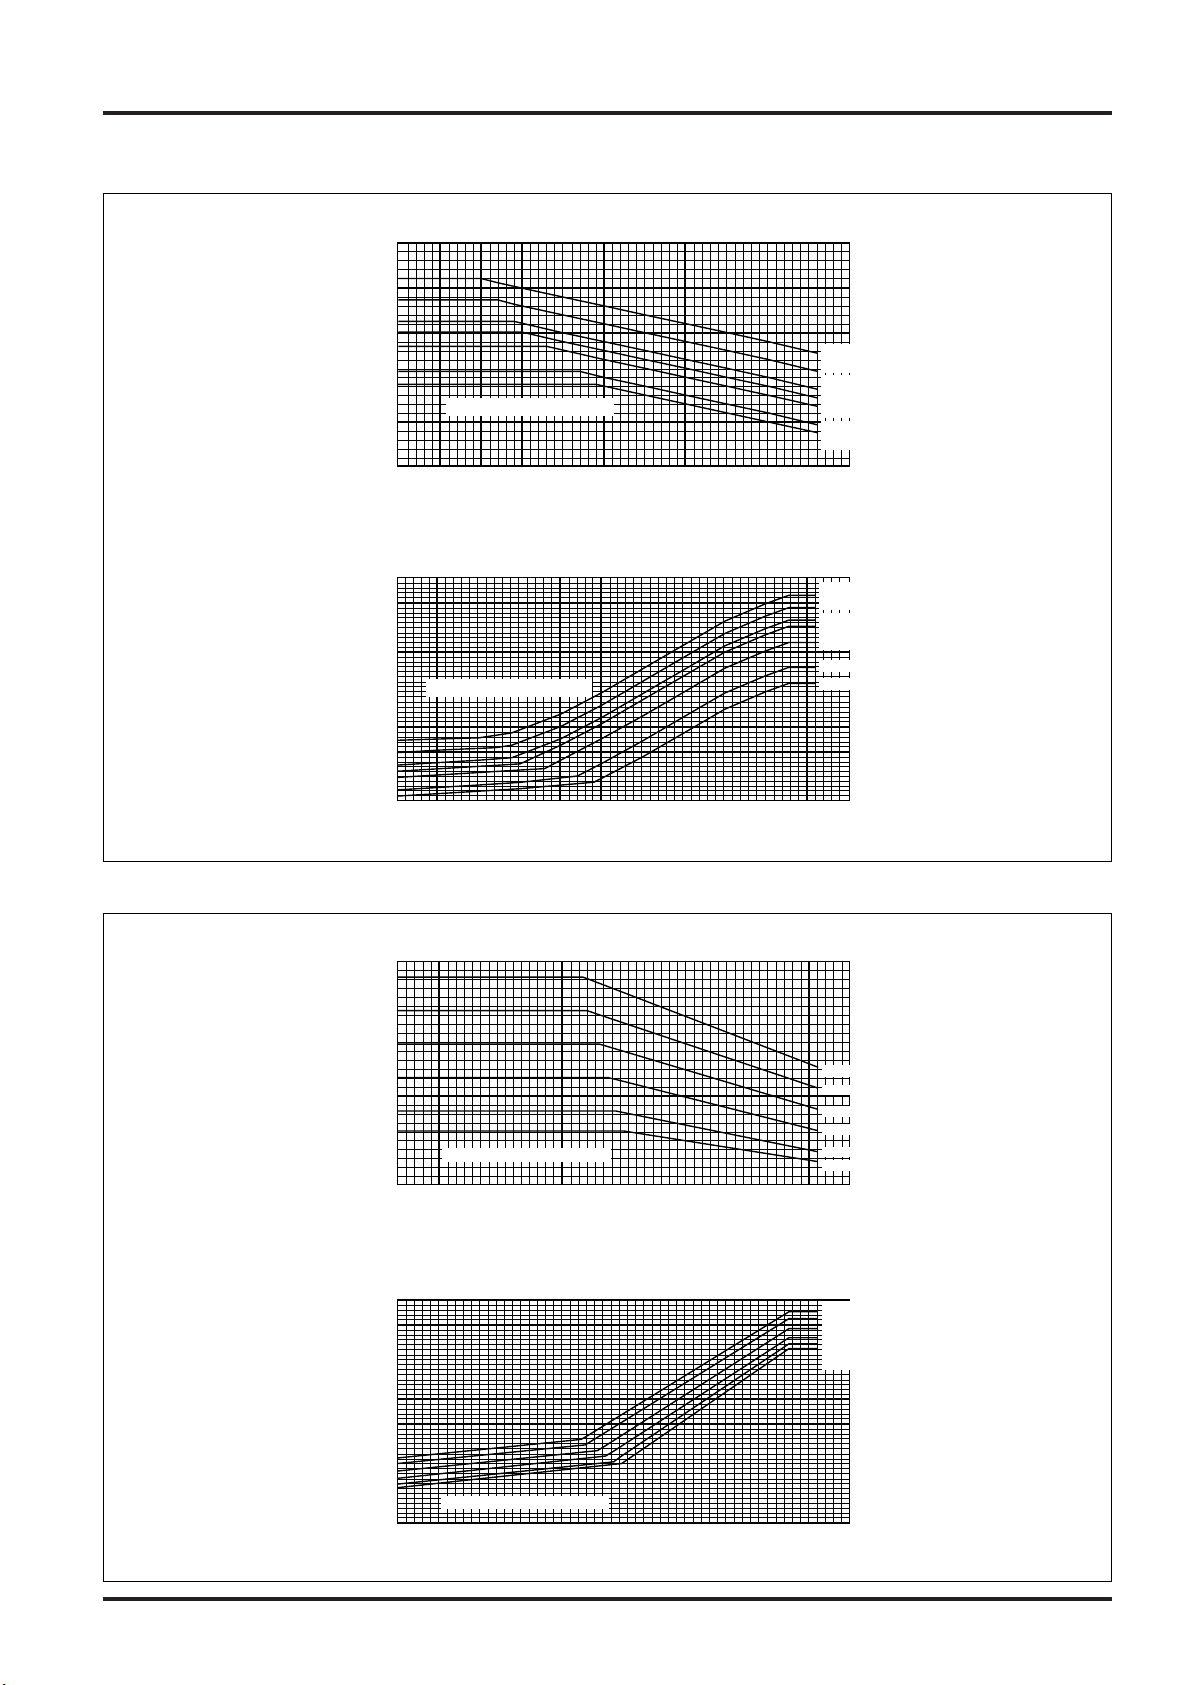
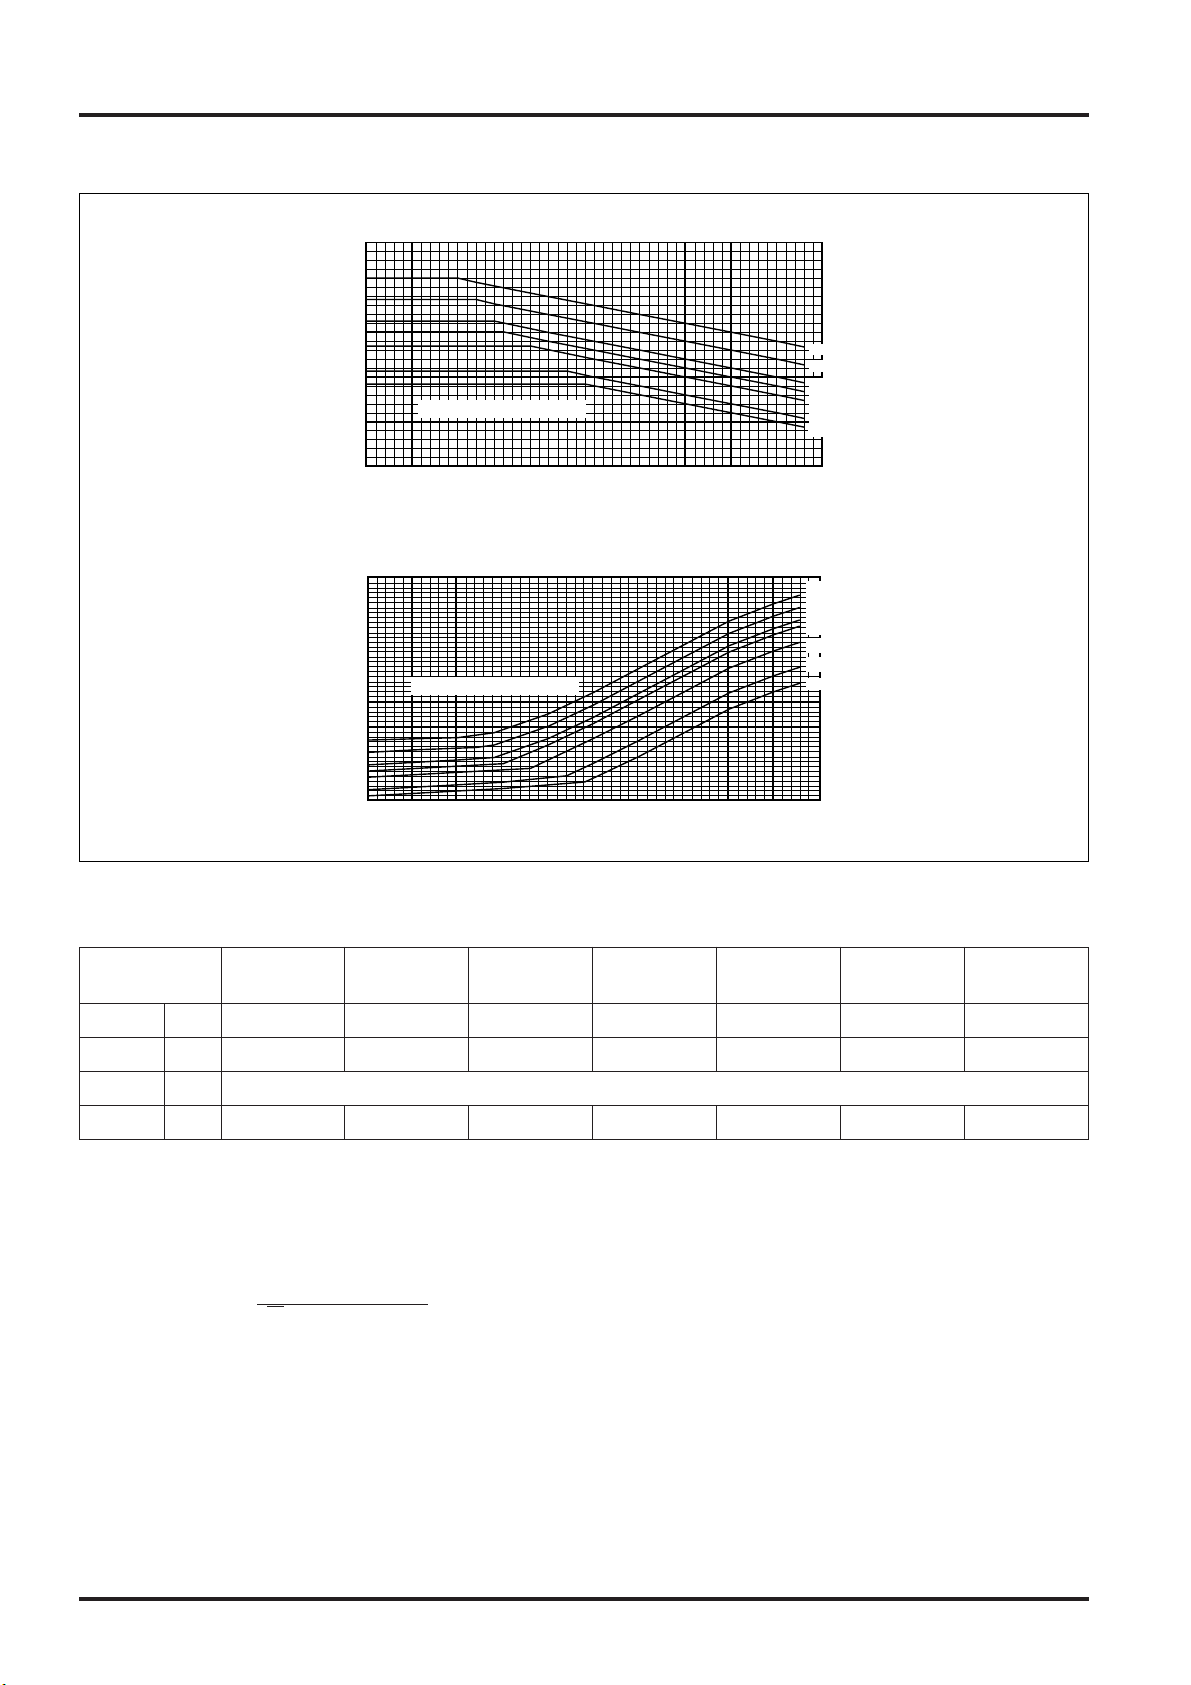
12.4 Correction by Refrigerant Piping Length
12.4.1 R410A refrigerant unit
To obtain a decrease in cooling/heating capacity due to refrigerant piping extension, multiply by the capacity
correction factor based on the refrigerant piping equivalent length in the table below.
0.65
0.7
0.75
0.8
0.85
0.9
0.95
0204060 80100 120 140 160
Pinping equivalent length (m)
Cooling capacity
correction factor
100
150
200
260
Total capacity of indoor unit
(1) Cooling capacity correction
0.65
0.7
0.75
0.8
0.85
0.9
0.95
0204060 80100 120 140 160
Pinping equivalent length (m)
Cooling capacity
correction factor
150
225
300
390
Total capacity of indoor unit
PUHY-P300YGM-A, PURY-P300YGM-A
PUHY-P200YGM-A, PURY-P200YGM-A
0.7
0.75
0.8
0.85
0.9
0.95
0204060 80100 120 140 160
Pinping equivalent length (m)
Cooling capacity
correction factor
125
188
250
325
Total capacity of indoor unit
0.7
0.75
0.8
0.85
0.9
0.95
0204060 80100 120 140 160
Pinping equivalent length (m)
Cooling capacity
correction factor
175
263
350
455
Total capacity of indoor unit
PUHY-P350YGM-A, PURY-P350YGM-A
PUHY-P250YGM-A, PURY-P250YGM-A
0.75
0.8
0.85
0.9
0.95
Cooling capacity
correction factor
020406080100 120 140 160
Pinping equivalent length (m)
200
300
400
520
Total capacity of indoor unit
0.7
0.75
0.8
0.85
0.9
0.95
0204060 80100 120 140 160
Pinping equivalent length (m)
Cooling capacity
correction factor
250
375
500
650
Total capacity of indoor unit
PUHY-P500YGM-A, PURY-P500YGM-A
PUHY-P400YGM-A, PURY-P400YGM-A
0.75
0.8
0.85
0.9
0.95
Cooling capacity
correction factor
0204060 80100 120 140 160
Pinping equivalent length (m)
225
338
450
585
Total capacity of indoor unit
PUHY-P450YGM-A, PURY-P450YGM-A
Page 32

30
CHAPTER 1 ● Product Section
0.9
0.95
1
020406080100 120
Pinping equivalent length (m)
Heating capacity
correction factor
(2) Heating capacity correction
0.8
0.82
0.84
0.86
0.88
0.9
0.92
0.94
0.96
0.98
1
020406080100 120 140 160
Pinping equivalent length (m)
Heating capacity
correction factor
PURY-P200YGM-A, PURY-P250YGM-A
PURY-P300YGM-A
PUHY-P200YGM-A, PUHY-P250YGM-A
0.9
0.95
1
020406080100 120
Pinping equivalent length (m)
Heating capacity
correction factor
0.8
0.82
0.84
0.86
0.88
0.9
0.92
0.94
0.96
0.98
1
020406080100 120 140 160
Pinping equivalent length (m)
Heating capacity
correction factor
PURY-P350YGM-A, PURY-P400YGM-A
PUHY-P300YGM-A, PUHY-P350YGM-A
PUHY-P400YGM-A, PUHY-P450YGM-A
PUHY-P500YGM-A
0.8
0.82
0.84
0.86
0.88
0.9
0.92
0.94
0.96
0.98
1
020406080100 120 140 160
Pinping equivalent length (m)
Heating capacity
correction factor
PURY-P450YGM-A, PURY-P500YGM-A
●
How to obtain piping equivalent length
1) PUHY-P200YGM-A, PURY-P200YGM-A
Equivalent length = (Actual piping length to the farthest indoor unit) + (0.35 × number of bent on the piping) m
2) PUHY-P250/P300YGM-A, PURY-P250/P300YGM-A
Equivalent length = (Actual piping length to the farthest indoor unit) + (0.42 × number of bent on the piping) m
3) PUHY-P350YGM-A, PURY-P350YGM-A
Equivalent length = (Actual piping length to the farthest indoor unit) + (0.47 × number of bent on the piping) m
4) PUHY-P400/P450/P500YGM-A, PURY-P400/P450/P500YGM-A
Equivalent length = (Actual piping length to the farthest indoor unit) + (0.50 × number of bent on the piping) m
Page 33

31
CHAPTER 1 ● Product Section
12.4.2 R22
refrigerant unit
Total capacity of indoor unit
Cooling capacity
correction factor
1.0
0.9
0.8
0.7
200406080 100 120
Piping equivalent length (m)
100
150
200
260
(1) Cooling capacity correction
Cooling capacity
correction factor
1.0
0.9
0.8
200406080 100 120
Piping equivalent length (m)
158
237
315
410
Total capacity of indoor unit
PUHY-315YEM-A/315YEMC-A
PUHY-200YEM-A/200YEMC-A
Total capacity of indoor unit
Cooling capacity
correction factor
1.0
0.9
0.8
0.7
200406080 100 120
Piping equivalent length (m)
125
188
250
325
200
300
400
520
Total capacity of indoor unit
Cooling capacity
correction factor
1.0
0.9
0.8
0.7
200406080 100 120
Piping equivalent length (m)
PUHY-400YEM-A/400YEMC-A
PUHY-250YEM-A/250YEMC-A
250
375
500
650
Total capacity of indoor unit
0
Cooling capacity
correction factor
1.0
0.9
0.8
0.7
20 40
60
80 100 120
Piping equivalent length (m)
Total capacity of indoor unit
Cooling capacity
correction factor
1.0
0.9
0.8
0.7
200406080 100 120
Piping equivalent length (m)
125
188
250
375
PURY-250YEMC-A
PUHY-500YEM-A/500YEMC-A
Total capacity of indoor unit
Cooling capacity
correction factor
1.0
0.9
0.8
0.7
200406080 100 120
Piping equivalent length (m)
100
150
200
300
PURY-200YEMC-A
Page 34

32
CHAPTER 1 ● Product Section
Heating capacity
correction factor
1.0
0.9
0.8
0.7
200406080 100 120
Piping equivalent length (m)
(2) Heating capacity correction
Heating capacity
correction factor
1.0
0.9
0.8
0.7
200406080 100 120
Piping equivalent length (m)
PUHY-200YEM-A/200YEMC-A PUHY-250YEM-A/250YEMC-A
Heating capacity
correction factor
1.0
0.9
0.8
0.7
200406080 100 120
Piping equivalent length (m)
Piping equivqlent length (m)
0
Heating capacity
correction factor
1.0
0.9
20 40
60
80 100 120
PUHY-315YEM-A/315YEMC-A
Total capacity of indoor unit
Heating capacity
correction factor
1.0
0.9
0.8
0.7
200406080 100 120
Piping equivalent length (m)
100
150
200 or more
PURY-200YEMC-A
Total capacity of indoor unit
Heating capacity
correction factor
1.0
0.9
0.8
0.7
200406080 100 120
Piping equivalent length (m)
125
188
250 or more
PURY-250YEMC-A
PUHY-400YEM-A/400YEMC-A
PUHY-500YEM-A/500YEMC-A
●
How to obtain piping equivalent length
1) PUHY-200YEM-A/200YEMC-A
Equivalent length = (Actual piping length to the farthest indoor unit) + (0.47 × number of bent on the piping) m
2) PUHY-250YEM-A/250YEMC-A
Equivalent length = (Actual piping length to the farthest indoor unit) + (0.50 × number of bent on the piping) m
3) PUHY-315YEM-A/315YEMC-A/400YEM-A/400YEMC-A
Equivalent length = (Actual piping length to the farthest indoor unit) + (0.70 × number of bent on the piping) m
4) PUHY-500YEM-A/500YEMC-A
Equivalent length = (Actual piping length to the farthest indoor unit) + (0.80 × number of bent on the piping) m
Page 35

33
CHAPTER 1 ● Product Section
100
50
0 200 400 600
100
50
0 200 400 600 800 1000 1200
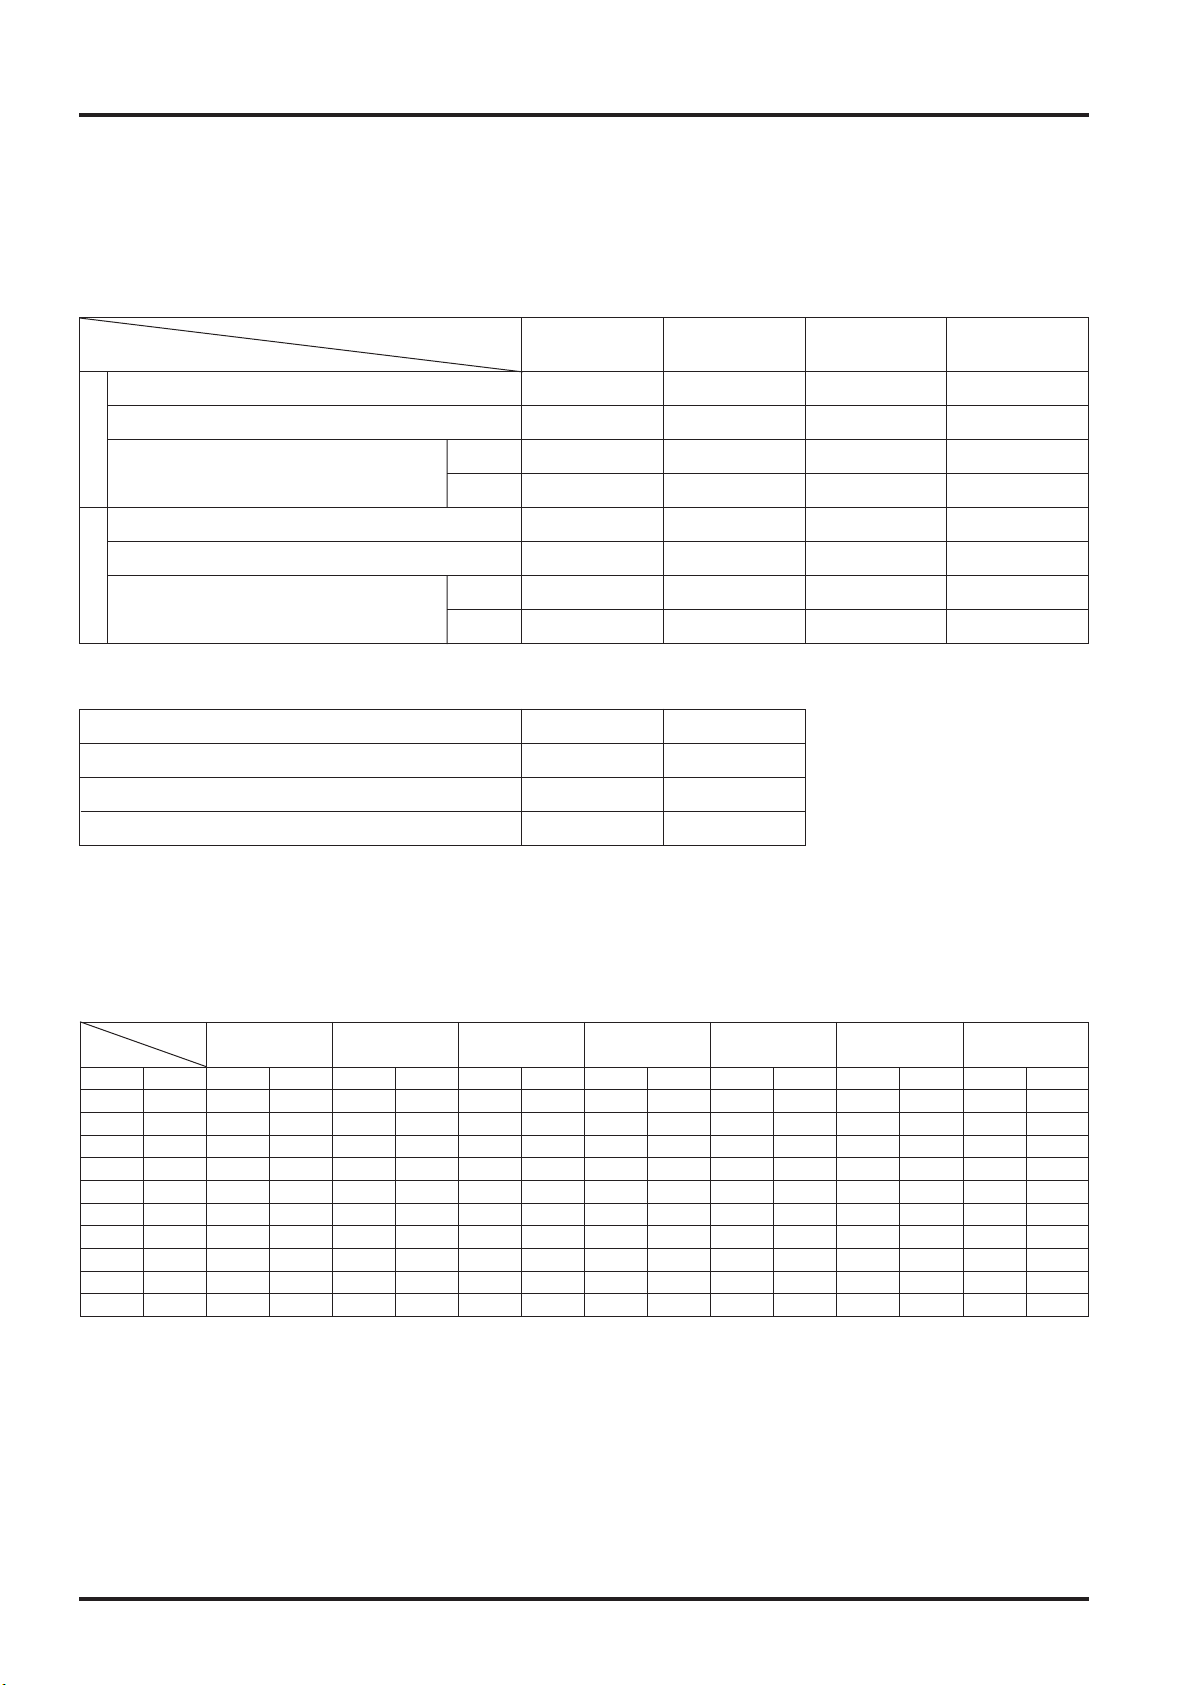
PZ-50RFM 466 174 2 GUF-50RDH3/50RD3
PZ-100RFM 561 236 2 GUF-100RDH3/100RD3
Dimension (mm)
AB
Tested
dust
Measurement method
Filter type
Applicable
model
GUF-50RDH3
GUF-100RDH3
GUF-50RD3
GUF-100RD3
Protection of heat
exchange element
Assurance of sanitary
environment
AFI
Gravitational
method
Compound
dust
ASHRAE
Colorimetric
method
Atomspheric
dust
Countingh method
(DOP method)
Application
JIS 14 types
DOP 0.8 µm
DOP 0.3 µm
82% 8% - 12% 5% - 9% 2% - 5%
99% 65% 60% 25%
Pre-filter NP/400 (EU3)
High Model PZ-50RFM
efficiency PZ-100RFM
filter
(EU7)(Optional parts)
Note: This is one set per main body.
PZ-50RFM PZ-100RFM
External static pressure (Pa)
External static pressure (Pa)
Air volume (m3/h) Air volume (m3/h)
13. Filter Characteristics
13.1 Filter Types
13.2 High-Efficiency Filter (Optional Parts)
13.3 Pressure Loss
Pressure loss characteristics
A
B
25
AIR
FLOW
Model
Number of
filters per set
Applicable model *
Page 36

34
CHAPTER 1 ● Product Section
The ability of the filters used within the OA processing units are shown below, expressed in terms of collection
ratio (%).
20
40
60
80
100
Collection
ratio (%)
High efficiency
filter
NP/400
0.2 0.3 0.4 0.6 0.8 1.0 2.0 3.0 4.0 6.0 8.0 10.0
20 30
40 60 80 100
Particle diameter (µm)
Dust removal retention characteristics (NP/400 + High efficiency filter)
GUF-50RDH3/50RD3
0
0 100 200 300 350
400
50 150 250
20
40
60
80
100
140
120
Presure
loss (Pa)
Dust removal volume (g/set)
GUF-100RDH3/100RD3
0
0
100 200 300 400 500 600 700
20
40
60
80
100
180
200
160
140
120
Presure
loss (Pa)
Dust removal volume (g/set)
Page 37

35
CHAPTER 1 ● Product Section
14. Noise Characteristics
14.1 GUF-50RDH3/50RD3
14.2 GUF-100RDH3/100RD3
●
Measurement Condition
90
85
80
75
70
65
60
55
50
45
40
35
30
25
20
15
10
NC-70
NC-60
NC-50
NC-40
NC-30
NC-20
NC-10
Directly below (Measurement point A)
Octave band sound level (dB)
Octave band central frequency (Hz)
<Ceiling recessed type>
Supply/
Exhaust air
Main unit
To indoor unit
90
85
80
75
70
65
60
55
50
45
40
35
30
25
20
15
10
NC-70
NC-60
NC-50
NC-40
NC-30
NC-20
NC-10
Outlet (Measurement point B)
Octave band sound level (dB)
Octave band central frequency (Hz)
90
85
80
75
70
65
60
55
50
45
40
35
30
25
20
15
10
NC-70
NC-60
NC-50
NC-40
NC-30
NC-20
NC-10
Directly below (Measurement point A)
Octave band sound level (dB)
Overall
Octave band central frequency (Hz)
62.5 125 250 500 1K 2K 4K 8K Overall 62.5 125 250 500 1K 2K 4K 8K
Overall 62.5 125 250 500 1K 2K 4K 8K Overall 62.5 125 250 500 1K 2K 4K 8K
90
85
80
75
70
65
60
55
50
45
40
35
30
25
20
15
10
NC-70
NC-60
NC-50
NC-40
NC-30
NC-20
NC-10
Outlet (Measurement point B)
Octave band sound level (dB)
Octave band central frequency (Hz)
Measurement site:
Mitsubishi Electric Co.,
Nakatsugawa Works
Anechoic chamber
A
B
1.5 m
1.5 m
High
Low
High
Low
Page 38

36
CHAPTER 1 ● Product Section
Test report
This document reports the result that there is no bacterial cross contamination for the Lossnay Core.
(1) Object
The object of this test is to verify that there is no bacterial cross contamination from the outlet air to the
inlet air of the Lossnay Core in the heat exchange process.
(2) Client
MITSUBISHI ELECTRIC CO. NAKATSUGAWA WORKS.
(3) Test period
April 26, 1999 - May 28, 1999
(4) Test method
The configuration of the test equipment is shown below. The test bacteria suspension is sprayed in the
outlet duct at a pressure of 1.5 kg/cm2with a sprayer whose dominant particle size is 0.3 - 0.5 µm. The
air sampling tubes are installed at the each center of the locations of A, B, C, D, in the Lossnay Core
inlet/outlet ducts so that their openings are directly against the air flow, and then connected to the
impinger outside the duct. The impinger is filled with 100 mL physiological salt solution. The airborne
bacteria in the duct air are sampled at the rate of 10L air/minute for three minutes.
(5) Test bacteria
The bacteria used in this test are as followed;
Bacillus subtilis IFO 3134
Pseudomonas diminuta IFO14213 (JIS K 3835 Method of testing bacteria trapping capability of
precision filtration film elements and modules; applicable to precision filtration film, etc. applied to air
or liquid)
(6) Test result
The result of the test with Bacillus subtilis is shown in Table 1.
The result of the test with Pseudomonas diminuita is shown in Table 2.
Sprayer
Impinger
Impinger
Impinger
Fan
Fan
Safety cabinet
Impinger
LOSSNAY Core
HEPA filter
15. Reference Documents
15.1 The Result of No Bacterial Cross Contamination for the
Lossnay Core and Determining Resistance of the Lossnay
Core to Molds
Page 39

37
CHAPTER 1 ● Product Section
Table 1 Test result with bacillus subtilis (CFU/30L air)
No. ABCD
1 5.4 × 10
4
5.6 × 10
4
<10
3
<10
3
2 8.5 × 10
3
7.5 × 10
3
<10
3
<10
3
3 7.5 × 10
3
<10
3
<10
3
<10
3
4 1.2 × 10
4
1.2 × 10
4
<10
3
<10
3
5 1.8 × 10
4
1.5 × 10
3
<10
3
<10
3
Average 2.0 × 10
4
1.5 × 10
4
<10
3
<10
3
Table 2 Test result with pseudomonas diminuita (CFU/30L air)
No. ABCD
1 3.6 × 10
5
2.9 × 10
5
<10
3
<10
3
2 2.5 × 10
5
1.2 × 10
5
<10
3
<10
3
3 2.4 × 10
5
7.2 × 10
5
<10
3
<10
3
4 3.4 × 10
5
8.4 × 10
5
<10
3
<10
3
5 1.7 × 10
5
3.8 × 10
5
<10
3
<10
3
Average 2.7 × 10
5
4.7 × 10
5
<10
3
<10
3
(7) Considerations
Bacillus subtilis is commonly detected in the air and resistant to dry. Pseudomonas diminuita is
susceptible to dry and only a few exists in the air. However, it is used in the performance verification of
the bacteria trapping filter since the particle size is small (Cell diameter; 0.5 µm: Cell length 1.0 to 4.0
µm).
Both Bacillus subtilis and Pseudomonas diminuta are detected at the location A and B in the outlet side
duct where they are sprayed, but neither them are detected at location C (in the air filtered by the
HEPA filter) and the location D (in the air crossed in the Lossnay Core) on the inlet side.
Since the number of bacteria in the location A is substantially equal to one in the location B, it is
estimated that only a few bacteria are attached to the Lossnay Core on the outlet side. Also, no test
bacteria is detected at the location D where the air is crossed in the Lossnay Core. Therefore, it can
be concluded that the bacteria attached to the outlet side will not pass through the inlet side even after
the heat is exchanged.
Shunji Okada
Manager, Biological Section
Kitasato Reseaarch Center of Enviromental Seiences
Page 40

38
CHAPTER 1 ● Product Section
Test report
This document reports the result of determining resistance of the Lossnay Core to molds.
(1) Object
The object of this test is to determining resistance of the Lossnay Core to molds.
(2) Client
Mitsubishi Electric Co. Nakatugawa Works
(3) Test sample
Lossnay Core (paper separator)
(4) Test period
April 26, 1999 - May 28, 1999
(5) Test method
The testing method is in accordance with “5. General Industrial Products,” “Test Method of Resistance
to Mold,” JIS Z 2911.
The Lossnay Core is cut into 5 × 5 cm square. pole. The test mold spore solution is sprayed on one
side of the core and, after covering one side of the crossing core with sponge sheet, the core is left in
the chamber with 27°C, (relative humidity 95%) for four weeks.
(6) Test mold
The molds used in this test are as follows;
Aspergillus niger ATCC 6275
Penicillium citrinum ATCC 9849
Rhizopus oryzae IFO 31005
Cladosporium cladosporioides IFO 6348
Chaetomium globosum ATCC 6205
(7) Determination criterion
Observed growth on specimens Degree
None growth 3
Light growth (less than 1/3 area) 2
Heavy growth (more than 1/3 area) 1
(8) Test result
No hypha was grown in the place where the test mold spore solution was applied. So the degree of
resistance to mold was judged to be 3.
Shunji Okada
Manager, Biological Section
Kitasato reseaarch Center of Enviromental Seiences
Page 41

39
CHAPTER 1 ● Product Section
Material,
Mixture ratio,
Organization,
Fan number,
Density,
Weight (g/m
2
)
15.2 Flame-proofing Properties of Lossnay Core
The Lossnay Core satisfied all requirements of Paragraph 4-3 of the Fire Prevention Law Enforcement Rules.
Details of the tests carried out are as seen below.
Notation format 2 - (3)
Notification of flame-proofing property test
(For flame-proof materials and related items)
Flame-proofing committee test No., B-80028
April 17, 1980
Messrs.: Mitsubishi Electrical Corporation
Japan Flame-proofing committee
The results of the test, requested on April 8, 1980, are as follows.
Whereas
Part name
Product name
(Brand)
Air filter
Total heat
exchanger
Lossnay
(ventilation fan) B
Specially treated paper:
(Partition (white): Thickness 0.2 mm)
(Filler block (blue): Thickness 0.2 mm)
Adhesive agent:
Vinyl acetate (Specific gravity ratio 2.6 %)
600 g/m
2
Residual Residual
Carbonized
Test No. Test item flame dust area
(sec.) (sec.) (cm2)
2-min.
1 (Vertical) 0. 4.1 35.4
heating
2 (Vertical) 0. 7.7 38.2
6-sec.
3
(Horizontal)
0. 1.4 35.9
heating after
1 (Vertical) 0. 0. 26.3
igniting
2
(Horizontal)
0. 0. 20.3
Test item
Carbonization No. of flame
length
contact times
Test No.
(cm) (times)
1
2
3
4
5
Evaluation Passing
Remarks
Test method
Application of Paragraph 4-3 Standards of Fire Prevention Laws
Enforcement Rules (Ministry of Home Affairs Ordinance No. 6, 1961)
(Thick cloth test)
Passing standards
Residual flame : 5 sec. or less
Residual dust : 20 sec. or less
Carburized area : 40 cm
2
or less
Washing test
Page 42

40
CHAPTER 1 ● Product Section
Applicant
Company name Mitsubishi Electric Corp., Nakatsugawa Works
Address 1-3 Komanba-cho, Nakatsugawa, Gifu
Specimen type
Single-face laminated
Product
Lossnay Core
corrugated board
name
(Total heat recovery unit)
Single-face laminated corrugated board
... Thickness: 4 mm
(Single-face corrugated board with
2 mm cell size laminated alternately at
right angle)
Partition (Liner paper) Flame-proof
treated paper
...
Thickness: 0.085 mm, Weight: 70 g/m
2
Material structure and Adhesive agent ... Vinyl acetate resin
Specimen cross-sectional ...
Weight: 30 g/m2(Solid)
and test body diagram, etc. Filler (Flute paper)
... Colored wood free paper
...
Thickness: 0.093 mm, Weight: 79 g/m
2
Adhesive agent
... Vinyl acetate resin
... Weight: 30 g/m
2
(Solid)
Partition (Liner paper) Flame-proof
treated paper
...
Thickness: 0.085 mm, Weight: 70 g/m
2
Test body size and
300 (Long side) × 200 (Short side) × 4 (Thickness)
thickness (mm)
Test body direction The longer side is the vertical side.
Testing standards
Pre-treatment of Heating
Heating surface class and direction
Testing
test body time
method
JIS A 1322
Method A
The direction of which the corrugated
(45° Meckelian burner
(drying method)
3 min. board fold was vertical was set as the
method) front of the heating surface.
Test date October 5, 1993
Test position
Residual
Residual
Carbonized Discoloration
frame dust
length (Vertical ×length (Vertical
×
Remarks
Test results Class Direction No.
(sec.) (sec.)
Horizontal) (cm) Horizontal) (cm)
10 08.2 × 4.7 18.7 × 7.3
Front Vertical 2 0 0 8.4 × 4.9 24.3 × 7.8 *1
30 07.4 × 5.0 22.0 × 8.4
Evaluation
The specimen conforms to Class 2 flame-proofing (heating time: 3 min.) according to the “Fire
retardancy test methods of thin materials for construction” as set forth by JIS A 1322.
Material Testing Laboratory
Persons in charge of testing Laboratory chief: Hiroshi Tamura, Technicians: Shigeru
Fujikawa, Nobuaki Oohiro, Tetsuya Ogawa
The Lossnay Core was also tested at the Japan Construction General Laboratories according to the fire
retardancy test methods of thin materials for construction as set forth by JIS A 1322. The material was evaluated
as Class 2 flame retardant. Details of the tests carried out are shown below.
Flame-proofing property test report
Messrs. Mitsubishi Electric Corp.,
Nakatsugawa Works
Acceptance No. VF-93-11-(2)
Data of acceptance September 7, 1993
Data of report October 12, 1993
Japan Construction General Laboratories
5-8-1 Fujishirodai, Suita City 565
Tel: 06-872-0391
Hiorshi Wakabayashi Dr. of Engineering, Director
Note: Immediately after starting heating, the flame was ignited simultaneously with the generation of smoke.
Penetration was observed approx. 2 min. 30 sec., after heating was started. There were no further changes.
4mm
2mm
Page 43

41
CHAPTER 1 ● Product Section
Testing facility General Building Research Corporation
Address 1-3 Komanba-cho, Nakatsugawa, Gifu
Company
Mitsubishi Electric Corporation
name
Nakatsugawa Works
Testing
According to “soundproofing effect test” in
method
Ministry of Construction No. 108
Measurement
March 9, 1979
date
Measurement
Temperature: 12.5°C, humidity: 77%
conditions
Soundproof area
W 580 × H 190
dimensions
Centre frequency
125 Hz 500 Hz 2,000 Hz
1 101.5 96.5 98.5
2 99.0 — —
3 100.0 97.5 98.5
4 102.0 — —
5 101.5 96.5 98.5
Average
100.9 96.9 98.5
level
1 81.5 63.5 53.0
2 79.5 — —
3 79.5 63.0 43.0
4 82.5 — —
5 81.5 62.5 43.5
Average
81.1 63.0 43.2
level
Average sound
pressure level
19.8 33.9 55.3
difference (dB)
Sound absorbed
by reverberation
chamber on
2.79 3.90 7.22
reception side
(m
2
)
Sound transmis-
5.8 18.4 37.1
sion loss (dB)
Refer to page 39 for details of test results
Remarks
The soundproofed area of the specimen is small in this test, and as
the transmission of sound though the surrounding concrete block wall
cannot be ignored, the concrete block wall was measured after the
main test, and the main test measurement results were corrected.
Persons in charge of testing: Mitsuo Morimoto, Toshifumi Murakami
Measurement results
Each measured sound pressure level (dB)
Certificate
IVA-78-122
number
Product name
LGH-50E
Item name Heat exchange-type ventilator
Application Ventilation
Date of
October 1978
manufacture
Place of
General Building Research Corporation
assembly
Dimensions W 1250 × H 310 × D 1589
Area
———
concentration
Remarks An existing hole (4000 mm × 3000 mm) was
covered with a hollow concrete block with
Cultures, double-faced mortar (thickness 20 mm each),
specimen with a wood frame with inner dimension of
installation 580 mm × 190 mm × 230 mm being installed.
method at The supply/exhaust box and duct was
test facility mounted in this, and the main unit and
weather cover was mounted.
Peripheral
Oil clay was filled around the sound source
sections
Specimen configuration (dimensions mm)
Refer to appendix 1, 2 for details. S: 1/20
15.3 Lossnay Core’s Soundproofing Properties Test
As the Lossnay Core is made of paper and the permeable holes are extremely small, the Element has outstanding
soundproofing properties and is appropriate for ventilation in soundproof rooms.
For example, the exposed ceiling-type LGH-50E has soundproofing characteristics of 33.9 dB with a center
frequency of 400 Hz. This means that a sound source of 96.9 dB can be shielded to 63 dB.
Soundproofing effect test results
For Mitsubishi Electric Corporation
Nakatsugawa Works
Test number IVA-78-122
Acceptance data : February 22, 1979
Report : May 24, 1979
General Building Reseach Corporation
Fujishirodai 5-125, Suita-shi, Osaka-Fu, Japan
Person in charge of testing: Takeshi Tokura
No. 122-1
The results of the tests are as noted below.
General Building Research Corporation
General Manager, S. Okushima
Remarks
Urethane foam (15 mm thick) was stuck onto the inside of the
duct and feed/exhaust box.
Specimen
Client
Sound source side
Reception side
Measurement pointMeasurement point
Sound transmission loss test
Steel plate
thickness: 0.8
Internal flange hole
with fixing screw
Weather cover
Steel plate thickness: 0.6
Wood frame
thickness: 20
Flange steel plate thickness: 1.6
Duct steel plate thickness: 1.6
Urethane foam thickness: 15 0.072 m
2
Feed/exhaust box
Steel plate thickness: 1.0
Sound
reception side
Sound
source side
Mortar
Page 44

42
CHAPTER 1 ● Product Section
15.4 Result of Microbial Test of Permeable Film Element
Microbial Test Report of Permeable Film Element
Kitasato Research Center of Environmental Science: Report No. 7858
March 3
rd
1998
Kitasato Reseach Center of Environmental Science
The chairman: Ichiro Yamamoto
Page 45

43
CHAPTER 1 ● Product Section
Microbial Test Report of Permeable Film Element
(1) Purpose of test
This test was conducted for the purpose of confirming whether or not microorganisms (Legionella)
present in humidified water are released into humidified air after passing through an original permeable
film humidifier element manufactured by Mitsubishi Electric Corporation.
(2) Party requesting test
Lossnay Manufacturing Department, Nakatsugawa Works,
Mitsubishi Electric Corporation.
Address: 1-3 Komanba-cho, Nakatsugawa City, Gifu Prefecture
(3) Test apparatus
Blower: Straight centrifugal fan, Model BFS-40S
Humidifier-mounted ducts: Air sampling pipes (copper pipes) are attached to sites located
approximately 20 cm in front of and behind the humidifier. The opening of the air intake pipe is
positioned in the center of the ducts facing the flow of air, and connected to a sampler outside the ducts
while gently bending along an L-shaped curve.
Apparatus operation: Dry air blown in with the sirocco fan passes through the humidifier element and
circulates to the air inflow port of the sirocco fan with a bellows duct having a diameter of 200 mm.
Air samplers: Impingers are filled in advance with 100 ml aliquots of sterile physiological salt solution,
after which one is connected upstream from the humidifier while another is connected downstream
from the humidifier. Sampled air is then sprayed into the physiological saline to clean. The amount of
air sampled into the impingers is set at 10 liters per minute. An under-sensor sampler consists of media
placed on each level below the six levels of porous nozzles gradually decreasing in size, and blows air
collected at the rate of 28.3 liters per minute onto the surface of agar media.
(4) Test organism
Legionella pneumophilla ATCC 33154
(5) Test method
1) Detection of test organism in humidified air
A suspension of test organisms at 1.4 × 10
7
CFU/ml is injected into the humidifier tank, after which the
suspension is allowed to fill the element by natural inflow.
The blower is operated after which air is collected into the sampler placed in the humidifier ten minutes
later. The amount of sampled air and the air conditions at that time are shown in Table 1.
Measurement of microbial count using the impinger method is performed by using physiological salt
solution immediately after air sampling as the undiluted liquid, preparing a 10-fold serial dilution,
inoculating 0.1 ml of that diluted liquid onto the surface of pour media B-CYEa agar media (Eiken
Chemical) and incubating at 37°C for 4 days followed by counting the number of colonies formed. Only
those colonies that form on B-CYEa agar media after re-inoculating onto B-CYEa agar media and
blood agar media are counted as Legionella. With respect to the under-sensor sampler method,
colonies that are formed using pour media WYOa agar media (Eiken Chemical) are re-inoculated onto
B-CYEa agar media and blood agar media, and those colonies that formed only on the B-CYEa agar
media are counted as Legionella.
Page 46

44
CHAPTER 1 ● Product Section
Table 1 Air sampling conditions
Impinger method Slit sample method
Measurement
Sampled air volume
Humidity of circulated air
Sampled air volume
Humidity of circulated air
1st 20 lit. 26.5% 28.3 lit. 35.6%
2nd 40 lit. 29.4% 141.5 lit.
****
3rd 100 lit. 52.8% 141.5 lit.
****
4th 100 lit.
****
141.5 lit.
****
5th 100 lit. 36.1% 141.5 lit. 93.4%
2) Detection of test organisms on the surface of the permeable film
20 ml of a suspension of test organisms (5.8 × 10
5
CFU/ml) are injected into one bag of the permeable
film humidifier element after which organisms are sampled and detected from the surface of the
element bag one hour later.
The sampling methods consist of: (1) sampling water droplets that formed on the surface of the front
side of the element (side where the spacer frame is not attached) with a sterile syringe, (2) stamping
the front surface and back surface (surface where the spacer frame is attached) of the element onto
the surface of a medium, and (3) wiping both surfaces of the element (measuring 5 × 5 cm2each) with
sterile solid gauze (Booth: Sawada Menko) and inoculating directly onto the surface of a medium.
Using pour media WYOa agar media (Eiken Chemical) for the medium, the formed colonies are reinoculated onto B-CYEa agar media and blood agar media followed by only counting those colonies
that formed on B-CYEa agar media as Legionella.
(6) Test period
January 12, 1998 - January 28, 1998
(7) Test results
1) Detection of airborne test organisms in humidified air
The detection status of test organisms in the impinger method and slit sampler method is shown in
Table 2.
Although two types of sampling methods were used, test organisms were unable to be detected in
circulating air in either of the methods.
Table 2 Detection of airborne test organisms in humidified air
Measurement
Impinger method Slit sampler method
(CFU/Sampled air volume) (CFU/Sampled air volume)
1st <10
2
CFU / 20 lit.> <102CFU / 28.3 lit.>
2nd <10
2
CFU / 40 lit.> <102CFU / 141.5 lit.>
3rd <10
2
CFU / 100 lit.> <102CFU / 141.5 lit.>
4th <10
2
CFU / 100 lit.> <102CFU / 141.5 lit.>
5th <10
2
CFU / 100 lit.> <102CFU / 141.5 lit.>
2) Detection of test organisms on the surface of the permeable film element
The detection status of test organisms from the surface of the permeable film humidifier element is
shown in Table 3.
(A) Test organisms were unable to be detected from water droplets that formed on the surface of the
front side (side on which the spacer frame is not attached). Since water droplets did not form on
the surface of the back side (surface in contact with the spacer frame), the test was unable to be
performed.
(B) In the case of pressing the test surface of the element onto the surface of the medium, test
organisms were not detected for either surface.
Page 47

45
CHAPTER 1 ● Product Section
(C) In the case of wiping both surfaces of the element with sterile solid gauze, test organisms were not
detected on the surface of the front side (side in which the spacer frame is not attached). Seven
colonies were detected from one of two locations on the surface of the back side (surface in
contact with the spacer frame). Test organisms were unable to be detected at the other location.
Table 3
Surface for sampling test organisms from permeable film element
Sampled Method
Front surface (Where spacer frame is not attached)
Back surface (in contact with spacer frame)
Sampling site No.1 Sampling site No.2 Sampling site No.3 Sampling site No.4
Culturing of water droplets
Not detected Not detected No droplets No droplets
Stamping method Not detected Not detected Not detected Not detected
Wiping method Not detected Not detected Detected Not detected
(8) Discussion
The test organism of Legionella pneumophilla was unable to detected in humidified air of a humidifier
using a permeable film humidifier element. Thus, a study was conducted by more directly injecting a
suspension of the test organism inside the permeable film humidifier element to assess whether or not
the test organisms permeate to the front side of the film element. As a result, although test organisms
were unable to be detected in water droplet culturing and stamping methods, test organisms were
detected from one sampling site on the back side in the wiping method. The number of detected test
organisms were 7 CFU per unit area of 5 × 5 cm. Since about 5.8 × 10²CFU ought to be detected even
if the amount of liquid that seeped from the element is assumed to be 1 µl (organism suspension
injected into the element: 5.8 × 10⁵CFU/ml), it was assumed that only an extremely small amount of
liquid actually seeped out. When considering that this seepage only occurred at one location of the 4
sites that were wiped, and that the amount of test organisms that seeped from the element is extremely
small, it is believed that the organisms were detected as a result of damaging the film surface during
wiping.
Thus, it was concluded that Legionella pneumophilla does not seep through the permeable film
humidifier element provided the surface of the element is not damaged by wiping or other form of
abrasion.
Shunji Okuda, Test Director
Page 48

Page 49

CHAPTER 2
Air Conditioning System
Design Section
Page 50

EA
OA
RARA SA
SA SA
RA SA
48
CHAPTER 2 ● Air Conditioning System Design Section
1. Guide to a Comfortable Air Conditioning System
Air conditioning is more than simply adjusting the temperature of the air. It is used for properly maintaining the
conditions for the air in a given space including the temperature, CO and CO2 levels, the density of contaminant
properties (removing odors created by humans and other things), air flow and its distribution. Recently, more
attention has been placed on what an air conditioning system can do in addition to controlling temperature to
improve the environment in a given space. This has given rise to demands for improved comfort, operating
control for individual rooms, low-energy consumption, low maintenance and more compactness. Ceiling
installation of units for cooling a floor or a particular zone, and functions such as the introduction of outdoor air,
exhaust air removal, dust removal, heat recovery from ventilated air, heat processing and humidifying have been
developed in response to these demands. In addition, by combining the OA processing unit with fin coil units or
packaged air conditioners, comprehensive air conditioning can be provided.
1.1 Elements of Air Conditioning to be Considered
1.2 Example of a Comfortable Air Conditioning System
Adjusting the properties of the air
Control CO and CO2
densities and expelling
airborne dust and odors
Reduce ventilation load
Maintain humidity
levels.
Important
especially
during winter
Especially remove
tobacco smoke (Smoke
that cannot be
processed by ventilation)
Cooling or heating and
maintaining desired
temperature
Ventilation
Adjusts indoor static
pressure (Inside and
outside room)
1. Individual fans for
intake and exhaust
2. Use individual static
pressure adjustment
units
1. High-efficiency filter
2. Total heat recovery
unit (Lossnay Core)
3.
Uses heat
exchanger
1. Direct Expansion coil
2. Use humidifier
(permeable film type)
Uses high-efficiency
filter
Refrigerant amount can
be controlled in
response to load
1. Remove contaminants
from outdoor air
2. Trouble-free and easy
to maintain
3. Process un-recovered
heat load.
4. Assist in cooling or
heating
1. Preheat for
humidifying
2. Clean humidifying
3. Long service life free
of mechanical trouble
or becoming dirty
1. Remove tobacco
smoke
2. Long service life
Maintain room
temperature at ± 0.5°C
(However, maintains air
flow and volume at
proper levels)
Heat recovery Humidifying Dust removal
Controlling room temperature
Heating or cooling
Outdoor air processing unit
Ventilation
Heat recovery
Cooling
and
heating
Humidifying
Dust removal
Fan
(Exhaust)
Total heat
recovery unit
Fan
(Supply)
Direct Expansion coil
(Cooling, heating)
Humidifier
(Adds humidity)
High-efficiency
filter for supply
air
(Dust removal)
Filter for exhaust
air
(Dust removal)
Filter Filter
Direct Expansion coil Direct Expansion coil
Indoor unit
Cooling or heating
Dust removal
Air flow
]
][
[
Page 51

49
CHAPTER 2 ● Air Conditioning System Design Section
2. Features of the OA Processing Unit
(1) Provides individual control for comprehensive air conditioning
By combining the OA processing units in each air conditioning zone with heating and cooling units,
comprehensive air conditioning can be provided with control each individual zone. This individual air
conditioning can include the operation and stopping of cooling and heating, ventilation, humidifying, heat
processing, dust removal and heat recovery.
(2) Provides more design freedom and effective utilization of space
The OA processing unit is recessed into the ceiling so there is no need for a separate equipment room and
elaborate duct work. In addition, if a ceiling mounted cooling and heating unit is selected, absolutely no floor
space is required for the system. This eases design constraints and helps to eliminate problems related to
the installation of the equipment room and noise and vibration from the main duct work.
(3) High static pressure outside the unit allows for extended duct length
Since a high static pressure outside the unit can be attained, extending ducts, adding branches or positioning
of outlets can be done with relative freedom. This is a system that allows for a wide range of flexibility during
installation.
(4) Long-life high-efficiency filter can be added
The high-efficiency filter offers up to 65% filtration (colorimetric method) and can be used for up to 3,000
hours without maintenance. There is space provided inside the OA processing unit for installing this optional
filter.
(5) Low-energy consumption
This system does not need the large conveyance power required by previous systems. In addition, individual
control and heat recovery by the internal Lossnay Core help to reduce energy consumption needs. In
addition, the cooling and heating unit is compact in size.
(6) Can calculate electrical costs for each zone
When used in conjunction with packaged air conditioning, electricity consumption for each zone can be
calculated, making this system perfect for use in buildings with tenants.
(7) Low noise
The noise level is low enough for the system to be used in virtually any application, including offices.
(8) Permeable film humidifier used
This is a clean type of humidifier that is compatible with the electronic components found in today’s “intelligent
buildings”.
Examples of air conditioning systems
OA processing unit
(Ventilation, Heat recovery, Cooling and Heating, Humidifying, Dust removal)
Indoor unit
Note: Both the gas and liquid refrigerant lines are shown by a single line in the drawing.
City Multi
Page 52

50
CHAPTER 2 ● Air Conditioning System Design Section
3. Air Conditioning and Ventilation
Fresh outdoor air must be introduced constantly at a set ratio in an air conditioning system. This fresh air is
introduced to be mixed with the return air from the room, to adjust the temperature and humidity, supply oxygen,
reduce body and other odors, remove tobacco smoke and to increase the cleanness of the air.
The standard ventilation (outdoor air intake) volume is determined according to the type of application, estimated
number of persons in the room, room area, and relevant regulations. Systems which accurately facilitate these
requirements are increasingly being required to be installed in buildings.
3.1 Necessity of Ventilation
The purpose of ventilation is basically to supply oxygen, clean the air and control the temperature and humidity.
Cleaning the air includes the elimination of odors, gases, dust and bacteria. Ventilation fills fundamental needs
such as providing personal comfort and ensuring the necessary environment for the animals, plants and
equipment in the area.
3.1.1 Effect of air contamination on human bodies
Effect of oxygen (O2) concentration
Concentration (%) Standards and effect of concentration changes
Approx. 21 Standard atmosphere.
20.5
Ventilation air volume standard will be a guideline where concentration does not decrease more than 0.5%
from normal value. (From Japanese building code)
20 - 19
An oxygen deficiency of this amount does not directly endanger life in a normal air pressure, but if there is a
combustion device in the area, the generation of CO will increase rapidly due to incomplete combustion.
18 Japanese Labor Safety and Sanitation Law standards. (Hypoxia prevention regulations.)
16 Normal concentration in exhaled air.
16 - 12 Increase in pulse and breathing resulting in dizziness and headaches.
15 Flame in combustion devices will extinguish.
12 Threat to life in short term.
7 Fatal
Page 53

Concentration (ppm)
Effect of concentration changes
0.01 - 0.2 Standard atmosphere.
5 Considered to be the long-term tolerable value.
10
From Japanese building code, Building Management Law standards.
Environmental standard 24-hour average.
20
Considered to be the short-term tolerable value.
Environmental standard 8-hour average.
50
Tolerable concentration for labor environment.
(Japan Industrial Sanitation Association)
100
No effect for 3 hours. Effect noticed after 6 hours.
Headache, illness after 9 hours; harmful for long-term but not fatal.
200 Light headache in the forehead in 2 to 3 hours.
400 Headache in the forehead, nausea in 1 to 2 hours; headache in the back of head in 2.5 to 3 hours.
800 Headache, dizziness, nausea, convulsions in 45 minutes. Comatose in 2 hours.
1,600 Headache, dizziness in 20 minutes. Death in 2 hours.
3,200 Headache, dizziness in 5 to 10 minutes. Death in 30 minutes.
6,400 Death in 10 to 15 minutes.
12,800 Death in 1 to 3 minutes.
Several 10,000 ppm
(Several %)
This level may be found in automobile exhaust.
Effect of carbon dioxide (CO2)
Concentration (%) Effect of concentration changes
0.03 (0.04) Standard atmosphere.
0.04 - 0.06 City air.
0.07 Tolerable concentration when many people stay for long time.
0.10
General tolerable concentration.
From Japanese building code, Building Management Law standards
0.15 Tolerable concentration used for ventilation calculations.
0.2 - 0.5 Considered as relatively poor.
0.5 or more Considered as the poorest.
0.5 Long-term safety limits (U.S. Labor Sanitation) ACGIH, regulation of laborer offices.
2 Depth of breathing and inhalation volume increases 30%.
3Work and physical functions deteriorate, breathing doubles.
4 Normal exhalation concentration.
4 - 5
The respiratory center is stimulated; depth and times of breathing increases. Dangerous if breathed in for a
long period. If an O
2 deficiency also occurs, trouble will occur sooner and be more dangerous.
8
When breathed in for 10 minutes, breathing difficulties, redness in the face and headaches will occur.
The trouble will worsen when there is also a deficiency of O
2.
18 or more Fatal
Apprpx. 5 ppm is
an annual
average value in
city areas.
This value may
exceed 100 ppm
near roads, in
tunnels and
parking areas.
51
CHAPTER 2 ● Air Conditioning System Design Section
Effect of carbon monoxide (CO)
10,000 ppm = 1%
There is no toxic level in
CO2 alone.
However, these tolerable
concentrations are a
guideline of the
contamination estimated
when the physical and
chemical properties of
the air deteriorate in
proportion to the increase
of CO2.
Note: According to Facility Check List published by Kagekuni-sha.
3.1.2 Effect of air contamination in buildings
Dirtiness of interior
New ceilings, walls and ornaments will turn yellow in one to two years. This is caused by dust and the tar in
tobacco smoke.
Page 54

52
CHAPTER 2 ● Air Conditioning System Design Section
3.2 Ventilation Method
3.2.1 Ventilation class and selection points
An appropriate ventilation method must be selected according to the purpose.
Ventilation is composed of “Supply air” and “Exhaust air” functions. These functions are classified according to
natural flow or mechanical ventilation using a fan (forced ventilation).
Classification of mechanical ventilation
Classification of ventilation (according to Building Standards Law)
Supply Exhaust Ventilation volume Room pressure
Class 1 Mechanical Mechanical Random (constant) Random
Class 2 Mechanical Natural Random (constant) Positive pressure
Class 3 Natural Mechanical Random (constant) Negative pressure
Class 4 Natural Mechanical & natural Limited (inconstant) Negative pressure
1. Class 1 ventilation
Fresh outdoor air is mechanically
brought in and simultaneously the
stale air in the room is mechanically
discharged.
2. Class 2 ventilation
Fresh outdoor air is mechanically
brought in and the exhaust air is
discharged from the exhaust air
outlet (natural).
3. Class 3 ventilation
The stale air in the room is
mechanical-ly discharged and
simultaneously fresh outdoor air is
mechanically introduced from the
supply air diffuser (natural).
Ex. of application
•Ventilation of air
conditioned rooms.
(buildings, hospitals,
etc.)
•Ventilation of room
not facing an outer
wall. (basement,
etc.)
•Ventilation of large
room. (office, large
conference room,
hall, etc.)
• Operating room.
• Clean rooms.
• Foodstuff processing
factories.
• Local ventilation in
kitchens.
•Ventilation of hot
exhaust air from
equipment rooms,
etc.
•Ventilation of humid
exhaust air from
indoor pools, bathrooms, etc.
• General simple
ventilation.
System effect
By changing the
balance of the supply
fan and exhaust fan’s
air volumes, the
pressure in the room
can be balanced
freely, and the
interrelation with
neighboring spaces
can be set freely.
As the room is
pressurized, the flow
of odors and dust,
etc., from neighboring
areas can be
prevented.
The exhaust air is
removed from a local
position in the room,
and applying an even
negative pressure can
prevent dispersion of
the stale air.
Design and construction
properties
•
An ideal design in which
the supply air diffuser
and exhaust air outlet
position relation and air
volume, etc., can be set
freely is possible.
•A system which adjusts
the temperature and
humidity of the supply
air diffuser flow to the
room environment can
be incorporated.
•
The supply and
exhaust volume can be
set freely according to
the changes in
conditions.
• The position and
shape of the supply
air diffuser can be
set.
• The temperature and
humidity of the
supply air diffuser
flow can be set
accordingly, and
dust can be removed
as required.
•Effective exhausting
of dispersed stale air
generation sites is
possible from a local
exhaust air outlet.
•Ventilation in which
the air flow is not felt
is possible with the
supply air diffuser
setting method.
Selection points
• Accurate supply air
diffuser can be
maintained.
• The room pressure
balance can be
maintained.
• The supply air
diffuser temperature
and humidity can be
adjusted and dust
treatment is
possible.
• The pressure is
positive.
•
The supply air diffuser
temperature and
humidity can be
adjusted, and dust
treatment is possible.
•
The positional relation
of the exhaust air
outlet to the supply air
diffuser is important.
• The room pressure
is negative.
•Local exhaust is
possible.
•Ventilation without
dispersing stale air is
possible.
•Ventilation with
reduced air flow is
possible.
•
The positional relation
of the exhaust air
outlet to the supply air
diffuser is important.
Supply
air
diffuser
Exhaust
fan
Exhaust
air
outlet
Exhaust
fan
Exhaust
fan
Stale
air
Fresh
outdoor
air
Page 55

53
CHAPTER 2 ● Air Conditioning System Design Section
3.2.2 Comparison of ventilation methods
There are two main types of ventilation methods.
Centralized ventilation method
This is mainly used in large buildings, with the fresh outdoor air intake being provided within a single equipment
room. For this method, primary treatment of the fresh outdoor air, such as heat exchange to the intake air and
dust removal is performed before distribution to the building by ducts.
Independent zoned ventilation method
This is mainly used in small to medium sized buildings, where the areas being ventilated use independent devices
for fresh outdoor air intake. The rate of use of this method has recently increased as independent control is
becoming ever more feasible.
Centralized ventilation method Independent zoned ventilation method
(1) System using Lossnay and cassette-type air conditioner
(2) System using Lossnay and ceiling recessed-type air conditioner
(3) System using OA processing unit
Air intake
(Fresh outdoor air)
Exhaust fan
Supply fan
Building use Lossnay
Heat source etc.
Exhaust air
(Stale air)
Cassette-type package air
conditioner or fan coil unit
Ceiling recessed-type
Lossnay
Exhaust air
Fresh outdoor air
Finished ceiling
Return grille
Ceiling embedded-type package
air conditioner fan coil unit
Ceiling recessed-type
Lossnay
Exhaust air
Fresh outdoor air
Finished ceiling
Return grille
OA processing unit
Page 56

54
CHAPTER 2 ● Air Conditioning System Design Section
3.2.3 Comparison of types of air conditioning systems
Comparison of centralised ventilation method and independent zoned ventilation method
Centralized ventilation method
The air transfer distance is long thus requiring
much fan power.
• Independent equipment room is required.
• Duct space is required.
• Penetration of floors with vertical shaft is not
desired in terms of fire prevention.
Generalized per system.
• Design of outer wall is not lost.
• The indoor supply air diffuser and return grille
can be selected freely for an appropriate design.
As there are many common-use areas, if the
building is a tenant building, an accurate
assessment of operating cost is difficult.
• As the usage time setting and ventilation volume
control, etc., is performed in a central monitoring
room, the user’s needs may not be met
appropriately.
•A large amount of ventilation is required even for
a few persons.
• An ideal supply air diffuser and return grille
position can be selected as the supply air
diffuser and return grilles can be laid out freely.
• The only noise in the room is the aerodynamic
sound.
•
Anti-vibration measures must be taken as the fan
in the equipment room is large.
• Centralized management is easy as it can be
performed in the equipment room.
• The equipment can be inspected at any time.
• Large as the entire system is affected.
• Immediate inspection can be performed in the
equipment room.
Fan power
Installation space
Zoning
Designability
Independent invoicing of
electricity
Controllability
Comfort
Maintenance and
management
Affect of breakdown
Independent zoned ventilation method
As the air transfer distance is short, the fan power
is small.
• Independent equipment room is not required.
• Piping space is required only above the ceiling.
Can be utilised for any one area.
•The number of intakes and exhaust air outlets on
the outer wall will increase; design must be
considered.
• The design will be fixed due to the installation
fittings, so the design of the intakes and exhaust
air outlets must be considered.
Invoicing for each zone separately is possible,
even in a tenant building.
• The user in each zone can operate the ventilator
freely.
• The ventilator can be operated even during off-
peak hours.
• Consideration must be made of the noise from
the main unit.
• Anti-vibration measures are often not required as
the unit is compact and the vibration generated
can be dispersed.
•Work efficiency is poor as the equipment is not
centrally located.
•
An individual unit can be inspected only when the
room it serves is vacant.
• Limited as only independent units are affected.
• Consultation with the tenant is required prior to
inspection of an individual unit.
Page 57

55
CHAPTER 2 ● Air Conditioning System Design Section
3.3 Outdoor Air (Ventilation) Load
3.3.1 How to calculate each approximate load
The outdoor air load can be calculated with the following formula if the required outside air intake volume Q m3/h
to be introduced is known:
(Outdoor air load) = γ · QF · (iO to iR)
= γ [kg/m3] × S [m2] × k × n [person/m2] × Vf [m3/h·person] × (iO to iR): ∆ i [kJ/kg]
γ : Specific gravity of air – 1.2 kg/m
3
S:Building’s airconditioned area
k:Thermal coefficient; generally 0.7 to 0.8.
n:The average population concentration is the inverse of the occupancy area per person. If the number of
persons in the room is unclear, refer to the Floor space per person table below.
Vf : Outdoor air intake volume per person
Refer to the “Required outdoor air intake volume per person” table shown below.
iO : Outdoor air enthalpy – kJ/kg
iR : Indoor enthalpy – kJ/kg
Floor space per person table (m
2
)
(According to the Japan Federation of Architects and Building Engineers Associations)
Department store, shop
Office building
Average Crowded Empty
Restaurant Theatre or cinema hall
General 4 - 7 0.5 - 2 0.5 - 2 5 - 8 1 - 2 0.4 - 0.6
design value 5 3.0 1.0 6.0 1.5 0.5
Required outdoor air intake volume per person table (m3/h·person)
Application example
Required ventilation volume
Degree of smoking
Recommended value Minimum value
Broker’s office
Extremely heavy Newspaper editing room 85 51
Conference room
Quite heavy
Bar
51 42.5
Cabaret
Heavy
Office 25.5 17
Restaurant 25.5 20
Light
Shop
25.5 17
Department store
None
Theatre 25.5 17
Hospital room 34 25.5
Caution
The application of this table to each type of room should be carefully considered in relation to the degree of
smoking in the room.
Page 58

56
CHAPTER 2 ● Air Conditioning System Design Section
Example calculations of determining ventilation load during both cooling and heating are given as follows:
3.3.2 Ventilation load during cooling (in general office building)
●
Classification of cooling load
Class
Heat from walls (q
WS)
(a) Indoor infiltration heat Heat from glass
from direct sunlight (q
GS)
from conduction & convection (q
GS)
Accumulated heat load in walls (q
SS)
Generated heat from people
Sensible heat (q
HS)
(b) Indoor generated heat
Latent heat (q
HL)
Genarated heat from electrical equipment Sensible heat (q
ES)
Latent heat (q
EL)
(c) Reheating load (q
RL)
(d) Outdoor air load
Sensible heat (q
FS)
Latent heat (q
FL)
}
}
}
}
(a) is the heat infiltrating the room, and often is 30 to 40% of the entire cooling load.
(b) is the heat generated in the room.
(c) is applies only when reheating is necessary.
(d) is the heat generated when outdoor air is mixed into part of the supply air diffuser volume and introduced into
the room.
The outdoor air is introduced to provide ventilation for the people in the room, and is referred to as the ventilating
load.
Typical load values (during cooling)
Type of load Load
Outdoor air load 53.0 W/m
2
Indoor
People 26.4 W/m
2
generated heat
Lighting equipment 30.0 W/m
2
Indoor infiltration heat 47.6 W/m
2
Total 157.0 W/m
2
Conditions: Middle floor of a general office building facing south.
Outdoor air load
33.8%
53.0 W/m
2
Indoor
infiltration
heat
30.3%
47.6 W/m
2
Indoor
generated heat
(People, lighting equipment)
35.9%
56.4 W/m
2
157.0 W/m
2
●
Determining internal heat gain
When classifying loads, the internal heat gain (indoor generated heat + indoor infiltration heat) will be the value of
the outdoor air load subtracted from the approximate cooling load when it is assumed that there is no reheating
load.
(Internal heat gain)
= 157.0 W/m2– 53.0 W/m2= 104.0 W/m
2
This value of internal heat gain is based on assumptions for typical loads. To determine individual levels of
internal heat gain, the following is suggested:
Page 59

57
CHAPTER 2 ● Air Conditioning System Design Section
Dry bulb temp.
Relative humidity
Wet bulb temp. Enthalpy
Enthalpy difference
Cooling
Outdoor air 33°C 63% 27°C 85 kJ/kg
31.8 kJ/kg
Indoors 26°C 50% 18.7°C 53.2 kJ/kg
When the load per floor area of 1 m2with a ventilation volume of 25 m3/h·person is calculated with the above air
conditions, the following is obtained:
Outdoor air (ventilation) load = 1.2 kg/m3(Specific gravity of air) × 0.2 persons/m2(no. of persons per 1 m2)
× 25 m3/h·person (outdoor air volume) × 31.8 kJ/kg (air enthalpy difference indoors/outdoors)
× 0.2777 (1,000 W/3,600 sec.) = 53.0 W/m
2
●
Indoor generated heat
(1) Heat generated from people
Heat generation design value per person in office
Sensible heat (SH) = 63.0 W/person
Latent heat (LH) = 69.0 W/person
Total heat (TH) = 132.0 W/person
The heat generated per 1 m2of floor space is
(Heat generated from people)
= 132.0 W/person × 0.2 person/m2= 26.4 W/m
2
(2) Heat generated from electrical equipment (lighting)
The approximate value of the room illuminant and power for lighting for a general office with illumination of
300 to 350 Lux, is 20 to 30 W/m2.
Note that the heat generated for each watt of electrical power consumption is 1.2 W for fluorescent lights,
including the heat generated by the ballast. The following should be considered as the generated heat
volume in terms of average of electrical power used for illumination.
(Heat generated by lighting fixtures)
= 25 W/m3× 1.2 W
= 30 W/m
3
●
Indoor infiltration heat
This is the heat that infiltrates into the building from outside. This can be determined by subtracting the amount of
heat generated by people and lighting from the internal heat gain.
(Indoor infiltration heat)
= 104.0 – (26.4 + 30.0) = 47.6 W/m
2
Cooling load per unit area
When the volume of outdoor air per person is 25 m3/h, and the number of persons per 1 m2is 0.2, the cooling
load will be approximately 157.0 W/m2.
How these values are determined can be seen as follows:
●
Outdoor air load
Air conditions <Standard design air conditions in Tokyo>
Lossnay recovers approximately 70% of the exhaust air load and saves on approximately 20% of
the total load.
Page 60

Type of load Load
Outdoor air load 56.0 W/m
2
Internal heat loss 77.7 W/m
2
Total 133.7 W/m
2
58
CHAPTER 2 ● Air Conditioning System Design Section
3.3.3 Ventilation load during heating
●
Classification of heating load
Class
Heat lost from walls (q
WS)
(a)
Indoor heat
Heat lost from glass (q
GS)
loss
Heat loss from conduction & convection (q
GS)
Accumulated heat load in walls (q
SS)
(b)
Outdoor air
Sensible heat (q
FS)
load
Latent heat (q
FL)
During heating, the heat generated by people and electrical equipment in the room can be subtracted from the
heating load.
However, as the warming up time at the start of heating is short, this generated heat may be ignored in some
cases.
Percentage of load
Internal heat loss
In terms of load classification, the internal heat loss is the value of the outdoor air load subtracted from the
approximate heating load.
(Internal heat loss)
= 133.7 W/m
2
– 56.0 W/m2= 77.7 W/m
2
Heating load per unit area
When the outdoor air volume per person is 25 m3/h, and the number of persons per 1 m2is 0.2 persons, the
approximate heating load will be approximately 133.7 W/m2.
●
Outdoor air load
Air conditions <Standard design air conditions in Tokyo>
Conditions: Middle floor of a general office building facing south.
When the load per 1 m2of floor area with a ventilation volume of 25 m3/h·person is calculated with the above air
conditions, the following is obtained:
Outdoor air (ventilation) load = 1.2 kg/m3× 0.2 persons/m2× 25 m3/h·person × 33.5 kJ/kg
× 0.2777 (1,000 W/3,600 sec.) = 56.0 W/m
2
Lossnay recovers approximately 70% of the exhaust air load and saves on approximately 30% of
the total load.
Outdoor (air
load) air load
41.9%
56.0 W/m
2
Indoor (heat
loss) heat loss
58.1%
77.7 W/m
2
133.7 W/m
2
Dry bulb temp.
Relative humidity
Wet bulb temp. Enthalpy
Enthalpy difference
Heating
Outdoor air 0°C 50% –3°C 5 kJ/kg
33.5 kJ/kg
Indoors 20°C 50% 13.7°C 38.5 kJ/kg
Page 61

59
CHAPTER 2 ● Air Conditioning System Design Section
3.4 Ventilation Performance
The ventilation performance is largely affected by the installation conditions. Ample performance may not be
achieved unless the model and usage methods are selected according to the conditions.
Generally, the ventilation performance is expressed by “Air volume” and “Air flow pressure (static pressure)”, and
these are necessary when considering ventilation.
3.4.1 Air volume
Air volume expresses the volume of air exhausted (or supplied) by the unit in a given period. Generally, this is
expressed as m3/hr (hour).
3.4.2 Air flow pressure
When a piece of paper is placed in front of a fan and let go, the piece of paper will be blown away. The force that
blows the paper away is called the wind pressure (air flow pressure), and this is normally expressed in units of
Pa. The air flow pressure is divided into the following three types:
(1) Static pressure
This is the force that presses the surroundings when the air is not moving such as in an automobile tire or
rubber balloon. For example, in a water gun, the hydraulic pressure increases when pressed by a piston –
and if there is a small hole, the water sprays out with force. The pressure of this water is equivalent to the
static pressure for air. The higher the pressure is, the further the water (air) can be sprayed.
(2) Dynamic pressure
This expresses the speed at which air flows, and can be thought of as the force at which a typhoon presses
against a building.
(3) Total pressure
This is the total force that air flow has, and is the sum of the static pressure and dynamic pressure.
3.4.3 Measurement of the air volume and air flow pressure
Mitsubishi measures the unit’s air volume and air flow pressure with a device as shown below according to the
Japan Industrial Standards (JIS C 9603).
Measuring device (JIS C 9603 standards)
Test machine
Chamber
Static pressure in chamber
(Static pressure measurement)
Rectifying net
Wind dispersing plate
Wind gauge
duct path
Orifice
Rectifying grid
Auxiliary fan
Throttle device
Pressure difference
before and after orifice
(Air volume measurement)
Page 62

60
CHAPTER 2 ● Air Conditioning System Design Section
Measurement method
The unit is operated with the throttle device fully closed. There is no air flow at this time, and the air volume is 0.
The maximum point of the static pressure (A point, the static pressure at this point is called the totally closed
pressure) can be obtained. Next, the throttle device is gradually opened, the auxiliary fan is operated, and the
middle points (points B, C and D) are obtained. Finally, the throttle device is completely opened, and the auxiliary
fan is operated until the static pressure in the chamber reaches 0. The maximum point of the air volume (point E,
the air volume at this point is called the fully opened air volume) is obtained. The points are connected as shown
below, and are expressed as air volume, static pressure curves (Q-H curve).
Static pressure (
H
)
Air volume (Q)
Page 63

61
CHAPTER 2 ● Air Conditioning System Design Section
4. Characteristics
4.1 How to Read the GUF Series OA Processing Unit
Characteristic Curves
4.1.1 Obtaining characteristics from static pressure loss
(1) Static pressure loss from straight pipe duct length (at required air volume)
(2) Static pressure loss at curved section (at required air volume)
(3) Static pressure loss of related parts (at required air volume)
Total static pressure loss
4.1.2 Calculation of duct pressure loss
When selecting a model that is to be used with a duct, calculate the volumes according to Tables 3, 4, 5 and 6,
and then select the unit according to the air volume and static pressure curve.
(2) How to obtain the duct resistivity
Table 4 Circular duct friction loss (steel plate duct,
inner roughness ε = 0.18 mm)
(1) Calculation of a rectangular pipe
Table 3 Conversion table from rectangular pipe to
circular pipe
1
1234567891011121314151617
2
3
4
5
6
7
8
9
10
11
12
13
14
15
16
17
18
19
20
21
21
20
19
18
17
16
15
14
13
12
11
10
9
8
7
6
22
23
24
25
5
4
3
2
1
100
200
400
600
800
1 000
2 000
4 000
6 000
8 000
10 000
20 000
40 000
60 000
80 000
100 000
200 000
400 000
600 000
800 000
1 00 0000
9
8
7
6
5
18
16
14
12
10
25
20
35
30
45
40
250
200
350
300
90
80
70
60
50
180
160
140
120
d=100cm
d=400cm
d=500cm
2.0
3
10
20
30
40
50
100
20
0
4
5
6
7
8
9
10
15
20
25
30
40
6
7
8
9
10
15
20
25
30
40
V=50m/s
V=50
How to read Table 3
Select the unit as per each duct. In the above example, the ¤520
rectangular pipe only goes as far as 17. Thus, the long side, short side
and converted circular pipe values are all multiplied by 100. The point
560 where the two lines cross is hence the value where the rectangular
pipe equates to the circular pipe.
How to read Table 4
The point where the line of the circular duct diameter (leftward
slanting line) and of the required air velocity (horizontal line)
intersect is the pressure loss per 1 m of duct.
The value of the slanted line to the lower right of the intersecting
point is the average velocity.
Estimated static pressure loss curve
obtained from 1 and 2
Long side of
rectangular pipe
Circular pipe diameter
The circular pipe diameter having equal hydraulic radius
Short side of
rectangular pipe
3
Air volume
Static
pressure
4 Intersection with air volume static
pressure characteristic curve
5 Air volume at application point
2 Total static
pressure loss
6 Static pressure loss at
application point
1 Required air
volume
Air volume (m
3
/h)
Friction loss (Pa/m)
0.1 0.2 0.4 0.60.8 1.0 2.0 4.0 6.0 8.010 20 30 40 5060 80100
Friction loss
0.1 0.2 0.4 0.60.8 1.0 2.0 4.0 6.0 8.010 20 30 40 5060 80100
2.0
5.2
5.2
Page 64

62
CHAPTER 2 ● Air Conditioning System Design Section
The figure obtained from Table 4 must then be corrected for duct type at various velocities. This can be done
using Table 5 below.
Table 5 Friction coefficient compensation table
An alternative, more detailed method for determining the pressure loss in duct work is as shown using the
following formula:
Duct inner surface Example
Average velocity (m/sec)
5101520
Very rough surface Concrete finish 1.7 1.8 1.85 1.9
Rough Mortar finish 1.3 1.35 1.35 1.37
Very smooth Drawn steel pipe Vinyl pipe 0.92 0.85 0.82 0.8
Circular pipe section pressure loss
∆p = λ
·· ·
v2(Pa)
∆p = C
··
v2(Pa)
= 0.6 C ·v
2
λ : Friction resistance coefficient (smooth pipe 0.025)
C:Local loss coefficient (refer to Table 6)
d:Duct diameter (m)
: Duct length (m)
ρ
: Air weight (1.2 kg/m2)
v:Wind velocity (m/s)
R
d
ρ
2
ρ
2
R
Page 65

63
CHAPTER 2 ● Air Conditioning System Design Section
(3) How to calculate curved sections
Table 6 List of pressure losses in each duct section
Duct
No.
section
Outline diagram
Conditions
C
value
R/D = 0.5 0.73 43D
90° =
0.75
0.38 23D
1 Smooth = 1.0 0.26 15D
Elbow = 1.5 0.17 10D
= 2.0 0.15 9D
W/D R/D
0.5 0.5 1.30 79D
0.75 0.47 29D
Rectangular 1.0 0.28 17D
2 Radius 1.5 0.18 11D
Elbow 1-3 0.5 0.95 57D
0.75 0.33 20D
1.0 0.20 12D
1.5 0.13 8D
R/D
1 0.5 0.70 42D
Rectangular
0.75 0.16 10D
Vaned
1.0 0.13 8D
3
Radius
1.5 0.12 7D
Elbow
2 0.5 0.45 27D
0.75 0.12 7D
1.0 0.10 6D
1.5 0.15 9D
90°
4 Miter 0.87 53D
Elbow
Rectangular
5
Square
1.25 76D
Square
Elbow
Rectangular
6
Vaned
0.35 21D
Square
Elbow
Rectangular
7
Vaned
Square
Junction
Same loss as circular duct.
Rectangular
Velocity is based on inlet.
8
Vaned
Radius
Junction
45°
9 Smooth
Elbow
a = 5° 0.17 10D
10° 0.28 17D
20° 0.45 27D
10 Expansion 30° 0.59 36D
40° 0.73 43D
Loss is for
hV
1 - hV2
a = 30° 0.02 1D
45° 0.04 2D
11 Contraction 60° 0.07 4D
Loss is for
V
2
Length of
equivalent
circular
pipe
No. of
vanes
With or without
vanes,
rectangular or
circular
1/2 times value
for similar 90°
Duct
No.
section
Outline diagram
Conditions
C
value
12 Transformer 0.15 9D
Abrupt
13
Entrance
0.50 30D
Abrupt
14
Exit
1.0 60D
Bellmouth
15
Entrance
0.03 2D
Bellmouth
16
Exit
1.0 60D
Re-entrant
17
inlet
0.85 51D
V
1/
V2 = 0 2.8 170D
0.25 2.4 140D
Sharp edge
0.50 1.9 110D
18
round orifice
0.75 1.5 90D
1 1.0 60D
Loss is for
V
2
20° 0.02
Pipe inlet
40° 0.03
19
(with
β 60° 0.05
circular
90° 0.11
hood)
120° 0.20
20° 0.03
Pipe inlet
40° 0.08
20
(with
β 50° 0.12
rectangular
90° 0.19
hood)
120° 0.27
V
1/V2 = 0 0.5 30D
0.25 0.45 27D
Abrupt
0.50 0.32 19D
21
contraction
0.75 0.18 11D
Loss is for
V
2
V1/V2 = 0 1.0 60D
0.20 0.64 39D
Abrupt
0.40 0.36 22D
22
expansion
0.60 0.16 9D
0.80 0.04 2D
Loss is for
V
1
Suction
inlet
0.2 35
23 (punched
0.4 7.6
narrow
0.6 3.0
plate)
0.8 1.2
Length of
equivalent
circular
pipe
Free are ratio
14° or less
D
Page 66

64
CHAPTER 2 ● Air Conditioning System Design Section
5. Lossnay Core Effect
5.1 Calculation of the Total Heat Recover Efficiency
The Lossnay Core’s heat recover efficiency can be
evaluated using the following three transfer rates:
1) Temperature (sensible heat) recover efficiency
2) Humidity (latent heat) recover efficiency
3) Enthalpy (total heat) recover efficiency
The heat recovery effect can be calculated if two of the
above efficiencies is known. (The temperature and
enthalpy efficiencies is indicated in the applicable
catalogue.)
●
Each recover efficiency can be calculated with the
formulas given below.
●
When the supply air volume and exhaust air volume are
equal, the heat exchange efficiencies on the supply and
exhaust sides are the same.
●
When the supply air volume and exhaust air volume are
not equal, the total heat recover efficiency is low if the
exhaust volume is lower, and high if the exhaust volume is
higher.
Refer to the efficiency correction graph in the applicable
catalogue for more details.
Item Formula
Temperature heat
exchange ηt =
t (
OA) - t (SA)
× 100
efficiency (%)
t (
OA) - t (
RA)
Enthalpy heat
exchange ηi =
i (
OA) - i (SA)
× 100
efficiency (%)
i (
OA) - i (RA)
η :Efficiency (%)
t: Dry bulb temperature (°C)
i:Enthalpy (kJ/kg)
Calculation of air conditions after passing through Lossnay Core
If the Lossnay Core heat exchange efficiency and the conditions of the room and outdoor air are known, the
conditions of the air entering the room and the air exhausted outdoors can be determined with the following
formulas.
When the Lossnay Core efficiency is found using a characteristics graph and if the amount of supply and exhaust
air is uneven, the efficiency will be different. In such cases, use the efficiency correction graph.
Supply side Exhaust side
Temperature t
SA = tOA – (tOA – tRA) · ηttEA = tRA + (tOA – tRA) · ηt
Enthalpy i
SA = iOA – (iOA – iRA) · ηiiEA = iRA + (iOA – iRA) · ηi
SA
Supply air
(Fresh cold or warm air)
RA
Return air
(Stale cold or warm air)
Indoors Outdoors
EA
Exhaust air
(Stale air)
OA
Outdoor air
(Fresh air)
Page 67

65
CHAPTER 2 ● Air Conditioning System Design Section
5.2 What is a Psychrometric Chart?
The chart which shows the properties of humid air is called a psychrometric chart. The psychrometric chart can
be used to find the (1) Dry bulb temperature, (2) Wet bulb temperature, (3) Absolute humidity, (4) Relative
humidity, (5) Dew point and (6) Enthalpy of a certain air condition. If two of these values are known beforehand,
the other values can be found with this chart. The way that the air will change when it is heated, cooled,
humidified or dehumidified can also be seen easily on the chart.
(1) Dry bulb temperature t (°C)
Generally referred to as standard temperature this is
measured with a dry bulb thermometer (conventional
thermometer). The obtained value is the dry bulb
temperature.
(2) Wet bulb temperature t’ (°C)
When a dry bulb thermometer’s heat sensing section is
wrapped in a piece of wet gauze and an ample air flow
(3 m/s or more) is applied, the heat applied to the wet
bulb by the air and the heat of the water vapor that
evaporates from the wet bulb will balance at an equal
state. The temperature indicated at this time is called
the wet bulb temperature.
(3) Absolute humidity × (kg/kg’)
The weight (kg) of the water vapor that corresponds to
the weight (kg’) of the dry air in the humid air is called
the absolute humidity.
(4) Relative humidity ϕ (%)
The ratio of the water vapor pressure Pw in the humid
air and the water vapor pressure Pws in the saturated
air at the same temperature is called the relative
humidity. This is obtained with the following formula:
ϕR = PW/PWS × 100
(5) Dew point t” (°C)
The water content in the air will start to condense when
air is cooled.
The dry bulb temperature at this time is called the dew
point.
(6) Enthalpy i (kJ/kg)
Physical matter has a set heat when it is at a certain
temperature and state. This retained heat is called the
enthalpy, with dry air at 0°C being set at 0.
Temperature (°C)
Absolute humidity × (kg/kg’)
Wet bulb temperature
(dew point) t’ (°C)
Relative humidity ϕ (%)
The dew point t” of the air at point A is the
temperature of the point at the same absolute humidity
as point A on the saturation curve.
t” °C dew point
Enthalpy i (kJ/kg)
A
t”
Parallel to absolute
temperature scale line
Page 68

66
CHAPTER 2 ● Air Conditioning System Design Section
5.3 Calculation of Lossnay Core Heat Recovery
The following figure shows the conditions of various air states when fresh air is introduced through the Lossnay
Core. If a sensible heat recovery unit is used alone and is assumed to have the same heat recover efficiency as
Lossnay Core, the condition of the air supplied to the room is expressed by point A in the figure. This point shows
that the air is very humid in summer and very dry in winter.
The air supplied to the room with Lossnay Core is indicated by point S in the figure. The air is precooled and
dehumidified in the summer and preheated and humidified in the winter before it is introduced to the room.
iSA
iOA
tOA tSA
A
S
O
R
i
RA
iSA
iOA
tRA tRA
S
R
AO
t
SA tOA
XOA
XSA
XRA
XRA
XSA
XOA
iRA
The quantity of heat recovered by using the Lossnay Core can be calculated with the following formula.
Total heat recovered: qT = γ · Q · (iOA - iSA) [W]
= γ · Q · (iOA - iRA) × ηi
Where γ = Specific weight of air under standard conditions 1.2 (kg/m3)
Q= Treated air volume (m3/h)
t=Temperature (°C)
x=Absolute humidity (kg/kg’)
i=Enthalpy (kJ/kg)
η = Exchange efficiency (%)
●
Suffix meanings
OA : Outdoor air
RA : Return air
SA : Supply air
Enthalpy (kJ/kg)
Outdoor air load
Lossnay Core heat recovery
Enthalpy (kJ/kg)
Outdoor air load
Lossnay Core heat recovery
Outdoor air
condition in
winter
Supply air condition of
the Lossnay
Supply air condition of
the Lossnay
Room air
condition
in summer
Outdoor air condition
in summer
Absolute
humidity (kg/kg’)
Room air condition in winter
Dry bulb temperature (°C)
Page 69

67
CHAPTER 2 ● Air Conditioning System Design Section
iOA
iSA
iRA
tOAtSAtRA
R
S
AO
X
OA
XSA
XRA
5.4 Lossnay Core Heat Recovery Effect
Comparison of outdoor air load of various ventilators
Examples of formulas to compare the heat recovered and outdoor air load when ventilating with the Lossnay (total
heat recovery ventirator), sensible heat recovery ventirator and conventional ventilators are shown below.
(1) Cooling during summer
Conditions:
●
Model GUF-100RDH3
●
Heat exchange efficiency table (%)
(For summer)
●
Ventilation rate: 1,000 m3/h
(Specific gravity of air γ = 1.2 kg/m3)
Lossnay Sensible HRV
Conventional
ventilator
Temperature
(sensible heat)
79 75 0
Enthalpy
(total heat)
64.5 — 0
●
Lossnay
(Supply air diffuser temperature) t
SA = 32°C – (32°C – 27°C) × 0.79 = 28.1°C
(Supply air diffuser enthalpy) i
SA = 86.2 – (86.2 – 55.3) × 0.645 = 66.6 kJ/kg
Heat recovered (86.2 – 66.6) × 1.2 × 1,000 × 0.2777
+
= 6,532 W
Outdoor air load (66.6 – 55.3) × 1.2 × 1,000 × 0.2777
+
= 3,766 W
●
Sensible HRV
(Supply air diffuser temperature) t
SA = 32°C – (32°C – 27°C) × 0.75 = 28.3°C
(Supply air diffuser enthalpy) i
SA = 82.5 kJ/kg (from psychrometric chart)
Heat recovered (86.2 – 82.5) × 1.2 × 1,000 × 0.2777
+
= 1,230 W
Outdoor air load (82.5 – 55.3) × 1.2 × 1,000 × 0.2777
+
= 9,064 W
●
Conventional ventilator
If a conventional ventilator is used, the heat recovered will be 0 as the supply air
diffuser is equal to the outdoor air.
The outdoor air load is:
(86.2 – 55.3) × 1.2 × 1,000 × 0.2777
+
= 10,297 W
+
Conversion Factor (1,000 W/3,600 sec.)
Calculation example Summer conditions
Supply air
Room air
Air
conditioner
Lossnay Sensible HRV
Conventional
ventilator
Dry bulb
temperature
Absolute
humidity
Relative
humidity
Enthalpy
27°C
28.1 28.3 32
15.0 21.1 21.1
62.8 86.5 70
66.6 82.5 86.2
6,532 1,230 0
3,766 9,064 10,297
37 88 100
11.1 g/kg’
50%
55.3 kJ/kg
Outdoor air
0.0211
Absolute humidity (kg/kg’)
Room air condition in summer
Outdoor air condition
in summer
Supply air condition
of the Lossnay Core
0.0150
0.0111
27
86.2
66.6
55.3
28.1
Dry bulb temperature (°C)
Lossnay Core heat recovery
Outdoor air load
Enthalpy (kJ/kg)
32
Exhaust air
Dry bulb
temperature
Absolute
humidity
Relative
humidity
Enthalpy
32°C
21.1 g/kg’
70%
86.2 kJ/kg
Dry bulb temperature (°C)
Absolute humidity (g/kg’)
Relative humidity (%)
Enthalpy (kJ/kg)
Outdoor air load (W)
Outdoor air load ratio (%)
Total heat recovered (W)
Page 70

68
CHAPTER 2 ● Air Conditioning System Design Section
(2) Heating during winter
Conditions:
●
Model GUF-100RDH3
●
Heat exchange efficiency table (%)
(For winter)
●
Ventilation rate: 1,000 m3/h
(Specific gravity of air γ = 1.2 kg/m3)
Lossnay Sensible HRV
Conventional
ventilator
Temperature
(sensible heat)
79 75 0
Enthalpy
(total heat)
70 — 0
●
Lossnay
(Supply air diffuser temperature) t
SA
=
(21°C – 0°C) × 0.79+ 0°C = 16.6°C
(Supply air diffuser
enthalpy) iSA = (40.6 – 4.6) × 0.7+ 4.6
= 29.7 kJ/kg
Heat recovered (29.7 – 4.6) × 1.2 × 1,000 × 0.2777
+
= 8,364 W
Outdoor air load (40.6 – 29.7) × 1.2 × 1,000 × 0.2777
+
= 3,633 W
●
Sensible HRV
(Supply air diffuser temperature) tSA=
(21°C – 0°C) × 0.75+ 0°C = 15.8°C
(Supply air diffuser
enthalpy) iSA = 20.5 kJ/kg
(from psychrometric chart)
Heat recovered (20.5 – 4.6) × 1.2 × 1,000 × 0.2777
+
= 5,299 W
Outdoor air load (40.6 – 20.5) × 1.2 × 1,000 × 0.2777
+
= 6,698 W
●
Conventional ventilator
If a conventional ventilator is used, the supply air diffuser is the same
as the outdoor air and the exhaust is the same as the room air.
Thus the heat recovered is 0 kJ/h and the outdoor air load is
(40.6 – 4.6) × 1.2 × 1,000 × 0.2777
+
= 11,997 W
+
Conversion Factor (1,000 W/3,600 sec.)
Calculation example Winter conditions
iRA
iOA
tOA tSA tRA
R
S
O
A
X
RA
XSA
XOA
iSA
Supply air
Room air
Air
conditioner
Lossnay Sensible HRV
Conventional
ventilator
Dry bulb
temperature
Absolute
humidity
Relative
humidity
Enthalpy
21°C
16.6 15.8 0
5.2 1.9 1.9
44.1 17.2 50
29.7 20.5 4.6
8,364 5,299 0
3,633 6,698 11,997
30 56 100
7.7 g/kg’
50%
40.6 kJ/kg
Outdoor air
Exhaust air
Dry bulb
temperature
Absolute
humidity
Relative
humidity
Enthalpy
0°C
1.9 g/kg’
50%
4.6 kJ/kg
Dry bulb temperature (°C)
Absolute humidity (g/kg’)
Relative humidity (%)
Enthalpy (kJ/kg)
Outdoor air load (W)
Outdoor air load ratio (%)
Total heat recovered (W)
0.0077
Absolute humidity (kg/kg’)
Outdoor air
condition in
winter
Room air condition
in winter
Supply air condition
of the Lossnay Core
0.0051
0.0019
0
40.6
29.7
4.6
16.6
Dry bulb temperature (°C)
Lossnay Core
heat recovery
Outdoor air load
Enthalpy (kJ/kg)
21
Page 71

69
CHAPTER 2 ● Air Conditioning System Design Section
5.5 Psychrometric chart
Evaporation pressure Pω [kPa]
Absolute humidity χ [kg/kg (DA)]
5.5
5.0
4.5
4.0
3.5
3.0
2.5
2.0
1.5
1.0
0.5
0.1
0.037
0.036
0.035
0.034
0.033
0.96
0.95
0.94
0.93
0.92
Relative capacity ν [m
3
/kg(DA)]
Saturation level ψ (%)
Relative humidity ψ (%)
Dry bulb temperature t [°C]
Relative enthalpy h [kJ/kg (DA)]
Sensible heat ratio SHF
Heated moisture [kJ/Kg]
Wet air h–x graph (SI)
(-10 to + 50°C, Air pressure 101.325 kPa)
Wet bulb temperature t’ [°C]
0.032
0.031
0.030
0.029
0.028
0.027
0.026
0.025
0.024
0.023
0.022
0.021
0.020
0.019
0.018
0.017
0.016
0.015
0.014
0.013
0.012
0.011
0.010
0.009
0.008
0.007
0.006
0.005
0.004
0.003
0.002
0.001
0.000
0.75
Ice
Water
0.76 0.77 0.78 0.79 0.80 0.81 0.82 0.83 0.84 0.85 0.86 0.87 0.88 0.89 0.90 0.91
0.0
1.0
0.9
0.8
0.7
0.6
0.5
0.4
0.3
u =
dh
dx
Page 72

70
CHAPTER 2 ● Air Conditioning System Design Section
6. Humidifying
6.1 The Need for Humidity
Humidity is an important part of air conditioning, especially when heating. During the winter heating months when
outside air is drawn in by the ventilator, the low-temperature, low-humidity (absolute humidity) air is heated by the
air conditioning unit and this causes a rapid drop in its relative humidity. (For example, 0°C DB, 50%RH outdoor
air is introduced and heated as is to 20°C, causing its relative humidity to drop to 13%RH which causes the
number of people complaining of dryness to the eyes and throat to increase.)
There are also problems such as when the temperature of a room with low humidity is raised, but the people in
the room still have cold feet. When the relative humidity is 40% or higher. Since this problem can be corrected by
not wastefully raising the temperature, humidity can also play a role in saving energy.
(While there are many opinions on what the level of humidity should be for comfort, it is generally believed that 40
to 50%RH relative humidity is suitable for room temperatures of 20 to 24°C. If the humidity is raised higher than
this, problems with condensation forming on windows and other areas may occur.)
6.2 Humidity Conditions in Buildings
The humidity conditions in modern buildings is generally quite poor. Even in buildings clearing the building code
restrictions with a relative humidity of 40%RH, there are only a few that have good conditions. Buildings with
centralized ducts often use spray type humidifiers. With this type of humidifier, the amount of moisture that is
dissolved into the air (the amount of effective humidity) is extremely small and as a result the humidity in the room
does not rise, making this a serious problem. Moreover, even if humidifiers enabling the air conditioning system to
theoretically clear the building codes requirement of 40%RH are incorporated, there are many instances where
the following actual causes will change the amount of humidity in a room.
●
The moisture created by people.
Causes that result in
In an office at 21°C, the human body generates a latent heat amount of 171.6 kJ/h “R” and the
an increase in humidity
latent heat for water evaporation is 2,499 kJ/kg. Accordingly, a person will create 171.6/2,499 =
0.686 R/h of water per hour.
●
Water heaters and other such equipment create moisture.
●
Doors being opened and closed and humidity infiltrating through small openings.
●
Absorption of moisture by materials that were abnormally dry at the time of the construction of the
building.
●
Increased temperature inside the rooms (Lowers relative humidity).
●
Large amounts of exhaust air.
●
Uneven humidifying by the humidifier in the building or a decline in the amount of humidifying due
Causes that result in to deterioration of the efficiency of the humidifier over time.
a decrease in humidity
●
If the amount of effective humidity (the amount of moisture dissolved into the air) is low.
(For example, there are many types of humidifiers available such as high-pressure spray types,
ultrasonic types and evaporation-spray types that could be incorporated into an air conditioning
system, but as mentioned earlier, if the moisture they emit condenses on the walls of the duct
work or if the droplets are not absorbed into the air, it simply becomes water that goes down the
drain and contributes nothing towards humidifying the room.)
6.3 Background of the Permeable Film Type Humidifier
Humidifiers can be classified into two main types: spray types and ultrasonic types. However, all things
considered, they are not the best overall.
The humidifier used in the OA processing unit is a permeable film type that uses natural evaporation to provide
clean humidifying. Its merits include its low initial cost, low running cost and uncomplicated operating principle.
Its demerits of low humidifying performance and short service life have been overcome by dramatically increasing
the evaporating surface of the water without changing the size of the humidifier itself. This is an epoch-making
humidifier.
Page 73

71
CHAPTER 2 ● Air Conditioning System Design Section
Type
Ultrasonic
type
High-
pressure
spray type
Natural
evaporation
Pan shape
Infrared
type
Dual flow
nozzle type
Electrode
type
Permeable
film type
Operating principle
Humidifying
performance
( /h)
0.4 - 18
2.5 - 300
0.2 - 1.0
0.4 - 35
2.0 - 9.0
1 - 18
0.5 - 78
0.2 - 4.8
Humidifying
efficiency
Medium to
high
Low
High
High
High
Medium to
high
High
High
Responsiveness
(Controlability)
Immediate
Immediate
Somewhat slow
(Self controlling)
Somewhat slow
Immediate
Immediate
Immediate
Somewhat slow
(Self controlling)
Service life
5,000 h
Medium
Vibrator
Long
1,250 h
Short
Evaporator
board
Short
5,000 h
Medium
Infrared
heater
Long
3,000 h Short
to medium
Electrode
plates
12,500 h
or more
(Hard water)
Long
Cost
(5 /h)
High
(130,000)
Low
(30,000)
Low
Low
(70,000)
High
(300,000)
High
(150,000)
High
(500,000)
Special
Power
consumption
(at 5 /h) kW
0.305
0.07
0.01 or less
4.0
5.0
0.75
5.8
0.01 or less
Maintenance
items
Clean oscillator
element every
season. Replace
oscillator element
every 5,000 h.
Replace nozzle
every season.
Clean water tank
every season.
Replace
evaporator board
every season.
Clean water tank
every season.
Replace main
body every 2 to 3
seasons.
Clean water tank
every 3 months.
Replace heater
every 5,000 h.
Replace nozzle
every season.
Clean cylinder
every 2 years.
Replace
electrode plates
every 3 years.
Replace element
every 10 years.
(Hard water)
Running
costs
(Index)
Low to
medium
Low
Low
High
High
Medium
High
Low
Problem areas
White exhaust
countermeasures
Low humidifying
efficiency.
Countermeasur
es for leakage.
Low humidifying
efficiency.
Short humidifying
element service
life.
Countermeasur
es against
scum.
Improving
maintainability.
High cost.
Improved air
pressure and
water pressure
controllability.
Requires air
compressor.
Improve
maintainability.
High cost.
rr
rr
rr
Water
Water
particles
Oscillator
Water
tank
Electric heater
Infrared
heater
Dry fog
Air
Water
Nozzle
Steam
Solid
electrode
Hot air
Permeable
film sheet
Electric
power
Steam
Water
Heated
water
Supply
(heated) water
6.4 Comparison of Humidifying Methods
Note: Service life is defined as performance up to 80% of the initial performance.
Page 74

72
CHAPTER 2 ● Air Conditioning System Design Section
7. Humidifying Effect of the OA Processing Unit
The humidity recovered by the Lossnay Element and the humidity added by the permeable type humidifier provide
a humidifying effect that is sufficiently more than the humidity lost in exhaust.
Conditions:●Model GUF-50RDH3
●
Outdoor unit PUHY-P200YGM-A
●
Ventilation 500 m3/h In addition to OA processing, all indoor
(Relative air volume γ = 1.2 kg/m3) units are connected for a total of 100%.
Method of Calculation
(1) Finding the air conditions after heating by direct expansion coil
●
Calculate the direct expansion coil performance.
Use the correction graph (Refer to page 73) to find the correction coefficient of 0.92 when the outdoor wet
bulb temperature is –3°C and the indoor temperature is 20°C. From this, the performance of the direct
expansion coil of the OA processing unit is as follows.
(6.42 – 2.25) × 0.92 = 3.84 kW
●
Calculate the air conditions after leaving the direct expansion coil.
Assuming the fixed pressure ratio of the air is 1.0.
There is a temperature increase of 23.0°C. (3.84/1.0/ (1.2 × 500/3,600) = 23.0°C)
Due to this temperature increase, the temperature of the air leaving the expansion coil is 38.4°C.
(15.4 + 23.0 = 38.4°C)
Since there is no change in absolute humidity from the heating, the absolute humidity leaving the expansion
coil is 3.59 g/kg (DA). The rest is taken from the psychrometric chart.
38.4°C 8.6% χ = 3.59 g/kg (DA) i = 47.8 kJ/kg(DA) WB = 17.2°C
Air after humidifying (SA)
Humidified
27.5 38.4
8.04 3.59
35.2 8.6
48.2 47.8
17.2 17.2
1.07 1.07
2.67 0
3.74 1.07
156 45
Not humidified
Dry bulb temperature
(°C)
Absolute humidity
(g/kg (DA))
Relative humidity
(%)
Enthalpy (kJ/kg
(DA))
Humidity recovered by
Lossnay Element (kg/h)
Humidity added by
humidifier (kg/h)
Total amount of
humidity (kg/h)
Humidified ratio
(*) (%)
* The humidified ratio is expressed as a ratio in
relation to the required humidified amount of the
total amount of humidity.
Permeable
film
humidifier
Direct
Expansion
coil
Wet bulb
temperature (°C)
Lossnay Core
outlet air (SA)
Dry bulb
temperature
Absolute humidity
15.4°C
3.59 g/kg (DA)
33.3%
24.6 kJ/kg (DA)
8.0°C
Relative humidity
Enthalpy
Dry bulb
temperature
Absolute humidity
20°C
5.80 g/kg (DA)
40%
35.0 kJ/kg (DA)
Relative humidity
Enthalpy
Wet bulb
temperature
Dry bulb
temperature
Absolute humidity
0°C
1.80 g/kg (DA)
50%
4.8 kJ/kg (DA)
–3°C
Relative humidity
Enthalpy
Wet bulb
temperature
Indoor air (RA)
Exhaust air (EA)
Ventilation amount 500 m
3
/h
(γ = 1.2 kg/m
2
)
Outside air (OA)
Page 75

73
CHAPTER 2 ● Air Conditioning System Design Section
The humidified amount found is a correction of the rated humidified amount using the above graph, so the
following formula is used for calculation.
Humidified amount = Rated humidified value × K1 × K2 = 2.7 × 1 × 0.99 = 2.67 kg/h
(2) Finding the amount of humidity added by a permeable film humidifier
1) To find the amount of humidity added by the humidifier, there is a need to correct the rated humidification on
the characteristics chart using the amount of air flow and the air conditions at the direct expansion coil outlet.
●
Air flow volume correction: In this case, since the rated air flow is the same as the processed air volume,
the correction coefficient (K1) from Graph 1 will be 1.0.
Graph 1 Air volume change correction
Humidifying volume
correction coefficient
(K1)
Air flow percentage
(Percentage in relation to rated air flow)
0 0.2 0.4 0.6 0.8 1.0 1.2
2.0
1.5
1.0
0.5
01521.5 30
2.0
1.5
1.0
0.5
Rated air flow 1.0 is as follows.
GUF-50RDH3 500 m
3
/h
GUF-100RDH3 1,000 m
3
/h
Humidifying volume correction
coefficient (K2)
Difference between dry bulb and wet bulb
temperatures of inlet port of the humidifier (K)
●
Air flow volume correction: This is calculated using the difference between dry bulb and wet bulb
temperatures of the direct expansion coil outlet air. It this case, the dry bulb
temperature minus the wet bulb temperature is 38.4 – 17.2 = 21.2°C. From
Graph 2 it can be seen that the correction coefficient (K2) is 0.99.
Graph 2 Correction graph for heated and humidified Lossnay Core air conditions
●
Percentage in relation to rated air flow =
processing air flow/rated air flow
●
The rated air flow is the air flow for the highest
speed setting on the characteristics chart for a
given model.
Example: GUF-50RDH3
......
500 m3/h
Page 76

74
CHAPTER 2 ● Air Conditioning System Design Section
OA
RA
SA
2) Method for calculating humidified air conditions
The following is the formula for finding the absolute humidity of humidified air from the amount of humidifying
in section 1).
●
Absolute humidity of humidified air = Absolute humidity at Lossnay Core outlet +
(Amount of humidifying × 1,000) ÷ (Air density (g) × Processed air amount) (g/kg (DA))
3.59 + (2.67 × 1,000)/(1.2 × 500) = 8.04 (g/kg (DA))
●
If natural evaporation is used, under normal temperatures, a relatively equal wet bulb temperature line can
be predicted. Accordingly, the air condition sought will be the intersecting point on the psychrometric chart
for the even wet bulb temperature line for the direct expansion coil outlet (17.2°C) and the absolute
humidity of humidified air.
27.5°C 35.2% χ = 8.04 g/kg (DA) i = 48.2 kJ/kg (DA) WB = 17.2°C
Dry bulb temperature (°C)
0 15.4 20 27.5 38.4
0.00804
17.2°C
0.00580
0.00359
0.00180
Absolute humidity (kg/kg (DA))
3) Required amount of humidifying and amount of recovered humidity (Recovery ratio)
●
The required amount of humidifying is the amount of humidity added to give both the outside air and the
inside air the same amount of absolute humidity.
Required amount humidifying = Air density (γ) × Processed air amount ×
(Indoor absolute temperature – Outdoor absolute humidity)/1,000 R/h (kg/h)
= 1.2 × 500 × (5.8 – 1.8)/1,000 = 2.40R/h (kg/h)
●
The amount of humidity recovered is the amount of absolute humidity, in relation to the outside air,
contained in the air after humidifying. Accordingly, the following formula is used.
Amount of humidity recovered = Air density (γ) × Processed air amount ×
(Absolute humidity after humidifying – Outdoor absolute humidity)/1,000 R/h (kg/h)
= 1.2 × 500 × (8.04 – 1.80)/1,000 = 3.74 kg/h
●
The recovery ratio is the amount of recovered humidity/required amount of humidifying.
3.74/2.40 × 100 = 156%
Page 77

75
CHAPTER 2 ● Air Conditioning System Design Section
8. Water Quality and Service Life of Humidifier
8.1 Water Quality Required by Water Supplied to Humidifier
The water supplied to a humidifier should satisfy the following conditions.
●
It should be neutral (pH 5.8 to 8.6).
●
There should be 100 mg/R or less of residual material after evaporation.
●
If the level of residual material after evaporation is high, use a water purifier to adjust the water quality.
8.2 Service Life of Permeable Film Humidifier
The service life of a permeable film humidifier is determined by the amount of accumulation of the residual
material in the supply water after evaporation. Results of tests show that the service life of a permeable film
humidifier is about five years (6,250 hours) when the water quality has residual material after evaporation of 100
mg/R. The humidifier has reached the end of its service life when the amount of humidification declines to 80%
of the its initial amount.
The reason the amount of humidification is reduced over time is due to the residual material after evaporation in
the supply water that accumulates on the inside of the permeable film and gradually covers its surface.
8.3 Relationship between Water Quality and Service Life
The service life of a permeable film humidifier is dependent upon the density of the residual material after
evaporation.
When residual material after evaporation is 200 mg/R, the service life is approximately 2.5 years.
When residual material after evaporation is 400 mg/R, the service life is approximately 1.25 years.
Moreover, if the amount of residual material after evaporation is exceptionally high, the accumulation of it could
cause damage the permeable film or cause other such secondary effects. Therefore, water with a high levels of
residual material after evaporation cannot offer any positive effect to a permeable film humidifier.
8.4 Water Purifiers
8.4.1 Effect of water purifiers
Even clear, colorless tap water or well water contains components that cannot be seen with the naked eye. The
most common of these microscopic components are the “hardness components” of calcium and magnesium.
Water that contains a large amount of these hardness components is called hard water and, conversely, water
that contains a small amount of these components is called soft water. A water purifier is used to remove calcium
and magnesium etc. from the water.
If hard water is used as is, it will cause a build up known as scaling which will reduce flow efficiency and
shorten the service life of the equipment. For these reasons, a water purifier should always be used.
8.4.2 Types of water purifiers and their operating principles
The following chart summarizes the representative types of water purifiers.
Operating principle Features Comments
Reverse osmosis Filters the ions from of the In principle, provides effective Requires water pressure.
permeable film type supply water. removal of impurities. Low flow volume.
Ion exchange type
Combination of positive and Higher water flow volume than Must be maintained to
negative ion exchange plastic. conventional water purifiers. ensure effectiveness.
Page 78

76
CHAPTER 2 ● Air Conditioning System Design Section
8.4.3 Difference between a water purifier and a water softener
Do not confuse a water purifier and a water softener.
A water softener is a device that softens the water by replacing the calcium, magnesium, and nitrium with sodium,
but does not remove impurities from the water.
A water purifier, as its name implies, removes all chemical impurities from the water in order to provide pure water
(H2O).
8.4.4 Recommended specifications of water purifiers
Reverse Osmosis water purifier is strongly recommended to keep acceptable water quality.
The following are one of the recommended specifications, “Cillit-Mini Osmosi MO Series” manufactured by
Cillichemie.
Specifications
Note: Water treatment cannot be performed when pressure is less that 3.6 bar.
Piping system incorporating a water purifier (Reference)
To humidifier
Water tank
Solenoid valve
Water purifier
Pump
Elevated water tank
Water supply
Water treatment flow volume m (RR/h)
Model 3.6 bar 6 bar 9 bar
25°C 15°C 25°C 15°C 25°C 15°C
Cillit-Mini Osmosi MO I 4 2.6 5.5 4.2 8.8 6.4
Cillit-Mini Osmosi MO II 5.8 4.4 9.5 7.1 14 10.5 GUF-50RDH3 (2.7 R/h)
Cillit-Mini Osmosi MO III 8 6.2 13 10.8 19 14.5 GUF-100RDH3 (5.4 R/h)
Cillit-Mini Osmosi MO IV 19 14.2 30 25 50 38
Page 79

77
CHAPTER 2 ● Air Conditioning System Design Section
9. Dust Removal
9.1 Necessity of Filters
Clean air is necessary for humans to live a comfortable and healthy life. Besides atmospheric pollution that has
been generated with the development of modern industries and the growth in the use of automobiles, air pollution
in sealed rooms has progressed to the point where it adversely affects the human body, and is now a major
problem.
Hay fever is most common in the spring and demands for preventing pollen from entering rooms are increasing.
9.2 Data Regarding Dust
The particle diameter of dust and applicable range of filters are shown in Table 1, and representative data
regarding outdoor air dust concentrations and indoor dust concentrations is shown in Table 2.
Table 1 Aerosol particle diameters and applicable ranges of various filters
Table 2 Major dust concentrations
Type Reference data
Outdoor air floating dust
Large city 0.1 - 0.15 mg/m
3
concentration
Small city 0.1 mg/m
3
or less
Industrial districts 0.2 mg/m
3
or more
General office 10 mg/h per person
Indoor dust concentration Stores (product vending stores) 5 mg/h per person
Applications with no tobacco smoke 5 mg/h per person
Remarks:
1. The core diameter of outdoor air dust is said to be 2.1 µm.
2. Dust in office rooms is largely caused by smoking, and the core diameter is 0.72 µm. The 14 types of dust
(average 0.8 µm) as set by JIS Z 8901 as performance test particles are employed.
3. The core diameter of dust generated in rooms where there is no smoking is approximately the same as outdoor
air.
4. Smoking in general offices (as per Japan):
Percentage of smokers : Approx. 70% (adult men)
Average number of cigarettes : Approx. 1/person·h (including non-smokers)
Smoking length of cigarette : Approx. 4 cm
Amount of dust generated by one cigarette : Approx. 10 mg/cigarette
Aerosol particle diameter (µm)
Solid
particles
Fumes Dust
Mist
Clay
Oil fumes
Tabacco smoke
Carbon black
ZnO fumes
Sea salt
particles
Atmospheric
dust
Fine dust, coarse
dust fillers
Cement
Pollen
Viruses
Bacteria
Hair
Medium to high efficiency filters
HEPA filter
Coal dust
Fry ashes
Mud Sand
Sprays
Fluid
particles
Air filters
Major
particles
Aerosol particle
0.001 0.01 0.1 0.3 1 10 100 1000
Page 80

78
CHAPTER 2 ● Air Conditioning System Design Section
9.3
Comparison of Dust Collection Efficiency Measurement Methods
The gravitational, colorimetric and counting methods used for measuring dust collection efficiency each have
differing features and must be used according to the application of the filter.
Test method Test dust
Inward flow dust Outward flow dust Efficiency
Type of applicable
measurement method measurement method indication method
filters
Synthetic: • Filter passage air
AFI • Dust on standard Dust weight volume measured
Gravitational
road in Arizona: 72%
measured • Weigh the dust Gravitational ratio Synthetic dust filters
method •
K-1 carbon black: 25%
beforehand remaining on the
• No.7 cotton lint: 3% filter and compare
NBS Degree of Degree of
Comparison of
Electrostatic dust
Colorimetric Atmospheric dust contamination of contamination of
contamination of
percentage of
method white filter paper white filter paper
reduction in degree
(for air conditioning)
of contamination
DOP Diameter of dicoctyl- Electrical counting Absolute filter and
Counting phthate small drop measurement using Same as left Counting ratio same type of high
method particles: 0.3 µm light aimed at DOP efficiency filter
Synthetic: • Filter passage air
Pre-filter
ASHRAE •
Regulated air cleaner
Dust weight volume measured
Filter for air
Gravitational fine particles: 72% measured • Weigh the dust Gravitational ratio
conditioning
method •
Morocco Black: 23%
beforehand remaining on the
(for coarse dust)
• Cotton linter: 5% filter and compare
ASHRAE Degree of Degree of
Comparison of Filter for air
Colori.etric Atmospheric dust contamination of contamination of
percentage of conditioning (for fine
method white filter paper white filter paper
reduction in degree dust) Electrostatic
of contamination dust collector
Air filter test for air
Comparison of
conditioning set by Degree of Degree of
percentage of Filter for air
Japan Air Cleaning JIS 11 types of dust contamination of contamination of
reduction in degree conditioning
Assoc. white filter paper white filter paper
of contamination
(Colorimetric test)
Pre-filter test set • Filter passage air
by Japan Air Dust weight volume measured
Cleaning Assoc. JIS 8 types of dust measured • Weigh the dust Gravitational ratio Pre-filter
(Gravitational beforehand. remaining on the
test) filter and compare.
Electrostatic air
Comparison of
cleaning device test Degree of Degree of
percentage of Electrostatic dust
set by Japan Air JIS 11 types of dust contamination of contamination of
reduction in degree collector
Cleaning Assoc. white filter paper white filter paper
of contamination
(Colorimetric test)
Page 81

79
CHAPTER 2 ● Air Conditioning System Design Section
Gravitational method
This method is used for air filters which remove coarse dust (10 µm or more). The measurement method is
determined by the gravitational ratio of the dust amount on the in-flow side and out-flow sides.
Dust collection ratio =
In-flow side dust amount – Out-flow side dust amount
× 100 (%)
In-flow side dust amount
Colorimetric method
The in-flow side air and out-flow side air are sampled with a suction pump and passed though filtering paper. The
sampled air is adjusted so that the degree of contamination on both filter papers is the same, and the results are
determined by the sampled air volume ratios on both sides.
Dust collection ratio =
Out-flow side sampling amount – In-flow side sampling amount
× 100 (%)
Out-flow side sampling amount
Orifice
Dust supply
device
Manometer
Motor
Dust container
Mixing blades
Dust supply outlet
Unit (mm)
Rectifying grid
Air volume
adjustment plate
Air-feed fan
Window
Specimen
Performance test device Example of dust supply device
Passed dust
collection filter
Air-feed fan
Orifice
Square duct
Throttle device
Rectifying grid
Venturi pipe
Dust chamber
Air filter
Specimen
3.5D3D 2D 2L 2L
Baffle plate
Coupling pipe
7° or
less
Pressure loss concentration
measurement position
Coupling pipe
Rectifying grid
Coupling
pipe
Round duct
Page 82

80
CHAPTER 2 ● Air Conditioning System Design Section
Model Cooling capacity Heating capacity
Outdoor
Filter efficiency
OA
air amount
processing GUF-50RDH3 + High-
65%
unit efficiency filter 5.18 kW 5.84 kW 500 m
3
/h
(Colorimetric method)
PZ-50RFM 1 unit
Model
Cooling Heating Air flow
Filter efficiency
performance performance volume
Indoor unit
PLFY-P40VKM-A + Highefficiency filter 4.5 kW 5.0 kW 15 m3/min 65% (Colorimetric method)
PAC-SE13KF-E 2 units
In a system such as this where the performance of each component is already known and the indoor dust density
is being sought, there may be times when the indoor filter performance is calculated for use as the allocated value
for indoor dust density. In such cases, the following formula is used.
Ci =
G + CoQo (1 –
η
o)
Qo + Qi ηi
η
i =
G + C
o Qo (1 – ηo) – Ci Qo
× 100
Ci Qi
Example of calculation
In the illustration above, the indoor dust density for the following design conditions is found as follows.
Outline of air conditioning
9.4 Calculating Dust Density
The following is an air conditioning system using an OA processing unit.
Dust density detection
Qo : Outdoor air intake amount (m3/h)
Q
i : Indoor unit air flow amount (m
3
/h)
(Total air flow amount for indoor unit)
η
o :
High-efficiency filter dust removal ratio (%) (Colorimetric method)
ηi : Indoor unit filter dust removal ratio (%) (Colorimetric method)
C
o : Outside air airborne dust density (mg/m
3
)
C
i : Indoor dust density (mg/m
3
)
G: Amount of dust generated indoors (mg/h)
Air conditioning area Number of people in room
Amount of outdoor air used Cooling capacity Heating capacity
100 m
3
(Office) 20 people 25 m3/h·people × 20 people = 500 m3/h 14.18 W 15.84 W
Unit used
Indoor unit
OA processing unit
High-efficiency filter ηo
Indoor unit filter ηi
Page 83

Calculation
......
Outdoor air intake amount Qo = 500 m3/h
Indoor unit air flow amount Qi = 15 × 2 × 60 = 1,800 m3/h
High-efficiency filter – dust removal ratio ηo = 65% (ηo’ = 67% Particle diameter 2.1 µm*)
Indoor unit filter – dust removal ratio ηi=65% (ηi’ = 57% Particle diameter 0.72 µm*)
Outside air airborne dust density Co = 0.1 mg/m
3
Amount of dust generated indoors G = Amount of dust created per person × Number
of people in room
= 10 mg/h·person × 20 people = 200 mg/h
From the above, the following shows the calculation for indoor dust density Ci.
Ci =
200 + 0.1 × 500 (1 – 0.65)
0.130 mg/m3( 0.142 mg/m3*)
500 + 1,800 × 0.65
The result clears the dust density of 0.15 mg/m3set by building codes and other such ordinances. Conversely,
the dust removal ratio for the indoor filter for attaining the indoor dust density Ci of 0.15 mg/m3is calculated as
follows.
η
i =
200 + 0.1 × 500 (1 – 0.65) – 0.15 × 500
× 100 52.7% ( 52.4%*)
0.15 × 1,800
This shows that a filter for the indoor unit with a minimum dust removal ratio of 52.7% (Colorimetric method) is
required.
* The result of a calculation using an average outdoor airborne particle diameter of 2.1 µm and an average indoor
airborne particle diameter of 0.72 µm is shown.
81
CHAPTER 2 ● Air Conditioning System Design Section
{}
Page 84

82
CHAPTER 2 ● Air Conditioning System Design Section
10. Sound
Sound is emitted when any object is excited causing it to vibrate. The object that vibrates is called the sound
source, and the energy that is generated at the source is transmitted through the air to the human ear. Humans
can hear the sound only when the ear drum vibrates.
10.1 Sound level and auditory perception
Sound level is the sound wave energy that passes through
a unit area in a unit time, and is expressed in dB (decibel)
units.
The sound heard by the human ear differs according to the
strength of the sound and the frequency, and the relation to
the pure tone sound is as shown on the right. The vertical
line shows the strength of the sound and the horizontal line
shows the frequency. For frequencies between 20 Hz to
15,000 Hz which can be felt by the human ear, the strength
of sound that can be felt that is equivalent to a 1,000 Hz
sound is obtained for each frequency. The point where
these points cross is the sound level curve, and a sound
pressure level numerical value of 1,000 Hz is expressed.
These are called units of phons. For example, the point on
the 60 curve is perceived as 60 phons.
●
On average, the human senses a sound that is less than
1,000 Hz as rather weak, and a sound between 2,000 to
5,000 Hz as strong.
10.2 How to measure sound levels
A sound level meter (JIS C 1502, IEC 651) is used to
measure sound levels. This sound level meter has three
characteristics (A, B and C characteristics) as shown on the
right. These represent various sound wave characteristics.
Generally, the A characteristic, which is the most similar to
the human ear, is used.
Sound level (dB)
Frequency (Hz)
Minimum audible valve
120 dB
100
–20
–2
–0.2
–0.02
–0.002
–0.0002
–0.00002
80
60
40
20
4.2
Response (dB)
Frequency (Hz)
C characteristic
B characteristic
A characteristic
Sound
(Pa)
Sound
strength
(W / cm
2
)
ISO audio perception curve
Page 85

83
CHAPTER 2 ● Air Conditioning System Design Section
Room application dB NC value Room application dB NC value
Broadcasting studio 25 15 - 20 Cinema 40 30
Music hall 30 20 Hospital 35 30
Theatre (approx. 500 seats) 35 20 - 25 Library 40 30
Classroom 40 25 Small office 45 30 - 35
Conference room 40 25 Restaurant 50 45
Apartment 40 25 - 30 Gymnasium 55 50
Hotel 40 25 - 30 Large conference room 50 45
Housing (room) 40 25 - 30 Factory 70 50 or more
10.3 Frequency analysis of sound
It is said that the human ear senses differently according to the frequency. However, the sound generated from a
vibration is not limited to one frequency, but instead, various frequencies are generated at differing levels. This is
expressed by the NC curve, which is determined according to the difficulty of hearing a conversation.
●
Even if the sound is a very low level, it is annoying if a specific frequency is emitted very loudly.
These sounds are suppressed to a minimum during product design stages, but, the sound may become very
disturbing with resonance of the ceiling, wall, etc.
Example Continuous frequency analysis NC curve
●
Tolerable noise levels and NC values according to room application
Frequency band (Hz)
Level (dB)
Frequency (Hz)
SPL (dB)
Min. audible limit
Page 86

84
CHAPTER 2 ● Air Conditioning System Design Section
10.4 Indoor noise
(1) Principle of indoor noise
1) Power levels
The Power level (PWL) of the sound source must be
understood when considering noise effects.
The following formula is used to obtain PWL from the
measured sound pressure data (values noted in
catalog) in an anechoic chamber.
PWL = SPLo + 20 logro + 11 [dB]................................(I)
PWL : Sound source power level (dB)
SPLo : Measured sound pressure in anechoic
chamber (dB)
ro : Measurement distance (m)
2) Principal model
Consider the room shown in Figs. 1 and 2.
●
Fig. 1 shows an example of the integrated main unit
and supply air diffuser (and return grille).
Fig. 2 shows an example of a separated main unit
and supply air diffuser (and return grille).
●
is the direct sound from the supply air diffuser
(return grille) and is the echo sound. ( to ) is
the direct sound that is emitted from the main unit
and duct and passes through the finished ceiling and
leaks. is the echo sound of .
3) Setting of noise
●
The following formula is used to obtain the noise
value at a position in the room.
SPL [dB] = PWL + 10 log + ................(II)
(i) (ii)
SPL :
Sound pressure level at reception point [dB]
PWL : Sound source power level [dB]
Q:Directivity factor (Refer to Fig. 3)
r:Distance from sound source [m]
R:Room constant [R – αS/(1 – α)]
α :Average sound absorption ratio in room
(Normally, 0.1 to 0.2)
S:Total surface area in room [m2]
Sound source position
Centre of room
Centre of ceiling
Edge
Corner
a
b
c
d
Q
1
2
4
8
Fig. 1
Fig. 2
Fig. 3 (Sound source position and directivity
factor Q)
3
1
Q
4πr
2
4
R
{}
Main unit
ro
Supply air diffuser
(return grille)
Supply air diffuser
(return grille)
c
b
a
d
Main unit
Page 87

85
CHAPTER 2 ● Air Conditioning System Design Section
●
For the supply air diffuser (and return grille) in Fig. 2,
PWL must be corrected for the noise alternation
provided by the duct work (TL) such that:
PWL’ = PWL – TL
●
Item (i) in formula (II) is the direct sound ( , ), and
(ii) is the echo sound ( , ).
●
The number of sound sources in the room (main unit,
supply air diffuser, return grille etc.) is obtained by
calculating formula (II), and combining the number
with formula (III).
SPL = 10log (10
SPL1/10
+ 10
SPL2/10
)
........................
(III)
●
The average sound absorption rate in the room and
the ceiling transmission loss differ according to the
frequency, so formula (II) is calculated for each
frequwncy band, and is combined with formula (III) for
an accurate value.
(2) Avoiding noise disturbance from
OA processing unit
1) When unit air passage behind ceiling is sound source
(Fig. 1 , , Fig. 2 to , )
(A) Avoid the following types of design when disturbing
noise may be emitted from large units. (Refer to
Fig. 4)
a) Sudden contraction of duct diameter
(Ex. ø 250 → ø 150, ø 200 → ø 100)
b) Sudden curves in aluminum flexible ducts, etc.
(Especially right after unit outlet)
c) Opening in ceiling plates
d) Suspension on weak material
(B) The following countermeasures should be taken.
(Refer to Fig. 5)
a) Use ceiling material with high soundproofing
properties (high transmission loss). (Care is
required for low frequency components as the
difference in material is great).
b) Addition of soundproofing material to areas
below sound source.
(The entire surface must be covered when
using soundproofing sheets. Note, that in some
cases, covering of the area around the unit
may not be possible due to the heat generated
from the unit.)
125
250
500
1,000
2,000
4,000
Material ( )
indicates
thickness (mm)
Lauan
plywood (12)
23
20
21
23
26
24
—
Fig. 4
Fig. 5
Transmission loss in ceiling material (dB)
Example
Average
20
10
11
19
26
34
42
22
12
15
21
28
35
39
Plaster
board (7)
Plaster
board (9)
Frequency band (Hz)
1
3
a) d)
a) b)
c) b)
Page 88

86
CHAPTER 2 ● Air Conditioning System Design Section
2)
When supply air diffuser (and return grille) is sound source
..... part 1
(A) If the main unit is separated from the supply air
diffuser (and return grille) as shown in Fig. 6, the
use of a silencer box a), silence duct b) or silence
grille c) is recommended.
(B) If a draft sound is being emitted from the supply air
diffuser (and return grille), branch the flow as
shown in Fig. 7 a), lower the flow velocity with a
grille, and add a silencer duct to section b).
(If the length is the same, a silencer duct with the
small diameter is more effective.)
3)
When supply air diffuser (and return grille) is sound source
..... part 2
(A) If the main unit and supply air diffuser (and return
grille) are integrated as shown in Fig. 8, or if the
measures taken in 2) a) and b) are inadequate, the
interior material in the room can be changed to that
having a high sound absorbency as shown in Fig.
8 a).
This is not, however, very effective towards direct
sounds.
(B) Installing the sound source in the corner of the
room as shown in Fig. 8 b) is effective towards the
center of the room, but will be inadequate towards
people in the corner of the room.
Fig. 6
Fig. 7
Fig. 8
a) b) c)
a) b)
a) b)
Page 89

87
CHAPTER 2 ● Air Conditioning System Design Section
11. Precautions when Using
11.1 OA Processing Unit Usage Conditions
Model Installation conditions for main unit
Supply air diffuser conditions
Exhaust air conditions
GUF-50RDH3
GUF-100RDH3
*
1 *2
0°C to +40°C, relative –15°C to +40°C, relative –10°C to +40°C, relative
GUF-50RD3 humidity of 80% or less humidity of 80% or less humidity of 80% or less
GUF-100RD3
Note: *1 However, this for a room in a common residential building and with conditions for air conditioning
temperature and humidity. Accordingly, if an item with a large temperature difference such as a large
refrigerator is used, this model cannot be used even if it falls within the values shown above.
*2
Depending on the usage conditions of the outdoor unit, there may be cases when it may not be capable of
using an supply air diffuser to –15°C. Therefore, always check the usage conditions of the outdoor unit.
11.1.1 Use in cold climates (outdoor temperature: –5°C or less)
Plot the OA processing unit intake air conditions A and B on
a psychrometric chart as shown on the right. If the high
temperature side air B intersects the saturation curve such
as at C, moisture condensation or frosting will occur on the
Lossnay Core. In this case, the low temperature side air A
should be preheated to the temperature indicated by point
A’ so that point C shifts to the point C’.
●
The OA processing unit cannot be used where toxic gases and corrosive elements such as
acids, alkalis, organic solvents, oil mist or paints exist.
●
Use where heat is recovered from odor-laden air and supplied to another place (area) is not
possible.
●
Avoid use where salt or hot water damage may occur.
●
Pre-heating is necessary if using the system in a cold climate (locations where winter
temperatures are below -15
°C).
11.1.2 Use in other special conditions
A
A’
C’
C
B
Saturation curve
Dry bulb temperature (°C)
Absolute humidity (kg/kg’)
Page 90

88
CHAPTER 2 ● Air Conditioning System Design Section
11.2 Noise Value of OA Processing Unit
The noise level specified for OA processing units is as that measured in an anechoic chamber. The sound level
may increase according to the installation construction material, and room contents.
When using the OA processing unit in a quiet room, it is recommended that measures such as installing a muffling
duct.
Note: Please consult with nearest OA processing unit supplier about availability of these parts.
11.3 Duct Design
●
Always treat the two ducts on the outdoor side (outdoor air intake and exhaust outlet) with insulation to prevent
frosting or condensation.
●
Always install heat insulation to prevent condensation on the supply air diffuser duct (system section material)
as well. (Heating and humidifying units only.)
●
The outdoor duct gradient must be 1/30 or more (to wall side) to prevent rain water from infiltrating the system.
●
Do not use the standard vent caps or round hoods where they may come into direct contact with rain water.
11.4 OA Processing Unit with Humidifier
●
In areas where freezing is anticipated, take steps to prevent the water supply pipes from freezing.
●
Always provide a gradient of 1/100 or more for the drain pipe.
●
Take steps to prevent condensation on the water supply and drain pipes.
●
Makes sure that the water supply to the humidifier is 40°C or less.
11.5 Transmission Rate of Various Gases and Related Maximum
Workplace Concentration
Measurement
Air volume Exhaust air
Supply air diffuser
Transmission
Max. workplace
conditions
Gas name ratio concentration
concentration
rate
concentrations
QSA/QRA CRA (ppm) CSA (ppm) (%) (ppm)
Hydrogen fluoride 1.0 36 <0.5 –0 0.6
Exhaust
air t = 24°C Hydrogen chloride 1.0 42 <0.5 –0 5
Nitric acid 1.0 20 <0.5 –0 10
Supply air t = 30°C Sulfulic acid 1.0 2.6 mg/m
3
–0 mg/m
3
–0 0.25
Measurement Trichlene 1.0 85.1 3.7 4.3 200
method
Acetone
1.0 3.3 0.15 4.5
1,000
•
Gas detection pipe
1.5 20.4 0.54 2.6
for HF, HCI, HNO
3 0.5 5.9 0.14 2.4
Xylene 1.0 5.9 0.5 8.5 150
• Chemical analysis 1.5 4.9 0.48 9.8
with colorimetric 0.5 38.4 0.17 0.4
method for H
2SO4 Isopropyl alcohol 1.0 44.7 2.0 4.5 400
1.5 31.0 2.6 8.4
• Gas Methanol 1.0 34.4 1.5 4.4 200
chromatography Ethanol 1.0 32.7 1.6 4.9 1,000
for organic
Ethyl acetate
0.5 3.3 0 0
solvents,etc.
alcohol
1.0 21.7 0.83 3.8 400
1.5 26.3 1.39 5.3
The fans are Ammonia 1.0 75.0 21 28 50
positioned at the Hydrogen sulfide 1.0 1.5 0.1 6.7 10
supply air exhaust Carbon monoxide 1.0 50 0.5 1
suction positions of Carbon dioxide 1.0 5,000 100 2
the element Smoke 1.0 1 - 2
Formaldehyde 1.0 0.5 0.01 2 0.08
Page 91

89
CHAPTER 2 ● Air Conditioning System Design Section
Note:●Water soluble gases and mists cannot be used because the amount that is transmitted with the water is
too great.
●
Acidic gases and mists cannot be used because these will accumulate in the element and cause
damage.
+
: OK
: Caution should be used
× : Should not be used
Main
Molecular
Gas Non-toxic/ Sulubility
Max.
+
Useability
generation Gas name
formula
vapour toxic/ in water workplace of Lossnay
site mist odor
m /m
g/100g
concentration Core
Sulfuric acid H
2SO
4 Mist Found 2,380 0.25
×
Nitric acid HNO
3 Mist Found 180 10
×
Phosphoric acid H
3PO
4 Mist Found 41 0.1
×
Acetic acid CH
3COOH Mist Bad odor 2,115 25
×
Chemical
Hydrogen chloride HCl Gas Found 427 58 5
×
plantor
Hydrogen fluoride HF Gas Found 90 0.6
×
chemical
Sulfur dioxide SO
2 Gas Found 32.8 0.25
laboratory
Hydrogen sulfide H2S Gas Found 2.3 10
Ammonia NH
3 Gas Bad odor 635 40 50
×
Phosphine PH
3 Gas Found 0.26 0.1
Methanol CH3OH Vapor Found Soluble 200
Ethanol CH
3CH2OH Vapor Found Soluble 1,000
Ketone Vapor Found Soluble 1,000
Skatole C
9H9N Gas Bad odor Minute
Toilet Ammonia NH
3 Gas Bad odor 635 40 50
×
Indole C9H7N Gas Bad odor Minute
Nitric monoxide NO 0.0043 50
Others
Ozone O
3 0.00139 0.1
Methane CH
4 0.0301
Chlorine Cl
2 Minute 0.5
Air Mixed gases Gas None 0.0167
Air
Oxygen O
2 Gas None 0.0283
(reference)
Nitrogen N
2 Gas None 0.0143
Carbon monoxide CO Gas Found 0.0214
Carbon dioxide CO
2 Gas None 0.759
11.6 Solubility of Odors and Toxic Gases, etc., in Water and Effect
on Lossnay Core
RR
Page 92

Page 93

CHAPTER 3
Control System
Design Section
Page 94

92
CHAPTER 3 ● Control System Design Section
OA processing unit fan operation when indoor
unit is stopped
OA processing unit stopping when indoor unit
is operated
Switching OA processing unit fan speed
Ventilation mode Auto
Humidifier (Only GUF-50/100RDH3) Auto (When heating)
Filter maintenance indicator (Optional setting)
OA processing unit error indicator
The sum of indoor units setting for one OA
16 units max
processing unit
The sum of interlocked OA processing units
1 unit
setting for one indoor unit
Start/Stop
Fan speed switching
Ventilation mode Auto
Humidifier (Only GUF-50/100RDH3) Auto (When heating)
Filter maintenance indicator (Optional setting)
OA processing unit error indicator
The sum of OA processing unit registering in
16 units max
one group
The sum of remote controllers and centralized
controllers registering to one OA processing 5 units max (Note)
unit
1. System Selection
Interlocked with indoor units
Non-interlocked OA processing units
TB3
Outdoor
unit
M-NET transmission line
MA Remote
controller
MA Remote
controller
cannot be used.
Indoor unit
OA processing
unit
Outdoor
unit
MA Remote
controller
OA processing
unit
OA processing
unit
OA processing
unit
Outdoor
unit
Group 1 Group 2
Connecting MA Remote controler and OA Processing Units
Group 3
00
OA processing
unit (IC Mode)
00
OA processing
unit (IC Mode)
00
OA processing
unit (IC Mode)
00
OA processing
unit (IC Mode)
MA Remote
controler
MA Remote
controler
MA Remote
controler
MA Remote
controler
Note: Number of local remote controller is 2 units max.
Group 1 : Multiple OA processing units (IC mode) only.
Group 2 : One OA processing unit (IC) and two Remote controllers.
Group 3 : One OA processing unit (IC) only.
Caution
●
The addresses of the entire system are set automatically so
make sure the address of each unit is initially set at 00
(setting at time of delivery).
●
When indoor units are not interlocked with OA processing
units switch the setting to IC mode (DIP-SW3-1 to ON).
●
When connecting two MA Remote controlers the same
group be sure to set one as the sub-remote.
●
You cannot use both M-NET remotes and MA Remote
controlers with OA procesesing units in the same group.
●
You cannot connect more than three Remote controlers to
OA processing units in the same group.
TB3
Page 95

93
CHAPTER 3 ● Control System Design Section
Central
Controller
System
TB7 TB3
Central controller system
Outdoor unit
Centralized
controller
MA Remote controller MA Remote controller
MA Remote controller
MA Remote
controller
MA Remote
controller
MA Remote
controller
Power supply unit
PAC-SC34KUA
Indoor
unit
Indoor
unit
OA processing
unit
OA processing
unit
OA processing
unit
OA processing
unit
OA processing
unit
OA processing
unit
OA processing
unit
Page 96

94
CHAPTER 3 ● Control System Design Section
1.1 System Designs. Example 1
Indoor units and OA processing unit interlocked system
Features
●
Interlocked operation with indoor units is possible.
●
Can also perform independent OA processing unit operations using MA/ME Remote controller.
System examples
The following groups can be configured.
Single refrigerant system
(
002
)
(
003
)(
004
)
(
005
)
(
006
)
(
007
)
(
008
)
(
009
)
(
010
)(
001
)
(
051
)
Group 1 : Group of one indoor unit and one OA processing unit in interlocked operation.
Group 2 : Group of multiple indoor units and one OA processing unit in interlocked operation.
Group 3 : Group of one indoor unit with two remote controllers and one OA processing unit in interlocked operation.
Group 4, 5 : Group of multiple groups and one OA processing unit in interlocked operation.
Group 1 : Group of one indoor unit and one OA processing unit in interlocked operation.
Group 2 : Group of multiple indoor units (with different refrigerants) and one OA processing unit in interlocked operation.
Group 3 : Group of multiple indoor units (with same refrigerant) and one OA processing unit in interlocked operation.
(
051
) (
055
)
(
002
)
(
001
)(
003
)
(
004
)
(
005
)(
006
)(
007
)
(
008
)
Outdoor unit
( ) address
( ) address
Indoor
unit
Group 1
Group 2 Group 3 Group 4 Group 5
MA Remote controller
MA Remote controller
MA Remote controller MA Remote controller
MA Remote controller
OA processing
unit
Outdoor unit Outdoor unit
Refrigerant 1 Refrigerant 2
Indoor
unit
Indoor
unit
Indoor
unit
Indoor
unit
Indoor
unit
Group 1 Group 2
Group 3
MA Remote controller MA Remote controller MA Remote controller
OA processing
unit
OA processing
unit
OA processing
unit
Indoor
unit
Indoor
unit
Indoor
unit
Indoor
unit
Indoor
unit
OA processing
unit
OA processing
unit
OA processing
unit
Multiple refrigerant system
(Main) (Sub)
Page 97

Local remote MELANS Series
MA Remote ME Remote Simple remote Group remote System remote Centralized Centralized
Model
controller controller controller controller controller controller controller
PAR-20MAA PAR-F27MEA
PAC-SE51CRA
PAC-SC30GRA PAC-SF41SCA
MJ-103MTRA
MJ-180A
or PAC-YT51CRA or G-50A
No. of controlable (Groups/Units)
1 Group/16 Units 1 Group/16 Units 1 Group/16 Units 8 Groups/16 Units
32 Groups/50 Units 50 Groups/50 Units
100 Groups/100 Units
200 Groups/200 Units
Start/Stop
Fan speed switching ×××
Ventilation mode switching ЧЧЧЧЧЧЧ
Humidifier switching
*1 *1 *1 *1 *1 *1 *1
(Only GUF-50/100RDH3)
Operation mode switching *2 *2 × *2 *2 *2 *2
Temperature setting *3 *3 *3 *3 *3 *3 *3
Priority instructions.
×××× ×
Local permitted/Prohibited
Status (Operation/Stop) × ×
Fan speed switching ×××
Ventilation mode ЧЧЧЧЧЧЧ
Humidifier (Only GUF-50/100RDH3)
× *4 × *4 × *4 × *4 × *4 × *4 × *4
Operation mode
Setting temperature *3 *3 *3 *3 *3 *3 *3
Error
Error contents
Filter sign ×
Local permitted/Prohibited
Weekly ЧЧЧЧЧ
Stop/Starts per day 2 2 ×××36
Stop/Starts per week ЧЧЧЧЧ21 42
Minumum setting (minutes)
10 10 ×××10 1
Error record ЧЧЧЧЧ
Switched & display : Group/Batch : Group only (or function available) × : Not available
95
CHAPTER 3 ● Control System Design Section
OA Processing unit function table (Interlocked settings)
Item Details
The sum of indoor units setting for one OA processing unit 16 units max
The sum of interlocked OA processing units setting for one indoor unit
1 unit
Independent Start/Stop of ventilation (OA processing unit) Possible
Fan speed switching High/Low
Ventilation mode switching Auto
Humidifier switching (Only GUF-50/100RDH3) Possible (When indoor unit is heating)
Operation mode switching Heat/Cool/Fan (Follows the operation mode of indoor unit)
Filter maintenance indicator (Optional setting) 3,000 h/1,500 h/4,500 h/No display
Error Display
•To operate OA processing units and indoor units by interlocking, it is necessary to perform
interlock setting from a remote controller.
• OA processing unit cannot be interlocked to another one.
• OA processing units set to group registration (non-interlocked) cannot be interlocked setting.
Restrictions and precautions
•
When the OA processing unit is interlocked setting, set the OA processing unit DIP switch 3-1 to off.
•
The OA processing unit will operate in the same mode as the synchronized indoor unit (heat, cool and fan).
(The OA processing unit will be cool when the indoor unit is operated in dry mode.)
•
To connect two MA Remote controllers to the same group, set one MA Remote controller as a subremote controller.
•
MA Remote controllers and other local remote controllers cannot be used together in the same group.
Controller function table especially regarded to the OA processing unit
OperationMonitoring
Scheduling/
Recording
Note: *1 When indoor unit is heating, interlocked OA processing unit is operating humidifier.
*2 The OA processing unit will operate in the same mode as the synchronized indoor unit (heat, cool and fan).
(The OA processing unit will be cool when the indoor unit is operated in dry mode.)
When using with multiple indoor units that are set differently, the OA processing unit will operate in the mode with priority of:
heat, cool and fan.
*3 In the case of GUF-50/100RDH3, temperature setting in heat mode is set at the OA processing unit DIP switch.
*4 When the “Heating” is displayed on the controller, the humidifier is also operating.
Page 98

96
CHAPTER 3 ● Control System Design Section
1.2 System Designs. Example 2
Non-interlocked OA processing unit system with remote controller
Features
●
Local remote controller can operate and monitor each group of OA processing units.
System example
The following groups can be configured.
Single refrigerant system
Group 1,2 : Groups of multiple OA processing units.
Group 3 : Group of multiple OA processing units with two remote controllers.
(
000
)(
000
)(
000
)(
000
)(
000
)(
000
)(
000
)
(
000
)
Outdoor unit
( ) address
Group 1
Group 2
Group 3
MA Remote controller MA Remote controller MA Remote controller
OA processing
unit
OA processing
unit
OA processing
unit
OA processing
unit
Note: On OA processing unit for a non-interlocked OA processing unit group, set DIP switch 3-1 (synchronous air
conditioning switch) to on.
Address setting is not required for a single refrigerant system (only when no M-NET remote controllers and
MELANS are used).
(Keep the factory set address (000) for both the outdoor unit and the OA processing units.)
Multiple refrigerant system
Group 1,3 : Groups of multiple OA processing units.
Group 2 : Group of multiple OA processing units (with different refrigerants).
(
051
) (
055
)
(
002
)
(
001
)(
004
)(
003
) (
008
)(
007
)(
006
)(
005
)
Outdoor unit
Outdoor unit
Refrigerant 1 Refrigerant 2
( ) address
Group 1 Group 2 Group 3
MA Remote controller MA Remote controller MA Remote controller
OA processing
unit
OA processing
unit
OA
processing
unit
OA processing
unit
OA processing
unit
Note: On OA processing unit for a non-interlocked OA processing unit group, set DIP switch 3-1 (synchronous air
conditioning switch) to on
.
Page 99

Local remote MELANS Series
Model
MA Remote ME Remote Simple remote Group remote System remote Centralized Centralized
controller controller controller controller controller controller controller
PAR-20MAA PAR-F27MEA
PAC-SE51CRA
PAC-SC30GRA PAC-SF41SCA
MJ-103MTRA
MJ-180A
or PAC-YT51CRA or G-50A
No. of controlable (Groups/Units) 1 Group/16 Units 1 Group/16 Units 1 Group/16 Units 8 Groups/16 Units
32 Groups/50 Units 50 Groups/50 Units
100 Groups/100 Units
200 Groups/200 Units
Start/Stop
Fan speed switching ×
Ventilation mode switching ЧЧЧЧЧЧЧ
Humidifier switching
*1 *1 *1 *1 *1 *1 *1
(Only GUF-50/100RDH3)
Operation mode switching *3 *3 × *4 *4 *4 *4
Temperature setting
Priority instructions.
××××
Local permitted/Prohibited
Status (Operation/Stop)
Fan speed switching ×
Ventilation mode ЧЧЧЧЧЧЧ
Humidifier (Only GUF-50/100RDH3)
× *2 × *2 × *2 × *2 × *2 × *2 × *2
Operation mode ×
Setting temperature
Error
Error contents
Filter sign ×
Local permitted/Prohibited
Weekly ЧЧЧЧЧ
Stop/Starts per day 2 2 ×××36
Stop/Starts per week ЧЧЧЧЧ21 42
Minumum setting (minutes)
10 10 ×××10 1
Error record ××× ×
Switched & display : Group/Batch : Group only (or function available) × : Not available
97
CHAPTER 3 ● Control System Design Section
OA Processing unit function table (Group settings)
Controller function table
Item Details
The sum of remote controllers and/or MELANS units that can be 5 units max
connected to one OA processing unit (Number of local remote controller is 2 units max.)
Operation of two remote controllers in one group Possible
Fan speed switching High/Low
Ventilation mode Auto
Humidifier switching (Only GUF-50/100RDH3) Possible (When heating)
Operation mode switching Heat/Cool/Fan
Filter maintenance indicator (Optional setting) 3,000 h/1,500 h/4,500 h/No display
Error Display
• OA processing unit cannot be interlocked to another one.
• OA processing units set to group registration (non-interlocked) cannot be interlocked setting.
Restrictions and precautions
• When the OA processing unit is set to group registration, set the OA processing unit DIP switch
3-1 to on.
•
To connect two MA Remote controllers to the same group, set one MA Remote controller as a subremote controller.
•
MA Remote controllers and other local remote controllers cannot be used together in the same group.
OperationMonitoring
Scheduling/
Recording
Note: *1 When in the “Heating” mode, the humidifier will also operate.
*2 When the “Heating” is displayed on the controller, the humidifier is also operating.
*3 “Dry” mode cannot be selected.
*4 “Dry” display flashes. It indicates “Dry” mode is prohibited.
Page 100

98
CHAPTER 3 ● Control System Design Section
1.3 System Design. Example 3
Central controller system with MELANS
Features
●
The Mitsubishi Electric air-conditioner network system (MELANS) can operate and monitor each group of OA
processing units and air-conditioners.
●
Can also perform operations using OA processing unit remote controller.
System example
The following groups can be configured.
Group 1 : Group of multiple indoor units and one OA processing unit in interlocked operation.
Group 2 : Group of one indoor unit with two remote controllers and one OA processing unit in interlocked operation.
Group 3, 4 : Group of multiple groups and one OA processing unit in interlocked operation.
Group 5 : Group of multiple OA processing units.
(
000
)
(
051
)
(
001
)
(
003
)
(
005
)(
007
)
(
002
) (
004
)
(
010
)
(
009
)
(
006
) (
008
)
Outdoor unit
Centralized controller
Power supply
unit
( ) address
Indoor
unit
Indoor
unit
Indoor
unit
Indoor
unit
Indoor
unit
Group 1
Group 5
Group 2 Group 3 Group 4
MA Remote controller
MA Remote
controller
MA Remote
controller
MA Remote
controller
MA Remote
controller
OA
processing
unit
OA processing
unit
OA processing
unit
OA
processing
unit
Note:●On OA processing unit for a non-interlocked OA processing unit group, set DIP switch 3-1 (synchronous
air conditioning switch) to on.
(In the system example shown above, Group 5 is non-interlocked OA processing unit.)
●
Perform group setting by specifying the same content as the group setting implemented for MA Remote
controller wiring from the MELANS (centralized controller).
●
To operate OA processing units and indoor units by interlocking, it is necessary to perform interlock
setting from the MELANS. (For a system that uses the MELANS, be sure to perform interlock setting
from the MELANS, not from a local remote controller.)
 Loading...