

Page 1
June.2012
TECHNICAL MANUAL FOR NORTH AMERICA
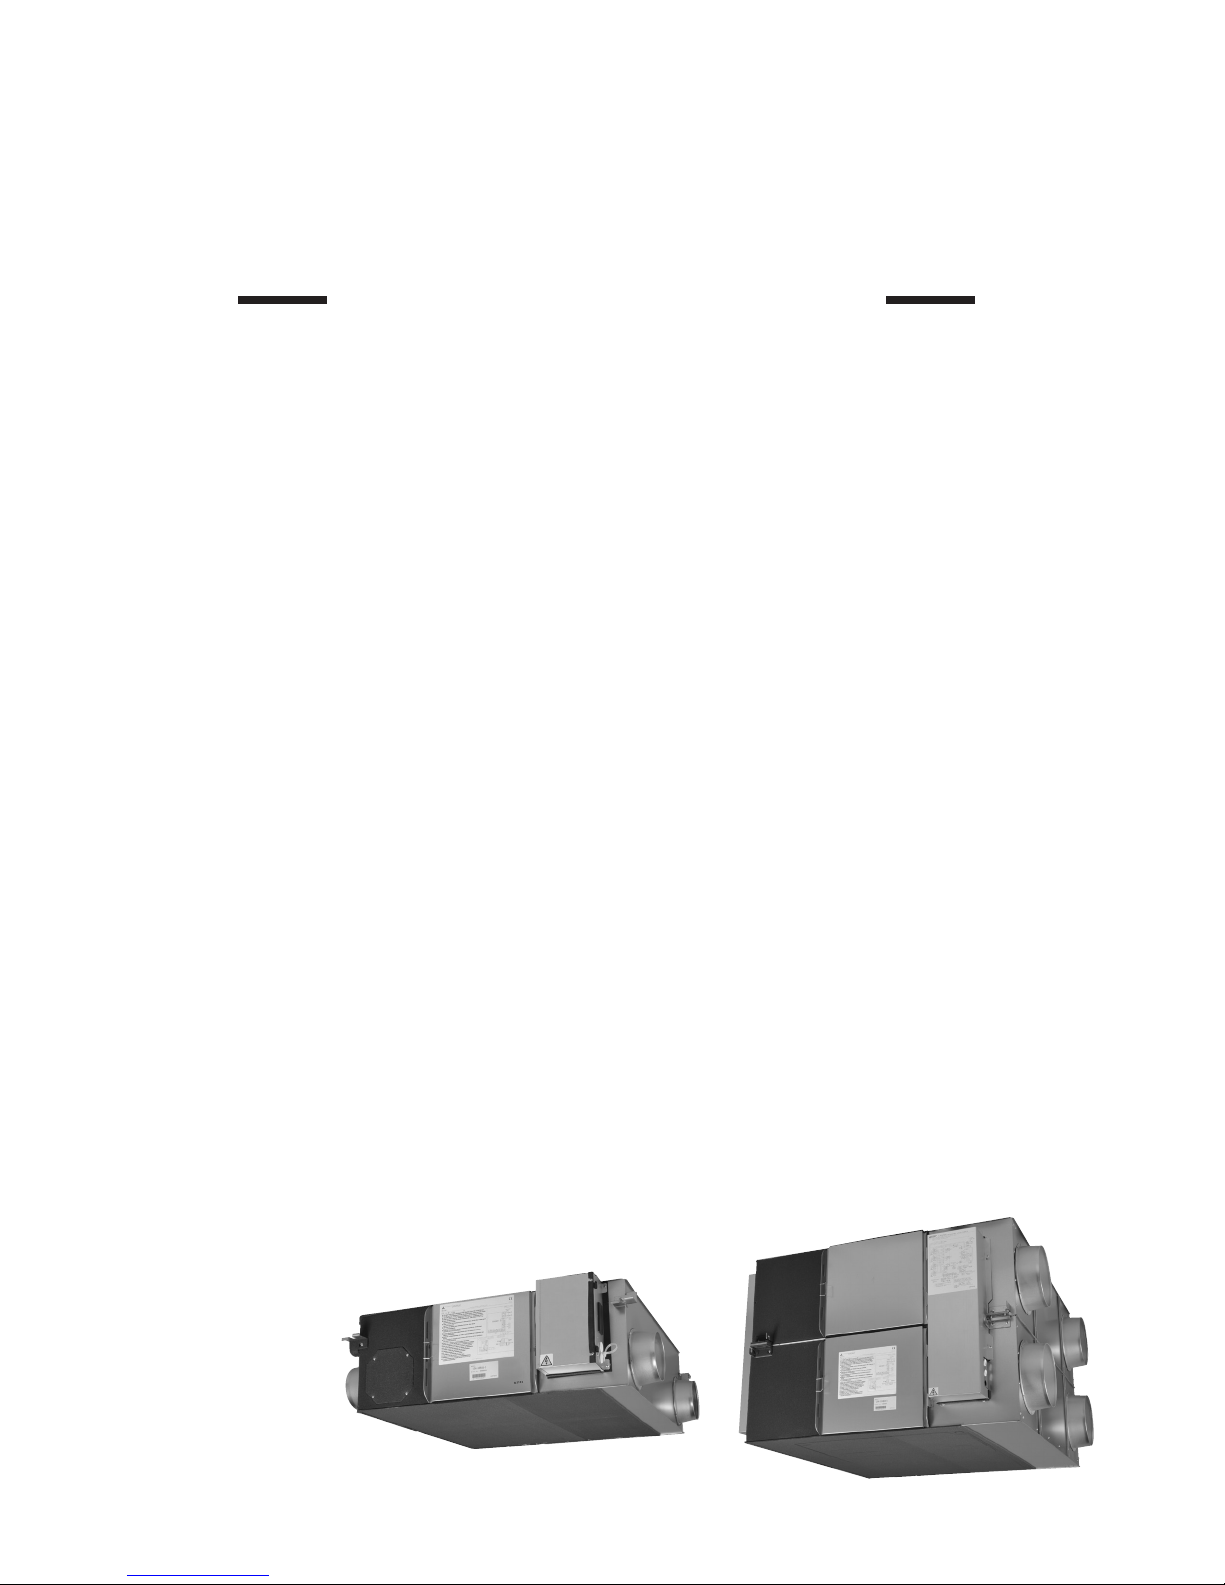
Models Lossnay Unit
LGH-F300RX5-E
LGH-F470RX
LGH-F600RX
LGH-F1200RX
5-E
5-E
5-E
Lossnay Remote Controller
PZ-60DR-E
PZ-41SLB-E
PZ-52SF-E
Page 2

Y11-001 Jun.2012 <MEE>
Page 3

CONTENTS
Lossnay Unit
CHAPTER 1 Ventilation for Healthy Living
1. Necessity of Ventilation
2. Ventilation Standards
3. Ventilation Method
4. Ventilation Performance
5. Ventilation Load
.................................................................................................................................................
CHAPTER 2 Lossnay Construction and Technology
1. Construction and Features
2. Lossnay Core Construction and Technology
3. Total Energy Recovery Efficiency Calculation
4. What is a Psychrometric Chart?
5. Lossnay Energy Recovery Calculation
CHAPTER 3 General Technical Considerations
1. Lossnay Energy Recovery Effect
2. Calculating Lossnay Cost Savings
3. Psychrometric Chart
4. Determining Lossnay Core Resistance to Bacterial Cross-Contamination and Molds
5. Lossnay Core Fire : retardant property
6. Lossnay Core Sound Reducing Properties Test
7. Changes in the Lossnay Core
8. Comparing Energy Recovery Techniques
....................................................................................................................................
.......................................................................................................................................
............................................................................................................................................
....................................................................................................................................
..............................................................................................................................
.....................................................................................................
..................................................................................................
........................................................................................................................
..............................................................................................................
......................................................................................................................
....................................................................................................................
.........................................................................................................................................
.............................................................................................................
...............................................................................................
..........................................................................................................................
........................................................................................................
.....................................
U-2
U-3
U-4
U-7
U-9
U-16
U-16
U-18
U-19
U-20
U-22
U-24
U-26
U-28
U-30
U-31
U-32
U-34
CHAPTER 4 Characteristics
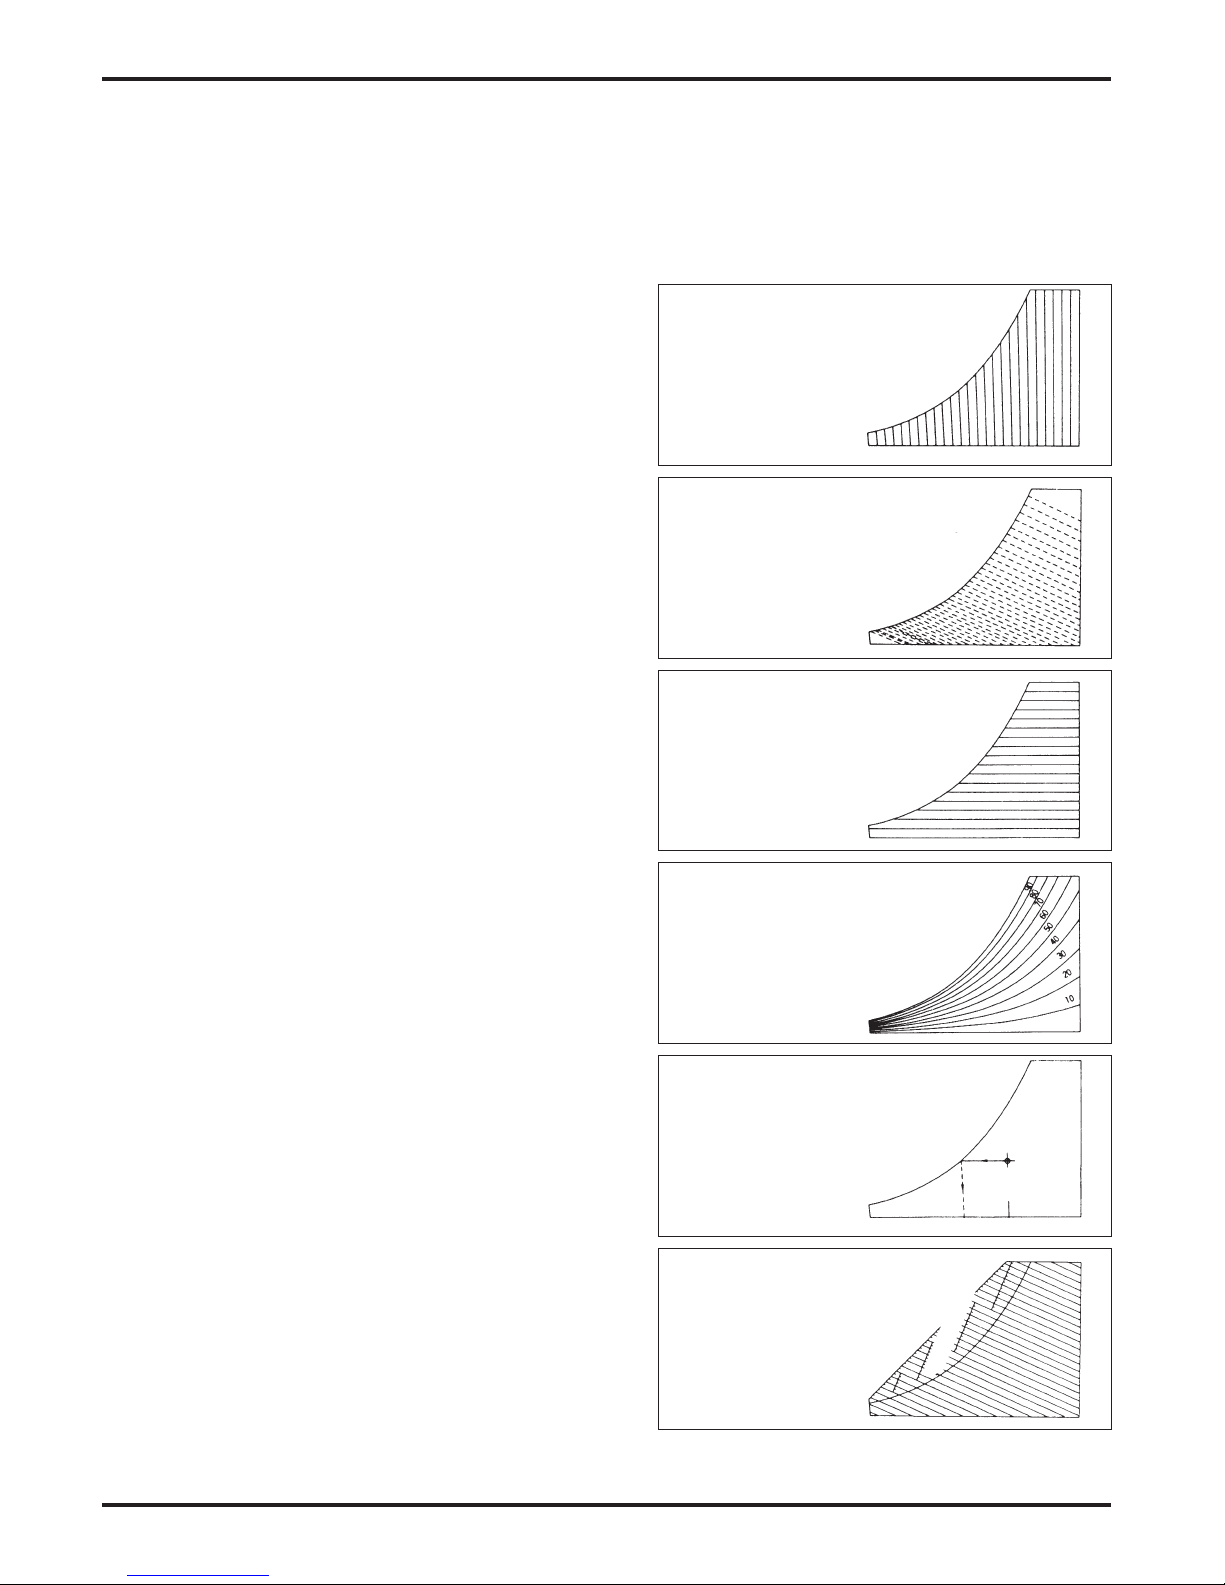
1. How to Read the Characteristic Curves
2. Calculating Static Pressure Loss
3. How to Obtain Efficiency from Characteristic Curves
4. Sound
5. NC Curves
...............................................................................................................................................................
.......................................................................................................................................................
...........................................................................................................
.......................................................................................................................
.......................................................................................
CHAPTER 5 System Design Recommendations
1. Lossnay Operating Environment
2. Sound Levels of Lossnay units with Built-in Fans
3. Attaching Air Filters
4. Constructing the Ductwork
5. Bypass Ventilation
6. Night purge function
7. Transmission Rate of Various Gases and Maximum Workplace Concentration Levels
8. Solubility of Odors and Toxic Gases, etc., in Water and the Effect on the Lossnay Core
9. Automatic Ventilation Switching
10. Alternate Installation for Lossnay
11. Installing Supplementary Fan Devices
..........................................................................................................................................
............................................................................................................................................
.........................................................................................................................................
......................................................................................................................
............................................................................................
...............................................................................................................................
.........................................................................................................................
.....................................................................................................................
.............................................................................................................
....................................
.................................
U-38
U-38
U-41
U-42
U-48
U-52
U-53
U-53
U-53
U-53
U-53
U-53
U-54
U-55
U-56
U-57
i
Page 4

CHAPTER 6 Examples of Lossnay Applications
1. Large Office Building
2. Small-Scale Urban Building
3. Hospitals
4. Schools
5. Convention Halls, Wedding Halls in Hotels
6.
Public Halls (Facilities such as Day-care Centers)
..........................................................................................................................................................
............................................................................................................................................................
........................................................................................................................................
.............................................................................................................................
.......................................................................................................
.............................................................................................
CHAPTER 7 Installation Considerations
1. LGH-Series Lossnay Ceiling Embedded-Type (LGH-RX5 Series)
CHAPTER 8 Filters
1. Importance of Filters
2. Dust
3. Calculation Table for Dust Collection Efficiency for Each Lossnay Filter
4. Comparing Dust Collection Efficiency Measurement Methods
5. Calculating Dust Concentration Levels
..................................................................................................................................................................
........................................................................................................................................
............................................................................................................
CHAPTER 9 Service Life and Maintenance
1. Service Life
2. Cleaning the Lossnay Core and Pre-lter
.......................................................................................................................................................
.........................................................................................................
CHAPTER 10 Ventilation Standards in Each Country
1. Ventilation Standards in Each Country
2. United States of America
3 . United Kingdom
................................................................................................................................................
...................................................................................................................................
..............................................................................................................
....................................................................
...........................................................
........................................................................
U-60
U-64
U-65
U-67
U-68
U-69
U-72
U-76
U-76
U-77
U-78
U-80
U-82
U-82
U-86
U-87
U-87
CHAPTER 11 Lossnay Q and A
Note: The word “LGH-F300 to 1200RX5-E” in this Lossnay Technical Manual expresses both the products for 50Hz area and
60Hz area, except for some parts where model name difference are written clearly.
.......................................................................................................................
U-90
ii
Page 5

Lossnay Remote Controller
1. Summary
2. Applicable Models
3. Terminology
.....................................................................................................................................................................
...............................................................................................................................................
.............................................................................................................................................................
4. System Features and Examples
4.1 Features
4.2 System Examples
4.3 System Selection
4.4 Basic System
4.5 Interlocking with M-Series or P-Series
4.6 Combining with City Multi
.........................................................................................................................................................
...........................................................................................................................................
............................................................................................................................................
..................................................................................................................................................
...........................................................................................................
...............................................................................................................................
5. Examples of Applications Using Various Input and Output Terminals
5.1 External Control Operating Mode Selection
5.2 Delayed Interlocked Operation
5.3 Multiple External Device Operation (PZ-60DR-E, PZ-41SLB-E, M-NET)
5.4 Multiple Lossnay Units Interlocked with One Indoor Unit (M-NET only)
5.5 Operation monitor output
5.6 Malfunction monitor output
5.7 By-pass operation monitor output
5.8 Connection Method
5.9
When switching High/Low/Extra-Low fan speed externally (when CO2 sensor or other equipment is connected)
5.10 When switching By-pass externally
5.11 When using the remote/local switching and the ON/OFF input (level signal)
5.12
When connecting to the City Multi, Lossnay remote controller (PZ-52SF-E) or Mitsubishi Electric Air-Conditioner Network System (MELANS)
........................................................................................................................................
........................................................................................................................
................................................................................................................................
.............................................................................................................................
...................................................................................................................
................................................................................................................
...................................................................................................
.......................................................
.........................................................
.................................................
.....
....
C-3
C-3
C-4
C-5
C-6
C-8
C-11
C-13
C-14
C-23
C-24
C-24
C-25
C-26
C-26
C-26
C-26
C-28
C-29
C-29
C-30
6. Precautions When Designing M-NET Systems
6.1 M-NET Transmission Cable Power Supply
6.2
Restrictions When the Lossnay Units are Connected to the Central Controller M-NET Transmission Cable
6.3 Wiring Example
6.4 Power Supply to the Indoor Unit Transmission Cable
..............................................................................................................................................
.....................................................................................................
7. M-NET Cable Installation
7.1 Precautions When Installing Wiring
7.2 Electrical Wiring
7.3 Control Cable Length
..............................................................................................................................................
.......................................................................................................................................
................................................................................................................
8. M-NET System Designs
8.1 Address Denitions
8.2 Precautions When Setting the Groups (when not interlocked with City Multi indoor units)
8.3 Precautions When Performing Interlock Settings (when interlocked with City Multi indoor units)
........................................................................................................................................
..........
.....................................................................................
.............................
...................
C-31
C-31
C-32
C-33
C-34
C-35
C-36
C-37
C-39
C-39
iii
Page 6

9. Automatic Ventilation Switching
9.1 Effect of Automatic Ventilation Mode
9.2 Ventilation mode control
..................................................................................................................................
..............................................................................................................
10. Troubleshooting
10.1 Service Flow
10.2 Checklist
...................................................................................................................................................
.........................................................................................................................................................
11. Installation method
11.1 Electrical installation
11.2 Connecting the power supply cable
11.3 System conguration
11.4 Function Setting
11.5 Trial operation
.......................................................................................................................................
................................................................................................................
......................................................................................................................................
..............................................................................................................................................
.................................................................................................................................................
12. Lossnay Remote Controller (PZ-60DR-E)
12.1 Parts Names
12.2 Setting the Day of the Week and Time
12.3 Using the Remote Controller
12.4 Care and Maintenance
12.5 Servicing
12.6 How to Install
12.7 Test Run
12.8 Function Selection
...................................................................................................................................................
...........................................................................................................
..........................................................................................................................
...................................................................................................................................
........................................................................................................................................................
..................................................................................................................................................
.........................................................................................................................................................
..........................................................................................................................................
C-40
C-40
C-44
C-45
C-64
C-66
C-66
C-72
C-76
C-78
C-79
C-79
C-83
C-83
C-84
C-85
C-86
13. Lossnay Remote Controller (PZ-41SLB-E)
..........................................................................................
14. Lossnay M-NET Remote Controller (PZ-52SF-E)
15. Appendix
15.1 Centralized Controller (AG-150A)
15.2 Remote Controllers for M-Series or P-Series indoor units
15.3 ME Remote Controller (PAR-F27MEA)
...................................................................................................................
........................................................................................................
.............................................................................
............................................................................
C-91
C-92
C-93
C-100
C-103
iV
Page 7

Page 8
Lossnay Unit
Page 9

Page 10
CHAPTER 1
Ventilation for Healthy Living
Page 11
CHAPTER 1 • Ventilation for Healthy Living
Ventilation air must be introduced constantly at a set ratio in an air-conditioning system. The ventilation air introduced is to be
mixed with the return air to adjust the temperature and humidity, supply oxygen, reduce odors, remove tobacco smoke, and to
increase the air cleanliness.
The standard ventilation (outdoor air intake) volume is determined according to the type of application, estimated number of
occupants in the room, room area, and relevant regulations. Systems that accurately facilitate these requirements are required
in buildings.
1. Necessity of Ventilation
The purpose of ventilation is basically divided into “oxygen supply”, “air cleanliness”, “temperature control” and “humidity control”.
Air cleanliness includes eliminating “odors”, “gases”, “dust” and “bacteria”. Ventilation needs are divided into “personal comfort”,
“optimum environment for animals and plants”, and “optimum environment for machinery and constructed materials”.
Ventilation regulations are detailed in a variety of codes and standards applied to mechanical systems in buildings. Energy
efficiency codes also often apply to the design of ventilation systems.
1.1 Room Air Environment in Buildings
In Japan, the “Building Management Law”, a law concerning the sanitary environment in buildings, designates 11 applications
including offices, shops, and schools with a total floor area of 32,300ft2 (3,000m2) or more, as buildings. Law maintenance
and ventilation, water supply, discharge management according to the Environmental Sanitation Management Standards is
obligatory.
The following table gives a specific account of buildings in Tokyo.
(Tokyo Food and Environment Guidance Center Report)
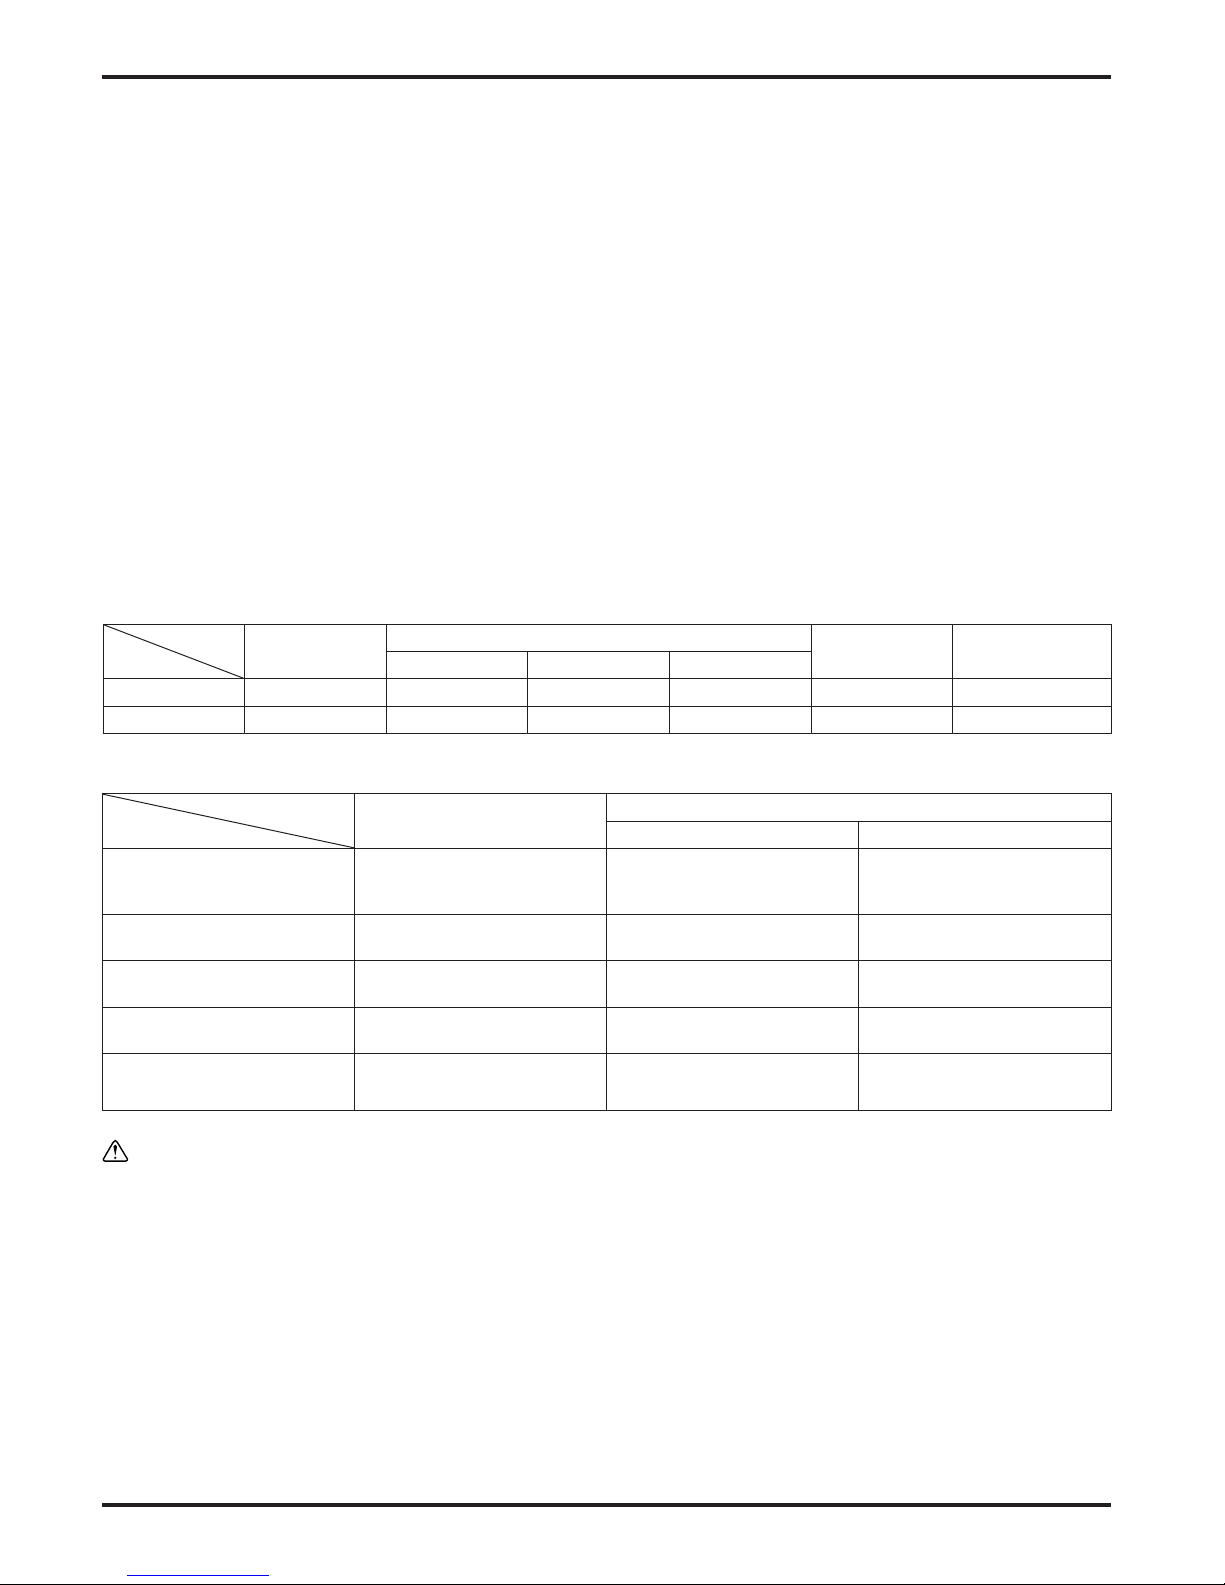
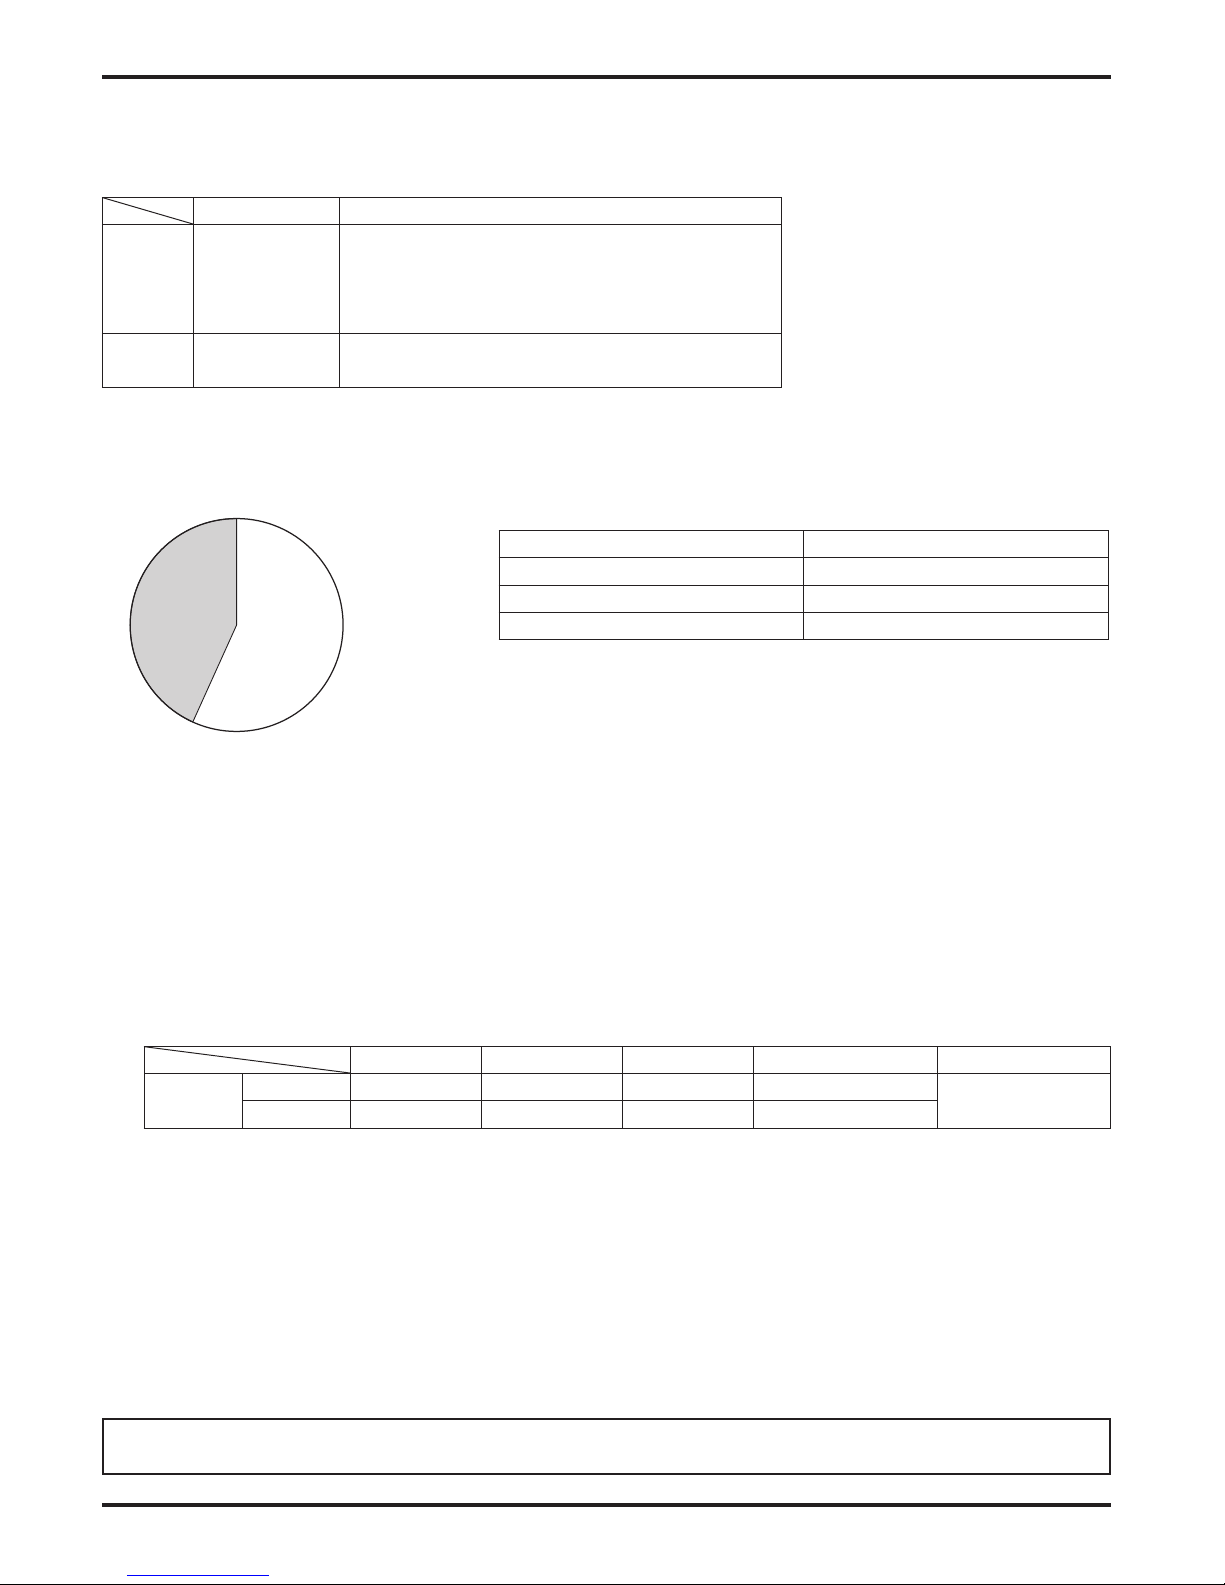
Specic Account of Buildings in Tokyo (March, 2003)
Number of Buildings %
Offices 1,467 56.7
Shops 309 22.0
Department Stores 63 2.4
Schools 418 16.2
Inns 123 4.8
Theaters 86 3.3
Libraries 12 0.5
Museums 11 0.4
Assembly Halls 63 2.4
Art Museums 8 0.3
Amusement Centers 27 1. 0
Total 2,587 100.0
Note: Excludes buildings with an expanded oor space of 32,300 to 58,820ft2 (3,000 to 5,000m2) in particular areas.
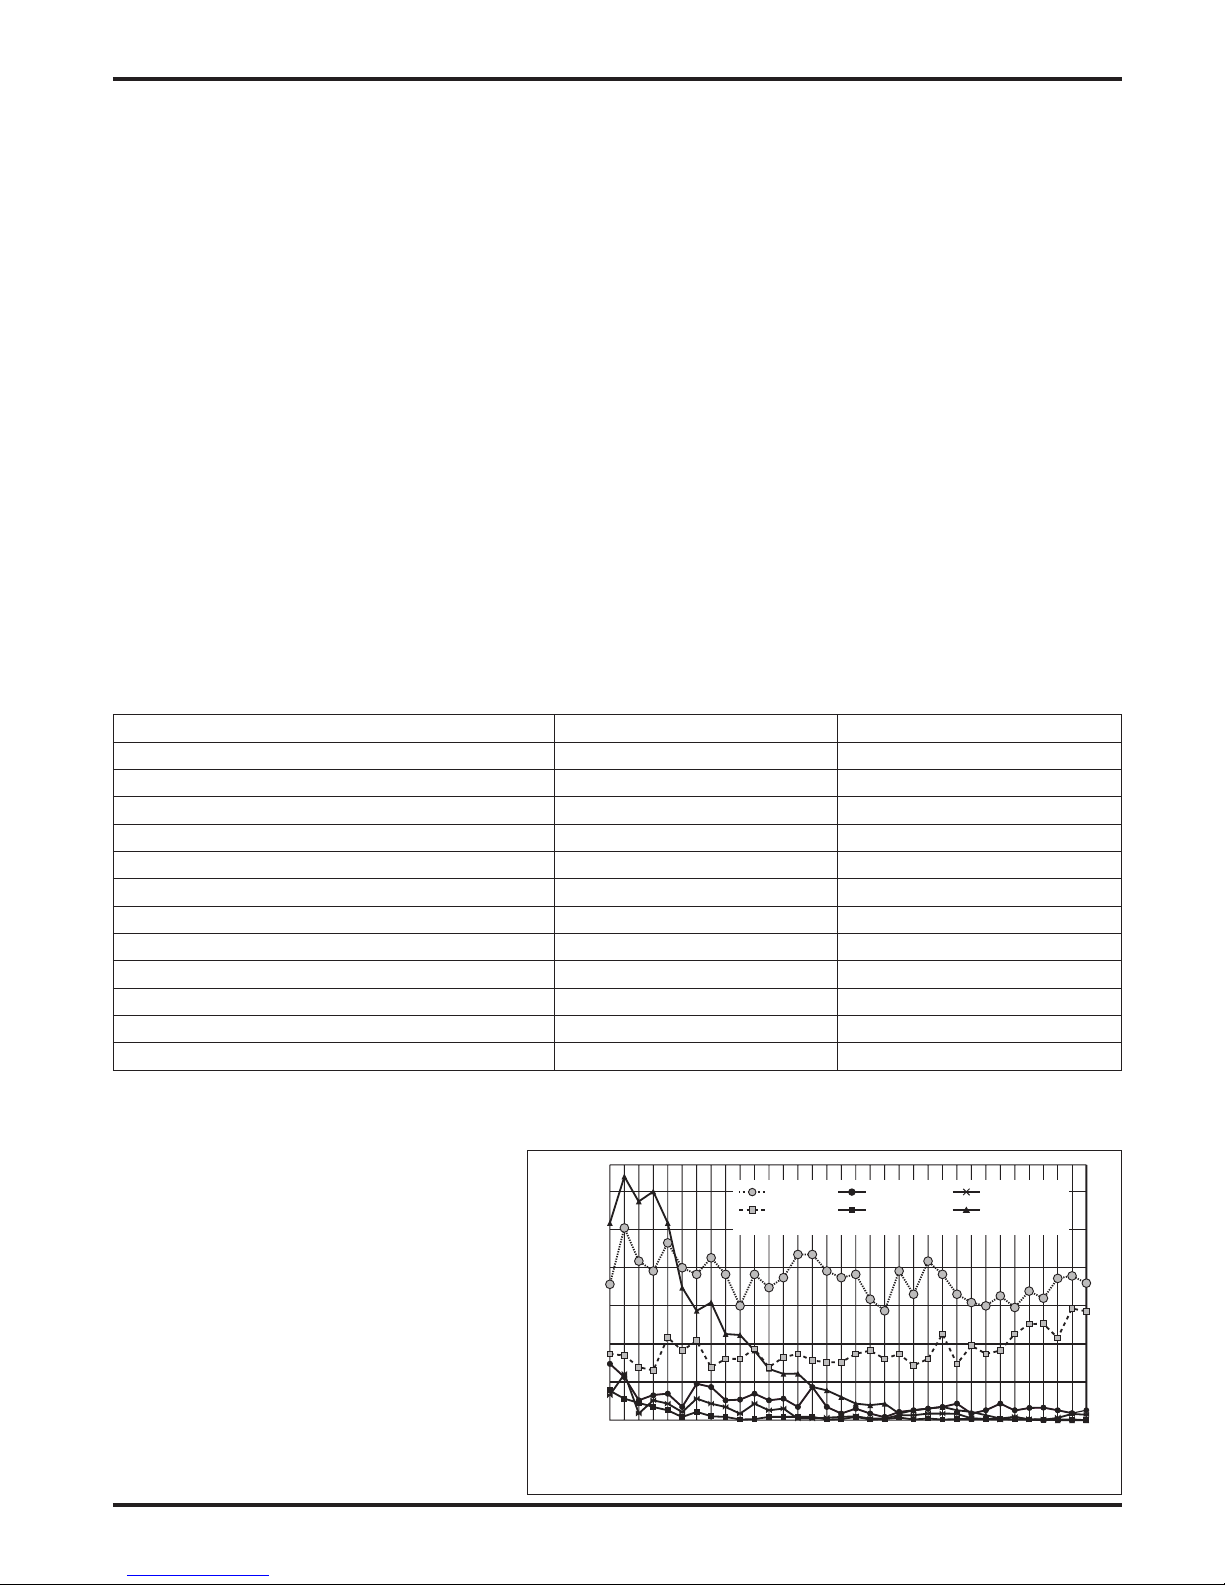
Results of the air quality measurement public
Percentage Unsuitable Air Quality by Year
inspection and the standard values that were
not met (percentage of unsuitability) for the
approximately 500 buildings examined in 1980
are shown in the chart at the right.
There was a large decrease in high percentages
60
50
40
relative humidity
carbon dioxide
temperature
carbon monoxide
ventilation
floating particles
(tobacco smoke)
of floating particles, but there was almost no
change in temperature and carbon dioxide. The
30
highest percentage of unsuitability in 2006 is
relative humidity with 36%, followed by carbon
dioxide at 28%.
20
10
Percentage of unsuitable air quality (%)
0
76 77 7879 80 8171 73 75
(From reference data in the 2006 edition of the “Water Supply
Division, Dept. of Localized Public Health, Tokyo Metropolitan
Government, Bureau of Public Health”)
82
83 84
87
85
88 899091 92 93 94 95 96 97 98 9900 01 02 03 0405 06
86
(year)
U-2
Page 12
CHAPTER 1 • Ventilation for Healthy Living
In Japan, an Instruction Guideline based on these regulations has been issued, and unified guidance is followed. Part of the
Instruction Guideline regarding ventilation is shown below.
The ventilation air intake must be 33ft (10m) or higher from ground level, and be located at an appropriate distance from the
•
exhaust air outlet. (Neighbouring buildings must also be considered.)
The ventilation air intake volume must be 15 to 18 CFM·occupant. (25 to 30 m3/h·occupant.)
•
An air volume measurement access hole must be installed at an appropriate position to measure the treated air volume of
•
the ventilating device.
Select the position and shape of the supply diffuser and return grille to evenly distribute the ventilation air in the room.
•
1.2 Effect of Air Contamination
Effect of Oxygen (O2) Concentration
Concentration (%) Standards and Effect of Concentration Changes
Approx. 21 Standard atmosphere.
20.5
20 - 19
18 Industrial Safety and Health Act. (Hypoxia prevention regulations.)
16 Normal concentration in exhaled air.
16 - 12
15 Flame in combustion devices will extinguish.
12 Short term threat to life.
7 Fatal
Ventilation air volume standard is a guideline where concentration does not decrease more than 0.5%
from normal value. (The Building Standard Law of Japan)
Oxygen deciency of this amount does not directly endanger life in a normal air pressure, but if there is a
combustion device in the area, the generation of CO will increase rapidly due to incomplete combustion.
Increase in pulse and breathing; resulting in dizziness and headaches.
Effect of Carbon Monoxide (CO) 10,000 ppm = 1%
Concentration (ppm)
0.01 - 0.2 Standard atmosphere.
5 Tolerable long-term value.
10
20
50
100
200 Light headache in the frontal lobe in 2 to 3 hours.
400 Headache in the temporal lobe, nausea in 1 to 2 hours; headache in the back of head in 2.5 to 3 hours.
800 Headache, dizziness, nausea, convulsions in 45 minutes. Comatose in 2 hours.
1,600 Headache, dizziness in 20 minutes. Death in 2 hours.
3,200 Headache, dizziness in 5 to 10 minutes. Death in 30 minutes.
6,400 Death in 10 to 15 minutes.
12,800 Death in 1 to 3 minutes.
Several 10,000 ppm
(Several %)
The Building Standard Law of Japan, Law for Maintenance of Sanitation in Buildings.
Environmental standard for a 24-hour average.
Considered to be the tolerable short-term value.
Environmental standard for an 8-hour average.
Tolerable concentration for working environment.
(Japan Industrial Sanitation Association)
No effect for 3 hours. Effect noticed after 6 hours.
Headache, illness after 9 hours; harmful for long-term but not fatal.
Level may be found in automobile exhaust.
Effect of Concentration Changes
Approx. 5 ppm is
the annual
average value in
city
environments.
This value may
exceed 100 ppm
near roads, in
tunnels and
parking areas.
U-3
Page 13
CHAPTER 1 • Ventilation for Healthy Living
Effect of Carbon Dioxide (CO2)
Concentration (%) Effect of Concentration Changes
0.03 (0.04) Standard atmosphere.
0.04 - 0.06 City air.
0.07 Tolerable concentration when many occupants stay in the space for long time.
0.10
0.15 Tolerable concentration used for ventilation calculations.
0.2 - 0.5 Relatively poor.
0.5 or more Very poor.
0.5 Long-term safety limits (U.S. Labor Sanitation) ACGIH, regulation of working offices.
2 Depth of breathing and inhalation volume increases 30%.
3 Work and physical functions deteriorate, increase breathing doubles.
4 Normal exhalation concentration.
4 - 5
8
18 or more Fatal
Note: According to Facility Check List published by Kagekuni-sha.
General tolerable concentration.
The “Building Standard Law” of Japan, “Law for Maintenance of Sanitation in Buildings”.
The respiratory center is stimulated; depth and times of breathing increases. Dangerous if inhaled for a
long period. If an O2 deciency also occurs, conditions will rapidly deteriorate and become dangerous.
When inhaled for 10 minutes, breathing difficulties, redness in the face and headaches will occur.
Conditions will worsen when there is also an O2 deciency .
There is no toxic level in
CO2 alone.
However, these
tolerable concentrations
are a guideline of the
contamination estimated
when the physical and
chemical properties of
the air deteriorate in
proportion to the
increase of CO2.
1.3 Effect of Air Contamination in Buildings
Dirtiness of interior
•
New ceilings, walls and ornaments will turn yellow from dust in 1 to 2 years.
2. Ventilation Standards
The legal standards for ventilation differ according to each country. Please follow the standards set by your country. In the U.S.,
ASHRAE revised their standards in 1989 to become more strict.
U-4
Page 14
CHAPTER 1 • Ventilation for Healthy Living
3. Ventilation Method
3.1 Comparing of Ventilation Methods
There are two main types of ventilation methods.
Centralized Ventilation Method
Mainly used in large buildings, with the ventilation air intake being installed in one machine room. For this method, primary
treatment of the ventilation air, such as energy recovery to the intake air and dust removal, is performed via distribution to the
building by ducts.
Independent Zoned Ventilation Method
Mainly used in small to medium sized buildings, with areas being ventilated using ventilation air intake via independent
ventilation devices. The use of this method has recently increased as independent control is becoming more feasible.
Centralized Ventilation Method Independent Zoned Ventilation Method
1) System operation with cassette-type indoor units of air conditioner
Air intake
(ventilation
air)
Filters
Lossnay
Exhaust
Supply fan
Each unit
Air exhaust
(stale air)
Cassette-type indoor units of
air conditioner or fan coil unit
Exhaust grill
Ceiling recessedtype Lossnay
Finished ceiling
Exhaust air
Ventilation air
2) System operation with ceiling embedded-type indoor units of air conditioner
Ceiling embedded-type indoor units
of air conditioner or fan coil unit
3)
Independent operation with ceiling suspended-type indoor units of air conditioner
Cassette-type or ceiling
suspended-type indoor units of
air conditioner or fan coil unit
Exhaust grill
Supply grill
Ceiling recessedtype Lossnay
Finished ceiling
Exhaust grill
Finished ceiling
Exhaust air
Ventilation air
Ceiling recessedtype Lossnay
Exhaust air
Ventilation air
U-5
Page 15
CHAPTER 1 • Ventilation for Healthy Living
Comparing Centralized Ventilation and Independent Zoned Ventilation Methods
Centralized Ventilation Method Independent Zoned Ventilation Method
Fan Power
Installation Area
Zoning
System Flexibility
Design
Control
The air transfer distance is long, thus requiring
much fan power.
• Independentequipmentroomisrequired.
• Ductspaceisrequired.
• Penetrationofoorswithverticalshaftisnot
recommended in terms of re prevention.
Generalized per system. Can be used for any one area.
• Designofouterwallisnotlost.
• Theindoorsupplyairdiffuserandreturngrillecan
be selected without restrictions for an appropriate
design.
• Astheusagesettimeandventilationvolume
control, etc., are performed in a central monitoring
room, the user’s needs may not be met
appropriately.
• Alargeamountofventilationisrequiredevenfor
a few occupants.
As the air transfer distance is short, the fan power is
small.
• Independentequipmentroomisnotrequired.
• Pipingspaceisrequiredonlyabovetheceiling.
• Thenumberofintakesandexhaustairoutletson
an outside wall will increase; design must be
considered.
• Thedesignwillbexedduetoinstallationttings,
so the design of the intakes and exhaust air
outlets must be considered.
• Theuserineachzonecanoperatetheventilator
without restrictions.
• Theventilatorcanbeoperatedevenduringoff-
peak hours.
Comfort
Maintenance and
Management
Trouble inuence
System Management
Costs
• Anidealsupplyairdiffuserandreturngrille
position can be selected as the supply air diffuser
and return grille can be positioned without
restrictions.
•
The only noise in the room is the sound of air movement.
• Antivibrationmeasuresmustbetakenasthefanin
the equipment room is large.
• Centralizedmanagementiseasyasitcanbe
performed in the equipment room.
• Theequipmentcanbeinspectedatanytime.
• Theentiresystemisaffected.
• Immediateinspectioncanbeperformedinthe
equipment room.
Because there are many common-use areas, if the
building is a tenant building, an accurate
assessment of operating cost is difficult.
• Considerationmustbemadebecauseofthe
noise from the main unit.
• Antivibrationmeasuresareoftennotrequiredas
the unit is compact and any generated vibration
can be dispersed.
• Workefficiencyispoorbecausetheequipmentis
not centrally located.
• Anindividualunitcanbeinspectedonlywhenthe
room it serves is vacant.
• Limitedasonlyindependentunitsareaffected.
• Consultationwiththetenantisrequiredpriorto
inspection of an individual unit.
Invoicing for each zone separately is possible, even
in a tenant building.
U-6
Page 16

CHAPTER 1 • Ventilation for Healthy Living
4. Ventilation Performance
The ventilation performance is largely affected by the installation conditions. Optimum performance may not be achieved
unless the model and usage methods are selected according to the conditions.
Generally, the ventilation performance is expressed by “air volume” and “wind pressure (static pressure)”.
4.1 Air Volume
Air volume equals the volume of air exhausted (or supplied) by the unit in a given period, and is expressed in CFM or m3/hr (hour).
4.2 Wind Pressure
When a piece of paper is placed in front of a fan then released, the piece of paper will be blown away. The force that blows the
paper away is called wind pressure and is normally expressed in inH2O. Wind pressure is divided into the following three types:
4.2.1 Static Pressure
The force that effects the surroundings when the air is contained such as in an automobile tyre or rubber balloon. For example,
in a water gun, the hydraulic pressure increases when pressed by a piston. If there is a small hole, the water is forced out of
that opening. The pressure of the water is equivalent to air static pressure. The higher the pressure, the farther the water (air)
can be forced out.
4.2.2 Dynamic Pressure
The speed at which air flows; for example, the force at which a hurricane presses against a building.
4.2.3 Total Pressure
The total force that wind has, and is the sum of the static pressure and dynamic pressure.
U-7
Page 17
CHAPTER 1 • Ventilation for Healthy Living
4.3 Measuring the Air Volume and Static Pressure
Mitsubishi Electric measures the Lossnay’s air volume and static pressure with a device as shown below according to Japan
Industrial Standards (JIS B 8628).
Measuring Device Using Orice (JIS B 8628 Standards)
Chamber
Damper
Smoothing
net
Wind gauge
duct path
Orice
Connection
Supply
Air
(SA)
Test unit
Blower
Pressure
difference before
and after orice
(Air volume
measurement)
Static pressure in chamber
(Static pressure measurement)
A) When measuring the supply air volume (with the orice plate)
Wind gauge
duct path
Smoothing
grid
Orice
Wind dispersing place
Smoothing
Return
Air
(RA)
net
B) When measuring the return air volume (with the orice plate)
Smoothing
grid
Blower
Connection
Test unit
Static pressure in chamber
(Static pressure measurement)
Measurement Method
The unit is operated with the throttle device fully closed. There is no air flow at this time, and the air volume is 0. The maximum
point of the static pressure (Point A, the static pressure at this point is called the totally closed pressure) can be obtained. Next,
the throttle device is gradually opened, the auxiliary fan is operated, and the median points (Points B, C and D) are obtained.
Finally, the throttle device is completely opened, and the auxiliary fan is operated until the static pressure in the chamber reaches 0.
The maximum point of the air volume (Point E, the air volume at this point is called the fully opened air volume) is obtained. The
points are connected as shown below, and are expressed as air volume, static pressure curves (Q-H curve).
U-8
)
Static pressure (
H
Air volume (Q)
Page 18
CHAPTER 1 • Ventilation for Healthy Living
5. Outdoor Air (ventilation) Load
5.1 How to Calculate Each Approximate Load
5.1 A (US unit)
The ventilation air load can be calculated with the following formula if the required ventilation intake volume “Q CFM” is known:
(Ventilation air load) = γ · QF · (iO - iR)
=
γ [lb/ft3] × S[ft2] × k × n [occupant/ft2] × Vf [CFM / occupant] × (iO - iR): ∆i [Btu/lb]
: Specific air gravity - 0.0749 lb/ft
γ
S : Building’s airconditioned area
k : Thermal coefficient; generally 0.7 - 0.8.
n :
The average population concentration is the inverse of the occupancy area per person. If the number of persons in the
room is unclear, refer to the Floor space per person table below.
Vf : Ventilation air intake volume per occupant
Refer to the Required ventilation air intake volume per occupant table below.
iO : Ventilation air enthalpy - Btu/lb
iR : Indoor enthalpy - Btu/lb
Floor Space per Occupant (ft2)
(According to the Japan Federation of Architects and Building Engineers Associations)
3
Office Building
General Design 43 - 75 5.4 - 21.5 5.4 - 21.5 54 - 86 10.8 - 21.5 4.3 - 6.5
Value 54 32.3 10.8 64.6 16.1 5.4
Average Crowded Empty
Department Store, Shop
Restaurant
Theater or
Cinema Hall
Required Ventilation Air Intake Volume Per Occupant (CFM per occupant)
Required Ventilation Volume
50 30
30 25
15
15 10
15
20
10
12
10
15
Amount of Cigarette Smoking
Extremely Heavy
Quite Heavy
Heavy
Light
None
Application Example
Broker’s office
Newspaper editing room
Conference room
Bar
Cabaret
Office
Restaurant
Shop
Department store
Theater
Hospital room
Recommended Value Minimum Value
Caution
The amount of smoking that could be present in each type of room must be carefully considered when obtaining the
required ventilation volume shown in the table above.
U-9
Page 19
CHAPTER 1 • Ventilation for Healthy Living
5.1 B (SI unit)
The ventilation air load can be calculated with the following formula if the required ventilation intake volume “Q m3/h” is known:
(Ventilation air load) = γ · QF · (iO - iR)
=
[kg/m3] × S [m2] × k × n [occupant/m2] × Vf [m3/h·occupants] × (iO - iR): ∆i [kJ/kg]
γ
: Specific air gravity - 1.2 kg/m
γ
S : Building’s air-conditioned area
k : Thermal coefficient; generally 0.7 - 0.8.
n :
The average population concentration is the inverse of the occupancy area per occupant. If the number of occupants in the
room is unclear, refer to the Floor space per
Vf : Ventilation air intake volume per
Refer to the Required ventilation air intake volume per
iO : Ventilation air enthalpy - kJ/kg
iR : Indoor enthalpy - kJ/kg
Floor Space per Occupant (m2)
(According to the Japan Federation of Architects and Building Engineers Associations)
3
occupant
occupant
table below.
occupant
table below.
Office Building
General Design 4 - 7 0.5 - 2 0.5 - 2 5 - 8 1 - 2 0.4 - 0.6
Value 5 3.0 1. 0 6.0 1. 5 0.5
Average Crowded Empty
Department Store, Shop
Restaurant
Theater or
Cinema Hall
Required Ventilation Air Intake Volume Per Occupant (m3/h·occupant)
Required Ventilation Volume
85 51
51 42.5
25.5
25.5 17
25.5
34
17
20
17
25.5
Amount of Cigarette Smoking
Extremely Heavy
Quite Heavy
Heavy
Light
None
Application Example
Broker’s office
Newspaper editing room
Conference room
Bar
Cabaret
Office
Restaurant
Shop
Department store
Theater
Hospital room
Recommended Value Minimum Value
Caution
The amount of smoking that could be present in each type of room must be carefully considered when obtaining the
required ventilation volume shown in the table above.
U-10
Page 20
CHAPTER 1 • Ventilation for Healthy Living
See below for Calculation examples of determining ventilation load during both cooling and heating.
5.2 Ventilation Load During Cooling (In an Office Building)
Cooling Load Classications
•
(a) Indoor penetration heat
(b) Indoor generated heat
(c) Reheating load (qRL)
(d) Outdoor air load
(a) Is the heat penetrating the room, and often is 30 to 40% of the entire cooling load?
(b) Is the heat generated in the room?
(c) Is applies only when reheating is necessary?
(d) Is the heat generated when ventilation air is mixed into part of the supply air diffuser volume and introduced into the room?
The ventilation air is introduced to provide ventilation for the room occupants, and is referred to as the ventilating load.
Office Building
Department Store, Shop
Heat generated from walls (qWS)
Heat generated from glass
Accumulated heat load in walls (qSS)
Generated heat from occupants
Generated heat from electrical equipment
Sensible heat (qFS)
Latent heat (qFL)
from direct sunlight (qGS)
from conduction and convection (qGS)
Sensible heat (qHS)
Latent heat (qHL)
Sensible heat (qES)
Latent heat (qEL)
Typical Load Values During Cooling
Load Type Load
4.9 W/ft2 (53.0 W/m2)
Occupants 2.5 W/ft2 (26.4 W/m2)
Lighting Equipment 2.8 W/ft2 (30.0 W/m2)
Total 14.6 W/ft2 (157.0 W/m2)
Ventilation air
load 33.8%
4.9 W/ft
(53.0 W/m2)
2
Indoor
generated heat
(occupants, lighting
equipment) 35.9%
5.2 W/ft2 (56.4 W/m2)
Indoor
penetration
heat 30.3%
2
4.4 W/ft
(47.6 W/m2)
2
14.6 W/ft
(157.0 W/m2 )
Ventilation Air Load
Indoor
Generated Heat
Indoor Penetration Heat 4.4 W/ft2 (47.6 W/m2)
Conditions: Middle south-facing oor of a typical office building.
Cooling Load Per Unit Area
When the volume of ventilation air per occupants is 15 CFM (25 m3/h), and the number of occupants per 1 ft2 is 0.0186 (1 m2 is
0.2), the cooling load will be approximately 14.6 W/ft2 (157.0 W/m2).
Ventilation Load
•
Standard design air conditions in Tokyo
Cooling
Dry Bulb Temp.
Outdoor Air 91.4°F (33 °C) 63% 80.6°F (27 °C) 36.5 Btu/Ib (85 kJ/kg)
Indoor Air 78.8°F (26 °C) 50%
Relative Humidity
Wet Bulb Temp. Enthalpy Enthalpy Difference
65.7°F (18.7 °C)
22.9 Btu/Ib (53.2 kJ/kg)
13.6 Btu/Ib (31.8 kJ/kg)
<US unit>
When the load per floor area of 1 ft2 with a ventilation volume of 15 CFM·occupant is calculated with the air conditions detailed
above, the following is obtained:
Ventilation air load = 0.0749 Ib/ft3 (Specific gravity of air) × 0.0186 occupant/ft2 (number of occupants per 1 ft2)
× 15 CFM·occupants (ventilation air volume) × 13.7 Btu/Ib (air enthalpy difference indoor/outdoor) = 0.286 Btu/min·ft2 (4.9 W/ft2)
<SI unit>
When the load per floor area of 1 m2 with a ventilation volume of 25 m3/h·occupant is calculated with the air conditions detailed
above, the following is obtained:
Ventilation air load = 1.2 kg/m3 (Specific gravity of air) × 0.2 occupant/m2 (number of occupants per 1 m2)
× 25 m3/h·occupants (ventilation air volume) × 31.8 kJ/kg (air enthalpy difference indoor/outdoor) = 190.8 kJ/h·m2 (53.0 W/m2)
The Lossnay recuperates approximately 70% of the exhaust air load and saves on approximately 20% of the total load.
U-11
Page 21

CHAPTER 1 • Ventilation for Healthy Living
Determining Internal Heat Gain
•
When classifying loads, the internal heat gain (indoor generated heat + indoor penetration heat) is the ventilation air load
subtracted from the approximate cooling load when it is assumed that there is no reheating load.
(Internal heat gain)
= 14.6 W/ft2 (157.0 W/m2) – 4.9 W/ft2 (53.0 W/m2) = 9.7 W/ft2 (104.0 W/m2)
The value of internal heat gain is based on assumptions for typical loads. To determine individual levels of internal heat gain,
•
the following is suggested:
Indoor Generated Heat
•
(1) Heat generated from occupants
Heat generation design value per person (occupant) in the office:
Sensible heat (SH) = 63.0 W/person (W·occupant)
Latent heat (LH) = 69.0 W/person (W·occupant)
Total heat (TH) = 132.0 W/person (W·occupant)
The heat generated per 1 ft2 (m2) of oor space:
Heat generated from occupants = 132.0 W/person (132.0 W·occupant) × 0.0186 person/ft2 (0.2 occupant/m2) = 2.5W/ft2 (26.4 W/m2)
(2) Heat generated from electrical equipment (lighting)
The approximate value of the lighting and power required for a general office with lighting of 300 - 350 Lux, is 1.9 - 2.8 W/ft2
(20 - 30 W/m2).
Heat generated from electrical equipment (lighting) = 30 W/m
Indoor Penetration Heat
•
The heat that penetrates into the building from outside, which can be determined by subtracting the amount of heat generated
by occupants and lighting from the internal heat gain.
(Indoor infiltration heat)
= 9.7 - (2.5 + 2.8) = 4.4 W/ft2 (104.0 – (26.4 + 30.0) = 47.6 W/m2)
2
U-12
Page 22
CHAPTER 1 • Ventilation for Healthy Living
5.3 Ventilation Load During Heating
Classication of Heating Load
•
Class Heat Load
Heat escaping from walls (qWS)
(a)
(b)
During heating, the heat generated by occupants and electrical equipment in the room can be subtracted from the heating load.
If the warming-up time at the start of heating is short, however, the generated heat may be ignored in some cases.
Percentage of Load
air load 41.9%
Indoor heat
loss
Ventilation
load
Ventilation
5.2 W/ft2
(56.0 W/m2)
Indoor heat
loss 58.1%
7.2 W/ft
(77.7 W/m2)
Heat escaping from glass (qGS)
Heat loss from conduction and convection (qGS)
Accumulated heat load in walls (qSS)
Sensible heat (qFS)
Latent heat (qFL)
Ventilation Air Load
Internal Heat 7.2 W/ft2 (77.7 W/m2)
2
Conditions: Middle south-facing oor of a typical office building.
Type of Load Load
5.2 W/ft2 (56.0 W/m2)
Total 12.4 W/ft2 (133.7 W/m2)
12.4 W/ft2
(133.7 W/m2)
Heating Load Per Unit Area
•
When the ventilation air volume per occupant is 15 CFM (25 m3/h), and the number of occupants per 1 ft2 is 0.0186 (1 m2
is 0.2), the heating load will be approximately 12.4 W/ft2 (133.7 W/m2).
Internal Heat Loss
•
In terms of load classification, the internal heat loss is the value of the ventilation air load subtracted from the approximate
heating load.
Internal heat loss = 12.4 W/ft2 – 5.2 W/ft2 = 7.2 W/ft2 (133.7 W/m2 – 56.0 W/m2 = 77.7 W/m2)
Ventilation Load
•
Standard design air conditions in Tokyo
Dry Bulb Temp.
Heating
<US unit>
When the load per 1 ft2 of floor area with a ventilation volume of 15 CFM·occupant is calculated with the air conditions
detailed above, the following is obtained:
Ventilation air load = 0.749 Ib/ft3 × 0.0186 occupants/ft2 × 15 CFM·occupant × 14.4 Btu/Ib = 0.30 Btu/min·ft2 (5.2 W/ft2)
<SI unit>
When the load per 1 m2 of floor area with a ventilation volume of 25 m3/h·occupant is calculated with the air conditions
detailed above, the following is obtained:
Ventilation air load = 1.2 kg/m3 × 0.2 occupants/m2 × 25 m3/h·occupant × 33.5 kJ/kg = 201.0 kJ/h·m2 (56 W/m2)
Outdoor Air 32 °F (0 °C) 50% 26.6 °F (–3 °C) 2.1 Btu/Ib (5.0 kJ/kg)
Indoor Air 68 °F (20 °C) 50%
Relative Humidity
Wet Bulb Temp. Enthalpy Enthalpy Difference
56.7 °F (13.7 °C)
16.6 Btu/Ib (38.5 kJ/kg)
14.4 Btu/Ib (33.5 kJ/kg)
The Lossnay recuperates approximately 70% of the ventilation load and saves on approximately 30% of the total load.
U-13
Page 23

Page 24

CHAPTER 2
Lossnay Construction and Technology
Page 25
CHAPTER 2 • Lossnay Construction and Technology
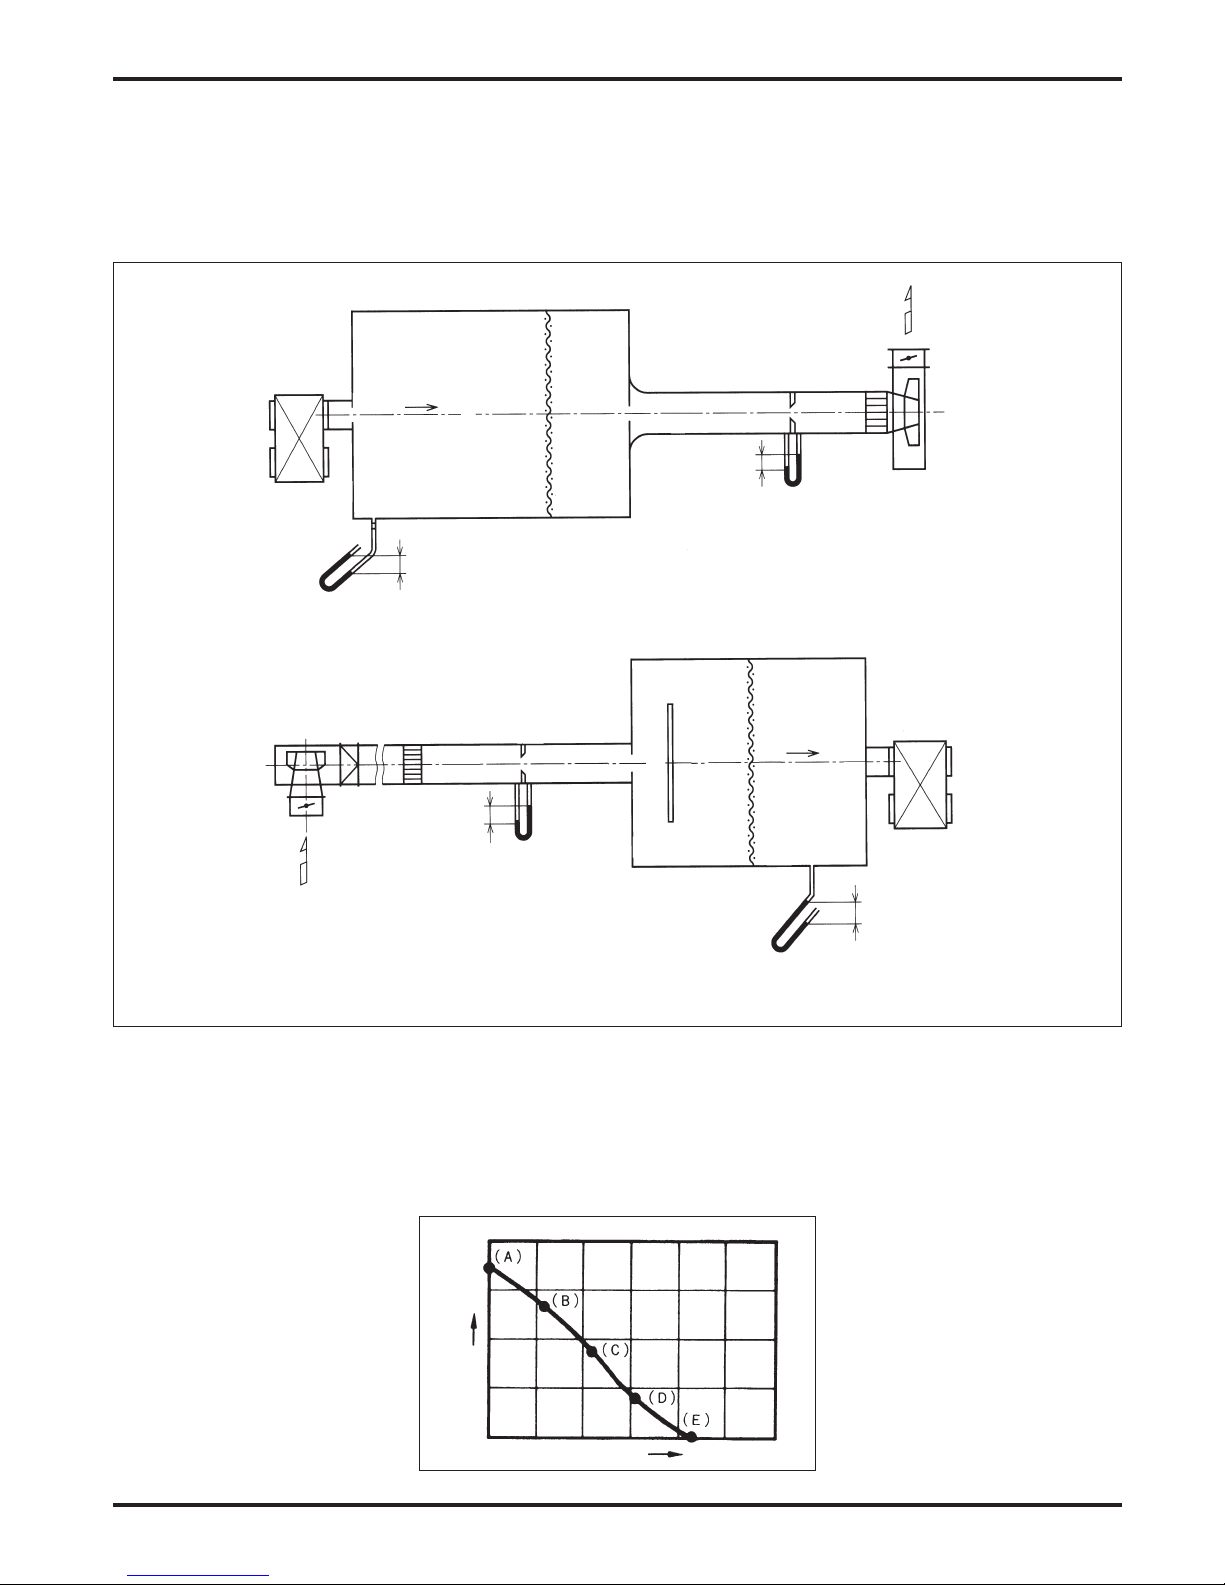
1. Construction and Features
Construction
•
Lossnay is constructed so that the exhaust air passage from the
indoor side to the outdoor side (RA → EA) and the ventilation air
passage from the outdoor side to the indoor side (OA → SA) cross.
The Lossnay Core is located at this crosspoint, and recovers the
heat by conduction through the separating medium between these
airflows. This enables the heat loss during exhaust to be greatly
reduced.
* RA : Return Air
EA : Exhaust Air
OA : Outdoor Air
SA : Supply Air
Main Features
(1) Cooling and heating maintenance fees are reduced while ventilating.
(2) The system size of Heating/cooling system and cooling/heating load can be reduced.
(3) Dehumidifying during summer and humidifying during winter is possible.
(4) Comfortable ventilation is possible with the outdoor air can be adjusted to parallel the room temperature.
(5) Sound can be reduced.
SA (Supply air diffuser)
Supply fan
RA (Return air)
Exhaust side lter
Note: The duct inlet and outlet are linear in the
actual product.
Lossnay Core
EA (Exhaust air)
Exhaust fan
OA (Outdoor air)
Intake side lter
2. Lossnay Core Construction and Technology
Simple Construction
•
The Lossnay core is a cross-air passage total energy recovery unit
constructed from specially treated membrane with a corrugated
structure.
The fresh air and exhaust air passages are totally separated
allowing the fresh air to be introduced without mixing with the
exhaust air.
Principle
•
The Lossnay Core uses the heat transfer properties and moisture
permeability of the treated membrane. Total heat (sensible heat
plus latent heat) is transferred from the stale exhaust air to the
ventilation air being introduced into the system when they pass
through the Lossnay.
Treated membrane
•
The cellulose membrane partition plates are treated with special
chemicals so that the Lossnay Core is an appropriate energy
recovery unit for the ventilator.
The membrane has many unique properties:
(1) Incombustible and strong.
(2) Has selective hydroscopicity and moisture permeability that permits the passage of only water vapor (including some
water-soluble gases).
(3) Has gas barrier properties that does not permit gases such as CO
space.
SA
Supply Air
(Fresh heating/cooling air)
Partition
plate
(Treated
membrane)
Spacer plate
(Treated
membrane)
RA
Return Air
(Dirty heating/cooling air)
2 and other pollutants from entering the conditioned
Indoors Outdoors
EA
Exhaust Air
(Stale air)
OA
Outdoor air
(Fresh air)
U-16
Page 26
CHAPTER 2 • Lossnay Construction and Technology
Total Energy Recovery Mechanism
•
Sensible Heat and Latent Heat
The heat that enters and leaves in accordance with rising or falling temperatures is called sensible heat. The direct movement of
water vapor molecules or due to the changes in the matter’s physical properties (evaporation, condensation) is called latent heat.
(1) Temperature (Sensible Heat) Recovery
1) Heat conduction and heat passage is performed through a
partition plate from the high temperature to low temperature
side.
2) As shown in the diagram at right, the energy recovery
efficiency is affected by the resistance of the partition plate.
For Lossnay, there is little difference when compared to
materials such as copper or aluminium that also have high
thermal conductivity.
t1
Ra1
Rp
Ra2
t2
Heat Resistance Coefficients
Lossnay Plate Cu Al
Ra1 10 10 10
Rp 1 0.00036 0.0006
Ra2 10 10 10
Total 21 20.00036 20.0006
(2) Humidity (Latent Heat) Recovery
Water vapor travels through the partition plate from the high
•
humidity to low humidity side via the differential pressure in
the vapor.
High humidity side
Partition plate
Ra1+Ra2»Rp
Low humidity side
Partition plate
U-17
Page 27
CHAPTER 2 • Lossnay Construction and Technology
3. Total Energy Recovery Efficiency Calculation
The Lossnay Core’s energy recovery efficiency can be considered
using the following three transfer rates:
(1) Temperature (sensible heat) recovery efficiency
(2) Humidity (latent heat) recovery efficiency
(3) Enthalpy (total heat) recovery efficiency
The energy recovery effect can be calculated if two of the above
efficiencies are known.
Each energy efficiency can be calculated with the formulas in the
•
table.
When the supply and exhaust air volumes are equal, the energy
•
recovery efficiencies on the supply and exhaust sides are the
same.
When the supply and exhaust air volumes are not equal, the total
•
energy recovery efficiency is low if the exhaust volume is lower,
and high if the exhaust volume is higher.
Item Formula
Temperature recovery
efficiency (%)
Enthalpy recovery
efficiency (%)
ηt =
ηi =
tOA - tSA
tOA - tRA
iOA - iSA
iOA - iRA
×100
× 100
SA
Fresh air exhaust
(Fresh heating/cooling air)
RA
Stale air induction
(Dirty heating/cooling air)
η : Efficiency (%)
t : Dry bulb temperature (°F, °C)
i : Enthalpy (Btu/Ib, kJ/kg)
Indoors Outdoors
EA
Exhaust air
(Stale air)
OA
Fresh air
induction
(Fresh air)
Calculation of Supply Air Condition After Passing Through Lossnay
If the Lossnay energy recovery efficiency and the conditions of the room and outdoor air are known, the conditions of the air
entering the room and the air exhausted outdoors can be determined with the following formulas in the following table.
Supply Side Exhaust Side
Temperature tSA = tOA - (tOA - tRA) × ηt tEA = tRA + (tOA - tRA) × ηt
Enthalpy iSA = iOA - (iOA - iRA) × ηi iEA = iRA + (iOA - iRA) × ηi
U-18
Page 28
CHAPTER 2 • Lossnay Construction and Technology
4. What is a Psychrometric Chart?
A chart that shows the properties of humid air is called a psychrometric chart. The psychrometric chart can be used to find the
(1) Dry bulb temperature, (2) Wet bulb temperature, (3) Absolute humidity, (4) Relative humidity, (5) Dew point and (6) Enthalpy
(total heat) of a certain air condition. If two of these values are known, the other values can be found with the chart. Now air
conditions will change when it is heated, cooled, humidified or dehumidified can also be seen easily on the chart.
(1) Dry Bulb Temperature t (°F, °C)
Generally referred to as standard temperature, the DB
temperature is obtained by using a dry bulb thermometer
(conventional thermometer).
Temperature (°F,°C)
(2) Wet Bulb Temperature t’ (°F, °C)
When a dry bulb thermometer is wrapped in a piece of wet
gauze and an ample air ow (3 m/s or more) is applied, the
heat from the air and evaporating water vapor applied to the
wet bulb will balance at an equal state and the wet bulb
temperature is obtained.
Wet bulb temperature
(dew point) t’ (°F, °C)
(3) Absolute Humidity x (Ib/Ib’, kg/kg’)
Weight (Ib, kg) of the water vapor that corresponds to the
weight (Ib’, kg’) of the dry air in the humid air.
(4) Relative Humidity ϕ (%)
Ratio of the water vapor pressure Pw in the humid air and the
water vapor pressure Pws in the saturated air at the same
temperature. Relative humidity is obtained with the following
formula:
ϕR = PW/PWS × 100
(5) Dew Point t” (°F, °C)
Water content in the air will start to condense when air is
cooled and the dry bulb temperature at that condition is the
dew point.
(6) Enthalpy i (Btu/Ib, kJ/kg)
Physical matter has a set heat when it is at a certain
temperature and state. The retained heat is called the
enthalpy, with dry air at 32 °F (0 °C) being set at 0.
Relative humidity ϕ (%)
The dew point t” of the air at point A is the temperature
of the point at the same absolute humidity as point A
on the saturation curve.
t”
Parallel to absolute
temperature scale line
t” °F, °C dew point
Absolute humidity x (Ib/Ib’, kg/kg’)
A
Enthalpy i (Btu/Ib, kJ/kg)
U-19
Page 29

CHAPTER 2 • Lossnay Construction and Technology
5. Lossnay Energy Recovery Calculation
The following diagram shows the various air conditions when ventilation air is introduced through the Lossnay Core. If a
conventional sensible energy recovery unit is used alone and is assumed to have the same energy recovery efficiency as
Lossnay, the condition of the air supplied to the room is expressed by Point A in the figure. Point A shows that the air is very
humid in summer and very dry in winter.
The air supplied to the room with Lossnay is indicated by Point S in the figure. The air is precooled and dehumidified in the
summer, and preheated and humidified in the winter before it is introduced to the room.
iOA
AO
iSA
Enthalpy (Btu/Ib, kJ/kg)
iOA
Outdoor air
iRA
iSA
Ventilation load
Lossnay Core energy recovery
O
tOA tSA
condition in
winter
Enthalpy (Btu/Ib, kJ/kg)
Dry bulb temperature (°F, °C)
i
RA
S
A
Ventilation load
Lossnay Core energy recovery
R
Supply air condition of
the Lossnay
Room air condition in winter
tRA tRA
Room air
condition
S
R
in summer
t
SA tOA
Supply air condition of
the Lossnay
The quantity of heat recovered by using the Lossnay Core can be calculated with the formula below:
Total heat recovered: qT = γ × Q × (iOA - iSA) [W]
= γ × Q × (iOA - iRA) × ηi
Where
<US unit>
γ = Specic weight of the air
under standard conditions 75 (Ib/ft3)
Q = Treated air volume (CFM)
t = Temperature (°F)
x = Absolute humidity (Ib/Ib’)
i = Enthalpy (Btu/Ib)
η = Energy recovery efficiency (%)
<SI unit>
γ = Specic weight of the air
under standard conditions 1.2 (kg/m3)
Q = Treated air volume (m3/h)
t = Temperature (°C)
x = Absolute humidity (kg/kg’)
i = Enthalpy (kJ/kg)
η = Energy recovery efficiency (%)
Outdoor air condition
in summer
XOA
XSA
XRA
Absolute humidity
(Ib/Ib’, kg/kg’)
XRA
XSA
XOA
OA : Outdoor air
RA : Return air
SA : Supply air
U-20
OA : Outdoor air
RA : Return air
SA : Supply air
Page 30
CHAPTER 3
General Technical Considerations
Page 31

CHAPTER 3 • General Technical Considerations
1. Lossnay Energy Recovery Effect
1.1 Comparing Ventilation Load of Various Ventilators
Examples of formulas that compare the energy recovered and ventilation load when ventilating with the Lossnay (total energy
recovery unit), a sensible energy recovery ventilation unit (sensible HRV), and a conventional ventilator unit are shown below.
(1) Cooling During Summer
Conditions
Model LGH-F600RX5-E
•
(at 60Hz, high speed) (For summer)
Ventilation rate: 600 CFM
•
(specic gravity of air ρ = 0.0749 Ib/ft3)
Supply air
Lossnay
Unit
Dry bulb temperature (°F)
Absolute humidity (Ib/Ib’)
Relative humidity (%)
Enthalpy (Btu/Ib)
Total energy recovered (kW)
Ventilation load (kW)
Ventilation load ratio (%)
Dry bulb
Indoor Unit
of
Air Conditioner
temperature
Absolute
humidity
Relative
humidity
Enthalpy
Room air
82.7 82.7 91.4
0.0159 0.0203 0.0203
66.0 84 63
29.6 34.5 36.4
4.7 1.6 0
5.5 9.3 10.9
50 86 100
78.8°F
0.0105 Ib/Ib’
50%
22.7 Btu/Ib
Energy recovery efficiency table (%)
•
Lossnay
Sensible HRV
Unit
Temperature
(Sensible Heat)
Enthalpy
(Total Heat)
69 69 –
50 14* –
* Calculated volume under conditions below.
Sensible HRV
Unit
Conventional
Ventilator Unit
Unit
Dry bulb
temperature
Absolute
humidity
Relative
humidity
Enthalpy
Conventional
Ventilator Unit
Exhaust air
Outdoor air
91.4°F
0.0203 Ib/Ib’
63%
36.4 Btu/Ib
Calculation Example Summer Conditions
Lossnay Unit
•
(Supply air diffuser temperature) tSA = 91.4°F – (91.4°F – 78.8°F) × 0.69 = 82.7°F
(Supply air diffuser enthalpy) hSA = 36.4 – (36.4 – 22.7) × 0.50 = 29.6 Btu/Ib
Heat recovered (36.4 – 29.6) × 0.0749 × 600 = 304.4 Btu/min = 5.4 kW
Ventilation load (29.6 – 22.7) × 0.0749 × 600 = 310.1 Btu/min = 5.5 kW
Sensible HRV Unit
•
(Supply air diffuser temperature) tSA = 91.4°F – (91.4°F – 78.8°F) × 0.69 = 82.7°F
(Supply air diffuser enthalpy) hSA = 34.5 Btu/Ib (from psychrometric chart)
Heat recovered (36.4 – 34.5) × 0.0749 × 600 = 85.4 Btu/min = 1.5 kW
Ventilation load (34.5 – 22.7) × 0.0749 × 600 = 530.3 Btu/min = 9.3 kW
[Calculated enthalpy recovery efficiency 85.4 ÷ (85.4 + 530.3) × 100 = 14%]
Conventional Ventilator Unit
•
If a conventional ventilator unit is used, the energy recovered will be 0 as the supply
air diffuser is equal to the outdoor air.
The ventilation load is:
(36.4 – 22.7) × 0.0749 × 600 = 620.2 Btu/min = 10.9 kW
U-22
36.4
Enthalpy
(Btu/Ib)
29.6
iSA
Ventilation load
22.7
iRA
Dry bulb temperature (°F)
iOA
AO
Lossnay energy recovery
S
R
Room air condition in summer
tRA
78.8
tSA
82.7
Outdoor air condition
in summer
Supply air condition
of the Lossnay
tOA
91.4
OA
X
0.0203
XSA
0.0159
XRA
0.0105
Absolute humidity (Ib/Ib’)
Page 32

(2) Heating During Winter
Conditions:
Model LGH-F600RX5-E
•
(at 60Hz, high speed) (For winter)
Ventilation rate: 600 CFM
•
(Specic gravity of air ρ = 0.0749 Ib/ft3)
Supply air
Dry bulb temperature (°F)
Absolute humidity (Ib/Ib’)
Relative humidity (%)
Enthalpy (Btu/Ib)
Total energy recovered (kW)
Ventilation load (kW)
Ventilation load ratio (%)
56.8 56.8 32
0.0047 0.0018 0.0018
48.5 18.5 50
11.1 7.9 2.0
7.1 4.6 0
4.3 6.8 11.5
36 60 100
Room air
Indoor Unit
of
Air Conditioner
Dry bulb
temperature
Absolute
humidity
Relative
humidity
Enthalpy
68°F
0.0073 Ib/Ib’
50%
16.6 Btu/Ib
Lossnay
Unit
Sensible HRV
CHAPTER 3 • General Technical Considerations
Energy recovery efficiency table (%)
•
Lossnay
Unit
Temperature
(Sensible Heat)
Enthalpy
(Total Heat)
69 69
64 40*
* Calculated volume under conditions below .
Unit
Conventional
Ventilator Unit
Sensible HRV
Unit
Dry bulb
temperature
Absolute
humidity
Relative
humidity
Enthalpy
Conventional
Ventilator Unit
–
–
Exhaust air
Outdoor air
32°F
0.0018 Ib/Ib’
50%
2.0 Btu/Ib
Calculation Example Winter Conditions
Lossnay Unit
•
(Supply air diffuser temperature) tSA = (68°F – 32°F) × 0.69 + 32°F = 56.8°F
(Supply air diffuser enthalpy) hSA = (16.6 – 2.0) × 0.64 + 2.0
= 11.3 Btu/Ib
Heat recovered (11.3 – 2.0) × 0.0749 × 600
= 417.9 Btu/min = 7.3 kW
Ventilation load (16.6 – 11.3) × 0.0749 × 600
= 238.2 Btu/min = 4.2 kW
Sensible HRV Unit
•
(Supply air diffuser temperature) tSA
= (68°F – 32°F) × 0.69 + 32°F = 56.8°F
(Supply air diffuser enthalpy) hSA = 7.9 Btu/Ib
(from psychrometric chart)
Heat recovered (7.9 – 2.0) × 0.0749 × 600
= 265.1 Btu/min = 4.7 kW
Enthalpy
2.0
iOA
11.3
iSA
(Btu/Ib)
16.6
iRA
Ventilation load
Lossnay
energy recovery
O
Ventilation load (16.6 – 7.9) × 0.0749 × 600
= 391.0 Btu/min = 6.9 kW
[Calculated enthalpy recovery efficiency 265.1 ÷ (265.1 + 391.0) × 100 = 40%]
Conventional Ventilator Unit
•
tOA
Outdoor air
condition in
winter
32
Dry bulb temperature (°F)
If a conventional ventilator is used, the supply air diffuser is the same
as the outdoor air and the exhaust is the same as the room air.
Thus the energy recovered is 0 kcal and the Ventilation load is
(16.6 – 2.1) × 0.0749 × 600 = 651.6 Btu/min = 11.5 kW
S
A
tSA
56.8
R
Room air condition
of the Lossnay
Supply air condition
tRA
68
X
in winter
XSA 0.0047
XOA 0.0018
Absolute humidity (Ib/Ib’)
RA 0.0073
U-23
Page 33

CHAPTER 3 • General Technical Considerations
2. Calculating Lossnay Cost Savings
Use the following pages to assess the economical benefits of using the Lossnay in particular applications.
(1) Conditions
Return air volume (RA) = CFM (m3/hr)
•
Outdoor air volume (OA) = CFM (m3/hr)
•
Air volume ratio (RA/OA) =
•
Air conditions
•
Season Winter Heating Summer Cooling
Dry bulb
Item
Outdoors
Indoors
Operation time: Heating = hours/day × days/month × months/year = hours/year
•
Cooling = hours/day × days/month × months/year = hours/year
Energy: Heating = Type: Electricity Cost: dollar/kWh
•
Cooling = Type: Electricity Cost: dollar/kWh
Power rates: Winter: dollar/kWh Summer: dollar/kWh
temp.
DB
[°F]
[°C]
Wet bulb
temp.
WB
[°F]
[°C]
Relative
humidity
RH
[%]
[%]
Absolute
humidity
×
[Ib/Ib’]
[kg/kg’]
Enthalpy
i kJ/kg
(Btu/Ib)
(kcal/kg’)
Dry bulb
temp.
DB
[°F]
[°C]
Wet bulb
temp.
WB
[°F]
[°C]
Relative
humidity
RH
[%]
[%]
Absolute
humidity
[Ib/Ib’]
[kg/kg’]
Enthalpy
i kJ/kg
×
(Btu/Ib)
(kcal/kg’)
(2) Lossnay Model
Model name:
•
Processing air volume per unit RA = CFM (m3/hr), OA = CFM (m3/hr), Air volume ratio (RA/OA) = CFM (m3/hr)
•
Energy recovery efficiency : Energy recovery efficiency = %,
•
Enthalpy recovery efficiency (cooling) = %,
Enthalpy recovery efficiency (heating) = %
Static pressure loss (unit-type) RA= Pa OA = Pa (Note: Each with lters)
•
Power consumption (pack-type) = none because of unit type
•
(3) Indoor Blow Air Conditions
Heating Cooling
Temperature
[°F]
[°C]
[Btu/lb]
Enthalpy
[kJ/kg]
Data obtained from
above equation
and
psychrometric chart
(Indoor temperature – outdoor air temperature) ×
=
energy recovery efficiency + outdoor air
temperature
=
==(Indoor enthalpy – outdoor air enthalpy) ×
enthalpy recovery efficiency + outdoor air
enthalpy
Dry-bulb temperature
•
Wet-bulb temperature
•
Relative humidity
•
Absolute humidity
•
Enthalpy
•
=
=
=
=
=
°F (°C)
°F (°C)
Ib/Ib’ (kg/kg’)
Btu/Ib (kg/kg)
%
==Outdoor air temperature – (outdoor air
temperature – indoor temperature) ×
energy recovery efficiency
==Outdoor air enthalpy – (outdoor air
enthalpy – indoor enthalpy) ×
enthalpy recovery efficiency
Dry-bulb temperature
•
Wet-bulb temperature
•
Relative humidity
•
Absolute humidity
•
Enthalpy
•
=
=
=
=
=
°F (°C)
°F (°C)
%
Ib/Ib’ (kg/kg’)
Btu/Ib (kg/kg)
U-24
Page 34

(4) Ventilation Load and Energy Recovery
Ventilation load without
Lossnay (q1)
Ventilation load with
Lossnay (q
Energy recovery (q
Ventilation load (%)
2)
==Air specic gravity × ventilation volume
× (indoor enthalpy – outdoor air enthalpy)
=
Ventilation load (q
× ( 1 – enthalpy recovery efficiency)
=
or
=
Air specic gravity × ventilation volume
× (indoor enthalpy
=
q
1
–
q2
=
–
=
3)
or
Ventilation load (q1)
=
× enthalpy recovery efficiency
Ventilation load = W = %
•
Ventilation load with Lossnay
•
= W = %
Energy recovered = W = %
•
(5) Recovered Money (Power Rates)
=
Energy recovered: kW × Unit price $/kWh ×
Cost savings
dollar)
(
operation
=
Hr/year
=
time Hr/year = kW × $/
CHAPTER 3 • General Technical Considerations
Heating Cooling
==Air specic gravity × ventilation volume
× (outdoor air enthalpy – indoor enthalpy)
=
1)
–
indoor blow enthalpy)
Heating Cooling
kWh
×
Ventilation load (q
× ( 1 – enthalpy recovery efficiency)
=
or
=
Air specic gravity × ventilation volume
× (indoor blow enthalpy
=
q
1
–
q2
=
–
=
or
Ventilation load (q1)
=
× enthalpy recovery efficiency
Ventilation load = W = %
•
ventilation load with Lossnay
•
= W = %
Energy recovered = W = %
•
=
Energy recovered: kW × Unit price $/kWh ×
operation
=
Hr/year
=
1)
time Hr/year = kW × $/
–
indoor enthalpy)
kWh
×
U-25
Page 35

CHAPTER 3 • General Technical Considerations
AEX-120-99—page 2
Figure 2. A psychrometric chart.
3. Psychrometric Chart
3.1 <US unit>
U-26
Page 36

3.2 <SI unit>
5.5
0.034
0.035
0.036
0.037
0.033
CHAPTER 3 • General Technical Considerations
Vapor pressure Pw [kPa]
0.00.000
0.1
0.005
0.004
0.5
0.001
0.002
0.003
0.92
5
3
/kg(DA)]
50494847464544434240 41393837363534333230 31292827262524232220 21191817161514131210 11987654320–1–2–3–4–9–10
5.0
4.5
4.0
3.5
3.0
2.5
2.0
1. 5
1. 0
Absolute humidity x [kg/kg(DA)]
0.006
0.007
0.008
0.009
0.010
0.011
0.012
0.013
0.014
0.015
0.016
0.017
0.018
0.019
0.020
0.021
0.022
0.023
0.024
0.025
0.026
0.027
0.028
0.029
0.030
0.031
0.032
0.96
0.95
0.94
Saturation [%]
20
25
15
0.93
15
Relative humidity [%]
20
10
Specific capacity v [m
30
35
40
45
65
70
75
80
25
22
21
60
Sensible heat ratio SHF
0.7
0.8
10000
15000
50
55
60
80
85
45
50
55
60
65
70
75
Wet bulb temperature t' [
20
19
18
55
17
16
50
Comparative enthalpy h [kJ/kg(DA)]
45
0.4
0.5
0.6
4500
5000
6000
7000
35
34
125
33
120
32
115
31
110
105
100
3800
3600
3400
3200
3000
2800
2600
2400
2200
2000
1800
1600
1400
1200
1000
30
30
29
28
95
27
90
26
85
80
C, atmospheric pressure 101.325 kPa)
°
dh
dx
(-10 to +50
Humid air psychrometric chart
85
90
95
25
24
75
23
70
65
Heat water ratio u = –– [kJ/kga]
1. 0
–10000
–20000
–40000
0.9
40000
20000
500
0
–500
–1000
–2000
–5000
25
30
35
40
5
10
15
20
25
30
40
20
C]
°
15
15
14
13
40
12
11
35
10
9
8
30
0.3
25
3800
4000
4200
50
–7–8 –5–6 1
Dry bulb temperature t [°C]
0.75 0.76 0.77 0.78 0.79 0.80 0.81 0.82 0.83 0.84 0.85 0.86 0.87 0.88 0.89 0.90 0.91
60
70
80
90
10
5
7
6
5
4
3
20
2
15
0
Water
1
0
10
–5
Chilled
–1
–2
–4
5
–5
–8
0
U-27
Page 37

CHAPTER 3 • General Technical Considerations
4. Determining Lossnay Core Resistance to Bacterial Cross-
Contamination and Molds
Test Report
(1) Object
To verify that there is no bacterial cross-contamination from the outlet air to the inlet air of the Lossnay Core.
(2) Client
MITSUBISHI ELECTRIC CO. NAKATSUGAWA WORKS.
(3) Test Period
April 26, 1999 - May 28, 1999
(4) Test Method
The test bacteria suspension is sprayed in the outlet duct at a pressure of 1.5 kg/cm2 with a sprayer whose
dominant particle size is 0.3 - 0.5 µm. The air sampling tubes are installed at the center of Locations A, B, C, D
(see diagram below), in the Lossnay inlet/outlet ducts so that the openings are directly against the air ow, and
then connected to the impingers outside the ducts. The impingers are lled with 100 mL physiological salt solution.
The airborne bacteria in the duct air are sampled at the rate of 10L air/minute for three minutes.
Sprayer
Impinger
Impinger
LOSSNAY Core
(5) Test Bacteria
The bacteria used in this test are as followed;
Bacillus subtilis: IFO 3134
Pseudomonas diminuta: IFO 14213 (JIS K 3835: Method of testing bacteria trapping capability of precision
ltration lm elements and modules; applicable to precision ltration lm, etc. applied to air or liquid.)
(6) Test Result
The result of the test with Bacillus subtilis is shown in Table 1.
The result of the test with Pseudomonas diminuta is shown in Table 2.
Impinger
Impinger
HEPA Filter
Fan
Fan
Safety cabinet
U-28
Page 38

CHAPTER 3 • General Technical Considerations
Table 1 Test Results with
Bacillus Subtilis
(CFU/30L air)
No. A B C D
1 5.4 × 10
2 8.5 × 10
3 7.5 × 10
4 1.2 × 10
5 1.8 × 10
Average 2.0 × 10
Table 2 Test Results with
4
3
3
4
4
4
Pseudomonas Diminuta
(CFU/30L air)
5.6 × 10
7.5 × 10
< 10
1.2 × 10
1.5 × 10
1.5 × 10
4
3
3
4
3
4
< 10
< 10
< 10
< 10
< 10
< 10
3
3
3
3
3
3
< 10
< 10
< 10
< 10
< 10
< 10
No. A B C D
1 3.6 × 10
2 2.5 × 10
3 2.4 × 10
4 3.4 × 10
5 1.7 × 10
Average 2.7 × 10
5
5
5
5
5
5
2.9 × 10
1.2 × 10
7.2 × 10
8.4 × 10
3.8 × 10
4.7 × 10
5
5
5
5
5
5
< 10
< 10
< 10
< 10
< 10
< 10
3
3
3
3
3
3
< 10
< 10
< 10
< 10
< 10
< 10
(7) Considerations
Bacillus subtilis is commonly detected in the air and resistant to dry conditions. Pseudomonas diminuta is
susceptible to dry conditions and only a few bacterium exists in the air; however, it is used to test lter performance
because the particle size is small (Cell diameter: 0.5 µm; Cell length: 1.0 to 4.0 µm).
Both Bacillus subtilis and Pseudomonas diminuta are detected at Locations A and B in the outlet side duct where
they are sprayed, but neither them are detected at Location C (in the air ltered by the HEPA lter) and Location D
on the inlet side.
Because the number of bacteria in Location A is substantially equal to one in Location B, it is estimated that only a
few bacteria are present in the Lossnay Core on the outlet side. Also, no test bacteria are detected at Location D.
The conclusion is, therefore, that the bacteria present in the outlet side will not pass through the inlet side even
after the energy is exchanged.
3
3
3
3
3
3
3
3
3
3
3
3
Shunji Okada
Manager, Biological Section
Kitasato Research Center of Environmental Sciences
U-29
Page 39

CHAPTER 3 • General Technical Considerations
5. Lossnay Core Fire : retardant property
The Lossnay Core was also tested at General Building Research Corporation of Japan according to the fire retardancy test
methods of thin materials for construction as set forth by JIS A 1322. The material was evaluated as a Class 2 flame
retardant.
U-30
Page 40

CHAPTER 3 • General Technical Considerations
6. Lossnay Core Sound Reducing Properties Test
Because the Lossnay Core is made of many layers of plates and the permeable holes are extremely small, the core has
outstanding sound reducing properties and is appropriate for ventilation in soundproof rooms.
For example, LGH-100RX3-E has sound reducing characteristics of 35.0dB with a center frequency of 500Hz, which means
that a sound source of 84.4dB can be shielded to 49.4dB.
Sound Reducing Effect Test Results
Test number
Name
Client
Address
Trade name
Main composition
Manufacture date
Size (unit : mm)
Test SpecimenTest Results
IVA-01-06
Mitsubishi Electric Corporation
1-3, Komaba-cho, Nakatsugawa-shi,
Gifu 508-8666, Japan
LGH-100RX
3-E
Air-to-Air Energy Recovery Ventilator
May 18, 2001
W1231 × H398 × D1521
(ANNEXED DRAWINGS No.1,2 show details.)
Joint adapter in the sound receiving room side
(Portion A in ANNEXED DRAWING No.1) had
Note
been filled with oil clay and then covered with
onefold aluminum tape, sound insulation sheet
and glass wool around duct successively.
Date of test
Sound transmitting size
Air temperature, Relative humidity
Center
frequency
1000
1250
1600
2000
2500
3150
4000
5000
Average sound pressure level (dB)
87.0
Receiving
room Lr
59.3
62.8
61.0
58.7
58.3
57.0
54.3
49.4
50.7
48.7
47.7
47.7
47.4
47.0
48.2
48.2
48.8
47.6
(Hz)
100
125
160
200
250
315
400
500
630
800
Source
room Ls
83.3
83.8
85.5
86.0
86.1
85.0
86.2
84.4
84.7
85.5
89.2
89.3
90.7
92.8
83.4
95.0
95.0
May 18, 2001
Ф254 mm × 2
22.0∞C, 62%RH (Receiving room)
Level
difference D
24.0
21.0
24.5
27.3
27.8
28.0
31. 9
35.0
34.0
36.8
39.3
41.5
41.9
43.7
44.6
45.2
46.2
47.4
Equivalent
absorption
area in receiving
room A (m2)
2.65
3.21
3.69
3.48
3.54
3.96
4.40
4.62
4.80
5.06
5.58
6.26
7.03
7.57
8.62
10.19
12.42
15.51
Sound
transmission
loss
TL (dB)
10
6
9
12
12
12
16
18
17
20
22
24
23
25
25
25
25
26
Notes:
1. The graph shows level difference with (revised) sound transmission loss.
2. Test specimen area (Sound transmitting area) is:
S = 0.10134m
2
(Ф254mm × 2) for calculating (revised) sound transmission
loss.
3. An arithmetic mean of revised sound transmission loss (1/3 octave, 125Hz
- 4000Hz)....18.4dB
Test method was determined according to JIS A 1416 : 1994
"Method for laboratory measurement of sound transmission
loss" and Architectural Institute of Japan Standard
"Measurement method on sound transmission loss of small
Standard
building elements".
(Reverberation room No. 2)
3
3
178.5m
180.0m
Test
specimen
MIC.
Computer system
Printer
Chain block (2t)
Sound receiving side
Test specimen
Test Method
5560
Section
Test
laboratory
(Reverberation room No. 3)
300
300
Air layer (t50)
Sound source side
Neoprene rubber
Filled with sand
Cavity concrete block (t190)
Filled inside with sand
Mortared both sides (15mm)
F. L.
Volume
Fig. 1 Testing setup (Unit : mm)
Heat & Acoustics Laboratory, Building Physics Dept.
General Building Research Corporation of Japan
5-8-1 Fujishirodai, Suita-shi, Osaka 565-0873, Japan
Revised sound
transmission
loss
TLc (dB)
11
6
10
70
Air-to-Air Energy
Recovery Ventilator
60
LGH-100RX
3-E
13
13
12
16
19
17
50
Level difference between
the source room and the
receiving room
40
20
22
24
23
25
30
Sound transmission loss (dB)
20
Revised sound
transmission loss
25
25
25
10
Sound transmission loss
26
0
125 250 500 1000 2000 4000
Center frequency (Hz)
Iwao Kurahashi (Head)
Responsible parties
Ta kao Waki (Section chief)
Mitsuo Morimoto (Section chief)
Sound source sideSound receiving side
Test specimen
SP.
Amplifier2 ch selector
EqualizerReal time analyzer
Noise generator
U-31
Page 41

CHAPTER 3 • General Technical Considerations
7. Changes in the Lossnay Core
An example of a building with Lossnay units installed, that has been used as a case study to assess the changes in the units.
7.1 Building Where Lossnay is Installed
(1) Building : Meiji Seimei, Nagoya Office/shop building
1-1 Shinsakae-machi Naka-ku, Nagoya
(2) No. of Floors : 16 above ground, 2-story penthouse, 4 basement oors
(3) Total Floor Space : 418,640 ft2 (38,893 m2)
(4) Reference Floor Space : 14,940 ft2 (1,388 m2)
7.2 Specications of Installed Ventilation Equipment
(1) Air Handling Method : 4 fan coil units (perimeter zone) per oor
Chilling Unit : Absorption-type 250 kT × 1 unit, turbo 250 kT × 2 units
Gas Direct Heating/Cooling Boiler
(2) Ventilation Method : Air - air total energy recovery unit “Lossnay”
LS-200 × 18 units installed in penthouse.
Outdoor air treatment volume: 27,211 CFM (46,231 CMH),
Exhaust air treatment volume: 31,980 CFM (54,335 CMH).
(3) Lossnay Units Used : LS-200* (with four Lossnay Cores)
: 340 kT, heating 1,630 kW
+
Lossnay Duct System Diagram Diagram of Lossnay Penthouse Installation
Exhaust air
RA side
bypass damper
RA fan
(for exhaust)
OA side bypass damper
Lossnay
U-32
(for intake)
AC
AC
AC
OA fan
Outdoor
air
4080
1300 1300
3200
RA
Lossnay
Lossnay
Lossnay
SA
4300
Lossnay
EA
2000
700
O A
10040
Unit (mm)
Page 42

CHAPTER 3 • General Technical Considerations
7.3 Lossnay Operation
(1) Unit Operation Began : September 1972
Daily Operation Began : 7:00
Daily Operation Stops
: 18:00
Average daily operation: 11 hours
}
(2) Inspection Date : November 1983
(3)
Months When Units are in Bypass Operation
: Three months of April, May, June
(4) Total Operation Time : (134 – 33) months × 25 days/month × 11 hours/day = 27,775 hours
7.4 Changes Detected in the Lossnay Core
Two Lossnay Cores were removed from the 18 Lossnay LS-200
installed, and static pressure loss and exchange efficiencies were
measured. See chart on right that compares initial operation
to same unit 11 years later. The appropriate air volume for one
Lossnay Core was 300 CFM (500 m
point was ±120 CFM (±200 m
3
/hr) of that value.
3
/hr), and the measurement
Characteristics in change of Lossnay Core over time
90
80
Enthalpy recovery efficiency
during heating
70
300
(1.20)
Heat recovery
efficiency
Data from delivery (1974)
Data from 1983
200
(0.80)
100
(0.40)
0
Static pressure loss (Pa)
(Static pressure loss (inH2O)) Recovery efficiencies (%)
300
(180)
Treated air volume
Static pressure loss
500
(300)
700
(420)
CMH
(CFM)
7.5 Conclusion
(1) Changes in the the Lossnay Core after approximately 11 years of use and an estimated 28,000 operation hours were not
found.
The static pressure loss was 0.60 to 0.64 in H
2O at 300 CFM (150 to 160 Pa at 500 m
Pa) increase. The exchange efficiencies had decreased slightly to above 300 CFM (500 m3/hr), however, this is considered
to be insignicant and remained in the measurement error range.
(2) The Core surface was black with dust, but there were no gaps, deformed areas, or mold that would pose problems during
practical use.
3
/hr), which was a 0.04 in H2O (10
U-33
Page 43

CHAPTER 3 • General Technical Considerations
8. Comparing Energy Recovery Techniques
Basic Methods of Total Energy Exchangers
Country of
Type Method Air ow development
Static Conductive Cross-ow Japan
Energy recovery (Mitsubishi Lossnay) transmission type
principle
Rotary type Heat accumulation/ Counterow Sweden
humidity accumulation
type
8.1 Principle Construction of Rotary-type Energy Recovery Techniques
Rotary-type energy recovery units have a rotor that has a layered
•
honeycomb structure made of kraft paper, plastic, aluminum or
other substrate materials, drive motor and housing.
A moisture absorbent material (desiccants such as litium
chloride, silicagels or engineered molecular sieve material) is
applied onto the rotor, and humidity is transferred.
The rotor rotates a few to 30 times a minute by the drive motor.
Approx. ø1.5mm
Exhaust
Fresh air
Rotary-type energy recovery units, when cooling, the high
•
temperature and high humidity ventilation air passes through the
rotor, with the heat and humidity being absorbed by the rotor.
When the rotor rotates, it moves into the exhaust air passage,
and the heat and humidity is discharged to the outdoors because
the exhaust is cool and has low humidity.
The rotor rotates and returns to the ventilation air passage to
absorb the heat and humidity again.
Function of the purge sector
•
There are two separation plates (purge sectors) in the front and
back of the rotor to separate airow. Because one of the plates
is slightly shifted, part of the ventilation air always ows into the
exhaust air passage to prevent the exhaust air and ventilation air
from mixing. (A balanced pressure difference is required.)
Purge sector
Drive motor
Rotor
Supply air Fresh air
Bearing
Return air Exhaust
A
Rotor rotation direction
Drive motor
Vr
Vs
B
Purge sector
Room side
Fresh air
U-34
Return air
When a purge sector is added, the exhaust air in the rotor going
into the air on the supply side can be prevented.
Vr: Rotor speed, Vs: Air speed in relief section
Page 44

CHAPTER 3 • General Technical Considerations
8.2 Comparing Static-type and Rotary-type Energy Recovery Units
Specication. Static-type Rotary-type
Conductive transmission-type: cross-ow
Static-type transmission total energy recovery unit with
orthogonally layered honeycomb-shaped treated plates
Construction/
Principle
Moving Parts
Material Quality Engineered resin composite Plastic, aluminum plates, etc.
Prelter Required (periodic cleaning required Required (periodic cleaning required)
Element Clogging
Air Leakage
Gas Transmission
Rate
Bacteria Transmission
Rate
Bypass air pass for
comfortable season
Maintenance
Life
Model is
Available
Measure of useability
formed into multiple layers.
As the supply air and exhaust air pass through different
•
passages (sequentially layered), the air passages are
completely separated.
None
•
Fixed core
Occurs (State where dirt adheres onto the element air
•
passage surface; however, this is easily removed with a
vacuum cleaner.)
Approximately 2.5% air leak at standard fan position.
Leaks found on the air supply side can be reduced to 0
by leaking the loss air volume (approx. 10%) on the
exhaust side with the fan position to the core.
Gas transmission ( Ammonia : approx. 2.9%)
•
In certied EATR on AHRI, Mitsubishi core EATR is
0%. Wheel types EATR are 0.04-7.7%.
Low (Because air intake/exhaust outlets are separate,
•
transmission is low.)
Bypass circuit required (Permitted on one side of air
intake and exhaust air outlet passage)
Core cleaning: More than once a year
The core surface will clog with lint and dirt, but
cleaning is easy with a vacuum cleaner.
Only the two core air passage intakes need to be
cleaned.
Core: Semi-permanent (10 years or more)
Static-type units do not break.)
o
Available from small to large.
o
Characteristic design of small
possible.
Large models are easy to
layout
.
: High o : Average × : Poor
•
and medium models are
match to a machine room
Heat accumulation/humidity accumulation-
type: counterow
The rotor core has honeycomb-shaped kraft paper,
etc., to which a moisture absorbent is applied (lithium
chloride, etc.). The rotor rotates, and heat
accumulation/humidity accumulation - heat discharge/
humidity discharge of total energy exchange is
performed by passing the exhaust and intake airows
into a honeycomb passage.
× Supply air and exhaust airows go into the same air
passage because of the rotary-type construction.
× Rotor driven with belt by gear motor
Rotor core
×
Occurs (Dust is smeared into element air passage lter.)
(The dust adhered onto the core surface is smeared
into the air passage by the purge sector packing. It
cannot be removed easily and thus the air volume
decreases.)
× Purged air volume occurs
To prevent exhaust leaking to the air intake side, a purge
air volume (6 to 14%) leak is created on the exhaust side.
Thus, there are problems in the purge sector operation
conditions (pressure difference, speed), and the air
volume must be balanced.
×
Gas transmission ( Ammonia : 45-57%)
× High (Because air intake/exhaust outlets are the same,
transmission is high.)
Bypass circuit required (Required on both air intake
and exhaust air outlet sides)
(Theoretically, bypass operation is possible by stopping
the rotation, but the core will over-absorb and cause
serious damage.)
Core
cleaning: Once or twice a year
Cleaning is difficult as dust is smeared into core
by the purge sector packing.
× Gear motor for rotor drive : Periodic inspection
× Rotor bearing, rotor drive belt : Periodic inspection
Core: Semi-permanent (10 years or more)
(Periodic replacement is required because of the rotor
bearings and the core clogging.)
× Rotor drive belt : Periodic replacement
× Drive motor, rotor bearing : Periodic replacement
Large type only
× Small models are difficult to design because of the
rotor magnitude.
U-35
Page 45

Page 46

CHAPTER 4
Characteristics
CHAPTER 4 • Characteristics
U-37
Page 47

CHAPTER 4 • Characteristics
1. How to Read the Characteristic Curves
1.1 Obtaining Characteristics from Static Pressure Loss
(1) Static pressure loss from a straight pipe duct length (at required air volume)
(2) Static pressure loss at a curved section (at required air volume)
(3) Static pressure loss of related parts (at required air volume)
Total static pressure loss
Static pressure loss at
application point
Total static
pressure loss
Static
pressure
Required air
volume
Estimated static pressure loss curve
obtained from
Air volume at application point
and
Intersection with air volume static
pressure characteristic curve
Air volume
2. Calculating Static Pressure Loss
2.1 How to Read the Air Volume - Static Pressure Curve
It is important to know the amount of static pressure loss applied
onto the Lossnay when using ducts for the air distribution. If the
static pressure increases, the air volume will decrease. The air
volume - static pressure curve (Q-H curve) example shows the
percentage at the decrease. A static pressure of 0.08 in H2O (19.6
Pa) is applied to Point A, and the air volume is 300 CFM (500 m3/
h). The duct resistivity curve shows how the static pressure is
applied when a duct is connected to the Lossnay. Thus, the L =
32.7 ft (9.97 m) duct resistivity curve in the diagram shows how the
static pressure is applied when a 32.8 ft (10 m) duct is connected.
Intersecting Point A on the Lossnay Q-H curve is the operation
point.
Example
Static pressure
0.08 in H
(19.6 Pa)
2O
Duct resistivity curve
Air volume
Q-H curve
300CFM
(500 m
A
L = 32.8 ft (10 m)
3
/h)
Duct Resistivity Curve
Duct Static Pressure
When duct is long Increases
If length is the same but the air volume Increases increases
If the duct diameter is narrow Increases
If the duct inner surface is rough
(such as a spiral)
U-38
Increases
(Duct length)
64 ft (20 m)
48 ft (15 m)
33 ft (10 m)
Static pressure
Air volume
16 ft (5 m)
Page 48

CHAPTER 4 • Characteristics
Reference
Pressure loss caused
by outdoor air wind velocity (inH2O)
= 0.003019 × r × V2
r : Air weight 0.0749 Ib/ft
{
v : Velocity (ft/s)
0.7
0.6
0.5
0.4
0.3
0.2
0.1
3
0
Outdoor air pressure loss (inH2O)
0102030405060
Outdoor air (ft/s)
Reference
Pressure loss caused
by outdoor air wind velocity (Pa)
r
=
2 2
r : Air weight 1.2 kg/m
{
v : Velocity (m/s)
× V2 =
1.2
× (velocity)
3
180
160
140
120
100
80
2
60
40
20
Outdoor air pressure (Pa)
2 4 6 8 10 12 14 16 18
Velocity (m/s)
U-39
Page 49

CHAPTER 4 • Characteristics
2.2 Calculating of Duct Pressure Loss
(1) How to Calculate Curved Sections in Ductwork
Table 6. Pressure Losses in Each Duct Area
Length of
Equivalent
No.
Duct
Area
90°
1
Smooth
Elbow
Rectangular
2
Radius
Elbow
Rectangular
Vaned
3
Radius
Elbow
90°
4
Miter
Elbow
Rectangular
5
Square
Elbow
Rectangular
Vaned
6
Square
Elbow
Rectangular
Vaned
7
Square
Junction
Rectangular
Vaned
8
Radius
Junction
45°
9
Smooth
Elbow
10 Expansion
11 Contraction
Outline Diagram
0.75
C
Value
0.73
0.38
0.26
0.17
0.15
Conditions
R/D = 0.5
=
= 1.0
= 1.5
= 2.0
W/D R/D
0.5
1.30
0.75
1. 0
1. 5
0.5
0.75
1. 0
1. 5
R/D
0.5
0.75
1. 0
1. 5
0.5
0.75
1. 0
1. 5
0.47
0.28
0.18
0.95
0.33
0.20
0.13
0.70
0.16
0.13
0.12
0.45
0.12
0.10
0.15
0.5
1-3
No. of
vanes
1
2
0.87 53D
1.25 76D
0.35 21D
Same loss as circular duct.
Velocity is based on inlet.
With or without
vanes,
rectangular or
round
a = 5°
Loss is for
hV1 - hV
10°
20°
30°
40°
2
1/2 times value
for similar 90°
0.17
0.28
0.45
0.59
0.73
a = 30°
0.02
45°
60°
Loss is for
V
2
0.04
0.07
Round
Pipe
43D
23D
15D
10D
9D
79D
29D
17D
11D
57D
20D
12D
8D
42D
10D
8D
7D
27D
7D
6D
9D
10D
17D
27D
36D
43D
1D
2D
4D
No.
Length of
Equivalent
Duct
Area
Outline Diagram
Conditions
C
Value
Round
Pipe
12 Transformer 0.15 9D
14° or less
Short
13
Entrance
Short
14
Exit
Bell-shaped
15
Entrance
Bell-shaped
16
Exit
Re-entering
17
inlet
Sharp edge,
18
round orifice
V1/V2 = 0
0.25
0.50
0.75
0.50 30D
1. 0 60D
0.03 2D
1. 0 60D
0.85 51D
2.8
2.4
1. 9
1. 5
1. 0
1
170D
140D
110 D
90D
60D
Loss is for
V2
0.02
V
β
β
1/V2
20°
40°
60°
90°
120°
20°
40°
50°
90°
120°
= 0
0.25
0.50
0.75
0.03
0.05
0.11
0.20
0.03
0.08
0.12
0.19
0.27
0.5
0.45
0.32
0.18
30D
27D
19D
11D
19
20
21
Pipe inlet
(with
circular
hood)
Pipe inlet
(with
rectangular
hood)
Short
contraction
Loss is for
V
2
60D
= 0
0.20
0.40
0.60
0.80
1. 0
0.64
0.36
0.16
0.04
39D
22D
9D
2D
22
Short
expansion
V
1/V2
Loss is for
V
1
23
Suction
inlet
(punched
narrow
plate)
Free are ratio
0.2
0.4
0.6
0.8
35
7.6
3.0
1.2
U-40
Page 50

CHAPTER 4 • Characteristics
3. How to Obtain Efficiency from Characteristic Curves
How to Read Characteristic Curve
Recovery
efficiency
Static pressure
outside unit
Temperature
recovery efficiency
Recovery efficiency
Static pressure outside unit
Obtaining the efficiency when supply air and exhaust air volumes are different.
•
Enthalpy recovery efficiency
Enthalpy recovery efficiency
Total static pressure loss (or total straight pipe equivalent length)
High notch air volume
Low notch air volume
(heating)
(cooling)
Static pressure loss related parts
(straight pipe equivalent length total)
Pipe length
The efficiency obtained from the intake side air volume in each characteristic curve can be corrected with the air volume ratio
in the bottom right chart.
If the intake side and exhaust side duct lengths are greatly different or if a differential air volume is required, obtain the intake
side efficiency from the bottom right chart.
Energy Recovery Efficiency Correction Curve
Exhaust air volume
Supply air volume
1. 21.3
0.8 0.9 1. 01.1 1. 4
Efficiency obtained
with air volume on
supply side from
characteristic curve
Air volume ratio =
Supply air volume
Exhaust air volume
Energy recovery
efficiency
(%)
90
80
70
60
Air volume ratio =
0.5 0.6 0.7
Supply side efficiency
after correction
50
Efficiency obtained from supply side air volume (%)
40
50 60 70 80 90 10 0
Corrected energy recovery efficiency (%)
U-41
Page 51

CHAPTER 4 • Characteristics
4. Sound
Sound is vibration transmitted through an object. The object that vibrates is called the sound source, and energy that is
generated at the source is transmitted through the air to the human ear at certain frequencies.
4.1 Sound Levels and Auditory Perception
Sound level is the sound wave energy that passes through a unit
area in a unit time, and is expressed in dB (decibel) units.
The sound heard by the human ear is different according to the
strength of the sound and the frequency, and the relation to the
tone (see chart on the right). The vertical line shows the strength
of the sound and the horizontal line shows the frequency. For
frequencies between 20 Hz to 15,000 Hz which can be detected
by the human ear, the strength of sound that can be detected that
is equivalent to a 1,000 Hz sound is obtained for each frequency.
The point where these cross is the sound level curve, and a sound
pressure level numerical value of 1,000 Hz is expressed. These
are called units of phons; for example, the point on the 60 curve is
perceived as 60 phons.
On average, the human detects sounds that are less than 1,000
•
Hz as rather weak, and sounds between 2,000 to 5,000 Hz as
strong.
ISO Audio Perception Curve
120 dB
Sound level (dB)
Minimum audible valve
Frequency (Hz)
100
4.2
–200
80
60
40
20
–20
–2
–0.2
–0.02
–0.002
–0.0002
Sound
pressure
(Pa)
Sound
strength
(W / cm
2
)
4.2 How to Measure Sound Levels
A sound level meter (JIS C 1502, IEC 651) is used to measure
sound levels and has three characteristics (A*1, C*2 and Flat)
as shown on the right. These represent various sound wave
characteristics. Generally, Characteristic A, which is the most
similar to the human ear, is used. The value measured with the
Lossnay unit operating includes noise caused by the unit and
background noise*3.
*1. Characteristic A is a sound for which the low tones have
been adjusted to be similar to the auditory perception of the
human ear.
*2. Characteristic C is a sound for which the high and low tones
have been adjusted slightly.
*3. Background noise: any sound present in the target location
when no sound is being produced.
Characteristic A
Response (dB)
Characteristic C
Flat characteristic
Frequency (Hz)
U-42
Page 52

CHAPTER 4 • Characteristics
4.3 Sound Frequency Analysis
The human ear detects sound differently according to the frequency; however, the sound generated from vibrations is not
limited to one frequency, but instead, various frequencies are generated at different levels. NC curve will show how the various
frequencies are generated at different levels, which is determined according to the difficulty of detecting conversations.
Even if the sound is a very low level, it can be detected if it has a specic and loud frequency.
•
These sounds are low during product design stages, but sounds may become very disturbing if resonating on ceilings, walls,
etc.
Example: Continuous Frequency Analysis NC Curve
Level (dB)
Frequency (Hz)
Tolerable Sound Levels and NC Values According to Room Application
•
Room Application
Broadcasting studio 25 15 - 20 Cinema 40 30
Music hall 30 20 Hospital 35 30
Theater (approx. 500 seats) 35 20 - 25 Library 40 30
Classroom 40 25 Small office 45 30 - 35
Conference room 40 25 Restaurant 50 45
Apartment 40 25 - 30 Gymnasium 55 50
Hotel 40 25 - 30 Large conference room 50 45
House (living room) 40 25 - 30 Factory 70 50 or more
dB
NC Value Room Application
SPL (dB)
Min. audible limit
Frequency band (Hz)
dB
NC Value
U-43
Page 53

CHAPTER 4 • Characteristics
* Approximate values of sound levels using practical examples
The following diagram shows typical everyday sounds.
Approximate degree of sound levels can be seen.
* Sound levels and perception
Boiler making
Forging, riveting,
drilling
Grinder
Engine, large
motor
Loud factory
Factory
Normal
machine
factory
Office
Computer
room
Typing
room
Many
occupants
Few
occupants
Transportation facilities
Residential area
Subway
Overhead
train
Passenger
car
Business
and
industrial
district
Suburb
Quiet
night
(dB)
130 Painful to ears
120 Near a airplane engine
110 Slight pain to ears Automobile horn
(2 m away)
100 Too loud want to cover Train with open
ears window in tunnel
90 Conversation with the Tr ain passing on
person near you is overhead tracks
not possible
80 Conversation is not Train passing through
possible unless voice is shopping district
raised
70 Voice is raised Shopping district with
intentionally to converse heavy traffic
60 Loud, but normal In busy office
conversation is possible
50 Sound is audible and Among quiet group
disturbing of pedestrians
40 Quiet but not peaceful In quiet group of
Conversation
people
30 Peaceful In broadcasting studio
20 Very quiet Sound of leaves
brushing against
10 each other
0
Source: “Heibon Sha, Industrial Encyclopedia”
U-44
Page 54

4.4 Indoor Sounds
(1) Indoor Sounds Principles
1) Power Levels
The Power level of the sound source (PWL) must be
understood when considering the effects of sound.
See formula below to obtain PWL from the measured sound
pressure data in an anechoic chamber.
CHAPTER 4 • Characteristics
Fig. 1.
Unit
PWL = SPLo + 20 log (
PWL : Sound source power level (dB)
SPLo : Measured sound pressure in anechoic
chamber (dB)
ro : Distance from the unit to measuring point (ft,m)
2) Principal Model
Consider the room shown in Figs. 1 and 2.
Fig. 1 shows an example of an integrated unit (similar to a
•
cassette-type Lossnay unit) and supply air diffuser (with
return grille).
Fig. 2 shows an example of a separated unit (similar to a
ceiling-embedded type Lossnay unit) and supply air diffuser
(with return grille).
is the direct sound from the supply air diffuser (return
•
grille), and is the echo sound. ( to ) is the direct
sound emitted from the unit and duct that can be detected
through the nished ceiling. is the echo sound of .
3) Position of Sound Source and Sound Value
SPL [dB] = PWL + 10 log + .........................(II)
ro) + 11 [dB] ...................(I)
3
1
Q
{ }
4πr
4
2
R
ro
Supply air diffuser
(return grille)
Fig. 2.
Unit
Supply air diffuser
(return grille)
Fig. 3.
(Position of Sound Source and Directivity Factor Q)
(i) (ii)
SPL :
PWL : Power level of sound source [dB]
Q : Directivity factor (Refer to Fig. 3)
r : Distance from sound source [ft,m]
R : Room constant [R =
α
S : Total surface area in room [ft2,m2]
Sound pressure level at reception point [dB]
S/(1 – α)]
: Average sound absorption ratio in room
(Normally, 0.1 to 0.2)
α
c
Position of Sound Source Q
a Center of room 1
b Center of ceiling 2
c Edge 4
d Corner 8
b
a
d
U-45
Page 55

CHAPTER 4 • Characteristics
For the supply air diffuser (and return grille) in Fig. 2, PWL
•
must be corrected for the sound transmission loss from the
duct work (TL) such that:
PWL’ = PWL – TL
Item (i) in formula (II) page 48 is the direct sound ( , ),
•
and (ii) is the echo sound ( , ).
The number sources of sound in the room (main unit,
•
supply air diffuser, return grille etc.) is obtained by
calculating formula (II), and combining the number with
formula (III).
SPL = 10 log (10
The average sound absorption rate in the room and the
•
ceiling transmission loss differ according to the frequency,
so formula (II) is calculated for each frequency band, and
calculated values are combined by formula (III) for an
accurate value. (When A-range overall value is required,
subtract A-range correction value from calculated values of
formula (II), and then combine them by formula (III).)
SPL1/10
+ 10
SPL2/10
.............................
)
(2) Reducing Lossnay Unit Operating Sound
1) When the airow of the unit from above the ceiling is the
sound source.
3
(See page 48: Fig. 1 , , Fig. 2 to , )
(A) Do not install the unit using the following specications if
disturbing sound could be emitted from large units.
(Refer to Fig. 4)
a) Decrease in diameters in the ductwork:
(Ex. 10"dia(ø 250) → 6"dia(ø 150), 8"dia(ø 200) → 4"dia(ø 100))
b) Curves in aluminum exible ducts, etc.
(Especially if immediately installed after unit outlet)
c) Opening in ceiling panels
d) Hanging the unit on materials that cannot support
the wight.
(B) The following countermeasures should be taken.
(Refer to Fig. 5)
a) Use ceiling material with high soundproofing
properties (high transmission loss). (Care is required
for low frequency components as the difference in
material is high).
b) Adding of soundproofing materials to areas below
the source of the sound.
(The entire surface must be covered with
soundproofing sheets. Note that in some cases,
covering the area around the unit may not be
possible due to generated heat.)
1
Transmission Loss in Ceiling Material (dB) Example
Material
( ) indicates
thickness
Average 20 22 23
125 10 12 20
250 11 15 21
500 19 21 23
1,000 26 28 26
2,000 34 35 24
Frequency band (Hz)
(III)
4,000 42 39 —
Fig. 4. Large Unit Installation (Example)
Fig. 5. Countermeasure (Example)
Plaster Board
1/4 inch
7 mm
( ) ( ) ( )
a) d)
a) b)
Plaster Board
3/8 inch
9 mm
c) b)
Lauan Plywood
1/2 inch
12 mm
U-46
Page 56

2)
When supply air diffuser (and return grille) is the source of the
sound
Part 1
(A) If the main unit is separated from the supply air diffuser
(and return grille) as shown in Fig. 6, installing an a)
silencer box, b) silence duct or c) silence grille is
recommended.
(B) If sound is being emitted from the supply air diffuser (and
return grille), a) branch the flow as shown in Fig. 7,
b) add a grille to lower the flow velocity and add a
silencer duct to section b).
(If the length is the same, a silencer duct with a small
diameter is more effective.)
3)
When supply air diffuser (and return grille) is the source of the
sound
Part 2
(A) If the main unit and supply air diffuser (and return grille)
are integrated as shown in Fig. 8, or if the measures
taken in 2) (A) and (B) are inadequate, add
soundproofing material that has a high sound
absorbency as shown in Fig. 8 a).
This is not, however, very effective with direct sounds.
(B) Installing the sound source in the corner of the room as
shown in Fig. 8 b) is effective with sound emitted from
center of the room, but will be inadequate towards sound
emitted from corner of the room.
CHAPTER 4 • Characteristics
Fig. 6 Sound from Supply Air Diffuser
a) b) c)
Fig. 7 Countermeasure (Example)
a) b)
Fig. 8 Additional Countermeasure (Example)
a) b)
U-47
Page 57

CHAPTER 4 • Characteristics
5. NC Curves
LGH-F300RX5-E
Background noise : 25 dB or less (A range) Background noise : 25 dB or less (A range)
Measurement site : Anechoic chamber Measurement site : Anechoic chamber
Operation conditions : Lossnay ventilation Operation conditions : Lossnay ventilation
Power supply : 208 V 60 Hz Power supply : 230 V 60 Hz
90
85
80
75
70
65
60
55
50
45
Extra
high
40
High
35
Low
30
Octave band sound pressure level (dB)
25
Extra
Low
20
15
10
Overall 62.5 125 250 500 1K 2K 4K 8K
Octave band frequency near center (Hz)
NC-10
NC-20
NC-70
NC-60
NC-50
NC-40
NC-30
1.5 m below
Measurement
point
LGH-F470RX5-E
Background noise : 25 dB or less (A range) Background noise : 25 dB or less (A range)
Measurement site : Anechoic chamber Measurement site : Anechoic chamber
Operation conditions : Lossnay ventilation Operation conditions : Lossnay ventilation
Power supply : 208 V 60 Hz Power supply : 230 V 60 Hz
90
85
80
75
70
65
60
55
50
Extra
high
45
High
40
Low
35
30
Octave band sound pressure level (dB)
Extra
25
Low
20
15
10
Overall 62.5 125 250 500 1K 2K 4K 8K
Octave band frequency near center (Hz)
NC-10
NC-70
NC-60
NC-50
NC-40
NC-30
NC-20
1.5 m below
Measurement
point
90
85
80
75
70
65
60
55
50
Extra
high
45
High
40
Low
35
30
Octave band sound pressure level (dB)
Extra
25
Low
20
15
10
Overall 62.5 125 250 500 1K 2K 4K 8K
Octave band frequency near center (Hz)
90
85
80
75
70
65
60
55
Extra
50
high
High
45
40
Low
35
30
Extra
Octave band sound pressure level (dB)
Low
25
20
15
10
Overall 62.5 125 250 500 1K 2K 4K 8K
Octave band frequency near center (Hz)
NC-20
NC-10
NC-20
NC-10
NC-70
NC-60
NC-50
NC-40
NC-30
NC-70
NC-60
NC-50
NC-40
NC-30
1.5 m below
1.5 m below
Measurement
point
Measurement
point
LGH-F600RX5-E
Background noise : 25 dB or less (A range) Background noise : 25 dB or less (A range)
Measurement site : Anechoic chamber Measurement site : Anechoic chamber
Operation conditions : Lossnay ventilation Operation conditions : Lossnay ventilation
Power supply : 208 V 60 Hz Power supply : 230 V 60 Hz
90
85
80
75
70
65
60
55
50
45
Extra
high
40
High
35
Low
30
Extra
Octave band sound pressure level (dB)
Low
25
20
15
10
Overall 62.5 125 250 500 1K 2K 4K 8K
Octave band frequency near center (Hz)
NC-70
NC-60
NC-50
NC-40
NC-30
NC-20
NC-10
U-48
1.5 m below
Measurement
point
90
85
80
75
70
65
60
55
50
Extra
high
45
High
40
Low
35
30
Extra
Octave band sound pressure level (dB)
Low
25
20
15
10
Overall 62.5 125 250 500 1K 2K 4K 8K
Octave band frequency near center (Hz)
NC-20
NC-10
NC-70
NC-60
NC-50
NC-40
NC-30
1.5 m below
Measurement
point
Page 58

CHAPTER 4 • Characteristics
LGH-F1200RX5-E
Background noise : 25 dB or less (A range) Background noise : 25 dB or less (A range)
Measurement site : Anechoic chamber Measurement site : Anechoic chamber
Operation conditions : Lossnay ventilation Operation conditions : Lossnay ventilation
Power supply : 208 V 60 Hz Power supply : 230 V 60 Hz
90
85
80
75
70
65
60
55
Extra
high
50
High
45
Low
40
35
30
Octave band sound pressure level (dB)
25
20
15
10
Overall 62.5 125 250 500 1K 2K 4K 8K
Octave band frequency near center (Hz)
NC-10
NC-70
NC-60
NC-50
NC-40
NC-30
NC-20
1.5 m below
Measurement
point
90
85
80
75
70
65
60
Extra
55
high
High
50
45
Low
40
35
30
Octave band sound pressure level (dB)
25
20
15
10
Overall 62.5 125 250 500 1K 2K 4K 8K
Octave band frequency near center (Hz)
NC-10
NC-20
NC-70
NC-60
NC-50
NC-40
NC-30
1.5 m below
Measurement
point
U-49
Page 59

Page 60

CHAPTER 5
System Design Recommendations
Page 61

CHAPTER 5 • System Design Recommendations
1. Lossnay Unit Operating Environment
Main Unit Installation Conditions OA ( Outdoor Air ) conditions RA ( Return Air ) conditions
Commercial use
Lossnay
Pay special attention to extreme operating conditions.
14°F to 104°F
-10°C to 40°C
RH80% or less
1.1 Cold Weather Area Intermittent Operation
When the OA temperature falls below 14°F (-10°C) during operation, the SA-fan will change to intermittent operation. OFF for
10 minutes, ON for 60 minutes.
1.2 In Cold Climates with Outdoor Temperature of 23°F (–5°C) or Less
Plot the Lossnay intake air conditions A and B on a psychrometric
chart (see right). If the high temperature side air B intersects the
saturation curve such as at C, moisture condensation or frost
will build on Lossnay. In this case, the low temperature side air A
should be warmed up to the temperature indicated by Point A’ so
that Point C shifts to the Point C’.
5°F to 104°F
-15°C to 40°C
RH80% or less
14°F to 104°F
-10°C to 40°C
RH80% or less
Saturation curve
B
C
A
Dry bulb temperature (°F,°C)
C’
A’
Absolute humidity (kg/kg’)
1.3 In High Humidity Conditions with Relative Humidity of 80% or More
When using the system in high humidity conditions such as heated indoor pools, bathrooms, mushroom cultivation houses,
high-fog areas etc., moisture will condense inside the Core, and drainage will occur. Lossnay units should not be used in these
types of applications.
1.4 Other Special Conditions
Lossnay units cannot be installed in locations where toxic gases and corrosive elements such as acids,
•
alkalis, organic solvents, oil mist or paints exist.
Cannot be installed where heat is recovered from odiferous air and supplied to another area.
•
Avoid installing in a location where unit could be damaged by salt or hot water.
•
U-52
Page 62

CHAPTER 5 • System Design Recommendations
2. Sound Levels of Lossnay Units with Built-in Fans
The sound levels specified for Lossnay units are generated from tests conducted in an anechoic chamber. The sound levels
may increase by 8 to 11 dB according to the installation construction material and room contents.
When using Lossnay units in a quiet room, it is recommended silencer duct, silencer intake/exhaust grill or silencer box be
installed.
3. Attaching Air Filters
An air filter must be mounted to both the intake and exhaust air inlets to clean the air and to prevent the Core from clogging.
Periodically clean the filter for optimum Lossnay unit performance.
4. Constructing the Ductwork
Always add insulation to the two ducts on the outdoor side (outdoor air intake and exhaust outlet) to prevent frost or
•
condensation from forming.
The outdoor duct gradient must be 1/30 or more (to wall side) to prevent rain water from going into the system.
•
Do not use standard vent caps or round hoods where those may come into direct contact with rain water.
•
(A deep hood is recommended.)
5. Bypass Ventilation
Do not operate “bypass ventilation” when heating during winter. Frost or condensation may form on the main unit.
6. Night purge function
Do not use the night purge function if fog or heavy rain is expected. Rain water may enter the unit during the night.
7. Transmission Rate of Various Gases and Maximum
Workplace Concentration Levels
Measurement
Conditions
Measurement method
• Photoacoustic
Spectroscopy (PAS)
for SF
6
•
Non-dispersive
Infrared Detector
(NDIR) for CO
•
Gas Detector Tube
for others
The fans are
positioned at the air
supply/exhaust
suction positions of
the Lossnay Core
Measurement
conditions:
80.6°F (27°C), 65% RH
* OA density for CO2
is 600 ppm.
2
Gas
Isopropyl alcohol 1. 0 2,000 50 2.5 400
Ammonia 1. 0 70 2 2.9 50
Carbon dioxide 1.0 44,500 1,400 1. 8
Sulfur hexauoride 1. 0 27.1 0.56 2.1
Air Volume
Ratio
QSA/QRA
Exhaust Air
Concentration
CRA (ppm)
Supply Air
Concentration
CSA (ppm)
Transmission
Rate
(%)
Concentrations
Max. Workplace
(ppm)
U-53
Page 63

CHAPTER 5 • System Design Recommendations
8. Solubility of Odors and Toxic Gases, etc., in Water and the
Effect on the Lossnay Core
Main
Generation
Site
Chemical
plant or
chemical
laboratory
Toilet
Others
Air
(reference)
: Recommended : Not recommend × : Avoid
Gas
Sulfuric acid H
Nitric acid HNO
Phosphoric acid H
Acetic acid CH
Hydrogen chloride HCl Gas Toxic 427 58 427 58 5 ×
Hydrogen uoride HF Gas Toxic 90 90 0.6 ×
Sulfur dioxide SO
Hydrogen sulde H2S Gas Toxic 2.3 2.3 10
Ammonia NH3 Gas Bad odor 635 40 635 40 50 ×
Phosphine PH
Methanol CH3OH Vapor Toxic
Ethanol CH3CH2OH Vapor Toxic
Ketone Vapor Toxic
Skatole C
Indole C9H7N Gas Bad odor Minute Minute
Ammonia NH3 Gas Bad odor 635 40 635 40 50 ×
Nitric monoxide NO 0.0043
Ozone O3
Methane CH4
Chlorine Cl2
Air Mixed gases Gas Non-toxic
Oxygen O2 Gas Non-toxic
Nitrogen N2 Gas Non-toxic
Carbon monoxide CO Gas Toxic
Carbon dioxide CO2 Gas Non-toxic 0.759 0.759
Molecular
Formula
2SO4 Mist Toxic 2,380 2,380 0.25 ×
3 Mist Toxic 180 180 10 ×
3PO4 Mist Toxic 41 41 0.1 ×
3COOH Mist Bad odor 2,115 2,115 25 ×
2 Gas Toxic 32.8 32.8 0.25
3 Gas Toxic 0.26 0.26 0.1
9H9N Gas Bad odor Minute Minute
Gas
Type
Hazardous
level
Solubility in Water
US unit SI unit
3
/ft3Ib/100Ib
ft
Soluble Soluble
Soluble Soluble
Soluble Soluble
0.0301 0.0301
Minute Minute
0.0167 0.0167
0.0283 0.0283
0.0143 0.0143
0.0214 0.0214
mℓ/mℓ
0.0043
0.00139 0.00139
g/100g
Max.
Workplace
Concentration
200
1,000
1,000
50
0.1
0.5
Useability
of Lossnay
Note: 1. Lossnay should not be used in environments with water soluble gases and mists because the amount that is
transmitted with the water is too high.
2. Lossnay should not be used in environments with acidic gases and mists because these will accumulate in the Core
and cause damage.
3. The table data above apply to only Lossnay partiton plate of total energy recovery units.
U-54
Page 64

CHAPTER 5 • System Design Recommendations
9. Automatic Ventilation Switching
(Refer to technical manual (Control) page C-40)
Effect of Automatic Ventilation Mode
The automatic damper mode automatically provides the correct ventilation for the conditions in the room. It eliminates the need
for manual switch operations when setting the Lossnay ventilator to “bypass” ventilation. The following shows the effect “bypass”
ventilation will have under various conditions.
(1) Reduces Cooling Load
If the air outside is cooler than the air inside the building during the cooling season (such as early morning or at night),
“bypass” ventilation will draw in the cooler outside air and reduce the cooling load on the system.
(2) Cooling Using Outdoor Air
During cooler seasons (such as between spring and summer or between summer and fall), if the occupants in a room
cause the temperature of the room to rise, “bypass” ventilation will draw in the cool outside air and use it as is to cool the
room.
(3) Night Purge
“Bypass” ventilation can be used to release hot air from inside the building that has accumulated during the hot summer
season.
LGH-RX5-E series has night purge function, that is used in the summer to automatically ventilate a room at night while
the air conditioner is stopped, to discharge accumulated heat and thereby reduce the air conditioning load the next
morning. (Selectable function)
(4) Cooling the Office Equipment Room
During cold season, outdoor air can be drawn in and used as is to cool rooms where the temperature has risen due to
office equipment use. (Only when interlocked with City Multi and M-Series or P-Series indoor units.)
U-55
Page 65

CHAPTER 5 • System Design Recommendations
10. Alternate Installation for Lossnay
10.1 Top/bottom Reverse Installation
All LGH-RX5 models can be installed in top/bottom reverse.
Top
Bottom
Bottom
Top
10.2 Vertical and Slanted Installation
All LGH-RX5 models should not be used in both vertical and slanted installation to avoid any problems (motor noise, water
incoming etc).
U-56
Page 66

CHAPTER 5 • System Design Recommendations
11. Installing Supplementary Fan Devices
On occasions it may be necessary to install additional fans in the ductwork following LGH-type Lossnay units because of the
addition of extra components such as control dampers, high-efficiency filters, sound attenuators, etc. which create a significant
extra static pressure to the airflow. An example of such an installation is as shown below.
Static pressure generating component Additional fan
SA RA
Lossnay fan
Lossnay
EA
OA
For such an installation, avoid undue stress on the fan motors. Referring to the diagrams below, Lossnay with extra fans should
be used at the point of left side from A.
Q-H for Lossnay Without Extra Fan Q-H for Lossnay With Extra Fan
(Static pressure) (Static pressure)
H
Lossnay
specication
curve
H1
H2
Extra fan
specication
curve
Lossnay with
extra fan
Lossnay with static pressure
increasing component.
A
H
H1
Lossnay
specication
curve
H1 + H2
Lossnay with static pressure
increasing component.
Lossnay without static
pressure increasing
component.
Q1
(Air volume) (Air volume)
Q
Q1 Q1’
Q
U-57
Page 67

Page 68

CHAPTER 6
Examples of Lossnay Applications
Page 69

CHAPTER 6 • Examples of Lossnay Applications
This chapter proposes Lossnay ventilation systems for eight types of applications. These systems were planned for use in
Japan, and actual systems will differ according to each country - the ventilation systems listed here should be used only as
reference.
1. Large Office Building
1.1 System Design Challenges
Conventional central systems in large buildings, run in oor and ducts, had generally been preferred to individual room units;
thus, air conditioning and ventilation after working hours only in certain rooms was not possible.
In this plan, an independent dispersed ventilation method applied to resolve this problem. The main advantage to such a
system was that it allows 24-hour operation.
A package-type indoor unit of air conditioner was installed in the ceiling, and ventilation was performed with a ceiling-embeddedtype Lossnay. Ventilation for the toilet, kitchenette and elevator halls, etc., was performed with a straight centrifugal fan.
System Design
Building specications
•
Total oor space 327,000 ft2 (30,350 m2)
Basement : Employee cafeteria
•
Ground oor : Lobby, conference room
•
2nd to 7th oor : Offices, salons, board room
•
Air conditioning system
•
Ventilation : Ceiling embedded-type Lossnay, straight centrifugal fan
•
: Basement oor SRC (Slab Reinforced Concrete), seven oors above ground oor
: Package air conditioning
1.2 System Requirements
(1) Operation system that answers individual needs was required.
Free independent operation system
•
Simple control
•
(2) Effective use of oor space
(Eliminating the equipment room)
(3) Application to Building Management Laws
Effective humidication
•
Eliminating indoor dust
•
(4) Energy conservation
1.3 Details
(1) Air Conditioning
In general offices, the duct method would applied with
•
several ceiling-embedded multiple cooling heat pump
packages in each zone to allow total zone operation.
Board rooms, conference rooms, and salons would air
•
conditioned with a ceiling embedded-type or cassette-type
multiple cooling heat pump package.
Installation of an office system air conditioning system
– The air supplied from the Lossnay unit was introduced into the
intake side of the indoor unit of air conditioner, and the stale air
from the room was directly removed from the inside of the ceiling.
Return grille
EA
(Exhaust
air)
OA
(Outdoor
air
suction)
EA
(Exhaust
air)
OA
(Outdoor
air
suction)
SA (Supply air)
Supply grille
Indoor unit of
air conditioner
SA (Supply air to room)
RA (Return air)
Grille
Indoor unit of
air conditioner
Inspection
space
Lossnay
Suspension bolt
position
Suspension bolt
Lossnay
Inspection hole
U-60
Page 70

CHAPTER 6 • Examples of Lossnay Applications
(2) Ventilation
For general offices, a ceiling embedded-type Lossnay unit would be installed. The inside of the ceiling would be used as a
•
return chamber for exhaust, and the air from the Lossnay unit would be supplied to the air-conditioning return duct and
mixed with the air in the air conditioning passage. (Exhaust air was taken in from the entire area, and supply air was
introduced into the indoor units of air conditioner to increase the effectiveness of the ventilation for large rooms.)
For board rooms, conference rooms, and salons, a ceiling embedded-type Lossnay unit would be installed. The stale air
•
would be exhausted from the discharge grille installed in the center of the ceiling. The supply air would be discharged
into the ceiling, where, after mixing with the return air from the air conditioner, it was supplied to the air conditioner.
The air in the toilet, kitchenette, and elevator hall, etc., would be exhausted with a straight centrifugal fan. The OA
•
supply would use the air supplied from the Lossnay unit. (The OA volume would be obtained by setting the Lossnay
supply fan in the general office to the extra-high mode.)
Installation of air conditioning system for board rooms, conference rooms,
salons - the air supplied from the Lossnay unit was blown into the ceiling, and
the stale air was removed from the discharge grille.
SA (Supply air)
Discharge grille
SA (Supply air)
Discharge grille
RA (Return air)
Inspection
space
Lossnay
Suspension bolt
position
Suspension bolt
Lossnay
Inspection hole
Suspension bolt
position
EA
(Exhaust air)
OA
(Outdoor
air suction)
EA
(Exhaust air)
OA
(Outdoor air suction)
U-61
Page 71

CHAPTER 6 • Examples of Lossnay Applications
A gallery for the exhaust air outlets would be constructed on the outside wall to allow for blending in with the exterior.
•
Reference oor indoor units of air conditioner system layout
= Lossnay Air-cooling heat pump air conditioner
Air-cooling heat pump air conditioner
Additional room
Women's
dressing room
Office
Office
machine room
Men's dressing
room
Kitchenette
Machine room
Kitchenette
Men's dressing
room
Office
machine room
Women's
dressing room
Additional
rooms
Machine
room
Machine
room
Additional
rooms
Office
Additional room
U-62
Page 72

CHAPTER 6 • Examples of Lossnay Applications
(3) Humidication
If the load uctuation of the required humidication amount was proportional to the ventilation volume, it was ideal to add a
humidifier with the ventilation system. For this application, the humidifier was installed on with the air supply side of the
Lossnay unit.
(4) Conforming to Building Laws
Many laws pertaining the building environments were concerned with humidication and dust removal; in these terms, it was
recommended that a humidier was added to the air conditioning system to allow adequate humidication.
Installing of a lter on each air-circulation system in the room was effective for dust removal, but if the outdoor air inlet was near
a source of dust, such as a road, a lter should also be installed on the ventilation system.
1.4 Outcome
(1) Air conditioning and ventilation needs were met on an individual room or were basis.
(2) Operation was possible with a 24-hour system.
(3) Operation was simple because the switches were accessible in the room. (A controller was not required.)
(4) Floor space was saved.
(5) Energy was conserved with the independent energy recovery function.
(6) Air-conditioning with ventilation was possible with the independent system.
U-63
Page 73

CHAPTER 6 • Examples of Lossnay Applications
2. Small-Scale Urban Building
2.1 System Design Challenges
The system was designed effectively using limited available air conditioner and ventilator installation space.
For this application, air ow must be considered for the entire oor and the ventilator was installed in the ceiling plenum.
System Design
Application : Office
•
Building specication : RC (Reinforced Concrete)
•
Total oor space : 5,950 ft2 (552 m2) (B1 to 6F)
•
Application per oor : B1: Parking area
•
GF to 6F: Office
Air conditioning system
•
Ventilation : Ceiling-embedded-type and cassette-type Lossnay, straight centrifugal fan, duct ventilation fan.
•
2.2 System Requirements
(1) Three sides of the building were surrounded by other
buildings, and windows could not be installed; therefore
mechanical ventilation needed to be reliable.
(2) Ample fresh outdoor air could not be supplied.
(3) If the exhaust in the room was large, odors from other areas
could have affected air quality.
(4) Humidication during winter was not possible.
: Package air conditioner
GF Layout 2F to 6F Layout
PAC : Package air conditioner
LS : Lossnay
2.3 Details
(1) Air conditioning
Space efficiency and comfort during cooling/heating was improved with ceiling-embedded cassette-type package air
•
conditioner.
(2) Ventilation
Room Entire area was ventilated by installing several ceiling-embedded-type Lossnay units.
•
Salon Humidication was possible by adding a humidier.
•
Conference room Area was independently ventilated by installing a ceiling-embedded-type or cassette-type
•
Board room Lossnay in each room.
•
Toilet, powder room
•
Kitchenette
•
Location of air intake/exhaust air outlets on outside wall
•
The freshness of the outdoor air taken in by the Lossnay was important, and because
other buildings, the intake and exhaust ports must be placed as far apart as possible.
}
(Outdoor air was supplied to the toilet and kitchenette by setting the selection switch on the
Lossnay unit for supply to the extra-high.)
}
}
Area was exhausted with a straight centrifugal fan or duct ventilation fan.
(An adequate exhaust volume was obtained by introducing outdoor air into the space with the
toilet being ventilated constantly.)
the building was surrounded by
U-64
Page 74

CHAPTER 6 • Examples of Lossnay Applications
2.4 Outcome
(1) Appropriate ventilation was possible with forced simultaneous air intake/exhaust using Lossnay units.
(2) Outdoor air to the toilet and kitchenette was possible with Lossnay units, and appropriate ventilation was possible even in
highly sealed buildings.
(3) Odors inltrating into other rooms was prevented with constant ventilation using an adequate ventilation air volume.
(4) Humidication was possible by adding a simple humidifying unit to the Lossnay unit.
3. Hospitals
3.1 System Design Challenges
Ventilating a hospitals required adequate exhaust air from the generation site and ensuring a supply of ample fresh outdoor air.
An appropriate system was an independent ventilation system with forced simultaneous air intake/exhaust.
The fan coil and package air conditioning were according to material and place, and the air conditioned room was ventilated
with ceiling-embedded-type Lossnay units. The toilet and kitchenette, etc., were ventilated with a straight centrifugal fan.
System Design
Building specication
•
Total oor space : 10,000 ft2 (931 m2) (GF to 3F)
•
Application per oor : GF : Waiting room, diagnosis rooms, surgery theater, director room, kitchen
•
2F : Patient rooms, nurse station, rehabilitation room, cafeteria
3F : Patient rooms, nurse station, head nurse room, office
Air conditioning system
•
Ventilation : Ceiling-embedded-type Lossnay, straight centrifugal fan
•
: RC (Reinforced Concrete)
: Fan coil unit, package air conditioner
3.2 System Requirements
(1) Prevented in-hospital disease transmission.
(Meeting needs for operating rooms, diagnosis rooms, waiting rooms and patient rooms were required.)
(2) Adequate ventilation for places where odors were generated
(Preventing odors generated from toilets from inltrating into other rooms was required.)
(3) Blocking external sound
(Blocking sound from outside of the building and from adjacent rooms and hallway was required.)
(4) Assuring adequate humidity
U-65
Page 75

CHAPTER 6 • Examples of Lossnay Applications
3.3 Details
(1) Air Conditioning
Centralized heat-source control using a fan coil for the
•
general system allowed efficient operation timer control and
energy conservation.
A 24-hour system using a package air conditioner for
•
special rooms (surgery theater, nurse station, special
patient rooms, waiting room) was the most practical.
(2) Ventilation
Hallway
•
Independent system using centralized control with large air
volume Lossnay units, or independent system with ceiling
suspended-type Lossnay units.
Surgery theater
•
Combination of larger air volume Lossnay and package airconditioner with HEPA lter on room supply air outlet.
Diagnosis rooms and examination room
•
Patient rooms
Nurse stations
Independent ventilation for each room using ceiling
suspended/embedded-type Lossnay.
Integral system with optional humidifier for required
•
rooms.
Positive/negative pressure adjustment, etc., was possible
•
by setting main unit selection switch to extra-high mode
(smaller air volume models) according to the room.
Toilet/kitchenette
•
Straight centrifugal fan or duct ventilation fan
Storage/linen closet
•
Positive pressure ventilation fan or duct ventilation fan.
The outdoor air was supplied from the hallway ceiling with
the straight centrifugal fan, and was distributed near the
indoor unit of air conditioner after the air ow was reduced.
Kitchen
•
Exhaust with negative pressure ventilation fan or straight
centrifugal fan. Outdoor air was supplied with the straight
centrifugal fan.
Machine room
•
Exhaust with positive pressure ventilation fan.
GF Layout
Machine
room
Prep
room
Surgery
theater
Director
room
2F Layout
Kitchenette
Rehabilitation
room
Lossnay
3F Layout
Storage/
machine
room
Head
nurse
Office
room
Kitchen
Inspection
room
Nurse
beds
Conference
Nurse
beds
Nurse
station
(4 beds)
room
Nurse
station
Patient
room
Medicine
supply
storage
Treatment
room
Lossnay
Patient
room
(1 bed)
Gastro
camera
room
Diagnosis
room
Patient
room
(1 bed)
Patient
room
(4 beds)
Patient
room
(1 bed)
Patient
room
(1 bed)
Pharmacy
Patient
room
(1 bed)
Patient
room
(1 bed)
Patient
room
(1 bed)
X-ray
room
Reception
Patient
room
(1 bed)
Patient
room
(4 beds)
Patient
room
(1 bed)
Waiting
room
Patient
room
(2 beds)
Storage
Cafeteria/
lounge
Lossnay
Patient
room
(1 bed)
Foyer
Storage
Patient
room
(1 bed)
Storage
3.4 Outcome
(1) The following outcomes were possible by independently ventilating the air-conditioned rooms with Lossnay units:
Disease transmission could be prevented by shielding the air between rooms.
•
Lossnay Core’s sound reducing properties reduced outside sound.
•
Because outdoor air did not need to be taken in from the hallway, doors could be sealed, shutting out sounds from the
•
hallway.
Humidication was possible by adding a humidier.
•
(2) By exhausting the toilet, etc., and supplying outdoor air to the hallway:
Odors inltrating into other rooms were prevented.
•
U-66
Page 76

CHAPTER 6 • Examples of Lossnay Applications
4. Schools
4.1 System Design Challenges
A comfortable classroom environment was necessary to improve the students’ desires to study.
Schools near airports, railroads and highways had sealed structures to soundproof the building, and thus air conditioning and
ventilation facilities were required. Schools in polluted areas such as industrial districts also required air conditioning and
ventilation facilities. At university facilities which had a centralized design to efficiently use land and to improve the building
functions, the room environment had to also be maintained with air conditioning.
System Design
Total oor space : 247,600 ft2 (23,000 m2)
•
Building specications
•
Memorial hall wing
Library wing
Main management wing
4.2 System Requirements and Challenges
(1) Mainly single duct methods, fan coil unit methods, or package methods were used for cooling/heating, but the diffusion
rate was still low, and water-based heaters were still the main heating source.
(2) The single duct method was difficult to control according to the usage, and there were problems in operation costs.
(3) Rooms were often ventilated by opening windows or using a ventilation gallery; although the methods provide ample
ventilation volume, those may introduce sound coming from the outside.
: Prep school (high school wing)
4.3 Details
(1) To achieve the goals of overall comfort, saving space and
energy, an air conditioning and ventilation system with a
ceiling-embedded-type fan coil unit and ceiling-embeddedtype Lossnay was installed.
(2) Automatic operation using a weekly program timer was used,
operating when the general classrooms and special
classrooms were used.
(3) By using a ventilation system with a total energy recovery unit,
energy was saved and soundproong was realised.
4.4
Criteria for installing air conditioning
Classroom Layout
(Hallway) SA RA
RA
(Classroom)
RA
SA
SA SA
SA
RA
RA
system in schools (Example)
(1) Zoning according to application must be possible.
(2) Response to load uctuations must be swift.
(3) Ventilation properties must be ideal.
(4) The system must be safe and rmly installed.
(5) Future facility expansion must be easy.
(6) Installation in existing buildings must be possible.
(7) Installation and maintenance costs must be low.
SA
RA
LS LS
OA EA OA
SA
RA
SASA
(Veranda)
4.5 System Trends
(1) It was believed that environmental needs at schools would continue to progress, and factors such as comfort level,
ventilation, temperature/humidity, sound proong, natural lighting, and color must be considered during the design stage.
(2)
Independent heating using a centralized control method was mainly applied when the air conditioner unit was installed for
heating only application. For cooling/heating, a combination of a fan coil method and package-type was the main method used.
(3) The total energy recovery unit was mainly used in consideration of the energy saved during air conditioning and the high
soundproong properties.
U-67
Page 77

CHAPTER 6 • Examples of Lossnay Applications
5. Convention Halls, Wedding Halls in Hotels
5.1 System Design Challenges
Hotels often included conference, wedding, and banquet halls.
Air conditioning systems in these spaces had to have a ventilation treatment system that could handle extremely large
uctuations in loads, any generated tobacco smoke, and odor removal.
5.2 Systems Requirements
The presence of CO and CO2 at permissible values, odor removal, and generated tobacco smoke were often considered in
ventilation standards; often the limit was set at 18 CFM·person to 21 CFM·person (30 m3/h·person to 35 m3/h·person). Several
package air conditioners with ventilation or air-handling unit facilities were often used, but these were greatly affected by
differences in capacity, ratio of smokers, and length of occupancy in the area.
5.3 Details
The proposed plan had two examples using a Lossnay unit as a ventilator for total energy recovery in the air-conditioned
conference room, and using several package air-conditioners with ventilation for convention and banquet halls.
A) Conference room
Energy recovery ventilation was executed with continuous operation of the Lossnay unit, but when the number of persons
increased and the CO2 concentration reached a set level (for example, 1,000 ppm in the Building Management Law), a
separate centrifugal fan turned on automatically. The system could also be operated manually to rapidly remove smoke
and odors.
B) Convention and banquet halls
The system included several outdoor air introduction-type package air conditioners and straight centrifugal fans for
ventilation. However, an inverter controller was connected to the centrifugal fan so that it constantly operated at 50
percent, to handle uctuations in ventilation loads. By interlocking with several package air-conditioners, detailed handling
of following up the air condition loads in addition to the ventilation volume was possible.
Systems using Lossnay were also possible.
LS : Lossnay
EX : Centrifugal fan
PAC : Package air conditioner
Conference Room Ventilation System Diagram
5.4 System Trends
The load characteristics at hotels was complex compared to general buildings, and were greatly affected by the occupancy, and
operation. Because of the high ceilings in meeting rooms and banquet halls preheating and precooling also needs to be
considered. Further research on management and control systems and product development would be required to achieve
even more comfortable control within these spaces.
U-68
EX : Centrifugal fan
PAC : Package air conditioner
IB : Inverter controller
Convention and Banquet Hall Ventilation System Diagram
Page 78

CHAPTER 6 • Examples of Lossnay Applications
6.
Public Halls (Facilities Such as Day-care Centers)
6.1 System Design Challenges
For buildings located near airports and military bases, etc., that required soundproofing, air conditioning and ventilation
facilities had conventionally been of the centralized type. However, independent dispersed air conditioning and ventilation
systems had been necessary due to the need for zone control, as well as for energy conservation purposes. The system
detailed below was a plan for these types of buildings.
System Design
Building specications
•
Application : GF Study rooms (two rooms), office, day-care room, lounge
•
2F
Air conditioning : GF Air-cooling heat pump chiller and fan coil unit
•
2F
Ventilation : Ceiling-embedded Lossnay unit
•
: Two oors above ground oor, Total oor space: 4,150 ft2 (385 m2)
.....
Meeting room
.....
Air-cooling heat pump package air conditioner
6.2 System Requirements
(1)
Conventional systems used centralized units with air-handling units, and air conditioning and ventilation were performed together.
(2) Topics
1) Special knowledge was required for operation, and there were problems in response to the users’ needs.
2) When the centralized method was used, the air even in rooms that were not being used was conditioned, increasing
operation costs.
3) Machine room space was necessary.
4) Duct space was necessary.
6.3 Details
(1) Air-conditioning Facilities
1) Small rooms : Air-cooling heat pump chiller and fan coil unit combination
2) Meeting rooms : Single duct method with air-cooling heat pump package air conditioner
(2) Ventilation Facilities
1) A ceiling-embedded-type Lossnay unit was used in each room, and a silence chamber, silence-type supply/return
grille, silence duct, etc. was incorporated on the outer wall to increase the total soundproong effect.
6.4 Outcome
(1) Operation was possible without special training, so system management was easy.
(2) Zone operation was possible, and was thus energy-saving.
(3) Soundproof ventilation was possible with the separately installed ventilators.
(4) Energy saving ventilation was possible with the energy recovery ventilation.
(5) Ceiling-embedded-type Lossnay unit saved space.
Ground Floor Layout 2F Layout
Machine room
PAC
Kitchenette
Stairway
LS
Study room
FCU
FCU
LS
Toilet
Hall
FCU
Day-care room
PAC
LS
Meeting room
Lounge
Foyer
LS
Study room
U-69
Page 79

Page 80

CHAPTER 7
Installation Considerations
Page 81

CHAPTER 7 • Installation Considerations
1. LGH-Series Lossnay Ceiling Embedded-Type
(LGH-RX5 Series)
LGH- F300 · F470 · F600RX5
Installation diagram
Always leave inspection holes ( 18 or 24) on the air
•
lter and Lossnay Core removal side.
Always insulate the two ducts outside the room (intake
•
air and exhaust air ducts) to prevent condensation.
It is possible to change the direction of the outside air
•
ducts (OA and EA side).
Do not install the vent cap or round hood where it will
•
come into direct contact with rain water.
Air volume (CFM) Model
300
470
600
LGH-F300RX type
LGH-F470RX type
LGH-F600RX type
EA
(Exhaust air)
OA
(Outside air)
Duct downward slope 1/30
or more (to wall side)
(Rainwater entrance
prevention)
Deep hood or
weather cover
EA (Exhaust air)
OA (Outside air)
5 7/8 to 9 7/8
23 5/8 or more
Duct diameter 8”dia
(ordered by customer)
Suspension bolt position
(ordered by customer)
A
Suspension bolt position
Inspection
opening
Inspection opening
Exhaust air grille
B
Lossnay Core/
air filter/
fan maintenance
space
(Return air)
Suspension bolt position
16 5/16
Suspension bolt
position
Supply air grille
16 5/16
Supply/
exhaust air grille
RA
SA
(Supply air)
Unit (inch)
Dimension
A B
34 1/2 41 7/8
39 3/4
40 13/16
39 3/4 49 3/4
LGH- F1200RX5
Installation diagram
Ceiling
Exhaust grille
(user supplied)
EA
(exhaust-air outlet)
Air-supply grille
(user supplied)
OA
(fresh-air intake)
Duct
(user supplied)
Duct
(user supplied)
Duct incline
Over 1/30
(toward the wall)
to prevent entry
of rainwater
EA
(exhaust-air outlet)
OA
(fresh-air intake)
suspension
bolt position
50 1/8
(user
supplied)
18( 24) Inspection port
Duct diameter 10”dia
(user supplied)
39 3/4
18( 24)
Inspection port
Heat exchanger/filter
maintenance space
Ceiling suspension
bolt
(user supplied)
Exhaust grille
(user supplied)
Y piping,Dwindle pipe
(user supplied)
Min. 23 5/8
5 7/8 to 9 7/8
Ceiling suspension
bolt position
RA
(return air)
Exhaust grille
(return air)
RA
Air-supply grille
(user supplied)
Air-supply grille
(user supplied)
Air-supply grille
SA
(supply air)
SA
(supply air)
Ceiling
suspension
bolt position
Duct
diameter 8”dia
(user supplied)
Always leave inspection holes ( 18 or 24) on the air
•
lter and Lossnay Core removal side.
Always insulate the two ducts outside the room (intake
•
air and exhaust air ducts) to prevent condensation.
If necessary, order a weather cover to prevent rain water
•
from direct contact or entering the unit.
Ducting
Indoor Outdoor
Heating-insulation
material
Taping
Duct
Duct connecting flange
Should secure with airtight
tape to prevent air leakage.
Heating-insulation
material
Taping
Should secure with airtight
tape to prevent air leakage.
Cover duct with insulation
foam prevent condensation.
EA
(exhaust
air outlet)
OA
(outside
air intake)
Electrically operated damper
(Protection against the intrusion of cold air
while Lossnay is stopped in winter)
(To be provided by the customer)
EA
(exhaust
air outlet)
OA
(outside
air intake)
U-72
Lossnay unit
Unit (inch)
In a region where there is risk of freezing in winter, it is
•
recommended to install an Electrically operated damper,
or the like, in order to prevent the intrusion of (cold)
outdoor air while Lossnay is stopped.
Page 82

CHAPTER 7 • Installation Considerations
1.1 Choosing the Duct Attachment
Choose between two directions for the outside duct (OA, EA) piping direction for alternative installation.
Standard Installation Alternative Installation
*A space is
necessary to
prevent rain
water from
entering the
unit.
EA
OA
It is possible
to set the unit
close to a
wall.
EA
To avoid obstructing
the supply and
exhaust ducts.
OA
EA
Lights, etc.
OA
1.2 Installation and Maintenance
(1) Always leave an inspection hole ( 18) to access the lter and Lossnay Core.
(2) Always insulate the two ducts outside the room (intake air and exhaust air ducts) to prevent frost from forming.
(3) Prevent rainwater from entering.
Apply a slope of 1/30 or more towards the wall to the intake air and exhaust air ducts outside the room.
•
Do not install the vent cap or round hood where it will come into direct contact with rainwater.
•
(4) Use the optional “control switch” (Ex. PZ-60DR-E, etc.) for the RX5-type.
A MELANS centralized controller can also be used.
1.3 Installation Applications
(1) Installing Two Units to One Outside Air Duct
The main unit’s supply outlet and suction inlet and the
room side and outdoor side positions cannot be
changed. However, the unit can be installed upsidedown, and installed as shown below. (This is
applicable when installing two units in one classroom,
etc.)
Reversed
installation
RA RA
EA
Lossnay Lossnay
OA EA
Inspection
opening
SA SA
Standard
installation
(2) System Operation with Indoor Unit of Air Conditioner
There is an increased use of air conditioning systems
with independent multiple air-conditioner unit due to
their features such as improved controllability, energy
conservation and saving space.
For these types of air conditioning systems, combining
the operation of the dispersed air conditioners to
Lossnay is possible.
Cassette-type indoor unit of
air conditioner or fan coil unit
Ceiling embedded-type indoor unit
of air conditioner or fan coil unit
Return grille
Return grille
Ceiling embeddedtype Lossnay unit
Exhaust
Air intake
Ceiling
Ceiling embeddedtype Lossnay unit
Exhaust
Air intake
Ceiling
U-73
Page 83

Page 84

CHAPTER 8
Filters
Page 85

CHAPTER 8 • Filters
1. Importance of Filters
Clean air is necessary for comfort and health. Besides atmospheric pollution that has been generated with the development of
modern industries, the increased use of automobiles, air pollution in air-tight room has progressed to the point where it has an
adverse effect on occupants.
Also, demands for preventing pollen from entering inside spaces are increasing.
2. Dust
The particle diameter of dust and applicable range of filters are shown in Table 1, and representative data regarding outdoor air
dust concentrations and indoor dust concentrations is shown in Table 2.
Table 1. Aerosol particle diameters and applicable ranges of various lters
Table 2. Dust Concentrations
Type Reference Data
Outdoor air dust
concentration
Indoor dust concentration
Solid
particles
Fluid
particles
Major
particles
Aerosol particle
Air lters
3.94×10-53.94×10
Viruses
HEPA lter
Aerosol particle diameter (mil)
-4
Fumes Dust
Tobacco smoke
Carbon black
ZnO fumes
1. 2 ×10
-3
3.94×10
Mist
Clay
Oil fumes
Sea salt
particles
Atmospheric
dust
-2
3.9×10-23.9×10
Bacteria
Medium to high efficiency lters
-1
Mud Sand
Fry ashes
Coal dust
Cement
Pollen
Hair
Fine dust, coarse
dust llers
393.9
Sprays
Large city 6.24 - 9.36 × 10⁻⁹ (lb/ft3) 0.1 - 0.15 mg/m
Small city 6.24 × 10⁻⁹ (lb/ft3) 0.1 mg/m3 or less
Industrial districts 1.25 × 10⁻⁹ (lb/ft3) 0.2 mg/m3 or more
General office 3.5 × 10⁻⁴ (ounce/h) 10 mg/h per person
Stores 0.00018 (ounce/h) 5 mg/h per person
Applications with no tobacco smoke 0.00018 (ounce/h) 5 mg/h per person
3
Remarks:
1. Outdoor dust is said to have a diameter of 0.08 mil (2.1 µm); the 11 types of dust (average diameter 0.08 mil (2.0 µm)) as
listed by JIS Z8901 for performance test particles are employed.
2. Dust in office rooms is largely generated by cigarette smoke, and its diameter is 0.028 mil (0.72 µm). The 14 types of dust
(average 0.031 mil (0.8 µm)) as listed by JIS Z 8901 for performance test particles are employed.
3. Dust generated in rooms where there is no smoking has approximately the same diameter as outdoor air.
4. Smoking in general offices (Japan):
Percentage of smokers : Approx. 70% (adult men)
Average number of cigarettes : Approx. 1/person·h (including non-smokers)
Length of cigarette
(tobacco section)
: Approx. 1.6 inch (4 cm)
Amount of dust generated by one cigarette : Approx. 3.5 × 10⁻⁴ ounce/cigarette (10 mg/cigarette)
U-76
Page 86

CHAPTER 8 • Filters
100
3.
Calculation Table for Dust Collection Efficiency of Each Lossnay Filter
Tested
Filter type
Pre-lter NP/400
Measurement
method
dust
Applicable
model
Commercial Lossnay
(LGH)
AFI
Gravitational
method
Compound
dust
82% 8% - 12% Protection of heat recovery element
ASHRAE
Colorimetric
method
Atomspheric
dust
Application
3.1 Pressure Loss
Effectiveness of the filters used in the Lossnay units are shown below, expressed in terms of collection ratio (%).
Colourimetric method
90% lter
80
60
40
Collection ratio (%)
20
7. 9 ×10-31. 2 ×10-21. 6 ×10-22.4×10
-2
3.1×10
3.9×10
-2
NP/400
-2
7. 9 ×10-21. 1 ×10-11. 6 ×10-12.4×10
Particle diameter (mil)
-1
3.1×10
3.9×10
-1
-1
7. 9 ×10-11. 2 1. 6 2.4 3.1 3.9
U-77
Page 87

CHAPTER 8 • Filters
4. Comparing Dust Collection Efficiency Measurement
Methods
The gravitational, colorimetric, and counting methods used for measuring dust collection efficiency each have different features
and must be used according to filter application.
Test Method Test Dust
AFI
Gravitational
method
NBS
Colorimetric
method
DOP
Counting
method
ASHRAE
Gravitational
method
ASHRAE
Colorimetric
method
Air lter test for air
conditioning set by
Japan Air Cleaning
Assoc.
(Colorimetric test)
Pre-lter test set
by Japan Air
Cleaning Assoc.
(Gravitational
test)
Electrostatic air
cleaning device test
set by Japan Air
Cleaning Assoc.
(Colorimetric test)
Synthetic:
• Dust on standard
road in Arizona: 72%
•
K-1 carbon black: 25%
• No. 7 cotton lint: 3%
Atmospheric dust
Diameter of dioctylphthalate small drop
particles: 0.01mil (0.3 µm)
Synthetic:
•
Regulated air cleaner
ne particles: 72%
•
Morocco Black: 23%
• Cotton linter: 5%
Atmospheric dust
JIS 11-type dust
JIS 8-type dust
JIS 11-type dust
Inward Flow Dust
Measurement Method
Dust weight
measured
beforehand
Degree of
contamination of
white lter paper
Electrical counting
measurement using
light aimed at DOP
Dust weight
measured
beforehand
Degree of
contamination of
white lter paper
Degree of
contamination of
white lter paper
Dust weight
measured
beforehand.
Degree of
contamination of
white lter paper
Outward Flow Dust
Measurement Method
• Filter passage air
volume measured
• Weigh the dust
remaining on the
lter and compare
Degree of
contamination of
white lter paper
Same as left Counting ratio
• Filter passage air
volume measured
• Weigh the dust
remaining on the
lter and compare
Degree of
contamination of
white lter paper
Degree of
contamination of
white lter paper
• Filter passage air
volume measured
• Weigh the dust
remaining on the
lter and compare.
Degree of
contamination of
white lter paper
Efficiency
Indication Method
Gravitational ratio Synthetic dust lters
Comparison of
contamination of
reduction in degree
of contamination
Gravitational ratio
Comparison of
percentage of
reduction in degree
of contamination
Comparison of
percentage of
reduction in degree
of contamination
Gravitational ratio Pre-lter
Comparison of
percentage of
reduction in degree
of contamination
Type of Applicable
Filters
Electrostatic dust
percentage of
(for air conditioning)
Absolute lter and
same type of high
efficiency lter
Pre-lter
Filter for air
conditioning
(for coarse dust)
Filter for air
conditioning (for ne
dust) Electrostatic
dust collector
Filter for air
conditioning
Electrostatic dust
collector
U-78
Page 88

CHAPTER 8 • Filters
Gravitational Method
This method is used for air filters that remove coarse dust (0.39 mil (10 µm) or more). The measurement method is determined
by the gravitational ratio of the dust amount on the in-flow and out-flow sides.
Dust collection ratio =
In-flow side dust amount – Out-flow side dust amount
In-flow side dust amount
Orice
Window
Specimen
Dust supply
device
Manometer
Motor
100 (%)
×
Dust container
Mixing blades
Dust collection lter
Performance test device Example of dust supply device
Rectifying grid
Air volume
adjustment plate
Air-feed fan
Dust supply outlet
Colorimetric Method
The in-flow side air and out-flow side air are sampled using a suction pump and passed though filtering paper. The sampled
air is adjusted so that the degree of contamination on both filter papers is the same, and the results are determined by the
sampled air volume ratios on both sides.
Dust collection ratio =
Air-feed fan
Out-flow side sampling amount – In-flow side sampling amount
Out-flow side sampling amount
Coupling pipe
Coupling
Square duct
Orice
Rectifying grid
Round duct
3.5D3D 2D 2L 2L
pipe
Pressure loss concentration
measurement position
Specimen
Rectifying grid
Baffle plate
Coupling pipe
7.9(200)
7° or
less
10.5R
(267R)
Venturi pipe
3.9R
(100R)
100 (%)
×
Dust chamber
Air lter
21.7(500)
Throttle device
Unit (inch(mm))
U-79
Page 89

CHAPTER 8 • Filters
5. Calculating Dust Concentration Levels
An air conditioning system using Lossnay units is shown below. Dust concentration levels can be easily determined using this
diagram.
Dust Concentration Study Diagram
Indoor unit of air conditioner
Indoor unit lter ηi
Co :
Outdoor air dust concentration (Ib/ft3 (mg/m3))
Ci : Indoor dust concentration (Ib/ft3 (mg/m3))
G :
Amount of dust generated indoors (Ib/h (mg/h))
Qo :
Outdoor air intake amount (CFM (m3/h))
Qi :
Indoor unit of air conditioner air volume
(Total air volume of indoor unit) (CFM (m3/h))
Lossnay unit
High-efficiency lter ηo
ηo : Filtering efficiency of humidier with high efficiency lter %
(colorimetric method)
ηi : Efficiency of the lter for the indoor unit of air conditioner %
(colorimetric method)
When the performance of each machine is known, the indoor dust concentration Ci may be obtained with the filter performance,
i
o
and
η
Also, with the value of Ci and
having been set to specific values as per manufacturer's data. The following formula is used:
η
Ci Q
η
i
η
o
) – Ci Q
η
i
o
)
o
known, indoor unit of air conditioner efficiency can be found using:
η
o
× 100
G + Co Qo (1 –
Ci =
G + Co Qo (1 –
i
=
η
Qo + Qi
U-80
Page 90

CHAPTER 9
Service Life and Maintenance
Page 91

CHAPTER 9 • Service Life and Maintenance
2.1 Removing the parts
1. Service Life
The Lossnay Core has no moving parts, which eliminates vibration problems and permits greater installation flexibility. In
addition, chemicals are not used in the energy recovery system. Performance characteristics remain constant throughout the
period of service.
A lifetime test, currently in progress and approaching thus for 17,300 hours, has revealed no evidence of either reduction in
energy recovery efficiency or material deterioration. If 2,500 hours is assumed to be the number of hours an air conditioner is
used during a year, 17,300 hours equals to about seven (7) years.
(This is not a guarantee of the service life.)
2. Cleaning the Lossnay Core and Pre-lter
Remove all dust and dirt on air filters and Lossnay cores at regular intervals in order to prevent a deterioration in the Lossnay functions.
Guideline: Clean the air filters once a year. (or when “FILTER” and “CLEANING” are indicated on the remote controller)
Clean the Lossnay cores once two year. (Clean the Lossnay cores once a year If possible.)
(Frequency should be increased depending on the extent of dirt.)
1) Maintenance cover
Locate and remove the cover fixing screw. Pull back the hinged clip.
Open the door and lift off of the hinge brackets.
2) Lossnay cores
Take hold of the handle and draw the Lossnay cores out from the
main unit.
Models LGH-F300 to F600RX
Models LGH-F1200RX5:
3) Air filters
After pulling out the Lossnay cores, undo filter guides, then remove
the air filters, located at the bottom left and right of the Lossnay
cores, as below.
5: 2 cores
................................
...........................................
4 cores
Maintenance cover
Hinge
Hinge
bracket
Models LGH-F300 to F600RX5 Models LGH-F1200RX5
Handle
Models LGH-F300 to F600RX
Lossnay core
Main unit
Air filter
5 Models LGH-F1200RX5
Filter stopper
Hinge
Handle
Lossnay
core
Maintenance cover
Main unit
Air filter
Hinge
bracket
Models LGH-F300 to F600RX
Models LGH-F1200RX
5:
................................
...........................................
5:
CAUTION
Bow filter stoppers a little to remove them from filter guide.
Take filter stoppers careful not to break them.
U-82
4 filters
8 filters
Filter guide
Page 92

2.2 Cleaning the parts
1) Air filters
Use a vacuum cleaner to remove light dust. To remove stubborn dirt
wash in a mild solution of detergent and lukewarm water. (under 104 F (40 C))
CAUTION
Never wash the filters in very hot water and never wash them
by rubbing them.
Do not dry the filters by exposing them to a flame.
2) Lossnay cores
Use a vacuum cleaner to suck up the dust and dirt on the exposed
surfaces of the Lossnay cores.
Use a soft brush only to clean exposed surface areas.
CAUTION
Do not use the hard nozzle of the vacuum cleaner. It may damage the exposed surfaces of the Lossnay cores.
Under no circumstances should the Lossnay cores be washed
in water.
CHAPTER 9 • Service Life and Maintenance
Vacuum cleaner
Air filter
Do NOT wash in water.
Vacuum cleaner
(with brushi attachment)
Lossnay core
Corner
2.3 Assembly after maintenance
Bearing in mind the following points, assemble the parts following
the sequence for their removal in reverse.
Arrange the Lossnay core with the air filter side as shown in the
name plate on the Lossnay unit.
Note
If “FILTER” and “CLEANING” are indicated on the remote
controller, turn off the indication, after maintenance.
U-83
Page 93

Page 94

CHAPTER 10
Ventilation Standards in Each Country
Page 95

CHAPTER 10 • Ventilation Standards in Each Country
1. Ventilation Standards in Each Country
1.1 Japan
Summary of Laws Related to Ventilation
Related Laws
Law for
Maintenance of
Sanitation in
Buildings
The Building
Standard Law of
Japan
Item
Acceptable Range Room Environment Standard Values Remarks
Buildings of at least
3,000 m2 (for schools, at
least 8,000 m2).
Buildings with
requirements for
ventilation equipment.
1) Windowless rooms.
2) Rooms in theaters,
movie theaters,
assembly halls, etc.
3) Kitchens, bathrooms,
etc.
Rooms with equipment
or devices using re.
If a central air quality management system or mechanical
ventilation equipment is installed, comply with the standard
target values shown in the table below.
Impurity Volume of
Particles
CO Rate
CO2 Rate Less than 1,000 ppm.
Temperature
Relative Humidity 40% - 70%
Ventilation Less than 0.5 m/sec.
Central air quality management system ventilation
capacity and characteristics
Effective ventilation capacity V 20Af/N(m3)
Af: Floor space (m2); N: Floor space occupied by one person
Impurity Volume of
Particles
CO Rate Less than 10 ppm.
2 Rate Less than 1,000 ppm.
CO
Temperature
Relative Humidity 40% - 70%
Ventilation Less than 0.5 m/sec.
Less than 0.15 mg per 1 m3
of air
Less than 10 ppm. (Less than 20
ppm when outside supply air has
a CO rate of more than 10 ppm.)
1) Between 17°C and 28°C
When making the room
2)
temperature cooler than the
outside temperature, do not
make the difference too great.
Less than 0.15 mg per 1 m3
of air
1) Between 17°C and 28°C
When making the room
2)
temperature cooler than the
outside temperature, do not
make the difference too great.
Applicable buildings are
those designed to serve a
specic purpose.
Applicable buildings are
those with ventilation
equipment requirements.
Industrial Safety and
Health Act
Offices.
(Office sanitation
regulated standards)
U-86
For general ventilation, the effective ventilation area
opening is at least 1/20 of the oor space, and the
ventilation equipment installed gives a CO density of 50
ppm and CO2 density of 5,000 ppm or less. If a central
air quality management system or mechanical ventilation
equipment is installed, comply with the standard target
values shown in the table below.
Impurity Volume of
Particles
CO Rate
CO2 Rate Less than 1,000 ppm.
Air Flow
Heat and Humidity
Conditions
Air (1 atmospheric pressure, 25°C)
less than 0.15 mg per 1 m
Less than 10 ppm. (Less than 20 ppm
when outside supply air has a CO
rate of more than 10 ppm.)
Air ow in room is less than
0.5 m/s, and air taken into the room
does not blow directly on or reach
occupants.
Heat between 17°C - 28°C
Relative humidity 40% - 70%
3
of air
Page 96

CHAPTER 10 • Ventilation Standards in Each Country
2. United States of America
ASHRAE Standard 62 - 2010 Table 6-1 Minimum ventilation rate in breathing zone
People Outdoor
Occupancy
Category
Correctional Facilities
Cell 5 2.5 0.12 0.6 25 10 4.9 2
Dayroom 5 2.5 0.06 0.3 30 7 3.5 1
Guard stations 5 2.5 0.06 0.3 15 9 4.5 1
Booking/waiting 7. 5 3.8 0.06 0.3 50 9 4.4 2
Educational Facilities
Daycare (through age 4) 10 5 0.18 0.9 25 17 8.6 2
Daycare sickroom 10 5 0.18 0.9 25 17 8.6 3
Classrooms (ages 5-8) 10 5 0.12 0.6 25 15 7. 4 1
Classrooms (age 9 plus) 10 5 0.12 0.6 35 13 6.7 1
Lecture classroom 7. 5 3.8 0.06 0.3 65 8 4.3 1
Lecture hall (xed seats) 7. 5 3.8 0.06 0.3 150 8 4.0 1
Art classroom 10 5 0.18 0.9 20 19 9.5 2
Science laboratories 10 5 0.18 0.9 25 17 8.6 2
University/college laboratories 10 5 0.18 0.9 25 17 8.6 2
Wood/metal shop 10 5 0.18 0.9 20 19 9.5 2
Computer lab 10 5 0.12 0.6 25 15 7. 4 1
Media center 10 5 0.12 0.6 A 25 15 7. 4 1
Music/theater/dance 10 5 0.06 0.3 35 12 5.9 1
Multi-use assembly 7. 5 3.8 0.06 0.3 100 8 4.1 1
Food and beverage Service
Restaurant dining rooms 7. 5 3.8 0.18 0.9 70 10 5.1 2
Cafeteria/fast-bood dining 7. 5 3.8 0.18 0.9 10 0 9 4.7 2
Bars, cocktail lounges 7. 5 3.8 0.18 0.9 100 9 4.7 2
Kitchen (cooking) 7. 5 3.8 0.12 0.6 20 14 7. 0 2
General
Break rooms 5 2.5 0.06 0.3 25 10 5.1 1
Coffee stations 5 2.5 0.06 0.3 20 11 5.5 1
Conference/meeting 5 2.5 0.06 0.3 50 6 3.1 1
Corridors – – 0.06 0.3 – 1
Occupiable storage rooms for
liquids or gels
Hotels, Motels, Resorts, Dormitories
Bedroom/living room 5 2.5 0.06 0.3 10 11 5.5 1
Barracks sleeping areas 5 2.5 0.06 0.3 20 8 4.0 1
Laundry rooms, central 5 2.5 0.12 0.6 10 17 8.5 2
Laundry rooms within dwelling units 5 2.5 0.12 0.6 10 17 8.5 1
Lobbies/prefunction 7. 5 3.8 0.06 0.3 30 10 4.8 1
Multipurpose assembly 5 2.5 0.06 0.3 120 6 2.8 1
Office Buildings
Breakrooms 5 2.5 0.12 0.6 50 7 3.5 1
Main entry lobbies 5 2.5 0.06 0.3 10 11 3.5 1
Occupiable storage rooms for dry
materials
Office space 5 2.5 0.06 0.3 5 17 8.5 1
Reception areas 5 2.5 0.06 0.3 30 7 3.5 1
Telephone/data entry 5 2.5 0.06 0.3 60 6 3.0 1
Air Rate
R
p
cfm/person L/s·person cfm/ft
5 2.5 0.12 0.6 B 2 65 32.5 2
5 2.5 0.06 0.3 2 35 1 7. 5 1
Area Outdoor
Air Rate
Ra
2
L/s∙m
Occupant
Notes
2
Density
(see Note 4)
#/1000 ft
or #/100 m
Default Values
Combined Outdoor Air
Rate (see Note 5)
2
cfm/person L/s·person
2
Air
Class
U-87
Page 97

CHAPTER 10 • Ventilation Standards in Each Country
Default Values
Combined Outdoor Air
Rate (see Note 5)
2
cfm/person L/s·person
2
Air
Class
Occupancy
Category
People Outdoor
Area Outdoor
Air Rate
R
p
cfm/person L/s·person cfm/ft
Air Rate
Ra
2
L/s∙m
Occupant
Notes
2
Density
(see Note 4)
#/1000 ft
or #/100 m
Miscellaneous Spaces
Bank vaults/safe deposit 5 2.5 0.06 0.3 5 17 8.5 2
Banks or bank lobbies 7. 5 3.8 0.06 0.3 15 12 6.0 1
Computer (not printing) 5 2.5 0.06 0.3 4 20 10.0 1
General (excludes manufacturing heavy
industrial and processes using chemicals)
10 5.0 0.18 0.9 7 36 18 3
Pharmacy (prep. area) 5 2.5 0.18 0.9 10 23 11. 5 2
Photo studios 5 2.5 0.12 0.6 10 17 8.5 1
Shipping/receiving 10 5 0.12 0.6 B 2 70 35 2
Sorting, packing, light assembly 7. 5 3.8 0.12 0.6 7 25 12.5 2
Telephone closets – – 0.00 0.0 – 1
Transportation waiting 7.5 3.8 0.06 0.3 10 0 8 4.1 1
Warehouses 10 5 0.06 0.3 B – 2
Public Assembly Spaces
Auditorium seating area 5 2.5 0.06 0.3 150 5 2.7 1
Places of religious worship 5 2.5 0.06 0.3 120 6 2.8 1
Courtrooms 5 2.5 0.06 0.3 70 6 2.9 1
Legislative chambers 5 2.5 0.06 0.3 50 6 3.1 1
Libraries 5 2.5 0.12 0.6 10 17 8.5 1
Lobbies/prefunction 5 2.5 0.06 0.3 150 5 2.7 1
Museums (children's) 7. 5 3.8 0.12 0.6 40 11 5.3 1
Museums/galleries 7. 5 3.8 0.06 0.3 40 9 4.6 1
Residential
Dwelling unit 5 2.5 0.06 0.3 F, G F 1
Common corridor – – 0.06 0.3 1
Retail
Sales (except as below) 7. 5 3.8 0.12 0.6 15 16 7. 8 2
Mall common areas 7. 5 3.8 0.06 0.3 40 9 4.6 1
Barbershop 7. 5 3.8 0.06 0.3 25 10 5.0 2
Beauty and nail salons 20 10 0.12 0.6 25 25 12.4 2
Pet shops (animal areas) 7. 5 3.8 0.18 0.9 10 26 12.8 2
Supermarket 7. 5 3.8 0.06 0.3 8 15 7. 6 1
Coin-operated laundries 7. 5 3.8 0.12 0.6 20 14 7. 0 2
Sports and Entertainment
Sports arena (play area) – – 0.30 1. 5 E – 1
Gym, stadium (play area) – – 0.30 1. 5 30 2
Spectator areas 7. 5 3.8 0.06 0.3 150 8 4.0 1
Swimming (pool & deck) – – 0.48 2.4 C – 2
Disco/dance oors 20 10 0.06 0.3 100 21 10.3 2
Health club/aerobics room 20 10 0.06 0.3 40 22 10.8 2
Health club/weight rooms 20 10 0.06 0.3 10 26 13.0 2
Bowling alley (seating) 10 5 0.12 0.6 40 13 6.5 1
Gambling casinos 7. 5 3.8 0.18 0.9 120 9 4.6 1
Game arcades 7. 5 3.8 0.18 0.9 20 17 8.3 1
Stages, studios 10 5 0.06 0.3 D 70 11 5.4 1
GENERAL NOTES FOR TABLE 6-1
1 Related requirements: The rates in this table are based on all other applicable requirements of this standard being met.
2 Environmental Tobacco Smoke: This table applies to ETS-free areas. Refer to Section 5.17 for requirements for buildings containing ETS areas and ETS-free areas.
3 Air density: Volumetric airfl ow rates are based on an air density of 0.075 lbda/ft3 (1.2 kgda/m3), which corresponds to dry air at a barometric pressure of 1 atm
(101.3 kPa) and an air temperature of 70°F (21°C). Rates may be adjusted for actual density but such adjustment is not required for compliance with this standard.
4 Default occupant density: The default occupant density shall be used when actual occupant density is not known.
5 Default combined outdoor air rate (per person): This rate is based on the default occupant density.
6 Unlisted occupancies: If the occupancy category for a proposed space or zone is not listed, the requirements for the listed occupancy category that is most similar in terms
of occupant density, activities, and building construction shall be used.
ITEM-SPECIFIC NOTES FOR TABLE 6-1
A For high school and college libraries, use values shown for Public Assembly Spaces - Libraries.
B Rate may not be suffi cient when stored materials include those having potentially harmful emissions.
C Rate does not allow for humidity control. Additional ventilation or dehumidi cation may be required to remove moisture. “Deck area” refers to the area surrounding the pool
that would be expected to be wetted during normal pool use, i.e., when the pool is occupied. Deck area that is not expected to be wetted shall be designated as a space type
(for example, “spectator area”).
D Rate does not include special exhaust for stage effects, e.g., dry ice vapors, smoke.
E When combustion equipment is intended to be used on the playing surface, additional dilution ventilation and/or source control shall be provided.
F Default occupancy for dwelling units shall be two persons for studio and one-bedroom units, with one additional person for each additional bedroom.
G Air from one residential dwelling shall not be recirculated or transferred to any other space outside of that dwelling.
U-88
Page 98

CHAPTER 10 • Ventilation Standards in Each Country
3. United Kingdom
CIBSE
Outdoor air
Application
Per person Per person Per m
Factories 8 l/s /person 5 l/s /person 0.8 l/s / m
Offices (open plan) 8 l/s /person 5 l/s /person 1.3 l/s / m
Shops, department stores, and supermarkets
8 l/s /person 5 l/s /person 3.0 l/s / m
2
2
2
2
Theaters 8 l/s /person 5 l/s /person — Some
Dance halls 12 l/s /person 8 l/s /person — Some
Hotel bedrooms 12 l/s /person 8 l/s /person 1.7 l/s / m
2
Laboratories 12 l/s /person 8 l/s /person — Some
Offices (private) 12 l/s /person 8 l/s /person 1.3 l/s / m
2
Residences (average) 12 l/s /person 8 l/s /person — Heavy
Restaurant (cafeteria) 12 l/s /person 8 l/s /person — Heavy
Cocktail bars 18 l/s /person 12 l/s /person — Heavy
Conference rooms (average) 18 l/s /person 12 l/s /person — Some
Residence 18 l/s /person 12 l/s /person — Heavy
Restaurant 18 l/s /person 12 l/s /person — Heavy
Board rooms, executive offices, and
conference rooms
25 l/s /person 18 l/s /person 6.0 l/s / m
Corridors N/A N/A 1.3 l/s / m
Kitchens (domestic) N/A N/A 10.0 l/s / m
Kitchens (restaurant) N/A N/A 20.0 l/s / m
Toilets N/A N/A 10.0 l/s / m
2
2
2
2
2
SmokingRecommended Minimum
None
Some
Some
Heavy
Heavy
Very
Heavy
N/A
N/A
N/A
N/A
U-89
Page 99

Page 100

CHAPTER 11
Lossnay Q and A
 Loading...