

Page 1

10
11
12
13
14
15
16
17
18
19
20
21
22
23
24
25
26
27
28
29
30
31
32
33
34
35
36
37
38
39
40
41
42
43
44
45
46
47
48
1
2
3
4
5
6
7
8
9
The Matrox NS-FNIC/4
Performance Numbers
Under Red Hat Linux 6.2
Matrox Networks
November 6, 2000
Version 1.0
Page 2

10
11
12
13
14
15
16
17
18
19
20
21
22
23
24
25
26
27
28
29
30
31
32
33
34
35
36
37
38
39
40
41
42
43
44
45
46
47
48
1
2
3
4
5
6
7
8
9
Page 3

1
Table of Contents
2
3
4
5
6
7
8
9
10
11
12
13
14
15
16
17
18
19
20
21
22
23
24
25
26
27
28
29
30
31
32
33
34
35
36
37
38
39
40
41
42
43
44
45
46
47
48
Product Presentation .................................................................................... 1
Benchmark Utilities Description..................................................................... 2
Detailed Benchmarking Tests and Results...................................................... 3
Test #1: Throughput and Server CPU Utilization................................................................ 3
Test #2: Validation of Throughput and CPU Utilization....................................................... 4
Test #3: Throughput by Transfer and packet size................................................................ 5
Test #4: Adding IP Forwarding ........................................................................................... 6
Test #5: Smartbits 1000 Test ............................................................................................. 7
Test #6: CPU Utilization .................................................................................................... 9
Test #7: Combined Throughput Testing .......................................................................... 10
Test #8: Testing Two Cards............................................................................................. 12
Conclusion ................................................................................................. 13
Table of Contents I
Page 4

1
List of Figures
2
3
4
5
6
7
8
9
10
11
12
13
14
15
16
17
18
19
20
21
22
23
24
25
26
27
28
29
30
31
32
33
34
35
36
37
38
39
40
41
42
43
44
45
46
47
48
Figure 1: Throughput and Server CPU Utilization - Bench Configuration ...............3
Figure 2: Throughput by Transfer and packet size - Bench Configuration................5
Figure 3: Adding IP Forwarding - Bench Configuration...........................................6
Figure 4: Smartbits 1000 Test - Bench Setup .........................................................7
Figure 5: Combined Throughput Testing - Combined Throughput Setup.............10
Figure 6: Testing Two Cards - Bench Setup .........................................................12
II List of Figures
Page 5

1
List of Tables
2
3
4
5
6
7
8
9
10
11
12
13
14
15
16
17
18
19
20
21
22
23
24
25
26
27
28
29
30
31
32
33
34
35
36
37
38
39
40
41
42
43
44
45
46
47
48
Table 1: Server and Client Computer Descriptions.............................................. 2
Table 2: Throughput and Server CPU Utilization - Netperf Benchmark Results.... 3
Table 3: Validation of Throughput - TTCP Benchmark Results ............................. 4
Table 4: Throughput by Transfer and packet size
TTCP Results (Client 3) ......................................................................... 5
Table 5: Adding IP Forwarding - TTCP Routing.................................................... 6
Table 6: Smartbits 1000 Test - Results (Packet Size of 64 Bytes) ........................... 8
Table 7: Smartbits 1000 Test - Results (Packet size of 1000 Bytes)........................ 8
Table 8: CPU Utilization - Combined Throughput Results................................... 9
Table 9: Combined Throughput Testing - Combined Throughput Results .......... 10
Table 10: Testing Two Cards - Combined Throughput Test ................................. 12
List of Tables III
Page 6

1
Tr a d e m a r k s
2
3
4
5
6
7
8
9
10
11
12
13
14
15
16
17
18
19
20
21
22
23
24
25
26
27
28
29
30
31
32
33
34
35
36
37
38
39
40
41
42
43
44
45
46
47
48
Matrox ® is a registered trademark of Matrox Electronic Systems Ltd.
The Matrox NS-FNIC/4™ is a trademark of Matrox Electronics Systems Ltd.
Intel™ is a trademark of the Intel Corporation.
Red Hat® is a trademark of the Red Hat Corporation.
All other nationally and internationally recognized trademarks and tradenames are
hereby acknowledged.
THE INFORMATION CONTAINED IN THIS MANUAL IS SUBJECT TO
CHANGE WITHOUT NOTICE AT ANY TIME.
© Copyright Matrox Electronic Systems Ltd., 2000. All rights reserved.
Disclaimer: Matrox Electronic Systems Ltd. reserves the right to make changes in
these specifications at any time and without notice. The information provided by this
document is believed to be accurate and reliable at the time of its publication. However, no responsibility is assumed by Matrox Electronic Systems Ltd. for its use; nor
for any infringements of patents or other rights of third parties resulting from its use.
No license is granted under any patents or patent rights of Matrox Electronic Systems
Ltd. by the ownership of this document.
IV Trademarks
Page 7

1
2
3
4
5
6
7
8
9
10
11
12
13
14
15
16
17
18
19
20
21
22
23
24
25
26
27
28
29
30
31
32
33
34
35
36
37
38
39
40
41
42
43
44
45
46
47
48
Performance
Numbers Under Red
Hat Linux
P
RODUCT PRESENTATION
The Matrox NS-FNIC/4 is a multiple port Network Interface Card (NIC). The name
stands for Network Server Fast NIC with four ports. It is designed to support 10BaseT
and 100BaseTx technology in both half and full duplex modes.
The Matrox NS-FNIC/4 allows four subnets to be connected to the same server while
using less server resources (PCI slot usage, power consumption, etc.) than four 1 port
NICs and giving the same, if not better, performance. Since the Matrox NS-FNIC/4
uses only one PCI slot per four subnets, you can add more subnets to the same server
by adding more Matrox NS-FNIC/4 cards. The Matrox NS-FNIC/4 can also be used
as part of a software router.
This paper will describe the performance numbers obtained for the Matrox
NS-FNIC/4 under RedHat Linux 6.2® with the Linux Kernel version 2.2.16.
Page 8

Performance Numbers Under Red Hat Linux
1
2
3
4
5
6
7
8
9
10
11
12
13
14
15
16
17
18
19
20
21
22
23
24
25
26
27
28
29
30
31
32
33
34
35
36
37
38
39
40
41
42
43
44
45
46
47
48
B
ENCHMARK UTILITIES DESCRIPTION
The benchmarking utilities that were used to obtain the performance numbers for this
paper are:
• NetPerf v2.1pl3 – available at http://www.netperf.org
.
NetPerf is a benchmark utility that can be used to measure the performance of
many different types of networking equipment. It provides tests for both
unidirectional throughput and end-to-end latency. Te s t #1 used NetPerf to obtain
a throughput and a server CPU utilization measurement for each port, while the
other ports remained idle.
• ΤΤΤΤTCP v1.4-1 – available at
http://ftp.sunet.se/ftp/pub/network/monitoring/TTCP/
TTCP times the transmission and reception of data between two systems using the
UDP or TCP protocols. It differs from common “blast” tests, which tend to
measure the remote client as much as the network performance and which usually
do not allow measurements at the remote end of a UDP transmission. The TTCP
utility only measured throughput. These tests were done using different packets
and file sizes, whenever file transfers were involved.
• Netcom Systems Smartbits 1000® - available at
http://www.netcomsystems.com/solutions/hardware.asp
SmartBits is a hardware device that is the industry standard for network
performance analysis for 10/100 Ethernet and TCP/IP communications.
• Top - Top is a plain text process manager that displays relevant information on all
processes that are active on the machine. The information that can be obtained
includes per-process CPU utilization and total user and system CPU utilization.
Since this information was constantly changing, only an approximation, from
measured values, could be given as to its overall performance. Running the utility
did not add errors to our values because its CPU utilization was also reported. For
all the tests, “Top” consumed 1.9% on average.
• Packet Sniffer - A Packet Sniffer is a network monitoring tool that captures data
packets and decodes them using built-in knowledge of common protocols. Sniffers
are used to debug and monitor networking problems.
TTTT
1:
1: S
AAAABBBBLLLLEEEE
Server
Server Client 1
ServerServer
1 Matrox
NS-FNIC/4
700MHz
Pentium III
AGP Matrox G200
128MB of RAM 64MB of RAM 64MB of RAM 128MB of RAM
20GB Hard Disk drive 1GB Hard Disk drive 1GB Hard Disk drive 20GB Hard Disk drive
RedHat Linux 6.2
(Kernel 2.2.16)
ERVER AND CLIEN T COMPUTER DESCRIPTIONS
1: 1:
Client 3
Client 3
Client 1 Client 2
Client 1Client 1
Intel EtherPro 10/100 Intel EtherPro 10/100 3Com 3CR990-TX-97
166MHz Pentium 100MHz Pentium
Matrox MGA PCI
Millennium
RedHat Linux 6.2 KDE
workstations.
Client 2
Client 2Client 2
Matrox MGA PCI
Millennium
RedHat Linux 6.2 KDE
workstations.
Client 3Client 3
(Used in
(Used in Test #3
(Used in (Used in
AGP Matrox G200
RedHat Linux 6.2 KDE
Test #3))))
Test #3Test #3
700MHz
Pentium III
workstations.
2 Benchmark Utilities Description
Page 9

Performance Numbers Under Red Hat Linux
1
2
3
4
5
6
7
8
9
10
11
12
13
14
15
16
17
18
19
20
21
22
23
24
25
26
27
28
29
30
31
32
33
34
35
36
37
38
39
40
41
42
43
44
45
46
47
48
T
#1: T
EST
AND SERVER
U
TILIZATION
HROUGHPUT
CPU
D
ETAILED BENCHMARKING TESTS AND RESULTS
The first test used the NetPerf benchmarking utility to obtain the throughput as well as
the server CPU utilization. A packet size of 8 kilobytes (8192 bytes) was used
throughout the test. The test bench was set up as shown in Figure 1, below.
Figure 1:
Figure 1: T
Figure 1:Figure 1:
Linux PC with a 10/
100 Ethernet Card
Linux PC with a 10/
100 Ethernet Card
HROUGHPUT AND SERVER
Subnet 1
CPU U
TILIZATION
Linux PC with a
Matrox NS-FNIC/4
Subnet 2 Subnet 3
Linux PC with a 10/
100 Ethernet Card
- B
ENCH CONFIGURATION
Subnet 4
Linux PC with a 10/
100 Ethernet Card
For this test, the clients were all 166MHz Pentiums. The results for throughput and
server CPU utilization are summarized in Ta ble 2. The throughput is in megabits per
second (1 million bits per second) and the CPU utilization is in percentage.
TTTT
2:
2: T
AAAABBBBLLLLEEEE
2: 2:
10Mbits/s
10Mbits/s
10Mbits/s10Mbits/s
Half duplex
Half duplex
Half duplexHalf duplex
10Mbits/s
10Mbits/s
10Mbits/s10Mbits/s
Full duplex
Full duplex
Full duplexFull duplex
100Mbits/s
100Mbits/s
100Mbits/s100Mbits/s
Half duplex
Half duplex
Half duplexHalf duplex
100Mbits/s
100Mbits/s
100Mbits/s100Mbits/s
Full duplex
Full duplex
Full duplexFull duplex
HROUGHPUT AND SERVER
Port 1
Port 1
Port 1Port 1
(Throughput /
(Throughput /
(Throughput / (Throughput /
CPU Utilization)
CPU Utilization)
CPU Utilization) CPU Utilization)
6.86 / 1.85 6.87 / 1.86 6.89 / 1.85 6.89 / 1.85
9.38 / 2.59 9.38 / 2.51 9.38 / 2.59 9.38 / 2.66
65.98 / 17.5 66.14 / 17.06 66.02 / 17.51 66.03 / 17.56
88.81 / 23.97 88.37 / 22.98 89.43 / 24.33 89.51 / 24.11
CPU U
(Throughput /
(Throughput /
(Throughput / (Throughput /
CPU Utilization)
CPU Utilization)
CPU Utilization) CPU Utilization)
Port 2
Port 2
Port 2Port 2
TILIZATION
- N
ETPERF BENCHMARK RESULTS
Port 3
Port 3
Port 3Port 3
(Throughput /
(Throughput /
(Throughput / (Throughput /
CPU Utilization)
CPU Utilization)
CPU Utilization) CPU Utilization)
(Throughput /
(Throughput /
(Throughput / (Throughput /
CPU Utilization)
CPU Utilization)
CPU Utilization) CPU Utilization)
On average, a Matrox NS-FNIC/4 port delivers a throughput of 89Mbits/s with 24%
of server CPU utilization at 100Mbits/s full duplex.
Port 4
Port 4
Port 4Port 4
Detailed Benchmarking Tests and Results 3
Page 10

Performance Numbers Under Red Hat Linux
1
T
#2: V
EST
2
T
HROUGHPUT AND
3
U
4
TILIZATION
5
6
7
8
9
10
11
12
13
14
15
16
17
18
19
20
21
22
23
24
25
26
27
28
29
30
31
32
33
34
35
36
37
38
39
40
41
42
43
44
45
46
47
48
ALIDATION OF
CPU
The second test used the same test bench as Tes t # 1 (see Figure 1). The purpose of
this test was to verify the throughput measurements of Test #1 with a second
independent application. The only limitation of this test is that no CPU utilization
measurements are provided. TTCP gives a throughput measurement by sending 16
megabytes (16,777,216 bytes) in packets of 8 kilobytes (8192 bytes) to the server. It
then divides the total transfer size by the time it took and converts this result to Mbits/s.
The throughput obtained, summarized in Tab le 3, is similar to that obtained from
Test #1. The major difference between Test #1 and Tes t # 2 occurs in the method in
which the table results were computed. The results from Test #1 are averages
computed by the utility itself after automatically performing the test many times.
TTCP, however, only performs one data transfer and then displays the computed
result. In order to get a reliable value, ten such tests were performed on each port and
arithmetic mean
the
of those ten results was computed. Tab le 3 displays only the
average results that were computed.
AAAABBBBLLLLEEEE
TTTT
10Mbits/s
10Mbits/s
10Mbits/s 10Mbits/s
Half duplex
Half duplex
Half duplexHalf duplex
10Mbits/s
10Mbits/s
10Mbits/s 10Mbits/s
Full duplex
Full duplex
Full duplexFull duplex
100Mbits/s
100Mbits/s
100Mbits/s 100Mbits/s
Half duplex
Half duplex
Half duplexHalf duplex
100Mbits/s
100Mbits/s
100Mbits/s 100Mbits/s
Full duplex
Full duplex
Full duplexFull duplex
VALIDATION
3:
3:
3: 3:
HROUGHPUT
OF T
Port 1
Port 1
Port 1 Port 1
(Mbits/s)
(Mbits/s)
(Mbits/s)(Mbits/s)
6.49 6.51 6.54 6.53
8.94 8.94 8.94 8.94
62.34 61.56 62.29 62.05
89.24 89.14 89.26 88.51
- TTCP B
Port 2
Port 2
Port 2 Port 2
(Mbits/s)
(Mbits/s)
(Mbits/s)(Mbits/s)
ENCHMARK RESULTS
Port 3
Port 3
Port 3Port 3
(Mbits/s)
(Mbits/s)
(Mbits/s)(Mbits/s)
At 100Mbits/s full duplex, the results were identical at 89Mbits/s in both Tes t #1 (as
shown in Table 2 ) and Test # 2 (as shown in Table 3, above).
At 100Mbits/s half duplex, the results were similar in both Test #1 (as shown in
Tab le 2 at 66Mbits/s) and Te s t #2 (as shown in Ta ble 3 , above at 62Mbits/s).
At the end of Tes t # 2 , it is clear that the four ports behave in a similar fashion and give
similar throughput.
Port 4
Port 4
Port 4Port 4
(Mbits/s)
(Mbits/s)
(Mbits/s)(Mbits/s)
4 Detailed Benchmarking Tests and Results
Page 11

Performance Numbers Under Red Hat Linux
1
T
#3: T
EST
2
T
RANSFER AND PACKET SIZE
3
HROUGHPUT BY
4
5
6
7
8
9
10
11
12
13
14
15
16
17
18
19
20
21
22
23
24
25
26
27
28
29
30
31
32
33
34
35
36
37
38
39
40
41
42
43
44
45
46
47
48
The third test also used the TTCP benchmarking utility but this time, it was used to
perform different total transfer sizes with different packet sizes. The total transfer sizes
were in fact files that were to be transferred by the software. The file sizes were 1MB,
5MB and 10MB. The packet sizes were 1KB (1024 bytes), 4KB (4096 bytes) and 8KB
(8192 bytes). The test bench was set up as shown in Figure 2, below.
Figure 2:
Figure 2: T
Figure 2:Figure 2:
Linux PC with a 10/
100 Ethernet Card
Linux PC with a 10/
100 Ethernet Card
HROUGHPUT BY TRANSFER AND PACKET SIZE
Linux PC with a
Matrox NS-FNIC/4
Subnet 1
Subnet 2 Subnet 3
Linux PC with a 10/
100 Ethernet Card
- B
TCCP
Application
ENCH CONFIGURATION
Subnet 4
Linux PC with a 10/
100 Ethernet Card
Tab le 4 only shows the results for a packet size of 8 KB and a file size of 10MB for
each port
10Mbits/s
10Mbits/s
10Mbits/s 10Mbits/s
Half duplex
Half duplex
Half duplexHalf duplex
10Mbits/s
10Mbits/s
10Mbits/s 10Mbits/s
Full duplex
Full duplex
Full duplexFull duplex
100Mbits/s
100Mbits/s
100Mbits/s 100Mbits/s
Half duplex
Half duplex
Half duplexHalf duplex
100Mbits/s
100Mbits/s
100Mbits/s 100Mbits/s
Full duplex
Full duplex
Full duplexFull duplex
AAAABBBBLLLLEEEE
TTTT
THROUGHPUT
4:
4:
4: 4:
TTCP R
Port 1
Port 1
Port 1 Port 1
(Mbits/s)
(Mbits/s)
(Mbits/s)(Mbits/s)
RANSFER AND PACKET SIZE
BY T
ESULTS
LIEN T
(C
Port 2
Port 2
Port 2 Port 2
(Mbits/s)
(Mbits/s)
(Mbits/s)(Mbits/s)
3)
Port 3
Port 3
Port 3 Port 3
(Mbits/s)
(Mbits/s)
(Mbits/s)(Mbits/s)
6.52 6.55 6.40 6.67
8.94 8.94 8.94 8.94
84.54 84.53 84.51 84.51
86.06 86.05 86.05 86.04
Port 4
Port 4
Port 4 Port 4
(Mbits/s)
(Mbits/s)
(Mbits/s)(Mbits/s)
In 100Mbits/s Half and Full duplex the resulting numbers were a full 20 points lower
across all four ports when using Client 1 and Client 2. To verify that this was not a
limitation of the Matrox NS-FNIC/4, this test used a different client configuration (see
Client 3 in “Benchmark Utilities Description” on page 2). The higher performing
client provided results that more closely resembled those in Test #1 and Test #2,
therefore the Matrox NS-FNIC/4 was not the cause of this performance drop.
Detailed Benchmarking Tests and Results 5
Page 12

Performance Numbers Under Red Hat Linux
1
2
3
4
5
6
7
8
9
10
11
12
13
14
15
16
17
18
19
20
21
22
23
24
25
26
27
28
29
30
31
32
33
34
35
36
37
38
39
40
41
42
43
44
45
46
47
48
T
#4: A
EST
F
ORWARDING
DDING
IP
The fourth test was similar to Tes t #3 in that it used the same file and packet sizes.
The difference was that the receiving part of the TTCP utility was not run on the
server but on a client. In other words, IP forwarding was added to this test, as shown in
Figure 3, below.
Figure 3:
Figure 3: A
Figure 3:Figure 3:
Client 1 Client 2
1 2
DDING
IP F
ORWARDING
TCCP
Application
- B
ENCH CONFIGURATION
Client 3 Client 4
3 4
IP Forwarding
NS-FNIC/4
Ports in the Server
This test verified whether the Matrox NS-FNIC/4 gives similar throughput when used
in a router configuration. The reported throughput was similar to those reported by
the first three tests and is shown in Tabl e 5 . This table only summarizes the results for
a packet size of 8KB and a file size of 10MB. Ta ble 5 displays the average of the results
obtained in routing packets from one port to the other three. For example, the result
displayed for port one is the average of the measured throughput on each of the three
other ports.
DDING
IP F
ORWARDING
Port 2
Port 2
Port 2Port 2
(Mbits/s)
(Mbits/s)
(Mbits/s)(Mbits/s)
- TTCP R
Port 3
Port 3
Port 3Port 3
(Mbits/s)
(Mbits/s)
(Mbits/s)(Mbits/s)
OUTING
Port 4
Port 4
Port 4Port 4
(Mbits/s)
(Mbits/s)
(Mbits/s)(Mbits/s)
10Mbits/s
10Mbits/s
10Mbits/s10Mbits/s
Half duplex
Half duplex
Half duplexHalf duplex
10Mbits/s
10Mbits/s
10Mbits/s 10Mbits/s
Full duplex
Full duplex
Full duplexFull duplex
100Mbits/s
100Mbits/s
100Mbits/s100Mbits/s
Half duplex
Half duplex
Half duplexHalf duplex
100Mbits/s
100Mbits/s
100Mbits/s100Mbits/s
Full duplex
AAAABBBBLLLLEEEE
TTTT
5:
5: A
5: 5:
Port 1
Port 1
Port 1Port 1
(Mbits/s)
(Mbits/s)
(Mbits/s)(Mbits/s)
6.32 6.32 6.28 6.28
8.94 8.94 8.94 8.94
61.14 61.13 61.32 62.00
61.17 61.54 63.47 64.59
The results in Table 5 are similar to those of Table 4 , showing that the Matrox
NS-FNIC/4 gives similar performance results irrespective of the routing
configuration. However, as in Tab le 4 , the results at 100Mbits/s full duplex seem low.
After further investigation, the client’s CPU and hard disk drive speed proved to be
causing the reduction. Routing, performed by software running on the Host CPU
rather than dedicated hardware, also combined to slow the system down.
6 Detailed Benchmarking Tests and Results
Page 13

Performance Numbers Under Red Hat Linux
1
2
3
4
5
6
7
8
9
10
11
12
13
14
15
16
17
18
19
20
21
22
23
24
25
26
27
28
29
30
31
32
33
34
35
36
37
38
39
40
41
42
43
44
45
46
47
48
T
T
EST
EST
#5: S
MARTBITS
1000
The fifth test used the Netcom Systems Smartbits 1000® and a network ‘sniffer’ to
generate a routing efficiency rating. The routing efficiency refers to the percentage of
packets that are correctly echoed back by the Matrox NS-FNIC/4. The test setup is
shown in Figure 4. The Smartbits generates packets which must be sent back to the
Smartbits by the Matrox NS-FNIC/4 in the server. The sniffer is used to ensure that
the statistics are valid and packets have not been corrupted in transit.
Figure 4:
Figure 4: S
Figure 4:Figure 4:
MARTBITS
1000 T
EST
- B
ENCH SETUP
2
Sniffer
SmartBits
1
2
1
Managed
Switch
1
Managed
Switch
2
NS-FNIC/4
Ports in the Server
Note: Figure 4 shows the connection for two ports. Ports 3 and 4 are connected
in the same fashion as port 1.
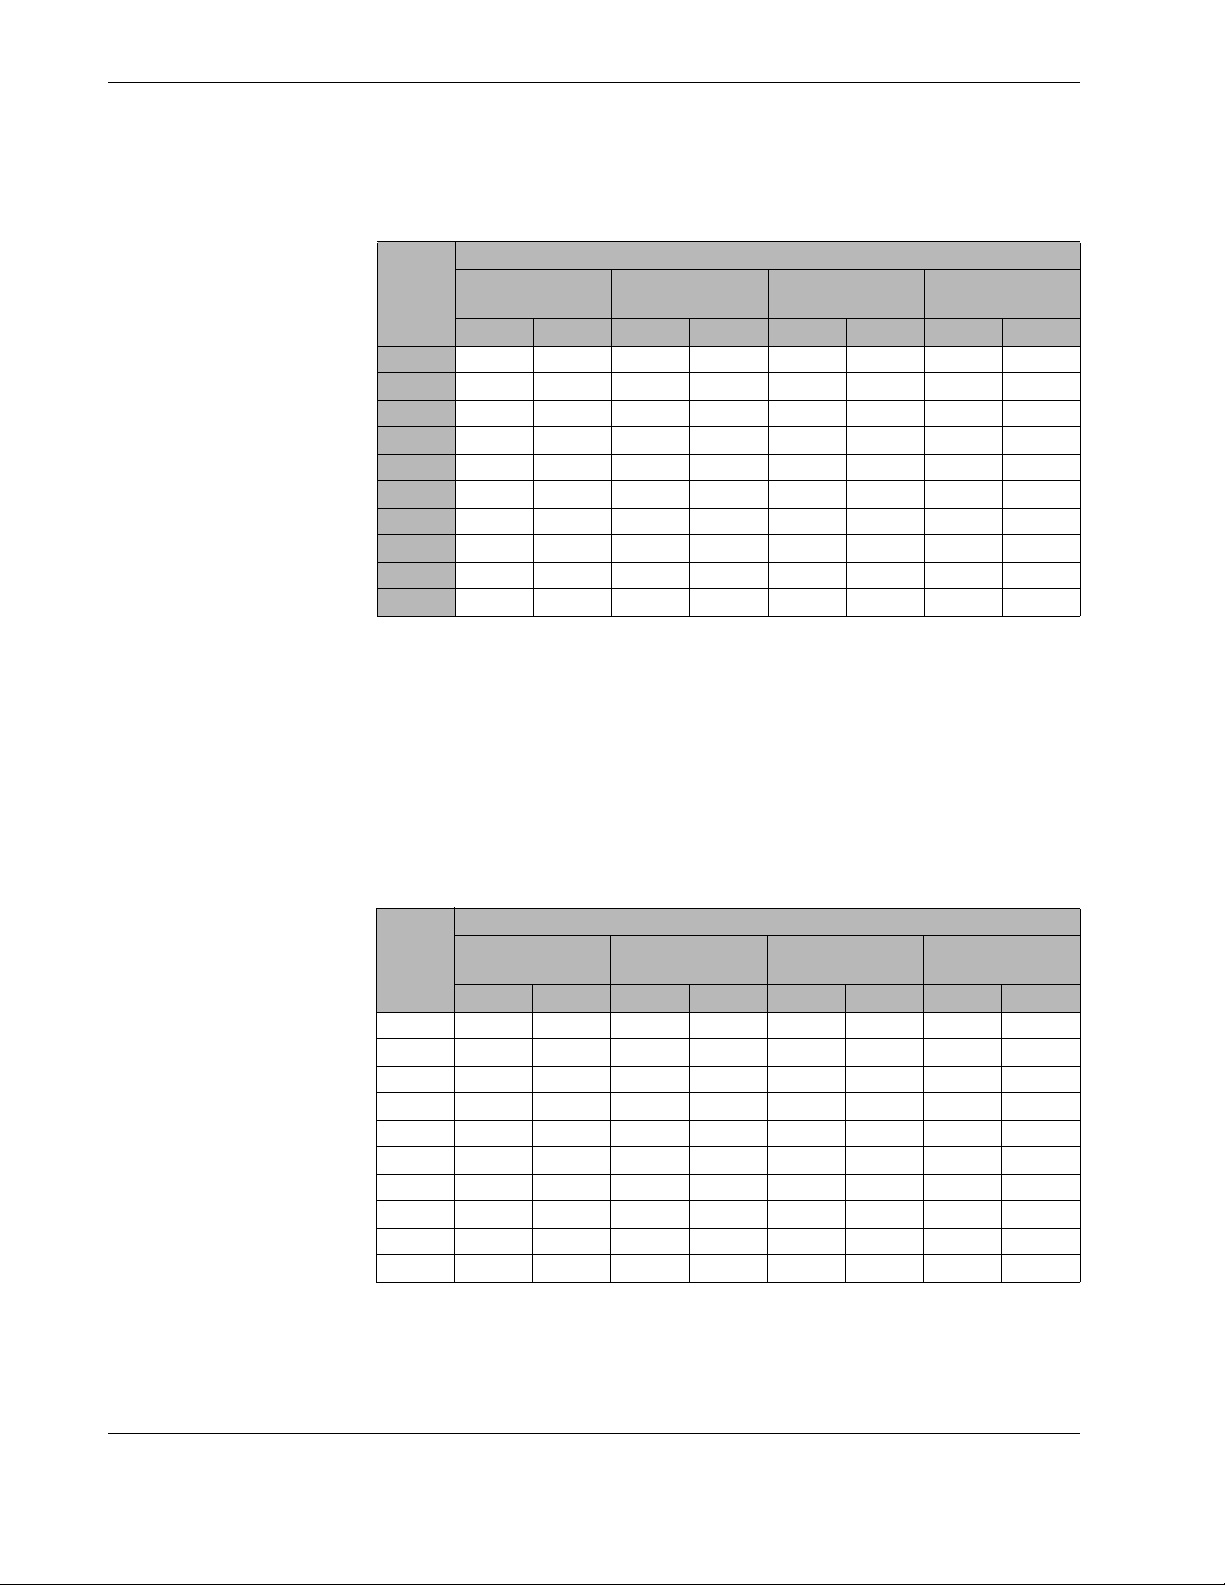
The test used a packet size of 64 bytes and the results are presented in Table 6 . The
Load column represents the percentage of the maximum throughput achievable by the
network. A load of 50%, for example, represents a theoretical bandwidth of about
50Mbits/s using 100Mbits/s modes. The results displayed in Table 6 are the efficiency
percentage computed as explained above. For the results on four ports, two rates were
computed and then the
results displayed for 4 ports are averages.
arithmetic mean
of those rates was calculated. Therefore, the
Detailed Benchmarking Tests and Results 7
Page 14
Performance Numbers Under Red Hat Linux
1
2
3
4
5
6
7
8
9
10
11
12
13
14
15
16
17
18
19
20
21
22
23
24
25
26
27
28
29
30
31
32
33
34
35
36
37
38
39
40
41
42
43
44
45
46
47
48
AAAABBBBLLLLEEEE
TTTT
Load
Load
Load Load
(%)
(%)
(%)(%)
100
100 99% 99% 99% 99% 27% 0% 26% 0%
100100
75
75 99% 99% 100% 100% 31% 0% 31% 0%
7575
50
50 100% 100% 100% 100% 99% 16% 99% 16%
5050
45
45 100% 100% 100% 100% 100% 21% 100% 22%
4545
42
42 100% 100% 100% 100% 100% 29% 100% 29%
4242
35
35 100% 100% 100% 100% 100% 44% 100% 45%
3535
25
25 100% 100% 100% 100% 100% 93% 100% 94%
2525
20
20 100% 100% 100% 100% 100% 100% 100% 100%
2020
10
10 100% 100% 100% 100% 100% 100% 100% 100%
1010
1111 100% 100% 100% 100% 100% 100% 100% 100%
10Mbits/s half
10Mbits/s half
10Mbits/s half 10Mbits/s half
2 ports
2 ports 4 ports
2 ports2 ports
MARTBITS
6:
6: S
6: 6:
duplex
duplex
duplexduplex
4 ports 2 ports
4 ports4 ports
1000 T
EST
- R
10Mbits/s full
10Mbits/s full
10Mbits/s full 10Mbits/s full
duplex
duplex
duplexduplex
2 ports 4 ports
2 ports2 ports
4 ports 2 ports
4 ports4 ports
ESULTS
(P
Mode
Mode
ModeMode
100Mbits/s half
100Mbits/s half
100Mbits/s half 100Mbits/s half
2 ports 4 ports
2 ports2 ports
ACKET SIZE OF
duplex
duplex
duplexduplex
4 ports 2 ports
4 ports4 ports
YTES
64 B
)
100Mbits/s full
100Mbits/s full
100Mbits/s full 100Mbits/s full
duplex
duplex
duplexduplex
2 ports 4 ports
2 ports2 ports
4 ports
4 ports4 ports
The 100Mbits/s results indicate that the system is not able to maintain wire-speed on
all 4 ports with small-size (64 byte) packets. This is not surprising as the small-size
packets place a heavy demand on the driver and the applications that reside above it.
However, two issues must be kept in mind. First, this limitation is not a card-limitation,
but rather a limitation of CPU power in the system. Secondly, small size packets are not
the typical case on a network. Generally, average packet size will be much closer to the
ethernet maximum size of 1500 bytes. Another test was performed with the same
setup and a packet size of 1000 bytes. The results shown below, indicating a 100%
efficiency, confirm that there are no dropped packets.
AAAABBBBLLLLEEEE
TTTT
Load
Load
Load Load
(%)
(%)
(%)(%)
2 ports
2 ports 4 ports
2 ports2 ports
100 100% 100% 100% 100% 100% 100% 100% 100%
75 100% 100% 100% 100% 100% 100% 100% 100%
50 100% 100% 100% 100% 100% 100% 100% 100%
45 100% 100% 100% 100% 100% 100% 100% 100%
42 100% 100% 100% 100% 100% 100% 100% 100%
35 100% 100% 100% 100% 100% 100% 100% 100%
25 100% 100% 100% 100% 100% 100% 100% 100%
20 100% 100% 100% 100% 100% 100% 100% 100%
10 100% 100% 100% 100% 100% 100% 100% 100%
1 100% 100% 100% 100% 100% 100% 100% 100%
MARTBITS
7:
7: S
7: 7:
10Mbits/s half
10Mbits/s half
10Mbits/s half 10Mbits/s half
duplex
duplex
duplexduplex
4 ports 2 ports
4 ports4 ports
EST
1000 T
2 ports 4 ports
2 ports2 ports
- R
10Mbits/s full
10Mbits/s full
10Mbits/s full 10Mbits/s full
duplex
duplex
duplexduplex
4 ports 2 ports
4 ports4 ports
ESULTS
Mode
Mode
ModeMode
(P
ACKET SIZE OF
100Mbits/s half
100Mbits/s half
100Mbits/s half 100Mbits/s half
duplex
duplex
duplexduplex
2 ports 4 ports
2 ports2 ports
4 ports 2 ports
4 ports4 ports
1000 B
YTES
100Mbits/s full
100Mbits/s full
100Mbits/s full 100Mbits/s full
duplex
duplex
duplexduplex
2 ports 4 ports
2 ports2 ports
)
4 ports
4 ports4 ports
The Matrox NS-FNIC/4 has trouble handling high loads of little packets but since
they are most likely to be rare, that should not be an issue.
8 Detailed Benchmarking Tests and Results
Page 15

Performance Numbers Under Red Hat Linux
1
2
3
4
5
6
7
8
9
10
11
12
13
14
15
16
17
18
19
20
21
22
23
24
25
26
27
28
29
30
31
32
33
34
35
36
37
38
39
40
41
42
43
44
45
46
47
48
T
#6: CPU
EST
U
TILIZATION
The sixth, seventh and eighth tests were meant to measure the combined throughput
of the four ports. The aggregate throughput is the sum of all individual throughputs
from these tests. Top was used to provide the resulting CPU usage for these test.
Test #6 used the same test bench setup as the original NetPerf test (see Figure 1). It
was exactly as Test # 1 , except that all the clients were active at the same time. Test # 6
was only performed in the two 100Mbits/s modes (half and full duplex). The
individual throughputs (see Ta bl e 8 ) are not very different from the results of the
previous tests.
AAAABBBBLLLLEEEE
TTTT
8:
8: CPU U
8: 8:
Port
Port
PortPort
1111 79.90 65.75
2222 82.74 65.62
3333 83.39 65.67
4444 81.90 65.57
Combined throughput
Combined throughput 327.93
Combined throughputCombined throughput
TILIZATION
100Mbits/s
100Mbits/s
100Mbits/s 100Mbits/s
full duplex
full duplex
full duplex full duplex
(Mbits/s)
(Mbits/s)
(Mbits/s)(Mbits/s)
OMBINED THROUGHPUT RESULTS
- C
100Mbits/s
100Mbits/s
100Mbits/s 100Mbits/s
half-duplex
half-duplex
half-duplexhalf-duplex
(Mbits/s)
(Mbits/s)
(Mbits/s)(Mbits/s)
327.93 262.61
327.93327.93
262.61
262.61262.61
The CPU utilization for this test can be described as follows:
• At 100Mbits/s full duplex, the individual CPU utilization by client ranges from
15% to 40% with an average of about 24.5%. This average is consistent with the
original test, which resulted in 24% CPU utilization. As for the overall CPU
utilization, it ranges from 60% to 100% with an average of 98%.
• At 100Mbits/s half duplex, the individual CPU utilization ranges from 5 to 20%
with an average of 11.25%. The overall value ranges from 20% to 55% with an
average of 45%.
Detailed Benchmarking Tests and Results 9
Page 16

Performance Numbers Under Red Hat Linux
1
T
#7: C
EST
2
T
HROUGHPUT TESTING
3
4
5
6
7
8
9
10
11
12
13
14
15
16
17
18
19
20
21
22
23
24
25
26
27
28
29
30
31
32
33
34
35
36
37
38
39
40
41
42
43
44
45
46
47
48
OMBINED
Test #7 was executed to obtain the combined throughput. It was similar to Te st #6
but switches were used to put two clients on each subnet. The final setup for this test
was as shown in Figure 3.
Figure 5:
Figure 5: C
Figure 5:Figure 5:
Linux PC with a
10/100 E thernet
card
Linux PC with a
10/100 E thernet
card
Linux PC with a
10/100 E thernet
card
Linux PC with a
10/100 E thernet
card
OMBINED THROUGHPUT TESTING
Switch
Linux PC with a
Matrox NS-FNIC/4
- C
OMBINED THROUGHPUT SETUP
Linux PC with a
10/100 E thernet
card
Switch
Linux PC with a
10/100 E thernet
card
Linux PC with a
10/100 E thernet
card
SwitchSwitch
Linux PC with a
10/100 E thernet
card
The four available 166MHz Pentiums with Linux installed were used with four
additional 100MHz Pentiums to provide the needed eight clients. In order not to
corrupt the data obtained, there was one 166MHz Pentium and one 100MHz Pentium
on each subnet. The expected individual throughput was lower than with only one
client per subnet and the overall throughput was expected to be about the same. The
expectations were confirmed by the results shown in Table 9 .
AAAABBBBLLLLEEEE
TTTT
Port
Port
PortPort
OMBINED THROUGHPUT TESTING
9:
9: C
9: 9:
100Mbits/s full duplex
100Mbits/s full duplex
100Mbits/s full duplex100Mbits/s full duplex
[100MHz/166MHz Pentium]
[100MHz/166MHz Pentium]
[100MHz/166MHz Pentium][100MHz/166MHz Pentium]
(Mbits/s)
(Mbits/s)
(Mbits/s)(Mbits/s)
OMBINED THROUGHPUT RESULTS
- C
100Mbits/s half duplex
100Mbits/s half duplex
100Mbits/s half duplex100Mbits/s half duplex
[100MHz/166MHz Pentium]
[100MHz/166MHz Pentium]
[100MHz/166MHz Pentium] [100MHz/166MHz Pentium]
(Mbits/s)
(Mbits/s)
(Mbits/s)(Mbits/s)
1111 39.25 / 40.18 37.15 / 37.56
2222 38.64 / 39.53 36.96 / 37.94
3333 38.68 / 39.06 37.18 / 37.49
4444 39.92 / 39.82 37.10 / 37.50
Combined
Combined
Combined Combined
throughput
throughput
throughputthroughput
315.08
315.08 298.88
315.08315.08
298.88
298.88298.88
Tab le 9 shows that the individual throughputs achieved are about half those measured
when only one client was present on each server port, but the combined throughput is
about the same as with only one client. At half duplex, it is 30Mbits/s higher.
10 Detailed Benchmarking Tests and Results
Page 17

Performance Numbers Under Red Hat Linux
1
2
3
4
5
6
7
8
9
10
11
12
13
14
15
16
17
18
19
20
21
22
23
24
25
26
27
28
29
30
31
32
33
34
35
36
37
38
39
40
41
42
43
44
45
46
47
48
CPU utilization for this test was as follows:
• At 100Mbits/s full duplex, individual client values ranged from 8% to 17%
averaging to 12.25%. Overall, it ranged from 64 % to 100% averaging at 98%.
There were twice as many clients as in the previous test. The same individual
average per port was obtained as in Test #7. The overall CPU Utilization per client
was halved.
• At 100Mbits/s half duplex, the CPU usage ranged from 6% to 20% averaging to
11%. Overall, it ranged from 48% to 95% averaging at 88%. In the previous case,
the opposite occurred. In Tes t # 6 , the average was 45%. Since there are now two
clients per port, both the bandwidth available and CPU Usage per client is now
halved.
Detailed Benchmarking Tests and Results 11
Page 18

Performance Numbers Under Red Hat Linux
1
2
3
4
5
6
7
8
9
10
11
12
13
14
15
16
17
18
19
20
21
22
23
24
25
26
27
28
29
30
31
32
33
34
35
36
37
38
39
40
41
42
43
44
45
46
47
48
T
C
EST
#8: T
ARDS
ESTING TWO
Test #8 used two Matrox NS-FNIC/4 cards in the server. One client was connected
to each available port. The final setup is shown on Figure 6. As for Tes t # 7 , there
were two 100Mhz Pentiums and two 166Mhz Pentiums on each Matrox NS-FNIC/4.
Figure 6:
Linux PC with a
10/100 Ethernet
card
Linux PC with a
10/100 Ethernet
card
Linux PC with a
10/100 Ethernet
card
Linux PC with a
10/100 Ethernet
card
Figure 6: T
Figure 6:Figure 6:
subnet 1
subnet
2
subnet
3
subnet 4
ESTING TWO CARDS
card 1
Linux PC with 2
Matrox NS-FNIC/4
- B
card 2
ENCH SETUP
subnet 1
subnet
2
subnet
3
subnet 4
Linux PC with a
10/100 Ethernet
card
Linux PC with a
10/100 Ethernet
card
Linux PC with a
10/100 Ethernet
card
Linux PC with a
10/100 Ethernet
card
Since having eight ports active simultaneously is very demanding on the server, the
expected results of this test were a little lower than the two previous tests. The
combined throughputs were expected to be near the ones obtained for those same
tests. The expected results were met, as shown in Ta ble 1 0.
AAAABBBBLLLLEEEE
TTTT
Port
Port
PortPort
ESTING TWO CARDS
10:
10: T
10: 10:
OMBINED THROUGHPUT TEST
- C
100Mbits/s full duplex
100Mbits/s full duplex
100Mbits/s full duplex 100Mbits/s full duplex
(Mbits/s)
(Mbits/s)
(Mbits/s)(Mbits/s)
100Mbits/s half duplex
100Mbits/s half duplex
100Mbits/s half duplex100Mbits/s half duplex
(Mbits/s)
(Mbits/s)
(Mbits/s)(Mbits/s)
1111 34.44 39.88
2222 35.12 39.40
3333 34.23 39.82
4444 35.00 39.65
5555 34.52 36.42
6666 34.67 39.43
7777 34.84 39.73
8888 53.98 46.23
Combined throughput
Combined throughput 296.80
Combined throughputCombined throughput
296.80 320.56
296.80296.80
320.56
320.56320.56
The CPU utilization for this test can be described as follows:
• At 100Mbits/s full duplex, each port ranged from 9% to 15% averaging at 12.38%
and overall, it ranged from 72% to 100% averaging at 99%.
• At 100Mbits/s half duplex, the CPU usage for each client ranged from 8% to 15%
averaging at 12.38% and overall, it ranged from 64% to 100 % averaging at 99%.
The combined throughput result shows that even with eight ports active at the same
time, the Matrox NS-FNIC/4 is able to deliver around 300Mbits/s shared almost
equally between its ports.
12 Detailed Benchmarking Tests and Results
Page 19

Performance Numbers Under Red Hat Linux
1
2
3
4
5
6
7
8
9
10
11
12
13
14
15
16
17
18
19
20
21
22
23
24
25
26
27
28
29
30
31
32
33
34
35
36
37
38
39
40
41
42
43
44
45
46
47
48
C
ONCLUSION
In conclusion, the Matrox NS-FNIC/4 is able to deliver at least 88Mbits/s per port at
100Mbits/s full duplex, which means a combined throughput of at least 300Mbits/s.
It can also deliver 60Mbits/s per port at 100Mbits/s half duplex, which means a
combined throughput of at least 240Mbits/s.
It attains similar performance even when used as part of a routing configuration in a
fast machine, giving the Matrox NS-FNIC/4 added value.
In congested networks, the Matrox NS-FNIC/4 in the server splits the network into
four smaller subnets without sacrificing bandwidth. Refer to the Matrox NS-FNIC/4
Case Study #1, available on the Matrox Networks web site, for more information.
Conclusion 13
Page 20

Performance Numbers Under Red Hat Linux
1
2
3
4
5
6
7
8
9
10
11
12
13
14
15
16
17
18
19
20
21
22
23
24
25
26
27
28
29
30
31
32
33
34
35
36
37
38
39
40
41
42
43
44
45
46
47
48
14 Conclusion
 Loading...