

Page 1

User Guide
Managed Switch
LGS5XX
1
Page 2

Contents
Chapter 1 - Getting Started ............................................................................... 6
Configuring the Console Port .............................................................................................................. 6
Interface Naming Conventions ........................................................................................................... 8
Window Navigation.................................................................................................................................. 9
Chapter 2 - System Status .............................................................................. 11
System Summary ................................................................................................................................. 11
RMON ........................................................................................................................................................ 12
Interface Statistics .............................................................................................................................. 20
Chapter 3 - Quick Start ..................................................................................... 23
Chapter 4 - System Management .................................................................. 24
System Information ............................................................................................................................. 24
TCAM Resources .................................................................................................................................. 25
Management Session Timeout ........................................................................................................ 27
Time ........................................................................................................................................................... 28
SNMP ........................................................................................................................................................ 36
Logs ........................................................................................................................................................... 58
Chapter 5 - Port Management ........................................................................ 63
Ports .......................................................................................................................................................... 63
Chapter 6 - VLAN Management ...................................................................100
Overview ............................................................................................................................................... 100
VLANs .................................................................................................................................................... 102
Interfaces ............................................................................................................................................. 106
VLAN Memberships .......................................................................................................................... 110
GVRP ...................................................................................................................................................... 112
VLAN Groups....................................................................................................................................... 113
2
Page 3

Voice VLAN .......................................................................................................................................... 118
Chapter 7 - Spanning Tree .............................................................................123
Overview ............................................................................................................................................... 123
Spanning Tree ..................................................................................................................................... 124
STP Interfaces .................................................................................................................................... 126
RSTP Interfaces ................................................................................................................................. 127
MSTP Properties ................................................................................................................................ 130
VLAN to MSTP .................................................................................................................................... 130
MSTP Instance Status ..................................................................................................................... 133
MSTP Instance Interface ................................................................................................................ 134
Chapter 8 - MAC Address Management ...................................................138
Dynamic MAC Addresses ............................................................................................................... 139
Static MAC Addresses .................................................................................................................... 140
Reserved MAC Addresses ............................................................................................................. 141
Chapter 9 - Multicast .......................................................................................143
Overview ............................................................................................................................................... 143
Feature Configuration ..................................................................................................................... 145
IGMP/MLD Snooping ........................................................................................................................ 147
IGMP Snooping ................................................................................................................................... 149
MLD Snooping .................................................................................................................................... 151
Multicast Router Ports .................................................................................................................... 152
Forward All ........................................................................................................................................... 153
Unregistered Multicast ................................................................................................................... 155
IGMP/MLD IP Group Addresses ................................................................................................... 156
MAC Group Address FDB ............................................................................................................... 158
IP Group Address FDB ..................................................................................................................... 161
Chapter 10 - IP Interface ................................................................................163
IPv4 ......................................................................................................................................................... 163
IPv6 ......................................................................................................................................................... 172
3
Page 4

Chapter 11 - IP Network Operations ..........................................................185
Domain Name System ...................................................................................................................... 185
DHCP ...................................................................................................................................................... 187
IP Source Guard ................................................................................................................................. 197
DHCP Snooping Binding Database ............................................................................................. 205
ARP Inspection ................................................................................................................................... 208
Interface Settings ............................................................................................................................. 213
Chapter 12 - Security ......................................................................................214
Management Security ..................................................................................................................... 214
RADIUS ................................................................................................................................................. 222
Network Access Control ................................................................................................................. 227
Port Security ....................................................................................................................................... 239
Storm Control ..................................................................................................................................... 241
Chapter 13 - Access Control List ................................................................243
Access Control Lists ........................................................................................................................ 243
MAC-Based ACL/ACE ...................................................................................................................... 245
IPv4-Based ACL/ACE ...................................................................................................................... 247
IPv6-Based ACL/ACE ...................................................................................................................... 250
ACL Binding ......................................................................................................................................... 252
Chapter 14 - Quality of Service ....................................................................254
Overview ............................................................................................................................................... 254
Feature Configuration ..................................................................................................................... 257
Queue Scheduling ............................................................................................................................. 258
CoS/802.1p to Queue ..................................................................................................................... 260
DSCP to Queue................................................................................................................................... 262
Bandwidth Control ............................................................................................................................ 263
Egress Shaping .................................................................................................................................. 265
Basic QoS ............................................................................................................................................. 266
Advanced QoS .................................................................................................................................... 267
QoS Statistics .................................................................................................................................... 279
4
Page 5

Chapter 15 – Maintenance .............................................................................281
Device Models..................................................................................................................................... 281
System Mode & Reboot ................................................................................................................... 282
File Management ............................................................................................................................... 283
Diagnostics .......................................................................................................................................... 294
Chapter 16 - Support .......................................................................................301
Appendix ...............................................................................................................302
Startup Menu Procedures .............................................................................................................. 302
5
Page 6

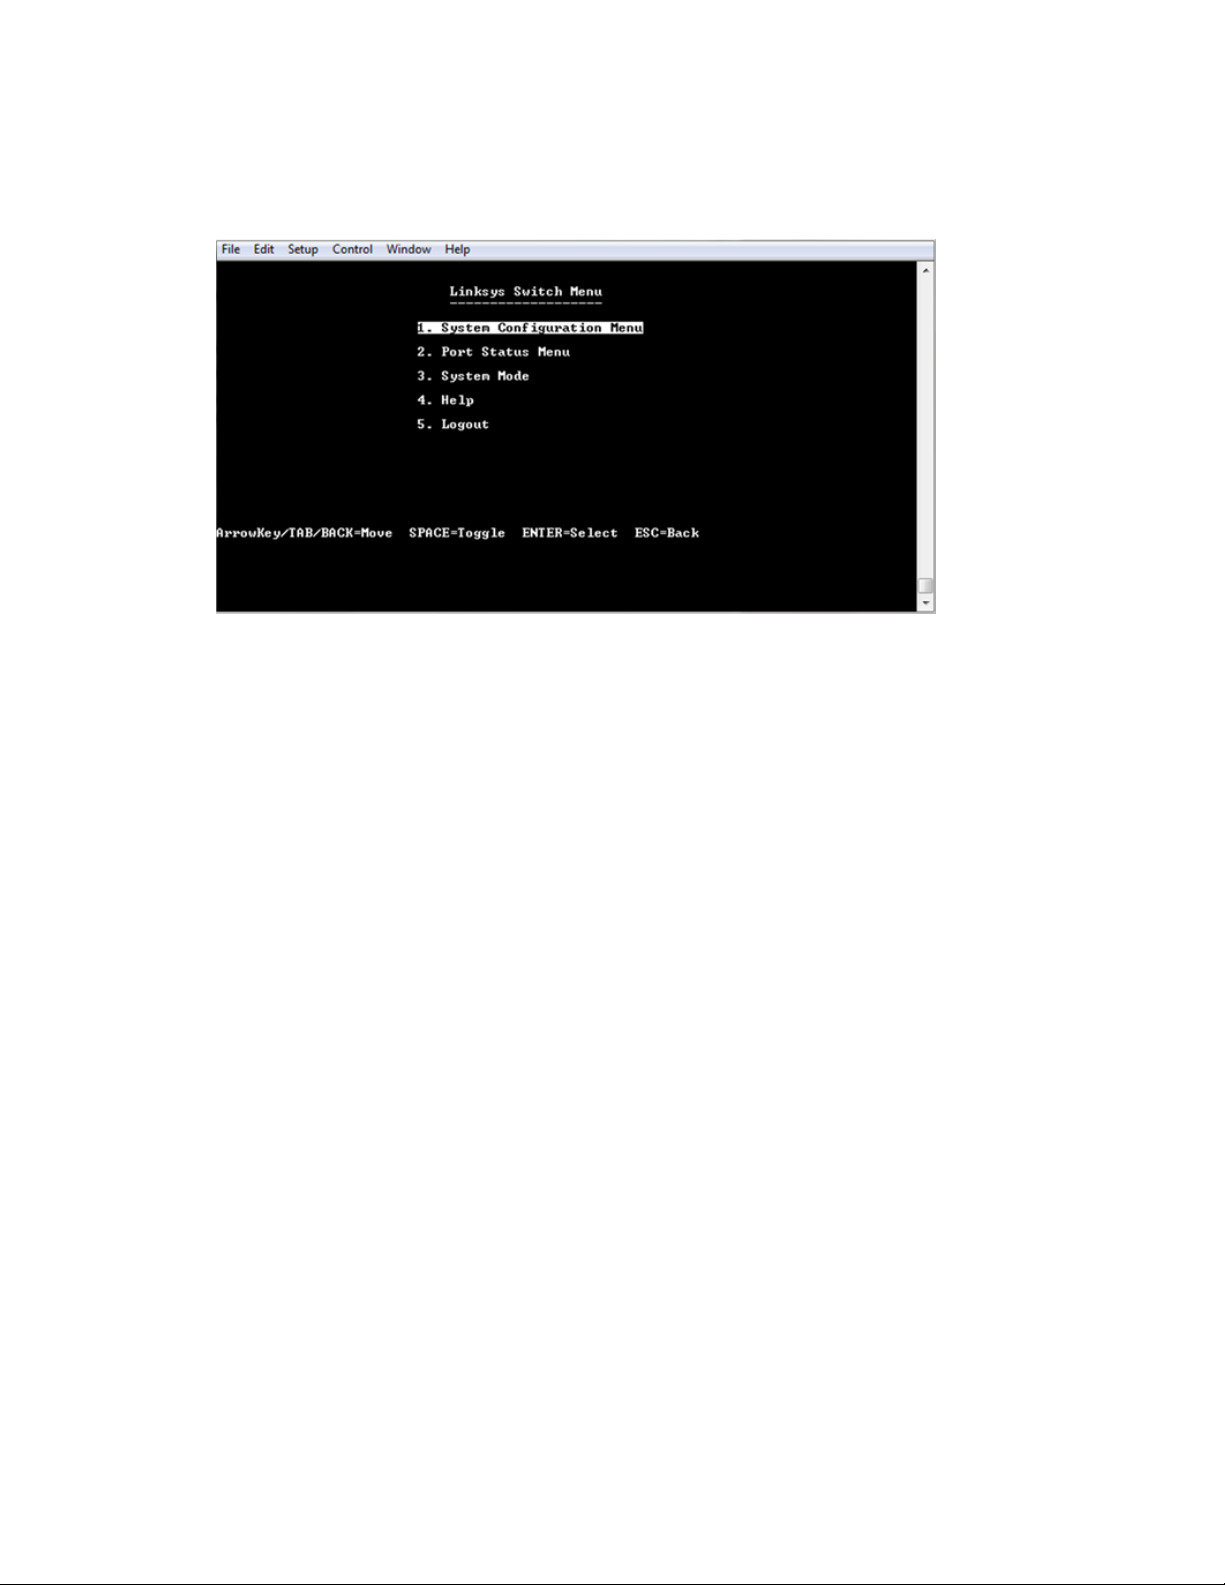
Chapter 1 - Getting Started
This section provides an introduction to the Web-based configuration utility, and covers the
following topics:
•
Configuring with the Console Port
•
Launching the Configuration Utility
•
Interface Naming Conventions
•
Window Navigation
Configuring the Console Port
To configure with the Console Port:
1. Use a provided serial cable to connect to console port
2. Start a terminal application such as Hyper Terminal on your computer
3. Configure the utility with 11520 bit per second, 8 data bits, no parity, 1 stop bit and no
flow control. (The firmware supports autobaud detection, the device will detect the speed
after pressing Enter.)
4. Type in default user name: admin, and password: admin
5. Enter to access menu CLI
The following menu is displayed:
6
Page 7
1. Enter your user name and password.
The main menu is displayed:
2. Continue configuring the device.
3. Click Logout to log out of the CLI menu.
Launching the Configuration Utility
This section describes how to navigate the Web-based switch configuration utility. If you are
using a pop-up blocker, make sure it is disabled.
The following browsers are supported:
•
Firefox (versions 16 and latest)
•
IE version (versions 9, 10)
•
Chrome (version 35 and latest)
Note—If you are using IPv6 interfaces on your management station, use the IPv6 global address
and not the IPv6 link local address to access the device from your browser.
To open the Web-based configuration utility:
1. Open a Web browser.
2. Enter the IP address of the device you are configuring in the address bar on the browser,
and then press Enter.
7
Page 8

Note—When the device is using the factory default IP address of
192.168.1.
251, its power
LED flashes
administrator-configured
To log in:
The default username is admin and the default password is admin.
1. Open the GUI. The Login page is displayed.
2. Enter the username/password. The password can contain up to 64 ASCII characters.
To log out:
By default, the application logs out after ten minutes of inactivity.
CAUTION
Unless the Running Configuration is copied to the Startup Configuration, rebooting the
device will remove all changes made since the last time the file was saved. Save the
Running Configuration to the Startup Configuration before logging off to preserve any
changes you made during this session.
When you click Quick Start > Save Your Configurations, the Configuration File Copy page appears.
Save the Running Configuration file by copying it to the Startup Configuration file.
continuously.
When the device is using a DHCP assigned IP address or an
static IP address, the power LED is on solid.
To log out, click Logout in the top right corner of any page. The system logs out of the device.
When a timeout occurs or you intentionally log out of the system, a message appears and the Login
page appears, with a message indicating the logged-out state.
Interface Naming Conventions
Within the GUI, interfaces are denoted by linking the following elements:
•
Interface Number: Port, LAG or VLAN ID
8
Page 9

Window Navigation
artup Configuration file type on the device.
This section describes the features of the Web-based switch configuration utility.
Application Header
The Application Header appears on every page. It provides the following application links:
Application Link Name Description
Logout Click to log out of the Web-based switch configuration utility.
Firmware Version Display the device version number.
Help Click for the link to this administration guide.
Management Buttons
The following table describes the commonly used buttons that appear on various pages in the
system.
Button Name Description
Add Click to display the related Add page and add an entry to a table.
Enter the information and click Apply to save it to the Running
Configuration. Click Close to return to the main page. Click Save
to display the Configuration File Copy page and save the Running
Configuration to the St
9
Page 10

Apply Click to apply changes to the Running Configuration on the
device. If the device is rebooted, the Running Configuration is lost
unless it is saved to the Startup Configuration file type or another
are cleared.
Clear All
Click to clear the statistic counters for all interfaces.
all interface, or log files.
entry and click Edit. The Edit page appears, and the
are displayed on the page.
Refresh
Click Refresh to refresh the counter values.
Test or Start
Click Test to perform the related tests.
selected or for all entries (respectively).
file type. Click Save to display the Configuration File Copy page
and save the Running Configuration to the Startup Configuration
file type on the device.
Button Name Description
Close Click to return to the previous page. Any changes not applied
Clear Click to clear information, such a counters of an interface or
Delete After selecting an entry in the table, click Delete to remove.
Edit Select the
entry can be modified.
1. Click Apply to save the changes to the Running
Configuration.
2. Click Close to return to the main page.
Search Enter the query filtering criteria and click Search. The results
View or View All Click View to display details associated with the entry
10
Page 11
Chapter 2 - System Status
This section describes how to view device statistics. It covers the following topics:
•
•
•
System Summary
System Summary
RMON
Interface Statistics
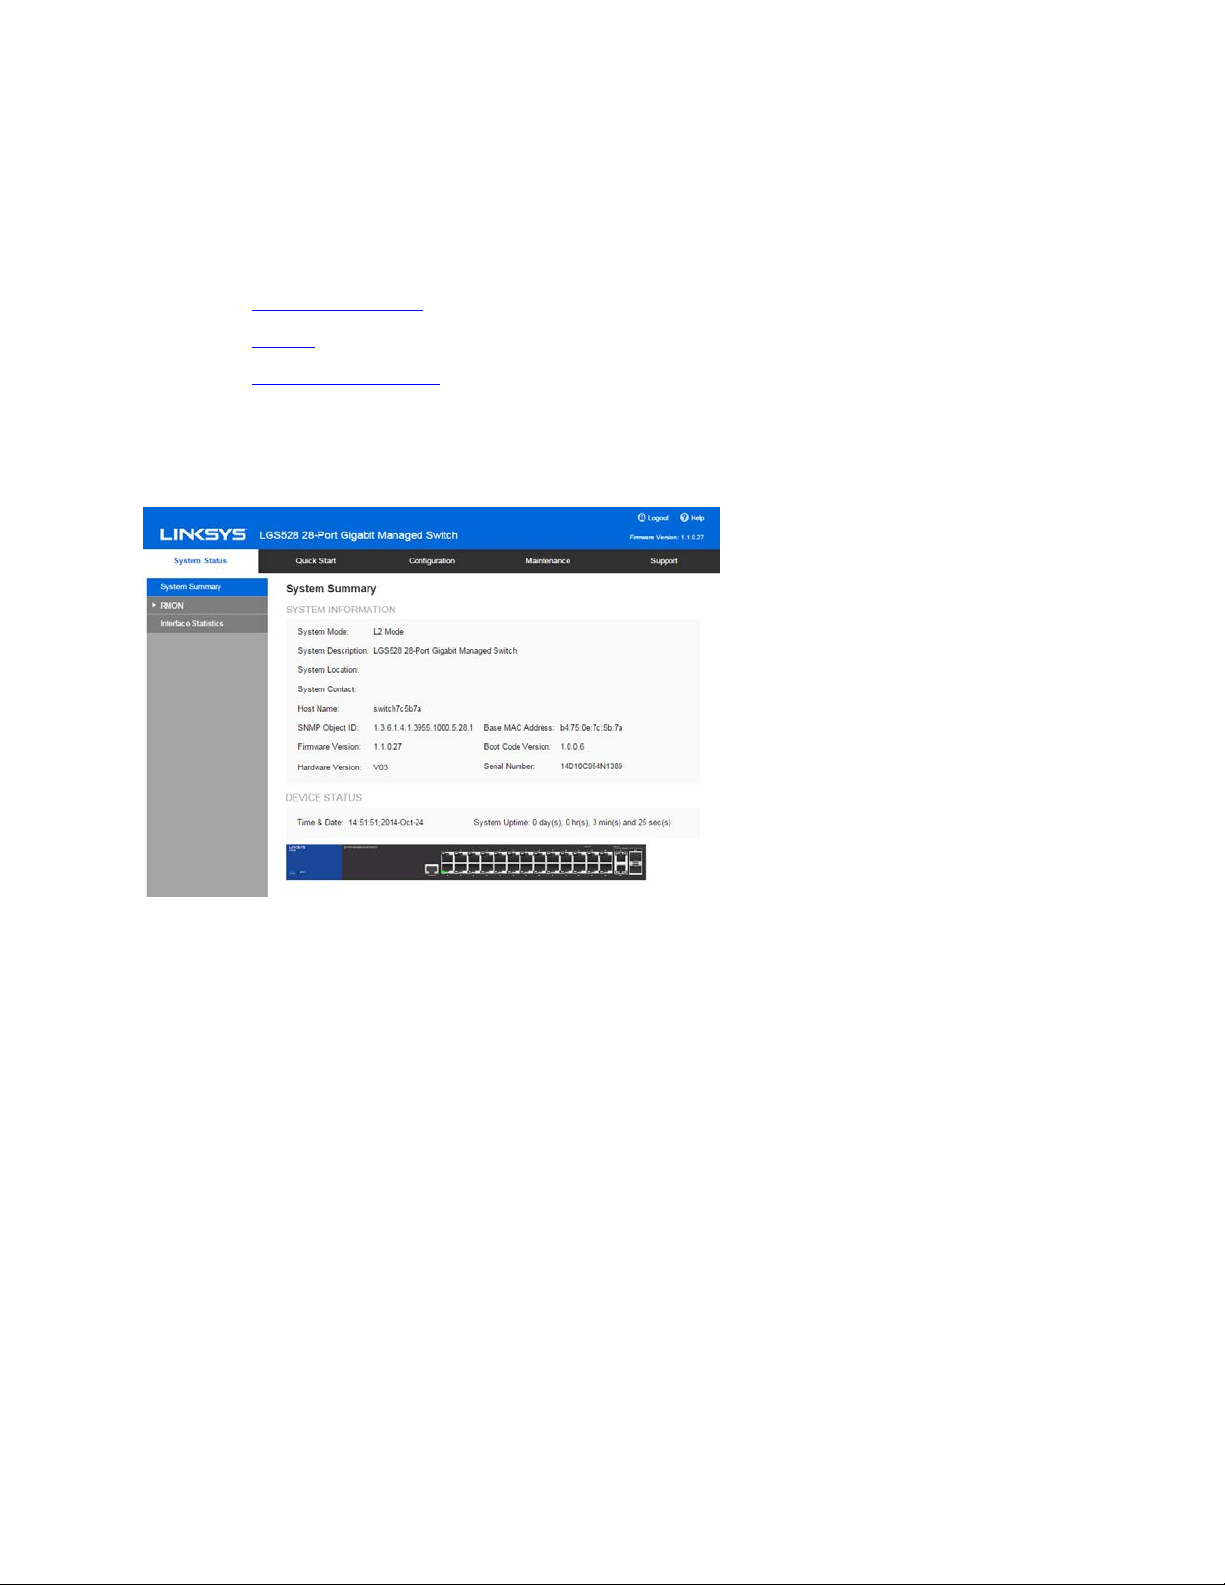
The System Summary page provides a graphic view of the device, and displays device status,
hardware information, firmware version information, general PoE status, and other items.
To view system information, click System Status > System Summary. The System Summary page
contains system and hardware information.
•
System Mode------Specifies whether the system is operating in Layer 2 or Layer 3 system
mode.
•
System Description------ A description of the system.
•
System Location------Physical location of the device. Click Edit to go the System Information
page to enter this value.
•
System Contact------Name of a contact person. Click Edit to go the System Information
page to enter this value.
11
Page 12

•
Host Name------Name of the device. By default, the device host name is composed of the
name of the switch followed by the final six digits in the device’s MAC address.
•
Base MAC Address------Device MAC address.
•
SNMP Object ID------ The unique vendor identification of the network management
subsystem assigned by Internet Assigned Numbers Authority
•
Firmware Version------ Firmware version number.
•
Boot Code Version------Boot version number.
•
Hardware Version ------Hardware version number of the device.
•
Serial Number------ Serial number.
•
Device Status
•
Fan Status------ Applicable only to models that have fans. The following values are possible:
-
-
•
Date & Time------ System date and time.
•
System Uptime------ Length of time since last reboot.
OK------ Fan is operating normally.
Fail------Fan is not operating correctly.
RMON
Statistics
The Statistics page displays detailed information regarding packet sizes and information
regarding physical layer errors. The information displayed is according to the RMON (Remote
Network Monitoring) standard. An oversized packet is defined as an Ethernet frame with the
following criteria:
•
Packet length is greater than MRU byte size.
•
Collision event has not been detected.
•
Late collision event has not been detected.
•
Received (Rx) error event has not been detected.
• Packet has a valid CRC.
12
Page 13

To view RMON statistics and/or set the refresh rate:
1. Click System Status > RMON > Statistics.
2. Select the Interface for which statistics are to be displayed.
3. Select the Refresh Rate, the time period that passes before the interface statistics are
refreshed.
The statistics are displayed for the selected interface.
•
Bytes Received------ Number of octets received, including bad packets and
FCS octets, but excluding framing bits.
•
Drop Events------Number of packets dropped.
•
Packets Received------ Number of good packets received, including Multicast and
Broadcast packets.
•
Broadcast Packets Received------Number of good Broadcast packets received. This
number does not include Multicast packets.
•
Multicast Packets Received------Number of good Multicast packets received.
•
CRC & Align Errors------ Number of CRC and Align errors that have occurred.
13
Page 14

•
Undersize Packets------Number of undersized packets (less than 64 octets) received.
•
Oversize Packets------Number of oversized packets (over 2000 octets) received.
•
Fragments------Number of fragments (packets with less than 64 octets, excluding
framing bits, but including Frame Check Sequence octets) received.
•
Jabbers------ Total number received packets that were longer than 1632 octets. This
number excludes frame bits, but includes FCS octets that had either a bad FCS
with an integral number of octets (FCS Error) or a bad FCS with a non-integral
octet (Alignment Error) number.
A jabber packet is defined as an Ethernet frame that satisfies the following
criteria:
-
Packet data length is greater than MRU.
-
Packet has an invalid CRC.
-
Received (Rx) Error Event has not been detected.
• Collisions------Number of collisions received. If Jumbo Frames are enabled, the
threshold of Jabber Frames is raised to the maximum size of Jumbo Frames.
• Frames of 64 Bytes------Number of frames, containing 64 bytes that were
received.
• Frames of 65 to 127 Bytes------Number of frames, containing 65-127 bytes that
were received.
• Frames of 128 to 255 Bytes------Number of frames, containing 128-255 bytes
that were received.
• Frames of 256 to 511 Bytes------Number of frames, containing 256-511 bytes
that were received.
• Frames of 512 to 1023 Bytes------Number of frames, containing 512-1023
bytes that were received.
• Packets of 1024 and More Bytes------ Number of frames, containing 1024-2000
bytes, and Jumbo Frames, that were received.
To clear or view statistics counters:
•
Click Refresh to refresh the counters on the page.
•
Click Clear to clear the selected interfaces counters.
•
Click View All to see all ports on a single page.
14
Page 15

RMON History
The RMON feature enables monitoring statistics per interface.
The History Control Table page defines the sampling frequency, amount of samples to store and
the port from which to gather the data.
After the data is sampled and stored, it appears in the History Table page that can be viewed by
clicking the History button.
To enter RMON control information:
1. Click System Status > RMON > History.
2. Click Add.
3. Enter the parameters.
•
New History Control Entry Index ------Displays the number of the new History table
entry.
•
Source Interface------Select the type of interface from which the history samples are
to be taken.
•
Maximum Samples------ Enter the number of samples to store.
•
Samples Collected------RMON is allowed by the standard to not grant all requested
samples, but rather to limit the number of samples per request. Therefore, this
field represents the sample number actually granted to the request that is equal or
less than the requested maximum sample.
•
Sampling Interval------ Enter the time in seconds that samples are collected from the
ports. The field range is 1-3600.
•
Owner------Enter the RMON station or user that requested the RMON information.
4. Click Apply. The entry is added to the History Control Table page, and the Running
Configuration file is updated.
15
Page 16

5. Click the History button (described below) to view the actual statistics.
RMON History Table
The History Table page displays interface-specific statistical network samplings. The
samples were configured in the History Control table described above.
To view RMON history statistics:
1. Click System Status > RMON > History.
2. Click History.
3. From the History Control Entry Index drop-down menu, select the entry number of the
sample to display.
The fields are displayed for the selected sample.
•
Owner------History table entry owner.
•
Sample Index------ Statistics were taken from this sample.
•
Drop Events------Dropped packets due to lack of network resources during the
sampling interval. This may not represent the exact number of dropped
packets, but rather the number of times dropped packets were detected.
•
Bytes Received------ Octets received including bad packets and FCS octets, but
excluding framing bits.
•
Packets Received------ Packets received, including bad packets, Multicast, and
Broadcast packets.
•
Broadcast Packets------Good Broadcast packets excluding Multicast packets.
•
Multicast Packets------Good Multicast packets received.
•
CRC Align Errors------CRC and Align errors that have occurred.
•
Undersize Packets------Undersized packets (less than 64 octets) received.
•
Oversize Packets------Oversized packets (over 2000 octets) received.
•
Fragments------Fragments (packets with less than 64 octets) received, excluding
framing bits, but including FCS octets.
•
Jabbers------ Total number of received packets that were longer than 2000
octets. This number excludes frame bits, but includes FCS octets that had
either a bad FCS (Frame Check Sequence) with an integral number of octets
(FCS Error) or a bad FCS with a non-integral octet (Alignment Error) number.
•
Collisions------ Collisions received.
16
Page 17
•
Utilization------ Percentage of current interface traffic compared to maximum
traffic that the interface can handle.
RMON Events
You can control the occurrences that trigger an alarm and the type of notification that occurs.
•
Events Page------Configures what happens when an alarm is triggered. This can be any
combination of logs and traps.
•
Alarms Page------ Configures the occurrences that trigger an alarm.
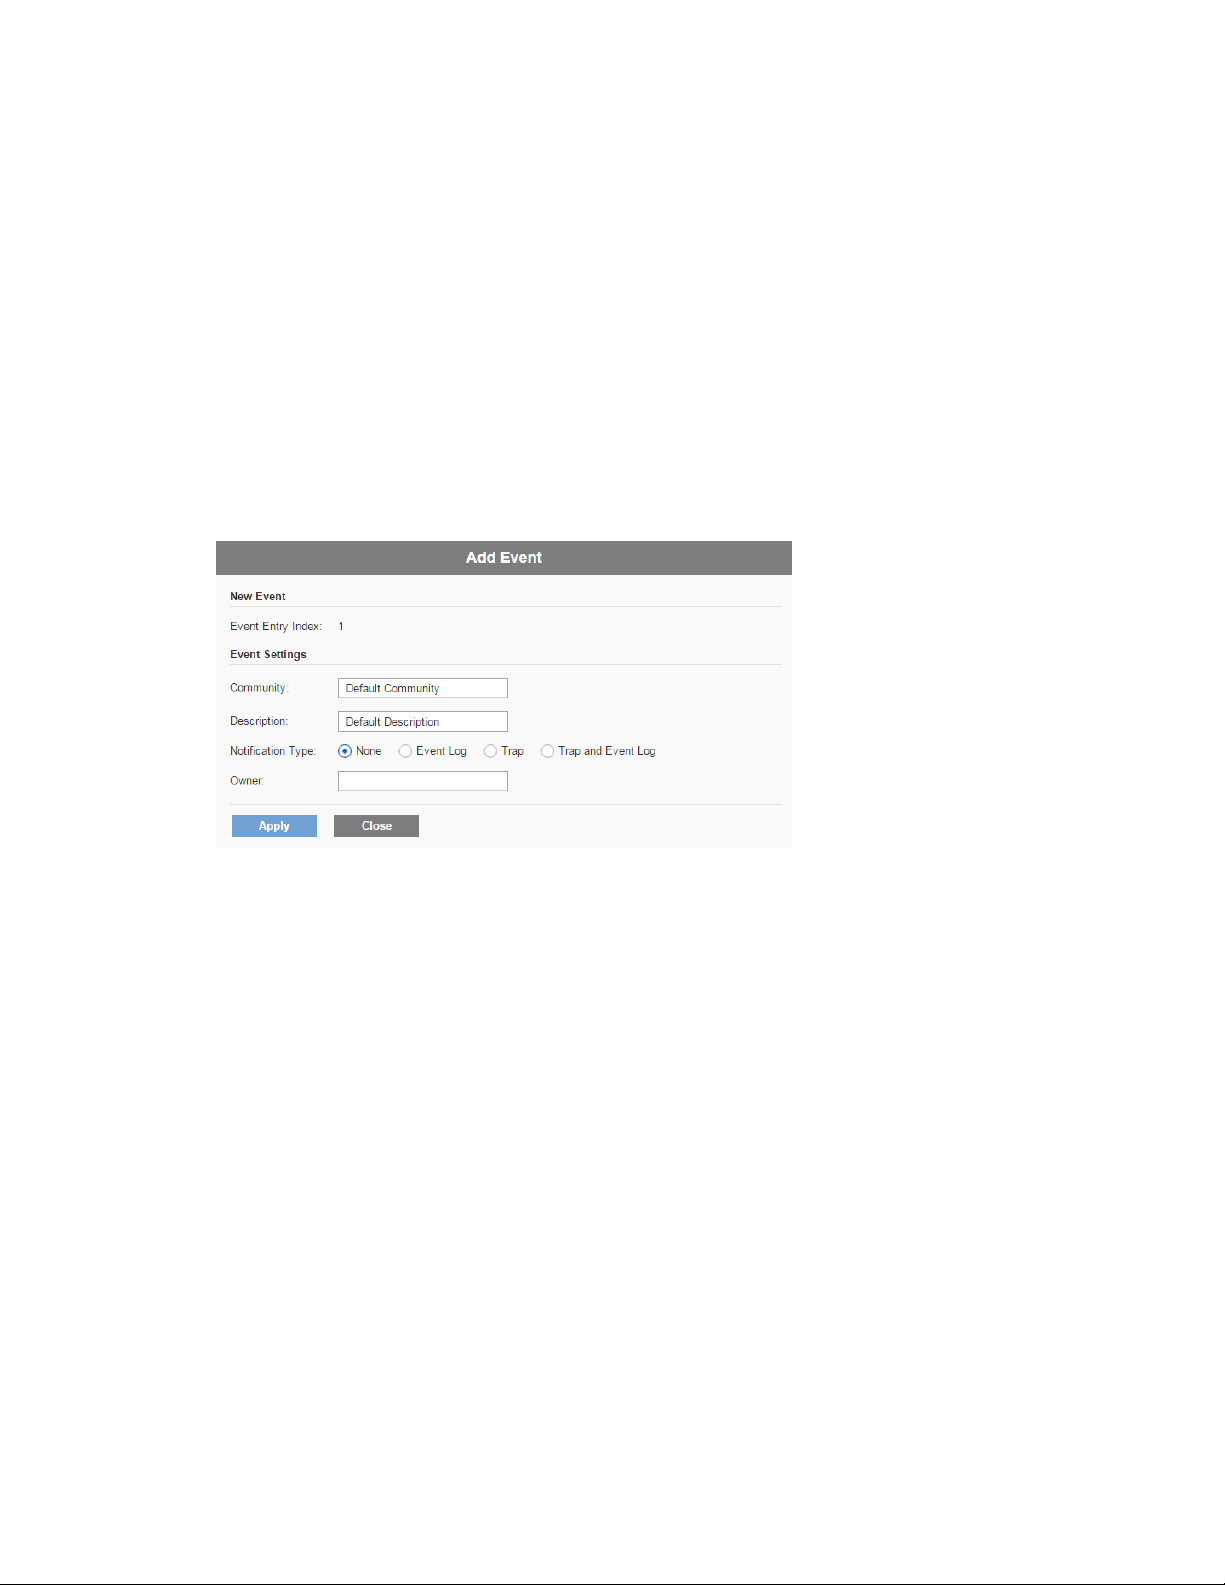
To define RMON events:
1. Click System Status > RMON > Events. This page displays previously defined events.
2. Click Add.
3. Enter the parameters.
•
Event Entry Index ------ Displays the event entry index number for the new entry.
•
Community------ Enter the SNMP community string to be included when traps are
sent (optional). Note that the community must be defined using the Defining
SNMPv1,2 Notification Recipients or Defining SNMPv3 Notification Recipients
pages for the trap to reach the Network Management Station.
•
Description------Enter a name for the event. This name is used in the Add RMON
Alarm page to attach an alarm to an event.
•
Notification Type------ Select the type of action that results from this event.
-
-
None------No action occurs when the alarm goes off.
Event Log (Event Log Table)------ Add a log entry to the Event Log table when
the alarm is triggered.
17
Page 18

-
Trap (SNMP Manager and SYSLOG Server)------ Send a trap to the remote log
server when the alarm goes off.
-
Trap and Event Log------ Add a log entry to the Event Log table and send a
trap to the remote log server when the alarm goes off.
•
Last Event Time------Displays the time of the event. (This is a read-only table in the
parent window and cannot be defined).
•
Owner------Enter the device or user that defined the event.
4. Click Apply. The RMON event is saved to the Running Configuration file.
5. Click Event Log to display the log of alarms that have occurred and that have been logged
(see description below).
RMON Events Logs
The Event Log Table page displays the log of events (actions) that occurred. Two types of
events can be logged: Log or Log and Trap. The action in the event is performed when the
event is bound to an alarm (see the Alarms page) and the conditions of the alarm have
occurred.
1. Click System Status > RMON > Events.
2. Click Event Log.
This page displays the following fields:
•
Event Entry Index ------ Event’s log entry number.
•
Log No.------ Log number (within the event).
•
Log Time------Time that the log entry was entered.
•
Description------Description of event that triggered the alarm.
RMON Alarms
RMON alarms provide a mechanism for setting thresholds and sampling intervals to generate
exception events on counters or any other SNMP object counter maintained by the agent. Both
the rising and falling thresholds must be configured in the alarm. After a rising threshold is
crossed, no rising events are generated until the companion falling threshold is crossed. After a
falling alarm is issued, the next alarm is issued when a rising threshold is crossed.
One or more alarms are bound to an event, which indicates the action to be taken when the alarm
occurs.
Alarm counters can be monitored by either absolute values or changes (delta) in the counter
values.
18
Page 19

To enter RMON alarms:
1. Click System Status > RMON > Alarms. All previously-defined alarms are displayed. The
fields are described in the Add RMON Alarm page below.
In addition to those fields, the following field appears:
•
Counter Value------ Displays the value of the statistic during the last sampling period.
2. Click Add.
3. Enter the parameters.
•
Alarm Entry Index------Displays the alarm entry number.
•
Interface------Select the type of interface for which RMON statistics are displayed.
•
Counter Name------ Select the MIB variable that indicates the type of occurrence
measured.
•
Sample Type------Select the sampling method to generate an alarm.
The options:
-
Absolute------ If the threshold is crossed, an alarm is generated.
-
Delta------Subtracts the last sampled value from the current value. The
difference in the values is compared to the threshold. If the threshold was
crossed, an alarm is generated.
•
Interval------ Enter the alarm interval time in seconds.
19
Page 20

•
Startup Alarm------Select the first event from which to start generation of alarms.
Rising is defined by crossing the threshold from a low-value threshold to a highervalue threshold.
-
Rising Alarm------ A rising value triggers the rising threshold alarm.
-
Falling Alarm------A falling value triggers the falling threshold alarm.
-
Rising and Falling Alarm------Both rising and falling values trigger the alarm.
•
Owner------Enter the name of the user or network management system that receives
the alarm.
•
Rising Threshold------Enter the value that triggers the rising threshold alarm.
•
Rising Event------Select an event to be performed when a rising event is triggered.
Events are created in the Events page.
•
Falling Threshold------Enter the value that triggers the falling threshold alarm.
•
Falling Event------ Select an event to be performed when a falling event is triggered.
4. Click Apply. The RMON alarm is saved to the Running Configuration file.
Interface Statistics
The Interface Statistics page displays traffic statistics per port. The refresh rate of the
information can be selected.
This page is useful for analyzing the amount of traffic that is both sent and received and its
dispersion (Unicast, Multicast, and Broadcast).
20
Page 21
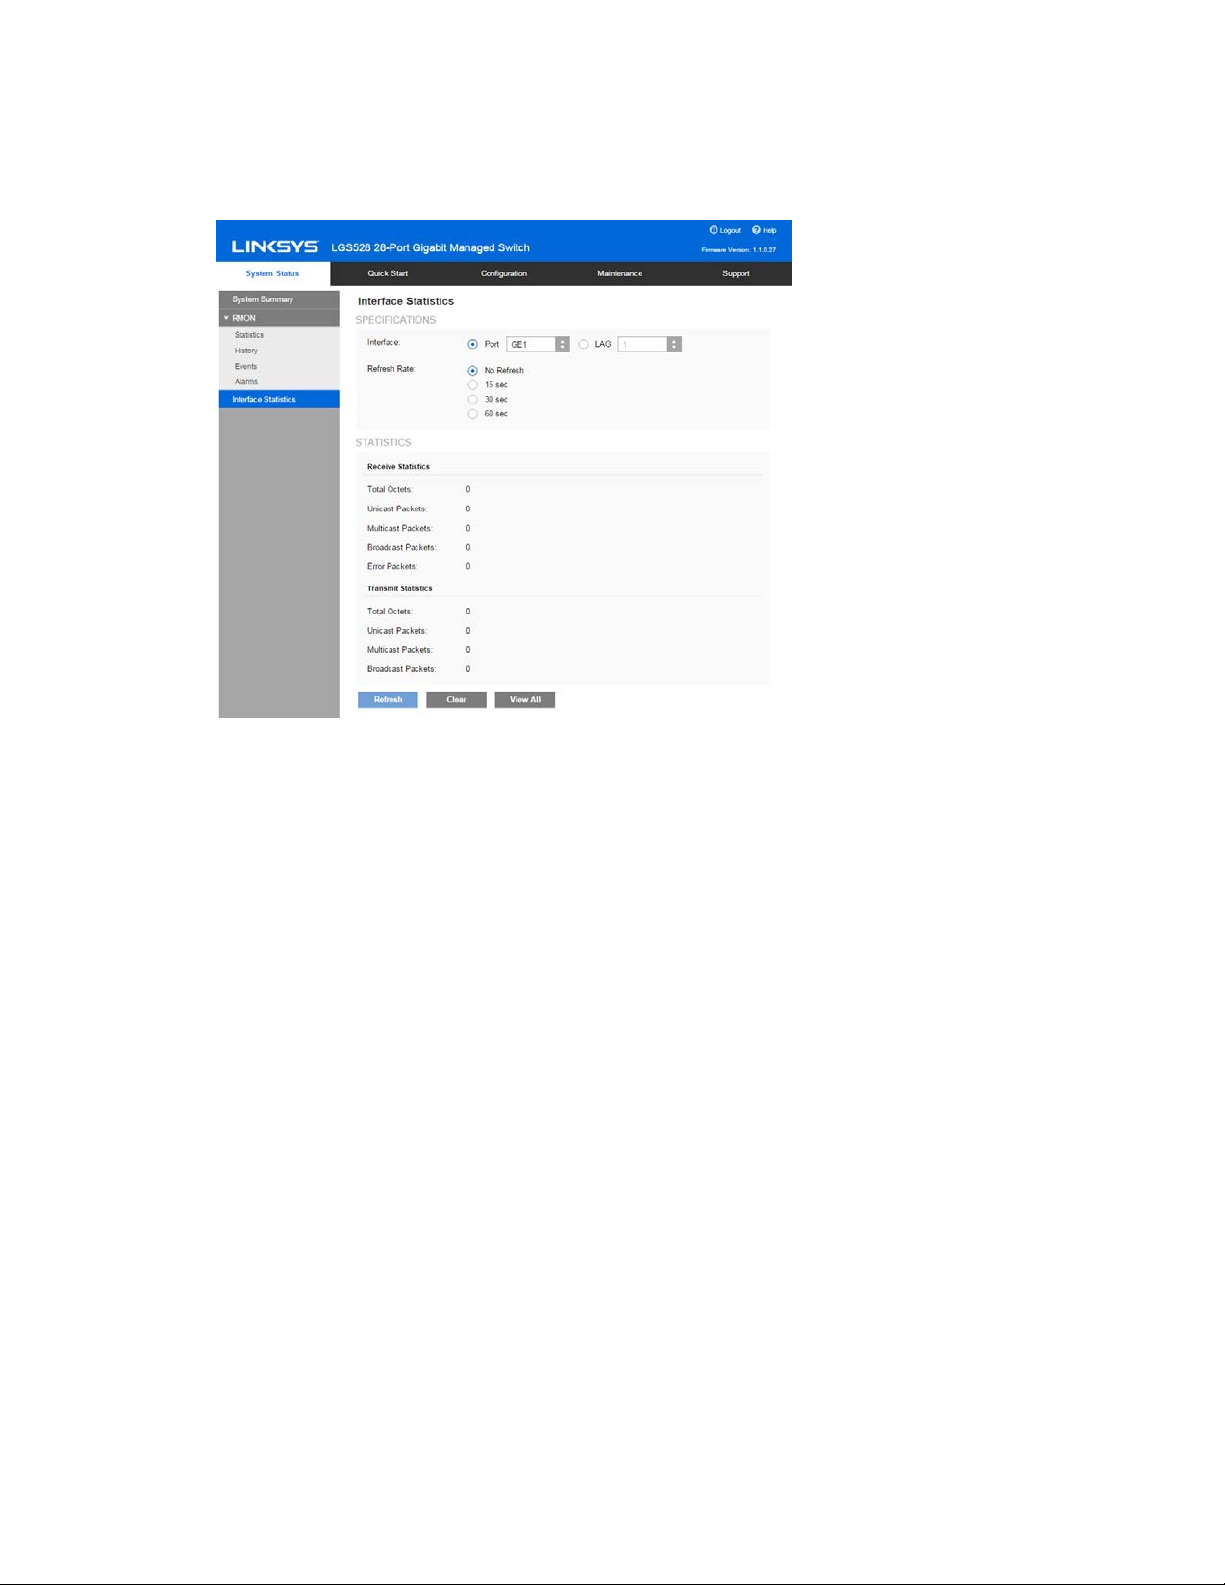
To display Ethernet statistics and/or set the refresh rate:
1. Click System Status > Interface Statistics.
2. Enter the parameters.
•
Interface------Select the specific interface for which
•
Ethernet statistics are to be displayed.
•
Refresh Rate------ Select the time period that passes before the interface
•
Ethernet statistics are refreshed. The available options are as follows:
•
No Refresh------ Statistics are not refreshed.
-
15 Sec------ Statistics are refreshed every 15 seconds.
-
30 Sec------ Statistics are refreshed every 30 seconds.
-
60 Sec------ Statistics are refreshed every 60 seconds.
The Receive Statistics area displays information about incoming packets.
•
Total Octets------Octets received, including bad packets and FCS octets, but excluding
framing bits.
•
Unicast Packets------Good Unicast packets received.
•
Multicast Packets------Good Multicast packets received.
•
Broadcast Packets------Good Broadcast packets received.
•
Error Packets------Packets with errors received.
21
Page 22

The Transmit Statistics area displays information about outgoing packets.
•
Total Octets------Octets transmitted, including bad packets and FCS octets, but excluding
framing bits.
•
Unicast Packets------Good Unicast packets transmitted.
•
Multicast Packets------Good Multicast packets transmitted.
•
Broadcast Packets------ Good Broadcast packets transmitted.
To clear or view statistics counters, do the following:
•
Click Refresh to refresh the counters on the page.
•
Click Clear to clear the selected interfaces counters.
•
Click View All to see all ports on a single page.
22
Page 23

Chapter 3 - Quick Start
This section describes how to view device statistics.
To simplify device configuration through quick navigation, the Quick Start page provides links to
the most commonly used pages.
Link Name (on the Page) Linked Page
Configure User Accounts and
Management Access
Configure Device IP Address IPv4 Interface
Create VLANs VLANs
Configure VLAN Memberships VLAN Memberships
Save Your Configuration Configuration File Copy
Clicking on the Support link takes you to the device product support page.
User Access & Accounts
23
Page 24

Chapter 4 - System Management
This chapter describes the following topics:
•
System Information
•
TCAM Resources
•
Management Session Timeout
•
Time
•
•
SNMP
Logs
System Information
To enter system information:
1. Click Configuration > System Management > System Information.
2. View or modify the system settings.
24
Page 25

•
System Description------ Displays a description of the device.
•
System Location------Enter the location where the device is physically located.
•
System Contact------ Enter the name of a contact person.
•
System Host Name------Select the host name of this device, which is used in the
prompt of CLI commands.
-
Default------ The default host name (System Name) of these switches is
switch123456, where 123456 represents the last three bytes of the
device MAC address in hex format.
-
User Defined------ Enter the host name. Use only letters, digits, and hyphens.
Host names cannot begin or end with a hyphen. No other symbols,
punctuation characters, or blank spaces are permitted (as specified in
RFC1033, 1034, 1035).
3. Click Apply to save the values in the Running Configuration file.
TCAM Resources
The TCAM Resources page is only displayed in Layer 3 mode.
TCAM holds the rules produced by applications, such as Access Control Lists (ACLs), Quality of
Service (QoS), IP Routing and user-created rules.
Some applications reserve TCAM resources that will be required upon their initiation. Additionally,
processes that initialize during system boot might configure some rules during the startup
process.
25
Page 26
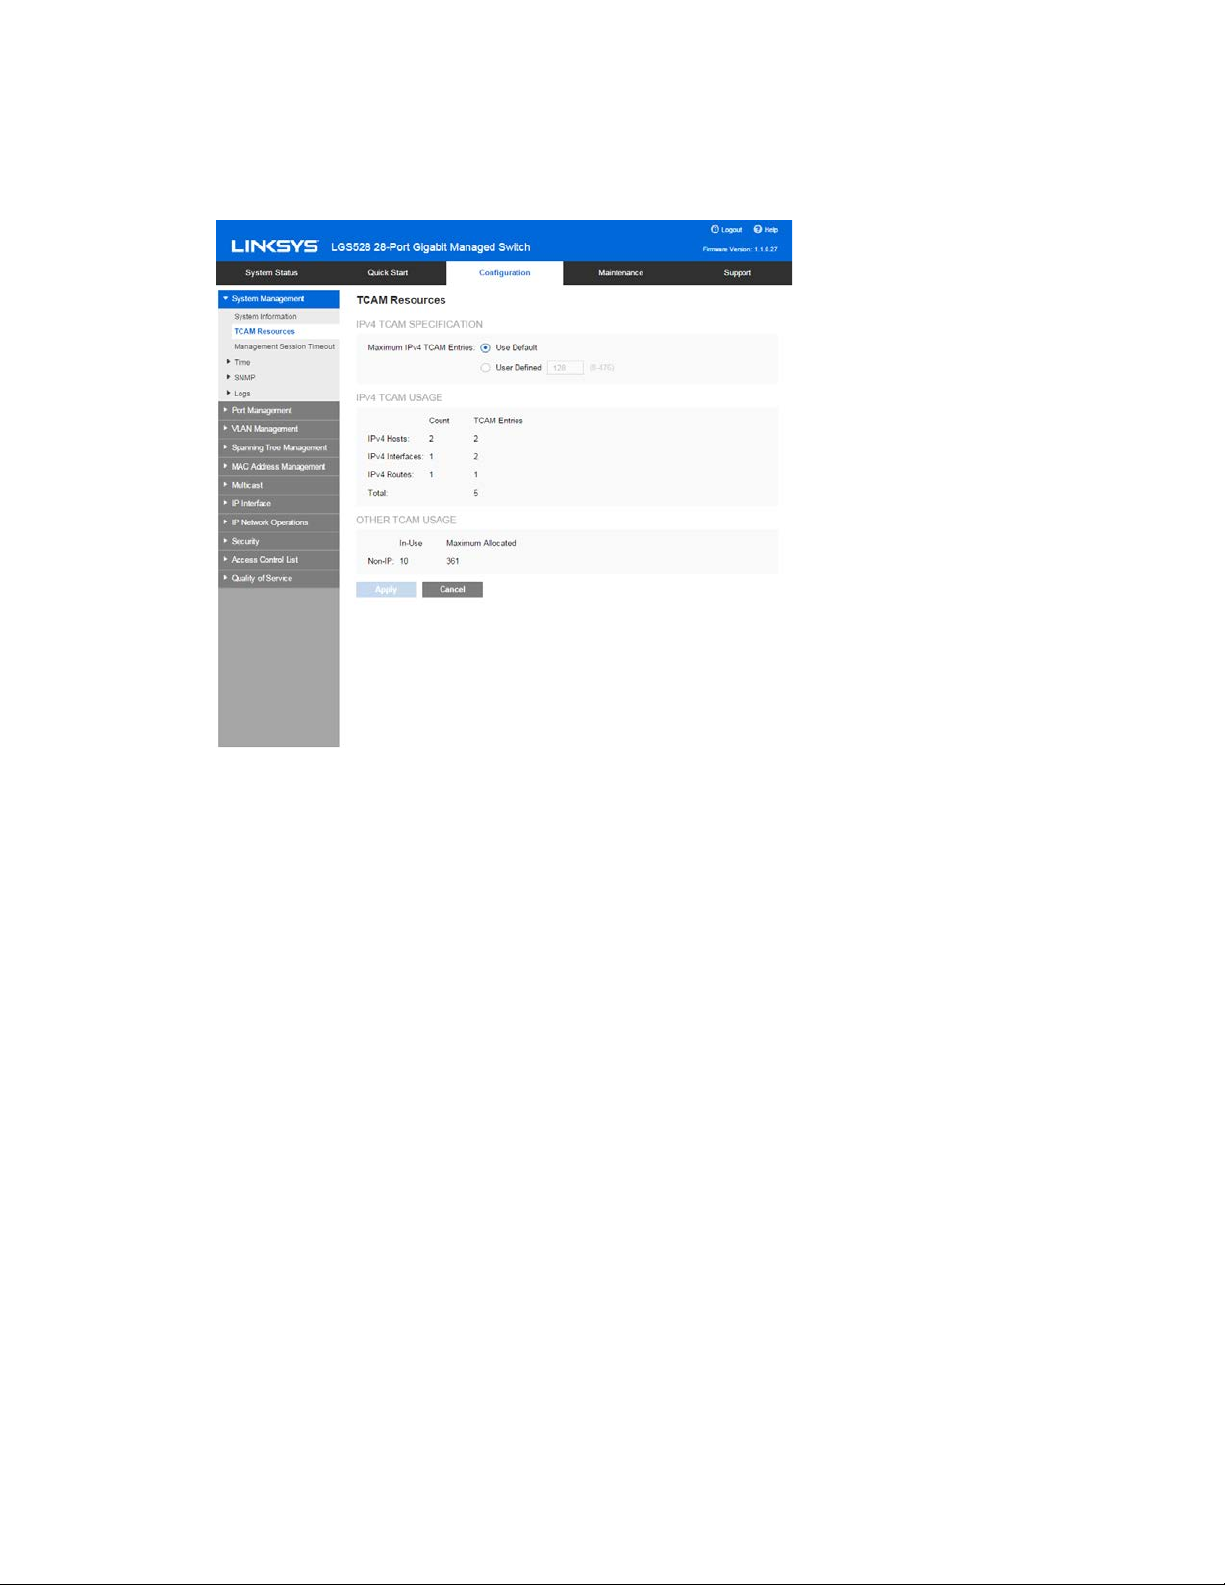
To configure and view TCAM utilization:
1. Click Configuration > System Management > TCAM Resources.
2. Select one of the following options:
•
Use Default------Use the system value for this field.
•
User Defined------ Enter the maximum number of TCAM entries that you determine
will be used for IPv4 routing.
Counters are displayed for TCAM utilization.
•
IPv4 Hosts
-
Count------Number of IPv4 interfaces configured on the switch.
-
TCAM Entries------Number of TCAM entries currently used by the known IPv4 nodes.
•
IPv4 Interfaces
-
Count------Number of IPv4 interfaces configured on the switch.
-
TCAM Entries------Number of TCAM entries used by the configured IPv4 interfaces.
•
IPv4 Routes
-
Count------Number of known IP routes on the switch.
-
TCAM Entries------Number of TCAM entries currently used by the known IP routes.
•
Total------Total number of TCAM entries.
26
Page 27

Counters are displayed for Non-IP TCAM Usage:
•
Non-IP
-
In Use------ Number of TCAM entries currently used by applications and features,
excluding IP routing.
-
Maximum Allocated------ Number of available TCAM entries that can be used by
applications and features, excluding IP routing.
Management Session Timeout
The Management Session Timeout configures the time intervals that the management sessions
can remain idle before they timeout and you must log in again to reestablish the session.
To set the idle session timeout for various types of sessions:
1. Click Configuration > System Management > Management Session Timeout.
2. Select the timeout for the following sessions from the corresponding list. The default
timeout value is 10 minutes.
•
Console Session Timeout------ Select the timeout for a console session.
•
Telnet Session Timeout------ Select the timeout for a Telnet session.
27
Page 28

•
HTTP Session Timeout------Select the timeout for an HTTP session.
•
HTTPs Session Timeout------ Select the timeout for an HTTPS session.
3. Click Apply to set the configuration settings on the device.
Time
This section describes the options for configuring the system time, time zone, and
Daylight Savings Time (DST).
•
Overview
•
System Time
•
SNTP Unicast Server
•
SNTP Multicast/Anycast
Overview
Synchronized system clocks provide a frame of reference between all devices on the network.
Network time synchronization is critical because every aspect of managing, securing, planning,
and debugging a network involves determining when events occur. Without synchronized clocks,
accurately correlating log files between devices when tracking security breaches or network
usage is impossible.
Synchronized time also reduces confusion in shared file systems, as it is important for the
modification times to be consistent, regardless of the machine on which the file systems reside.
For these reasons, it is important that the time configured on all of the devices on the network is
accurate.
Note—The device supports Simple Network Time Protocol (SNTP) and when enabled, the device
dynamically synchronizes the device time with time from an SNTP server. The device operates
only as an SNTP client, and cannot provide time services to other devices.
System Time
System time can be set manually by the user, dynamically from an SNTP server, or synchronized
from the PC running the GUI. If an SNTP server is chosen, the manual time settings are
overwritten when communications with the server are established.
28
Page 29

As part of the boot process, the device always configures the time, time zone, and DST. These
parameters are obtained from the PC running the GUI, SNTP, values set manually, or if all else
fails, from the factory defaults.
Time
The following methods are available for setting the system time on the device:
•
Manual------User must manually set the time.
•
SNTP------ Time can be received from SNTP time servers. SNTP ensures accurate
network time synchronization of the device up to the millisecond by using an SNTP
server for the clock source. When specifying an SNTP server, if choosing to
identify it by hostname, three suggestions are given in the GUI:
-
time-a.timefreq.bldrdoc.gov
-
time-b.timefreq.bldrdoc.gov
-
time-c.timefreq.bldrdoc.gov
After the time has been set by any of the above sources, it is not set again by the browser.
Note—SNTP is the recommended method for time setting.
Time Zone and Daylight Savings Time (DST)
The Time Zone and DST can be set on the device in the following ways:
•
Dynamic configuration of the device through a DHCP server, where:
-
Dynamic DST, when enabled and available, always takes precedence over
the manual configuration of DST.
-
If the server supplying the source parameters fails, or dynamic
configuration is disabled by the user, the manual settings are used.
-
Dynamic configuration of the time zone and DST continues after the IP
address lease time has expired.
•
Manual configuration of the time zone and DST becomes the Operational time
zone and DST, only if the dynamic configuration is disabled or fails.
Note------ The DHCP server must supply DHCP option 100 in order for dynamic
time zone configuration to take place.
29
Page 30

SNTP Modes
The device can receive system time from an SNTP server in one of the following ways:
•
•
The device supports having all of the above modes active at the same time and selects the
best system time received from an SNTP server, according to an algorithm based on the
closest stratum (distance from the reference clock).
System Time
Client Broadcast Reception (passive mode)------ SNTP servers broadcast the time,
and the device listens to these broadcasts. When the device is in this mode, there
is no need to define a Unicast SNTP server.
Client Broadcast Transmission (active mode)------ The device, as an SNTP client,
periodically requests SNTP time updates. This mode works in either of the
following ways:
-
SNTP Anycast Client Mode------ The device broadcasts time request packets
to all SNTP servers in the subnet, and waits for a response.
-
Unicast SNTP Server Mode------ The device sends Unicast queries to a list of
manually-configured SNTP servers, and waits for a response.
Use the System Time page to select the system time source. If the source is manual, you
can enter the time here.
Caution------ If the system time is set manually and the device is rebooted, the manual time
settings must be reentered.
30
Page 31

To define system time:
1. Click Configuration > System Management > Time > System Time.
The current time is displayed. This shows the DHCP time zone or the acronym for
the user-defined time zone if these were defined.
2. Enter the following parameters:
Clock Source------ Select the source used to set the system clock.
•
SNTP-If you enable this, the system time is obtained from an SNTP server.
•
To use this feature, you must also configure a connection to an SNTP
server in the SNTP Unicast Server page.
•
SNTP Client Unicast-Select to enable client Unicast mode.
•
SNTP IPv4 Multicast Rx-Select to receive SNTP IPv4 Multicast
synchronization packets requesting system time information. The packets
are transmitted from any SNTP servers on the subnet.
•
SNTP IPv4 Anycast Tx-Select to transmit SNTP IPv4 Anycast
synchronization packets requesting system time information. The packets
are transmitted to all SNTP servers on the subnet.
31
Page 32

•
SNTP IPv6 Multicast Rx-Select to receive SNTP IPv6 Multicast
synchronization packets requesting system time information. The packets
are transmitted from any SNTP servers on the subnet.
•
SNTP IPv6 Anycast Tx-Select to transmit SNTP IPv6 Anycast
synchronization packets requesting system time information. The packets
are transmitted to all SNTP servers on the subnet.
•
Manual Date/Time-Set the date and time manually. The local time is used
when there is no alternate source of time, such as an SNTP server.
Time Zone-The local time is used via the DHCP server or Time Zone offset.
•
Time Zone from DHCP-Select to enable dynamic configuration of the time
zone and the DST from the DHCP server. Whether one or both of these
parameters can be configured depends on the information found in the
DHCP packet. If this option is enabled, you must also enable DHCP client on
the device. The DHCP Client supports Option 100 providing dynamic time
zone setting.
•
DHCP Time Zone-Displays the acronym of the time zone configured from
the DHCP server. This acronym appears in the Actual Time field.
•
Time Zone Offset-Select the difference in hours between Greenwich Mean
Time (GMT) and the local time. For example, the Time Zone Offset for Paris
is GMT +1, while the Time Zone Offset for New York is GMT - 5.
•
Time Zone Acronym-Enter a user-defined name that represents the time
zone you have configured. This acronym appears in the Actual Time field.
Daylight Savings Time-Select how DST is defined:
•
Daylight Savings - Select to enable Daylight Saving Time.
•
Time Set Offset-Enter the number of minutes offset from GMT ranging
from1-1440. The default is 60.
•
Daylight Savings Type-Click one of the following:
-
USA - DST is set according to the dates used in the USA.
-
European - DST is set according to the dates used by the European
Union and other countries that use this standard.
-
By Dates - DST is set manually, typically for a country other than
the USA or a European country. This allows customization of the
start and stop of DST.
-
Recurring - DST occurs on the same date every year. This allows
customization of the start and stop of DST.
32
Page 33

•
For Daylight Savings Time, enter the following parameters:
-
From - Date and time that DST starts.
-
To - Date and time that DST ends.
•
Recurring From, enter the following parameters that indicate when DST
begins each year:
-
Day - Day of the week on which DST begins every year.
-
Week - Week within the month from which DST begins every year.
-
Month - Month of the year in which DST begins every year.
-
Time - The time at which DST begins every year.
•
(Recurring) To - Enter the following parameters that indicate when DST
ends each year:
-
Day - Day of the week on which DST ends every year.
-
Week - Week within the month from which DST ends every year.
-
Month-Month of the year in which DST ends every year.
-
Time-The time at which DST ends every year.
3. Click Apply. The system time values are written to the Running Configuration file.
SNTP Unicast Server
Up to 16 Unicast SNTP servers can be configured.
Note—To specify a Unicast SNTP server by name, you must first configure DNS server(s) on the
device (see DNS Settings). To add a Unicast SNTP server, SNTP Client Unicast must be enabled
(in the System Time page).
To view the Unicast SNTP server page:
•
Click Configuration > System Management > Time > SNTP Unicast Server.
This page displays the following information for each Unicast SNTP server:
1. SNTP Server------ SNTP server IP address. The preferred server, or hostname, is
chosen according to its stratum level.
2. SNTP Server Status------ SNTP server status. The possible values:
-
Up------SNTP server is currently operating normally.
-
Down------ SNTP server is currently not available.
33
Page 34

-
Unknown------ SNTP server is currently being searched for by the device.
-
In Process------Occurs when the SNTP server does not fully trust its own time
server (i.e. when first booting up the SNTP server).
3. Stratum Level------Distance from the reference clock expressed as a numerical
value. An SNTP server cannot be the primary server (stratum level 1) unless polling
interval is enabled.
4. Offset------ Estimated offset of the server's clock relative to the local clock, in
milliseconds. The host determines the value of this offset using the algorithm
described in RFC 2030.
5. Delay------Estimated round-trip delay of the server's clock relative to the local clock
over the network path between them, in milliseconds. The host determines the
value of this delay using the algorithm described in RFC 2030.
6. Poll Interval------ Displays whether polling is enabled or disabled.
7. Last Response Time------ Last date and time a response was received from this SNTP
server.
To add a Unicast SNTP server, enable SNTP Client Unicast.
1. Click Add.
2. Enter the following parameters:
o
SNTP Server------ Select if the SNTP server is going to be identified by its IP address
or if you are going to select a well-known SNTP server by name from the list.
Note—To specify a well-known SNTP server, the device must be connected to the
internet and configured with a DNS server or configured so that a DNS server is
identified by using DHCP. (See DNS Settings)
o
IP Version------Select the version of the IP address: Version 6 or Version 4.
34
Page 35

o
IPv6 Address Type------ Select the IPv6 address type (if IPv6 is used). The options:
-
Link Local------ The IPv6 address uniquely identifies hosts on a single network
link. A link local address has a prefix of FE80, is not routable, and can be
used for communication only on the local network. Only one link local
address is supported. If a link local address exists on the interface, this
entry replaces the address in the configuration.
-
Link Local Interface------ Select the link local interface (if IPv6 Address Type
Link Local is selected) from the list.Global------ The IPv6 address is a global
Unicast IPV6 type that is visible and reachable from other networks.
o
SNTP Server IP Address------Enter the SNTP server IP address. The format depends
on which address type was selected.
o
SNTP Server Name------ Select the name of the SNTP server from a list of well-known
NTP servers. If other is chosen, enter the name of an SNTP server in the adjacent
field.
o
Poll Interval------ Select to enable polling of the SNTP server for system time
information. All NTP servers that are registered for polling are polled, and the clock
is selected from the server with the lowest stratum level (distance from the
reference clock) that is reachable. The server with the lowest stratum is
considered to be the primary server. The server with the next lowest stratum is a
secondary server, and so forth. If the primary server is down, the device polls all
servers with the polling setting enabled, and selects a new primary server with the
lowest stratum.
3. Click Apply. The STNP server is added, and you are returned to the main page.
SNTP Multicast/Anycast
This page is only available in Layer 3.
To enable receiving SNTP packets from all servers on the subnet and/or to enable transmitting
time requests to SNTP servers:
1. Click Configuration > System Management > Time > SNTP Multicast/Anycast.
2. Click Add to select the interface for SNTP reception/transmission.
35
Page 36

Select an interface.
3. Click Apply to save the settings to the Running Configuration file.
SNMP
This section describes the Simple Network Management Protocol (SNMP) feature that provides a
method for managing network devices. It covers the following topics:
•
SNMP Versions and Workflow
•
Feature Configuration
•
Views
•
Groups
•
Users
•
Communities
•
Notification Filters
•
V1/V2 Notification Recipients
•
V3 Notification Recipients
SNMP Versions and Workflow
The device functions as SNMP agent and supports SNMPv1, v2, and v3. It also reports system
events to trap receivers using the traps defined in the supported MIBs (Management Information
Base).
SNMPv1 and v2
To control access to the system, a list of community entries is defined. Each community entry
consists of a community string and its access privilege. The system responds only to SNMP
messages specifying the community which has the correct permissions and correct operation.
SNMP agents maintain a list of variables that are used to manage the device. These variables are
defined in the Management Information Base (MIB).
36
Page 37

Note—Due to the security vulnerabilities of other versions, it is recommended to use SNMPv3.
SNMPv3
In addition to the functionality provided by SNMPv1 and v2, SNMPv3 applies access control and
new trap mechanisms to SNMPv1 and SNMPv2 PDUs. SNMPv3 also defines a User Security
Model (USM) that includes:
•
Authentication------Provides data integrity and data origin authentication.
•
Privacy------Protects against disclosure message content. Cipher Block- Chaining (CBCDES) is used for encryption. Either authentication alone can be enabled on an SNMP
message, or both authentication and privacy can be enabled on an SNMP message.
However, privacy cannot be enabled without authentication.
•
Timeliness------ Protects against message delay or playback attacks. The SNMP agent
compares the incoming message time stamp to the message arrival time.
SNMP Workflow
Note—For security reasons, SNMP is disabled by default. Before you can manage the device via
SNMP, you must turn on SNMP in the SNMP>Feature Configuration page.
The following is the recommended series of actions for configuring SNMP:
If you decide to use SNMPv1 or v2:
1. Click Configuration > System Management >SNMP > Communities.
2. Click Add.
The community can be associated with access rights and a view in Basic mode or with a
group in Advanced mode. There are two ways to define access rights of a community:
37
Page 38

•
Basic mode------The access rights of a community can configure with Read Only,
Read Write, or SNMP Admin. In addition, you can restrict the access to the
community to only certain MIB objects by selecting a view (defined in the Views
page).
•
Advanced Mode------The access rights of a community are defined by a group
(defined in the Groups page). You can configure the group with a specific security
model. The access rights of a group are Read, Write, and Notify.
3. Choose whether to restrict the SNMP management station to one address or allow SNMP
management from all addresses. If you choose to restrict SNMP management to one
address, then input the address of your SNMP Management PC in the IP Address field.
4. Input the unique community string in the Community String field.
5. Optionally, enable traps by using the Trap Settings page.
6. Optionally, define a notification filter(s) by using the Notification Filter page.
7. Configure the notification recipients on the Notification Recipients SNMPv1, 2 page.
If you decide to use SNMPv3:
1. Define the SNMP engine by using the Engine ID page. Either create a unique Engine ID or
use the default Engine ID. Applying an Engine ID configuration clears the SNMP database.
2. Optionally, define SNMP view(s) by using the Views page. This limits the range of OIDs
available to a community or group.
3. Define groups by using the Groups page.
4. Define users by using the SNMP Users page, where they can be associated with a group. If
the SNMP Engine ID is not set, then users may not be created.
5. Optionally, enable or disable traps by using the Trap Settings page.
6. Optionally, define a notification filter(s) by using the Notification Filter page.
7. Define a notification recipient(s) by using the Notification Recipients SNMPv3 page.
38
Page 39

Model OIDs
Mode Name
Description
Object ID
LGS528P
26
Management Switch + 2
COMBO ports
enterprises(1) .linksys(3955) .
smb(1000) .5 28 .2
LGS528
26
Management Switch + 2
COMBO ports
enterprises(1) .linksys(3955) .
smb(1000) .5 .28 .1
LGS552P
50
Management Switch + 2
COMBO ports
enterprises(1) .linksys(3955) .
smb(1000) .5 .52 .2
LGS552
50
Management Switch + 2
COMBO ports
enterprises(1) .linksys(3955) .
smb(1000) .5 .52 .1
The following are the device model Object IDs (OIDs):
Private OIDs are placed under: enterprises(1).linksys(3955).smb(1000).switch01(201).
Feature Configuration
-ports Gigabit PoE+
-ports Gigabit
-ports Gigabit PoE+
-ports Gigabit
The Engine ID is used by SNMPv3 entities to uniquely identify them. An SNMP agent is considered
an authoritative SNMP engine. This means that the agent responds to incoming messages (Get,
GetNext, GetBulk, Set) and sends trap messages to a manager. The agent's local information is
encapsulated in fields in the message.
Each SNMP agent maintains local information that is used in SNMPv3 message exchanges. The
default SNMP Engine ID is comprised of the enterprise number and the default MAC address. This
engine ID must be unique for the administrative domain, so that no two devices in a network have
the same engine ID.
Local information is stored in four MIB variables that are read-only (snmpEngineId,
snmpEngineBoots, snmpEngineTime, and snmpEngineMaxMessageSize).
Caution—When the engine ID is changed, all configured users and groups are erased.
39
Page 40

To configure SNMP:
1. Click Configuration > System Management >SNMP> Feature Configuration.
2. Enter the following fields:
•
SNMP------ Select to enable SNMP.
•
Authentication Notification------Select to enable SNMP authentication failure
notification.
•
SNMP Notification------ Select to enable SNMP notifications.
•
Local SNMPv3 Engine ID------ Configure the engine. The options are:
•
Use Default------Select to use the device-generated engine ID. The default engine ID
is based on the device MAC address, and is defined per standard as:
- First 4 octets------First bit = 1, the rest is the IANA enterprise number.
- Fifth octet------Set to 3 to indicate the MAC address that follows.
- Last 6 octets------ MAC address of the device.
•
None------No engine ID is used.
•
User Defined------ Enter the local device engine ID. The field value is a hexadecimal
string (range: 10 - 64). Each byte in the hexadecimal character strings is
represented by two hexadecimal digits.
40
Page 41

All remote engine IDs and their IP addresses are displayed in the Remote Engine ID
table.
3. Click Apply. The Running Configuration file is updated.
The Remote Engine ID table shows the mapping between IP addresses of the engine
and Engine ID. To add the IP address of an engine ID:
4. Click Add.
Enter the following fields:
•
Remote Engine IP Address------ Select whether to specify the Engine ID server by IP
address or name.
•
IP Version------Select the supported IP format.
•
IPv6 Address Type------ Select the IPv6 address type (if IPv6 is used). The options
are:
- Link Local------ The IPv6 address uniquely identifies hosts on a single network
link. A link local address has a prefix of FE80, is not routable, and can be used
for communication only on the local network. Only one link local address is
supported. If a link local address exists on the interface, this entry replaces the
address in the configuration.
-
Global------ The IPv6 address is a global Unicast IPV6 type that is visible and
reachable from other networks.
•
Remote Engine IP Address------ Enter the IP address of the log server.
•
Remote Engine IP Name------Enter the domain name of the log server.
•
Engine ID------Enter the Engine ID.
5. Click Apply. The Running Configuration file is updated.
41
Page 42

Views
A view is a user-defined label for a collection of MIB subtrees. Each subtree ID is defined by the
Object ID (OID) of the root of the relevant subtrees. Either well- known names can be used to
specify the root of the desired subtree or an OID can be entered (see Model OIDs).
Each subtree is either included or excluded in the view being defined.
The Views page enables creating and editing SNMP views. The default views (Default,
DefaultSuper) cannot be changed.
Views can be attached to groups in the Groups page or to a community which employs basic
access mode through the Communities page.
To define SNMP views:
1. Click Configuration > System Management>SNMP > Views.
2. Click Add to define new views.
42
Page 43

3. Enter the parameters.
•
View Name------Enter a view name between 0-30 characters)
•
View Object------ Select the node in the MIB tree that is included or excluded in the
selected SNMP view.
The options to select the object:
-
Object ID------ Enter an OID not offered in the Object ID Selection List option.
-
Object ID Selection List------ Enables you to navigate the MIB tree. Press the
Up arrow to go to the level of the selected node's parent and siblings; press
the Down arrow to descend to the level of the selected node's children.
Click nodes in the view to pass from one node to its sibling. Use the
scrollbar to bring siblings in view.
4. Include or exclude the MIB object from the view. If Include Object is selected, the MIB
objects are included in the view, otherwise they are excluded.
5. Click Apply.
6. In order to verify your view configuration, select the user-defined views from the Filter:
View Name list.
The following views exist by default:
•
Default------ Default SNMP view for read and read/write views.
•
DefaultSuper------ Default SNMP view for administrator views. Other views can be
added.
•
Object ID------ Displays the Object ID and its subtree to be included or excluded in the
SNMP view.
•
Object View------ Displays whether the defined object and its subtree are included or
excluded in the selected SNMP view.
43
Page 44

Groups
In SNMPv1 and SNMPv2, a community string is sent along with the SNMP frames. The community
string acts as a password to gain access to an SNMP agent. However, neither the frames nor the
community string are encrypted. Therefore, SNMPv1 and SNMPv2 are not secure.
In SNMPv3, the following security mechanisms can be configured.
•
Authentication------The device checks that the SNMP user is an authorized system
administrator. This is done for each frame.
•
Privacy------SNMP frames can carry encrypted data. Thus, in SNMPv3, there are three levels
of security:
-
No security (No authentication and no privacy)
-
Authentication (Authentication and no privacy)
-
Authentication and privacy
SNMPv3 provides a means of controlling the content each user can read or write and the
notifications they receive. A group defines read/write privileges and a level of security. It
becomes operational when it is associated with an SNMP user or community.
Note—To associate a non-default view with a group, first create the view in the Views page.
To create an SNMP group:
Click Configuration > System Management>SNMP > Groups.
1.
This page displays the existing SNMP groups and their security levels. The following fields
are displayed for each SNMP group (only the fields not explained in the Add page):
•
No Authentication Read View------No authentication is needed, and anyone is able to
read the view.
•
No Authentication Write View------ No authentication is needed, and anyone is able to
write the view.
•
No Authentication Notify View------No authentication is needed, and anyone is able
to receive notification of the view.
•
Authentication Read View------Only authenticated users are allowed to read the
view. By default, all users or community of a group can access all the MIB objects.
A group can be limited to specific view(s) based on the read, write, notify
authentication and/or privacy configurations.
•
Authentication Write View------ Only authenticated users are able to write the view.
Management access is write for the selected view.
44
Page 45

•
Authentication Notify View------Only authentication users are allowed to received
notification.
•
Privacy Read View------ When reading the objects in the view, the SNMP messages
are encrypted.
•
Privacy Write View------ When writing the object in the view, the SNMP messages are
encrypted.
•
Privacy Notify View - Notification on the objects in the view are encrypted.
2. Click Add.
3. Enter the parameters.
•
Group Name------Enter a new group name.
•
Security Model------ Select the SNMP version attached to the group, SNMPv1, v2, or
v3.
Three types of views with various security levels can be defined. For each security
level, select the views for Read, Write and Notify by entering the following fields:
-
Enable------ Select this field to enable the Security Level.
-
Security Level------ Define the security level attached to the group. SNMPv1
and SNMPv2 support neither authentication nor privacy. If SNMPv3 is
selected, select to enable one of the following:
o No Authentication and No Privacy------Neither the Authentication
nor the
o Privacy security levels are assigned to the group.
o Authorized View------ Select the Read, Write and Notify views
associated with this group and with the above security level.
45
Page 46

o Authentication and No Privacy------Authenticates SNMP
messages, and ensures the SNMP message origin is
authenticated but does not encrypt them.
o Authorized View------ Select the Read, Write and Notify views
associated with this group and with the above security level.
o Authentication and Privacy------Authenticates SNMP messages,
and encrypts them.
o Authorized View------ Select the Read, Write and Notify views
associated with this group and with the above security level.
4. Click Apply. The SNMP group is saved to the Running Configuration file.
Users
An SNMP user is defined by the login credentials (username, passwords, and authentication
method) and by the context and scope in which it operates by association with a group and an
Engine ID.
The configured user has the attributes of its group, having the access privileges configured within
the associated view.
46
Page 47

Groups enable network managers to assign access rights to a group of users instead of to a single
user.
A user can only belong to a single group.
To create an SNMPv3 user, the following must first exist:
•
An engine ID must first be configured on the device. This is done in the Engine ID page.
•
An SNMPv3 group must be available. An SNMPv3 group is defined in the Groups page.
To display SNMP users and define new ones:
1. Click Configuration > System Management>SNMP > Users.
This page contains existing users.
2. Click Add.
This page provides information for assigning SNMP access control privileges to SNMP
users.
3. Enter the parameters.
•
User Name------Enter a name for the user.
•
Engine ID------Select either the local or remote SNMP entity to which the user is
connected. Changing or removing the local SNMP Engine ID deletes the SNMPv3
User Database. To receive inform messages and request information, you must
define both a local and remote user.
-
-
•
Group Name------Select the SNMP group to which the SNMP user belongs.
SNMP groups are defined in the Add Group page.
Local------ User is connected to the local device.
Engine------ User is connected to a different SNMP entity besides the local
device. If the remote Engine ID is defined, remote devices receive inform
messages, but cannot make requests for information.
47
Page 48

Note—Users who belong to groups which have been deleted remain, but they are
inactive.
•
Authentication Method------Select the Authentication method that varies according
to the Group Name assigned. If the group does not require authentication, then the
user cannot configure any authentication. The options are:
-
None------No user authentication is used.
-
MD5------ A password that is used for generating a key by the MD5
authentication method.
-
SHA------ A password that is used for generating a key by the SHA (Secure
Hash Algorithm) authentication method.
•
Authentication Password------If authentication is accomplished by either a MD5 or a
SHA password, enter the local user password in either Encrypted or Plaintext.
Local user passwords are compared to the local database, and can contain up to
32 ASCII characters.
•
Privacy Method------ Select one of the following options:
-
None------Privacy password is not encrypted.
-
DES------ Privacy password is encrypted according to the Data Encryption
Standard (DES).
•
Privacy Password------ 16 bytes are required (DES encryption key) if the DES privacy
method was selected. This field must be exactly 32 hexadecimal characters. The
Encrypted or Plaintext mode can be selected.
4. Click Apply to save the settings.
Communities
Access rights in SNMPv1 and SNMPv2 are managed by defining communities in the Communities
page. The community name is a type of shared password between the SNMP management station
and the device. It is used to authenticate the SNMP management station.
Communities are only defined in SNMPv1 and SNMPv2 because SNMPv3 works with users
instead of communities. The users belong to groups that have access rights assigned to them.
The Communities page associates communities with access rights, either directly (Basic mode) or
through groups (Advanced mode):
•
Basic mode------The access rights of a community can configure with Read Only, Read Write,
or SNMP Admin. In addition, you can restrict the access to the community to only certain
MIB objects by selecting a view (defined in the SNMP Views page).
48
Page 49

•
Advanced Mode------The access rights of a community are defined by a group (defined in the
Groups page). You can configure the group with a specific security model. The access
rights of a group are Read, Write, and Notify.
To define SNMP communities:
1. Click Configuration > System Management>SNMP > Communities.
This page contains a table of configured SNMP communities and their properties.
2. Click Add.
This page enables network managers to define and configure new SNMP communities.
3. Enter the following fields:
•
SNMP Management Station------Click User Defined to enter the management station
IP address that can access the SNMP community. Click All to indicate that any IP
device can access the SNMP community.
•
IP Version------Select either IPv4 or IPv6.
•
IPv6 Address Type------ Select the supported IPv6 address type if IPv6 is used. The
options are:
-
Link Local------ The IPv6 address uniquely identifies hosts on a single network
link. A link local address has a prefix of FE80, is not routable, and can be
used for communication only on the local network. Only one link local
address is supported. If a link local address exists on the interface, this
entry replaces the address in the configuration.
-
Global------ The IPv6 address is a global Unicast IPV6 type that is visible and
reachable from other networks.
-
Interface------ If the IPv6 address type is Link Local, select whether it is
received through a VLAN or ISATAP.
•
IP Address------Enter the SNMP management station IP address.
49
Page 50

•
Community------ Enter the community name used to authenticate the management
station to the device.
•
Access Control------ Select one of the following:
-
Basic------In this mode, there is no connection to any group. You can only
choose the community access level (Read Only, Read Write, or SNMP
Admin) and, optionally, further qualify it for a specific view. By default, it
applies to the entire MIB.
-
Advanced------ In this mode, access is controlled by group configurations.
•
Access Mode------ Configure the community:
-
Read Only------ Management access is restricted to read-only. Changes
cannot be made to the community.
-
Read Write------Management access is read-write. Changes can be made to
the device configuration, but not to the community.
-
SNMP Admin------ User has access to all device configuration options, as well
as permissions to modify the community. SNMP Admin is equivalent to
Read Write for all MIBs except for the SNMP MIBs. SNMP Admin is
required for access to the SNMP MIBs.
-
View Name------ Select an SNMP view (a collection of MIB subtrees to which
access is granted).
-
Group Name------Select an SNMP group that determines the access rights in
Advanced mode.
•
Click Apply. The SNMP Community is defined, and the Running Configuration is
updated.
50
Page 51

Notification Filters
The Notification Filter page enables configuring SNMP notification filters and Object IDs (OIDs)
that are checked. After creating a notification filter, it is possible to attach it to a notification
recipient in the Notification Recipients SNMPv1/v2 page, and Notification Recipients SNMPv3
page.
The notification filter enables filtering the type of SNMP notifications that are sent to the
management station based on the OID of the notification to be sent.
51
Page 52

To define a notification filter:
1. Click Configuration > System Management>SNMP > Notification Filter.
The Notification Filter page contains notification information for each filter. The table is
able to filter notification entries by Filter Name.
2. Click Add.
3. Enter the parameters.
•
Filter Name------ Enter a name between 0-30 characters.
•
Filter Object------ Select the node in the MIB tree that is included or excluded in the
selected SNMP filter. The options to select the object are as follows:
-
Selection List------ Enables you to navigate the MIB tree. Press the Up arrow
to go to the level of the selected node's parent and siblings; press the Down
arrow to descend to the level of the selected node's children. Click nodes in
the view to pass from one node to its sibling. Use the scrollbar to bring
siblings in view.
-
If Object ID is used, the object identifier is included in the view if the
Include in filter option is selected.
4. Include or exclude in Object Filter. If this is selected, the selected MIBs are included in the
filter, otherwise they are excluded.
5. Click Apply. The SNMP views are defined and the running configuration is updated.
52
Page 53

V1/V2 Notification Recipients
Trap messages are generated to report system events, as defined in RFC 1215. The system can
generate traps defined in the MIB that it supports.
Trap receivers (aka Notification Recipients) are network nodes where the trap messages are sent
by the device. A list of notification recipients are defined as the targets of trap messages.
A trap receiver entry contains the IP address of the node and the SNMP credentials
corresponding to the version that is included in the trap message. When an event arises that
requires a trap message to be sent, it is sent to every node listed in the Notification Recipient
Table.
53
Page 54

The Notification Recipients SNMPv1/v2 page and the Notification Recipients SNMPv3 page
enable configuring the destination to which SNMP notifications are sent, and the types of SNMP
notifications that are sent to each destination (traps or informs). The Add/Edit pop-ups enable
configuring the attributes of the notifications.
An SNMP notification is a message sent from the device to the SNMP management station
indicating that a certain event has occurred, such as a link up/ down.
It is also possible to filter certain notifications. This can be done by creating a filter in the
Notification Filter page and attaching it to an SNMP notification recipient. The notification filter
enables filtering the type of SNMP notifications that are sent to the management station based
on the OID of the notification that is about to be sent.
Defining SNMP Notification Recipients
To define a recipient in SNMPv1/v2:
1. Click Configuration > System Management > SNMP > V1/V2 Notification Recipients.
This page displays the currently-defined SNMP recipients.
2. Enter the parameters.
•
Recipient------ Select whether to specify the remote log server by IP address or
server name.
54
Page 55

•
IP Version------Select either IPv4 or IPv6.
•
IPv6 Address Type------ Select either Link Local or Global.
-
Link Local------ The IPv6 address uniquely identifies hosts on a single network
link. A link local address has a prefix of FE80, is not routable, and can be
used for communication only on the local network. Only one link local
address is supported. If a link local address exists on the interface, this
entry replaces the address in the configuration.
-
Global------ The IPv6 address is a global Unicast IPV6 type that is visible and
reachable from other networks.
•
Interface------ If the IPv6 address type is Link Local, select whether it is received
through a VLAN or ISATAP.
•
Recipient IP Address------Enter the IP address of where the traps are sent.
•
Recipient IP Name------ Enter the server name of where the traps are sent.
•
UDP Port------ Enter the UDP port used for notifications on the recipient device.
•
Notification Type------ Select whether to send Traps or Informs. If both are required,
two recipients must be created.
•
Notification Version------Select the trap SNMP version 1 or 2.
•
Community------ Select from the drop-down the community string of the trap
manager. Community String names are generated from those listed in the
Community page.
•
Notification Filter------ Select to enable filtering the type of SNMP notifications sent
to the management station. The filters are created in the Notification Filter page.
•
Filter Name------Select the SNMP filter that defines the information contained in
traps (defined in the Notification Filter page).
3. Click Apply. The SNMP Notification Recipient settings are written to the Running
Configuration file.
55
Page 56

V3 Notification Recipients
To define a recipient in SNMPv3:
1. Click SNMP > V3 Notification Recipients SNMP.
This page displays recipients for SNMPv3.
2. Enter the fields:
•
Recipient------ Select whether to specify the remote log server by IP address or
server name
•
IP Version------Select either IPv4 or IPv6.
56
Page 57

•
IPv6 Address Type------ Select the IPv6 address type (if IPv6 is used). The options:
-
Link Local------ The IPv6 address uniquely identifies hosts on a single network
link. A link local address has a prefix of FE80, is not routable, and can be
used for communication only on the local network. Only one link local
address is supported. If a link local address exists on the interface, this
entry replaces the address in the configuration.
-
Global------ The IPv6 address is a global Unicast IPV6 type that is visible and
reachable from other networks.
•
Link Local Interface------ Select the link local interface (if IPv6 Address Type Link
Local is selected) from the drop-down list.
•
Recipient IP Address/Name------ Enter the IP address or server name of where the
traps are sent.
•
UDP Port------ Enter the UDP port used to for notifications on the recipient device.
•
Notification Type------ Select whether to send traps or informs. If both are required,
two recipients must be created.
•
User Name------Select from the drop-down list the user to whom SNMP notifications
are sent. In order to receive notifications, this user must be defined on the SNMP
User page, and its engine ID must be remote.
•
Security Level------ Select how much authentication is applied to the packet.
Note—The Security Level here depends on which User Name was selected. If this
User Name was configured as No Authentication, the Security Level is No
Authentication only. However, if this User Name has assigned Authentication and
Privacy on the User page, the security level on this screen can be either No
Authentication, or Authentication Only, or Authentication and Privacy.
The options are:
-
No Authentication------ Indicates the packet is neither authenticated nor
encrypted.
-
Authentication------Indicates the packet is authenticated but not encrypted.
-
Privacy------ Indicates the packet is both authenticated and encrypted.
•
Notification Filter------ Select to enable filtering the type of SNMP notifications sent
to the management station. The filters are created in the Notification Filter page.
57
Page 58

•
Filter Name------Select the SNMP filter that defines the information contained in
traps (defined in the Notification Filter page).
3. Click Apply. The SNMP Notification Recipient settings are written to the Running
Configuration file.
Logs
This section describes the Logs feature, which enables the device to generate multiple
independent logs. It covers the following topics:
o Overview
o Log Management
o Remote Log Servers
o RAM Log
o Flash Memory Log
Overview
Each log is a set of messages describing system events. The device generates the following local
logs:
•
Log sent to the console interface.
•
Log written into a cyclical list of logged events in the RAM and erased when the device
reboots.
•
Log written to a cyclical log-file saved to the Flash memory and persists across reboots.
In addition, you can send messages to remote SYSLOG servers in the form of SNMP traps and
SYSLOG messages.
Log Management
You can enable or disable logging on the Log Management page.
You can select the events by severity level. Each log message has a severity level marked with
the first letter of the severity level separated by dashes (-) on each side (except for Emergency,
which is indicated by the letter F). For example, the log message "%INIT-I-InitCompleted: …" has a
severity level of I, meaning Informational.
The event severity levels are listed from the highest severity to the lowest severity, as follows:
•
Emergency------ System is not usable.
58
Page 59

•
Alert------Action is needed.
•
Critical------ System is in a critical condition.
•
Error------System is in error condition.
•
Warning------ System warning has occurred.
•
Notice------ System is functioning properly, but a system notice has occurred.
•
Informational------ Device information.
•
Debug------Detailed information about an event.
You can select different severity levels for RAM and Flash logs. These logs are displayed in the
RAM Log page and Flash Memory Log page, respectively.
Selecting a severity level to be stored in a log causes all of the higher severity events to be
automatically stored in the log. Lower severity events are not stored in the log.
For example, if Warning is selected, all severity levels that are Warning and higher are stored in
the log (Emergency, Alert, Critical, Error, and Warning). No events with severity level below
Warning are stored (Notice, Informational, and Debug).
To set global log parameters:
1. Click Configuration > System Management > Logs > Log Management.
59
Page 60

2. Enter the parameters.
•
System Log
-
Logging------ Select to enable message logging.
-
Originator Identifier------ Enables adding an origin identifier to SYSLOG
messages. The options:
o None------Do not include the origin identifier in SYSLOG messages.
o Hostname------Include the system hostname in SYSLOG messages.
o IPv4 Address------ Include the IPv4 address of the sending interface in
o IPv6 Address------ Include the IPv6 address of the sending interface in
o User Defined------ Enter a description to be included in SYSLOG
•
Log Settings
Severity------Select the severity levels of the messages to be logged to the following:
-
RAM Logging------Severity levels of the messages to be logged to the RAM.
-
Flash Memory Logging------ Severity levels of the messages to be logged to
the Flash memory.
SYSLOG messages.
SYSLOG messages.
messages.
3. Click Apply. The Running Configuration file is updated.
Remote Log Servers
The Remote Log Servers page enables defining remote SYSLOG servers where log messages are
sent (using the SYSLOG protocol). For each server, you can configure the severity of the
messages that it receives.
To define SYSLOG servers:
1. Click Configuration > System Management > Logs > Remote Log Servers.
The list of configured remote log servers is displayed.
2. Click Add.
3. Enter the parameters.
60
Page 61

•
Enter New Server
-
Remote Log Server------ Select whether to identify the remote log server by
IP address or name.
-
IP Version------Select the supported IP version.
-
IPv6 Address Type------ Select the IPv6 address type (if IPv6 is used). The
options are as follows:
o Global------ The IPv6 address is a global Unicast IPV6 type that is
visible and reachable from other networks.
o Link Local------ The IPv6 address uniquely identifies hosts on a single
network link. A link local address has a prefix of FE80, is not
routable, and can be used for communication only on the local
network. Only one link local address is supported. If a link local
address exists on the interface, this entry replaces the address in
the configuration.
o Interface------Select the link local interface (if IPv6 Address Type Link
Local is selected) from the list.
•
Log Server IP Address------Enter the IP address of the log server if it is to be
identified by address.
•
Log Server Name------ Enter the domain name of the log server if it is to be identified
by name.
•
Server Settings
-
UDP Port------ Enter the UDP port to which the log messages are sent.
-
Facility------Select a facility value from which system logs are sent to the
remote server. Only one facility value can be assigned to a server. If a
second facility code is assigned, the first facility value is overridden.
-
Description------Enter a server description.
61
Page 62

-
Minimum Logging Level------Select the minimum level of system log
messages to be sent to the server.
4. Click Apply. The SYSLOG server is added, and the Running Configuration file is updated
RAM Log
The RAM Log page displays all messages that were saved in the RAM (cache) in chronological
order. Entries are stored in the RAM log according to the configuration in the Log Management
page.
To view log entries:
•
Click Configuration > System Management > Logs > RAM Log.
This page contains the following fields:
-
Log Index------ Log entry number.
-
Log Time------Time when message was generated.
-
Severity------Event severity.
-
Description------Message text describing the event.
•
To clear the log messages, click Clear. The messages are cleared.
Flash Memory Log
The Flash Memory Log page displays the messages that were stored in the Flash memory, in
chronological order. The minimum severity for logging is configured in the Log Management page.
Flash logs remain when the device is rebooted. You can clear the logs manually.
To view the Flash logs:
•
Click Configuration > System Management > Logs > Flash Memory Log.
This page contains the following fields:
-
Log Index------ Log entry number.
-
Log Time------Time when message was generated.
-
Severity------Event severity.
-
Description------Message text describing the event.
•
To clear the messages, click Clear. The messages are cleared.
62
Page 63

Chapter 5 - Port Management
This section describes port configuration, link aggregation, and the Green Ethernet feature.
It covers the following topics:
•
Ports
•
Link Aggregation
•
Green Ethernet
•
PoE
•
Discovery - -- LLDP
Ports
To configure ports:
1. Configure port by using the Ports page.
2. Enable/disable the Link Aggregation Control (LAG) protocol, and configure the potential
member ports to the desired LAGs by using the LAGs page. By default, all LAGs are empty.
3. Configure the Ethernet parameters, such as speed and auto-negotiation, for the LAGs by
using the LAGs page.
4. Configure the LACP parameters for the ports that are members or candidates of a
dynamic LAG by using the LAGs page.
5. Configure Green Ethernet and 802.3 Energy Efficient Ethernet by using the Green
Ethernet page.
6. Configure Green Ethernet energy mode and 802.3 Energy Efficient Ethernet per port by
using the Green Ethernet page.
7. If PoE is supported and enabled for the device, configure the device as described in PoE.
8. Configure LLDP and LLDP-MED port configuration by using Discovery LLDP.
To configure port settings:
1. Click Configuration > Port Management > Ports.
2. Select Enable to support jumbo packets of up to 9 KB in size. If Jumbo Frames is not
enabled (default), the system supports packet size up to 2,000 bytes. For Jumbo Frames
to take effect, the device must be rebooted after the feature is enabled.
3. To update the port settings, select the desired port, and click Edit.
63
Page 64

4. Modify the following parameters:
•
Port------Select the port number.
•
Operational Status------ Displays whether the port is currently up or down. If the port
is down because of an error, the description of the error is displayed.
•
Administrative Mode------ Select to bring the port up or down.
•
Suspended Port------ Select to reactivate a port that has been suspended. The
reactivate operation brings the port up without regard to why the port was
suspended.
•
Protected Port------Select to make this a protected port. (A protected port is also
referred to as a Private VLAN Edge [PVE].)
The features of a protected port:
-
Protected Ports provide Layer 2 isolation between interfaces (Ethernet
ports and LAGs) that share the same VLAN.
-
Packets received from protected ports can be forwarded only to
unprotected egress ports. Protected port filtering rules are also applied to
packets that are forwarded by software, such as snooping applications.
-
Port protection is not subject to VLAN membership. Devices connected to
protected ports are not allowed to communicate with each other, even if
they are members of the same VLAN.
-
Both ports and LAGs can be defined as protected or unprotected.
-
Protected LAGs are described in the LAGs section.
•
Auto Negotiation------Select to enable auto-negotiation on the port. Autonegotiation enables a port to advertise its transmission speed, duplex mode, and
flow control abilities to the port link partner.
64
Page 65

•
Port Speed------Configure the speed of the port. The port type determines the
available speeds. You can designate this field only when port auto-negotiation is
disabled.
•
Duplex Mode------Select the port duplex mode. This field is configurable only when
auto-negotiation is disabled, and the port speed is set to 10M or 100M. At port
speed of 1G, the mode is always full duplex.
Possible options:
-
Half------The interface supports transmission between the device and the
client in only one direction at a time.
-
Full------The interface supports transmission between the device and the
client in both directions simultaneously.
•
Auto Advertisement------ Select the capabilities advertised by auto-negotiation when
it is enabled.
Options:
-
Max Capability------ All port speeds and duplex mode settings can be
accepted.
-
10 Full Duplex------10 Mbps speed and Full Duplex mode.
-
10 Half Duplex------10 Mbps speed and Half Duplex mode.
-
100 Full Duplex------100 Mbps speed and Full Duplex mode.
-
100 Half Duplex------100 Mbps speed and Half Duplex mode.
-
1000 Full Duplex------1000 Mbps speed and Full Duplex mode.
•
Back Pressure------ Select the Back Pressure mode on the port (used with Half Duplex
mode) to slow down the packet reception speed when the device is congested. It
disables the remote port, preventing it from sending packets by jamming the
signal.
•
Flow Control------Enable or disable 802.3x Flow Control, or enable the autonegotiation of flow control on the port (only when in Full Duplex mode).
•
MDI/MDIX------the Media Dependent Interface (MDI)/Media Dependent Interface
with Crossover (MDIX) status on the port.
Options:
-
MDIX------ Select to swap the port's transmit and receives pairs.
-
MDI------ Select to connect this device to a station by using a straight-through
cable.
65
Page 66

-
Auto------Select to configure this device to automatically detect the correct
pinouts for the connection to another device.
•
Description------Enter the port description.
5. Click Apply. The port settings are written to the Running Configuration file.
Link Aggregation
This section describes how to configure LAGs. It covers the following topics:
Overview
Load Balancing
LAG Management
Default Settings and Configuration
Static and Dynamic LAG Workflow
LAGs
Overview
Link Aggregation Control Protocol (LACP) is part of the IEEE specification (802.3ad) that enables
you to bundle several physical ports together to form a single logical channel (LAG). LAGs multiply
the bandwidth, increase port flexibility, and provide link redundancy between two devices.
Two types of LAGs are supported:
•
Static------ A LAG is static if the LACP is disabled on it. The ports assigned to a static LAG
are always active members. After a LAG is manually created, the LACP option cannot be
added or removed, until the LAG is edited and a member is removed (which can be added
prior to applying), then the LACP button becomes available for editing.
•
Dynamic------ A LAG is dynamic if LACP is enabled on it. The ports assigned to dynamic LAG
are candidate ports. LACP determines which candidate ports are active member ports.
The non-active candidate ports are standby ports ready to replace any failing active
member ports.
Load Balancing
Traffic forwarded to a LAG is load-balanced across the active member ports, thus achieving an
effective bandwidth close to the aggregate bandwidth of all the active member ports of the LAG.
66
Page 67

Traffic load balancing over the active member ports of a LAG is managed by a hash-based
distribution function that distributes Unicast and Multicast traffic based on Layer 2 or Layer 3
packet header information.
The device supports two modes of load balancing:
•
By MAC Addresses------(Default) Based on the destination and source MAC addresses of all
packets.
•
By IP and MAC Addresses------Based on the destination and source IP addresses for IP
packets, and destination and source MAC addresses for non-IP packets.
LAG Management
In general, a LAG is treated by the system as a single logical port. In particular, the
LAG has port attributes similar to a regular port, such as state and speed.
The device supports eight LAGs.
Every LAG has the following characteristics:
•
All ports in a LAG must be of the same media type.
•
To add a port to the LAG, it cannot belong to any VLAN except the default VLAN.
•
Ports in a LAG must not be assigned to another LAG.
•
No more than eight ports are assigned to a static LAG and no more than 16 ports can be
candidates for a dynamic LAG.
•
All the ports in a LAG must have auto-negotiation disabled, although the LAG can have
auto-negotiation enabled.
•
When a port is added to a LAG, the configuration of the LAG is applied to the port. When
the port is removed from the LAG, its original configuration is reapplied.
•
Protocols, such as Spanning Tree, consider all the ports in the LAG to be one port.
Default Settings and Configuration
Ports are not members of a LAG and are not candidates to become part of a LAG.
Static and Dynamic LAG Workflow
After a LAG has been manually created, LACP cannot be added or removed until the LAG is edited
and a member is removed. Only then the LACP field is activated.
To configure a static LAG:
67
Page 68

1. Disable LACP on the LAG to make it static. Assign up to eight member ports to the static
LAG in the Port List to the LAG Port Member list. Perform these actions in the LAGs page.
2. Configure various aspects of the LAG, such as speed and flow control by using the Edit
LAG page.
To configure a dynamic LAG:
1. Enable LACP on the LAG. Assign up to 16 candidates ports to the dynamic LAG by
selecting and moving the ports from the Port List to the LAG Port Member List by using
the LAGs page.
2. Configure various aspects of the LAG, such as speed and flow control by using the LAGs
page.
LAGs
The LAGs page displays global and per-LAG settings. The page also enables you to configure the
global settings and to select and edit the desired LAG on the Edit LAG Membership page.
To define the member or candidate ports in a LAG:
1. Click Configuration > Port Management > Link Aggregation > LAGs.
Information for each defined LAG is displayed.
68
Page 69

2. Select the Load Balance Method:
•
by MAC Address------(Default) Based on the destination and source MAC addresses
of all packets.
•
by IP and MAC Address------Based on the destination and source IP addresses for IP
packets, and destination and source MAC addresses for non-IP packets.
3. Select the LAG to be configured, and click Edit.
69
Page 70

4. Enter the values for the following fields:
Operational Status------Displays the following:
-
Status------Whether the LAG is currently operating.
-
LAG Speed------Displays the current speed at which the LAG is operating.
-
Flow Control------Whether flow control is enabled on the LAG.
Port List------Move those ports that are to be assigned to the LAG from the Port List
to the LAG Port Member list. Up to eight ports per static LAG can be assigned, and
16 ports can be assigned to a dynamic LAG.
LAG Mode------Displays whether the LAG is up or down.
Suspended LAG------Select to reactivate the LAG.
LACP------Select to enable LACP on the selected LAG. This makes it a dynamic LAG.
This field can only be enabled after moving a port to the LAG in the next field.
Protected LAG------Select to make the LAG a protected port for Layer 2 isolation.
See the Port Configuration description in Setting Basic Port Configuration for
details regarding protected ports and LAGs.
Auto Negotiation------Select to enable auto-negotiation on the LAG. Autonegotiation is a protocol between two link partners that enables a LAG to
advertise its transmission speed and flow control to its partner (the Flow Control
default is disabled). It is recommended to keep auto-negotiation enabled on both
sides of an aggregate link, or disabled on both sides, while ensuring that link
speeds are identical.
70
Page 71

•
Port Speed------Configure the speed of the LAG. The port types determine the
available speeds. You can designate this field only when port auto- negotiation is
disabled.
•
Auto Advertisement------ Select the capabilities to be advertised by the LAG.
The options:
-
Max Capability------ All LAG speeds and both duplex modes are available.
-
10 Full Duplex------The LAG advertises a 10 Mbps speed and the mode is full
duplex.
-
100 Full Duplex------The LAG advertises a 100 Mbps speed and the mode is
full duplex.
-
1000 Full Duplex------The LAG advertises a 1000 Mbps speed and the mode
is full duplex.
•
Flow Control------Set Flow Control to either Enable or Disable or Auto- Negotiation.
•
Description------Enter the LAG name or a comment.
5. Click Apply. LAG membership is saved to the Running Configuration file.
Green Ethernet
This section describes Green Ethernet, a set of features designed to be environmentally friendly
by reducing the power consumption of a device.
The Green Ethernet feature can reduce overall power usage in the following ways:
•
Energy-Detect Mode------ In this mode, the switch conserves power when the operational
status of a port is down. Energy-Detect Mode is supported on all ports.
•
Short-Reach Mode------In the mode,, the switch will analyze cable length and adjust power
usage accordingly. If the cable is shorter than 50 meters (164 feet), the device uses less
power to send frames over the cable. This mode is only supported on RJ45 GE ports, and
does not apply to Combo ports.
This mode is globally disabled by default. It cannot be enabled if EEE mode is enabled (see
below).
•
802.3 Energy Efficient Ethernet (EEE)------EEE reduces power consumption when there is
no traffic on the port. See Energy Efficient Ethernet Feature for more information.
EEE is enabled globally by default. On a given port, if EEE is enabled, Short-Reach mode
will be disabled. If Short Reach-Mode is enabled, EEE is grayed out.
These modes are configured per port, without taking into account the LAG membership of the
ports.
71
Page 72

Power savings, current power consumption and cumulative energy saved can be monitored. The
total amount of saved energy can be viewed as a percentage of the power that would have been
consumed by the physical interfaces had they not been running in Green Ethernet mode.
The saved energy displayed does not include the amount of energy saved by EEE.
Energy Efficient Ethernet Feature
EEE is designed to save power when there is no traffic on the link. In Energy Detect Mode, power
is reduced when the port is down.
When using 802.3 EEE, systems on both sides of the link can disable portions of their
functionality and save power during periods of no traffic.
802.3 EEE supports IEEE 802.3 MAC operation at 100 Mbps and 1000 Mbps:
LLDP is used to select the optimal set of parameters for both devices. If LLDP is not supported by
the link partner, or is disabled, 802.3 EEE will still be operational, but it might not be in the optimal
operational mode.
The 802.3 EEE feature is implemented using a port mode called Low Power Idle (LPI) mode. The
switch automatically chooses LPI Mode, if enabled, for a port when there is no traffic on that port.
Both sides of a connection (device port and connecting device) must support
802.3 EEE for it to work. When traffic is absent, both sides send signals indicating that power is
about to be reduced. When signals from both sides are received, the Keep Alive signal indicates
that the ports are in LPI Mode (and not in Down status), and power is reduced.
For ports to stay in LPI mode, the Keep Alive signal must be received continuously from both
sides.
Power Saving by Disabling Port LEDs
The Disable Port LEDs feature saves power consumed by the device’s LEDs. When located in an
unoccupied room, these LEDs are unnecessary. Use the Green Ethernet feature to disable port
LEDs (link, speed, and PoE) when they are not needed. Enable them if needed (debugging,
connecting additional devices, etc.).
72
Page 73

Advertise Capabilities Negotiation
802.3 EEE support is advertised during the Auto-Negotiation stage. Auto- Negotiation provides a
linked device with the capability to detect the abilities (modes of operation) supported by the
device at the other end of the link, determine common abilities, and configure itself for joint
operation. Auto-Negotiation is performed at the time of link-up, on command from management,
or upon detection of a link error. During the link establishment process, both link partners
exchange their 802.3 EEE capabilities. Auto-Negotiation functions without user interaction when
it is enabled on the device.
Note—If Auto-Negotiation is not enabled on a port, the EEE is disabled. The only exception is if
the link speed is 1GB, then EEE will still be enabled even though Auto-Negotiation is disabled.
Default Configuration
By default, 802.3 EEE is enabled globally and per port.
Interactions Between Features
The following describe 802.3 EEE interactions with other features:
•
If auto-negotiation is not enabled on the port, the 802.3 EEE operational status is
disabled. The exception to this rule is that if the link speed is 1 Gigabyte, EEE will still be
enabled even though Auto-Negotiation is disabled.
•
If 802.3 EEE is enabled and the port is going up, it commences to work immediately in
accordance with the maximum wake time value of the port.
•
On the GUI, the EEE field for the port is not available when the Short Reach Mode option
on the port is checked.
•
If the port speed on the GE port is changed to 10Mbit, 802.3 EEE is disabled. This is
supported in GE models only.
802.3 EEE Configuration Workflow
This section describes how to configure the 802.3 EEE feature and view its counters.
1. Ensure that auto-negotiation is enabled on the port by opening the Ports page.
•
Select a port and open the Edit Ports page.
•
Select Auto Negotiation field to ensure that it is Enabled.
73
Page 74

2. Ensure that 802.3 Energy Efficient Ethernet (EEE) is globally enabled in the Green
Ethernet page (it is enabled by default). This page also displays how much energy has been
saved.
3. Ensure that 802.3 EEE is enabled on a port by opening the Green Ethernet page.
•
Select a port, open the Edit Ports page.
•
Check the 802.3 Energy Efficient Ethernet (EEE) mode on the port (it is enabled by
default).
Configuring Green Ethernet
To configure Green Ethernet globally and on a port:
1. Click Configuration > Port Management > Green Ethernet.
2. Choose whether to enable the following features:
•
Energy Detect Mode------Select to globally enable.
•
Short Reach------Select to globally enable Short Reach mode if there are Green
Ethernet ports on the device.
Note—If Short Reach is enabled, EEE must be disabled.
•
Port LEDs------ Select to disable port LEDs. When disabled, ports do not display link
status, activity, etc.
•
802.3 Energy Efficient Ethernet (EEE)------Select to globally enable EEE.
3. Click Apply to set the global settings.
The following fields are displayed:
74
Page 75

•
Power Savings------ Displays the percentage of power saved by running Port LED,
Short Reach and Energy Detect modes. The EEE power savings is dynamic by
nature since it is based on port utilization and is therefore not taken into
consideration. The power saving calculation is performed by comparing the
maximum power consumption without power savings to the current consumption.
•
Cumulative Energy Saved------ Displays the amount of energy saved from the last
device reboot in watt hours. This value is updated each time there is an event that
affects power saving.
For each port the following fields are described:
•
Port------The port number.
•
Short-Reach Mode------Whether Short-Reach Mode is enabled.
•
Short Reach Status------ Whether Short-Reach Mode is operational. This is a function of
whether it has been enabled (Administrative Status), whether it has been enabled on
the local port, and whether it is operational on the local port.
75
Page 76

•
Short Reach Reason------ If Short-Reach mode is not operational, displays the reason.
•
Cable Length------ Displays VCT-returned cable length in meters.
•
EEE Mode------Whether the mode is enabled.
•
EEE Status------Whether EEE is currently operating on the local port. This is a function
of whether it has been enabled (Administrative Status), whether it has been enabled on
the local port and whether it is operational on the local port.
Note—The window displays the Short Reach, Energy Detect and EEE settings for each
port; however, they are not enabled on any port unless they are also enabled globally.
•
EEE Status------ State of EEE of the port regarding to EEE mode (enabled or disabled).
•
Remote EEE Mode------ EEE mode of the linked partner.
•
Energy Detect Mode - Whether Energy Detect Mode is enabled.
•
Energy Detect Status -Whether Energy Detect Mode is currently operational. This is a
function of whether it has been enabled (Administrative Status), whether it has been
enabled on the local port and whether it is operational on the local port.
•
Energy Detect Reason - If Energy Detect Mode is not operational, this field identifies
why not.
4. Select a Port and click Edit.
5. Select to enable or disable the various features.
6. Click Apply. The Green Ethernet port settings are written to the Running Configuration
File.
76
Page 77

PoE
The Power over Ethernet (PoE) feature is only available on PoE-based devices. For a list of PoEbased devices, refer to the Device Models section.
This section describes how to use the PoE feature. It covers the following topics:
•
Overview
•
Feature Configuration
•
Port Limit Power Mode
•
Class Limit Power Mode
Overview
A PoE device is PSE (Power Sourcing Equipment) that delivers electrical power to connected PD
(Powered Devices) over existing copper cables without interfering with the network traffic,
updating the physical network or modifying the network infrastructure.
See Device Models for information concerning PoE support on various models. PoE provides the
following features:
•
Eliminates the need to run 110/220 V AC power to all devices on a wired LAN.
•
Removes the necessity for placing all network devices next to power sources.
•
Eliminates the need to deploy double cabling systems in an enterprise, significantly
decreasing installation costs.
Power over Ethernet can be used in any enterprise network that deploys relatively low-powered
devices connected to the Ethernet LAN:
•
IP phones
•
Wireless access points
•
IP gateways
•
Audio and video remote monitoring devices
PoE Operation
PoE implementation stages:
•
Detection------ Sends special pulses on the copper cable. When a PoE device is located at the
other end, that device responds to these pulses.
•
Classification------ Negotiation between the Power Sourcing Equipment (PSE) and the
Powered Device (PD) commences after the Detection stage. During negotiation, the PD
specifies its class, which is the amount of maximum power that the PD consumes.
77
Page 78

•
Power Consumption------ After the classification stage completes, the PSE provides power
to the PD. If the PD supports PoE, but without classification, it is assumed to be class 0
(the maximum). If a PD tries to consume more power than permitted by the standard, the
PSE stops supplying power to the port.
Power Modes
Power per port can be limited depending on the Power Mode:
•
Port Limit------ Power is limited to a specified wattage. For these settings to be active, the
system must be in PoE Port Limit mode. That mode is configured in the PoE Feature
Configuration page.
When the power consumed on the port exceeds the port limit, the port power is turned off.
•
Class Limit------ Power is limited based on the class of the connected PD. For these settings
to be active, the system must be in PoE Class Limit mode. That mode is configured in the
PoE Feature Configuration page.
When the power consumed on the port exceeds the class limit, the port power is turned
off.
PoE Priority Example
A 48-port device is supplying a total of 375 watts.
The administrator configures all ports to allocate up to 30 watts each. This results in 48 times 30
ports equaling 1440 watts, which is too much. The device cannot provide enough power to each
port, so it provides power according to the priority.
The administrator sets the priority for each port, allocating how much power it can be given.
These priorities are entered in the PoE Port Limit Mode or Class Limit Power Mode pages.
See Device Models for a description of the device models that support PoE and the maximum
power that can be allocated to PoE ports.
PoE Configuration Considerations
There are two factors to consider in PoE configuration:
•
The amount of power that the PSE can supply
•
The amount of power that the PD is attempting to consume
You can decide:
•
Maximum power a PSE is allowed to supply to a PD
•
POE mode-To change the mode from Class Power Limit to Port Limit, and vice versa,
during device operation. The power values per port that were configured for the Port Limit
mode are retained.
78
Page 79

Note--Changing the mode from Class Limit to Port limit, and vice versa, when the device is
operational forces the Powered Device to reboot.
•
Maximum port limit allowed as a per-port numerical limit in mW (Port Limit mode).
The PoE-specific hardware automatically detects the PD class and its power limit according to
the class of the device connected to each specific port (Class Limit mode).
If at any time during the connectivity an attached PD requires more power from the device than
the configured allocation allows (no matter if the device is in Class Limit or Port Limit mode), the
device does the following:
•
Maintains the up/down status of the PoE port link
•
Turns off power delivery to the PoE port
•
Logs the reason for turning off power
Feature Configuration
The Feature Configuration page enables selecting either the Port Limit or Class Limit PoE mode
and specifying the PoE traps to be generated.
These settings are entered in advance. When the PD actually connects and is consuming power, it
might consume much less than the maximum power allowed.
Output power is disabled during power-on reboot, initialization, and system configuration to
ensure that PDs are not damaged.
79
Page 80

To configure PoE on the device and monitor current power usage:
1. Click Configuration > Port Management > PoE > Feature Configuration.
2. Enter the values for the following fields:
•
Power Mode------ Select one of the following options:
-
Port Limit------ The maximum power limit per each port is configured by the
user.
-
Class Limit------ The maximum power limit per port is determined by the class
of the device, which results from the Classification stage.
Note--When you change from Port Limit to Class Limit, or vice versa, you must
disable PoE ports, and enable them after changing the power configuration.
The following counters are displayed for the device:
•
Nominal Power ------ The total amount of power in watts that the device can supply to
all the connected PDs.
•
Consumed Power------ Amount of power in watts that is currently being consumed by
the PoE ports.
80
Page 81

•
Available Power------ Nominal power in watts minus the amount of consumed power.
3. Click Apply to save the PoE properties.
Port Limit Power Mode
To configure port limit power mode:
1. Click Configuration > Port Management > PoE > Port Limit Power Mode.
The following fields are displayed for ports on which the port limit power mode is enabled:
•
PoE Status------ Enable or disable PoE on the port.
•
Power Priority Level------Port priority is low, high, or critical, for use when the power
supply is low. For example, if the power supply is running at 99% usage and port 1
is prioritized as high, but port 3 is prioritized as low, port 1 receives power and port
3 might be denied power.
•
Power Allocation Limit (mW)------ Power in milliwatts allocated to the port.
•
Max Power Allocation (mW)------Maximum amount of power permitted on this port.
•
Power Consumption (mW)------Amount of power assigned to the powered device
connected to the selected interface.
•
Class------Power class of device.
81
Page 82

•
Operational Status------ Displays whether Power Limit mode is enabled or disabled on
the port.
2. Select a port and click Edit. Enter the fields as described above.
3. Click Apply. The PoE settings for the port are written to the Running Configuration file.
Class Limit Power Mode
To configure class limit power mode:
1. Click Configuration > Port Management > PoE > Class Limit Power Mode.
82
Page 83

The following fields are displayed for ports on which the port limit power mode is enabled:
•
PoE Status------ Enable or disable PoE on the port.
•
Power Priority Level------ Port priority is low, high, or critical, for use when the power
supply is low. For example, if the power supply is running at 99% usage and port 1
is prioritized as high, but port 3 is prioritized as low, port 1 receives power and port
3 might be denied power.
•
Class------Class configured on this port. The classes are shown in the following:
Class Maximum Power Delivered by Device Port
0 15.4 watt
1 4.0 watt
2 7.0 watt
3 15.4 watt
4 30.0 watt
83
Page 84

•
Max Power Allocation (mW)------ Maximum amount of power permitted on this port.
The switch hardware may actually supply 5-10% more power than Max Power
Allocation to accommodate the power loss over the wire.
•
Power Consumption (mW)------Amount of power assigned to the powered device
connected to the selected interface.
•
Operational Status------ Whether the Class Limit mode is enabled or disabled on the
port.
2. Select a port and click Edit. Enter the fields as described above.
3. Click Apply. The PoE settings for the port are written to the Running Configuration file.
Discovery - LLDP
This section provides information for configuring Discovery. It covers the following topics:
•
Overview
•
Feature Configuration
•
LLDP MED Ports
•
LLDP Local Information
•
LLDP Neighbor Information
•
LLDP MED Network Policy
Overview
Link Layer Discovery Protocol (LLDP) is a link layer protocol for directly-connected LLDP-capable
neighbors to advertise themselves and their capabilities. LLDP enables network managers to
troubleshoot and enhance network management in multi-vendor environments. LLDP
standardizes methods for network devices to advertise themselves to other systems, and to
store discovered information.
84
Page 85

By default, the device sends an LLDP advertisement periodically to all its interfaces and
processes incoming LLDP packets as required by the protocols. In LLDP, advertisements are
encoded as TLV (Type, Length, Value) in the packet.
The information learned is stored in the data in a Management Information Base (MIB). The
network management system models the topology of the network by querying these MIB
databases.
By default, the device terminates and processes all incoming LLDP packets as required by the
protocol.
The LLDP protocol has an extension called LLDP Media Endpoint Discovery (LLDP-MED) that
provides and accepts information from media endpoint devices such as VoIP phones and video
phones. For further information about LLDP-MED, see LLDP MED Network Policy.
The following LLDP configuration notes apply:
•
LLDP can be enabled or disabled globally or per port. The LLDP capability of a port is
relevant only if LLDP is globally enabled.
•
If LLDP is globally enabled, the device filters out incoming LLDP packets from ports that
are LLDP-disabled.
•
If LLDP is globally disabled, the device can be configured to discard, VLAN- aware
flooding, or VLAN-unaware flooding of all incoming LLDP packets. VLAN-aware flooding
floods an incoming LLDP packet to the VLAN where the packet is received excluding the
ingress port. VLAN-unaware flooding floods an incoming LLDP packet to all the ports
excluding the ingress port. The default is to discard LLDP packets when LLDP is globally
disabled. You can configure the discard/flooding of incoming LLDP packets from the LLDP
Feature Configuration page.
LLDP end devices, such as IP phones, learn the voice VLAN configuration from LLDP
advertisements. By default, the device is enabled to send out LLDP advertisement based on the
voice VLAN configured at the device. Refer to the Voice VLAN (p. 118) for details.
Note--LLDP does not distinguish if a port is in a LAG. If there are multiple ports in a LAG, LLDP
transmit packets on each port without taking into account the fact that the ports are in a LAG.
The operation of LLDP is independent of the STP status of an interface.
If 802.1x port access control is enabled at an interface, the device transmits and receives LLDP
packets to and from the interface only if the interface is authenticated and authorized.
If a port is the target of mirroring, then LLDP considers it down.
85
Page 86

Note—LLDP are link layer protocols for directly-connected LLDP capable devices to advertise
themselves and their capabilities. In deployments where the LLDP- capable devices are not
directly connected and are separated with LLDP- incapable devices, the LLDP-capable devices
may be able to receive the advertisement from other device(s) only if the LLDP-incapable devices
flood the LLDP packets they receive. If the LLDP-incapable devices perform VLAN-aware
flooding, then LLDP-capable devices can hear each other only if they are in the same VLAN. An
LLDP-capable device may receive advertisements from more than one device if the LLDPincapable devices flood the LLDP packets.
Workflows
Following are examples of actions that can be performed with the LLDP feature and in a
suggested order. You can refer to the LLDP section for additional guidelines on LLDP
configuration. LLDP configuration pages are accessible under the Administration
Configuration>Port Management > Discovery LLDP menu.
1. Enter LLDP global parameters, such as LLDP Frames Handling using the LLDP Feature
Configuration page.
2. Configure LLDP per port by using LLDP Feature Configuration page. On this page,
interfaces can be configured to receive/transmit LLDP PDUs, send SNMP notifications,
specify which TLVs to advertise, and advertise the device's management address.
3. Create LLDP MED network policies by using the LLDP MED Network Policy page.
4. Associate LLDP MED network policies and the optional LLDP-MED TLVs to the desired
interfaces by using the LLDP MED Port Settings page.
Feature Configuration
The Feature Configuration Page enables configuration of LLDP global parameters and entering
the TLVs that are sent in the LLDP PDU.
The LLDP-MED TLVs to be advertised can be selected in the LLDP MED Port Settings page, and
the management address TLV of the device may be configured to be advertised.
To configure the LLDP port settings:
1. Click Configuration > Port Mangement > Discovery – LLDP > Feature Configuration.
86
Page 87

The following fields are displayed (only fields that do not appear in the Edit page are
described):
•
Interface------The port to edit.
•
LLDP MED Status------Enabled or disabled.
•
Number of neighbors------Number of neighbors discovered.
•
Neighbor Capability------ Displays the primary functions of the neighbor; for example:
Bridge or Router.
•
Local PoE------Local PoE information advertised.
-
power priority------ Port power priority
-
power value------Port power value
•
Neighbor PoE------PoE information advertised by the neighbor.
-
power priority------ Port power priority
-
power value------Port power value
2. Enter the following fields.
•
LLDP Status------Select to enable LLDP on the device (enabled by default).
•
LLDP Frame Handling------ If LLDP is not enabled, select the action to be taken if a
packet that matches the selected criteria is received.
-
Filtering------ Delete the packet.
-
Flooding------ Forward the packet to all VLAN members.
3. Select a port and click Edit.
87
Page 88

This page provides the following fields:
•
Port------Select the port to edit.
•
LLDP Status------Select the LLDP publishing option for the port. The values are the
following:
-
Tx Only------Publishes but does not discover.
-
Rx Only------ Discovers but does not publish.
-
Tx & Rx------ Publishes and discovers.
-
Disable------Indicates that LLDP is disabled on the port.
•
Management Address TLV------ Select one of the following ways to advertise the IP
management address of the device:
-
Auto Advertise------Specifies that the software automatically chooses a
management address to advertise from all the IP addresses of the device.
In case of multiple IP addresses, the software chooses the lowest IP
address among the dynamic IP addresses. If there are no dynamic
addresses, the software chooses the lowest IP address among the static IP
addresses.
-
Manual Advertise------Select this option and the management IP address to
be advertised.
-
None------Do not advertise the management IP address.
•
Management IP Address------ If Manual Advertise was selected, select the
Management IP address from the addresses provided.
•
Available Optional TLVs------ Information to be published by the device
88
Page 89

•
Advertize Optional TLVs------ Select the information to be published by the device by
moving the TLV from the Available Optional TLVs list. The available TLVs contain
the following information:
-
Port Description------Information about the port, including manufacturer,
product name and hardware/software version.
-
System Name------System's assigned name (in alpha-numeric format). The
value equals the sysName object.
-
System Description------ Description of the network entity (in alpha- numeric
format). This includes the system's name and versions of the hardware,
operating system, and networking software supported by the device. The
value equals the sysDescr object.
-
System Capabilities------Primary functions of the device, and whether or not
these functions are enabled on the device. The capabilities are indicated by
two octets. Bits 0 through 7 indicate Other, Repeater, Bridge, WLAN AP,
Router, Telephone, DOCSIS cable device, and station respectively. Bits 8
through 15 are reserved.
-
802.3 MAC-PHY------Duplex and bit rate capability and the current duplex
and bit rate settings of the sending device. It also indicates whether the
current settings are due to auto-negotiation or manual configuration.
-
802.3 Link Aggregation------ Whether the link (associated with the port on
which the LLDP PDU is transmitted) can be aggregated. It also indicates
whether the link is currently aggregated, and if so, provides the aggregated
port identifier.
-
802.3 Maximum Frame------ Maximum frame size capability of the MAC/PHY
Management Address TLV------Select one of the following ways to advertise
the IP management address of the device:
4. Enter the relevant information, and click Apply. The port settings are written to the
Running Configuration file.
LLDP MED Ports
The LLDP MED Ports page enables the selection of the LLDP-MED TLVs and/or the network
policies to be included in the outgoing LLDP advertisement for the desired interfaces. Network
Policies are configured using the LLDP MED Network Policy page.
89
Page 90

To configure LLDP MED on each port:
1. Click Configuration > Port Management > Discovery – LLDP > LLDP MED Ports.
This page displays the following LLDP MED settings for all ports (only fields not described
in the Edit page are listed):
•
Location------Whether Location TLV is transmitted.
•
PoE------ Whether POE-PSE TLV is transmitted.
•
Inventory------ Whether Inventory TLV is transmitted.
2. The message at the top of the page indicates whether the generation of the LLDP MED
Network Policy for the voice application is automatic or not (see LLDP Overview). Click on
the link to change the mode.
3. To associate additional LLDP MED TLV and/or one or more user-defined LLDP MED
Network Policies to a port, select it, and click Edit.
4. Enter the parameters:
•
Port------Select the interface to configure.
•
LLDP MED Status------ Enable/disable LLDP MED on this port.
•
Available Optional TLVs------ Select the TLVs that can be published by the device by
moving them from the Advertise Optional TLVs list.
90
Page 91

•
Available Network Policies------Select the LLDP MED policies to be published by
LLDP by moving them from the Available Network Policies list. These were created
in the LLDP MED Network Policy page. To include one or more user-defined
network polices in the advertisement, you must also select Network Policy from
the Available Optional TLVs.
Note—The following fields must be entered in hexadecimal characters in the exact data
format that is defined in the LLDP-MED standard (ANSI-TIA1057_final_for_publication.pdf):
•
Location Coordinate------Enter the coordinate location to be published by LLDP.
•
Location Civic Address------Enter the civic address to be published by LLDP.
•
Location (ECS) ELIN------ Enter the Emergency Call Service (ECS) ELIN location to be
published by LLDP.
5. Click Apply. The LLDP MED port settings are written to the Running Configuration file.
LLDP Local Information
To view the LLDP local port status advertised on a port:
1. Click Configuration > Port Management Discovery - LLDP > LLDP Local Information.
2. Select the desired port from the Port list.
This page displays the following groups of fields (the actual fields displayed depend on the
optional TLVs selected to be advertised):
91
Page 92

•
Global
-
-
-
Chassis ID Subtype------ Type of chassis ID. (For example, the MAC address.)
Chassis ID------Identifier of chassis. Where the chassis ID subtype is a MAC
address, the MAC address of the device appears.
System Name------Name of device.
-
System Description------ Description of the device (in alpha-numeric format).
-
Supported System Capabilities------ Primary functions of the device, such as
Bridge, WLAN AP, or Router.
-
Enabled System Capabilities------Primary enabled function(s) of the device.
92
Page 93

-
Port ID Subtype------Type of the port identifier that is shown.
-
Port ID------Identifier of port.
-
Port Description------Information about the port, including manufacturer,
product name and hardware/software version.
•
Management Address
Displays the table of addresses of the local LLDP agent. Other remote managers
can use this address to obtain information related to the local device. The address
consists of the following elements:
-
Address Subtype------Type of management IP address that is listed in the
-
Management Address field; for example, IPv4.
-
Address------ Returned address most appropriate for management use.
-
Interface Subtype------ Numbering method used for defining the interface
number.
-
Interface Number------Specific interface associated with this management
address.
•
MED Information
-
Capabilities Supported------ MED capabilities supported on the port.
-
Current Capabilities------ MED capabilities enabled on the port.
-
Device Class------ LLDP-MED endpoint device class. The possible device
classes are:
-
Endpoint Class 1------Generic endpoint class, offering basic LLDP services.
-
Endpoint Class 2------Media endpoint class, offering media streaming
capabilities, as well as all Class 1 features.
-
Endpoint Class 3------Communications device class, offering all Class 1 and
Class 2 features plus location, 911, Layer 2 device support, and device
information management capabilities.
-
PoE Device Type------ Port PoE type; for example, powered.
-
PoE Power Source------Port power source.
-
PoE Power Priority------ Port power priority.
-
PoE Power Value------ Port power value.
-
Hardware Revision------ Hardware version.
-
Firmware Revision------Firmware version.
-
Software Revision------Software version.
93
Page 94

-
Serial Number------ Device serial number.
-
Manufacturer Name------Device manufacturer name.
-
Model Name------ Device model name.
-
Asset ID------ Asset ID.
•
Location Information
-
Civic------Street address.
-
Coordinates------ Map coordinates: latitude, longitude, and altitude.
-
ECS ELIN------ Emergency Call Service (ECS) Emergency Location
Identification Number (ELIN).
• Network Policy
-
Application Type------Network policy application type; for example, Voice.
-
VLAN ID------ VLAN ID for which the network policy is defined.
-
VLAN Type------VLAN type for which the network policy is defined. The
possible field values are the following:
Tagged------ Indicates the network policy is defined for tagged VLANs.
Untagged------Indicates the network policy is defined for untagged
VLANs.
-
User Priority------Network policy user priority.
-
DSCP------Network policy DSCP.
LLDP Neighbor Information
The LLDP Neighbor Information page contains information that was received from neighboring
devices.
After timeout (based on the value received from the neighbor Time To Live TLV during which no
LLDP PDU was received from a neighbor), the information is deleted.
To view the LLDP neighbors information:
1. Click Configuration>Port Management > Discovery - LLDP > LLDP Neighbor Information.
94
Page 95

This page contains the following fields:
•
Port------Number of the local port to which the neighbor is connected.
•
Global
-
Local Port------ Port number.
-
MSAP Entry------ Device Media Service Access Point (MSAP) entry number.
-
Basic Details
-
Chassis ID Subtype------Type of chassis ID (for example, MAC address).
-
Chassis ID------Identifier of the 802 LAN neighboring device chassis.
-
Port ID Subtype------ Type of the port identifier that is shown.
-
Port ID------Identifier of port.
-
Port Description------ Information about the port, including manufacturer,
product name and hardware/software version.
-
System Name------ Name of system that is published.
-
System Description------ Description of the network entity (in alpha-numeric
format). This includes the system name and versions of the hardware,
operating system, and networking software supported by the device. The
value equals the sysDescr object.
-
Supported System Capabilities------ Primary functions of the device. The
capabilities are indicated by two octets. Bits 0 through 7 indicate Other,
Repeater, Bridge, WLAN AP, Router, Telephone, DOCSIS cable device, and
station, respectively. Bits 8 through 15 are reserved.
-
Enabled System Capabilities------Primary enabled function(s) of the device.
•
Management Address
95
Page 96

-
Address Subtype------Managed address subtype; for example, MAC or IPv4.
-
Address------ Managed address.
-
Interface Subtype------Port subtype.
-
Interface Number------Port number.
•
MED Information
-
Capabilities Supported------ MED capabilities enabled on the port.
-
Current Capabilities------ MED TLVs advertised by the port.
-
Device Class------LLDP-MED endpoint device class. The possible device
classes are:
-
Endpoint Class 1------Indicates a generic endpoint class, offering basic LLDP
services.
-
Endpoint Class 2------Indicates a media endpoint class, offering media
streaming capabilities as well as all Class 1 features.
-
Endpoint Class 3------Indicates a communications device class, offering all
Class 1 and Class 2 features plus location, 911, Layer 2 switch support
and device information management capabilities.
-
PoE Device Type------ Port PoE type, for example, powered.
-
PoE Power Source------Port’s power source.
-
PoE Power Priority------ Port’s power priority.
-
PoE Power Value------ Port’s power value.
-
Hardware Revision - -- Hardware version.
-
Firmware Revision------Firmware version.
-
Software Revision------Software version.
-
Serial Number------Device serial number.
-
Manufacturer Name------ Device manufacturer name.
-
Model Name------ Device model name.
-
Asset ID------Asset ID.
•
Location Information
Enter the following data structures in hexadecimal as described in section 10.2.4
of the ANSI-TIA-1057 standard:
-
Civic------Civic or street address.
-
Coordinates------Location map coordinates------ latitude, longitude, and altitude.
96
Page 97

-
ECS ELIN------ Device’s Emergency Call Service (ECS) Emergency Location
Identification Number (ELIN).
-
Unknown------ Unknown location information.
•
Network Policy
-
Application Type------Network policy application type, for example, Voice.
-
VLAN ID------VLAN ID for which the network policy is defined.
-
VLAN Type------VLAN type, Tagged or Untagged, for which the network
policy is defined.
-
User Priority------ Network policy user priority.
-
DSCP------Network policy DSCP.
LLDP MED Network Policy
LLDP Media Endpoint Discovery (LLDP-MED) is an extension of LLDP that provides the following
additional capabilities to support media endpoint devices:
•
Enables the advertisement and discovery of network polices for real-time applications
such as voice and/or video.
•
Enables discovery of the device location to allow creation of location databases and, in the
case of Voice over Internet Protocol (VoIP), Emergency Call Service (E-911) by using IP
Phone location information.
LLDP MED sends Troubleshooting information alerts to network managers upon:
•
Port speed and duplex mode conflicts
•
QoS policy misconfigurations
Setting LLDP MED Network Policy
An LLDP-MED network policy is a related set of configuration settings for a specific real-time
application such as voice, or video. A network policy, if configured, can be included in the outgoing
LLDP packets to the attached LLDP media endpoint device. The media endpoint device must send
its traffic as specified in the network policy it receives. For example, a policy can be created for
VoIP traffic that instructs VoIP phone to:
•
Send voice traffic on VLAN 10 as tagged packet and with 802.1p priority 5.
•
Send voice traffic with DSCP 46.
Network policies are associated with ports by using the LLDP MED Port Settings page. An
administrator can manually configure one or more network policies and the interfaces where the
policies are to be sent. It is the administrator's responsibility to manually create the VLANs and
their port memberships according to the network policies and their associated interfaces.
97
Page 98

In addition, an administrator can instruct the device to automatically generate and advertise a
network policy for voice application based on the voice VLAN maintained by the device. Refer to
the Auto Voice VLAN section for details on how the device maintains its voice VLAN.
To define an LLDP MED network policy:
1. Click Configuration > Port Management > Discovery – LLDP > LLDP MED Network.
This page contains previously-created network policies.
2. When Network Policy for Voice Application is enabled, the device automatically generates
and advertises a network policy with the current voice VLAN configuration. Go to Voice
VLAN > Feature Configuration page to configure the voice VLAN.
3. Click Apply to add this setting to the Running Configuration file.
4. To define a new policy, click Add.
5. Enter the values:
•
Network Policy Number------ Select the number of the policy to be created.
•
Application------Select the type of application (type of traffic) for which the network
policy is being defined.
•
VLAN ID------Enter the VLAN ID to which the traffic must be sent.
•
VLAN Tag------ Select whether the traffic is Tagged or Untagged.
•
Layer 2 Priority------Select the traffic priority applied to traffic defined by this
network policy. This is the CoS value.
•
DSCP Value------ Select the DSCP value to associate with application data sent by
neighbors. This informs them how they must mark the application traffic they send
to the device.
6. Click Apply. The network policy is defined.
98
Page 99

Note—You must manually configure the interfaces to include the desired manually-defined
network policies for the outgoing LLDP packets using the LLDP MED Port Settings.
99
Page 100

Chapter 6 - VLAN Management
This section covers the following topics:
Overview
VLANs
Interfaces
VLAN Memberships
GVRP
VLAN Groups
Voice VLAN
Overview
A VLAN is a logical group of ports that enables devices associated with it to communicate with
each other over the Ethernet MAC layer, regardless of the physical LAN segment of the bridged
network to which they are connected.
VLAN Description
Each VLAN is configured with a unique VLAN ID (VID) with a value from 1 to 4094. A port on a
device in a bridged network is a member of a VLAN if it can send data to and receive data from the
VLAN. A port is an untagged member of a VLAN if all packets destined for that port into the VLAN
have no VLAN tag. A port is a tagged member of a VLAN if all packets destined for that port into
the VLAN have a VLAN tag. A port can be a member of only one untagged VLAN but can be a
member of multiple tagged VLANs.
A port in VLAN Access mode can be part of only one VLAN. If it is in General or Trunk mode, the
port can be part of one or more VLANs.
VLANs address security and scalability issues. Traffic from a VLAN stays within the VLAN, and
terminates at devices in the VLAN. It also eases network configuration by logically connecting
devices without physically relocating those devices.
If a frame is VLAN-tagged, a four-byte VLAN tag is added to each Ethernet frame. The tag
contains a VLAN ID between 1 and 4094, and a VLAN Priority Tag (VPT) between 0 and 7. See
Quality of Service for details about VPT.
100
 Loading...