

LeCroy
Digital Oscilloscopes
Get the Complete Picture
Quick Reference Guide
QUICKSTART TO SIGNAL VIEWING
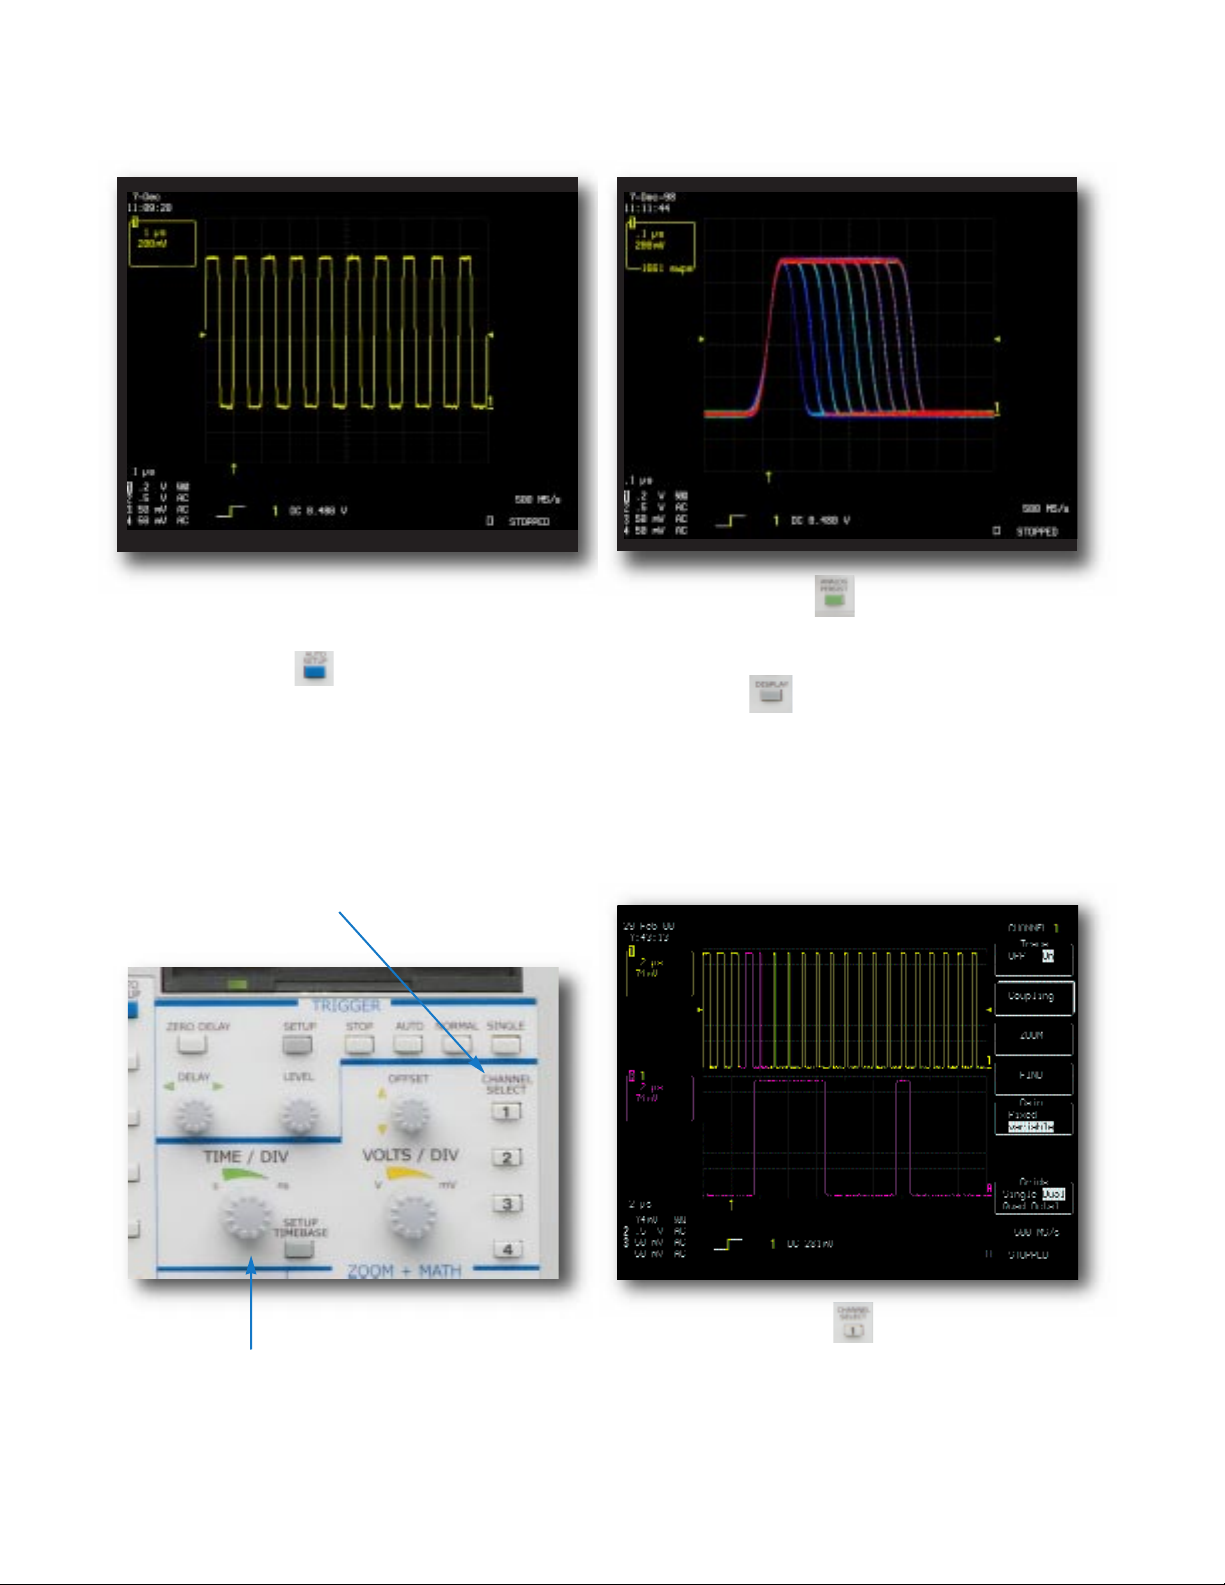
Quickly display a signal View with Analog Persistence
1. Connect your signal.When you use a probe,
Probus automatically sets the vertical scale factor.
2.Press
Press a Channel Select button and use the control knobs to adjust
that channel’s Volts/Div and offset settings. Press twice to toggle the
channel between on and off.
Autosetup , and view.
Press Analog Persist to access the power of Analog
Persistence.The three-dimensional view shows variations in
a waveform as intensity or color-graded variations.
Press Display to customize the display.
Quickly zoom on signal details
Adjust the Time/Div and SMARTMemory automatically assures the
maximum resolution for each timebase setting.
Press Setup Timebase to setup the scope’s timebase and acquisition system.
1. Use Channel Select for signal selection.
(TIP - choose a grid style - single,dual,quad,or octal
for maximum signal fidelity.)
2. Select ZOOM and view - Use the zoom controls to
magnify and inspect.
QUICKLY MEASURE AND ANALYZE
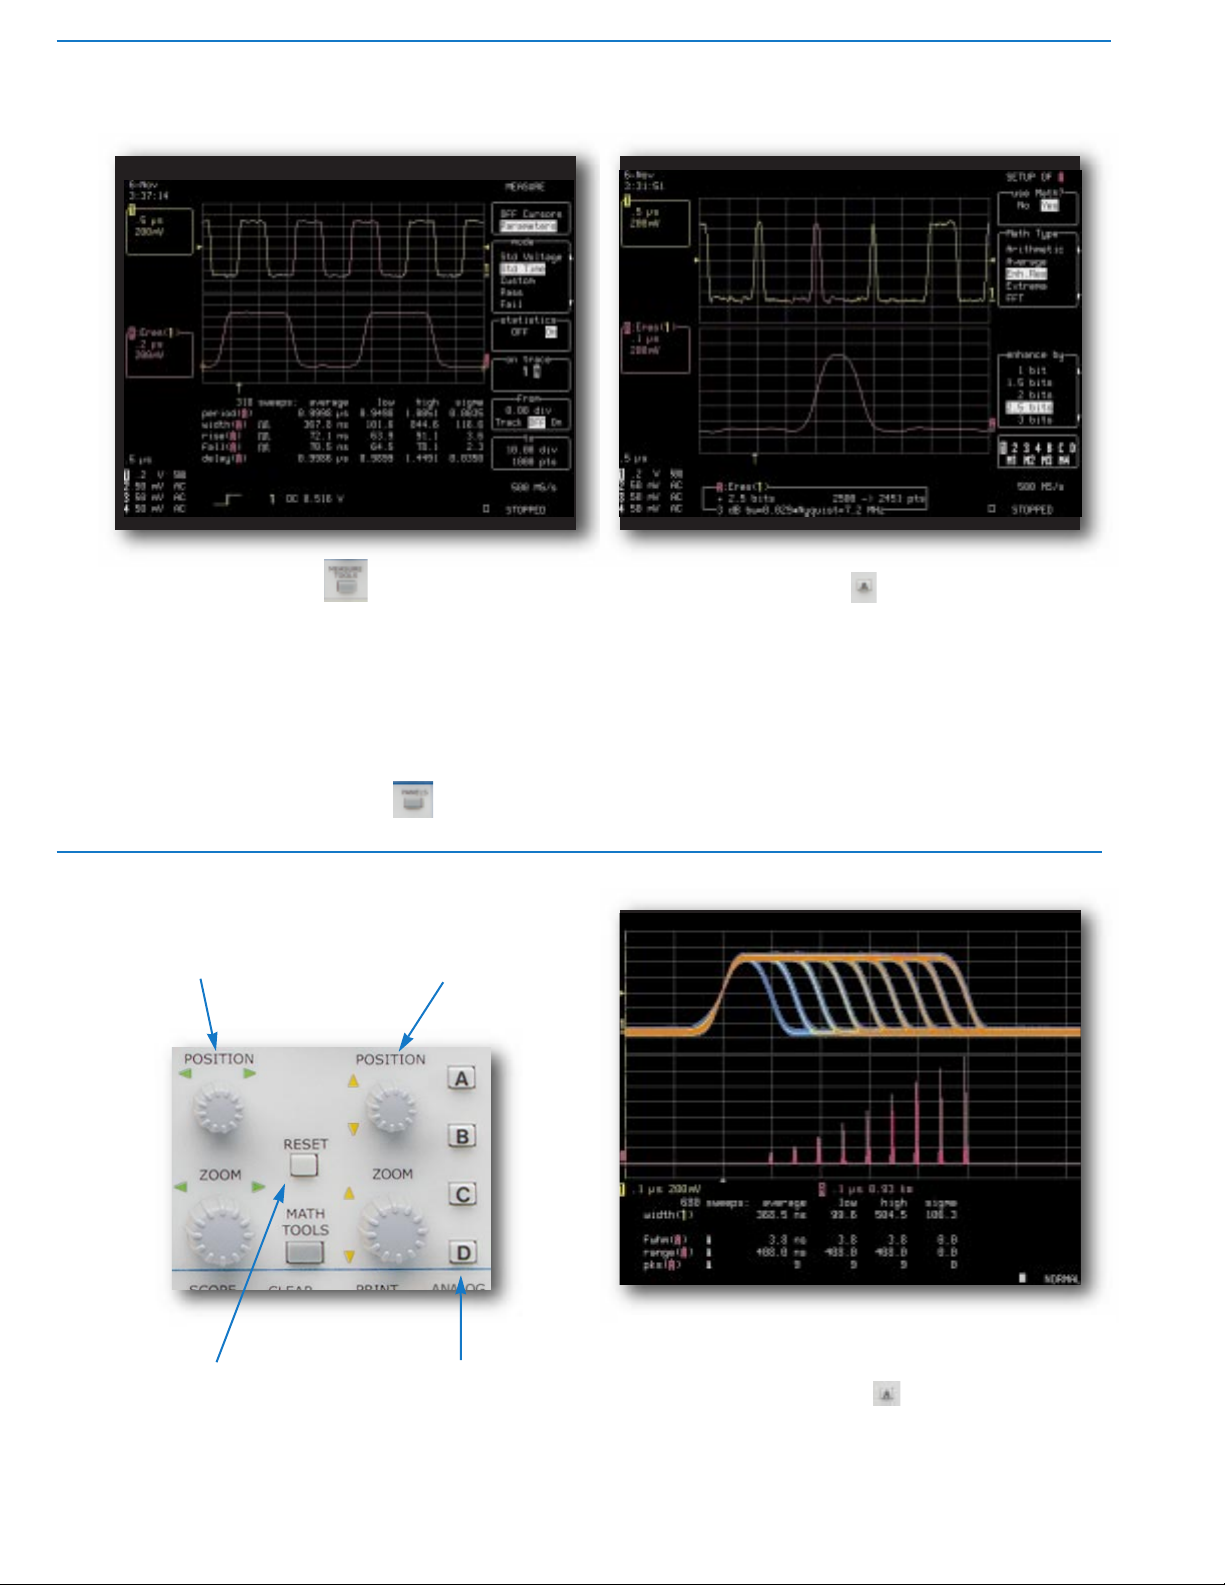
Measure with parameters and cursors
Press Measure T ools to choose measurements with cursors or automatic parameter measurements with statistics for multiple sweeps.
1. Select standard Time or Voltage measurements.
2. Turn parameter statistics on and off.
3. Select Custom to establish your own set of
measurements.Press Panels to save for later.
Waveform math for enhanced resolution
Press button A, B, C, or D to setup a zoom trace for
math processing.
1. Select Setup
2. Select Use Math
3. Choose a function to set up.
Math and analysis can be performed on any trace.The
result is displayed on trace A,B,C,or D.
Rotary controls adjust the horizontal position and magnification of the selected zoom trace.
Press to reset the zoom
magnification to 1:1.Also used
to reset math and analysis
functions.
Rotary controls adjust the vertical position and magnification
of the selected zoom trace.
Buttons A, B, C, D, select a
zoom trace for setup and control. Press twice to toggle
between on and off.
Parameter analysis with histograms
Histograms are math functions which are displayed on
traces A, B,C,or D.
1. Press button A, B, C, or D.
2. Select Setup
3. Select Use Math and select a Parameter.
Histograms show the graphical result of multiple measure-
ments.Histogram parameters quantify the graphical result.

MATH-MEASUREMENTS-ANALYSIS
STANDARD MATH IN ALL WAVERUNNER OSCILLOSCOPES
Arithmetic: Sum (add),Difference (subtract), Product (multiply), Ratio
(divide).
Averaging: Summed,or linear,average of up to 1000 sweeps.
Extrema: Display trace envelope,floor,and roof.
FFT: Fast Fourier Transform to 50 000 points; Power Spectrum, Phase,
Magnitude; FFT Windows include Flat Top, Rectangular, Blackman
Harris,Von Hann, Hamming.
Other Functions: Identity, Negation (Invert), Sine x/x.
Resample: To deskew as well as resample signals.
Rescale: Assign new physical units or rescale.
ERES: Enhanced Resolution for up to 11 bits of vertical resolution.
Trending:Plot a parameter versus time or versus another parameter.
STANDARD MEASUREMENTS IN ALL WAVERUNNER
OSCILLOSCOPES
ampl Amplitude
area Integral of waveform data
base Lower of two most probable states
cycles Number of cycles of a periodic waveform
cmean Cyclic mean:The average of waveform data
Crms Cyclic root mean square
delay Time from trigger to transition
Ddly Time between 50% level of two sources
duty Duty cycle:Width as percentage of period
f80-20% Fall time from 80-20%
fall Fall time from 90-10%
freq Frequency
maximum The highest point in waveform
mean Average of data for time domain waveform
minimum Measures the lowest point in a waveform
over- Overshoot negative
over+ Overshoot positive
period Period of a cyclic signal
pkpk Peak-to-peak
phase Phase difference between signal analyzed and signal
used as reference
r20-80% Rise time from 20% to 80%
rise Rise time from 10% to 90%
rms Root Mean Square of data between the cursors
top Higher of two most probable states
width Width of cyclic signal: all waveform pulses are averaged
then displayed
WAVEANALYZER OPTION (WAVA)
All standard math and measurement tools plus...
Extended Averaging
Summed, or linear,Average of up to one million waveforms; Continuous
Average.
Extended FFT
Fast Fourier Transform to one million points;FFT Average;Power Averaging,
Power Density, Real, Real + Imaginary.
Histograms
Graphical analysis with Histograms and Histogram Analysis Parameters.
Math Functions*
Absolute Value, Derivative, Exp (base e), Exp (base 10), Integral, Log (base
e), Log (base 10), Reciprocal (1/x), Square, Square Root.
Parameter Measurements*
Cmedian Cyclic median: average of base and top values over
an integral number of cycles.
Csdev Cyclic standard deviation.
Dc2d± D clock to data ± (setup and hold time)
Dt@lv The transition time between selected levels on a
single trace or between two traces.
first Indicates value of horizontal axis at left cursor.
last Time from trigger to last (rightmost) cursor.
median The average of base and top values.
r@level Rise time between selected voltage levels.
Points Number of points in the waveform between
the cursors.
sdev Standard deviation of data between the cursors.
t@level Time from trigger (t=0) to crossing at a level.
f@level Fall time between selected voltage levels.
Dur The time between triggers in segment or other
history modes.
* Also included with EMM
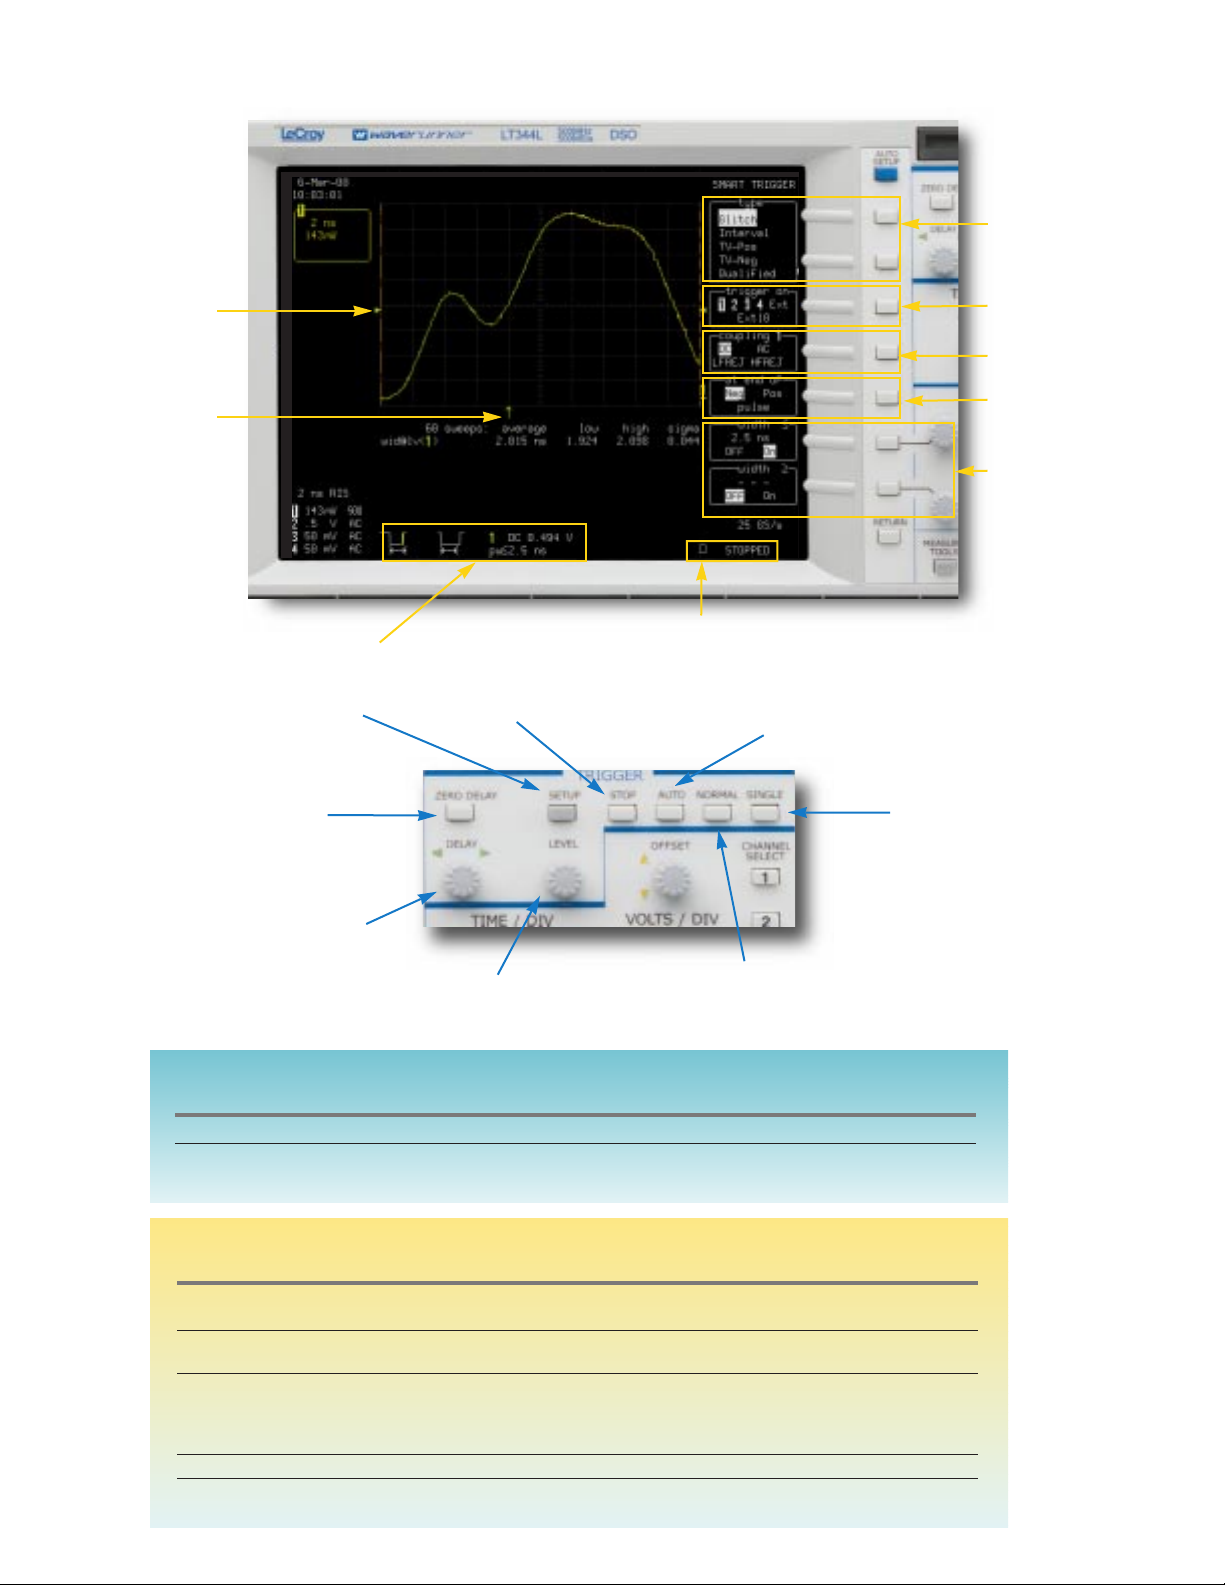
TRIGGERING
Select trigger
type - Glitch
Trigger level
indicator
Trigger time
indicator
Trigger icons indicate the type and
characteristics of the trigger in use.
Setup – Accesses the
trigger setup menus.
Zero Delay – Presets the
trigger delay to zero.
Stop - Prevents triggering
the scope.
Select trigger
source
Select coupling
Select pulse type
Setup width
conditions
Indicator flashes when a trigger
occurs and text indicates status.
Auto – Triggers even if a signal
is not present.
Single – Arms the trigger.The
scope triggers once when the
trigger conditions are met and
displays the signal.
Delay – Selects a pre- or posttrigger delay.Use to view the
signal events prior to the trigger
point.
Sets the trigger level.
Normal – Triggers whenever the
trigger conditions are met.
WAVERUNNER BASIC TRIGGERS
Name Description
Edge Select positive or negative slope and holdoff by time or events.
Window Set a window around the trigger level. Trigger whenever the signal crosses outside the
window in either direction.
WAVERUNNER SMART TRIGGERS
Name Description
®
Glitch Triggers at end of positive or negative pulses down to 2 ns.
Trigger when pulse is > or < or within a range (< and >) or outside a range.
Interval Triggers on intervals between positive or negative edges.
Trigger when interval is > or < or within a range (< and >) or outside a range.
Qualified Qualify by edge or state. Triggers on one channel after a defined state or edge has occurred
on another channel.
Set a time that the second must occur within to trigger or a wait time or number events
before triggering.
Dropout Triggers if the input signal drops out for longer than selected time.
TV Triggers on line (up to 1500) in odd or even fields for PAL, NTSC, or non-standard video.
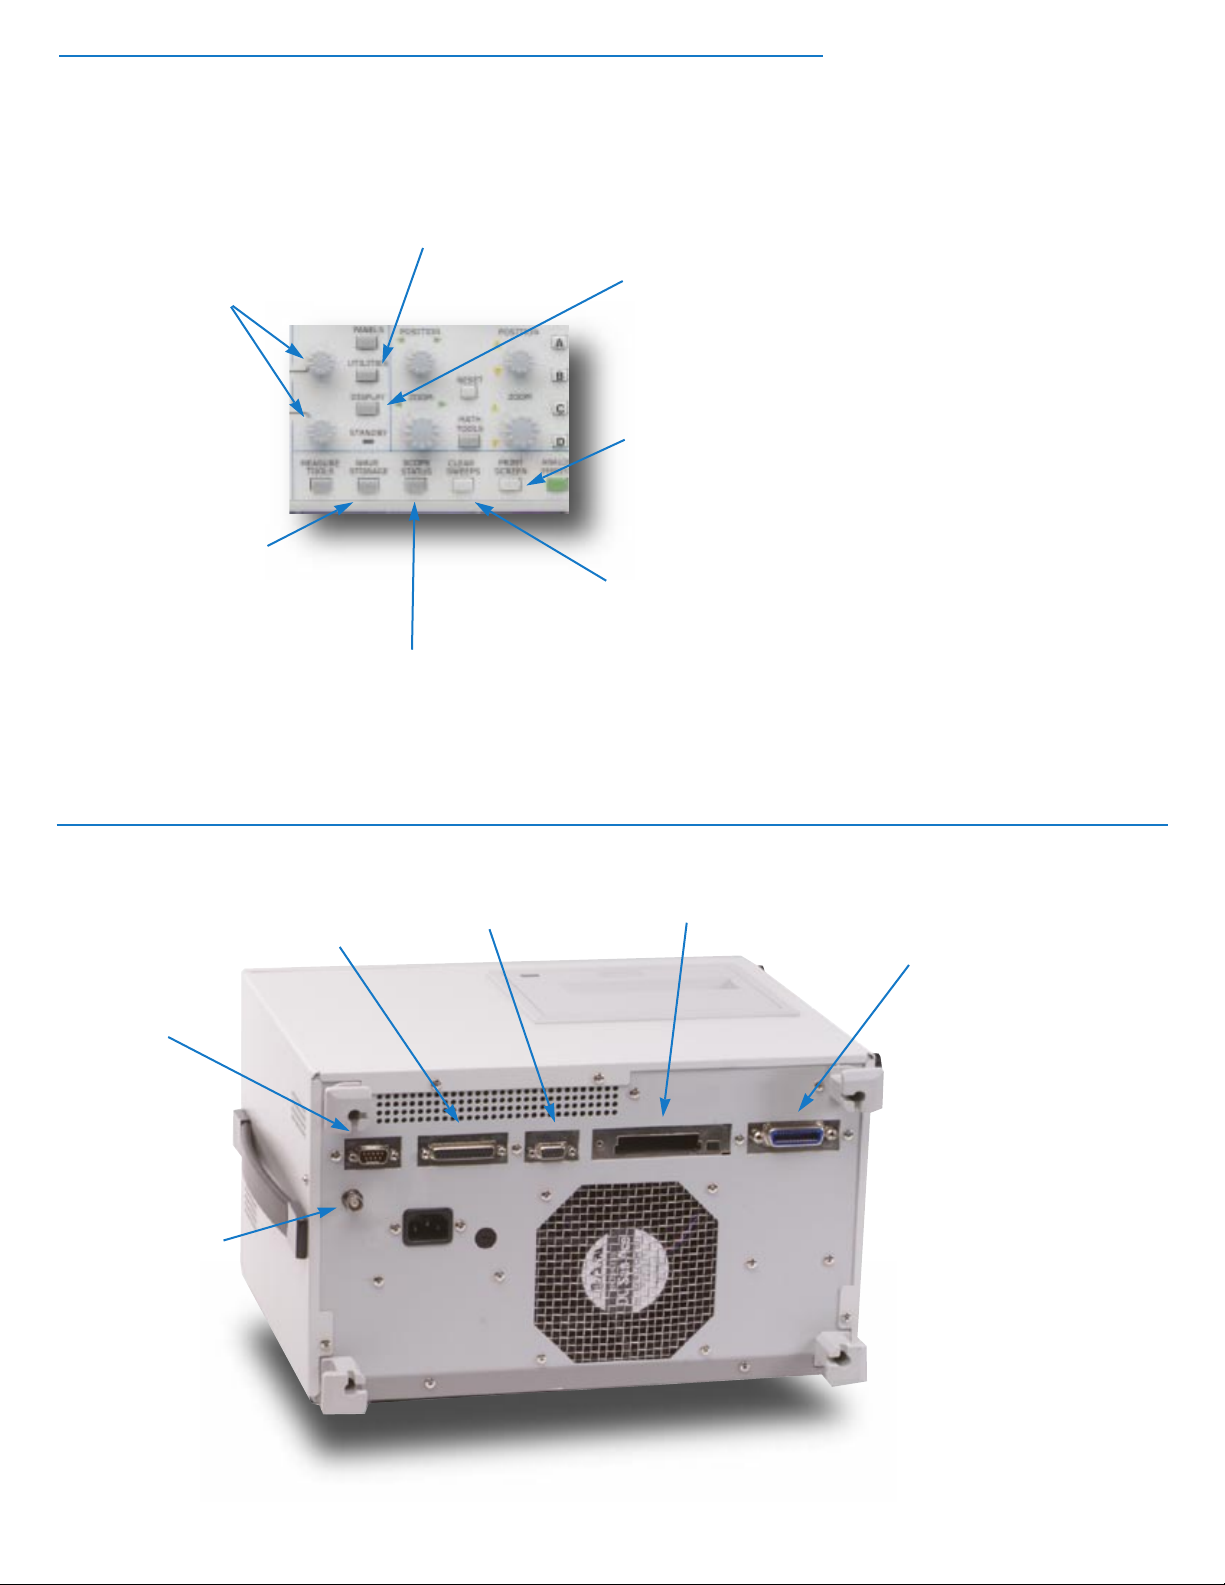
GENERAL CONTROLS
Utilities – Functions include setup of hardcopy
Two rotary controls are
multipurpose,including
menu item selection, cursor
movement, and setting
memory length.
printing, Cal Out signal, GPIB,and I/O interfaces, as
well as other functions.
Setup display characteristics and
functions,including color schemes,
and persistence conditions.Toggling
Analog Persist on shows a second
menu.
Sales and Service
Throughout the World
Corporate Headquarters
700 Chestnut Ridge Road
Chestnut Ridge, NY 10977
USA
See the LeCroy web site for the latest
applications notes, lab briefs, free software, and hypertext manuals.
http://www.lecroy.com
Store and recall waveforms
to/from internal scope memory,
floppy disk, or PC cards.
Check the status of the scope’s systems,
and setup conditions; add software options,
and free up memory.
REAR PANEL
Centronics Port
VGA Port
Print to the hardcopy device
setup in the utilities menu (hardcopy selection).
Clear data acquired in persistence
displays,sweep averaging, and
measurement statistics.
PC Card Slot (optional)
Copyright © February 1999
LeCroy, ProBus,
SmartMemory and
SmartTrigger are registered
trademarks of LeCroy
Corporation.
Waverunner, WaveAnalyzer
and Analog Persistence are
trademarks of LeCroy
Corporation.
Centronics is a registered
trademark of Data Computer
Corp.
All rights reserved.
Information in this
publication supersedes all
earlier versions.
Specifications subject to
change without notice.
GPIB Port
LTXXX-QRG-E
REV-A
RS-232-C
Rear BNC
Signal Output
Trigger Ready
Trigger Out
Pass/Fail
 Loading...