


Manual Supplement
Agilent Technologies
For
8753ET/ES Network Analyzers
Documentation Set (08753-90470)
and
8753ES Option 011
Documentation Set (08753-90477)
Updates for Network Analyzers with Firmware Revision 7.66
Part Number 08753-90534
Printed in USA
July 2000
© Copyright 2000 Agilent Technologies

Notice
The information contained in this document is subject to change without notice.
Agilent Technologies makes no warranty of any kind with regard to this material,
including but not limited to, the implied warranties of merchantability and fitness for a
particular purpose. Agilent Technologies shall not be liable for errors contained herein or
for incidentalor consequential damages in connection with the furnishing, performance,or
use of this material.
Certification
Agilent Technologies certifies that this product met its published specifications at the time
of shipment from the factory. Agilent Technologies further certifies that its calibration
measurements are traceable to the United States National Institute of Standards and
Technology, to the extent allowed by the Institute's calibration facility, and to the
calibration facilities of other International Standards Organization members.
Regulatory and Warranty Information
The regulatory and warranty information is located in Chapter 8, “Safety and Regulatory
Information” of your 8753ET or 8753ES network analyzer user’s guide.
Assistance
Product maintenance agreements and other customer assistance agreements are available
for Agilent Technologies products. For any assistance, contact your nearest Agilent
Technologies sales or service office. See Table 8-1 of your 8753ET or 8753ES network
analyzer user’s guide for the nearest office.
ii

Manuals that This Document Supplements
SOFTKEY
This manual supplement provides documentation updates for all 8753ET and 8753ES
network analyzers with firmware revision of 7.66 and documentation printed prior to
July 2000.
• In the 8753ET/ES Network Analyzers Documentation Set (part number 08753-90470),
this document supplements the following manuals:
— 8753ET and 8753ES Network Analyzers User’s Guide (part number 08753-90472)
— 8753ET and 8753ES Network Analyzers Reference Guide (part number
08753-90473)
— 8719ET/ES, 8720ET/ES, 8722ET/ES, and 8753ET/ES Network Analyzers
Programmer’s Guide (part number 08753-90475)
• In the 8753ES Option 011 Network Analyzer Documentation Set (part number
08753-90477), this document supplements the following manuals:
— 8753ES Option 011 Network Analyzer User’s Guide (part number 08753-90479)
— 8753ES Option 011 Network Analyzer Reference Guide (part number 08753-90480)
— 8719ET/ES, 8720ET/ES, 8722ET/ES, and 8753ET/ES Network Analyzers
Programmer’s Guide (part number 08753-90475)
The information within this manual supplements has been included in manuals printed
during or after July 2000.
How to Use This Guide
This guide uses the following conventions:
Front-Panel Key
Screen Text This represents text displayed on the instrument’s screen.
This represents a key physically located on the
instrument.
This represents a “softkey,” a key whose label is
determined by the instrument’s firmware.
iii

Documentation Map
The Installation and Quick Start Guide provides procedures for
installing, configuring, and verifying the operation of the analyzer. It
also will help you familiarize yourself with the basic operation of the
analyzer.
The User’s Guide shows how to make measurements, explains
commonly-used features, and tells you how to get the most
performance from your analyzer.
The Reference Guide provides reference information, such as
specifications, menu maps, and key definitions.
The Programmer’s Guide provides general GPIB programming
information, a command reference, and example programs. The
Programmer’s Guide contains a CD-ROM with example programs.
iv
The CD-ROM provides the Installation and Quick Start Guide, the
User’s Guide, the Reference Guide, and the Programmer’s Guide in
PDF format for viewingor printing from a PC. This supplement isnot
included on the CD-ROM.
The Service Guide provides information on calibrating,
troubleshooting,and servicing your analyzer. The Service Guideis not
part of a standard shipment and is available only as Option 0BW, or
by ordering part number 08753-90484 (8753ES without Option 011
and 8753ET) or by ordering part number 08753-90485 (8753ES with
Option 011). A CD-ROM with the Service Guide in PDF format is
included for viewing or printing from a PC.

Contents
1. Supplement for the User’s Guide
Using This Chapter. . . . . . . . . . . . . . . . . . . . . . . . . . . . . . . . . . . . . . . . . . . . . . . . . . . . . . . . . . 1-2
Using Limit Lines to Test a Device. . . . . . . . . . . . . . . . . . . . . . . . . . . . . . . . . . . . . . . . . . . . . .1-3
Creating Flat Limit Lines . . . . . . . . . . . . . . . . . . . . . . . . . . . . . . . . . . . . . . . . . . . . . . . . . . . 1-3
Creating a Sloping Limit Line . . . . . . . . . . . . . . . . . . . . . . . . . . . . . . . . . . . . . . . . . . . . . . . 1-3
Creating Single Point Limits . . . . . . . . . . . . . . . . . . . . . . . . . . . . . . . . . . . . . . . . . . . . . . . . 1-3
Editing Limit Segments . . . . . . . . . . . . . . . . . . . . . . . . . . . . . . . . . . . . . . . . . . . . . . . . . . . . 1-3
Running a Limit Test . . . . . . . . . . . . . . . . . . . . . . . . . . . . . . . . . . . . . . . . . . . . . . . . . . . . . . 1-4
Offsetting Limit Lines . . . . . . . . . . . . . . . . . . . . . . . . . . . . . . . . . . . . . . . . . . . . . . . . . . . . . . 1-4
Using Test Sequencing to Test a Device. . . . . . . . . . . . . . . . . . . . . . . . . . . . . . . . . . . . . . . . . . 1-5
Limit Test Example Sequence . . . . . . . . . . . . . . . . . . . . . . . . . . . . . . . . . . . . . . . . . . . . . . . 1-5
Using Ripple Limits to Test a Device. . . . . . . . . . . . . . . . . . . . . . . . . . . . . . . . . . . . . . . . . . . . 1-7
Setting Up the List of Ripple Limits to Test. . . . . . . . . . . . . . . . . . . . . . . . . . . . . . . . . . . . . 1-7
Editing Ripple Test Limits. . . . . . . . . . . . . . . . . . . . . . . . . . . . . . . . . . . . . . . . . . . . . . . . . . 1-10
Running the Ripple Test . . . . . . . . . . . . . . . . . . . . . . . . . . . . . . . . . . . . . . . . . . . . . . . . . . . 1-12
Using Bandwidth Limits to Test a Bandpass Filter . . . . . . . . . . . . . . . . . . . . . . . . . . . . . . .1-17
Setting Up Bandwidth Limits . . . . . . . . . . . . . . . . . . . . . . . . . . . . . . . . . . . . . . . . . . . . . . . 1-17
Running a Bandwidth Test . . . . . . . . . . . . . . . . . . . . . . . . . . . . . . . . . . . . . . . . . . . . . . . . .1-19
Conversion Loss Using the Frequency Offset Mode . . . . . . . . . . . . . . . . . . . . . . . . . . . . . . . 1-23
Setting Measurement Parameters for the IF Range . . . . . . . . . . . . . . . . . . . . . . . . . . . . . 1-25
Performing a Power Meter (Source) Calibration Over the IF Range . . . . . . . . . . . . . . . .1-25
Setting the Analyzer to the RF Frequency Range . . . . . . . . . . . . . . . . . . . . . . . . . . . . . . .1-26
Performing a Power Meter Calibration Over the RF Range . . . . . . . . . . . . . . . . . . . . . . .1-28
Performing the R-Channel Measurement. . . . . . . . . . . . . . . . . . . . . . . . . . . . . . . . . . . . . . 1-29
To View Plot Files on a PC . . . . . . . . . . . . . . . . . . . . . . . . . . . . . . . . . . . . . . . . . . . . . . . . . . . 1-31
Saving Measurement Results . . . . . . . . . . . . . . . . . . . . . . . . . . . . . . . . . . . . . . . . . . . . . . . . 1-33
Saving in Textual (CSV) Form. . . . . . . . . . . . . . . . . . . . . . . . . . . . . . . . . . . . . . . . . . . . . . . 1-33
Saving in Graphical (JPEG) Form. . . . . . . . . . . . . . . . . . . . . . . . . . . . . . . . . . . . . . . . . . . .1-34
Calibrating for Non-Coaxial Devices (ES Analyzers Only). . . . . . . . . . . . . . . . . . . . . . . . . . 1-35
TRL Error Correction . . . . . . . . . . . . . . . . . . . . . . . . . . . . . . . . . . . . . . . . . . . . . . . . . . . . . 1-35
LRM Error Correction. . . . . . . . . . . . . . . . . . . . . . . . . . . . . . . . . . . . . . . . . . . . . . . . . . . . . . . 1-36
Create a User-Defined LRM Calibration Kit . . . . . . . . . . . . . . . . . . . . . . . . . . . . . . . . . . . 1-36
Modifying Calibration Kits . . . . . . . . . . . . . . . . . . . . . . . . . . . . . . . . . . . . . . . . . . . . . . . . . . 1-37
Saving Modified Calibration Kits to a Disk . . . . . . . . . . . . . . . . . . . . . . . . . . . . . . . . . . . .1-37
2. Supplement for the Reference Guide
In This Chapter . . . . . . . . . . . . . . . . . . . . . . . . . . . . . . . . . . . . . . . . . . . . . . . . . . . . . . . . . . . . . 2-2
Menu Maps . . . . . . . . . . . . . . . . . . . . . . . . . . . . . . . . . . . . . . . . . . . . . . . . . . . . . . . . . . . . . . . . 2-3
Hardkey/Softkey Reference. . . . . . . . . . . . . . . . . . . . . . . . . . . . . . . . . . . . . . . . . . . . . . . . . . . .2-9
Analyzer Functions . . . . . . . . . . . . . . . . . . . . . . . . . . . . . . . . . . . . . . . . . . . . . . . . . . . . . . . . 2-9
Error Messages . . . . . . . . . . . . . . . . . . . . . . . . . . . . . . . . . . . . . . . . . . . . . . . . . . . . . . . . . . . . 2-15
Error Messages in Alphabetical Order . . . . . . . . . . . . . . . . . . . . . . . . . . . . . . . . . . . . . . . . 2-15
Error Messages in Numerical Order. . . . . . . . . . . . . . . . . . . . . . . . . . . . . . . . . . . . . . . . . . 2-15
Options and Accessories . . . . . . . . . . . . . . . . . . . . . . . . . . . . . . . . . . . . . . . . . . . . . . . . . . . . . 2-16
Accessories Available . . . . . . . . . . . . . . . . . . . . . . . . . . . . . . . . . . . . . . . . . . . . . . . . . . . . . 2-16
Preset State and Memory Allocation . . . . . . . . . . . . . . . . . . . . . . . . . . . . . . . . . . . . . . . . . . . 2-17
Preset State . . . . . . . . . . . . . . . . . . . . . . . . . . . . . . . . . . . . . . . . . . . . . . . . . . . . . . . . . . . . . 2-17
Contents-v

Contents
3. Supplement for the Programmer’s Guide
In This Chapter . . . . . . . . . . . . . . . . . . . . . . . . . . . . . . . . . . . . . . . . . . . . . . . . . . . . . . . . . . . . . 3-2
Alphabetical Command Reference . . . . . . . . . . . . . . . . . . . . . . . . . . . . . . . . . . . . . . . . . . . . . . 3-3
BWLIMDB . . . . . . . . . . . . . . . . . . . . . . . . . . . . . . . . . . . . . . . . . . . . . . . . . . . . . . . . . . . . . . . 3-3
BWLIMDISP . . . . . . . . . . . . . . . . . . . . . . . . . . . . . . . . . . . . . . . . . . . . . . . . . . . . . . . . . . . . . 3-3
BWLIMMAX . . . . . . . . . . . . . . . . . . . . . . . . . . . . . . . . . . . . . . . . . . . . . . . . . . . . . . . . . . . . . 3-4
BWLIMMIN . . . . . . . . . . . . . . . . . . . . . . . . . . . . . . . . . . . . . . . . . . . . . . . . . . . . . . . . . . . . . . 3-4
BWLIMSTAT . . . . . . . . . . . . . . . . . . . . . . . . . . . . . . . . . . . . . . . . . . . . . . . . . . . . . . . . . . . . . 3-5
BWLIMTEST . . . . . . . . . . . . . . . . . . . . . . . . . . . . . . . . . . . . . . . . . . . . . . . . . . . . . . . . . . . . . 3-5
BWLIMVAL . . . . . . . . . . . . . . . . . . . . . . . . . . . . . . . . . . . . . . . . . . . . . . . . . . . . . . . . . . . . . . 3-6
CLER . . . . . . . . . . . . . . . . . . . . . . . . . . . . . . . . . . . . . . . . . . . . . . . . . . . . . . . . . . . . . . . . . . . 3-6
EDITRLIM . . . . . . . . . . . . . . . . . . . . . . . . . . . . . . . . . . . . . . . . . . . . . . . . . . . . . . . . . . . . . . . 3-7
OUTP . . . . . . . . . . . . . . . . . . . . . . . . . . . . . . . . . . . . . . . . . . . . . . . . . . . . . . . . . . . . . . . . . . . 3-8
RLIMLINE . . . . . . . . . . . . . . . . . . . . . . . . . . . . . . . . . . . . . . . . . . . . . . . . . . . . . . . . . . . . . . . 3-9
RLIMM . . . . . . . . . . . . . . . . . . . . . . . . . . . . . . . . . . . . . . . . . . . . . . . . . . . . . . . . . . . . . . . . . . 3-9
RLIMSTP . . . . . . . . . . . . . . . . . . . . . . . . . . . . . . . . . . . . . . . . . . . . . . . . . . . . . . . . . . . . . . . 3-10
RLIMSTR . . . . . . . . . . . . . . . . . . . . . . . . . . . . . . . . . . . . . . . . . . . . . . . . . . . . . . . . . . . . . . . 3-10
RLIMTEST . . . . . . . . . . . . . . . . . . . . . . . . . . . . . . . . . . . . . . . . . . . . . . . . . . . . . . . . . . . . . 3-11
RLIMVAL . . . . . . . . . . . . . . . . . . . . . . . . . . . . . . . . . . . . . . . . . . . . . . . . . . . . . . . . . . . . . . . 3-11
SAVECSV . . . . . . . . . . . . . . . . . . . . . . . . . . . . . . . . . . . . . . . . . . . . . . . . . . . . . . . . . . . . . . . 3-12
SAVEJPG . . . . . . . . . . . . . . . . . . . . . . . . . . . . . . . . . . . . . . . . . . . . . . . . . . . . . . . . . . . . . . .3-12
SELBND . . . . . . . . . . . . . . . . . . . . . . . . . . . . . . . . . . . . . . . . . . . . . . . . . . . . . . . . . . . . . . . 3-13
Preset Conditions. . . . . . . . . . . . . . . . . . . . . . . . . . . . . . . . . . . . . . . . . . . . . . . . . . . . . . . . . . . 3-15
Preset State . . . . . . . . . . . . . . . . . . . . . . . . . . . . . . . . . . . . . . . . . . . . . . . . . . . . . . . . . . . . . 3-15
Command Listings. . . . . . . . . . . . . . . . . . . . . . . . . . . . . . . . . . . . . . . . . . . . . . . . . . . . . . . . . . 3-17
Alphabetical List of New Commands . . . . . . . . . . . . . . . . . . . . . . . . . . . . . . . . . . . . . . . . . 3-17
OPC-Compatible List of New Commands. . . . . . . . . . . . . . . . . . . . . . . . . . . . . . . . . . . . . . 3-17
Contents-vi

1 Supplement for the User’s Guide
1-1

Supplement for the User’s Guide
LIMIT LINE
LIMIT MENU
RECALL KEYS
RECALLKEYS MENU
Using This Chapter
Using This Chapter
This chapter contains the supplemental information changes to the user’s guides that
coincide with the release of firmware revision 7.66. These changes pertain to the following
user’s guides.
• 8753ET and 8753ES Network Analyzers User’s Guide (part number 08753-90472)
• 8753ES Option 011 Network Analyzer User’s Guide (part number 08753-90479)
The following list describes the changes to 8753ET and 8753ES user’s guides printed prior
to July 2000. Each of the changes are described in detail in the remainder of this chapter.
The page references in this list refer to page numbers in this supplement.
• Making Measurements Chapter
— Add the softkey after the softkey in all existing
locations.
— Add the softkey between the key and the
Save/Recall
softkey in the section titled “Limit Test Example Sequence”
in “Using Test Sequencing to Test a Device” on page 1-5.
— Add “Using Ripple Limits to Test a Device” on page 1-7 to the chapter.
— Add “UsingBandwidth Limits to Testa Bandpass Filter” on page 1-17 to the chapter.
• Making Mixer Measurements Chapter
— Replace the section titled “Conversion Loss Using the Frequency Offset Mode” on
page 1-23.
• Printing, Plotting, and Saving Measurement Results Chapter
— Add a note referencing the new “Saving in Graphical (JPEG) Form” section after the
displayed paragraph in “To View Plot Files on a PC.”
— Add the new sections “Saving in Textual (CSV) Form” on page 1-33 and “Saving in
Graphical (JPEG) Form” on page 1-34 to the “Saving Measurement Results” section.
• Calibrating for Increased Measurement Accuracy Chapter
— Add a paragraph explaining the frequency entry to step 5 of “Calibrating for
Non-Coaxial Devices (ES Analyzers Only).”
— Append a note referencing the new “Saving Modified Calibration Kits to a Disk”
section to step 19 of the “Calibrating for Non-Coaxial Devices (ES Analyzers Only)”
section.
— Append a note referencing the new “Saving Modified Calibration Kits to a Disk”
section to step 19 of the “LRM Error Correction” section.
• Operating Concepts Chapter
— Append “Saving Modified Calibration Kits to a Disk” on page 1-37 to the end of the
section titled “Modifying Calibration Kits.”
1-2

Using Limit Lines to Test a Device
LIMIT MENU
LIMIT LINE ON
EDIT LIMIT LINE
CLEAR LIST
YES
LIMIT MENU
LIMIT LINE
LIMIT LINE ON
EDIT LIMIT LINE
CLEAR LIST
YES
LIMIT MENU
LIMIT LINE ON
EDIT LIMIT LINE
CLEAR LIST
YES
LIMIT MENU
LIMIT LINE
LIMIT LINE ON
EDIT LIMIT LINE
CLEAR LIST
YES
LIMIT MENU
LIMIT LINE ON
EDIT LIMIT LINE
CLEAR LIST
YES
LIMIT MENU
LIMIT LINE
LIMIT LINE ON
EDIT LIMIT LINE
CLEAR LIST
YES
LIMIT MENU
LIMIT LINE ON
EDIT LIMIT LINE
LIMIT MENU
LIMIT LINE
LIMIT LINE ON
EDIT LIMIT LINE
Creating Flat Limit Lines
In step 1, replace the following line:
System
with
System
Creating a Sloping Limit Line
In step 1, replace the following line:
Supplement for the User’s Guide
Using Limit Lines to Test a Device
System
with
System
Creating Single Point Limits
In step 1, replace the following line:
System
with
System
Editing Limit Segments
In step 1, replace the following line:
System
with
System
1-3

Supplement for the User’s Guide
LIMIT MENU
LIMIT LINE ON
EDIT LIMIT LINE
LIMIT MENU
LIMIT LINE
LIMIT LINE ON
EDIT LIMIT LINE
LIMIT MENU
LIMIT LINE ON
EDIT LIMIT LINE
LIMIT MENU
LIMIT LINE
LIMIT LINE ON
EDIT LIMIT LINE
LIMIT MENU
LIMIT TEST ON
BEEP FAIL ON
LIMIT MENU
LIMIT LINE
LIMIT TEST ON
BEEP FAIL ON
LIMIT MENU
LIMIT LINE OFFSETS
STIMULUS OFFSET
LIMIT MENU
LIMIT LINE
LIMIT LINE OFFSETS
STIMULUS OFFSET
Using Limit Lines to Test a Device
Deleting Limit Segments
In step 1, replace the following line:
System
with
System
Running a Limit Test
In step 1, replace the following line:
System
with
System
Activating the Limit Test
In this section, replace the following line:
System
with
System
Offsetting Limit Lines
In step 1, replace the following line:
System
with
System
3 M/µ
3 M/µ
1-4

Using Test Sequencing to Test a Device
RECALLKEYS MENU
RECALL REG1
RECALL KEYS
RECALLKEYS MENU
RECALL REG1
Using Test Sequencing to Test a Device
Limit Test Example Sequence
In step 1, replace the following line:
Save/Recall
with:
Save/Recall
Supplement for the User’s Guide
1-5

Supplement for the User’s Guide
Using Test Sequencing to Test a Device
This page intentionally left blank.
1-6

Supplement for the User’s Guide
Using Ripple Limits to Test a Device
Using Ripple Limits to Test a Device
Setting Up the List of Ripple Limits to Test
Two tasks are involved in preparing for ripple testing:
• First, set up the analyzer settings to view the frequency of interest.
• Second, set up the analyzer to test over the appropriate frequencies against your
specific limits.
This example will show you how to set up the analyzer to test ripple limits. In this
example, we will be testing the pass band of a bandpass filter where the center frequency
of the filter is approximately 1.8 GHz and has a bandwidth of approximately 2.9 GHz.
Refer to Figure 1-1.
Figure 1-1 Bandpass Filter Being Ripple Tested
1-7

Supplement for the User’s Guide
Trans: FWD S21 (B/R)
TRANSMISSN
AUTO SCALE
CALIBRATE MENU
RESPONSE
THRU
AUTO SCALE
Using Ripple Limits to Test a Device
Setting Up the Analyzer to Perform the Ripple Test
This section sets up the analyzer so that a bandpass filter can be easily viewed on the
analyzer display.
1. Connect your filter as shown in Figure 1-2.
Figure 1-2 Connections for an Example Ripple Test Measurement
2. Press and choose the measurement settings. For this example, the
Preset
measurement settings are as follows:
• or on ET models:
Meas
•
Center 1.8 G/n
•
Span 3.4 G/n
•
Scale Ref
You may also want to select settings for the number of data points, power, averaging,
and IF bandwidth.
3. Substitute a thru for the device and perform a response calibration by pressing:
Cal
4. Reconnect your test device.
5. To better view the measurement trace, press . Refer to
Scale Ref
Figure 1-3.
1-8

Figure 1-3 Filter Pass Band Before Ripple Test
Supplement for the User’s Guide
Using Ripple Limits to Test a Device
Setting Up Limits for Ripple Testing
This section instructs you on setting up the ripple tests parameters. You must set up the
analyzer to check the DUT at the correct frequencies and compare the measured values
against the maximum allowable ripple value for each frequency band. To do this, you set
up individual frequency bands. You define the stop and start frequency and the maximum
allowable ripple value of each frequency band. You may set up as many as 12 frequency
bands for testing ripple.The frequencybands are combined in a list that is displayedwhile
the ripple frequency bands are being edited.
In this example, we will create one ripple limit (or frequency band) that spans the entire
pass band from 500 MHz to 3.2 GHz. We will also create two additional frequency bands
that when merged, will span the pass band with tighter limits. Using the Ripple Edit
Menu, we will create a ripple limits list on the analyzer that is similar to the following
table.
Table 1-1 Ripple Limits for Ripple Test Example
Frequency Band Minimum Frequency Maximum Frequency Maximum Ripple
1 500 MHz 3.2 GHz 2.0 dB
2 500 MHz 1.85 GHz 1.3 dB
3 1.85 GHz 3.2 GHz 1.3 dB
Notice that Frequency Band 1 overlaps in frequency the remaining frequency bands.
Whereas, Frequency Bands 2 and 3 are separate bands that cover the same span of
frequency. This can be done to put tighter limits over narrower frequency spans within the
bandpass or to customize the ripple test to meet your specific requirements.
1-9

Supplement for the User’s Guide
LIMIT MENU
RIPPLE LIMIT
EDIT RIPL LIMIT
ADD
MINIMUM FREQUENCY
MAXIMUM FREQUENCY
MAXIMUM RIPPLE
DONE
EDIT RIPL LIMIT
FREQUENCY BAND
Using Ripple Limits to Test a Device
1. To access the ripple test menu, press:
System
2. To access the ripple test edit menu, press .
3. Add the first frequency band (Frequency Band 1) to be tested by pressing .
4. Set the lower frequency value of Frequency Band 1 by pressing:
500 M/µ
5. Set the upper frequency value of Frequency Band 1 by pressing:
3.2 G/n
6. Set the maximum allowable ripple amplitude value of Frequency Band 1 by pressing:
2.0 x1
7. Repeat steps 3 through 6 for the two remaining frequency bands to be tested for
maximum ripple.
The network analyzer allows you to enter up to 12 frequency bands to be tested for
maximum ripple.
8. After you have entered all of the ripple test frequency band parameters, return to the
ripple test menu by pressing .
Editing Ripple Test Limits
Once the frequency band limits for ripple testing has been created, the limits may be
changed using the same menu that was used to create them. Using the edit ripple test
menu, you may:
• change existing frequency band limits
• add more frequency band limits
• delete individual frequency band limits
• clear all frequency band limits
Changing Existing Frequency Band Limits
Existing frequency band limits may be changed for testing the ripple. This procedure
guides you through changing the existing frequency band limits.
1. To access the ripple test edit menu from the ripple test menu, press:
2. Enter the frequency band whose limits you want to change by pressing:
a.
b. The numeric key indicating the frequency band number that you are changing.
The frequency band number is located in the left column of the list of frequency
bands.
1-10

Supplement for the User’s Guide
MINIMUM FREQUENCY
MAXIMUM FREQUENCY
MAXIMUM RIPPLE
DONE
EDIT RIPL LIMIT
ADD
MINIMUM FREQUENCY
MAXIMUM FREQUENCY
MAXIMUM RIPPLE
DONE
Using Ripple Limits to Test a Device
3. Make the changes to the selected band by pressing:
a. and the new value to change the lower frequency of the
frequency band.
b. and the new value to change the upper frequency of the
frequency band.
c. and the new decibel value to change the maximum allowable
ripple of the frequency band. Terminate the new decibel value with the key.
x1
4. Repeat steps 2 and 3 for additional frequency bands to be changed to test the ripple.
5. After you have entered the necessary changes to the ripple test frequency band
parameters, return to the ripple test menu by pressing .
Adding Additional Frequency Bands
More frequencyband limits may be added for testing the ripple. This procedure guides you
through adding the more frequency band limits.
The network analyzer allows you to enter up to 12 frequency bands for maximum ripple
testing.
1. To access the ripple test edit menu, press .
2. Create a new frequency band by pressing .
3. Set the lower frequency value of the frequency band by pressing:
a.
b. the numeric keys indicating the minimum frequency value of the frequency band
c. the appropriate frequency key (either , , or )
G/n M/µ k/m
4. Set the upper frequency value of the frequency band by pressing:
a.
b. the numeric keys indicating the maximum frequency value of the frequency band
c. the appropriate frequency key (either , , or )
G/n M/µ k/m
5. Set the maximum allowable ripple amplitude value of the frequency band by pressing:
a.
b. the decibel value of the frequency band’s maximum allowable ripple
c.
x1
6. Repeat steps 2 through 5 for additional frequency bands to be tested for maximum
ripple.
7. After you have added all of the new frequency bands, return to the ripple test menu by
pressing .
1-11

Supplement for the User’s Guide
EDIT RIPL LIMIT
FREQUENCY BAND
DELETE
CLEAR LIST
DONE
RIPL TEST on OFF
Using Ripple Limits to Test a Device
Deleting Existing Frequency Bands
Frequency band limits may be deleted for testing the ripple. This procedure guides you
through deleting existing frequency band limits. You may delete individual frequency
bands or delete all of the frequency bands from the list.
1. To access the ripple test edit menu, press:
2. Select the first frequency band (as an example, Frequency Band 3) to be deleted by
pressing:
3 x1
3. Repeat step 2 until you have deleted the required frequency bands from the list.
4. If you need to delete all of the frequency bands, you can delete them all by pressing:
When this softkey is pressed, you will be asked to confirm that you want to delete all of
the frequency bands from the list.
5. After you have finished deleting the frequency bands, you can return to the ripple test
menu by pressing .
Running the Ripple Test
Once the list of ripple limits has been set up, you are ready to run the ripple test. From the
Ripple Test Menu, you can:
• start and stop the ripple test
• display and hide the ripple test limit lines
• select a frequency band and display its ripple measurement in two ways:
❏ the absolute measured ripple value
❏ the margin which the measured ripple passes or fails the user-defined maximum
ripple value
Starting and Stopping the Ripple Test
Once the list of ripple limits have been set up, start the ripple test by pressing
from the Ripple Test Menu until ON is displayed on the softkey.
Pressing this softkey toggles the analyzer between ripple test on and ripple test off status.
Figure 1-4 shows the filter pass band (with the scale changed to 1 dB/division) being ripple
tested. Note that the filter fails the ripple test. The portions of the pass band trace which
do not meet the test requirements are displayed in red.
1-12

Using Ripple Limits to Test a Device
RIPL LIMIT on OFF
Figure 1-4 Filter Passband with Ripple Test Activated
Supplement for the User’s Guide
As the analyzer measures the ripple, a message is displayed indicating whether the
measurement passes or fails:
• If the ripple test passes, a RIPLn PASS message (where n = the channel number) is
displayed in the color assigned to Channel 1 Memory. The ripple test must pass in all
frequency bands before the pass message is displayed.
• If the ripple test fails, a RIPLn FAIL message (where n = the channel number) is
displayed in red. The portion of the trace that exceeds the user-specified maximum
ripple value is also displayed in red.
Displaying the Ripple Limits
After the list of ripple limits has been set up, display the ripple test limits by pressing
from the Ripple Test Menu until ON is displayed on the softkey.
Pressing this softkey toggles the analyzer ripple limits display on and off. If the ripple
limits are displayed and the ripple test is off,the ripple limits are displayednear the top of
the graticule and are not compared with the displayed trace. However, once the ripple test
is started, the ripple limits are displayed with respect to the measured trace in the
following manner:
• If the ripple test passes, the ripple limits are drawn on the display for each frequency
band. Within each frequency band, an upper and lower ripple limit is drawn such that
they are equidistant above the upper point of the measured trace and below the lower
point of the measured trace.
• If the ripple test fails, the ripple limits are drawn on the display for each frequency
band. Within eachfrequency band, the lower ripple limit is drawn atthe lowest point on
the measured trace and the upper ripple limit is drawn at the user-specified maximum
1-13

Supplement for the User’s Guide
MORE
ADJUST DISPLAY
MODIFY COLORS
MORE
RIPPLE LIM LINES
TINT
RIPL VALUE [ ]
RIPL VALUE [OFF ]
RIPL VALUE [ABSOLUTE ]
RIPL VALUE [MARGIN ]
RIPL TEST on OFF
Using Ripple Limits to Test a Device
ripple value above the lower ripple limit. The ripple that exceeds the maximum ripple
value extends above the upper limit. This measured trace that extends above the upper
limit is displayed in red.
Figure 1-5 shows the filter pass band tested with the ripple limits activated. Notice that
there are three sets of ripple limits shown. Also notice that the measured trace exceeds the
upper ripple limit only in Frequency Band 3.
Figure 1-5 Filter Pass Band with Ripple Test and Ripple Limits Activated
Changing the Ripple Limits Line Color. The color of the lines that represent the
ripple limits can be changed by:
1. pressing the key
Display
2. pressing
3. pressing and turning the analyzer front panel knob until
the desired color appears (You may also use the step keys or the numeric keypad
instead of the front panel knob to change the color.)
Checking the Ripple Value
Once the ripple test has been started and is running, you may display the ripple value of
each frequency band in one of two formats, the absolute format or the margin format. Both
formats are described in this section.
To display the ripple value, press . Pressing this softkey toggles
between , , and
. from the Ripple Test Menu until ON is
displayed on the softkey. Pressing this softkey toggles the analyzer between ripple test on
1-14

Supplement for the User’s Guide
RIPL VALUE BAND
RIPL VALUE [ABSOLUTE ]
Using Ripple Limits to Test a Device
and ripple test off status.
When the Absolute and Margin choicesare selected,the frequency band and measurement
value are displayed to the right side of the pass/fail message described previously. This
display is displayed in the same color as the pass/fail message.
The frequency band of the displayed value is displayed as Bn (where n = the frequency
band number). The frequency band may be changed to display the value of each band. To
change the displayed frequency band value, from the Ripple Test Menu, press
and then use the and keys (or the numerical keypad) to
select the desired frequency band.
Viewing the Ripple Value in Absolute Format
When is selected, the absolute ripple value of the selected
frequency band is displayed. The absolute ripple value is the measured maximum level
minus the measured minimum level within the frequency band. This value is displayed in
dB.
Figure 1-6 shows the ripple test with absolute ripple value displayed for Frequency
Band 1. The B1 indicates that the ripple value displayed is for Frequency Band 1. Notice
that Frequency Band 1 passes the ripple test. It has an absolute ripple value of 1.675 dB
while the maximum ripple value entered for Frequency Band 1 was 2.0 dB. Thus, even
though the ripple test fails because of Frequency Band 3, the ripple passes in Frequency
Band 1.
Figure 1-6 Filter Pass Band with Absolute Ripple Value for Band 1 Activated
1-15

Supplement for the User’s Guide
RIPL VALUE [MARGIN ]
Using Ripple Limits to Test a Device
Viewing the Ripple Value in Margin Format
When is selected, the margin by which the ripple value passed
or failed is displayed. The ripple value margin is the user-defined maximum ripple minus
the absolute ripple value within the frequency band. This value is displayed in dB. A
positive value is the margin that the ripple passes the ripple test in the frequency band. A
negative value is the margin that the ripple fails the ripple test in the frequency band.
Figure 1-7 shows the ripple test with margin ripple value displayed for Frequency Band 2.
Notice that Frequency Band 2 passes the ripple test with a margin of 0.097 dB. The plus
sign (+) indicates this band passes the ripple test by the amount displayed. A minus sign
(−) would indicate that the band failed by the displayed amount.
Figure 1-7 Filter Pass Band with Margin Ripple Value for Band 2 Activated
1-16

Supplement for the User’s Guide
Using Bandwidth Limits to Test a Bandpass Filter
Using Bandwidth Limits to Test a Bandpass Filter
The bandwidth testing mode can be used to test the bandwidth of a bandpass filter. The
bandwidth test finds the peak of a signal in the passband and locates a point on each side
of the passband at an amplitude below the peak (that you specify during the test setup).
The frequency between these two points is the bandwidth of the filter. This bandwidth is
compared to minimum and maximum allowable bandwidths that you specify during the
test setup.
This example shows you how to test the bandwidth of a bandpass filter. In this example,
we will be testing the pass band of a bandpass filterwhere thecenter frequency of the filter
is approximately 321 MHz. Refer to Figure 1-8.
Figure 1-8 Bandpass Filter Being Bandwidth Tested
Setting Up Bandwidth Limits
When you set up the bandwidth limits to test the bandpass filter, you will first set up the
analyzer to perform the bandwidth test and then you will set up bandwidth limits of the
bandwidth test.
Setting Up the Analyzer to Perform the Bandwidth Test
This section sets up the analyzer so that a bandpass filter can be easily viewed on the
analyzer display.
1. Connect your filter as shown in Figure 1-9.
1-17

Supplement for the User’s Guide
Trans: FWD S21 (B/R)
TRANSMISSN
AUTO SCALE
Using Bandwidth Limits to Test a Bandpass Filter
Figure 1-9 Connections for a Bandpass Filter Example Measurement
2. Press and choose the measurement settings. For this example, the
Preset
measurement settings are as follows:
a. or on ET models:
Meas
b.
Center 321 M/µ
c.
Span 200 M/µ
d.
Scale Ref
You may also want to select settings for the number of data points, power, averaging,
and IF bandwidth.
Figure 1-10 Filter Pass Band Before Bandwidth Test
1-18

Supplement for the User’s Guide
CALIBRATE MENU
RESPONSE
THRU
LIMIT MENU
BANDWIDTH LIMIT
N DB POINTS
MINIMUM BANDWIDTH
MAXIMUM BANDWIDTH
BW TEST on OFF
Using Bandwidth Limits to Test a Bandpass Filter
3. Substitute a thru for the device and perform a response calibration by pressing:
Cal
4. Reconnect your test device.
Refer to Figure 1-10.
Setting Up the Bandwidth Limits
When you set up the bandwidth limits to test the bandpass filter, you will set
• the amplitude below the peak that is used to measure the filter’s bandwidth. This
setting is called N dB Points.
• the Maximum Bandwidth value. If the measured bandwidth is greater than this value,
the test will fail.
• the Minimum Bandwidth value. If the measured bandwidth is less than this value, the
test will fail.
1. To access the bandwidth menu, press:
System
2. Toset the amplitude below the peak passband amplitude that you wantto measure the
bandwidth. In this case, we are setting the bandwidth that will be measured 40 dB
below the peak amplitude of the bandpass filter by pressing:
40 x1
3. To set the minimum bandwidth for the bandwidth test, press:
100 M/µ
4. To set the maximum bandwidth for the bandwidth test, press:
150 M/µ
Running a Bandwidth Test
After setting up the bandwidth limits, you are ready to run the bandwidth test and check
the test results. For this example, we will:
• Start the test.
• Display the bandwidth markers.
• Review the test results.
Activating the Bandwidth Test
1. Start the bandwidth test by pressing the softkey until ON is
displayed.
The bandwidth test continues to run until the softkey is returned to the OFF position.
The test displays a message in the upper left corner of the graticule showing that the
bandwidth test is being performed and the channel on which the test is being
1-19
Supplement for the User’s Guide
BW MARKER on OFF
Using Bandwidth Limits to Test a Bandpass Filter
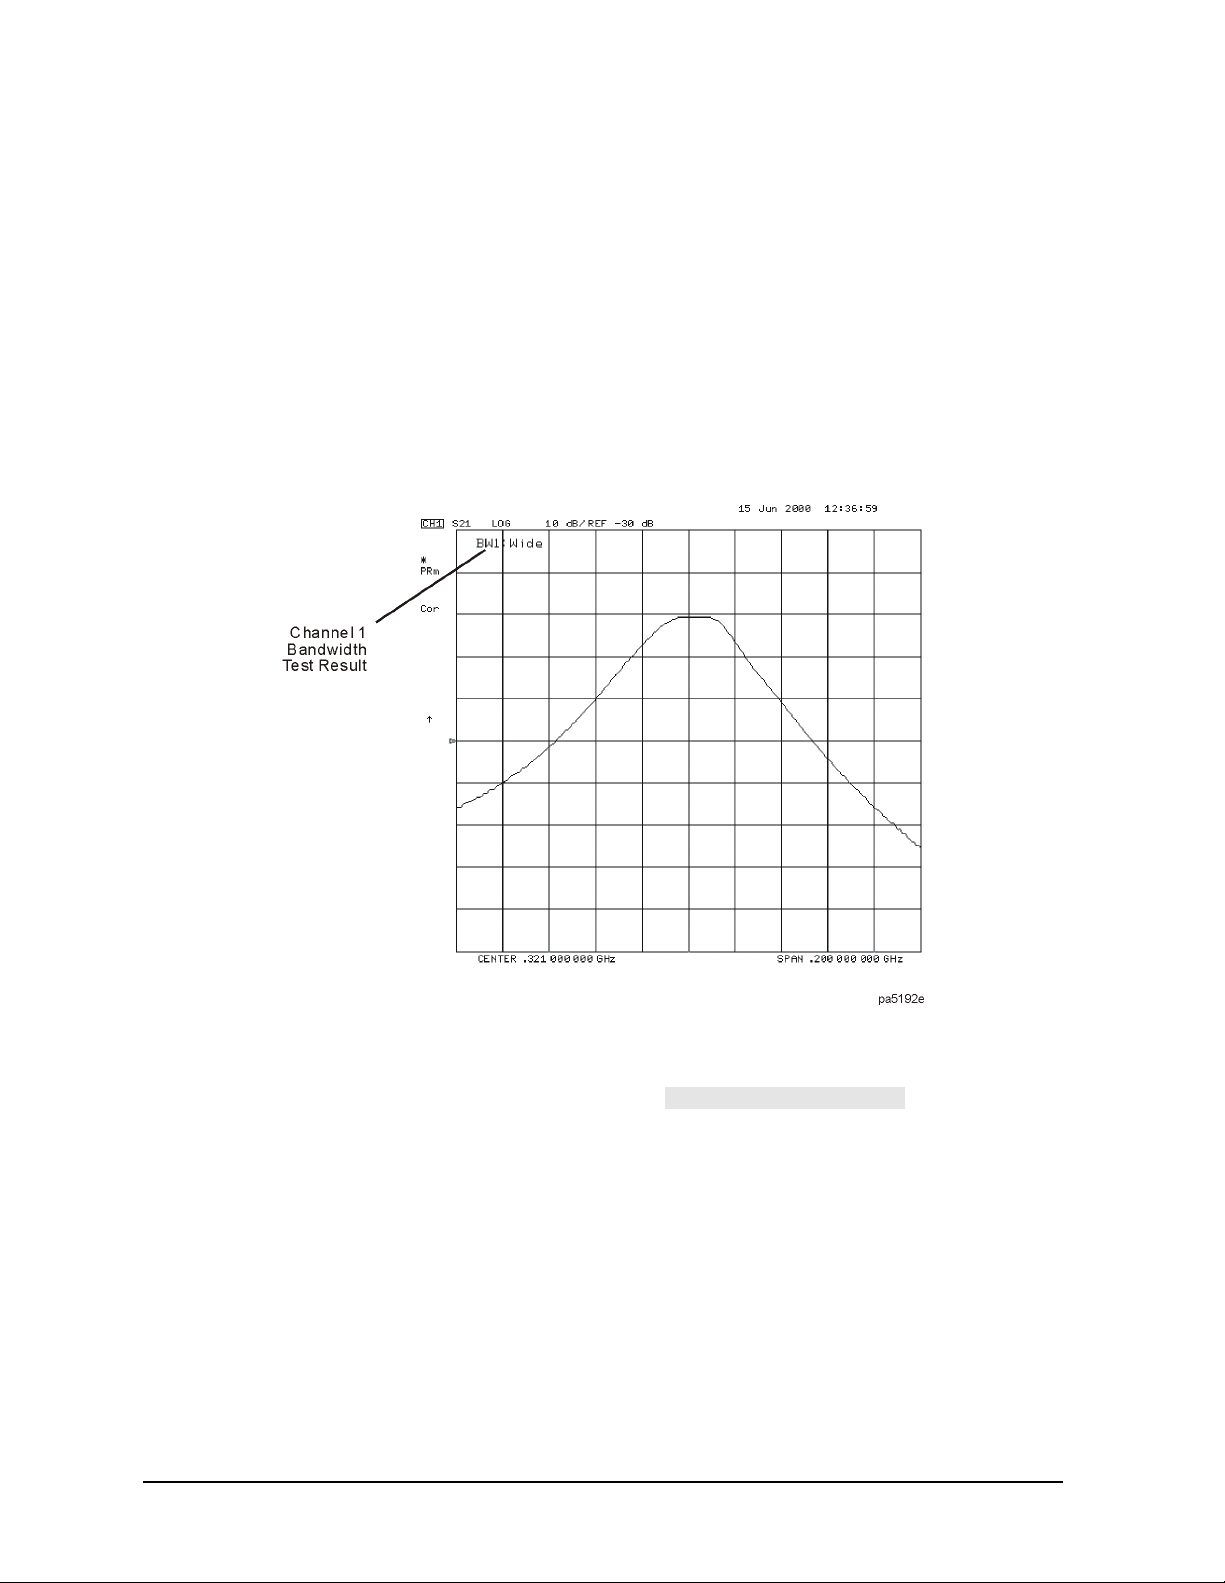
performed. For example, BW1: indicates that the bandwidth test is being run on
channel 1. See Figure 1-11.
The test also displays a message indicating whether the filter passes or fails the
bandwidth test. When the filter is passing the test, the message indicates Pass. When
the filter is failing the test, the failure message indicates either Wide (when the pass
band is wider than the maximum bandwidth input) or Narrow (when the pass band is
narrower than the minimum bandwidth input).
When the filter passes the bandwidthtest, thecolor of the bandwidth test Passmessage
is green. When the filter fails the bandwidth test, the color of the bandwidth test
Wide/Narrow message is red.
Figure 1-11 Filter Pass Band with Bandwidth Test Activated
Displaying the Bandwidth Markers
1. Display the bandwidth markers by pressing the softkey until
ON is displayed on the softkey.
When the bandwidth markers are displayed, amarker isplaced on each side of the peak
amplitude at a position equal to the N dB Points value below the peak. The markers are
placed at the 40 dB points on the signal in Figure 1-12. The bandwidth markers
resemble the following symbol: T
1-20

Supplement for the User’s Guide
BW DISPLAY on OFF
Using Bandwidth Limits to Test a Bandpass Filter
Figure 1-12 Bandwidth Markers Placed 40 dB Below the Bandpass Peak
Displaying the Bandwidth Value
1. Display the bandwidth value by pressing the softkey until ON
is displayed on the softkey.
When this softkey is set to the ON position, the measured bandwidth value is displayed
in the upper left corner of the display, to the right of the bandwidth Pass/Wide/Narrow
message. This value changes as the analyzer continues measuring the bandwidth. The
bandwidth value is displayed in Figure 1-13.
If the filter is failing the bandwidth test, the color of the bandwidth value is red, the
same color as the failure (Wide) message of Figure 1-11. If the filter is passing the
bandwidth test, the displayed bandwidth value is green (the same color as the
bandwidth test Pass message).
1-21

Supplement for the User’s Guide
Using Bandwidth Limits to Test a Bandpass Filter
Figure 1-13 Filter Pass Band with Bandwidth Value Displayed
1-22
Supplement for the User’s Guide
PWR RANGE MAN
Conversion Loss Using the Frequency Offset Mode
Conversion Loss Using the Frequency Offset Mode
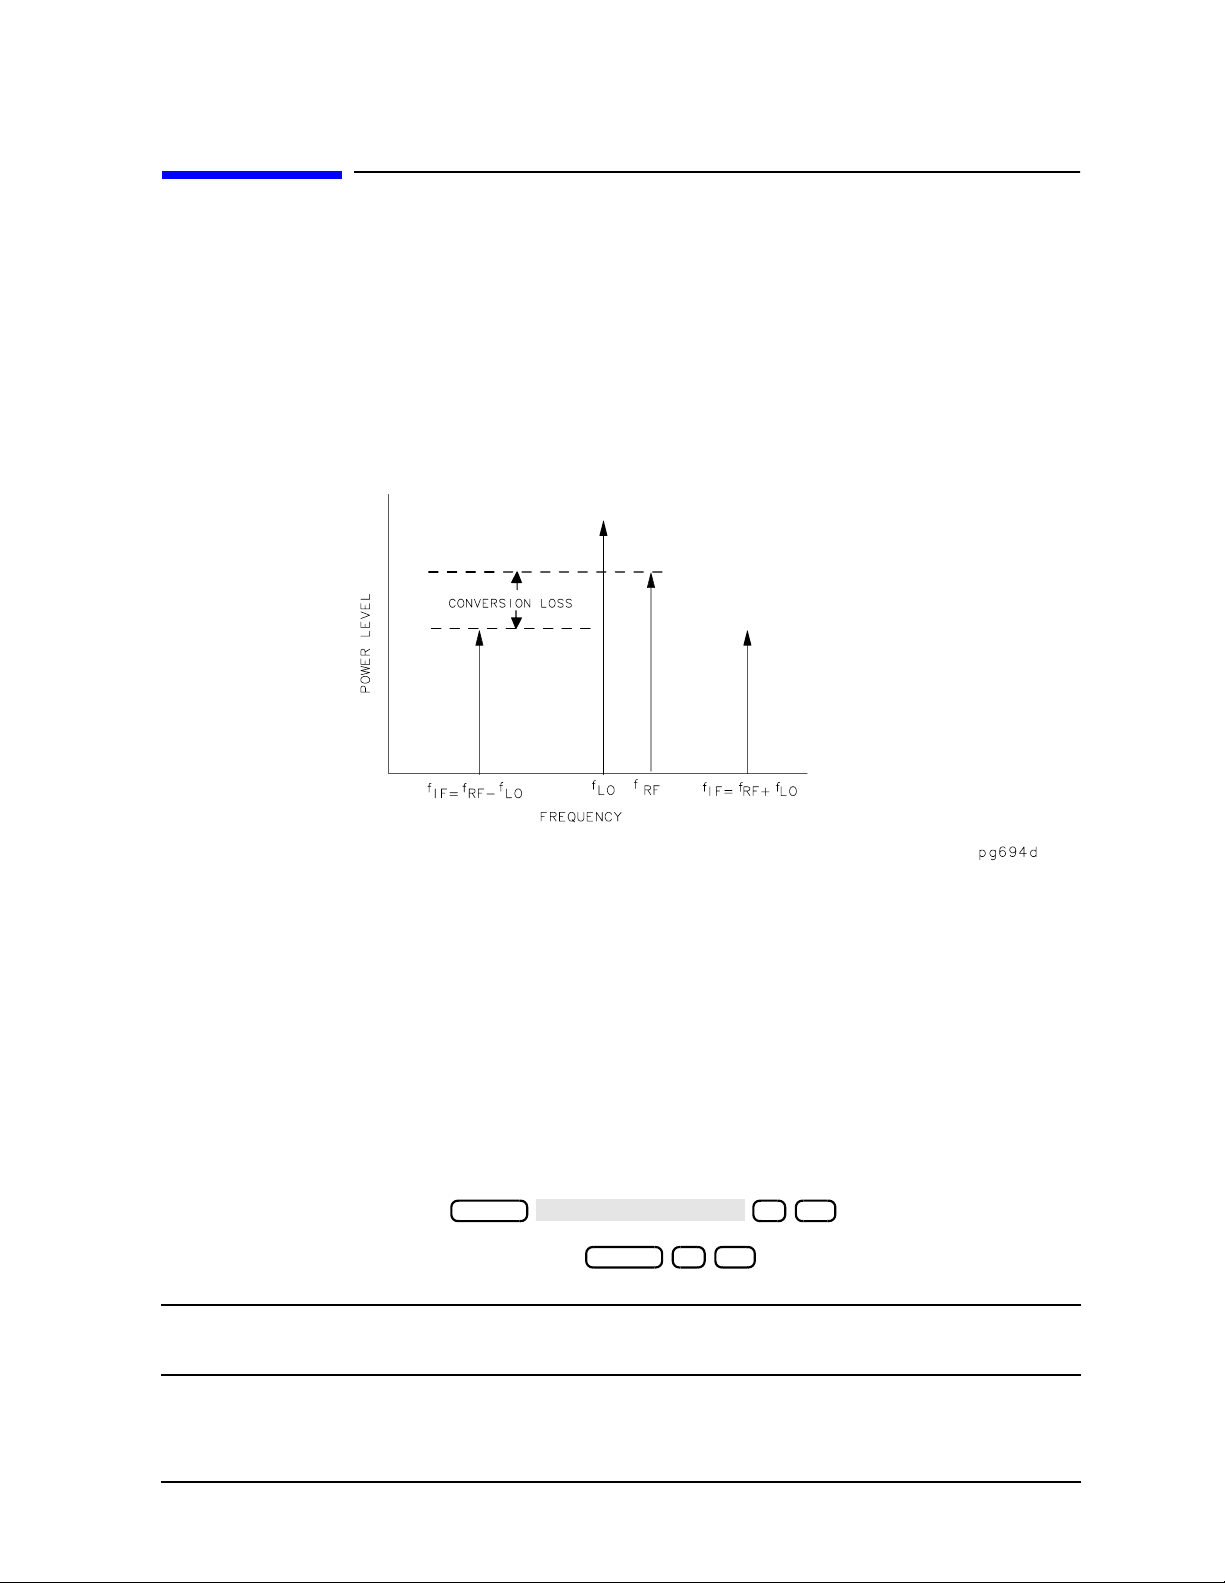
Conversion loss is the measure of efficiency of a mixer. It is the ratio of side-band IF power
to RF signal power, and is usually expressed in dB. The mixer translates the incoming
signal, (RF), to a replica, (IF), displaced in frequency by the local oscillator, (LO).
Frequency translation is characterized by a loss in signal amplitude and the generation of
additional sidebands. For a given translation, two equal output signals are expected, a
lower sideband and an upper sideband.
Figure 1-14 An Example Spectrum of RF, LO, and IF Signals Present in a
Conversion Loss Measurement
The following procedure describes the R channel swept IF frequency conversion loss
measurement of a broadband component mixer with power meter calibration. For this
example, we will use an LO frequency of 1 GHz (1000 MHz), an IF start frequency of
100 MHz, and an IF stop frequency of 350 MHz.
1. Set the LO source to the desired CW frequency of 1000 MHz and power level to 13 dBm.
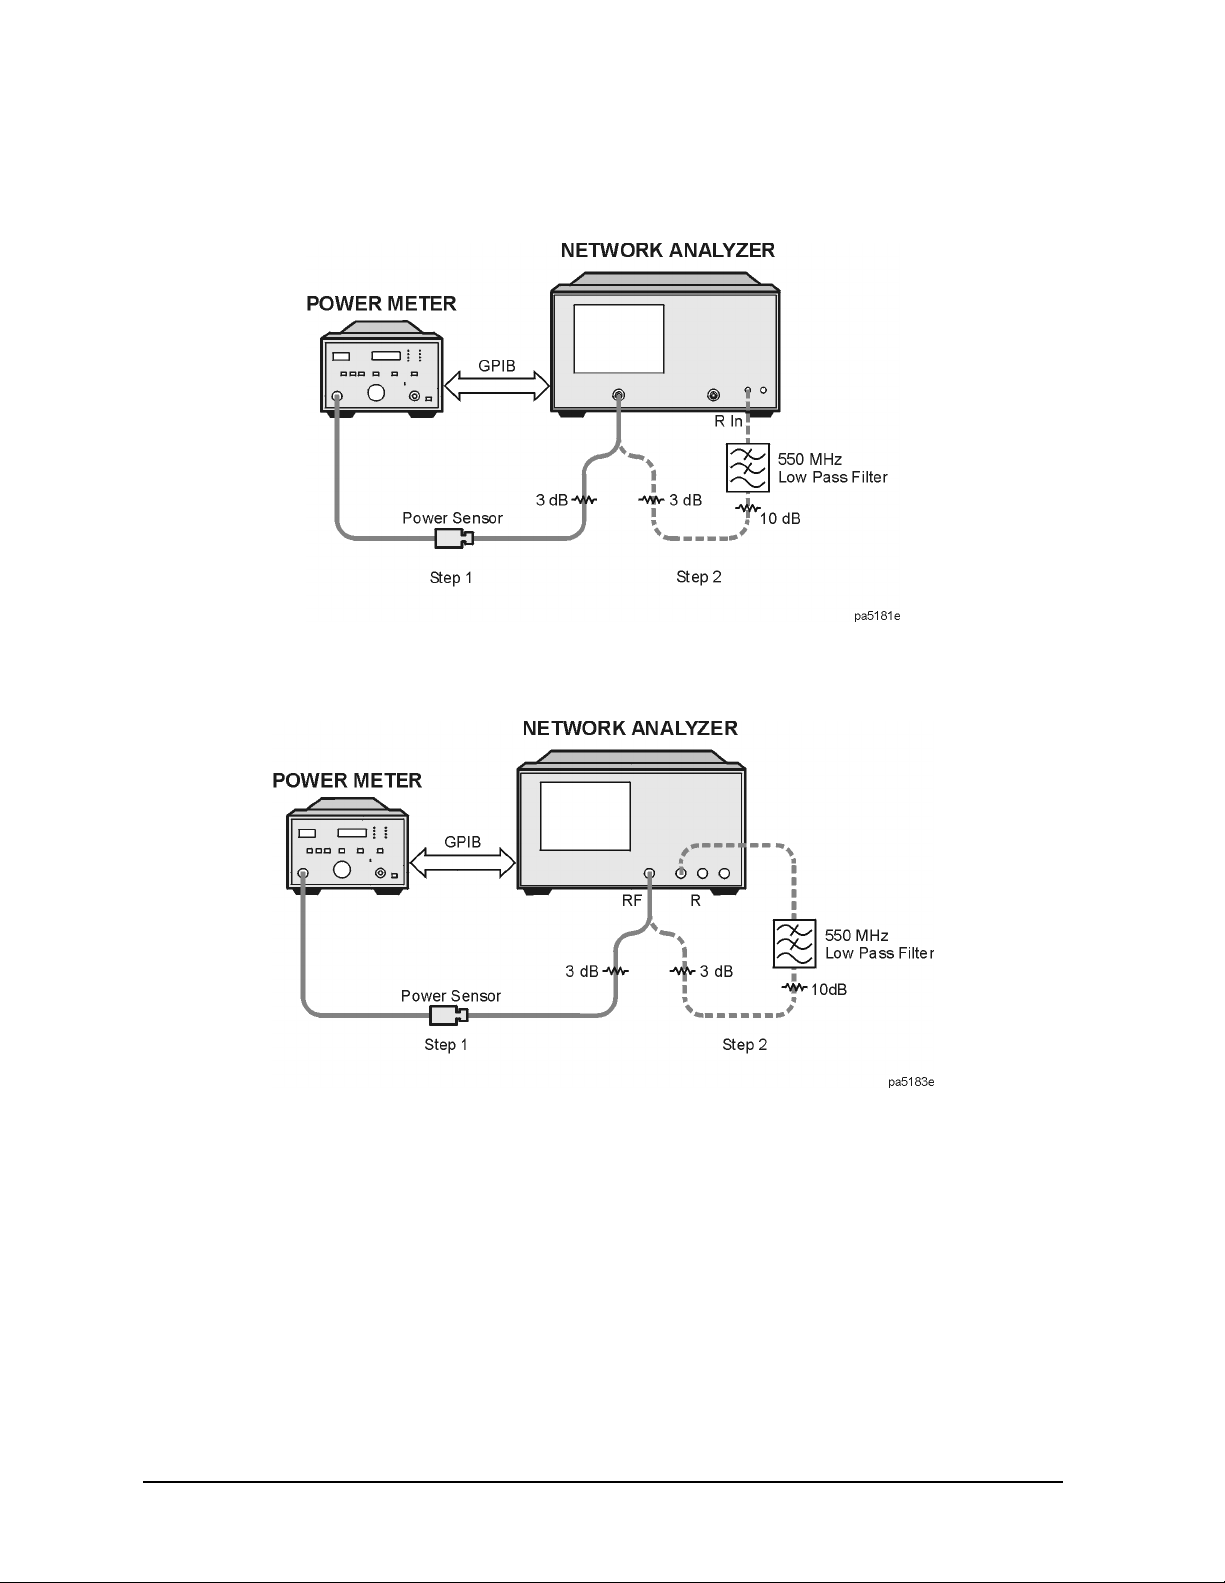
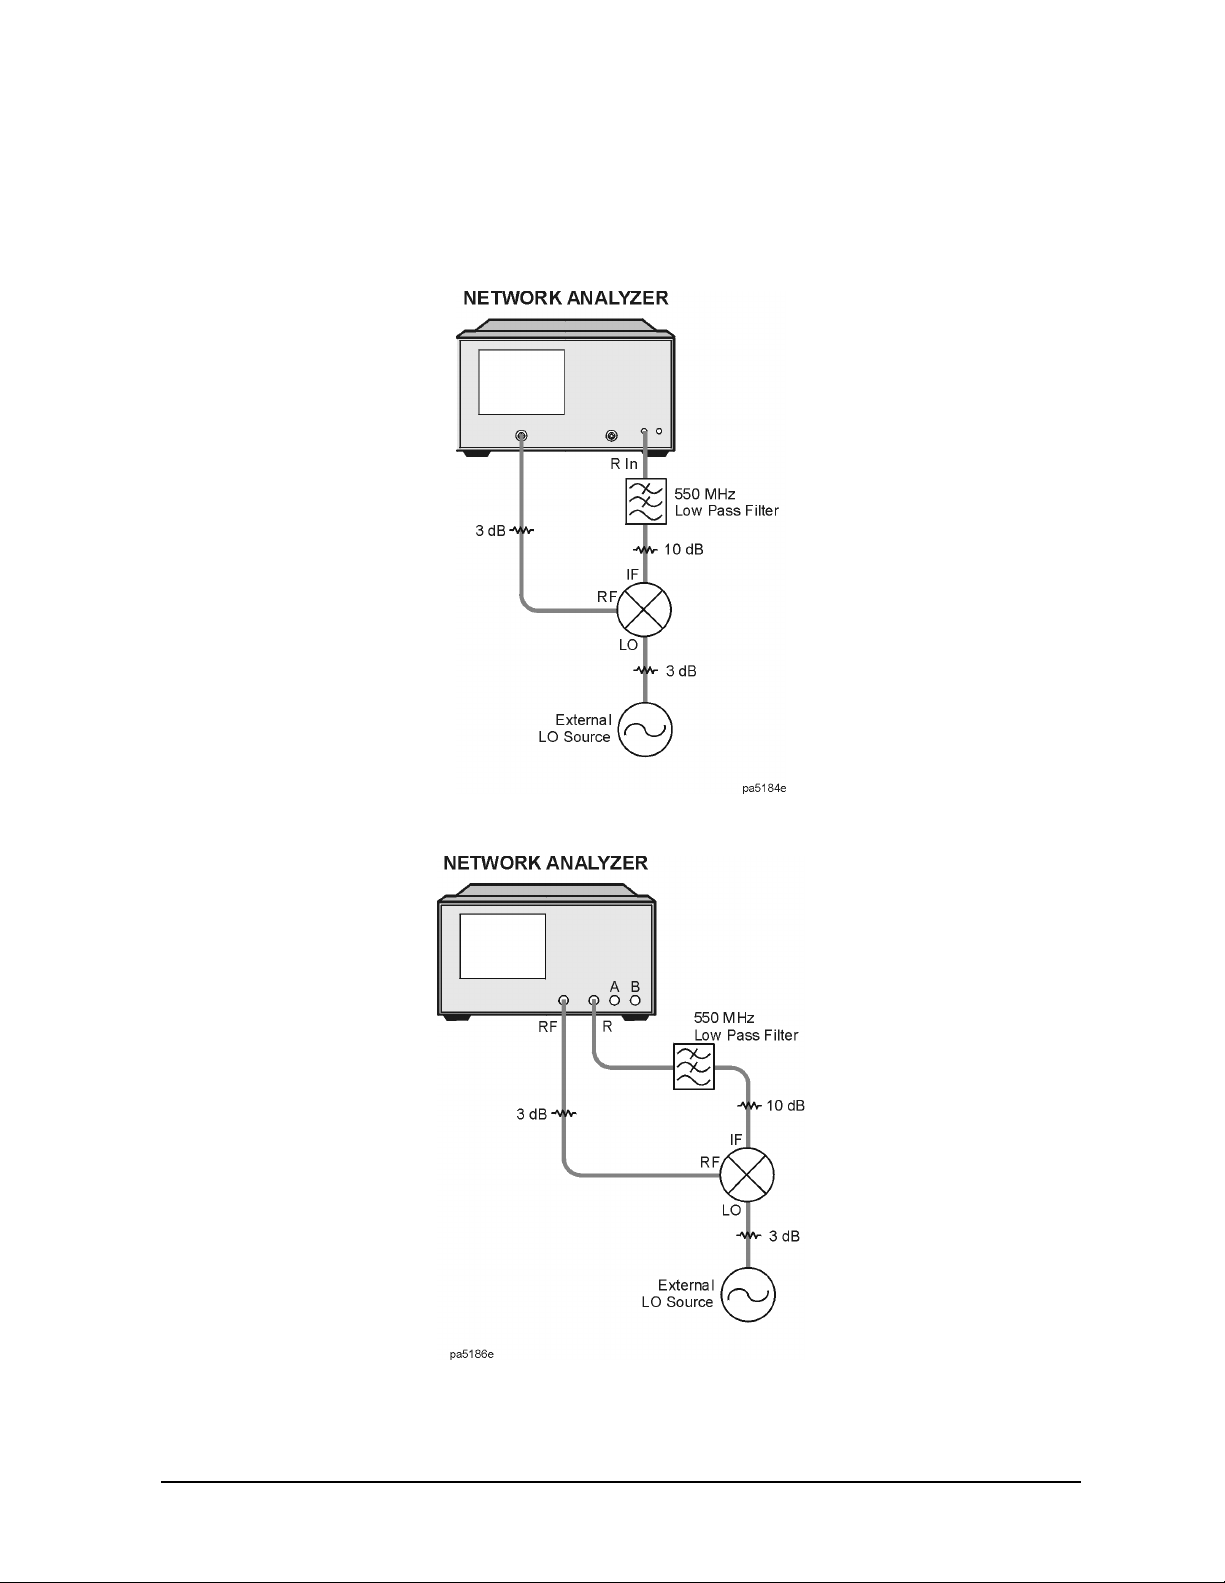
2. Connect the measurement equipment as shown in Step 1 of Figure 1-15 (or Step 1 of
Figure 1-16).
3. Set the desired analyzer RF power to the value which will provide −10 dBm or less to
the R channel input.
For 8753ET/ES, press .
For 8753ES with Option 011, press .
Power
0 x1
Power 0 x1
CAUTION To prevent connector damage, use an adapter (part number 1250-1462) as a
connector saver for R CHANNEL IN.
1-23
Supplement for the User’s Guide
Conversion Loss Using the Frequency Offset Mode
Figure 1-15 8753ET/ES Connections for R Channel and
Source Calibration (IF Range)
Figure 1-16 8753ES Option 011 Connections for R Channel and
Source Calibration (IF Range)
1-24

Supplement for the User’s Guide
INSTRUMENT MODE
FREQ OFFS MENU
LO MENU
FREQUENCY: CW
INPUT PORTS
R
R
SYSTEM CONTROLLER
SET ADDRESSES
ADDRESS: P MTR/GPIB
aa
POWER MTR [ ]
PWRMTR CAL
LOSS/SENSR LISTS
CAL FACTOR
SENSOR A
ADD
FREQUENCY
CAL FACTOR
DONE
DONE
Conversion Loss Using the Frequency Offset Mode
Setting Measurement Parameters for the IF Range
1. From the front panel of the analyzer, set the desired receiver (IF) frequency and source
output power by pressing:
System
Start 100 M/µ Stop 350 M/µ
If the LO frequency is not set to 0 Hz, press:
0 x1
2. Select the measurement trace.
• For 8753ET/ES, press .
• For 8753ES with Option 011, press .
Meas
Meas
The measurement trace is shown on the display.
3. To select the analyzer as the system controller by pressing
Local
.
Performing a Power Meter (Source) Calibration Over the IF Range
1. Calibrate and zero the power meter.
2. Set the power meter's address:
(where aa is the GPIB address of the power meter)
x1
3. Select the appropriate power meter by pressing until the correct
model number is displayed (Agilent 436A or Agilent 438A/437).
NOTE The Agilent E4418B and Agilent E4419B power meters have a “437
emulation” mode. This allows these power meters, with an Agilent
848X-series power sensor, to be used with the network analyzer. In this step,
when selecting a power meter, choose the 438A/437 selection.
4. Press and
enter the correction factors as listed on the power sensor. Press
(where fff is the frequency of the calibration factor in MHz)
fff
nnn
factor. When finished, press .
Cal
M/µ
(where nnn is the calibration factor number) for each correction
x1
1-25

Supplement for the User’s Guide
PWRMTR CAL
ONE SWEEP
TAKE CAL SWEEP
TAKE CAL SWEEP
CALIBRATE MENU
RECEIVER CAL
TAKE RCVR CAL SWEEP
INSTRUMENT MODE
FREQ OFFS MENU
LO MENU
FREQUENCY:CW
RETURN
DOWN CONVERTER
RF < LO
FREQS OFFS ON
Conversion Loss Using the Frequency Offset Mode
5. To perform a one sweep power meter calibration over the IF frequency range at 0 dBm,
press:
Cal
0 x1
NOTE Because power meter calibration requires a longer sweep time, you maywant
to reduce the number of points before pressing . After
the power meter calibration is finished, return the number of points to its
original value and the analyzer will automatically interpolate this
calibration.
6. Tocalibrate the R channel over the IF range,connect the equipment as shown in Step 2
of Figure 1-15 (or Figure 1-16) and press:
Cal
0 x1
❏ The low pass filter is required to limit the range of frequencies passed into the R
channel input port. The filter is selected to pass the IF frequencies for the
measurement but prevent the LO feedthrough and unwanted mixer products from
confusing the phase-lock loop operation.
❏ A pad is used to isolate the filter and improve the IF port match for the mixer.
Once completed, the display should read 0 dBm.
Setting the Analyzer to the RF Frequency Range
1. While the analyzer is still set to the IF frequency range, set the frequency offset mode
LO frequency from the analyzer by pressing:
System
1000 M/µ
The LO menu is used to set only the LO CW frequency. All other settings apply when
using the HP/Agilent 8625A external source.
2. To select the converter type and a high-side LO measurement configuration, press:
3. Turn on frequency offset operation by pressing:
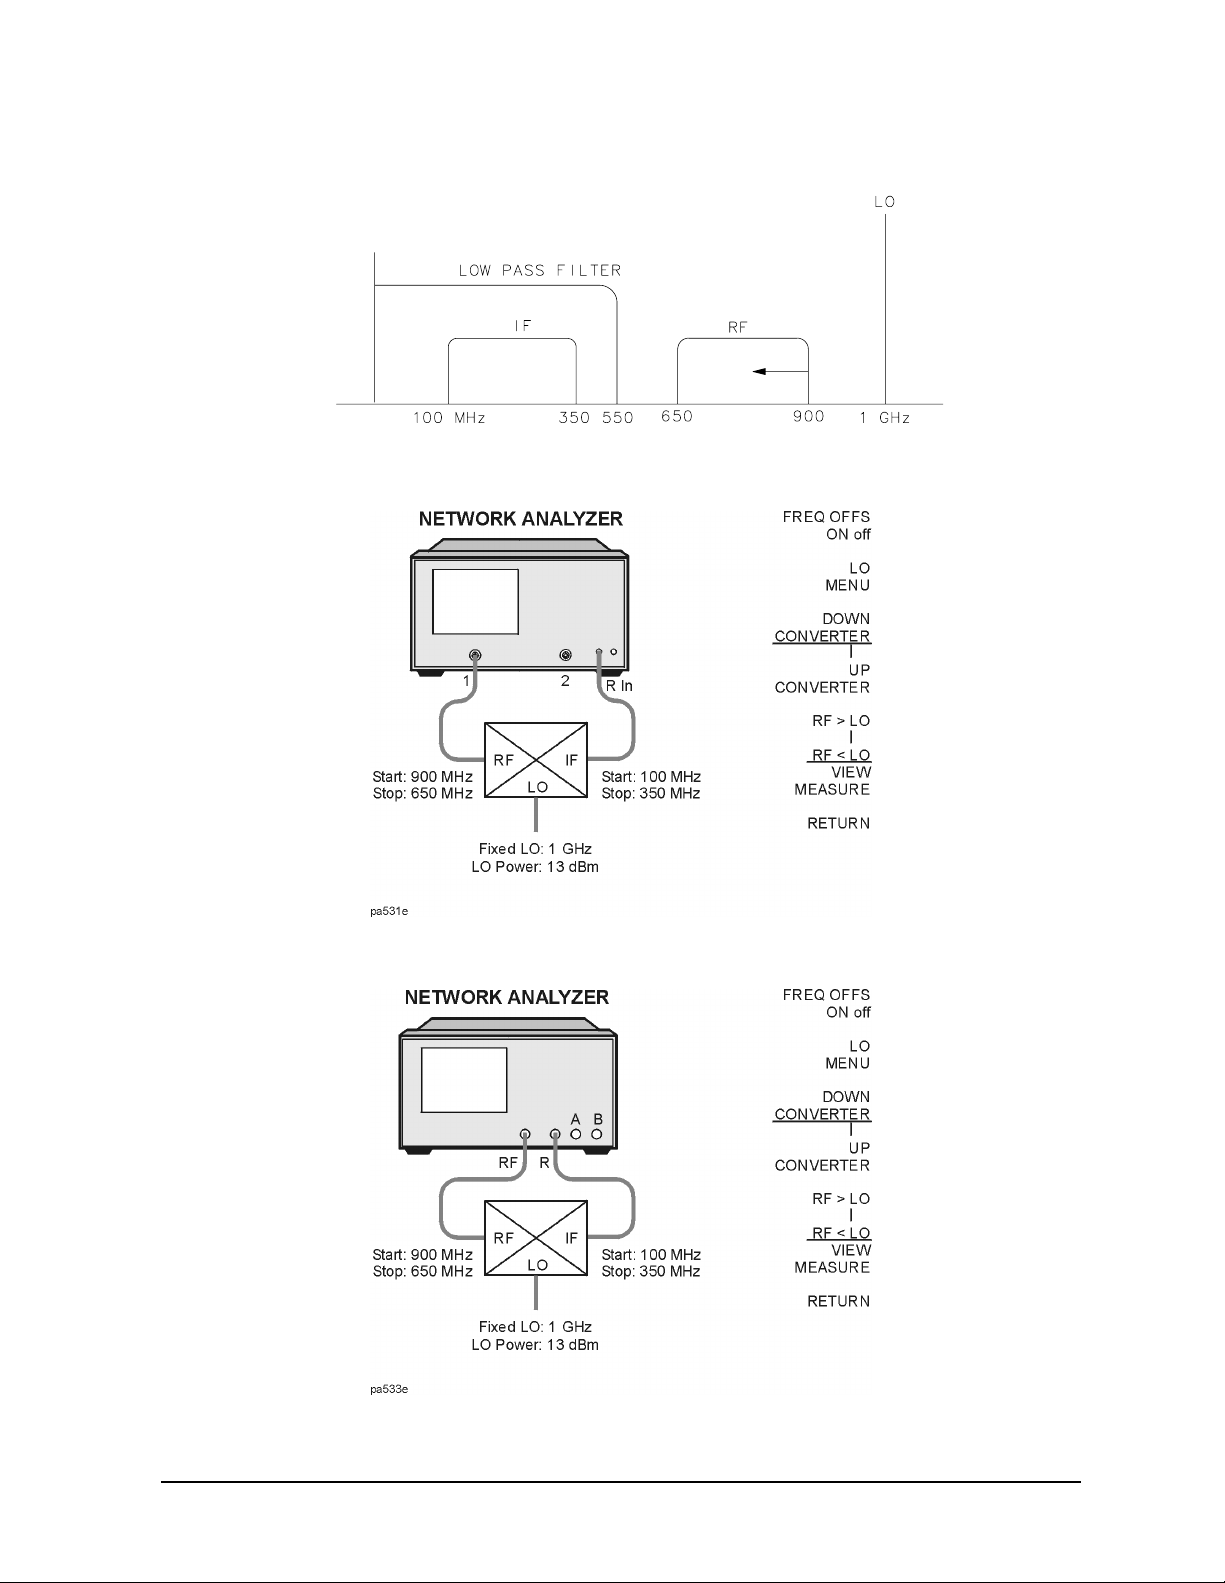
Notice in this high-side LO, down conversion configuration, the analyzer's source is
actually sweeping backwards, as shown in Figure 1-17.
The measurement setup diagram is shown in Figure 1-18 and Figure 1-19. Note the RF
frequency values are shown in this illustration.
1-26
Supplement for the User’s Guide
Conversion Loss Using the Frequency Offset Mode
Figure 1-17 Diagram of Measurement Frequencies
Figure 1-18 8753ET/ES Measurement Setup from Display
Figure 1-19 8753ES Option 011 Measurement Setup from Display
1-27

Supplement for the User’s Guide
PWRMTR CAL
ONE SWEEP
TAKE CAL SWEEP
Conversion Loss Using the Frequency Offset Mode
Performing a Power Meter Calibration Over the RF Range
1. Make the connections as shown in Figure 1-20 (or Figure 1-19) for the one-sweep power
meter calibration over the RF range.
Figure 1-20 8753ET/ES Power Meter Calibration Equipment Setup
for the RF Range
Figure 1-21 8753ES Option 011 Power Meter Calibration Equipment Setup
for the RF Range
2. Use the power meter settings that were set up in steps 1 through 4 of the “Performing a
Power Meter (Source) Calibration Over the IF Range” section.
Perform a one-sweep power meter calibration over the RF frequency range at 0 dBm by
pressing .
Cal
0 x1
NOTE Do not reduce the number of points to perform this power meter calibration.
1-28
Reducing the number of points will turn off the receiver calibration.
Supplement for the User’s Guide
Conversion Loss Using the Frequency Offset Mode
Performing the R-Channel Measurement
1. Connect the equipment as shown in Figure 1-22 (or Figure 1-23).
Figure 1-22 8753ET/ES R-Channel Mixer Measurement Equipment Setup
Figure 1-23 8753ES Option 011 R-Channel Mixer Measurement Equipment Setup
The analyzer is now displaying the conversion loss of the mixer calibrated with power
meter accuracy.
1-29

Supplement for the User’s Guide
AUTOSCALE
Conversion Loss Using the Frequency Offset Mode
2. To view the conversion loss in the best vertical resolution, press
.
Figure 1-24 Conversion Loss Example Measurement
Scale Ref
In this measurement, you set the input power and measured the outputpower. Figure1-24
shows the absolute loss through the mixer versus mixer output frequency. If the mixer
under test contained built-in amplification, then the measurement results would have
shown conversion gain.
1-30

Supplement for the User’s Guide
To View Plot Files on a PC
To View Plot Files on a PC
To modify the color or font size, consult the documentation for the particular application
being used.
NOTE Plot files may also be saved to a floppy disk as a JPEG file and used on a
personal computer. Refer to “Saving in Graphical (JPEG) Form” on page 1-34.
1-31

Supplement for the User’s Guide
To View Plot Files on a PC
This page intentionally left blank.
1-32

Supplement for the User’s Guide
SAVE FILE FORMATS
TEXT FMT [CSV]
FILETYPE: TEXT
SAVE FILE
Saving Measurement Results
Saving Measurement Results
Saving in Textual (CSV) Form
Textual measurement results can be saved in a comma-separated value (CSV) format and
imported into a spreadsheet application. Additional information is also saved as a
preamble to the measurement results. The saved information includes:
• network analyzer model number and firmware version
• date the file was saved
• type of measurement being done
• start and stop frequencies
• sweep time
• port power
• IF bandwidth
• channel number
• number of points
• format
• the frequency (or time) and the real and imaginary measurement values for each of
points measured
1. Press .
Save/Recall
2. Make sure that is displayed.
3. Make sure that is underlined. If it is not underlined, press the
softkey so that TEXT is underlined.
4. Insert a 3.5-inch floppy disk in the network analyzer’s disk drive.
5. Press to save the display information as text in the CSV format.
The text file may be retrieved from the floppy disk on personal computer and can be
imported into an application that accepts text in the comma-separated value format,
such as a spreadsheet.
1-33

Supplement for the User’s Guide
SAVE FILE FORMATS
GRAPH FMT [JPG]
FILETYPE: GRAPHIC
SAVE FILE
Saving Measurement Results
How the Analyzer Names These Files Sequentially
When text files are saved, the analyzer generates the file names automatically in the
following format:
txtcss.csv
where: txt is a constant that indicates that this is a text file,
c is the indicator of the channel (1−4) on which the measurement data was
taken (channel-file index number).
ss is a 2-digit, sequential indicator of the measurement (file index number). The
file index number may be numbered from 00−31. As the next measurement is
taken, the file index number is incremented.
If all four channels are making measurements and a save is performed, there
will be four channel numbers that share the same file index number. For
example, the files would be named txt100.csv, txt200.csv, txt300.csv, and
txt400.csv. If a measurement does not include all four channels, unused
channel-file index numbers will not be used by the next measurement.
However, if all of the files that share a file index number are erased, that file
index number will be re-used.
csv is the file format, comma-separated value in this case.
Saving in Graphical (JPEG) Form
Graphical measurement results can be saved in JPEG format and used as an illustration
in a text editor or desktop publishing application.
1. Press .
Save/Recall
2. Make sure that is displayed.
3. Make sure that is underlined. If it is not underlined, press the
softkey so that GRAPHIC is underlined.
4. Insert a 3.5-inch floppy disk in the network analyzer’s disk drive.
5. Press to save the display as a graphic in the JPEG format.
The graphic file may be retrieved from the floppy disk on personal computer and can be
imported into an application that accepts graphics in the JPEG format.
1
1. The network analyzer firmware is based in part on the work of the Independent JPEG Group.
1-34
Supplement for the User’s Guide
DEFINE STANDARD
DELAY/THRU
MODIFY STD DEFINITION
SPECIFY OFFSET
OFFSET DELAY
MAXIMUM FREQUENCY
STD OFFSET DONE
KIT DONE (MODIFIED)
SAVE USER KIT
Calibrating for Non-Coaxial Devices (ES Analyzers Only)
Calibrating for Non-Coaxial Devices (ES Analyzers Only)
TRL Error Correction
Modify the Standard Definitions
5. To define the LINE/MATCH standard, press:
6 x1
.08 G/n
Enter a frequency greater than the maximum frequency range of the analyzer. For
example, press . Then, press .
Label the Calibration Kit
19. To save the newly defined kit into nonvolatile memory, press:
10 G/n
NOTE Refer to “Saving Modified Calibration Kits to a Disk” in the “Operating
Concepts” chapter for information about saving modified calibration kits,
along with calibration data and instrument states, to a disk.
1-35

Supplement for the User’s Guide
KIT DONE (MODIFIED)
SAVE USER KIT
LRM Error Correction
LRM Error Correction
Create a User-Defined LRM Calibration Kit
19. To save the newly defined kit into nonvolatile memory, press:
NOTE Refer to “Saving Modified Calibration Kits to a Disk” in the “Operating
Concepts” chapter for information about saving modified calibration kits,
along with calibration data and instrument states, to a disk.
1-36

Supplement for the User’s Guide
CAL KIT
SELECT CAL KIT
USER KIT
SAVE STATE
Modifying Calibration Kits
Modifying Calibration Kits
Saving Modified Calibration Kits to a Disk
The calibration kit, along with any calibration data and other instrument state
information, can be saved to an ISTATEfile on a floppy disk. To save a modified calibration
kit with an instrument state, press:
Cal
Save/Recall
1-37

2 Supplement for the Reference Guide
2-1

Supplement for the Reference Guide
In This Chapter
In This Chapter
This chapter contains the supplemental information changes to the reference guides that
coincide with the release of firmware revision 7.66. These changes pertain to the following
reference guides.
• 8753ET and 8753ES Network Analyzers Reference Guide (part number 08753-90473)
• 8753ES Option 011 Network Analyzer Reference Guide (part number 08753-90480)
The following list describes the changes to 8753ET and 8753ES reference guides printed
prior to July 2000. Each of the changes are described in detail in the remainder of this
chapter. The page references in this list refer to page numbers in this supplement.
• Menu Maps Chapter
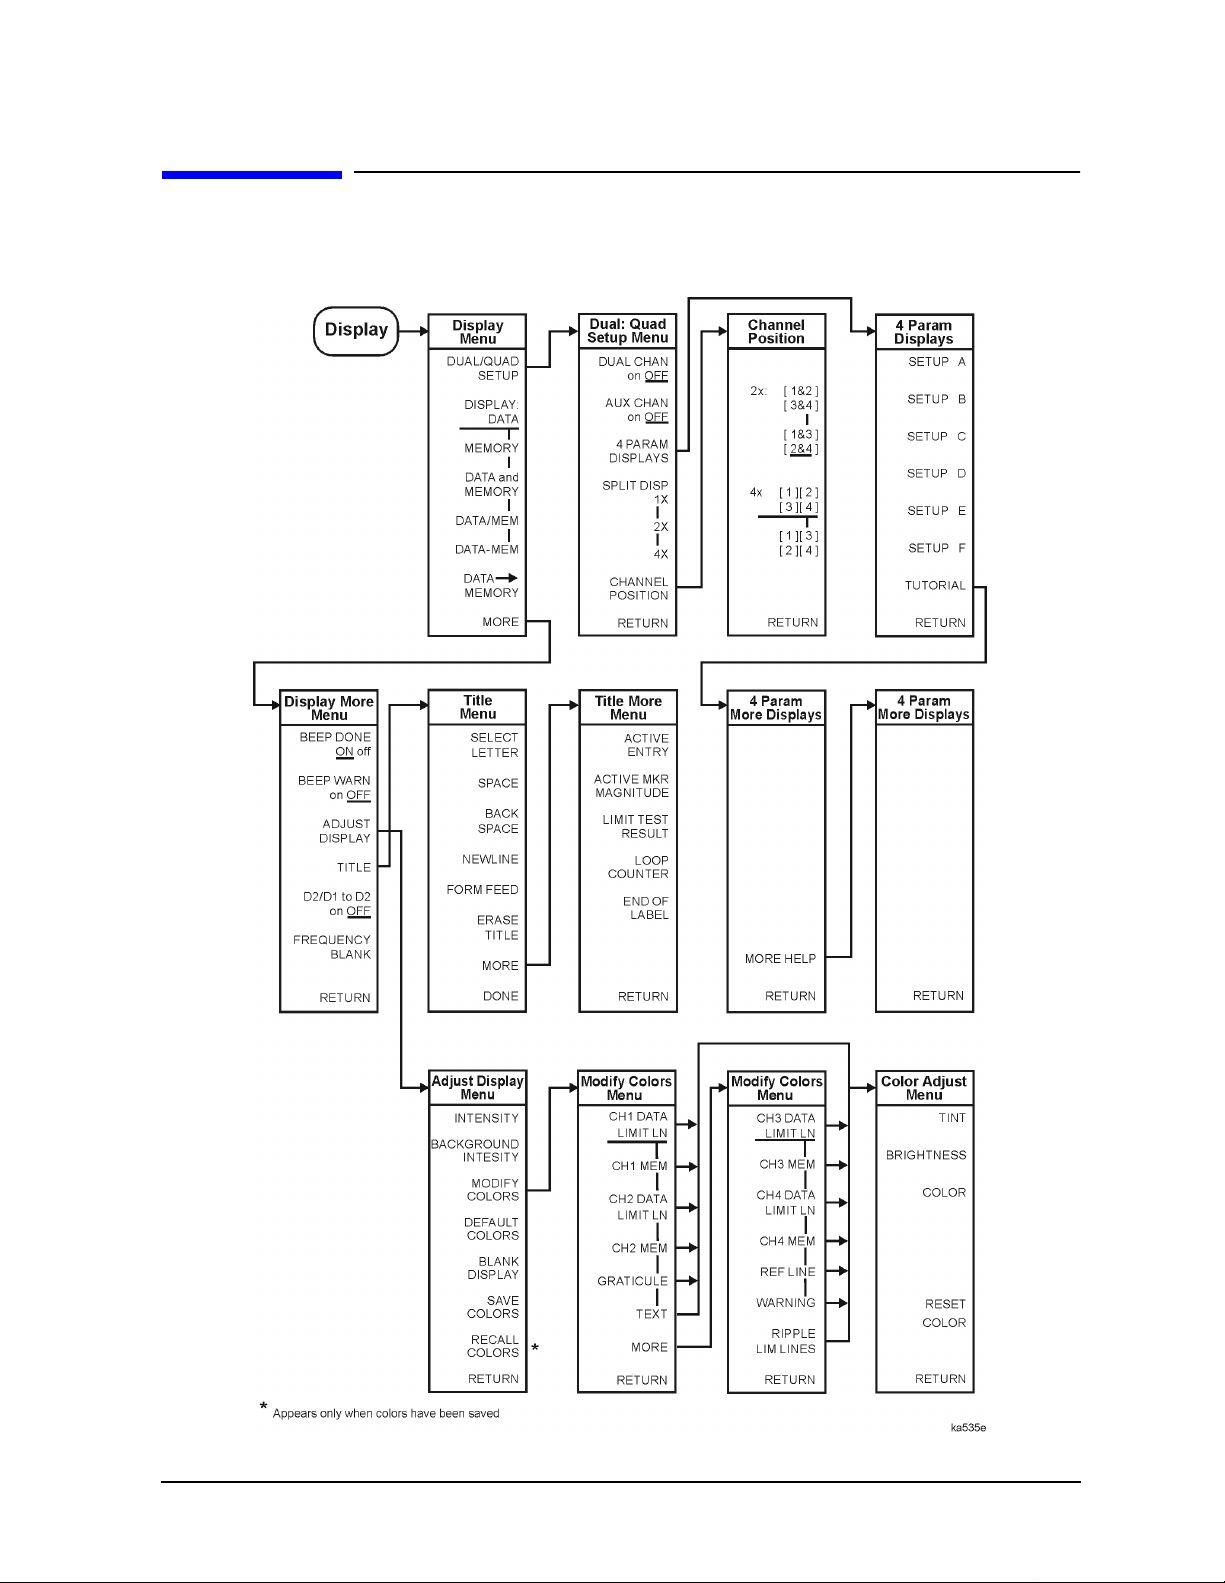
— Replace the Display menu map using Figure 2-1 on page 2-3.
— Replace the Save/Recall menu map using Figure 2-2 on page 2-4.
— Replace the System menu map for the 8753ET using Figure 2-3.
— Replace the System menu map for the 8753ES using Figure 2-4.
• Hardkey/Softkey Reference Chapter
— Replace the description for five existing softkeys. See “Existing Softkeys” on
page 2-9.
— Add 24 new softkeys and their descriptions. See “New Softkeys” on page 2-10.
• Error Messages Chapter
— Add four new error messages. See to “Error Messages” on page 2-15.
• Options and Accessories Chapter
— Update the Agilent Technologies Internet URL. See “Accessories Available” on
page 2-16.
• Preset State and Memory Allocation Chapter
— Add the Limit Menu preset conditions for Ripple Limits and Bandwidth Limit to the
Preset Conditions table. See “Preset Conditions” on page 2-17.
2-2
Menu Maps
Figure 2-1 Menu Map for Display
Supplement for the Reference Guide
Menu Maps
2-3

Supplement for the Reference Guide
Menu Maps
Figure 2-2 Menu Map for Save/Recall
2-4

Set Clock
Menu
TIME STAMP
ON off
ROUND
SECONDS
SET
MINUTES
SET
HOUR
SET
DAY
SET
MONTH
SET
YEAR
RETURN
User Settings
Menu
PRESET
SETTINGS
K36 MODE
on OFF
K39 MODE
on OFF
Preset Settings
Menu
CAL INTERP
ON off
Select Limits
Menu
LIMIT LINE
RIPPLE
LIMIT
BANDWIDTH
LIMIT
RETURN
Ripple
Test Menu
RIPL LIMIT
on OFF
RIPL TEST
on OFF
RIPL VALUE
[]
OFF
RIPL VALUE
BAND
EDIT
RIPL LIMIT
RETURN
Edit Ripple
Limits Menu
FREQUENCY
BAND
MINIMUM
FREQUENCY
MAXIMUM
FREQUENCY
MAXIMUM
RIPPLE
DELETE
ADD
CLEAR
LIST
DONE
Bandwidth
Test Menu
BW TEST
on OFF
BW DISPLAY
on OFF
BW MARKER
on OFF
N DB
POINTS
MINIMUM
BANDWIDTH
MAXIMUM
BANDWIDTH
RETURN
.
Limits
Menu
LIMIT LINE
on OFF
LIMIT TEST
on OFF
BEEP FAIL
on OFF
EDIT
LIMIT LINE
LIMIT LINE
OFFSETS
RETURN
Edit Limits
Menu
SEGMENT
EDIT
DELETE
ADD
CLEAR
LIST
LIMIT
TYPE
DONE
Edit Segment
Menu
STIMULUS
VALUE
MARKER
STIMULUS
UPPER
LIMIT
LOWER
LIMIT
DELTA
LIMITS
MIDDLE
VALUE
MARKER
MIDDLE
DONE
Edit List
Menu
SEGMENT
EDIT
DELETE
CLEAR
DONE
ADD
LIST
Edit Sensor
Menu
FREQUENCY
CAL
FACTOR
DONE
****
System
System
Menu
SET CLOCK
CONFIGURE
MENU
LIMIT
MENU
TRANSFORM
MENU
HARMONIC
MEAS
INSTRUMENT
MODE
SERVICE
MENU
*
**
***
Configure
Menu
RAW OFFSET
ON off
SPUR AVOID
ON off
USER
SETTINGS
RETURN
Instrument
Mode Menu
NETWORK
ANALYZER
EXT SOURCE
AUTO
EXT SOURCE
MANUAL
TUNED
RECEIVER
FREQ OFFS
MENU
RETURN
Offset Limits
Menu
STIMULUS
OFFSET
AMPLITUDE
OFFSET
MARKER
AMP. OFS.
RETURN
Frequency
Offset Menu
FREQ OFFS
on OFF
LO
MENU
DOWN
CONVERTER
CONVERTER
UP
RF > LO
RF < LO
VIEW
MEASURE
RETURN
FREQUENCY :
LO CONTROL
LO SOURCE
Transform
Menu
TRANSFORM
SET FREQ
LOW PASS
LOW PASS
IMPULSE
LOW PASS
BANDPASS
WINDOW
SPECIFY
RETURN
LO
Menu
CW
SWEEP
POWER :
FIXED
SWEEP
on OFF
ADDRESS
VIEW
MEASURE
RETURN
on OFF
STEP
GATE
Specify Gate
Harmonic
Mode Menu
HARMONIC
OFF
SECOND
THIRD
RETURN
Menu
GATE
on OFF
GATE:
START
STOP
CENTER
SPAN
GATE
SHAPE
RETURN
Window
Menu
WINDOW:
MAXIMUM
NORMAL
MINIMUM
USE MEMORY
AMPLITUDE
Service
Menu
TESTS
TEST
OPTIONS
SELF
DIAGNOSIS
SERVICE
MODES
ANALOG BUS
on OFF
PEEK /
POKE
FIRMWARE
REVISION
RETURN
on OFF
DEMOD:
OFF
PHASE
RETURN
Gate Shape
Menu
GATE SHAPE
MAXIMUM
NORMAL
MINIMUM
RETURN
Tests
Menu
EXECUTE
TEST
INTERNAL
TESTS
EXTERNAL
TESTS
SYS VER
TESTS
ADJUSTMENT
TESTS
DISPLAY
TESTS
RETURN
WIDE
Limit Type
Menu
SLOPING
LINE
FLAT
LINE
SINGLE
POINT
RETURN
Test Options
Menu
CONTINUE
TEST
REPEAT
on OFF
RECORD
on OFF
LIMITS
[ NORM ]
PWR LOSS
on OFF
LOSS / SENSR
LISTS
DUMP GRAPH
on OFF
RETURN
Offset Table
Menu
USE SENSOR
CAL FACTOR
CAL FACTOR
A / B
SENSOR A
SENSOR B
POWER
LOSS
RETURN
Service Modes
Menu
FRACN TUNE
on OFF
SRC ADJUST
MENU
SOURCE PLL
ON off
PLL AUTO
ON off
PLL DIAG
on OFF
PLL PAUSE
[ CONT ]
MORE
RETURN
Source
Adjust Menu
SRC TUNE
on OFF
SRC TUNE
FREQ
ALC
ON off
PWR DAC
on OFF
SLOPE
DAC
SRC ADJUST
DACS
HB FLTR SW
on OFF
RETURN
Peek / Poke
Menu
PEEK / POKE
ADDRESS
MEMORY
RETURN
PEEK
POKE
RESET
Adjust DACS
Menu
SLOPE
OFFSET DAC
SQUARE LAW
LINEAR DAC
DETECTOR
OFFSET DAC
OFFSET DAC
LOG
WRITE
EEPROM
RETURN
Serve Mode
More Menu
SAMPLE COR
IF GAIN
IF GAIN
IF GAIN
SPUR TEST
STORE EEPR
SPUR AVOID
RETURN
ON off
AUTO
ON
OFF
on OFF
on OFF
ON off
Only appears on instruments
*
equipped with Option 010.
Only appears on instruments
**
equipped with Option 002.
Service
***
****
menu key descriptions are
located in the 8753D Option 011
Network Analyzer Service Guide.
Loss appears thru the power loss path.
ka538e
Menu Map for System (8753ET only)

Set Clock
Menu
TIME STAMP
ON off
ROUND
SECONDS
SET
MINUTES
SET
HOUR
SET
DAY
SET
MONTH
SET
YEAR
RETURN
User Settings
Menu
PRESET
SETTINGS
K36 MODE
on OFF
K39 MODE
on OFF
*****
******
Preset Settings
Menu
CAL INTERP
ON off
Select Limits
Menu
LIMIT LINE
RIPPLE
LIMIT
BANDWIDTH
LIMIT
RETURN
Ripple
Test Menu
RIPL LIMIT
on OFF
RIPL TEST
on OFF
RIPL VALUE
[]
OFF
RIPL VALUE
BAND
EDIT
RIPL LIMIT
RETURN
Edit Ripple
Limits Menu
FREQUENCY
BAND
MINIMUM
FREQUENCY
MAXIMUM
FREQUENCY
MAXIMUM
RIPPLE
DELETE
ADD
CLEAR
LIST
DONE
Bandwidth
Test Menu
BW TEST
on OFF
BW DISPLAY
on OFF
BW MARKER
on OFF
N DB
POINTS
MINIMUM
BANDWIDTH
MAXIMUM
BANDWIDTH
RETURN
.
Limits
Menu
LIMIT LINE
on OFF
LIMIT TEST
on OFF
BEEP FAIL
on OFF
EDIT
LIMIT LINE
LIMIT LINE
OFFSETS
RETURN
Edit Limits
Menu
SEGMENT
EDIT
DELETE
ADD
CLEAR
LIST
LIMIT
TYPE
DONE
Edit Segment
Menu
STIMULUS
VALUE
MARKER
STIMULUS
UPPER
LIMIT
LOWER
LIMIT
DELTA
LIMITS
MIDDLE
VALUE
MARKER
MIDDLE
DONE
Edit List
Menu
SEGMENT
EDIT
DELETE
CLEAR
DONE
ADD
LIST
Edit Sensor
Menu
FREQUENCY
CAL
FACTOR
DONE
****
System
System
Menu
SET CLOCK
CONFIGURE
MENU
LIMIT
MENU
TRANSFORM
MENU
HARMONIC
MEAS
INSTRUMENT
MODE
SERVICE
MENU
*
**
***
Configure
Menu
TESTSET SW
CONTINUOUS
RAW OFFSET
ON off
SPUR AVOID
ON off
USER
SETTINGS
RETURN
Instrument
Mode Menu
NETWORK
ANALYZER
EXT SOURCE
AUTO
EXT SOURCE
MANUAL
TUNED
RECEIVER
FREQ OFFS
MENU
RETURN
Offset Limits
Menu
STIMULUS
OFFSET
AMPLITUDE
OFFSET
MARKER
AMP. OFS.
RETURN
Frequency
Offset Menu
FREQ OFFS
on OFF
LO
MENU
DOWN
CONVERTER
CONVERTER
UP
RF > LO
RF < LO
VIEW
MEASURE
RETURN
FREQUENCY :
LO CONTROL
LO SOURCE
Transform
Menu
TRANSFORM
SET FREQ
LOW PASS
LOW PASS
IMPULSE
LOW PASS
BANDPASS
WINDOW
SPECIFY
RETURN
LO
Menu
CW
SWEEP
POWER :
FIXED
SWEEP
on OFF
ADDRESS
VIEW
MEASURE
RETURN
on OFF
STEP
GATE
Specify Gate
Harmonic
Mode Menu
HARMONIC
OFF
SECOND
THIRD
RETURN
Menu
GATE
on OFF
GATE:
START
STOP
CENTER
SPAN
GATE
SHAPE
RETURN
Window
Menu
WINDOW:
MAXIMUM
NORMAL
MINIMUM
USE MEMORY
AMPLITUDE
Service
Menu
TESTS
TEST
OPTIONS
SELF
DIAGNOSIS
SERVICE
MODES
ANALOG BUS
on OFF
PEEK /
POKE
FIRMWARE
REVISION
RETURN
on OFF
DEMOD:
OFF
PHASE
RETURN
Gate Shape
Menu
GATE SHAPE
MAXIMUM
NORMAL
MINIMUM
RETURN
Tests
Menu
EXECUTE
TEST
INTERNAL
TESTS
EXTERNAL
TESTS
SYS VER
TESTS
ADJUSTMENT
TESTS
DISPLAY
TESTS
RETURN
WIDE
Limit Type
Menu
SLOPING
LINE
FLAT
LINE
SINGLE
POINT
RETURN
Test Options
Menu
CONTINUE
TEST
REPEAT
on OFF
RECORD
on OFF
LIMITS
[ NORM ]
PWR LOSS
on OFF
LOSS / SENSR
LISTS
DUMP GRAPH
on OFF
RETURN
Offset Table
Menu
USE SENSOR
CAL FACTOR
CAL FACTOR
A / B
SENSOR A
SENSOR B
POWER
LOSS
RETURN
Service Modes
Menu
FRACN TUNE
on OFF
SRC ADJUST
MENU
SOURCE PLL
ON off
PLL AUTO
ON off
PLL DIAG
on OFF
PLL PAUSE
[ CONT ]
MORE
RETURN
Source
Adjust Menu
SRC TUNE
on OFF
SRC TUNE
FREQ
ALC
ON off
PWR DAC
on OFF
SLOPE
DAC
SRC ADJUST
DACS
HB FLTR SW
on OFF
RETURN
Peek / Poke
Menu
PEEK / POKE
ADDRESS
MEMORY
RETURN
PEEK
POKE
RESET
Adjust DACS
Menu
SLOPE
OFFSET DAC
SQUARE LAW
LINEAR DAC
DETECTOR
OFFSET DAC
OFFSET DAC
LOG
WRITE
EEPROM
RETURN
Serve Mode
More Menu
SAMPLE COR
IF GAIN
IF GAIN
IF GAIN
SPUR TEST
STORE EEPR
SPUR AVOID
RETURN
ON off
AUTO
ON
OFF
on OFF
on OFF
ON off
**
***
****
*****
******
Only appears on instruments
*
equipped with Option 010.
Only appears on instruments
equipped with Option 002.
Service
menu key descriptions are
located in the 8753D Option 011
Network Analyzer Service Guide.
Loss appears thru the power loss path.
Only appears on instruments equipped
with Option K36.
Only appears on instruments equipped
with Option K39.
ka537e
Menu Map for System (8753ES only)

Supplement for the Reference Guide
ADD
SEGMENT
CLEAR LIST
DELETE
MAXIMUM FREQUENCY
MINIMUM FREQUENCY
OFFSET DELAY
Hardkey/Softkey Reference
Hardkey/Softkey Reference
Analyzer Functions
Existing Softkeys
The description of these softkeys changed for reference guides printed prior to July 2000:
1) displays the edit segment menu and adds a new
segment to the endof the list. The new segment is initially
a duplicate of the segment indicated by the pointer > and
selected with the softkey.
2) adds a new frequency band to the Ripple Limit list
which is indicated by the pointer >. The new frequency
band is a duplicate of the most recently selected frequency
band.
deletes all segments or bands in the list.
deletes the segment or the frequency band indicated by
the > pointer.
is used to:
1) define the highest frequency at which a calibration kit
standard can be used during measurement calibration. In
waveguide, this is normally the upper cutoff frequency of
the standard.
or
2) set the maximum frequency of the selected frequency
band when setting up ripple test parameters.
is used to:
1) define the lowest frequency at which a calibration kit
standard can be used during measurement calibration. In
waveguide, this must be the lower cutoff frequency of the
standard, so that the analyzer can calculate dispersive
effects correctly (see ).
or
2) set the minimum frequency of the selected frequency
band when setting up ripple test parameters.
2-9

Supplement for the Reference Guide
BANDWIDTH LIMIT
BW DISPLAY on OFF
BW MARKER on OFF
BW TEST on OFF
N DB POINTS
MINIMUM BANDWIDTH
MAXIMUM BANDWIDTH
EDIT RIPL LIMIT
Hardkey/Softkey Reference
New Softkeys
These are new softkeys and do not appear in reference guides printed prior to July 2000:
selects the bandwidth limit line choice. This selection
leads to the menu used to define and test bandwidth limits
of a bandpass filter. Refer to the “Using Bandwidth Limits
to Test a Bandpass Filter” section in the “Making
Measurements” chapter of the user’s guide.
displays the measured bandwidth value to the right of the
pass/fail message.
displays the cutoff frequencies of the bandwidth using
markers on the data trace.
turns bandpass filter bandwidth testing on or off. When
bandwidth testing is on, the analyzer locates the
maximum point of the data trace and uses it as the
reference from which to measure the filter’s bandwidth.
Then, the analyzer determines the two cutoff frequencies
of the bandpass filter. The cutoff frequencies are the two
points on the data trace at a user-specified amplitude
below the reference point. The cutoff frequencies are also
referred to as the N dB Points where “N” is defined as the
number of decibels below the peak of the bandpass that
the filter is specified. (The amplitude is specified using the
softkey.)
The bandwidth is the frequency difference between the
two cutoff frequencies. The bandwidth is compared to the
user-specified minimum and maximum bandwidth limits
(entered using the and
softkeys).
If the test passed, a message is displayed in green text in
the upper left portion of the LCD. An example of this
message is: BW1: Pass, where the “1” indicates the
channel where the bandwidth test is performed. If the
bandwidth test does not pass, a fail message indicating
whether the bandpass was too wide or too narrow is
displayed in red text. An example of this message is BW1:
Wide.
selects the menu used to edit the ripple limits. The edit
ripple limits menu allows you to add, change, or delete
ripple limits for the ripple test.
2-10

Supplement for the Reference Guide
FILETYPE: GRAPHIC
SAVE FILE
GRAPH FMT [ ]
FILETYPE: TEXT
SAVE FILE
TEXT FMT [ ]
FREQUENCY BAND
GRAPH FMT [ ]
FILETYPE: GRAPHIC
LIMIT MENU
MAXIMUM BANDWIDTH
MAXIMUM RIPPLE
MINIMUM BANDWIDTH
N DB POINTS
RECALL KEYS
RIPL LIMIT on OFF
Hardkey/Softkey Reference
saves the display to the disk drive as a graphic file when
is pressed. The format of the graphic file is
determined by the selection.
saves the display to the disk drive as a text file
when is pressed. The form of the text file is
determined by the selection.
selects an existing frequency band to be reviewed, edited,
or deleted. The maximum numberof frequencybands is 12
(numbered 1 to 12).
sets the format of the graphic file when
is selected. The only graphic
selection currently available is the JPEG format.
accesses the menu thatallows you to set up the three limit
line types: standard limit lines, ripple limit lines, and
bandwidth limit lines.
sets the maximum bandwidth value of the bandwidth test
limits.
sets the maximum ripple allowed ofthe selectedfrequency
band. The maximum allowable ripple is 100 dB.
sets the minimum bandwidth value of the bandwidth test
limits.
sets the N dB point which is used to determine the
bandwidth test cutoff frequencies. Enter the number of
decibels below the peak of the bandpass that the filter is
specified.
accesses two recall keys which allows you to set the recall
keys menu as the initial menu displayed when
Save/Recall
is pressed or select specific registers to recall.
displays lines that represent the ripple limits when the
ripple test is set to ON.
2-11

Supplement for the Reference Guide
RIPL TEST on OFF
RIPL VALUE [ ]
RIPL VALUE BAND
RIPL VALUE [ ]
Hardkey/Softkey Reference
turns ripple testing on oroff. When rippletesting is on, the
analyzer sets the lower ripple limit line at the lowest
amplitude point within the frequency band and sets the
upper limit line at the user-specified amplitude above. If
the trace data remains at or below the upper limit line,
that portion of the ripple test passes.If the trace data rises
above the upper limit line within the frequency band, the
test fails. Data within each frequency band is compared
with the defined ripple limit of the band. The ripple test
checks each frequency band using this method. A
maximum of 12 frequency bands can be tested on each
channel. These bands may overlap in frequency. If all of
the channel’s frequency bands pass the ripple test, the
analyzer displays a pass message.
If the test passed, a message is displayed in orange text in
the upper right portion of the LCD. An example of this
message is: RIPL1 PASS, where the “1” indicates the
channel where the ripple test is performed. If the ripple
test does not pass, a fail message is displayed in red text.
An example of this message is RIPL1 FAIL.
displays the ripple value of the selected frequency band.
The ripple value can be displayed in two ways or turned
off.Selecting OFF removes the displayedripple value from
the display. Selecting ABSOLUTE or MARGIN displays
the ripple value. The ripple value is preceded on the
display by an indicator of the selected band. For example,
when the ripple value is preceded by “B2”, this indicates
that the ripple value shown is for Band 2. The frequency
band indicator and ripple value are displayed in the same
color as the pass/fail message for the overall ripple test.
When ABSOLUTE is selected, the display shows the
absolute ripple of the data trace within the frequency
band.
When MARGIN is selected, the display shows the
difference between the maximum allowable ripple and the
absolute ripple valuewithin the frequencyband. When the
margin value is preceded by a plus sign (+), this indicates
that the ripple within the selected frequency band is
passing by the value shown. When the margin value is
preceded by a negative sign (−), this indicates that the
ripple within the selected band is failing by the value
shown.
2-12
selects a frequency band to display the ripple value.When
is set to the absolute or margin choices,
this softkey selects the ripple measurement for the
selected frequency band.

Supplement for the Reference Guide
RIPPLE LIM LINES
RIPPLE LIMIT
SAVE FILE
SAVE FILE FORMATS
TEXT FMT [ ]
FILETYPE: TEXT
Hardkey/Softkey Reference
selects ripple limit line trace on the display color
modification.
selects the ripple limit line choice. This selection leads to
menus used to define ripple limits or specifications with
which to compare a test device. Refer to the “Using Ripple
Limits to Test a Device” section in the “Making
Measurements” chapter of the user’s guide.
saves the display information to the disk drive. The type of
information saved is dependent on the FILETYPE
selection. The FILETYPE selection can either be graphic
or text.
accesses the save file menu which allows you to save the
display information to the disk drive as either graphic or
textual information.
sets the format of the text file when is
selected. The only text selection currently available is the
comma separated values (CSV) format.
2-13

Supplement for the Reference Guide
Hardkey/Softkey Reference
This page intentionally left blank.
2-14

Error Messages
Error Messages in Alphabetical Order
BANDWIDTH LIMIT INVALID: MIN BW > MAX BW
Supplement for the Reference Guide
Error Messages
Information
Message
CAUTION: FLOPPY DISK IS FULL
Error Number
218
CAUTION: TOO MANY SEGMENTS OR POINTS
Information
Message
RIPPLE LIMIT TABLE EMPTY
Information
Message
The bandwidth test has a minimum bandwidth greater than the maximum
bandwidth. Change the minimum bandwidth to a frequency less than the
frequency of the maximum bandwidth or change the maximum bandwidth to a
frequency greater than the frequency of the minimum bandwidth.
This message is displayed if you try to save files to the floppy disk that does not
have enough memory toperform the save task. Correctby inserting a newfloppy
disk in the front panel disk drive or by erasing files from the current floppy disk.
This message is displayed if you try to insert too many segments or points using
your current function.
The ripple limit table does not have any frequency bands defined. Add at least
one frequency band to the ripple limit table for ripple testing.
Error Messages in Numerical Order
Error
Error
Number
218 CAUTION: FLOPPY DISK IS FULL
2-15

Supplement for the Reference Guide
Options and Accessories
Options and Accessories
Accessories Available
For accessories not listed in this section, refer to the configuration guide for your analyzer
or refer to the following Internet site:
www.agilent.com/find/8753
2-16

Preset State and Memory Allocation
Preset State
Table 2-1 Preset Conditions
Preset Conditions Preset Value
Limit Menu
Limit Lines
Limit Lines Off
Limit Testing Off
Limit List Empty
Edit Mode Upper/Lower Limits
Stimulus Offset 0 Hz
Supplement for the Reference Guide
Preset State and Memory Allocation
Amplitude Offset 0 dB
Limit Type Sloping Line
Beep Fail Off
Ripple Limit
Ripple Limit Off
Ripple Test Off
Bandwidth Limit
Bandwidth Test Off
Bandwidth Display Off
Bandwidth Marker Off
2-17

3 Supplement for the Programmer’s
Guide
3-1

Supplement for the Programmer’s Guide
In This Chapter
In This Chapter
This chapter contains the supplemental information changes to the programmer’s guide
that coincides with the release of firmware revision 7.66. These changes pertain to:
The Programmer’s Guide for 8719ET/ES, 8720ET/ES, 8722ET/ES, and 8753ET/ES
Network Analyzers (part number 08753-90475)
The following list describesthe changesto programmer’sguides printed prior to July 2000.
Each of the changes are described in detail in the remainder of this chapter. The page
references in this list refer to page numbers in this supplement.
• Alphabetical Command Reference Chapter
— Add 20 programming commands. See the “Alphabetical Command Reference” on
page 3-3.
• Appendix A: Preset Conditions
— Replace the Limit Line Conditions table in the “Preset State” section using Table 3-1
on page 3-15.
• Appendix B: Command Listings
— Add 22 new programming commands to the “Alphabetical List of Commands” using
the “Alphabetical List of New Commands” on page 3-17.
— Add one new programming command to the “OPC-Compatible List of Commands”
using the “OPC-Compatible List of New Commands” on page 3-17.
3-2
Alphabetical Command Reference
N DB POINTS
BW DISPLAY on OFF
BWLIMDB
Syntax
Supplement for the Programmer’s Guide
Alphabetical Command Reference
BWLIMDB<num>;
or
BWLIMDB?;
Description
Command Description Range Query Response
BWLIMDB Enters the N dB Point, the amplitude
below the peak thatisusedtomeasurethe
filter’s bandwidth.
0.001 to 300 dB
<num><
L
>
F
Front Panel Equivalents
Command Hardkey Softkey
BWLIMDB
System
BWLIMDISP
Syntax
BWLIMDISP<ON|OFF>;
or
BWLIMDISP?;
Description
Command Description Range Query Response
BWLIMDISP Turns the measured bandwidth value in
the upper left corner of the display on and
off. The measured bandwidth value is
displayed near the bandwidth
Pass/Wide/Narrow message.
N/A
<0|1><
L
>
F
Front Panel Equivalents
Command Hardkey Softkey
BWLIMDISP
System
3-3

Supplement for the Programmer’s Guide
MAXIMUM BANDWIDTH
MINIMUM BANDWIDTH
Alphabetical Command Reference
BWLIMMAX
Syntax
BWLIMMAX<num>[HZ|KHZ|MHZ|GHZ];
or
BWLIMMAX?;
Description
Command Description Range Query Response
BWLIMMAX Entersthe maximum bandwidth value. If the
measured bandwidth is greater than this
value, the filter fails the bandwidth test.
a. Refer to “Preset State and Memory Allocation” in your analyzer’s reference guide.
stimulus range
a
<num><
L
>
F
Front Panel Equivalents
Command Hardkey Softkey
BWLIMMAX
System
BWLIMMIN
Syntax
BWLIMMIN<num>[HZ|KHZ|MHZ|GHZ];
or
BWLIMMIN?;
Description
Command Description Range Query Response
BWLIMMIN Enters the minimum bandwidth value. If
the measured bandwidth is less than this
value, the filter fails the bandwidth test.
stimulus range
a
<num><
L
>
F
a. Refer to “Preset State and Memory Allocation” in your analyzer’s reference guide.
Front Panel Equivalents
Command Hardkey Softkey
BWLIMMIN
System
3-4
Supplement for the Programmer’s Guide
BW TEST on OFF
Alphabetical Command Reference
BWLIMSTAT
Syntax
BWLIMSTAT;
Description
Command Description Range Response
BWLIMSTAT Returns the results of the bandwidth test.
A returned value of 0 indicates that the
filter passed the bandwidth test. A
returned value of −1 indicates that the
filter failed the bandwidth test because it
is narrower than the bandwidth limit. A
returned value of 1 indicates that the
filter failed the bandwidth test because it
is wider than the bandwidth limit.
No Front Panel Equivalents
GPIB only: no front panel equivalent.
BWLIMTEST
Syntax
BWLIMTEST<ON|OFF>;
Description
or
BWLIMTEST?;
N/A
<−1|0|1><
L
>
F
BWLIMTEST Turns the bandwidth test on and off. N/A
Front Panel Equivalents
Command Description Range Query Response
L
<0|1><
>
F
Command Hardkey Softkey
BWLIMTEST
System
3-5

Supplement for the Programmer’s Guide
CLEAR LIST
Alphabetical Command Reference
BWLIMVAL
Syntax
BWLIMVAL;
Description
Command Description Range Response
BWLIMVAL Returns the measured bandwidth value. N/A
<num><
L
>
F
Front Panel Equivalents
GPIB only: no front panel equivalent.
CLER
Syntax
CLER;
Description
Command Description Range Query Response
CLER Clears(ordeletes)theallofexistingripple
test limits.
Front Panel Equivalents
N/A N/A
Command Hardkey Softkey
CLER
3-6
System

Supplement for the Programmer’s Guide
EDIT RIPL LIMIT
Alphabetical Command Reference
EDITRLIM
Syntax
EDITRLIM;
Description
Command Description Range Query Response
EDITRLIM Begins the editing of the ripple limit list. N/A N/A
Front Panel Equivalents
Command Hardkey Softkey
EDITRLIM
System
3-7

Supplement for the Programmer’s Guide
Alphabetical Command Reference
OUTP
NOTE Because this is an “Alphabetical Command Reference,” the output commands
are listed alphabetically, rather than byfunction, in both the “Syntax” section
and the “Description” section.
Syntax
OUTPFARPLPT;
OUTPRPLBNDALL;
OUTPRPLBNDPF;
OUTPRPLBNDVAL;
Description
NOTE Most commandsthat output an array require that you set the format for data
transfers with the FORM command.
Command Description Range Response
OUTPFARPLPT Outputs the onscreen failed ripple point
information in the following commaseparated value format: the number of
failed points followed by pairs of numbers
representing the first failed frequency,
first failurevalue,secondfailed frequency,
second failure value, and so on.
OUTPRPLBNDALL Outputs the measured ripple values for all
active frequency bands in the following
comma-separated value format: the
number of bands followed by pairs of
numbers representing the first band
number (1), ripple value of first band,
second band number (2), ripple value of
second band, and so on.
OUTPRPLBNDPF Outputs the pass/fail status for selected
frequency band (see “SELBND”) as “1”
(band passes) or as “0” (band fails).
OUTPRPLBNDVAL Outputs the ripple value for selected
frequency band (see “SELBND”).
N/A
N/A
N/A
N/A
<num,array><
<num,array><
<0|1><
<num><
Front Panel Equivalents
L
>
F
L
>
F
L
>
F
L
>
F
GPIB only: no front panel equivalent.
3-8

RLIMLINE
RIPL LIMIT on OFF
MAXIMUM RIPPLE
Syntax
Supplement for the Programmer’s Guide
Alphabetical Command Reference
RLIMLINE<ON|OFF>;
or
RLIMLINE?;
Description
Command Description Range Query Response
RLIMLINE Turns the lines that represent the ripple
test limits on and off.
N/A
<0|1><
Front Panel Equivalents
Command Hardkey Softkey
RLIMLINE
System
RLIMM
Syntax
RLIMM<num>[DB];
or
RLIMM?;
L
>
F
Description
Command Description Range Query Response
RLIMM Sets the value of the maximum allowable
ripple limit for current frequency band.
0.01 to 100 dB
<num><
L
>
F
Front Panel Equivalents
Command Hardkey Softkey
RLIMM
System
3-9

Supplement for the Programmer’s Guide
MAXIMUM FREQUENCY
MINIMUM FREQUENCY
Alphabetical Command Reference
RLIMSTP
Syntax
RLIMSTP<num>[HZ|KHZ|MHZ|GHZ];
or
RLIMSTP?;
Description
Command Description Range Query Response
RLIMSTP Sets the stop frequency of the current
frequency band.
stimulus range
a
<num><
L
>
F
a. Refer to “Preset State and Memory Allocation” in your analyzer’s reference guide.
Front Panel Equivalents
Command Hardkey Softkey
RLIMSTP
System
RLIMSTR
Syntax
RLIMSTR<num>[HZ|KHZ|MHZ|GHZ];
or
RLIMSTR?;
Description
Command Description Range Query Response
RLIMSTR Sets the start frequency of the current
ripple limit.
stimulus range
a
<num><
L
>
F
a. Refer to “Preset State and Memory Allocation” in your analyzer’s reference guide.
Front Panel Equivalents
Command Hardkey Softkey
RLIMSTR
System
3-10

RLIMTEST
RIPL TEST on OFF
RIPL VALUE [ ]
Syntax
Supplement for the Programmer’s Guide
Alphabetical Command Reference
RLIMTEST<ON|OFF>;
or
RLIMTEST?;
Description
Command Description Range Query Response
RLIMTEST Turns the ripple limit test on and off. N/A
<0|1><
L
>
F
Front Panel Equivalents
Command Hardkey Softkey
RLIMTEST
System
RLIMVAL
Syntax
RLIMVAL<OFF|ABS|MAR>;
Description
Command Description Range Query Response
RLIMVAL Displays the ripple limit value of the
selected band (see “SELBND”) in absolute
format (ABS) or margin format (MAR).
OFF turns the displayed ripple limit value
off.
N/A N/A
Front Panel Equivalents
Command Hardkey Softkey
RLIMVAL
System
3-11
Supplement for the Programmer’s Guide
SAVE FILE
GRAPH FMT [ ]
FILETYPE: GRAPHIC
SAVE FILE
GRAPH FMT [ ]
FILETYPE: GRAPHIC
Alphabetical Command Reference
SAVECSV
Syntax
SAVECSV;
Description
Command Description Range Query Response
SAVECSV Saves the current measurement to the
disk drive in the comma-separated value
(CSV) format.
N/A N/A
Front Panel Equivalents
Command Hardkey Softkey
SAVECSV
Save/Recall
when is set to CSV and
is selected.
SAVEJPG
Syntax
SAVEJPG;
Description
Command Description Range Query Response
SAVEJPG Saves the currentdisplay to the disk drive
Front Panel Equivalents
Command Hardkey Softkey
SAVEJPG
3-12
in the JPG format. OPC-compatible.
Save/Recall
N/A N/A
when is set to JPG and
is selected.
SELBND
FREQUENCY BAND
Syntax
Supplement for the Programmer’s Guide
Alphabetical Command Reference
SELBND<num>;
or
SELBND?;
Description
Command Description Range Query Response
SELBND Selects the ripple frequency band for the
following commands: OUTPRPLBNDPF,
OUTPRPLBNDVAL, and RLIMVAL.
integers 1−12
<num><
L
>
F
Front Panel Equivalents
Command Hardkey Softkey
SELBND
System
3-13

Supplement for the Programmer’s Guide
Alphabetical Command Reference
This page intentionally left blank.
3-14

Preset Conditions
Preset State
Table 3-1 Limit Line Conditions
Preset Conditions Preset Value
Limit Lines
Limit Lines Off
Limit Testing Off
Limit List Empty
Edit Mode Upper/Lower Limits
Stimulus Offset 0 Hz
Amplitude Offset 0 dB
Supplement for the Programmer’s Guide
Preset Conditions
Limit Type Sloping Line
Beep Fail Off
Ripple Limit
Ripple Limit Off
Ripple Test Off
Bandwidth Limit
Bandwidth Test Off
Bandwidth Display Off
Bandwidth Marker Off
3-15

Supplement for the Programmer’s Guide
Preset Conditions
This page intentionally left blank.
3-16

Supplement for the Programmer’s Guide
Command Listings
Alphabetical List of New Commands
BWLIMDB EDITRLIM RLIMSTR
BWLIMDISP OUTPFARPLPT RLIMTEST
BWLIMMAX OUTPRPLBNDALL RLIMVAL
BWLIMMIN OUTPRPLBNDPF SAVECSV
BWLIMSTAT OUTPRPLBNDVAL SAVEJPG
BWLIMTEST RLIMLINE SELBND
BWLIMVAL RLIMM
CLER RLIMSTP
Command Listings
OPC-Compatible List of New Commands
SAVEJPG
3-17

Index
A
absolute
ripple test value
absolute value, ripple test
accessories URL
activating the bandwidth test
1-19
Agilent Technologies URL
analyzer functions
B
band
adding a frequency
changing a frequency
deleting a frequency
frequency
bandwidth
bandwidth limit
preset state
bandwidth markers
displaying
bandwidth test
activating
display of measurement status
3-5
display of measurement value
3-3
maximum width
minimum width
on/off control
returning measured value
running
setting dB point amplitude
setting up limits
bandwidth testing
bandwidth value
displaying
BWLIMDB
BWLIMDISP
BWLIMMAX
BWLIMMIN
BWLIMSTAT
BWLIMTEST
BWLIMVAL
C
calibration data, saving
calibration kit, saving a modified
changing the ripple limits color
clear list
CLER
color
changing the ripple limits
ripple test message
, 1-19–1-22
1-37
1-14
, 3-6
, 3-6
, 1-14, 1-15
, 3-11
, 2-16
,
, 2-16
, 2-9
, 1-11
, 1-10
, 1-12
, 1-9
, 1-19
, 2-17
, 1-20
, 1-19
, 3-4
, 3-4
, 3-5
, 3-6
, 3-3
, 1-17–1-19
, 1-17–1-22
, 1-21
, 3-3
, 3-3
, 3-4
, 3-4
, 3-5
, 3-5
, 3-6
, 1-37
, 1-14
, 1-13
comma-separated values, saving
3-12
comma-separated values. See
CSV format
conversion loss using frequency
offset mode
CSV files, saving
CSVformat,savingmeasurement
results in
D
delete frequency band list
display
bandwidth test measurement
status
bandwidth test measurement
value
ripple test measured value
Display menu map
display ripple test limits
display ripple test values
displaying the bandwidth
markers
displaying the bandwidth value
,
,
,
,
1-21
E
edit
ripple test limit list
editing ripple limits
EDITRLIM
error messages
existing softkeys
F
file
index numbers
sequential CSV naming of
firmware
revision
frequency band
clearing list
frequency bands
adding
changing
deleting
selecting for ripple test
setting
frequency offset mode, conversion
loss
functions, analyzer
G
graphic files
, 1-23
saving as JPG
, 1-23
, 3-12
, 1-33
, 3-5
, 3-3
, 1-20
, 3-7
, 2-15
, 2-9
, 1-34
, 2-2, 3-2
, 3-6
, 1-11
, 1-10
, 1-12
, 1-9
, 3-12
, 3-6
, 2-3
, 1-13
, 1-14
, 3-7
, 1-10–1-12
, 3-13
, 2-9
, 3-11
, 1-34
,
,
saving measurement results as
1-34
I
instrument state
internet
J
jpeg files, saving results as
JPG files, saving
L
limit lines
limit list
limit menu
M
manual part number
margin
margin value, ripple test
maximum
maximum and minimum
maximum bandwidth
measured value
measurement
measurements
menu map
messages
minimum
minimum bandwidth
mixer
modifying calibration kits
, 1-37
saving
, 2-16
preset state
editing for ripple test
preset state
ripple test value
allowable ripple value
bandwidth value
for ripple test, output of
results, saving graphically
returningbandwidthtestvalue
3-6
saving as graphic files
saving as text files
Display
Save/Recall
System
error
bandwidth value
measurement diagram, using
saving to a disk
, 2-3
, 2-4, 2-7
, 2-15
1-26
,
, 1-34
, 3-12
, 2-17
, 3-7
, 2-17
, 2-2, 3-2
, 1-14, 1-16
, 3-11
, 3-9
, 3-4
, 1-19
, 1-19
, 3-8
, 1-34
,
, 3-12
, 3-12
, 2-3
, 3-4
, 1-19
,
, 1-37
Index

Index
N
n dB
setting for bandwidth test
N dB Point
names for CSV files
new softkeys
O
on/off control
bandwidth test
ripple test
OUTPFARPLPT
OUTPRPLBNDALL
OUTPRPLBNDPF
OUTPRPLBNDVAL
output
failed ripple test points
ripple test measured value
ripple test measured values
ripple test pass/fail status
P
part number
reference guide
pass/fail status
for ripple test, output of
preset state
R
reference guide
changes
part number
RF frequency range
using the mixer measurement
ripple limit
preset state
ripple limit testing
ripple limits
editing
running the test
setting
ripple test
absolute value
band start frequency
band stop frequency
clear frequency band list
display measured value
displaying limits
displaying values
edit limit list
frequency bands
margin value
maximum ripple
message color
on/off control
, 1-19
, 3-11
, 2-17
, 2-2, 3-2
diagram
, 1-10–1-12
, 1-7–1-10
, 1-34
, 2-10
, 3-5
, 3-8
, 3-8
, 3-8
, 3-8
, 3-8
, 2-2, 3-2
, 3-8
, 2-2, 3-2
, 1-26
, 2-17
, 1-7–1-16
, 1-12–1-16
, 1-15
, 3-10
, 3-10
, 3-6
, 3-11
, 1-13
, 1-14
, 3-7
, 1-9
, 1-16
, 3-9
, 1-13
, 3-11
, 3-3
, 3-8
, 3-8
, 3-8
output all band measured
values
output measured value
output pass/fail status
outputting failed points
selecting frequency bands
starting and stopping
RLIMM
RLIMSTP
RLIMSTR
RLIMTEST
RLIMVAL
running a bandwidth test
1-19–1-22
running the ripple limits test
1-12–1-16
S
save
measurements as graphic files
measurements as text files
Save/Recall menu map
SAVECSV
SAVEJPG
saving
calibration data
instrument state
measurement results
modified calibration kits
to a disk
SELBAND
setting ripple limits
setting up bandwidth test limits
1-17–1-19
softkeys
existing
new
spreadsheet, saving test file for a
1-33
start frequency
ripple test bands
starting the ripple test
stop frequency
ripple test bands
stopping the ripple test
System menu map
T
test
bandwidth
ripple limit
text file, saving measurements as
a
text files
saving as CSV
, 3-8
, 3-9
, 3-10
, 3-10
, 3-11
, 3-11
3-12
, 3-12
, 3-12
graphically
, 1-37
, 3-13
, 2-9
, 2-10
, 1-17–1-22
, 1-7–1-16
, 1-33
, 3-8
, 3-8
, 3-8
, 3-13
, 1-12
,
,
, 3-12
, 2-3
, 1-37
, 1-37
, 1-34
, 1-37
, 1-7–1-10
, 3-10
, 1-12
, 3-10
, 1-12
, 2-4, 2-7
, 3-12
TRL error correction
label the calibration kit, 1-35
U
URL
Agilent Technologies
for accessories
W
world wide web
,
,
,
, 2-16
, 2-16
, 2-16
2 Index
 Loading...