

Page 1

Notice
Hewlett-Packard to Agilent Technologies Transition
This documentation supports a product that previously shipped under the HewlettPackard company brand name. The brand name has now been changed to Agilent
Technologies. The two products are functionally identical, only our name has changed. The
document still includes references to Hewlett-Packard products, some of which have been
transitioned to Agilent Technologies.
Printed in USA March 2000
Page 2

Option
HEWLETT
PACKARD
No. 08763-90366 Supersedes October 1998
Printed in USA February 1999
Page 3

Notice.
The information contained in this document is subject to change without
notice.
Hewlett-Packard makes no warranty of any kind with regard to
this material, including but not limited to, the implied warranties of
merchantability and fitness for a particular purpose. Hewlett-Packard
shall not be liable for errors contained herein or for incidental or
consequential damages in connection with the furnish@, performance,
or use of this material.
Copyright Hewlett-Packard Company 1098,1900
Page 4

Ke
Text
This represents a key physically located on the
instrument.
This represents a “softkey,” a key whose label is
determined by the instrument’s lirmware
This represents text displayed on the instrument’s
screen.
Page 5

The
front and rear
environmental operating requirementq
as procedures for hwMling, conUgwlng,
and verifying the operation of the analyzer.
The
features, and
performance from your analyzer.
The Quick
summary of selected
The HP-IB Progreaming and
0
information for operation of the network
analyzer under
and
011 network analyzer’s
Guide shows how to make
you how to get the most
Gnlde provides programming
Start Guide
electrical and
Guide provides
features.
Command
control.
BASIC
programming example8 to
demonstrate the remote operation of the
network analyzer.
System Verillcation and
provides the system verification and
performance
Record for your
network analyzer.
and the Wrformence
Examples
Guide
011
Page 6

1.
Where to Look for More Information
Preset Conditions
Analyzer Command
Code Naming Convention
Valid Characters
units
........................
Command Formats
General Structure:
...................
...............
..............
...................
..................
.................
...................
Analyzer Operation
Held Commands
Operation Complete
HP-IB Operation
Device Types
..................
...................
.................
....................
....................
.......................
Listener
Controller
......................
.....................
Bus Structure
.................
.....................
Handshake Lines
Control Lines
Requirements
.................
...................
.................
Operational Capabilities
status lndica~rs
Device Modes
System-Controller Mode
Mode
Pass-Control Mode
Analyzer
Modes
Setting HP-IB Addresses
Response to
Commands)
Abort
.......................
Device Clear.
Met&Messages
...................
...................
..............
..................
..............
................
.................
................
...............
..........
1-7
1-9
1-9
1-12
1-12
1-12
1-14
1-14
1-14
1-14
1-17
1-19
............
1-21
1-21
1-23
1-24
Universal
Page 7

Local..
Local Lockout
Parallel Poll
Control
Remote..
Serial
Trigger
Reading Analyzer Data
Output Queue
Command Query.
.....................
...................
....................
....................
....................
.....................
......................
.................
....................
..................
....................
output syntax.
Marker Data
Array-Data Formats
Trace-Data Transfers
Stimulus-Related Values
Data-Processing Chain
Data Arrays
...................
.....................
.................
.................
...............
.................
.....................
............
Data Levels
Learn String and Calibration-Kit String
Error Reporting
Status Reporting
The Status Byte
.....................
........
....................
...................
...................
The Event-Status Register and Event-Status Register B .
Error Output
Error Messages in Numerical Order
Calibration
Display Graphics
User Graphics Units
subset:
Accepted but ignored HP-GL commands:
Disk File Names
Using Key Codes
Key Select Codes Arranged by
Only Commands
Alphabetical Mnemonic Listing
....................
..........
......................
....................
.................
....................
......
....................
....................
...
.................
.............
1-26
1-26
1-26
1-27
130
136
139
1-46
1-62
1-63
Index
Page 8

. . . . . . . . . . . . . . .
Analyzer Single Bus Concept . . . . . . . . . . . . .
(ASCII) Data-Transfer Character String
Data-Processing Chain for Measurement Outputs
Status Reporting Structure . . . . . . . . . . . . . .
1-6. Key Codes . . . . . . . . . . . . . . . . . . . . . .
. . . .
1-16
1-22
.
1-62
l-l.
Preset Conditions (1 of 5)
Code Naming Convention
OPC-compatible Commands
..............
..............
..............
........
HP 8753E Network Analyzer Array-Data Formats
1.6.
Definitions
................
Relationship between Calibrations and Classes
1.8. Error
Key
Select Codes
Only
Commands
Arrays
...............
..................
..................
................
1-13
134
...
.....
1-56
1-65
Page 9

Programming and
1
This document is a reference for operation of the network analyzer
under
analyzer, refer to the HP
control.
information
manual operation of the
User’s Guide.
HP-IB Programming and Cbmman
d Reference
l-l
Page 10

Additional information covering many of the topics discussed in this
document is located in the following:
for
a description and discussion of all aspects of the
overview of all technical details as a broad tutorial. HP publication,
n
IEEE Standard
operation. Published by the:
Institute of Electrical and Electronics Engineers, Inc.,
345
New York, New York 10017.
HP
examples in HP BASIC.
part number 5021-1927.
std
East
of the
contains detailed information on
Street
includes
A thorough
1-2 HP-IB
and
d Itehrence
Page 11

When the
key is pressed, the analyzer reverts to a known state
called the factory preset state. This state is
l-l.
Preset Conditions (1 of
Analyzer Mode
Analyzer Mode
Frequency
Value
Step Sweep
Mode
External Trigger
Sweep Time
Start
Frequency Span
Frequency Span
Start
Span
CW
Frequency
Start Power
Coupled Rawer
Power
Coupled Channels
Coupled Port
Network Analyzer
Mode
Linear Frequency
Continuous
100 ma,
Auto Mode
Idle
6000.07
0
on
on
on
16.0 dBm
on
Power Range
No. of
Frequency
Mode
Frequency
Sweep Mode
Power
Parameter
Color Selections
Dual Channel
Channel
split Display
Active Channel Channel 1
Frequency Blank
in
Auto;
201
Swept
Channel 1: 811;
Channel 2: 821;
Channel 8: 812;
Channel 4:
Log Magnitude
[all inputs)
bme
Disabled
l-l.
Number of
before
0
HP-IB
and
d Ibference
Page 12

l-l. Preset Conditions (2 of 5)
Beeper: Bone
Beeper:
Warning
IF Bandwidth
Aperture
PRESETVALUE
Interpolated
Error
AA
A
no effect. If
on
16%
InCre~
16%.
Markers
1,
4
Reference Marker
1
1
None
Marker Mode
Channel 1
Channel 2
[hp]
Delta Marker Mode
Marker Search
1% SPAN; OE
Degrees
Marker lkrget
Marker
Value
Marker Tracking
Marker Sthnuhw
Marker
LO
Value
Marker Aux Offset
Degrees
Marker
polar Marker
Marker
Input A
Input B
Mode
Chop A and B
Power Meter
Number of
Beep
Power Loss
1 InterpoIated Error Correction can be on or off when the
factory preset state.
of
1-4
User’s Guide describes how to set the factory preset
Error Correction.
and
d Reference
Upper/Lower
in the
Page 13

CONDITIONS
l-l. Preset Conditions
VALUE
-20
conflgaratlon
[cont.)
Baud Rate
of 5)
VALUE
Active
Active
Shape
Span
Demodulation
Window
Use Memory
HP-IB Mode
Clock Time Stamp
FbctoryNwr
Parallel port
Plotter
Plotter port
Plotter Baud Rate
Plotter Handshake
HP-IB Address
Normal
-10
nanoaeconti
Normal
Last Active
on
last AcMve
State
Last AcMve
Active
Active
HP-IB Address
Data Array
Raw Data Array
Data Array
Data
Select Dbk
2
Loop Counter
Modes
Phase Lock
Sampler Correction
Spur Avoidance
Analog
Node
Active
state
Internal
0
on
on
11 (Aux Input)
1 The directory size is calculated
2 Pressing preset turns off sequencing modify (edit) mode and tips any
sequence.
AcMve
0.013% of the floppy disk size (which
HP-IB Progmamdng
and
Page 14

l-l. Preset Conditions (4 of 5)
lot
Data
lot Memory
‘lot
lot lbxt
‘lot Marker
‘lot Quadrant
Plot
lot Speed
Data
QraMcule
QraMcule
on
on
on
on
on
on
Pull
2
6
1
VALUE
Pen Number (cant):
Line
Data
Data
Mode
Ref
Last Active State
Magenta
Blue
Red
Black
Black
Black
l-l. Preset Conditions (5 of 5)
HP-IB Prorpamming and
Scale
d Reference Guide
Reference
Value
Page 15

The analyzer
commands are derived from their front-panel key
titles (where possible), according to this naming convention:
Simple comman
as in POWE, the
comman
are the
four letters of the function they control,
d name for power. If the function label
ds
contains two words, the first three mnemonic letters are the first three
letters of the fhst word, and the fourth mnemonic letter is the first
letter of the second word.
example, ELED is derived from electrical
delay.
If there are many commands grouped together in a category, as in
markers or plotting pen numbers, the command is increased to 8
letters. The
4 letters are the category label and the last 4 letters
are the function specifier. As an example, category pen numbers are
represented by the
comman
d PENN, which is used in combination with
several functions such as PENNDATA, PENNMEMO.
The code naming guidelines, listed in are used in order to:
n
make commands more meaningful and easier to remember
n
There are times when these guidelines are not
followed due to technical considerations.
HP-IB
and
d Reference Guide 1-7
Page 16

1-2. Code Naming Convention
Key Title
One Word
Two Words
Two
Three Words
Power
start
Electrical Delay
Search Right
Marker
in a
Gate
Pen
Data
Some codes require appendages (ON, OFF,
have a front-panel equivalent are
For BP-IB Code Use
Four Letters
First Three Letters of First
Word, First Letter of Second
Word
Four Letters of Roth
First Three
Word, Fhst Letter of Second
Word, First Four Letters of
Third Word
of First
etc.). Codes that do not
only commands. They use a
Example
POWE
ELED
similar convention based on the common name of the function.
BP-IB
and
d Beference Guide
Page 17

The analyzer accepts the following ASCII characters:
letters
numbers
n
decimal points
n
l
semicolons
n
quotation marks
n
carriage returns (CR)
linefeeds
Both upper- and lower-case letters are acceptable. Carriage returns,
leading zeros, spaces, and unnecessary terminators are ignored, except
for those within a command or appendage. If the analyzer does not
recognize a character as appropriate, it generates a syntax error message
and recovers at the next terminator.
The analyzer can input and output data in basic units such as Hz,
seconds, etc.
Seconds
S
V
Volts
Hz
DB
Hertz
or
Input data is assumed to be in basic units (see above) unless one of the
following units is used (upper and lower case are equivalent):
MS Milliseconds
US Microseconds
NS Nanoseconds
PS
HP-IB
KHZ Kilohertz
MBZ Megahertz
GHZ
FS
and
Gigahertz
Femtoseconds
d
Guide
Page 18

The
commands accepted by the analyzer can be grouped into five
input-syntax types. The analyzer does not distinguish between
and lower-case
letters.
General Structure:
The general syntaz structure is:
[code] [appendage] [data] [unit] [terminator]
The individual sections of the
[code]
The root mnemonic (these codes are described in
code are
below.
the “Alphabetical Mnemonic Listing” later in this
document.)
A qualifier attached to the root mnemonic Possible
appendages are ON or
(toggle a function ON or
or integers, which specify one capability out of
several. There can be no spaces or symbols between
the code and the appendage.
A single operand used by the root mnemonic, usually
to set the value of a function. The data can be a
number or a character string. Numbers are accepted
as integers or decimals, with power of ten
by E (for example,
frequency to 2
STAR
sets the start
Character strings must be
enclosed by double quotation marks.
For example:
A title string using RMB
OUTPUT 716;
where the
two
are an escape so that
BASIC will interpret the third
would look like:
properly.
[unit]
[terminator]
HP-IB
The units of the operand, if applicable. If no units
are specitled, the analyzer assumes the basic units
as described previously. The data is entered into
the function when either units or a terminator are
received.
Indicates the end of the command, enters the data,
and switches the active-entry area OFF. A semicolon
(;) is the recommended terminator.
are not necessary for the analyzer to
ds
interpret comman
correctly, but in the case of a
syntax error, the analyzer will attempt to recover at
and
d lbference
Page 19

the next terminator. The analyzer also interprets line
feeds and
END OR IDENTIFY
messages as
terminators.
Syntax Types
The specific syntax types are:
SYNTAX TYPE 1: [code] [terminator]
These are simple action commands that require no complementary
information, such as
AUTO;
the active channel).
SYNTAX TYPE 2:
These are simple action comman
such as
,
[code] [appendage] [terminator]
ds requiring limited customization,
and
,
(error correction ON or
(recall register
There can be no
or
characters or symbols between the code and the appendage.
In the following cases: CLEAREG[D] ,
and
For example,
will
generate a syntax error.
must be 2 characters.
1; will execute, while
,
SYNTAX TYPE 3: [code] [data]
These are data-input
comman
ds such as STAR 1.0
(set the
start frequency to 1
SYNTAX TYPE 4: [code] [appendage] [data] [terminator]
These are titling and marker commands that have an appendage,
such as
(title register 2
(title register 1
QUERY SYNTAX:
To query a front-panel-equivalent function, append a question
mark (?)
REAL?.)
the root mnemonic
example, POWE?,
or
To query commands with integer appendages, place the
question mark after the appendage.
HP-IB
and
d Reference
Page 20

The analyzer cannot process
key commands known as “held” commands.
held command because it requires the analyzer to take one sweep of
data before executing any other commands.
Once a held command is received, the analyzer will read new commands
into the input buffer, but it will not begin the execution of any
commands until the completion of the
until it is able to process the commands in the buffer.
Commands that call a calibration class are held if there
is just one standard in the class, since such commands
trigger a measurement.
Occasionally, there is a need to know when certain analyzer operations
have been completed. There is an operation-complete function (OPC)
that allows a synchronization of programs with the execution of
certain key commands. This mechanism is activated by issuing
or QPC?; prior to an
operation-complete bit will then be set after the execution of the
OPC-compatible command.
OPC bit to be set when the
place of the
command execution is complete. The analyzer will halt the computer
by not t
example, executing
analyzer causes the bus to halt until the instrument preset is complete
and the analyzer outputs a one (1).
As another example, consider the timing of sweep completion. Send
string sets the analyzer sweep time
completion of a single sweep to respond with a one (1). The computer
should be programmed to read the number one (1) response from the
analyzer indicating completion of the single sweep. At this point a valid
trace exists and the trace data could be read into the computer.
causes the analyzer to output a one (1) when the
the one (1) until the command has completed.
3
commands while executing certain
example,
command. When the
command. The status byte or
example, issuing
sweep is
, and then immediately querying the
3 seconds, and then waits for
SING;
Issuing
is a
causes the
in
This
1-12
HP-IB Procpammipg and
d Reference
Page 21

OPC-compatible Commands
REFD
RESPDONE
1A2
to
31)
EXTTON
1 These commands are not querlsble, but the active channel may be found by
HARMSEC
INSMEXSM SAVC
INSMTUNR
NOOP SLIS
RAID TRAD
to
to
are OPCcompatible if there
SAVE< 1 to
to 31>
SAVT
SING
to G>
WAIT
only one standard in the
HP-IB Procpammine and Comman
d Reference
1-18
Page 22

The HewletMackard Interface Bus (HP-B) is Hewlett-Packard’s
hardware, software, documentation, and support for IEEE 488.2 and
worldwide standards for interfacing instruments. This interface
allows you to operate the analyzer and peripherals in two methods:
n
by an external system controller
n
by the network analyzer in system-controller mode
The HP-B employs a party-line bus structure in which up to 15 devices
can be connected on one contiguous bus. The interface consists of
16 signal lines and 8 ground lines within a shielded cable. With this
cabling system, many different types of devices including instruments,
computers, power meters, plotters, printers, and disk drives can be
connected in parallel.
Every HP-IB device must be capable of performing one or more of the
following interface functions:
A talker is a device capable of transnu
‘tting device-dependent data when
addressed to talk. There can be only one active talker at any given
time.
n
power meters
n
disk drives
n
voltmeters
n
counters
n
tape readers
of this type of device include:
The network analyzer is a talker when it sends trace data or marker
information over the bus.
A listener is a device capable of receiving device-dependent data over
the interface when addressed to listen. There can be as many as 14
listeners connected to the interface at any given time. Examples of this
type of device include:
n
printers
n
power supplies
generators
1-14
HP-IB
and Cemman
d
Guide
Page 23

The network analyzer is a listener when it is controlled over the bus by
a system controller.
Controller
A controller is
1.
the operation of the bus
as a device capable of:
2. addressing talkers and listeners
There can be only one active controller on the interface at any time.
Examples of controllers include desktop computers, minicomputers,
workstations, and the network analyzer. In a multiple-controller
system, active control can be passed between controllers, but there can
only be one system controller connected to the interface. The system
controller acts as the master and can regain active control at any time.
The analyzer is an active controller when it plots, prints, or stores to
an external disk drive in the pass-control mode The analyzer is also a
system controller when it is operating in the system controller mode,
and
d
Page 24

Figure l-l. HP-IB Bus Structure
Data Bus
The data bus consists of 8 bi-directional lines that are used to transfer
data from one device
commands and data
transmitted on these lines are typically encoded in ASCII, although
binary encoding is often used to speed up the transfer of large arrays.
Both ASCII- and binary-data formats are available to the analyzer. In
addition, every byte transferred over
insure
Handshake Lines
data.
undergoes a handshake to
A three-line handshake scheme coordinates the transfer of data between
talkers and listeners. ‘lb insure data integrity in multiple-listener
transfers, this technique forces data transfers to occur at the transfer
HP-IB
and Co-
d Reference
Page 25

rate of the slowest device connected to the interface. With most
computing controllers and instruments, the handshake is performed
automatically, making it transparent to the programmer.
Control
The data bus also has five control lines, The controller uses these lines
to address devices and to send bus commands.
IFC (Interface Clear)
ATN (Attention)
SRQ (Service Request)
REN (Remote Enable)
This line is used exclusively by the
system controller. When this line
is true (low), all devices (whether
addressed or not) unaddress and
revert to an idle state.
The active controller uses this
to
whether the information
on the data bus is command-oriented
or dataoriented. When this line
is true (low), the bus is in the
command mode, and the data lines
carry bus commands. When this
data mode, and the data lines carry
device-dependent instructions or
data.
This line is set true (low) when
a device requests service and
the active controller services the
requesting device, The network
can be enabled to pull the
SRQ line for a variety of reasons such
as requesting control of the interface,
for the purposes of printing, plotting,
or accessing a disk.
This line is used exclusively by
the system controller. When this
line is set true (low), the bus is
in the remote mode, and devices
are addressed by the controller to
either listen or talk. When the bus
is in remote mode and a device is
addressed, it receives instructions
from the system controller via
rather than from its front panel
HP-IB
and Comman
d Reference
1-17
Page 26

EOI (End or Identify)
(pressing (Local) returns the device
to front-panel operation). When this
line is set false (high), the bus and all
of the connected devices return to
local operation.
This line is used by a talker to
indicate the last data byte in a
multiple-byte transmission, or by
an active controller to initiate
a parallel-poll sequence. The
analyzer recognizes the EOI line as
a terminator, and it pulls the EOI
line with the last byte of a message
output (data, markers, plots, prints,
error messages). The analyzer does
not respond to parallel poll.
and
d lteferencw
Page 27

Number of Interconnected
15 maximum.
Devices:
Interconnection Path Maximum
Cable Length:
Message Transfer Scheme:
20 meters maximum or 2 meters per
device (whichever is less).
Byte serial, bit parallel asynchronous
data transfer using a
handshake system.
Data Rate:
Maximum of 1 megabyte-per-second
over the speci3ed distances with
depends on the transfer rate of the
slowest device connected to the bus.
Address Capability:
listen. A maximum of 1 taker and
14 listeners can be connected to the
interface at given time.
Multiple-Controller Capability:
controller (such as this instrument),
only one controller can be active
at any given time. The active
controller can pass control to another
controller, but only the system
controller can assume unconditional
control. Only one
allowed.
drivers.
data rate
addresses: 31 talk, 31
controller is
Page 28

the network
there is a
standard. The
of
Full-acceptor handshake.
rear panel, next to the
device subsets as defined by the IEEE 488.2
has the following capabilities:
handshake.
connector,
issued. No
Basic listener, unaddresses if MTA is issued. No listen-only
mode.
Complete service request (SRQ) capabilities.
Complete remote/local capability including local lockout.
PPO
TEO
These codes are completely explained in the IEEE Std 488 documents,
published by the Institute of Electrical and Electronic Engineers, Inc,
345 East 47th Street, New York,
New York 11017.
Does not respond to parallel poll.
Complete device clear
Responds to a Group Execute Trigger (GET) in the
hold-trigger mode.
System controller capabilities in system-controller mode.
Pass control capabilities in pass-control mode.
Tri-state drivers.
No extended listener capabilities.
No extended talker capabilities.
mode.
and
d
Page 29

Status Indicators
When the analyzer is connected to other instruments over the
the
of the analyzer. The
status indicators illuminate to display the current status
status indicators are located in the
instrument-state function block on the front panel of the network
analyzer.
R
Remote Operation
L
Listen mode
T
S
Service request (SRQ) asserted by the analyzer
The analyzer uses a single-bus architecture. The single bus allows both
the analyzer and the host controller to have complete access to the
peripherals in the system.
Three different controller modes are possible in an
n
system-controller mode
n
talker/listener mode
n
pass-control mode
system:
and
1-21
Page 30

GRAPHICS PLOTTER
SYSTEM
Figure 1-2. Analyzer Single Bus Concept
System-Controller Mode
This mode allows the analyzer to control peripherals directly in a
stand-alone environment (without an external controller). This mode
can only be selected manually from the analyzer’s front panel. It can
only be used if no active computer or instrument controller is connected
to the system via
If an attempt is made to set the network
analyzer to the system-controller mode when another controller is
connected to the interface, the following message is displayed on the
analyzer’s display screen:
The analyzer must be set to the system-controller mode in order to
access peripherals from the front panel. In this mode, the analyzer can
1-22 HP-IB
and
d
Page 31

directly control peripherals (plotters, printers, disk drives, power meters,
etc) and the analyzer may plot, print, store on disk or perform power
meter functions.
Do not attempt to use this mode for
recommends using an
when
See the following section,
instrument controller
HP
Mode.
Mode
This is the mode that is normally used for remote programming of the
analyzer. In talker/listener mode, the analyzer and all peripheral devices
are controlled from an external instrument controller. The controller
can command the analyzer to talk and other devices to listen. The
analyzer and peripheral devices cannot talk directly to each other unless
the computer sets up a data path between them. This mode allows
the analyzer as either a talker or a listener, as required by the
controlling computer for the particular operation in progress.
Pass-Control Mode
mode allows the computer to control the analyzer via HP-IB (as
with the talker/listener mode), but
allows the analyzer to take
control of the interface in order to plot, print, or access a disk. During
an analyzer-controlled peripheral operation, the host computer is free to
perform other internal tasks
data or display manipulation) while
the analyzer is controlling the bus. After the analyzer-controlled task is
completed, the analyzer returns control to the system controller.
Performing an instrument preset does not affect the
selected bus mode, although the bus mode will return
to talker/listener mode if the line power is cycled.
HP
Analyzer
User’s
provides
information on setting the correct bus mode from the
front-panel menu.
Analyzer Bus Modes
As discussed earlier, under HP-IB control, the analyzer can operate in
one of three modes:
pass-control, or system-controller
mode.
HP-IB
and
d Reference
Page 32

In talker/listener mode, the analyzer behaves as a simple device on the
bus. While in this mode, the analyzer can make a plot or print using
the
or
OUTPPRIN;
commands. The analyzer will wait
until it is addressed to talk by the system controller and then dump the
display to a plotter/printer that the system controller has addressed to
listen. Use of the
commands PLOT;
and
PR I NALL;
require control to
be passed to another controller.
In pass-control mode, the analyzer can request control from the system
controller and take control of the bus if the controller addresses it
to take control. This allows the analyzer to take control of printers,
plotters, and disk drives on an as-needed basis. The analyzer sets
event-status register bit 1 when it needs control of the interface, and
the analyzer will transfer control back
the system controller at the
completion of the operation. It will pass control back to its controller
address, specified by ADDRCONT.
The analyzer can also operate in the system-controller mode. This mode
is only used when there is no remote controller on the bus.
this
mode, the analyzer takes control of the bus, and uses it whenever it
needs
to access a peripheral. While the analyzer
other devices on the bus can attempt to take control.
REN, ATN, and IFC lines must remain
in this mode, no
the
and the data lines
must be freed by all but the addressed talker.
In systems interfaced using HP-IR, each instrument on the bus is
by an HP-IR address. This address code must be different for
each instrument on the bus.
non-volatile memory and are not affected when you press
addresses are stored in short-term,
or
cycle the power.
The analyzer occupies two HP-IB addresses: the
instrument itself and the display. The display
address is derived from the instrument address by
complementing the instrument’s least-significant bit.
Hence, if the instrument is at an even address, the
display occupies the next higher address.
the
instrument is at an odd address, the display occupies
the next lower address.
1-24
HP-IB Prolpamming and Camman
d
Page 33

The analyzer addresses are set by pressing (Local)
In system-controller mode, the addresses must be set for the plotter,
printer, disk drive, and power meter.
default address for the analyzer is device 16, and the display
address is device 17.
There is also an address for the system controller, This
address refers to the controller when the network
analyzer is being used in pass-control mode. This is
the address that control is passed back to when the
analyzer-controlled operation is complete.
Abort
The analyzer responds to the abort message
talker, and controller functions.
Device Clear
clearing the input and output queues, and clearing any HP-IB errors
The status registers and the error queue are unaffected.
by halting all listener,
The analyzer wig go into local mode if the local command (GTL) is
received, the remote line is unasserted, or the front-panel local key is
pressed. Changing the analyzer’s HP-IB status from remote to local does
not affect any of the front-panel functions or values.
Local Lockout
If the analyzer receives the local-lockout command (LLO) while it is
in remote mode, it will disable the entire front panel except for the
line power switch. A local-lockout condition can only be cleared by
releasing the remote line, although the local command (GTL) will place
the instrument temporarily in local mode.
Poll
The analyzer does not respond to parallel-poll
parallel-poll unconflgure
HP-IB
messages.
(PPC) or
d
Reference
Page 34

Control
the analyzer is in pass-control mode, is addressed to
the take-control co
from the system control it
and receives
take
active control of the bus. If the analyzer is not requesting control, it will
immediately pass control to the system controller’s address. Otherwise,
the analyzer will execute the function for which it sought control of the
bus and then pass control back to the system controller.
The analyzer will go into remote mode when the remote
is asserted
and the analyzer is addressed to listen. While the analyzer is held in
remote mode,
disabled. Changing the analyzer’s
front-panel keys (with the exception of
status from remote to local
are
does not affect any front-panel settings or values.
Serial Poll
The analyzer will respond to a serial poll with its status byte, as
in the “Status Reporting” section of this document. lb initiate the
serial-poll sequence, address the analyzer to talk and issue a serial-poll
enable command (SPE). Upon receiving this command, the analyzer
return its status byte. End the sequence by issuing a serial-poll disable
command (SPD). A serial poll does not affect the value of the status
byte, and it does not set the instrument to remote mode.
In hold mode, the analyzer responds to device trigger by taking a single
sweep. The analyzer responds only to selected-device trigger
This
means that it will not respond to group execute-trigger (GET) unless it is
addressed to listen. The
will not respond to GET if it is not in
hold mode.
HP-IB
and Co-
d Reference
Page 35

Whenever an output-data
data into the output queue (or buffer) where it is held until the system
controller outputs the next read command. The queue, however, is only
one event long: the next output-data command will overwrite the data
queue immediately after every query or data request from the analyzer.
commandis received, the analyzer puts the
All instrument functions can be queried to find the current ON/OFF
state or value.
mark character (?) to the command to query the state of the functions.
Suppose the operator has changed the power level from the analyzer’s
front panel. The computer can ascertain the new power level using the
analyzer’s commandquery function. If a question mark is appended
to the root of a command, the
function.
outputs the current RF source power at the test port. When
the
analyzer receives
source power level. This condition ill
talk light
the controller.
ON/OFF commands can
function is ON or a zero (0) if it is OFF. For example, if a command
controls an active function that is underlined on the analyzer display,
querying that comman
or a zero (0) if it is not. As another example, there are nine options on
the format menu and only one option is underlined at a time. Only the
underlined option will return a one when queried.
instrument state commands, append the question
will output the value of that
instance,
7
sets the source power to 7
, it prepares to
and
the current RF
the analyzer front-panel
In this case, the analyzer transmits the output power to
be queried. The reply is a one (1) if the
d
yields a one (1) if the command is underlined
instance, send the command string
to the
dual-channel display is switched ON, the analyzer will return a one (1)
to the instrument controller
Similarly, to determine if phase is being measured and displayed, send
the command string
PHAS?;
the
this case, the
analyzer
will return a one (1) if phase is currently being displayed. Since the
command only applies to the active channel, the response to the
query depends on which channel is active.
and
d
1-27
Page 36
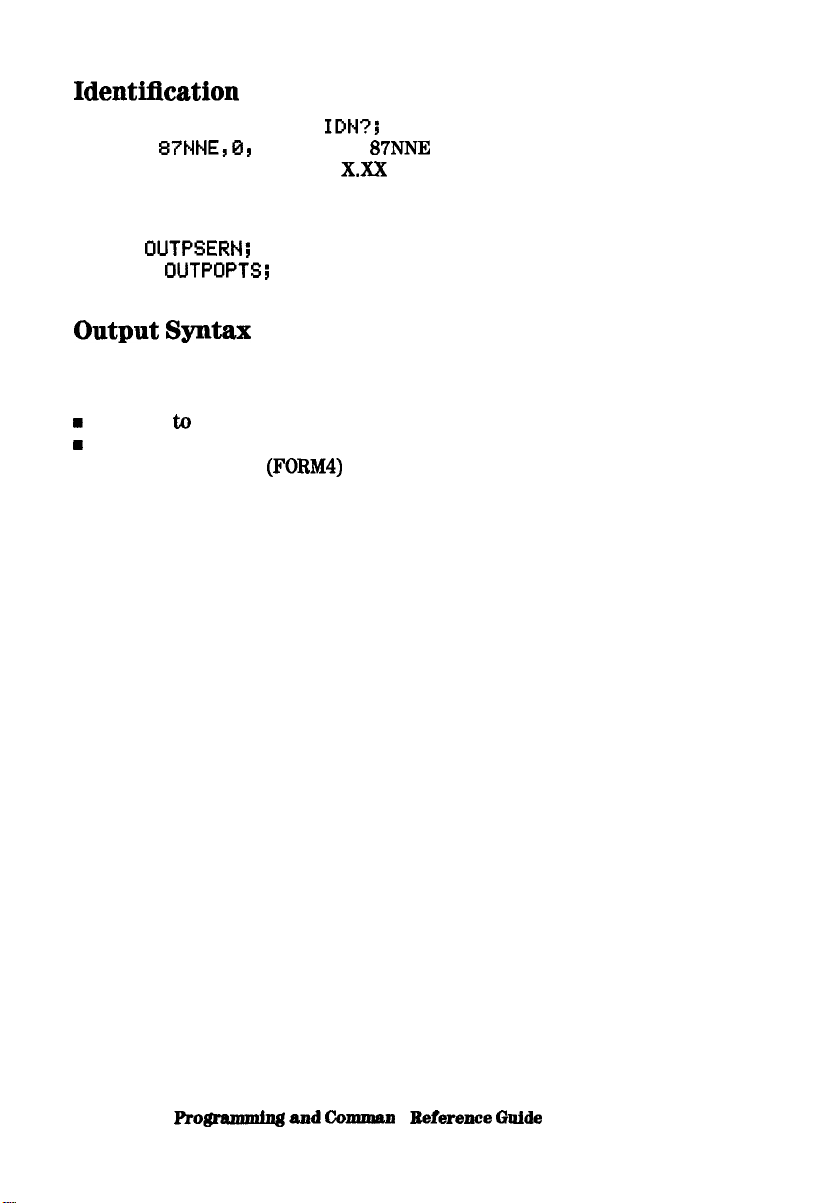
The
analyzer’s response to
PACKARD,
X. XX
where
is HEWLETT
is the model
number of the instrument and is the firmware revision of the
instrument.
The analyzer also has the capability to output its serial number with the
command
command
, and to output its installed options with the
.
The following three types of data are transmitted by the analyzer in
ASCII format:
response
query
certain output commands
n
ASCII floating-point
array transfers
1-28
BP-IB Prolpamming and
d
Page 37

format only, meaning that each character and
digit is transmitted
as a separate byte, leaving the receiving computer to reconstruct the
numbers and strings. Numbers are transnu
‘tted as
strings,
consisting of:
Figure
(ASCII) Data-Transfer Character String
for negative, blank for positive.
3 digits
Decimal point
16 digits
E
Exponent
Digits to the left of the decimal point.
Standard decimal point.
Digits to the right of the decimal point.
Exponent notation.
for negative,
+
for positive.
Two digits for the exponent.
When multiple numbers are sent, the numbers are separated by commas.
When number pairs are sent, the numbers are separated by a comma
and terminated with a line feed
HP-IB Programmbg and Co-
d Reference
Page 38

The network analyzer offers several options for outputting trace-related
data. Data can be selectively read from the trace using the markers,
or the entire trace can be read by the controller. If only
information is required (such as a single point on the trace or the result
of a marker search), the marker output command can be used to read
the information.
or
commands. These commands allow a much faster data
transfer than when using markers to output
more information on these
Special
A marker must IWt be assigned to the desired frequency before it can
be used to read the trace data. This is accomplished using the marker
commands. The controller sends a marker command followed by a
frequency within the trace-data range If the actual desired frequency
was not sampled, the markers can be set to continuous mode and the
desired marker value wig be linearly interpolated from the two nearest
points. This interpolation can be prevented by putting the markers into
discrete mode Discrete mode allows the marker to only be positioned
on a measured trace-data point.
As
alternative, the analyzer can be programmed to choose the
stimulus value by using the MARKER SEARCH function. Maximum,
minimum, target value, or bandwidths search can be automatically
determined with MARKER SEARCH. To continually update the search,
switch the marker tracking ON. The trace-maximum search will remain
activated
data points can be read using the
data points.
co
located in HP
Programming
n
The search is switched OFF.
n
The tracking is switched
n
All markers are switched
HP-IB Pro@tunmin~
d Reference Guide
Page 39

Marker data can be output to a controller by using analyzer commands.
These commands cause the analyzer to
three numbers: marker
value 1, marker value 2, and marker stimulus value. For example, in
log-magnitude display mode we get the log magnitude at the marker
(value
zero (value
and the marker frequency. See for
a complete listing of all the possibilities for values 1 and 2. The four
possibilities for the marker stimulus value are:
n
frequency
n
time (as in time domain, Option 010 Only)
n
n
power (in power sweep mode)
Programming and
d Reference Guide
Page 40

Format
PHASE
DELAY
CHART
Marker
Mode
LIN
LOG MKR
1
T
real
real
2
t
t
t
OUTPFORM
2
t
t
t
real
real
real
real
value
T
real
real
value
t
t
t
degree:
degree:
G + jB
POLAR
REAL
IMAGINARY
marker readout values are the marker values displayed in the
right-hand comer of the display. They also correspond to the
due and
2 is not
value associated with the fIxed marker.
real
real
SWR
real
in this format, though it is included in data
real
real
real
real
t
SWR
real
real
real
t
SWR
1-82
HP-IB
and Comman
d Reference Guide
Page 41
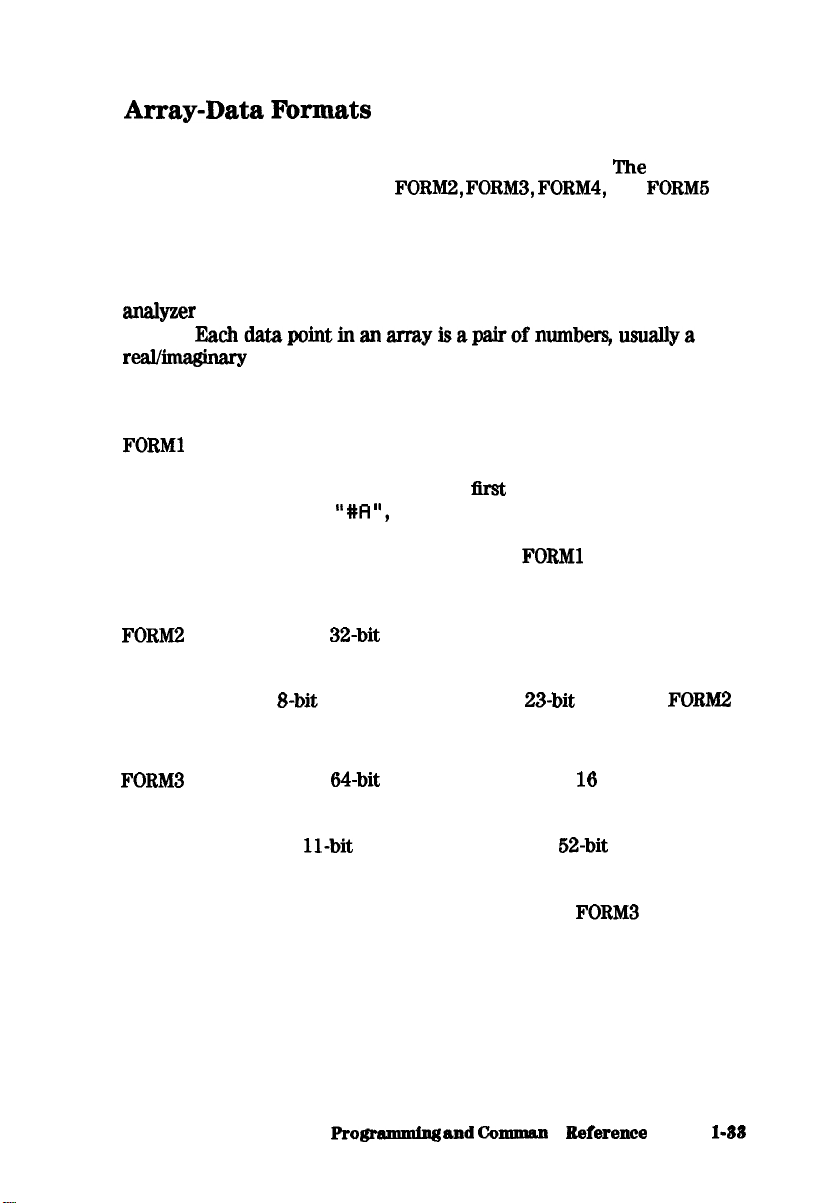
The analyzer can transmit and receive arrays in the analyzer’s internal
binary format as well as four different numeric formats.
format is set with the FORMl,
commands. These commands do not affect learn-string transfers,
calibration-kit string transfers, or non-array transfers, such as command
query, or output marker values.
A transmitted array will be output in the current format, and the
will attempt to read incoming arrays according to the current
format. Eachdatapointinanarrayisapairofnumbers,usuallya
pair The number of data points in each array is the same
as the number of points in the current sweep.
The five formats are described below:
The analyzer’s internal binary format, 6
bytes-per-data point. The array is preceded by a
four-byte header. The
string
the standard block header. The second
two bytes represent the
two bytes are an integer representing the number of
bytes in the block to follow.
is best applied
when rapid data transfers, not to be modified by the
computer nor interpreted by the user, are required.
IEEE
floating-point format, 8 bytes-per-data
point. The data is preceded by the same header as
in FORMl. Each number consists of a l-bit sign, an
mantissa.
is the format of choice if your computer supports
single-precision floating-point numbers.
current
and
IEEE
floating-point format,
bytes-perdata
point. The data is preceded by the same header as
in FORMl. Each number consists of a l-bit sign,
an
biased exponent, and a
mantissa.
This format may be used with double-precision
floating-point numbers No additional precision is
available in the analyzer data, but
may be
a convenient form for transferring data to your
computer.
HP-IB Prognumning
d
Guide
Page 42

ASCII floating-point format. The data is transmitted
as ASCII numbers, as described previously in “Output
Syntax”. There is no header. The analyzer always
uses
to transfer data that is not related to
array transfers (i.e. marker responses and instrument
settings).
PC-DOS
floating-point format with 4
bytes-per-number, 8 bytes-per-data point. The data is
preceded by the same header as in
order is reversed to comply with PC-DOS formats. If
you are using a PC-based controller,
most
effective format to use.
The
terminates each
line with the last byte
ransmission by asserting the EOI interface
t
‘tted.
l-6 offers a comparative
overview of the five arraydata formats.
1-5.
8753E Network Analyzer Array-Data Formats
2
6
header
IEEE 64-bit
Numbers
Floating-Point
used In FORM 4.
Data
4
8
24 60
4 8
6
8
The byte
is the
trace with header
1206
1603
3216
10,060
1603
Bytee
1210
1612
3220
1612
HP-IB
and Comman
d Reference Guide
Page 43

Transferring trace-data from the analyzer using an instrument controller
can be divided into three steps:
1. allocating an array to receive and store the data
2. commanding the analyzer to transmi
3.
accepting the transferred data
Data residing in the analyzer is always stored in pairs for each data
point (to accommodate
has to be two elements wide, and as deep as the number of points in the
array being transferred. Memory space for the array must be declared
before any data can be transferred from the analyzer to the computer.
As mentioned earlier, the analyzer can transmit data over
different formats. The type of format affects what kind of data array
is declared (real or integer), because the format determines what type
of data is transferred.
different formats are discussed in “Example 3: Measurement Data
located
in HP
Programming
information on the various types of data that can be obtained (raw
data, error-corrected data, etc), see “Data Levels,” located later in this
document,
information on transferring trace-data by selected points, see
“Limit Line and Data Point Special
Programming
‘t
the data
pairs). Hence, the receiving array
in five
examples of data transfers using
Guide.
located in HP
“Example
Reading ASCII Disk
Instrument Controller’s Disk
Programming Crumples
access disk
HP-IB
from a computer.
Co-
d
to the
located in HP
explains
how to
Page 44

Frequency-related
are calculated for the analyzer display. The
start and stop frequencies or center and span frequencies of the selected
frequency range are available to the programmer.
In a linear frequency range, the frequency values can be easily
calculated because the trace data points are equally spaced across the
trace. Relating the data from a linear frequency sweep to frequency can
be done by querying the start frequency, the frequency span, and the
number of points in the trace,
Given that information, the frequency of point
n
in a linear-frequency
sweep is represented by the equation:
F-Start frequency + (n-l) x
In most cases, this is an easy solution for determining the related
frequency value that corresponds with a data point. This technique
is illustrated in “Example 3B: Data Transfer Using FORM 4 (ASCII
Format),” located
in HP
Programming Rrumples
When using log sweep or a list-frequency sweep, the points are not
evenly spaced over the frequency range of the sweep. In these cases,
an effective way of determining the frequencies of the current sweep is
to use the OUTPLIML
used for limit lines, it can
co
be used to identify all of the frequency
points in a sweep. Limit lines do not need to be on in order to read
the frequencies directly out of the instrument with the OUTPLIML
command. Refer to “Example
Information,” located
in HP
Data Transfer Using Frequency Array
Programming
Another method of identifying
points in a sweep is to use the marker commands
and
loop that corresponds to the number of
points in the sweep.
at a point in the sweep, where x is the number of
the point in a sweep, and OUTPMARK outputs the
stimulus
HE-IB Pro@ammh@ and Co-
as part of the marker data.
of the frequency
in a FOR
places a marker
d Reference
Page 45

This section describes the manner in which the analyzer processes
measurement data. It includes information on data arrays, common
output commands, data levels, the learn string, and the calibration kit
shows the different kinds of data available within the
instrument:
n
pre-raw measured data
n
raw measured data
n
error-corrected data
formatted data
n
trace memory
calibration
Trace memory can be directly output to a controller with
but it cannot be directly
‘tted back.
,
HP-IB Pro@ammin~ and Co-
d
Guide
Page 46

OUTPPRE
OUTPCALC
I
OUTPRAF
OUTPDATF
Figure 1-4. The Data-Processing Chain for Measurement Outputs
All the data-output commands are designed to insure that the data
transmitted reflects the current state of
n
and OUTPFORF will not transnu
OUTPFORM, OUTPDATF,
data until
instrument:
formatting functions
have completed.
n
‘ts data in
with
the SWPSTART command. Refer to “Example
Correction Processed on an External PC,
Programming
OUTPIJML,
and OUTPLIMF will not transmit data until
located in HP
the limit test has occurred (if activated).
n
OUTPMARK
It
completed before transnu
will activate a marker if a marker is not already selected.
‘tting data.
Pro@ammb@ and
d Reference Guide
mode and
Error
Page 47

current trace before transmi
insures that the statistics have been
tting data. If the statistics are not
for the
activated, it will activate the statistics long enough to update the
current values before deactivating the statistics.
n
OUTPMWID insures that a bandwidth search has been executed for
the current trace before t
data. If the bandwidth-search
function is not activated, it will activate the bandwidth-search
function long enough to update the current values before switching
OFF the bandwidth-search functions.
The HP 8753E has four distinct fast data transfer commands. These
commands circumvent the internal “byte handler” routine and output
trace dumps as block data. In other words, the
outputs the
entire array without allowing any process swapping to occur
data transfer times are not affected by these routines. However,
there are speed improvements with binary data formats. The following
is a description of the four fast data transfer commands:
n
OUTPDATF outputs the error corrected data from the active channel
in the current output format. This data may be input to the
using the INPUDATA command.
n
OUTPFORF outputs the formatted display trace array from the active
channel in the current output format. Only the
number in each
of the OUTPFORM data pairs is actually transferred for the display
value for these display formats, the INPUFORM command may not be
used to re-input the data back into the
may not be
in some display formats (see lhble l-4), thus
The second value
reducing the number of bytes transferred.
n
OUTPMEMF outputs the memory trace from the active channel. The
data is in real/hm@nary pairs, and, as such, may be input back into
the memory trace using
or INPUFORM followed by the
DATI command.
n
outputs the raw measurement data trace. The data
may be input back into the memory trace using the
command.
and
d Reference
Page 48

Different levels of data can be read out of the instrument. Refer to the
data-processing chain in
different types of data that are available from the network analyzer.
Pre-raw data
The following list describes the
This is the raw data without sampler
correction or attenuator offsets
applied. With raw offsets turned off,
the calibration coefhcients generated
can be transferred to an external
controller and used with the data
gathered using the
commands. Refer to “Example
Error Correction Processed
on an External Computer,” located in
If a
measurement
calibration is active, or
on, the four arrays refer to
and
respectively. This data is
represented in
lBampeS
mode is
,
pairs.
Raw data
The basic measurement data,
reflecting the
averaging, and IF bandwidth. If a
full
is activated, there are actually
four raw arrays kept: one for each
raw S-parameter. The data can be
output to a controller with the
commands OUTPRAW 1,
only raw 1 is available, and it holds
the current parameter. If a
measurement calibration is active,
the four arrays refer to
and
represented in reaUimagimv pairs.
Error
The results of a measurement
calibration are arrays containing
error coefhcients. These error
error-correction routines. Each array
corresponds to a specific error term
HP-IB
parameters,
measurement calibration
Normally,
respectively. This data is
d
,
Page 49

Error-corrected data
in the error model. The HP
User’s
details which error coefllcients are
used for
calibration types, as
well as the arrays those coefllcients
can be found in. Not all calibration
types use all 12 arrays. The data is
stored as real/imaghry
error-correction applied. The
array represents the currently
measured parameter, and is
in real/imaginary pairs. The
error-corrected data can be output to
a controller
command.
with the
The
command reads the trace memory,
if available. The trace memory also
contains error-corrected data. Note
that neither raw nor error-corrected
data reflect such post-processing
functions as electricaldelay offset,
trace math, or time-domain gating.
Formatted data
This is the array of data actually
being displayed. It reflects all
post-processing functions such as
electrical delay and time domain.
The units of the array output depend
on the current display format.
See
for the various units
deflned as a function of display
format.
Generally, formatted data is the most useful of the
data levels,
because it is the same information the operator sees on the display.
However, if post-processing is unnecessary (e.g. possibly in cases
involving smoothing), error-corrected data may be more desirable.
Error-corrected data also affords the user the opportunity to input the
data to the network analyzer and apply post-processing at another time.
HP-IB
and
d Reference Glide 1-41
Page 50

of the instrument state. It includes all the
front-panel settings, the limit-test tables, and the list-frequency table for
the current instrument state. It does not include calibration data or the
infonuation stored in the save/recall registers.
The learn string can be output to a controller with the
command, which
string has a
ds
the analyzer to start transmitting the
length for a given
OUTPLEAS;
revision. The
array has the same header as in FORM 1. Refer to “Example 5:
the Learn String,” located in HP
The calibration kit includes a set of key characteristics of the calibration
standards used to determine the calibration accuracy. There are default
kits for several different connector types. There is also space for a
calibration kit. The command
currently active calibration kit as a
string in FORM 1. As with
the learn string, the calibration-kit string has a
outputs the
length for a given
revision.
d Eeference Guide
Page 51

This section describes the analyzer’s error-reporting process. It includes
information on status reporting, the status byte, the event-status
registers, and the error output.
The
1-6 for a description of each bit within the status reporting
structure.
status reporting structure is depicted in Refer
1-5. Status
and
Structure
d Reference
1-48
Page 52

1-6. Status Bit Definitions
Bit
for reverse
1
Waiting for forward
2 Check event&atua
4 Mesaage
in output queue A command has prepared information to be output, but it
Check event-status
6 Bequest
7
Bit
Name
0 Operation complete
1 Bequest control
2
Sequence Bit
4
error
Byntaxermr
6
Definition
Not applicable for the HP
Not applicable for the HP
One of the enabled
In event statue register B
beer
Bet.
been placed
the error queue, but has not been read yet.
has not been read yet.
One of the enabled
One of the enabled
An Inetrument preset
in the event-statun register
in cawing an SRQ.
been executed.
A command for which OPC has been enabled has
completed operation.
The analyzer
been commanded to perform an
that requires control of a peripheral, and needs control of
The analyzer
been addressed to talk but there
nothing in the output queue to
A sequence has executed the
A command
The incoming
received that could not be executed.
conunande contained a syntax error.
command.
The syntax error can only be cleared by a device clear or
an
The operator has pressed a
preset.
key or turned the
7 Poweron
1-44
HP-IB
A power-on sequence
the regher.
and Cbmman
d Reference Chide
occurred since the last read of
Page 53

Status Bit
Begleter B
Name
0 Single rnveep, number of
1
2 Data entry complete
3 Limit failed, Channel 2
4
5
6
7 Copy
or calibration step
complete
Service routine waiting or An internal service routine
done
failed, Channel 1
Search failed, Channel 2
Search failed, Channel 1
A
completed
waiting for an operator response.
A terminator key
A marker search
target value
A marker search wan executed on Channel 1, but the
target value
group, or calibration step
the
failed on Channel 2.
been pressed or a value entered ovel
read of the
executed on Channel 2, but the
not found.
not found.
(continued)
been
read of the register.
completed operation, or
failed, Channel 4
0 Limit failed, Channel 8
LO Search falled, Channel 4
Search failed, Channel 3
Limit test failed on Channel 4.
Limit
A marker
value
A marker
target value was not found.
wan executed on Channel 4, but the
not found.
wa8 executed on Channel 3, but the
The analyzer has a status-reporting mechanism that reports information
about specilk
functions and events. The status byte (consisting
of summary bits) is the top-level register. Each bit reflects the condition
of another register or queue. If a summary
bit is set (equals
corresponding register or queue should be read to
the
the status
information and clear the condition. Reading the status byte does not
affect the state of the summary
the condition of the
bits. The summary bits always reflect
queue or register.
The status byte can be read by a serial poll or by using the command
OUTPSTAT does not automatically put the instrument in
remote mode, thus giving the operator access to the analyzer front-panel
functions.
be interpreted as the
will return an ASCII (text) integer
status byte. Using the OUTPSTAT command
HP-IB
and
d Reference
that can
Page 54

will not necessarily return the same status byte value as when using
a
poll because the “Message in Output Queue” bit is always set
when using
The status byte:
n
summarizes the error queue
summarizes two event-status registers that monitor
conditions
inside the
n
contains a bit that is set when the instrument is issuing a service
request (SRQ) over
n
contains a bit that is set when the
has data to transmit over
HP-IB
Any bit in the status byte can be selectively enabled to generate a
service request
when set. Setting a bit in the
enable register with the command enables the corresponding
bit in the status byte. The units variable
equivalent of the bit in the status byte For example,
status-byte bits 3 and 4 (since
bits.
will not affect the state of the status-register bits.
+ 24) and disables all the other
nn
represents the binary
enables
The sequencing bit can be set during the execution of a test sequence to
assert an SRQ.
The status byte also
error queue. (The error queue is described in the next section.) When
the
outputs information, it puts the information in the output
queue where it resides until the controller reads it. The output queue
is only one event long. Therefore, the next output request will clear
the current data. The
summary bit is set whenever there is data in the
output queue.
The event-status register and event-status register B are
two registers in the status-reporting structure. They are selectively
by bits in the status byte via enable registers. The
event-status registers consist of latched
the beginning of a
trigger condition in the instrument. It can
A latched bit is set at
only be cleared by reading the register. The bit will not be reactivated
until the condition occurs again. If a bit in one of these two registers is
enabled, it is summarhed
registers
of
which
are
work
enabled
in the same
by the
using the
manner
summary bit in the status byte. The
commands
as
The
units variable
represents the binary equivalent of the bit in the status byte.
1-48
HP-IB
and Command Reference Guide
other
, both
Page 55

If a bit in one of the event-status registers is enabled, and therefore, the
bit in the status byte is enabled, an
will be generated.
The SRQ will not be cleared until one of the five following conditions
transpire:
1. The event-status register is read, clearing the latched bit.
2. The summary bit in the status byte is disabled.
3. The event-status register bit is disabled.
4. The status registers are cleared with the command.
An instrument preset is performed.
Service requests generated when there are error messages or when the
instrument is waiting for the Group Execute Trigger (GET) command are
cleared by:
reading the errors
issuing GET (disabling the bits)
n
clearing the status registers
When an error condition is detected in the
a message is
generated, displayed on the analyzer’s display screen, and placed in the
error queue. Error messages consist of an error number followed by an
ASCII string no more than SO-characters long. The string contains the
same message that appears on the
holds up to 20 error messages
the order in which they occur The
display. The error queue
error messages remain in the error queue until the errors are read by
the system controller using the command OUTPERRO. The OUTPERRO
command outputs one error message
The error queue can only be cleared by performing an
instrument preset or by cycling the line power.
order to keep the queue
it is important to
read all of the messages out of the queue each time
errors are detected.
HP-IB
Command Reference
1-47
Page 56

explanations and suggestions in finding the cause of the error
messages, refer to the alphabetical listing in Chapter 10 of the HP
User’s
Some error numbers have been omitted
due to obsoleted error messages.
Error
Number
OPTIONAL FUNCTION; NOT
1
INVALID KEY
2
CORRECTION CONSTANTS NOT
3
PHASE LOCK CAL FAILED
4
NO IF FOUND: CHECK R INPUT LEVEL
POSSIBLE FALSE LOCK
6
NO PHASE LOCK: CHECK R INPUT LEVEL
7
PHASE LOCK
8
9
10
11
12
13
14
TABLE EMPTY
CONTINUOUS SWITCHING NOT ALLOWED
SWEEP TIME INCREASED
SWEEP TIME TOO
AVERAGING INVALID ON NON-RATIO
FUNCTION NOT VALID
NO MARKER SPAN NOT SET
16
17
I9
20
21
22
23
TRANSFORM, GATE NOT ALLOWED
DEMODULATION
TABLE EMPTY:
but there is no list freq. table
AIR FLOW RESl’RICTED: CHECK FAN FIEl’ER
POWER
POWER
PROBE POWER SHUT
NOT VALID
HOT!
SHUT
DOWN!
DOWN!
Error
MEASURE
if user select9
sweep type
and
d Reference Guide
Page 57

Error
24
I
26
28
30
31
32
I
33
34
37
38
30
40
42
43
46
46
47
48
PRINTER: not on, not connect, wrong addm
I
PRINT ABORTED
PLOTTER: not on, not connect, wrong
PLOTTER NOT READY-PINCH WHEELS UP
REQUESTED DATA NOT CURRENTLY AVAILABLE
ADDRESSED TO TALK WITH NOTHING TO
WRITE
SYNTAX ERROR
BLOCK INPUT ERROR
BLOCK INPUT LENGTH ERROR
CTRL OR PASS CTRL IN
ANOTHER SYSl’EM CONTROLLER ON HP-IB BUS
DISK: not on, not connected, wrong
DISK HARDWARE PROBLEM
DISK MEDIUM NOT INITIALIZED
NO DISK MEDIUM IN DRIVE
FIRST CHARACTER MUSl’ BE A LE’ITER
LETTERS AND NUMBERS ARE ALLOWED
NOT ENOUGH SPACE ON DISK FOR
NO FILE(S) FOUND ON DISK
ILLEGAL UNIT OR VOLUME NUMBER
DISK IS WRITE PROTECTED
DISK WEAR-REPLACE DISK SOON
WITHOUT SELECTING INPUT TYPE
FAILED
I
I
TOO MANY SEGMENTS OR POINTS
HP-IB
and Comman
d Reference
Page 58

Error
61
SO
61
63
I 64
66
67
68
70
I
72
I
I
73
74
I
I
77
111
112
113
114
115
I
INSUFFICIENT MEMORY
NO VALID MEMORY TRACE
NO VALID
OVERLOAD ON INPUT R, POWER REDUCED
OVERLOAD ON INPUT A, POWER REDUCED
OVERLOAD ON INPUT B, POWER REDUCED
BP 8753 SOURCE PARAMETERS CHANGED
CALIBRATION REQUIRED
CURRENT PARAMETER NOT IN CAL SET
CORRECTION TURNED OFF
DOMAIN RESET
ADDITIONAL SI!ANDARDS NEEDED
NO CALIBRATION
NO SPACE FOR NEW CAL. CLEAR REGISl’ERS
FORMAT NOT VALID FOR MEASUREMENT
WRONG DISK FORMAT, INITIALIZE DISK
DEADLOCK
SELF
NO FAIL FOUND
TROUBLE! CHECK SETUP AND
IN REGISTER
MEMORY CLEARED
I
I
FAILED
OVER
HP-IB ProIpumning and
d Reference Chide
Page 59

Error
Number
116
117
118
110
I I
POWER METER INVALID
PWR MTR: NOT ON/CONNECTED OR WRONG ADDRS
POWER METER NOT SETTLED
DEVICE: not on, not connect, wrong addm
127
I
130
131
132
I I
133
I I
146
I
141
144 NO LIMIT LINES DISPLAYED
146 EXTERNAL SOURCE MODE REQUIRES CW TIME
150
152
153
134 INSUFFICIENT MEMORY, PWR MTR CAL OFF
157
160
161
162
CAN’T STORE/LOAD SEQUENCE, INSUFFICIENT MEMORY
INVALID WITH SINGLE CHANNEL
FUNCTION NOT VALID DURING MOD SEQUENCE
MEMORY FOR CURRENT SEQUENCE IS FULL
THIS LIST FREQ INVALID IN HARM/S OH2 RNG
FREQ OFFSET
FREQ + OFFSET MUST BE < 3
LOG SWEEP REQUIRES 2 OCTAVE MINIMUM SPAN
SAVE FAILED
INVALID:
SEQUENCE MAY HAVE CHANGED, CAN’T CONTINUE
SEQUENCE ABORTED
(CH2) ‘DiRGET VALUE NOT FOUND
PRESS [MENU), SELECT CW (IF) FREQ, THEN SWEPT LO
I
EXT SRC: NOT ON/CONNECTED OR WRONG ADDR
VALID IN NETWORK ANALYZER
INSUFFICIENT MEMORY
NUM PTS DIFFERENT
I
I
HP-IB
and Command Reference
1-51
Page 60

Error
Number
163
I
164ITOO MANY NESI’ED SEQUENCES. SEQ ABORTED
166
I
167
168 INSUFFICIENT MEMORY FOR PRINT/PLOT
160 HPIB COPY IN
170 COPYzdevice
171
I
173
174
175 PRINTER: error
176 PRINTER: busy
177
178
170
FUNCTION
PARALLEL PORT NOT AVAILABLE FOR GPIO
PRINT/PLOT IN PROGRESS, ABORT WITH LOCAL
PARALLEL PORT NOT. AVAILABLE FOR COPY
I
PRINTER: paper error
I
PRINTER: not connected
PRINTER: power
PRINTER: not handshaking
print color not supported with EPSON
POWER UNLEVELED
VALID DURING MOD SEQUENCE
not responding; copy aborted
Error
ABORT WITH LOCAL
I
I
I
CANNOT FORMAT DOS DISKS ON THIS DRIVE
187
188 DIRECTORY FULL
180
SWEEP MODE CHANGED TO CW TIME SWEEP
DISK READ/WRITE ERROR
and
d
Page 61

Error
Error
MESSAGE LENGTH ERROR
191
I
103
I
104
I
105
I
106
I
107 FILE NOT FOUND OR WRONG TYPE
I I
108 NOT ALLGWED DURING POWER METER CAL
100 CANNOT MODIFY FACTORY PRESET
200
201 FUNCTION NOT VALID FOR INTERNAL MEMORY
202
I I
203
204
I
205
206
207
208
I
211
212
EXT SOURCE NOT READY FOR TRIGGER
FILE NOT FOUND
I
ASCII: MISSING ‘BEGIN’ statement
ASCII: MISSING ‘CITIFILE’ Btatement
ASCII: MISSING ‘DATA’ statement
ASCII: MISSING ‘VAR’ statement
ALL REGISTERS HAVE BEEN USED
FUNCTION NOT AVAILABLE
CANNOT READ/WRITE HFS FILE SYSTEM
FREQS CANNOT BE CHANGED, TOO MANY POINTS
I
LIMIT TABLE EMPTY
ARGUMENT OUT OF RANGE
POWER OUT MAY BE UNLEVELED
EXT R CHAN MUST BE ON FOR FREQUENCY OFFSET MODE
SWEEP
MODE
OVERLAP! LIST TYPE CHANGED TO STEPPED
ANALOG BUS DISABLED IN 6
RANGE CAUSED POWER LVL CHANGE IN
CORRECTION ON: AUX CHANNEL(S) RESTORED
CAUTION: CORRECTION OFF: AUX CHANNEL(S) DISABLED
CAUTION: AUX CHANNELS MEASURE S-PARAMETERS
ONLY
BE STEPPED
FREQUENCY OFFSET
IFBW
I
I
I
I
I
I
I
Z-PORT CAL REQUIRED FOR AUX CHANNEL USE
HP-IB Progmmmhrj and Comman
d Reference Guide
Page 62

Calibration
Measurement calibration over
follows the same command
sequence as a calibration from the front-panel. information,
refer to
HP
Network Ana&zer
1. Start by selecting a calibration hit, such as
2. Select a calibration type, such as
Measurement Results” in the
l-port
ohm type-N
(CAL
IS 111;
3. Call each class used by the calibration type, such as
(CLASS
11 A; ) During a
reflection, transmis
sion,and isolation subsequences must be opened
before the classes in the subsequence are
calibration, the
and then closed at
the end of each subsequence.
4. If a class has more than one standard in it, select a standard from the
menu presented
to
If, during a calibration, two standards are measured to satisfy one
class, the class must be closed with
DONE;.
6. Declare the calibration done, such as with ~~~~~~~~~~~~~:~:~~
1;
over HP-IB).
The
to STANG commands will hold off the
until
completion because they trigger a sweep. If a class has only one
standard in it, which means that it will trigger a sweep when
class command will
hold off the HP-IB.
the
HP-IB
Since different cal kits can have a different number of
standards in a given class, any automated calibration
sequence is valid only for a specific
and
d Reference
hit.
Page 63

1-7.
Relationship between Calibrations and Classes
1 These subheadin@ must be called when doing full 2-port calibrations.
2 These subheadin@ must be called when doing
HP-IB [email protected]@ and Co-
a-port calibrations.
d Reference
Page 64

Error Coefficient Arrays
Eesponaeand
Isolation
2
3
8
9
10
12
1 One path, 2-port
2 Response and isolation corrects for
transmission measurements, and for directivity and reflection tracking in
reflection measurements.
Meaning of
D
directivity
duplicates arrays 1 to 6 in arrays 7 to 12.
subscript:
and transmission tracking in
S-source match
-reflection tracking
X-crosstalk or isolation
L-load match
T
trammission tracking
Meaning of second subscript:
F-forward
R-reverse
Pro@ammiqf and
d Reference Guide
Page 65

Display Graphics
Size of Graticule only
n
length to 4915
height
to 3950
Size of Complete Display (graticule plus annotation and
length
height
0
0 to 4095
Command
CS;
Description
Erases the user graphics display.
Turns off the measurement display.
the direction in which characters are
lettered.
l,0
-l,0
0 degrees
90 degrees
180 degrees
270
degrees
labels)
DF;
LB[text][etx];
Sets the default values.
Labels the display, placing the symbols starting
at the current pen position. All incoming
characters are printed until the etx symbol is
received. The default etx symbol is the
value 3 (not the character 3).
BP-IB
and
Page 66

Specifies line type:
PD;
Outputs
and
the scaling limits:
Draws from the current pen position to
There can be many pairs of x,y coordinates
within one command. They are separated by
commas, and the entire sequence is terminated
with a semicolon.
Pen down. A line is drawn only if the pen is
down.
Erases the user graphics display.
Plot relative: draws a line from the current pen
position to a position y up and x over.
Pen up. Stops anything from being drawn.
Turns ON the measurement display.
Sets the character size, for height h and width w
in centimeters:
Selects pen n:
HP-IB
and
d Iteference Guide
Page 67

Accepted but ignored
service request mask
scaling points
commands:
Input window
OC Output current pen position
OE Output error
01 Output identity
Output status
SL Character slant
SR Relative character size
Guide l-5B
Page 68

Disk
characters, such as
kind of information in the
index, used to distinguish
created by the analyzer consist of a state name of up to eight
appended with up to two characters. In
format, the
The IWt appended character is the
name is
In DOS format, the
type, telling the
The second appended character is a data
of the same type.
is
Error-corrected data, raw data, formatted data, memory traces, and
calibration files are FORM 3 data files (IEEE 64-bit floating point
format). The other
are not meant to be decoded. lists the
appended characters and their meanings
1-9. Disk File
I, P Instrument state
Four-channel instrument state
W
1
G
D
Error-corrected data
Raw data
Display @aphica
1
Channel 1
2
Channel 2
3
Channel 3
4 Channel 4
1
4 ChlICh3, raw
8 Ch2lCh4,
raw
arrays1to 4
arrays1to 4
F
Formatted data
M
Memory trace
C
kit
and
1
Channel 1
2
Channel 2
3
Channel 3
4 Channel 4
1
Channel 1
2
Channel 2
3
Channel 3
4 Channel 4
K
d Reference
Guide
Page 69

1-9. Disk File Suffixes (continued)
1
Cal data, channel 1
2
Cal data, channel 2
F
Full page (HP-GL plot)
0
A
B
C
Same
P
1
11
12
channel
L
R
Right (HPGL plot)
S
Error-corrected
L
U
L
U
1
2
Lower
Lower
Channel 1
Channel 2
HP-IB
and Co-
d Reference Guide 1-61
Page 70

Using Key Codes
Using key codes allows remote control of the analyzer keys and can be
used as an alternative to using other
useful, but it is a highly recommended
command mnemonic appropriate for the function desired.
When using key codes, the following notes must be taken into
consideration:
commands. This may be
practice to use the
Note 1: An “invalid key” is reported with a 63.
Note 2:
Note 3:
OUTPKEY;
outputs the key code of the last key pressed.
outputs the last key code or knob count. If the reply
is positive, it is a key code. If it is negative, then set bit 16
equal to bit 14, and the resulting two byte integer is the
knob count. It can be either positive or negative. There are
about 120 counts per turn.
HP-IB
and commkn
d Reference
Page 71

Key Select Codes Arranged by Front-Panel
The
by their front-panel key equivalent.
that cm-respond to
listed under the
AVG
CAL-Error correction, calibration
CAL-Calibration kits
CAL-Power Meter Calibration
CHANNEL
COPY
DISPLAY
ENTRY
FORMAT
LOCAL
MENU (stimulus)
MARKER
MARKER FCTN
SAVE/RECALL-Internal registers
SAVE/RECALL-Disk
SCALE REF
SEQ-Sequencing
SYSTEM
SYSTEM-Limit testing
SYSTEM-Transform
Column headings:
Function
Action
Mnemonic
S
?
0
mnemonics in the following table are functionally arranged
example, all of the mnemonics
accessed by means of the
key in the following
The front-panel function affected by the mnemonic
The effects of the mnemonic on that function.
The
Syntax type. See “Syntax Types,” earlier in this
document.
Interrogate response. If a response is
listed.
OPC-compatible command.
mnemonic.
key, will be
it is
BP-IB Progmamu@ and Command
Guide
Page 72

The range of acceptable inputs and corresponding
units.
Symbol conventions:
Optional data.
D
Numerical data.
An integer appendage that is part of the command.
that the actual
A character string operand which must be enclosed by
double quotes.
example,
comman
and
where I- 1 to
ds are
indicates
<>
I
A necessary appendage.
An either/or choice in appendages.
HP-IB
and Co-
d Reference Guide
Page 73

Averaging
Restart
Key Select Codes
Mnemonic s 0
AVG
1
8
D
2
Smoothing
IF bandwidth
correction
Cal
Receiver
Port
Set
Set bandwidth
Resume a previously
calibration
Set power level for
receiver
receiver
calibration sweep
A
Input B
8
0.06 to 20%
2
8
D
c
2
2
1
power
8
8
8
2
Velocity
value
Value
HP-IB Pro@ammin@ and Comman
to 10
8
d
Guide
Page 74

Key Select Codes (continued)
Adapter
removal
nenu
Cal Fbrtl
Recall Cal
Adapter delay
Adapter: coax
Adapter: waveguide
Remove adapter
cal
measures
Hold 2-port cal
measurer all
4
only 2 parametem)
Number of sweep
cal
Alternate A and B
Chop A and B
None
and
l-port
l-port
I-port
One path
a-port
4
then
Mnemonic S
calibration
ADPTWAVE
MODS
CALN
0
1
1
1
1
2
2
8
1
1
1
1
1
1
1
1
1
1
cal
1
cal
a-port cal
HP-IB
Isolation
and
1
1
1
1
1
1
d Reference
Page 75

Key Select Codes (continued)
Intermediate
cal
Select
clam
Select
reflection
AL-error
Reflection
Line/match 1
(forward open)
(forward
(reverse open)
(reverse load)
Rev
Fwd match
Rev match
short)
Mnemonic
REVM
FWDI
0
I
1
1
1
1
1
1
1
1
1
1
1
1
Reverse isolation
clam
The clam commands are
he clam. If there
only calls another menu.
just one standard, that standard
If there
A
B
C
D
E
if there
more than one standard in the
ProgrammIng and Command Reference
only one standard in
measured
the clam
Page 76

Key Select Codes (continued)
correction, calibratfon
Sliding load Set
Done
load Load no offset WAN
Load
Done with:
Reflection
Transmission
load
Save cal
and
l-port cal
cal
Select default
2.929
Mnemonic
SLID
DONE
OFLD
RAID
SAVT
CALKUSED
I
1
OPC
1
1
1
1
1
1
OPC
1
1
OPC
1
1
OPC
1
1
1
1
1
1
1
1
1
1
1
1
1
Modify kit
number
.
HP-IB
current
selects the HP
cal
Camman
for the HP
d
Reference Guide
1
8
Page 77

Select Codes (continued)
std.
Define std.
Action
Short
Arbitrary huped.
Cpen cap.
Open cap. Cl
cap.
Fixed load
load
Delay
frequency
Max. frequency
STDTDELA
8
a
8
8
8
0
(lO-27
(1O-3e
to
Std. done
Waveguide
Standard defined
BP-IB
WAVE
STDD
and
d
char.
Page 78

I&y Select Codes (continued)
claw
(forward open)
(forward short.)
(forward load) sPFxx11c[I,I..]
(reverse open)
(reveme short)
load)
Match
Reverse
Reflect
Line or Match
Reflect,
Match
Match
Match
Line,
Line, Reverse,
Match
Mnemonic
(continued)
3
3
3
3
3
3
3
3
3
3
3
3
3
3
3
3
3
3
l 3
3
l 3
0
numbers
Std numbera
numbers
numbers
Std numbem
Std numbers
numbers
numbers
numbers
numbers
numbers
Std numbers
numbers
numbers
numbers
Std
Ttuu, Reverse,
3
l 3
Match
l a
These commands are accepted for compatibility with the revision 6.00
6.43.
d Reference Guide
numbers
numbers
numbers
Page 79

Select Codes (continued)
done
isolation
Forward
Match
Reverse
Match
Reflect
Line or Match
Reflect,
Match
Reflect, I&verse,
Match
Line, Rxward,
Match
CLAD
Mnemonic
l
0
3
8
S
3
8
3
3
3
3
3
3
3
8
10
char.
10 char.
10 char.
10 char.
10 char.
10 char.
10 char.
10 char.
10 char.
10 char.
10 char.
10 char.
10 char.
10 char.
10 char.
10 char.
10 char.
10 char.
10 char.
Reverse,
Reverse,
Reverse,
Match
Match
Match
‘These commands are accepted for compatibility with the HP
l
Commm
8
8
3
3
8
revision 6.00
d Reference Guide 1-71
10 char.
10 char.
10 char.
10 char.
10 char.
10 char.
Page 80

Key Select Codes (continued)
Function Action
done
Into
klt
Cal
Cal
SET
One sweep
Number of
Set port cal
Reflect
20
20
CAL-power
Mnemonic 8
kite (continued)
KITD
SAVEUSEK
meter
3
1
1
1
1
1
1
3 D
D
D
1
3 D
1 D
0
10 char.
Cal power:
Cal power:
Cal power:
Cal power:
power
table
Requires
1-72
Add segment
Edit segment N
Done with segment
Delete 6egment
Done
Clear list
mode when using the
Programming and
SADD
CLEL
2 1,0
1
2
1
3 D
1
1
1
1
port.
d Reference Guide
Sensor B available
HP 433A only
1 to 12
Page 81

Key Select Codes (continued)
C&power meter calibration (continued)
I
power Frequency
1
segment
I
cal Edit sensor menu A
table Edit sensor menu B
segment Cal factor
C
C
Value
Add segment
Edlt segment N
Done with segment
Delete segment
Done
Clear list
Frequency
Channel 1
Channel 2
Channel 3
Channel 4
lb
lb plot&~
Mnemonic
CALFBENA
CALFSENB
SADD
SDON
SDEL
CLEL
CHANNEL
COPY
0
1
1
1
8 D
1
1
1
1
3 D
3 D
1 OPO
1 OPO
1
1 OF%?
1
1
433A only
F
F
P
‘lotter
setup Default
t
frequency or power sweeps, refer to Chapter 12, ‘Preset State and Memory
A
Requires
Auto feed
setup Default
Auto feed
feed
In the HP
control mode when
HP-IB
2
1
1
2 1,0
1
1
the
port.
and
d Reference Guide l-78
Page 82

Key Select Codes (continued)
List values
parameters
Next page
Previous page
Values
parameters
print
feature Data channel 1
to
Monochrome
Color
Data channel 2
Data channel 3
Data channel 4
Memory channel
Memory
Memory channel 3
Memory channel 4
Reference line
Action
dump PRINT&L
channel 2
I
COPY (continued)
PREP
0
1
1
1
1
1
1
1
1
2
2
2
2
2
2
2
2
2
2
plotted
1-74
to be Data
HP-IB
Memory
Marker
and c0mme.n
2
2 l,o
2 l,o
2 l,o
2 l,o
2 l,o
d Reference Guide
Page 83

Key Select Codes (continued)
Function
Pen number
Plot scale
Plot speed
Left lower
Left upper
lower
Data
Memory
Marker
Data
Memory
Full page
Slow
to pl,p2
(continued)
0
1
1
1
1
1
3
3
8
3
3
3
3
1
1
1
1
.
. . .
. . .
...
...
. . .
. . .
1
. .
10
10
10
10
10
10
10
Pro@ammiqf and
d Reference Guide l-71
Page 84

l-10. Key Select Codes (continued)
Function
Auxiliary on/off
Dual on/off
split
display
display
One graMale per
channel
2 gratlcule display
with channel 2 on top
2
with channel 3 on top
4
with channel 2 in
4 gnatlcule
with channel 3 in
upper right
2 data divided by
channel 1 data, and
Data
Memory ouly
Data and mem
to
(Channel
DISPLAY
DISPDATA
DISPDDM
0
2 l,o
2 l,o
2 l,o
1 l,o
1 l,o
1 l,o
1 l,o
1 l,o
1 l,o
1 l,o
2 l,o
1
1
1
1
Rotation
Data
mem
Data to mem
Intensity
Blank Display
Title
On done BEEPDONE<ONIOPF>
Blank
and
d
2 1,0
Guide
1
1
3 D
2 l,o
4
2 1,0
1
48 char.
Page 85

Key Select Codes (continued)
Function
display
‘eature colors
color
intensity
Save colors
Recall colors
Default colors
Ch 1 memory
Ch 2 memory
Ch 3 memory
Ch 4 data/limit ln
Ch 4 memory
Reference line
Color
color
default
Mnemonic
(continued)
0
3
1
1
1
1
1
1
1
1
1
1
1
1
1
1
1
3
3
3
1
off
Up
Down
Polar
Real
SWR
HP-IB
UP
DOWN
and
1
1
1
1
1
1
1
1
1
1
1
1
d Reference Guide l-77
Page 86

Key Select Codes (continued)
Function Action
HP-IB modes
Use
Display commands
unit
Volume
HP-IB
addressee
Select plotter
Select printer
Plotter
Controller
Plotter
printer
control
Mnemonic
0
1
1
2
3
3
3
2
1
1
1
Select printer
plotter
1-78
HP-IB
DeskJet
LaserJet
HP-IB PRNPRTHPIB
Parallel
HP-IB PISPRTHPIB
and
PRNTYPDJ
PRNTYPPJ
PRNTYPEP
d Reference Guide
1
1
1
1
1
1
1
1
1
1
1
1
Page 87

Key Select Codes (continued)
serial
nput
Action
Baud
Handshake
Baud rate
Handshake
Cmtigwe
A
B MEASB
Selects
1
Mnemonic
LOCAL (continued)
AR
BR
AB
MEASA
0
3 D
2 1,0
3 D 1200,2400,4300,
2 l,o
2
CPY-COPY We
1
1
1
1
1
1
2
input
Syntax type
to the HP
TRAP
1 when ANABOFF.
Ana&z6r
HP-IB
Syntax type 3, and range
for
information on the
aud
1
1
1
1
1
1
1 to 31, when ANABON.
d Reference Guide l-79
Page 88

Select Codes (continued)
Action
Level
Always couple power
Port coupling
power
0
Range 1
Range 2
Range 3
Range 4
Range
Range 6
Range 7
auto/manual
Source power on/off
MENU
2
1
1
1
1
1
1
1
SD
2 l,o
2 l,o
1,0
2
2 l,o
? 0
option
set
sweep SWEA
‘Output power ranges: HP 87633
-86 to +SdBm. HP 87633 Opt. 011:
-6 to
Option 011 only.
-86
-6 to
3
3
3
+
HP 8763E Opt.
d
D
D
D
1
1
with Opt.
011 with Opt. 006:
Guide
0, 10, 20 . . . 70
7odB
36,400
Page 89

Key Select Codes (continued)
bupled
Hold
Single
Number of groups
Continuous
External trigger off
External trigger on
Manual
Value
slope
value
Mnemonic
MENU 1timuln6)
HOW
on
on
0
1
1
3
1
2
2
1
1
3
D
2
, 11,26, 61,101
01, 401, Sol, 1601
Linear
a
Power
Fbr frequency or power sweeps, refer to Chapter 12, “Preset State and Memory
&cation,” in the
weep,
on:
l/frequency step.
HP-IB
POWS
Fbr CW time: 0 to 24
CW
and
1
1
1
1
1
1
sweep,
Rx frequency
on:
d
l/time
Guide 1-81
Page 90

l-10.
Select Codes (continued)
Add
Edit segment N
Done
Clear list
segment Start
Center
Points
cw
Done with segment
more
Segment power
Segment
segment
BW
I
(stimulue) (continued)
SADD
SDEL
s 7 0
1
1
D
1
1
1
2 1,0
SD
3 D
8 D
D
SD
8 D
1
2 l,o
SD
2 l,o
8 D
Stimulus ranget
3, 11, 21, 26, 61,
101
1601
option
10,
1000,
8700,
Single negment
sweep
AU segment sweep
For frequency or power
to
in the HP
on:
HP 8768E
HP-IB
weep,
‘Output power ranges: HP 8763E
l/frequency step.
Opt.
011:
1
1
refer to Chapter 12, “Preset State and Memory
CW time: 0 to 24 houra Fbr frequency
and
-86 to +
-6
CW time sweep,
HP 87633
BP
d Reference
Opt. 011 with Opt.
on: *l/time
Opt. 076:
Page 91

Select Codes (continued)
Select active
zero
reference
Coupled
markers
All off
zero
Fixed
Mode 0%
Value
Aux value
Continuous
channels
Uncouple
Mnemonic
s
1
1
2
1
1
8
8
8
0
D
D
D
Stimulus ranSet
Amplitude
Amplitude
Fbr frequency or power
Allocation,” in the
frequency
Fbr log
600 unita
positive, and has minimum
and 10
on:
step.
600
linear magnitude:
HP-IB Programming and
refer to Chapter 12, ‘Pre8et State and Memory
on:
ph8w:
l/frequency step.
600
600
CW
of ,001
CW time
Fbr Smith
0 to 24 houra Fbr
600
degrees,
d
and
The wale
Guide
Page 92
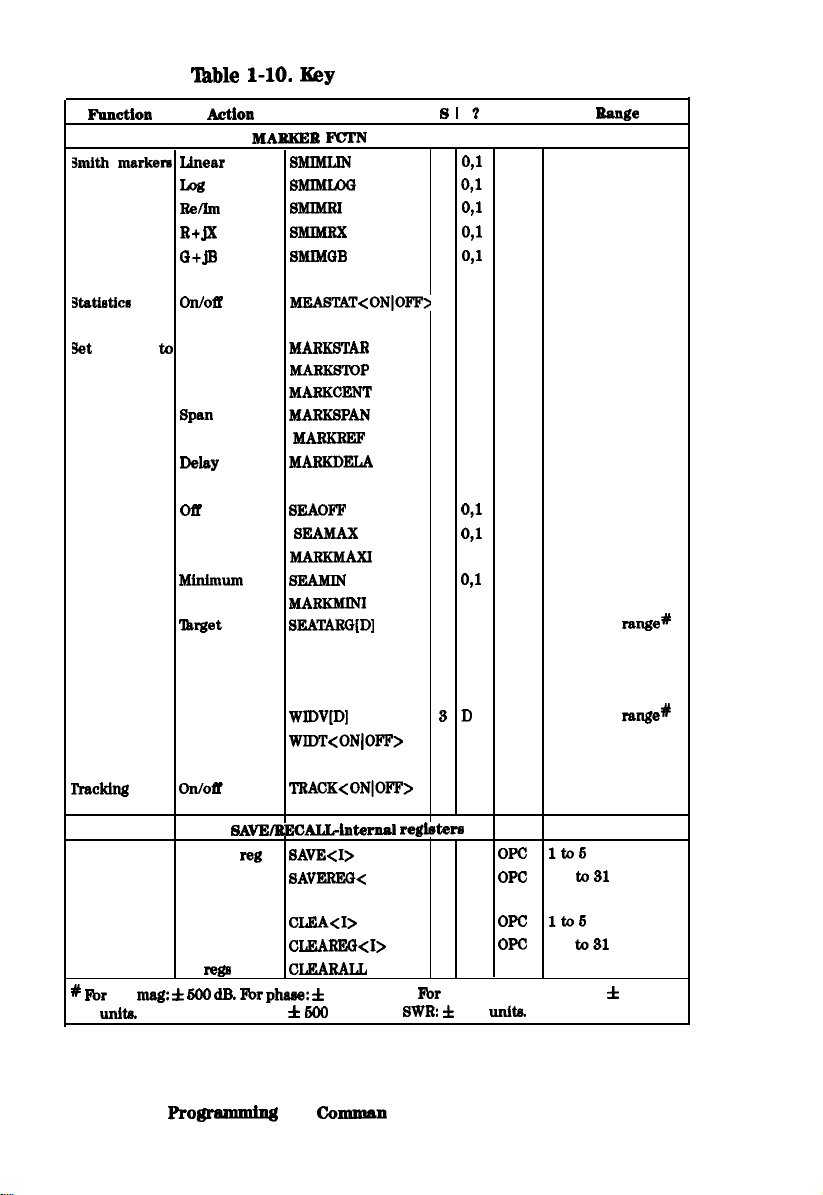
I&y Select Codes (continued)
marken
function
Start
marker value Stop
Center
Reference
&arch
Maximum
Search
Search right
left SEAL
SEAR
Mnemonic
(continued)
1
1
1
1
1
2 1,0
1
1
1
1
1
1
1
1
1
8 D
1
1
0
Amplitude range+
Width
Value
Width on/off
search
Save
Selected
Selected reg
Clear
Selected reg
Selected reg
AII
log
600
1-84
Fbr linear magnitude: units. Fbr
HP-IB Pro@‘aunnhg and
Amplitude
2 l,o
2 l,o
2
I>
2
2
2
1
600 degrees.
Smith chart and Polar:
600 units.
01 to31
01
OPC
d Reference Chide
Page 93

Key Select Codes (continued)
Selected reg
Selected
Internal reg
Internal
Save state
Plot
Selected
lb
Disk ffle
labels from
Copy labele from
real and bnaghuuy
Mnemonic
I
regletcm (contiued)
0
2
2
4
4
4
4
2
2
4 1 to 6, 10 char.
1
1
2 1,0
01
1 to
01 to 81, 10
char.
01 to
char.
01 to 81, 10
char.
char.
ffles
Raw date
data
User graphicr
Data only (error
corrected,
real
and
format
SAVUBINA
SAVUASCI
From
Recall
Requires pass control mode when using the
‘See
1-1.
error corrected data
HP-IB
the
2 l,o
2 1,0
2 1,0
2 1,0
1
1
2
1
port.
that output by the command
and
d
Page 94

Key Select Codes (continued)
Scale
Reference
log mag:
600 unlb.
and 10
Internal memory
Internal disk
External disk
Internal
Value
Value
Set delay
Coaxial delay
Waveguide delay
600
and
Fbr
minimum
linear magnitude:
Mnemonic S
INTD
MA-
WAVD
600 degrees.
600 units.
of
0
1
1
D
1
1
1
1
1
1
1
8
D
3
D
8
1
D
8
1
1
D
600 unite. The scale
Range
166
8102
Amplitude
0 to 10
Amplitude range#
10.0
0 to 360 deg
chart and Polar:
degrees,
HP-IB
and
d Reference
Page 95

Key Select Codes (continued)
nenu
Action
Continue sequence
Do sequence
sequence
New/modify sequence
Pause to
Done modify
Select sequence
Duplicate seq. X
Print sequence I
title
sequence I
Clear llequence I
continuously
low
high
low
Program all
output bits
Set specified bit on
Y
end
end sweep
forward
seq.
I
CONS
Mnemonic
1
2
2
2
1
1
2 I
2
1
2
2
1
1
1
1
8 D
8 D
D
0
1 to 6, 10 char.
0 to 266
Clear specified blt on
bit for
Input
do
Input
do
bit
bit low
HP-IB
and
1
1
d Reference
Page 96
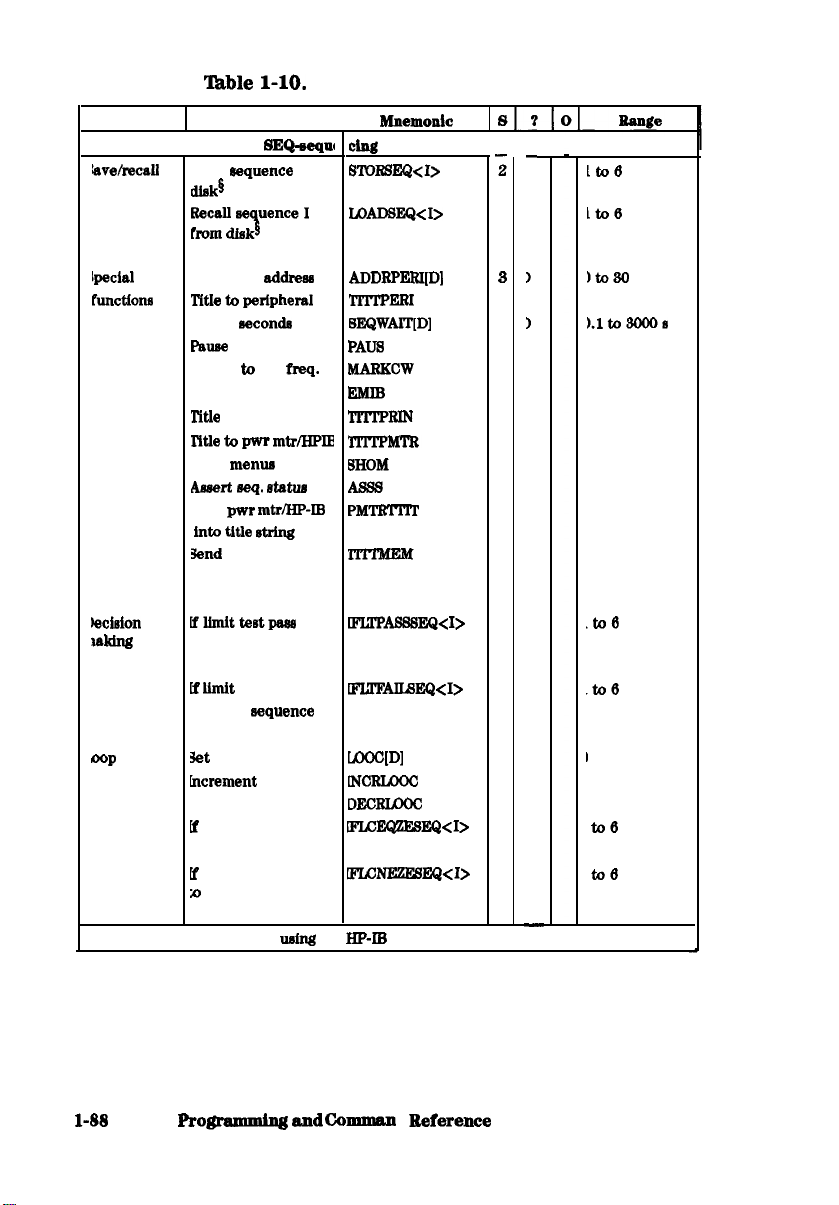
Function Action
Store sequence I to
Key Select Codes (continued)
(continued)
sequences
Peripheral
Wait D aecond6
Marker
Emit beep
Show menua
Read
trace memory
then do sequence I
Decrement by 1
CW
to HP-IB printer
pwr
bit
number into
test fail
then do sequence I
value
by 1
counter equals 0
then do sequence
counter not equal
2
1
8
1
1
1
1
1
1
1
1
1
2
2
8
2
2
to 82,760
0 then do sequence
Requires paw control when
HP-IB
the
Ckmmmd
port.
Guide
Page 97

Select Codes (continued)
Function
Set clock
mode
Instrument
mode
Action
Center
Time
set date
Set time
Sampler, attenuator
Spur avoidance
Second
Network analyzer
Ext.
Ext.
Tuned receiver
auto
manual
I
SPAN[D]
INSMTUNR
0
8 D
8 D
8 D
8 D Sthuul~
2
3
8
2
2
2
2
1
1
1
1
1
1
1
Frequency
offset
Value
Select up converter
Select down
converter
frequency or power sweeps, refer to Chapter 12, ‘Preset State and Memory
Allocation,” in the
frequency sweep,
on:
l/time
on:
HP-IB
G&da
l/frequency step.
CW time: 0 to 24 hours. Fbr
and
2
8
D
1
1
1
1
CW time sweep,
d Reference Guide 1-89
Page 98

Key Select Codes (continued)
line
Action
Sampler correction
Frequency
control
View
I
(continued)
2 l,o
2 l,o
8 D
1 D
1 D
1
1 D
1 D
1 D
1
2 l,o
8 D
2 l,o
2 1,0
0
frequency range of
frequency range of
instrument
frequency range of
instrument
power range of
instrument
power range of
power range of
instrument
test
Beeper
offset
Amplitude
Marker to offset
frequency or power
in the HP
llthne step.
log
10
600
For Linear magnitude:
and
refer to Chapter 12, “Preset State and Memory
UseA G&da Fbr
phase:
600 units. Fbr
valuer of
and timnwn
2 1,0
2 1,0
D
8 D
1
CW
time: 0 to 24
step. Fbr CW time sweep, transform
600 degrees. Rx Smith chart and Polar:
600 unltu The scale
d
Guide
Amplitude range#
Page 99

I&y Select Codes (continued)
Function Action Mnemonic 8
edit
Add segment
Edit segment D
Delete segment
Done with edit
Clear list CLEAL
Edit segment
frequency or power sweep+ refer to Chapter 12, ‘Preset State and Memory
sweep,
on:
For log mag:
linear magnitude:
positive. and
value
Marker to
Upper lhnlt
Delta limits
Middle value
Marker
Flat line type
l/time
middle MARlG5DD
600
Fbr phase:
on:
SADD
SDEL
SDON
Fbr CW
l/frequency
600 degreea For Smith chart and
600 units. For
values of
For CW
0
D
8
D
1
D
8
D
8
8
D
1
1
0 to 24
600 units. The scale
1
Amplitude range#
Amplitude range#
Amplitude range#
Fbr
Range
18
HP-IB
d Reference
1-91
Page 100

Select Codes (continued)
Action
Time Domain
set
Low
Low
Specify
Window Maxhnum
Normal
Any value
Window
shape
Demodulation
Rata
trace memory
Amplitude
Center
Span
on/off
impulse
menu
I
SETF
Mnemonic
2
1
1
1
1
1
1
1
1
2
1
1
1
2
B
B
B
B
0
dependent
range
frequency or power sweeps, refer to Chapter 12,
Allocation,” in the
sweep,
1-92
Maximum
Wide
Normal
HP-IB
on:
l/frequency step.
Fbr CW time: 0 to 24
CW time sweep,
and Co-
d
State and Memory
frequency
on:
Guide
 Loading...