

Page 1

User Manual
4200-900-01 Rev. K / February 2017
*P4200-900-01K*
4200-900-01K
www.tek.com/keithley
Model 4200-SCS
Semiconductor Characterization System
Page 2

Page 3

Model 4200-SCS
Semiconductor Characterization System
User’s Manual
KTE Interactive Version 9.1SP2
©2000-2017, Keithley Instruments
All rights reserved.
Any unauthorized reproduction, photocopy, or use of the information herein, in whole or in
part, without the prior written approval of Keithley Instruments. is strictly prohibited.
All Keithley Instruments product names are trademarks or registered trademarks of Keithley
Instruments. Other brand names are trademarks or registered trademarks of their respective
holders.
Document Number:
4200-900-01 Rev. K / February 2017
Page 4

Page 5

Safety Precautions
The following safety precautions should be observed before using this product and any associated instrumentation. Although some
instruments and accessories would normally be used with non-hazardous voltages, there are situations where hazardous conditions may
be present.
This product is intended for use by qualified personnel who recognize shock hazards and are familiar with the safety precautions required
to avoid possible injury. Read and follow all installation, operation, and maintenance information carefully before using the product. Refer
to the user documentation for complete product specifications.
If the product is used in a manner not specified, the protection provided by the product warranty may be impaired.
The types of product users are:
Responsible body is the individual or group responsible for the use and maintenance of equipment, for ensuring that the equipment is
operated within its specifications and operating limits, and for ensuring that operators are adequately trained.
Operators use the product for its intended function. They must be trained in electrical safety procedures and proper use of the instrument.
They must be protected from electric shock and contact with hazardous live circuits.
Maintenance personnel perform routine procedures on the product to keep it operating properly, for example, setting the line voltage or
replacing consumable materials. Maintenance procedures are described in the user documentation. The procedures explicitly state if the
operator may perform them. Otherwise, they should be performed only by service personnel.
Service personnel are trained to work on live circuits, perform safe installations, and repair products. Only properly trained service
personnel may perform installation and service procedures.
Keithley Instruments products are designed for use with electrical signals that are rated Measurement Category I and Measurement
Category II, as described in the International Electrotechnical Commission (IEC) Standard IEC 60664. Most measurement, control, and
data I/O signals are Measurement Category I and must not be directly connected to mains voltage or to voltage sources with high transient
over-voltages. Measurement Category II connections require protection for high transient over-voltages often associated with local AC
mains connections. Assume all measurement, control, and data I/O connections are for connection to Category I sources unless otherwise
marked or described in the user documentation.
Exercise extreme caution when a shock hazard is present. Lethal voltage may be present on cable connector jacks or test fixtures. The
American National Standards Institute (ANSI) states that a shock hazard exists when voltage levels greater than 30V RMS, 42.4V peak,
or 60VDC are present. A good safety practice is to expect that hazardous voltage is present in any unknown circuit before measuring.
Operators of this product must be protected from electric shock at all times. The responsible body must ensure that operators
prevented access and/or insulated from every connection point. In some cases, connections must be exposed to potential human contact.
Product operators in these circumstances must be trained to protect themselves from the risk of electric shock. If the circuit is capable of
operating at or above 1000V, no conductive part of the circuit may be exposed.
Do not connect switching cards directly to unlimited power circuits. They are intended to be used with impedance-limited sources. NEVER
connect switching cards directly to AC mains. When connecting sources to switching cards, install protective devices to limit fault current
and voltage to the card.
Before operating an instrument, ensure that the line cord is connected to a properly-grounded power receptacle. Inspect the connecting
cables, test leads, and jumpers for possible wear, cracks, or breaks before each use.
When installing equipment where access to the main power cord is restricted, such as rack mounting, a separate main input power
disconnect device must be provided in close proximity to the equipment and within easy reach of the operator.
For maximum safety, do not touch the product, test cables, or any other instruments while power is applied to the circuit under test.
ALWAYS remove power from the entire test system and discharge any capacitors before: connecting or disconnecting cables or jumpers,
installing or removing switching cards, or making internal changes, such as installing or removing jumpers.
Do not touch any object that could provide a current path to the common side of the circuit under test or power line (earth) ground. Always
make measurements with dry hands while standing on a dry, insulated surface capable of withstanding the voltage being measured.
are
Page 6
The instrument and accessories must be used in accordance with its specifications and operating instructions, or the safety of the
!
equipment may be impaired.
Do not exceed the maximum signal levels of the instruments and accessories, as defined in the specifications and operating information,
and as shown on the instrument or test fixture panels, or switching card.
When fuses are used in a product, replace with the same type and rating for continued protection against fire hazard.
Chassis connections must only be used as shield connections for measuring circuits, NOT as safety earth ground connections.
If you are using a test fixture, keep the lid closed while power is applied to the device under test. Safe operation requires the use of a lid
interlock.
If a screw is present, connect it to safety earth ground using the wire recommended in the user documentation.
The symbol on an instrument means caution, risk of danger. The user should refer to the operating instructions located in the user
documentation in all cases where the symbol is marked on the instrument.
The symbol on an instrument means caution, risk of danger. Use standard safety precautions to avoid personal contact with these
voltages.
The symbol on an instrument shows that the surface may be hot. Avoid personal contact to prevent burns.
The symbol indicates a connection terminal to the equipment frame.
If this symbol is on a product, it indicates that mercury is present in the display lamp. Please note that the lamp must be properly
disposed of according to federal, state, and local laws.
The WARNING heading in the user documentation explains dangers that might result in personal injury or death. Always read the
associated information very carefully before performing the indicated procedure.
The CAUTION heading in the user documentation explains hazards that could damage the instrument. Such damage may invalidate the
warranty.
Instrumentation and accessories shall not be connected to humans.
Before performing any maintenance, disconnect the line cord and all test cables.
To maintain protection from electric shock and fire, replacement components in mains circuits - including the power transformer, test leads,
and input jacks - must be purchased from Keithley Instruments. Standard fuses with applicable national safety approvals may be used if
the rating and type are the same. Other components that are not safety-related may be purchased from other suppliers as long as they
are equivalent to the original component (note that selected parts should be purchased only through Keithley Instruments to ma
accuracy and functionality of the product). If you are unsure about the applicability of a replacement component, call a Keithley Instruments
office for information.
To clean an instrument, use a damp cloth or mild, water-based cleaner. Clean the exterior of the instrument only. Do not apply cleaner
directly to the instrument or allow liquids to enter or spill on the instrument. Products that consist of a circuit board with no case or chassis
(e.g., a data acquisition board for installation into a computer) should never require cleaning if handled according to instructions. If the
board becomes contaminated and operation is affected, the board should be returned to the factory for proper cleaning/servicing.
intain
Page 7

Model 4200-SCS User’s Manual Table of Contents
Table of Contents
Section Topic Page
1 Getting Started............................................................................................ 1-1
Installation and system connections ............................................................... 1-3
Unpacking the Model 4200-SCS .............................................................. 1-3
Shipment contents.................................................................................... 1-3
Environmental considerations................................................................... 1-4
Powering up the 4200-SCS ...................................................................... 1-5
System connections.................................................................................. 1-6
Model 4200-SCS Hardware Overview .......................................................... 1-10
DC source-measure unit (SMU) ............................................................. 1-10
DC preamp ............................................................................................. 1-14
Multi-frequency capacitance / voltage unit (CVU) ......................................... 1-16
Model 4210-CVU card ............................................................................ 1-16
Force-measure timing............................................................................. 1-20
Pulse cards ................................................................................................... 1-20
About the pulse cards............................................................................. 1-21
Firmware upgrade for the 4200-PG2...................................................... 1-22
Standard pulse........................................................................................ 1-22
Segment ARB waveform ........................................................................ 1-23
Remote bias tee (RBT) and 3-port power divider ................................... 1-26
SCP2 (Oscilloscope)............................................................................... 1-28
Ground unit (GNDU) ............................................................................... 1-32
Basic circuit configurations ..................................................................... 1-32
Ground unit terminals and connectors.................................................... 1-34
Connecting DUTs .......................................................................................... 1-36
Test fixtures............................................................................................. 1-36
Probers ................................................................................................... 1-37
Advanced connections............................................................................ 1-37
How to run a basic test.................................................................................. 1-38
Boot the system and log in ..................................................................... 1-38
Open KITE.............................................................................................. 1-38
Locate and run the vds-id test module.................................................... 1-40
Test definition.......................................................................................... 1-41
Run vds-id test........................................................................................ 1-42
View and save the sheet data................................................................. 1-42
View and save the graph data ................................................................1-43
Firmware upgrade ......................................................................................... 1-45
Accessing the release notes ......................................................................... 1-46
2 Model 4200-SCS Software Environment .............................................. 2-1
Understanding KITE ........................................................................................ 2-3
KITE project structure ..................................................................................... 2-3
KITE interface........................................................................................... 2-3
Project navigator....................................................................................... 2-5
Project defined.......................................................................................... 2-7
Project components.................................................................................. 2-7
ITMs versus UTMs .......................................................................................... 2-8
Defining an ITM ........................................................................................ 2-9
Defining a UTM....................................................................................... 2-10
Using the UTM GUI view ........................................................................ 2-11
How to create your own ITMs ....................................................................... 2-13
Understanding the ITM definition tab...................................................... 2-13
Understanding the ITM forcing functions................................................ 2-13
Understanding dual sweep ..................................................................... 2-15
Understanding pulse mode ..................................................................... 2-16
How to use the definition tab to configure ITM parameters .................... 2-17
Basic test execution ...................................................................................... 2-21
4200-900-01 Rev. K / February 2017 i
Page 8

Table of Contents Model 4200-SCS User’s Manual
Project navigator check boxes................................................................2-21
Executing an individual test .................................................................... 2-23
How to display and manage test results ....................................................... 2-24
Data file management............................................................................. 2-24
How to manage numeric test results in Sheet tab .................................. 2-32
How to manage graphical test results in the Graph tab.......................... 2-38
KITE library management ............................................................................. 2-45
Submitting devices, ITMs, and UTMs to libraries ................................... 2-45
Submitting tests to a library .................................................................... 2-48
3 Common Device Characterization Tests.............................................. 3-1
How to perform an I-V test on my device ........................................................ 3-4
Default project overview ........................................................................... 3-4
How to perform a C-V test on my device ...................................................... 3-13
KITE ITM configuration........................................................................... 3-13
Definition tab........................................................................................... 3-13
Forcing functions and measure options.................................................. 3-16
Selecting the forcing function ................................................................. 3-16
CVU ITM examples ................................................................................ 3-21
CVU Voltage Sweep ............................................................................... 3-22
CVU Voltage List Sweep......................................................................... 3-23
CVU Frequency Sweep (bias) ................................................................3-24
CVU Frequency Sweep (step)................................................................3-26
How to perform a Pulsed I-V test on my device............................................ 3-27
Introduction (PIV-A and PIV-Q)............................................................... 3-27
Pulse IV for CMOS: 4200-PIV-A............................................................. 3-29
4200-PIV-A test connections .................................................................. 3-30
Using the PulseIV-Complete project for the first time ............................. 3-38
Pulse IV UTM descriptions ..................................................................... 3-49
cal_pulseiv.............................................................................................. 3-50
vdsid_pulseiv .......................................................................................... 3-51
VdId_Pulse_DC_Family_pulseiv ............................................................ 3-53
vgsid_pulseiv .......................................................................................... 3-57
VgId_DC_Pulse_pulseiv......................................................................... 3-59
scopeshot_cal_pulseiv ........................................................................... 3-63
scopeshot_pulseiv .................................................................................. 3-64
vdsid_pulseiv_demo ............................................................................... 3-66
vgsid_pulseiv_demo ............................................................................... 3-66
scopeshot_pulseiv_demo ....................................................................... 3-66
How to perform a Quiescent-point Pulsed I-V test (PIV-Q) on my device..... 3-66
Q-Point Pulse IV – Model 4200-PIV-Q ................................................... 3-66
What is the PIV-Q package..................................................................... 3-67
How to perform reliability (stress-measure) tests on my device.................... 3-68
Connecting devices for stress / measure cycling.................................... 3-68
Overview of the cycling-related tabs....................................................... 3-69
Configuring subsite cycling
Configuring device stress properties ...................................................... 3-74
How to perform AC stress for wafer level reliability (WLR) ........................... 3-78
Segment Stress / Measure Mode ........................................................... 3-85
Segment ARB stressing ......................................................................... 3-86
Segment Stress / Measure Mode configuration...................................... 3-87
Executing subsite cycling ....................................................................... 3-91
Subsite cycling data sheets .................................................................... 3-91
Subsite cycling graphs............................................................................ 3-96
Configuration sequence for subsite cycling ............................................ 3-98
How to perform a flash memory test on my device..................................... 3-100
Introduction........................................................................................... 3-100
Theory of operation .............................................................................. 3-100
Flash connections................................................................................. 3-115
Direct connection to single DUT ........................................................... 3-120
Direct connection to array DUT for disturb testing................................ 3-121
Switch matrix connection to array DUT ................................................ 3-122
Memory projects ................................................................................... 3-124
NVM_examples .................................................................................... 3-126
Flash-NAND tests ................................................................................. 3-126
..................................................................... 3-69
ii 4200-900-01 Rev. K / February 2017
Page 9

Model 4200-SCS User’s Manual Table of Contents
Flash-NOR tests ................................................................................... 3-130
Flash-switch tests ................................................................................. 3-130
Running any Flash Project for the first time.......................................... 3-133
Running the Flash-NAND, Flash-NOR or Flash-Switch Project ........... 3-133
Running the Program or Erase UTM .................................................... 3-134
Running the Fast-Program-Erase UTM................................................ 3-136
Running the SetupDC UTM .................................................................. 3-137
Running the Vt-MaxGm ITM ................................................................. 3-137
Running the ConPin-Pulse or ConPin-DC UTM (Switch projects only) 3-138
FlashEndurance-NAND tests................................................................3-139
Running a FlashEndurance or FlashDisturb project ............................. 3-146
Running endurance or disturb looping.................................................. 3-148
FlashDisturb tests ................................................................................. 3-149
Explanation of flash UTM parameters .................................................. 3-151
Error codes ........................................................................................... 3-153
Troubleshooting.................................................................................... 3-154
How to perform Charge Pumping................................................................3-155
How to perform a Charge Trapping test...................................................... 3-156
Slow single pulse charge trapping high K gate stack ........................... 3-156
Charge trapping procedure................................................................... 3-157
4 How to Control Other Instruments with the Model 4200-SCS......... 4-1
How to control external equipment.................................................................. 4-2
Controlling external equipment overview.................................................. 4-2
Keithley Configuration Utility (KCON) ............................................................. 4-5
How to control a switch matrix ........................................................................ 4-7
KCON setup.............................................................................................. 4-9
Open KITE and the ivswitch project........................................................ 4-11
Running test sequences ......................................................................... 4-12
The connect test ..................................................................................... 4-14
How to control a probe station ...................................................................... 4-15
Prober control overview.......................................................................... 4-16
Test system connections......................................................................... 4-18
KCON setup............................................................................................ 4-19
Probe station configuration ..................................................................... 4-21
Open the probesubsites project.............................................................. 4-21
Open the project plan window ................................................................4-22
Test descriptions..................................................................................... 4-22
Running the test sequence ..................................................................... 4-25
Test data ................................................................................................. 4-26
Running individual plans or tests ............................................................ 4-27
How to control an external pulse generator .................................................. 4-27
Test system connections......................................................................... 4-28
KCON setup............................................................................................ 4-28
Open the ivpgswitch project.................................................................... 4-31
Description of tests ................................................................................. 4-32
First id-vg test ......................................................................................... 4-32
pgu-trigger test........................................................................................ 4-34
Compare the test results......................................................................... 4-35
How to control an external CV analyzer........................................................ 4-37
Connections............................................................................................ 4-38
KCON setup............................................................................................ 4-38
Create a new project............................................................................... 4-39
Add a subsite plan .................................................................................. 4-40
Add a device plan ................................................................................... 4-41
Add a UTM.............................................................................................. 4-42
Modifying the cvsweep UTM................................................................... 4-43
Executing the test ................................................................................... 4-43
What if my equipment is not listed in KCON ................................................. 4-44
5 How to Generate Basic Pulses ............................................................... 5-1
KPulse: Getting started............................................................................. 5-2
Triggering .................................................................................................. 5-3
Standard pulse waveforms ....................................................................... 5-4
Segment ARB waveforms......................................................................... 5-6
4200-900-01 Rev. K / February 2017 iii
Page 10

Table of Contents Model 4200-SCS User’s Manual
Custom file arb waveforms (full-arb)......................................................... 5-8
Index .............................................................................................................................. I-1
iv 4200-900-01 Rev. K / February 2017
Page 11

Model 4200-SCS User’s Manual Section 1: Getting Started
Section 1
Getting Started
In this section:
Topic Page
Installation and system connections . . . . . . . . . . . . . . . . 1-3
Unpacking the Model 4200-SCS . . . . . . . . . . . . . . . . . . . . . . . . .1-3
Inspection for damage . . . . . . . . . . . . . . . . . . . . . . . . . . . . . . .1-3
Shipment contents . . . . . . . . . . . . . . . . . . . . . . . . . . . . . . . . . . . .1-3
Manuals . . . . . . . . . . . . . . . . . . . . . . . . . . . . . . . . . . . . . . . . . . .1-3
Repacking for shipment . . . . . . . . . . . . . . . . . . . . . . . . . . . . . .1-3
Environmental considerations . . . . . . . . . . . . . . . . . . . . . . . . . .1-4
Shipping and storage environment . . . . . . . . . . . . . . . . . . . .1-4
Operating environment . . . . . . . . . . . . . . . . . . . . . . . . . . . . . .1-4
Powering up the 4200-SCS . . . . . . . . . . . . . . . . . . . . . . . . . . . . .1-5
Line power . . . . . . . . . . . . . . . . . . . . . . . . . . . . . . . . . . . . . . . . .1-5
Line power connection . . . . . . . . . . . . . . . . . . . . . . . . . . . . . . .1-6
Line frequency setting . . . . . . . . . . . . . . . . . . . . . . . . . . . . . . .1-6
Warm-up period . . . . . . . . . . . . . . . . . . . . . . . . . . . . . . . . . . . .1-7
System connections . . . . . . . . . . . . . . . . . . . . . . . . . . . . . . . . . .1-7
Connecting the keyboard and mouse . . . . . . . . . . . . . . . . . . .1-7
Connecting GPIB instruments . . . . . . . . . . . . . . . . . . . . . . . . .1-8
Connecting a probe station . . . . . . . . . . . . . . . . . . . . . . . . . . .1-9
Connecting a printer . . . . . . . . . . . . . . . . . . . . . . . . . . . . . . . . .1-10
Connecting a LAN . . . . . . . . . . . . . . . . . . . . . . . . . . . . . . . . . . .1-10
Model 4200-SCS Hardware Overview . . . . . . . . . . . . . . . . 1-11
DC source-measure unit (SMU) . . . . . . . . . . . . . . . . . . . . . . . . .1-13
Models 4200-SMU and 4210-SMU overview . . . . . . . . . . . . . .1-13
Basic characteristics . . . . . . . . . . . . . . . . . . . . . . . . . . . . . . . .1-13
Basic SMU circuit configuration . . . . . . . . . . . . . . . . . . . . . . .1-14
SMU terminals and connectors . . . . . . . . . . . . . . . . . . . . . . . .1-16
SMU with Model 4200-PA overview . . . . . . . . . . . . . . . . . . . . .1-17
Basic characteristics . . . . . . . . . . . . . . . . . . . . . . . . . . . . . . . .1-17
Basic SMU/preamp circuit configuration . . . . . . . . . . . . . . . .1-18
DC preamp . . . . . . . . . . . . . . . . . . . . . . . . . . . . . . . . . . . . . . . . . .1-19
PreAmp terminals and connectors . . . . . . . . . . . . . . . . . . . . .1-19
FORCE terminal . . . . . . . . . . . . . . . . . . . . . . . . . . . . . . . . . . . .1-20
SENSE terminal . . . . . . . . . . . . . . . . . . . . . . . . . . . . . . . . . . . . .1-21
PreAmp CONTROL connector . . . . . . . . . . . . . . . . . . . . . . . . .1-21
Multi-frequency capacitance / voltage unit (CVU) . . . . . . . 1-21
Model 4210-CVU card . . . . . . . . . . . . . . . . . . . . . . . . . . . . . . . . . .1-21
Measurement overview . . . . . . . . . . . . . . . . . . . . . . . . . . . . . .1-21
Measurement functions . . . . . . . . . . . . . . . . . . . . . . . . . . . . . .1-22
Test signal . . . . . . . . . . . . . . . . . . . . . . . . . . . . . . . . . . . . . . . . .1-23
DC bias function and sweep characteristics . . . . . . . . . . . . .1-23
Force-measure timing . . . . . . . . . . . . . . . . . . . . . . . . . . . . . . . . .1-24
Bias function . . . . . . . . . . . . . . . . . . . . . . . . . . . . . . . . . . . . . . .1-24
Sweep function . . . . . . . . . . . . . . . . . . . . . . . . . . . . . . . . . . . . .1-25
Pulse cards . . . . . . . . . . . . . . . . . . . . . . . . . . . . . . . . . . . . . . 1-25
About the pulse cards . . . . . . . . . . . . . . . . . . . . . . . . . . . . . . . . .1-26
Firmware upgrade for the Model 4200-PG2 . . . . . . . . . . . . . . . .1-27
4200-900-01 Rev. K / February 2017 Return to Section Topics 1-1
Page 12

Section 1: Getting Started Model 4200-SCS User’s Manual
Standard pulse . . . . . . . . . . . . . . . . . . . . . . . . . . . . . . . . . . . . . . 1-27
Segment ARB waveform . . . . . . . . . . . . . . . . . . . . . . . . . . . . . . 1-27
Full arb . . . . . . . . . . . . . . . . . . . . . . . . . . . . . . . . . . . . . . . . . . . 1-29
Pulse card settings . . . . . . . . . . . . . . . . . . . . . . . . . . . . . . . . . 1-30
Remote bias tee (RBT) and 3-port power divider . . . . . . . . . . 1-30
RBT . . . . . . . . . . . . . . . . . . . . . . . . . . . . . . . . . . . . . . . . . . . . . . 1-30
3-port power divider . . . . . . . . . . . . . . . . . . . . . . . . . . . . . . . . 1-31
Using an RBT and power divider . . . . . . . . . . . . . . . . . . . . . . 1-31
SCP2 (Oscilloscope) . . . . . . . . . . . . . . . . . . . . . . . . . . . . . . . . . . 1-32
Digital storage oscilloscope card . . . . . . . . . . . . . . . . . . . . . 1-32
Scope card settings . . . . . . . . . . . . . . . . . . . . . . . . . . . . . . . . 1-33
Ground unit (GNDU) . . . . . . . . . . . . . . . . . . . . . . . . . . . . . . . . . . 1-36
Basic characteristics . . . . . . . . . . . . . . . . . . . . . . . . . . . . . . . 1-36
Basic circuit configurations . . . . . . . . . . . . . . . . . . . . . . . . . . . 1-37
Ground unit connections . . . . . . . . . . . . . . . . . . . . . . . . . . . . 1-37
Ground unit DUT connections . . . . . . . . . . . . . . . . . . . . . . . . 1-38
Ground unit terminals and connectors . . . . . . . . . . . . . . . . . . 1-39
FORCE terminal . . . . . . . . . . . . . . . . . . . . . . . . . . . . . . . . . . . . 1-39
SENSE terminal . . . . . . . . . . . . . . . . . . . . . . . . . . . . . . . . . . . . 1-39
COMMON terminal . . . . . . . . . . . . . . . . . . . . . . . . . . . . . . . . . 1-40
Chassis ground . . . . . . . . . . . . . . . . . . . . . . . . . . . . . . . . . . . . 1-40
Connecting DUTs . . . . . . . . . . . . . . . . . . . . . . . . . . . . . . . . . 1-40
Test fixtures . . . . . . . . . . . . . . . . . . . . . . . . . . . . . . . . . . . . . . . . . 1-40
Testing with less than ±20 V . . . . . . . . . . . . . . . . . . . . . . . . . . 1-41
Testing with more than ±20 V . . . . . . . . . . . . . . . . . . . . . . . . . 1-41
Probers . . . . . . . . . . . . . . . . . . . . . . . . . . . . . . . . . . . . . . . . . . . . 1-42
Advanced connections . . . . . . . . . . . . . . . . . . . . . . . . . . . . . . . 1-42
How to run a basic test . . . . . . . . . . . . . . . . . . . . . . . . . . . .1-42
Boot the system and log in . . . . . . . . . . . . . . . . . . . . . . . . . . . . 1-42
Open KITE . . . . . . . . . . . . . . . . . . . . . . . . . . . . . . . . . . . . . . . . . . 1-43
Locate and run the vds-id test module . . . . . . . . . . . . . . . . . . . 1-44
Test definition . . . . . . . . . . . . . . . . . . . . . . . . . . . . . . . . . . . . . . . 1-45
Run vds-id test . . . . . . . . . . . . . . . . . . . . . . . . . . . . . . . . . . . . . . 1-46
View and save the sheet data . . . . . . . . . . . . . . . . . . . . . . . . . . 1-46
View and save the graph data . . . . . . . . . . . . . . . . . . . . . . . . . . 1-47
Firmware upgrade . . . . . . . . . . . . . . . . . . . . . . . . . . . . . . . . . 1-49
Accessing the release notes . . . . . . . . . . . . . . . . . . . . . . . . 1-50
1-2 Return to Section Topics 4200-900-01 Rev. K / February 2017
Page 13

Model 4200-SCS User’s Manual Section 1: Getting Started
Section 1
Getting Started
Installation and system connections
Unpacking the Model 4200-SCS
Inspection for damage
After unpacking the Keithley Instruments Model 4200 Semiconductor Characterization System
(SCS), carefully inspect the unit for any shipping damage. Report any damage to the shipping
agent, because such damage is not covered by the warranty.
Shipment contents
The following items are included with the 4200-SCS:
• 4200-SCS with any ordered source-measure units (SMUs) factory-installed.
• Ordered 4200-PA modules factory-installed.
• Ordered 4220-PGU pulse generator cards factory-installed.
• Ordered 4225-PMU pulse/measure cards factory-installed.
• Ordered 4225-RPM remote pulse (and switch) modules.
• Ordered pulse application packages.
• Cables, connectors, adapters and other accessories that are supplied with the pulse
generator, scope, and pulse application packages.
• Line cord.
• Miniature triaxial cables, two per 4200-SMU or 4210-SMU, 2 m (6 ft). These are not
included when the SMU is ordered with with a 4200-PA.
• Triaxial cables, two per 4200-PA, 2 m (6 ft).
• Interlock cable.
• Keyboard with integrated pointing device.
• System software and manuals on CD-ROM.
•Microsoft
• Ordered 4200-Compiler factory-installed.
®
Windows®.
Manuals
All 4200 manuals are provided on a CD-ROM and are preinstalled on the hard drive. Because the
manuals are provided in PDF format, they can be printed from any computer that is connected to a
printer by using Adobe
®
Reader®.
Repacking for shipment
Should it become necessary to return the 4200-SCS for repair, carefully pack the entire unit in its
original packing carton or the equivalent, and follow these instructions:
• Call Keithley Instruments’ repair department at 1-800-935-5595 for a Return Material
Authorization (RMA) number.
• Let the repair department know the warranty status of the 4200-SCS.
• Write ATTENTION REPAIR DEPARTMENT and the RMA number on the shipping label.
4200-900-01 Rev. K / February 2017 Return to Section Topics 1-3
Page 14

Section 1: Getting Started Model 4200-SCS User’s Manual
Environmental considerations
Shipping and storage environment
To avoid possible damage or deterioration, the 4200-SCS should be shipped and stored within the
following environmental limits:
• Temperature: -10 °C to +60 °C
• Relative humidity: 5 % to 90 %, non-condensing
Operating environment
Temperature and humidity
The 4200-SCS should be operated within the following environmental limits:
• Temperature: +15 °C to +40 °C
• Relative humidity: 5 % to 80 %, non-condensing
NOTE SMU and preamp accuracy specifications are based on operation at 23 °C ±5 °C and
between 5 % and 60 % relative humidity. See the product specifications for additional
temperature and humidity derating factors outside these ranges.
Proper ventilation
To avoid overheating, the 4200-SCS should be operated in an area with proper ventilation. Allow
at least eight inches of clearance at the back of the mainframe to assure sufficient airflow.
CAUTION To prevent damaging temperatures and other harmful environmental
conditions that could degrade specified performance, follow these
precautions:
• Keep the venting holes and fan free of dust, dirt, and contaminants, so that
the unit’s ability to dissipate heat is not impaired.
• Keep the fan vents and cooling vents from becoming blocked.
• Do not position any devices that force air (heated or unheated) adjacent to
the unit into cooling vents. This additional airflow could compromise
accuracy performance.
• When rack mounting the unit, make sure there is adequate airflow around
the sides, bottom, and back to ensure proper cooling.
• Rack mounting high-power dissipation equipment adjacent to the Model
4200-SCS could cause excessive heating to occur.
• To ensure proper cooling in rack situations with convection cooling only,
place the hottest equipment (the, power supply) at the top of the rack.
Precision equipment, such as the 4200-SCS, should be placed as low as
possible in the rack where temperatures are the coolest.
• Add spacer panels below the unit will help ensure adequate airflow.
1-4 Return to Section Topics 4200-900-01 Rev. K / February 2017
Page 15

Model 4200-SCS User’s Manual Section 1: Getting Started
CAUTION A large system (for example, multiple SMUs, multiple pulse generators,
and a scope) draws more power than a small system, causing the internal
power supply to generate more heat. Because of this, it is imperative that
systems of any size have proper ventilation. Even a small system with
inadequate ventilation can be damaged by excess heat.
Cleanliness
To avoid internal dirt buildup that could degrade performance and affect longevity, the
4200-SCS should be operated in a clean, dust-free environment.
Powering up the 4200-SCS
The following information covers power requirements for the 4200-SCS power connections,
power-up characteristics, and warm-up requirements.
Line power
The 4200-SCS operates from a line voltage in the range of 100 V to 240 V at a frequency of 50 Hz
or 60 Hz. Line voltage is automatically sensed, but line frequency is not (For more information see
the Reference Manual, Line frequency setting, page 2-16. Check to ensure the operating voltage
in your area is compatible.
CAUTION Operating the instrument on an incorrect line voltage may cause damage,
possibly voiding the warranty.
NOTE To avoid possible problems caused by electrical transients or line voltage
fluctuations, the 4200-SCS should be operated from a dedicated power source.
Line power connection
To connect the unit to line power and turn it on:
1. Before plugging in the power cord, make sure the front panel power switch is in the off
position.
2. Connect the female end of the supplied power cord to the AC receptacle on the rear panel
(see Figure 1-1).
WARNING The large diameter line cord (supplied) must be used to power the 4200-SCS.
Do not use a different line cord. Using a different line cord may result in
personal injury or death due to electric shock.
3. Connect the other end of the supplied line cord to a grounded AC line power receptacle.
4200-900-01 Rev. K / February 2017 Return to Section Topics 1-5
Page 16

Section 1: Getting Started Model 4200-SCS User’s Manual
Power
Receptacle
Line
Fuses
(2)
WARNING The power cord supplied with the unit contains a separate grou nd for use with
grounded outlets. When proper connections are made, the in strument chassis
is connected to power line ground through the ground wire in the power c ord.
Failure to use a grounded outlet may result in personal injury or death due to
electric shock.
Figure 1-1
Line power receptacle and line fuses location
Line frequency setting
The 4200-SCS can be operated either from 50 Hz or 60 Hz power line sources, but it does not
automatically sense the power line frequency when it is powered up. You can change the line
frequency setting using the KCON utility. See the Reference Manual, Keithley CONfiguration Utility
(KCON), page 7-1 for details.
NOTE Operating the 4200-SCS with the wrong line frequency setting may result in noisy
readings because the line frequency setting affects SMU line freque ncy noise
rejection.
Warm-up period
The 4200-SCS can be used immediately after being turned on. However, the unit should be
allowed to warm up for at least 30 minutes to achieve rated measurement accuracy.
System connections
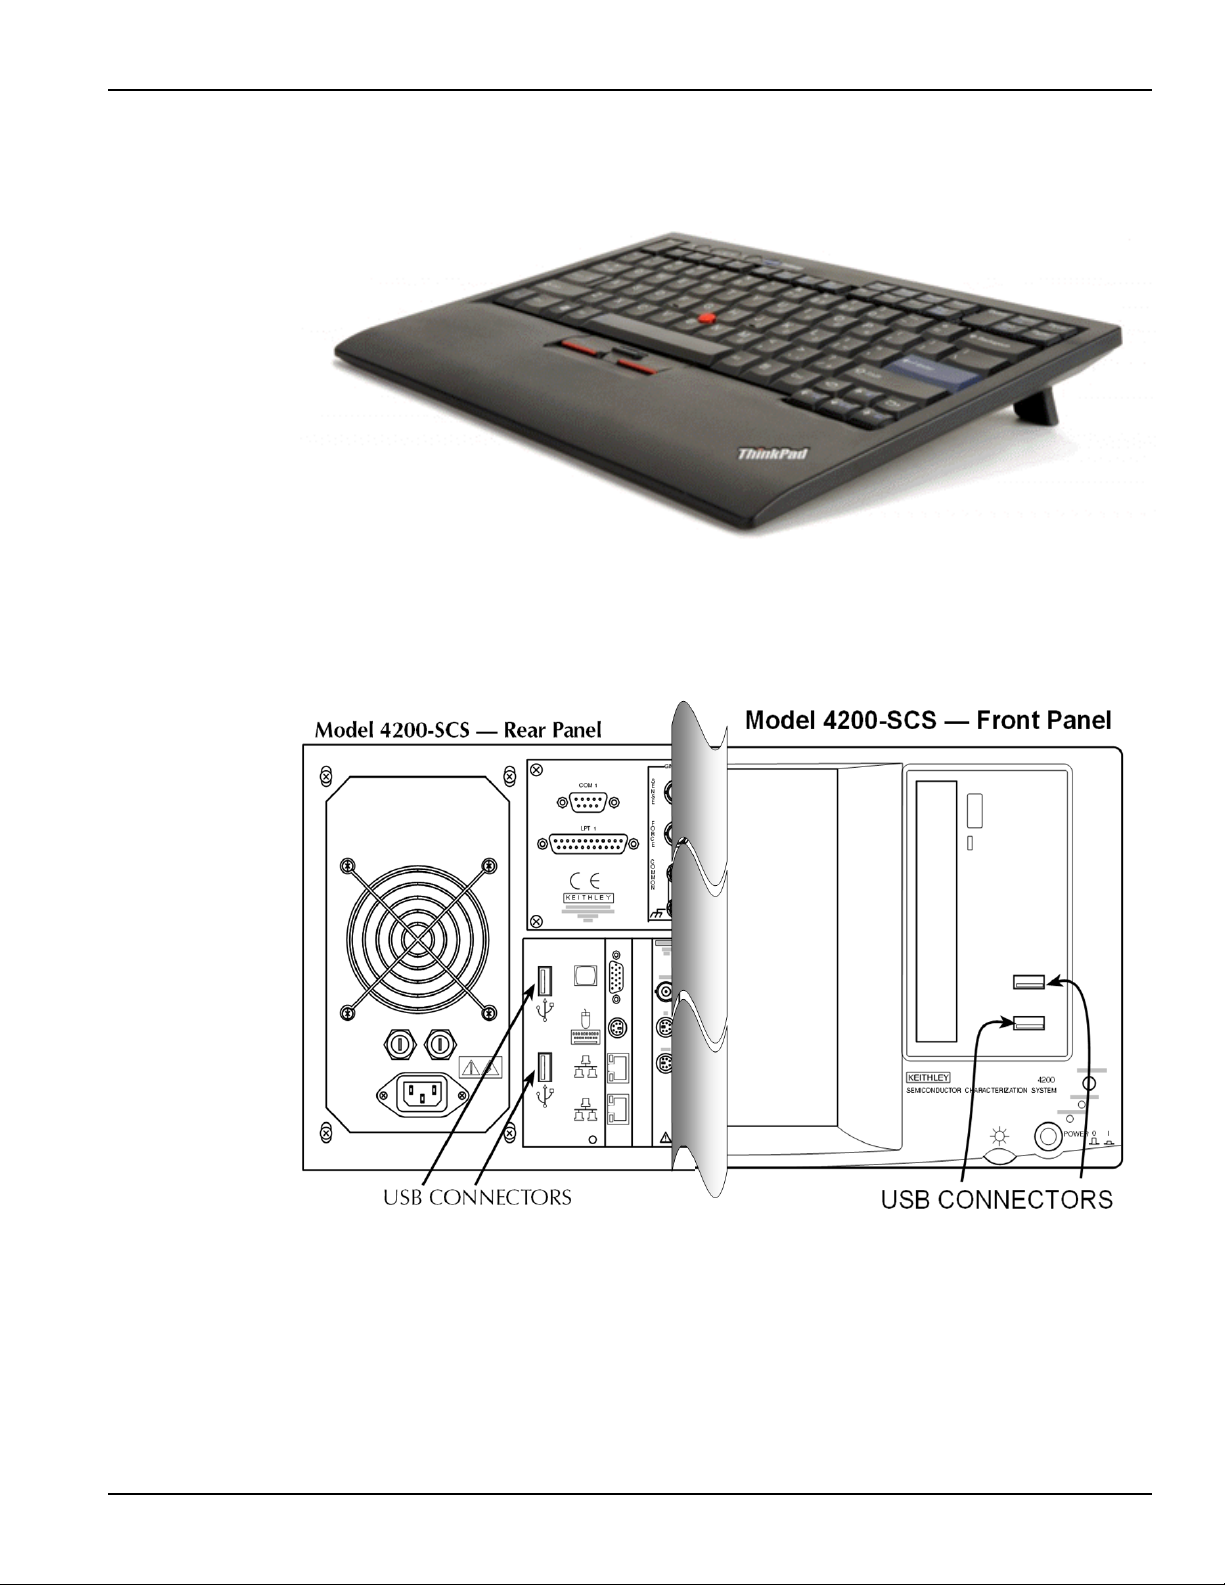
Connecting the keyboard and mouse
The keyboard is connected to the 4200-SCS with a USB, and can be plugged into any of the four
USB ports (two in front and two in back; see Figure 1-3). The keyboard is shown in
Figure 1-2. To ensure proper operation, make sure the keyboard is connected to one of the four
USB ports prior to power up. Figure 1-3 shows the keyboard connections to the rear panel of the
4200-SCS.
1-6 Return to Section Topics 4200-900-01 Rev. K / February 2017
Page 17
Model 4200-SCS User’s Manual Section 1: Getting Started
Figure 1-2
Model 4200-SCS keyboard
To use an optional mouse, connect a USB mouse into any of the four 4200-SCS USB ports.
Figure 1-3
Keyboard connections
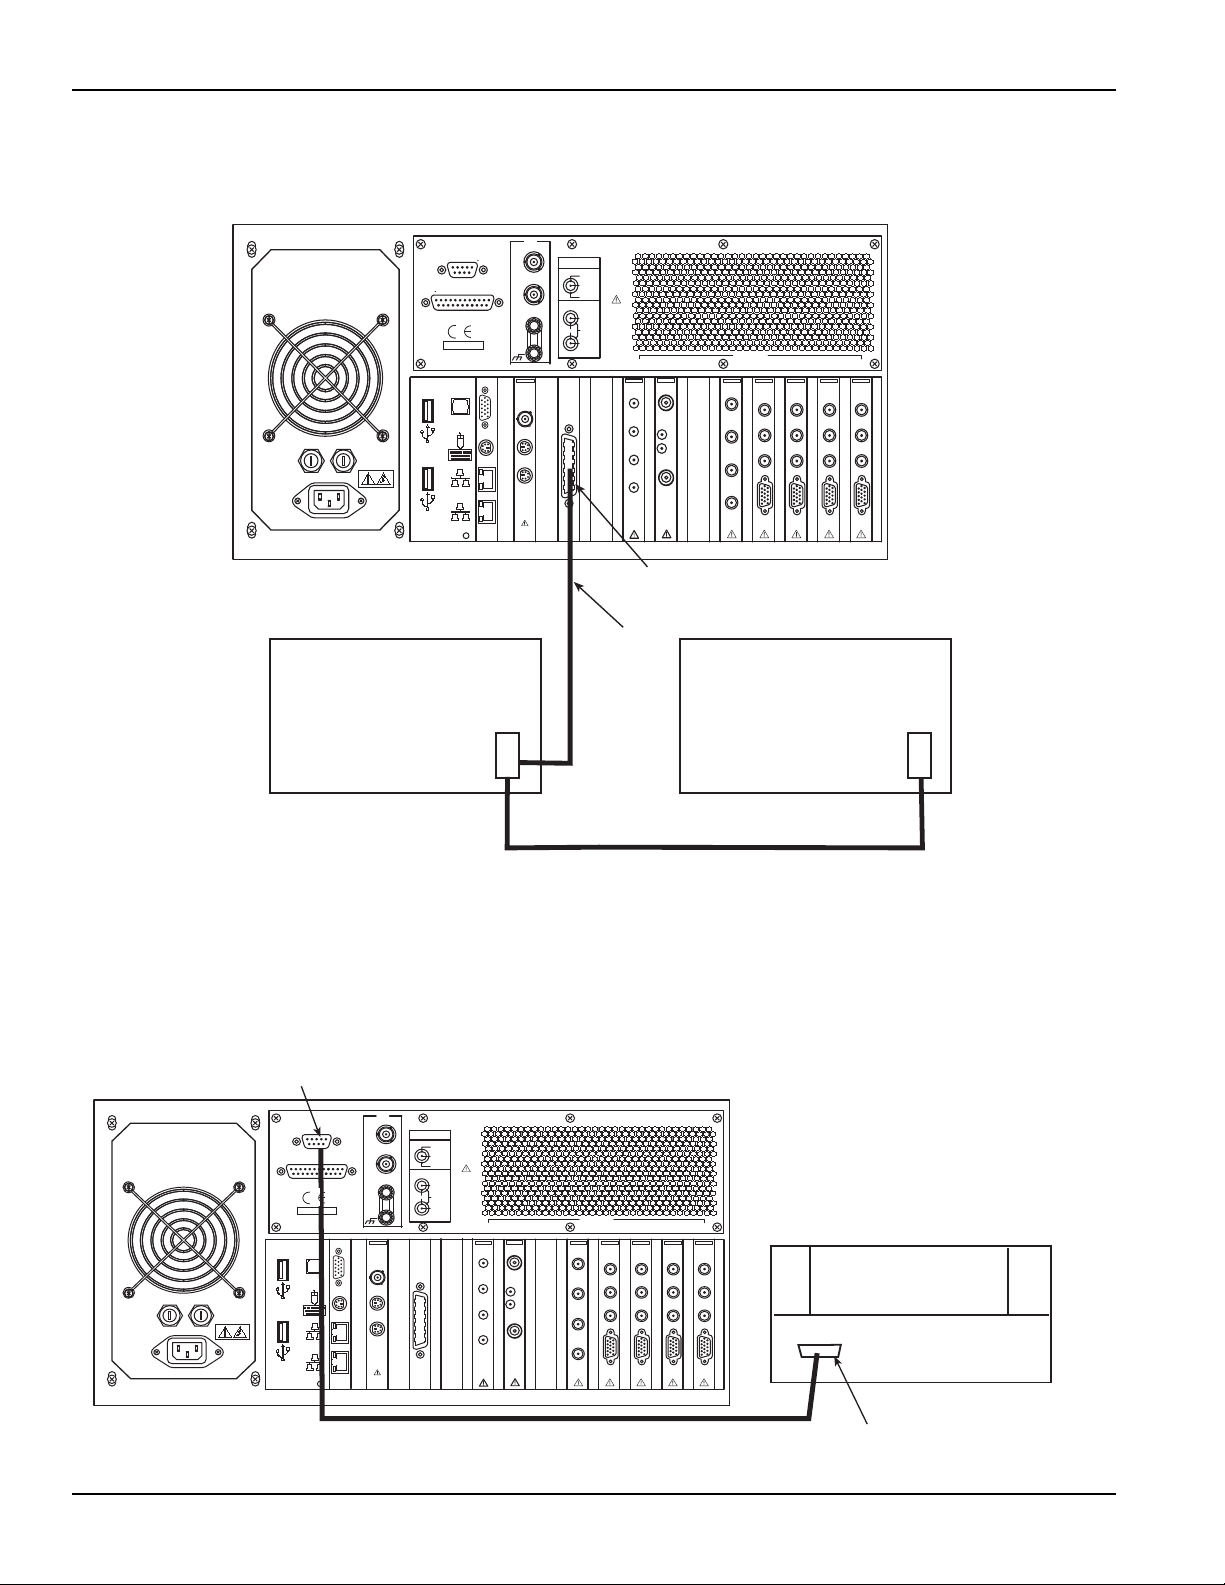
Connecting GPIB instruments
The 4200-SCS can control one or more external instruments by way of the IEEE-488 General
Purpose Instrument Bus (GPIB). Instruments typically used in a test system with the 4200-SCS
include a switch matrix and a C-V meter. Figure 1-4 shows how to connect GPIB instruments to
the 4200-SCS.
4200-900-01 Rev. K / February 2017 Return to Section Topics 1-7
Page 18
Section 1: Getting Started Model 4200-SCS User’s Manual
GPIB Connector
GPIB Instrument GPIB Instrument
7007
GPIB Cable
7007 GPIB Cable
Model 4200-SCS
INSTRUMENT
CONNECTIONS
SMU ONLY
SMU AND GNDU
GNDU
COM 1
LPT 1
S
E
N
S
E
F
O
R
C
E
C
O
M
M
O
N
SENSE LO
GUARD
SENSE LO
COMMON
COMMON
FORCE
SENSE
GUARD
SMU
SENSE LO
SENSE
FORCE
PA CNTRL
SMU
SENSE LO
SENSE
FORCE
PA CNTRL
SMU
SENSE LO
SENSE
FORCE
PA CNTRL
SMU
SENSE LO
SENSE
FORCE
PA CNTRL
4200
TM
INTLK
IN
OUT
KEITHLEY
Channel 2
Channel 1
Trigger
Out
Channel 1
Channel 2
Ext
Trg
Ext
Clk
PG2
SCP2HR
Trigger
In
CVU
HCUR
LPOT
HPOT
LCUR
KEITHLEY
INSTRUMENTS
SLOT8SLOT7SLOT6SLOT5SLOT4SLOT3SLOT2SLOT
1
4200
KEITHLEY
4200
KEITHLEY
4210
KEITHLEY
4210
KEITHLEY
KEITHLEY
KEITHLEY
4205
4200
4200
KEITHLEY
28775 AURORA RD.
CLEVELAND, OH 44139
MADE IN
USA
Probe Station
Shielded Serial Cable
RS-232 Connector
RS-232 Connector
INSTRUMENT
CONNECTIONS
SMU ONLY
SMU AND GNDU
GNDU
COM 1
LPT 1
S
E
N
S
E
F
O
R
C
E
C
O
M
M
O
N
SENSE LO
GUARD
SENSE LO
COMMON
COMMON
FORCE
SENSE
GUARD
SMU
SENSE LO
SENSE
FORCE
PA CNTRL
SMU
SENSE LO
SENSE
FORCE
PA CNTRL
SMU
SENSE LO
SENSE
FORCE
PA CNTRL
SMU
SENSE LO
SENSE
FORCE
PA CNTRL
4200
TM
INTLK
IN
OUT
KEITHLEY
Channel 2
Channel 1
Trigger
Out
Channel 1
Channel 2
Ext
Trg
Ext
Clk
PG2
SCP2HR
Trigger
In
CVU
HCUR
LPOT
HPOT
LCUR
KEITHLEY
INSTRUMENTS
SLOT8SLOT7SLOT6SLOT5SLOT4SLOT3SLOT2SLOT
1
4200
KEITHLEY
4200
KEITHLEY
4210
KEITHLEY
4210
KEITHLEY
KEITHLEY
KEITHLEY
4205
4200
4200
KEITHLEY
28775 AURORA RD.
CLEVELAND, OH 44139
MADE IN
USA
Model 4200-SCS
Figure 1-4
GPIB instrument connections
Connecting a probe station
A probe station can be controlled through the RS-232 interface connected to the 4200-SCS, as
shown in Figure 1-5.
Figure 1-5
Probe station connections
1-8 Return to Section Topics 4200-900-01 Rev. K / February 2017
Page 19
Model 4200-SCS User’s Manual Section 1: Getting Started
LAN Junction
Box or Hub
CAT 5 UTP Cable
LAN Connectors
Model 4200-SCS
INSTRUMENT
CONNECTIONS
SMU ONLY
SMU AND GNDU
GNDU
COM 1
LPT 1
S
E
N
S
E
F
O
R
C
E
C
O
M
M
O
N
SENSE LO
GUARD
SENSE LO
COMMON
COMMON
FORCE
SENSE
GUARD
SMU
SENSE LO
SENSE
FORCE
PA CNTRL
SMU
SENSE LO
SENSE
FORCE
PA CNTRL
SMU
SENSE LO
SENSE
FORCE
PA CNTRL
SMU
SENSE LO
SENSE
FORCE
PA CNTRL
4200
TM
INTLK
IN
OUT
KEITHLEY
Channel 2
Channel 1
Trigger
Out
Channel 1
Channel 2
Ext
Trg
Ext
Clk
PG2
SCP2HR
Trigger
In
CVU
HCUR
LPOT
HPOT
LCUR
KEITHLEY
INSTRUMENTS
SLOT8SLOT7SLOT6SLOT5SLOT4SLOT3SLOT2SLOT
1
4200
KEITHLEY
4200
KEITHLEY
4210
KEITHLEY
4210
KEITHLEY
KEITHLEY
KEITHLEY
4205
4200
4200
KEITHLEY
28775 AURORA RD.
CLEVELAND, OH 44139
MADE IN
USA
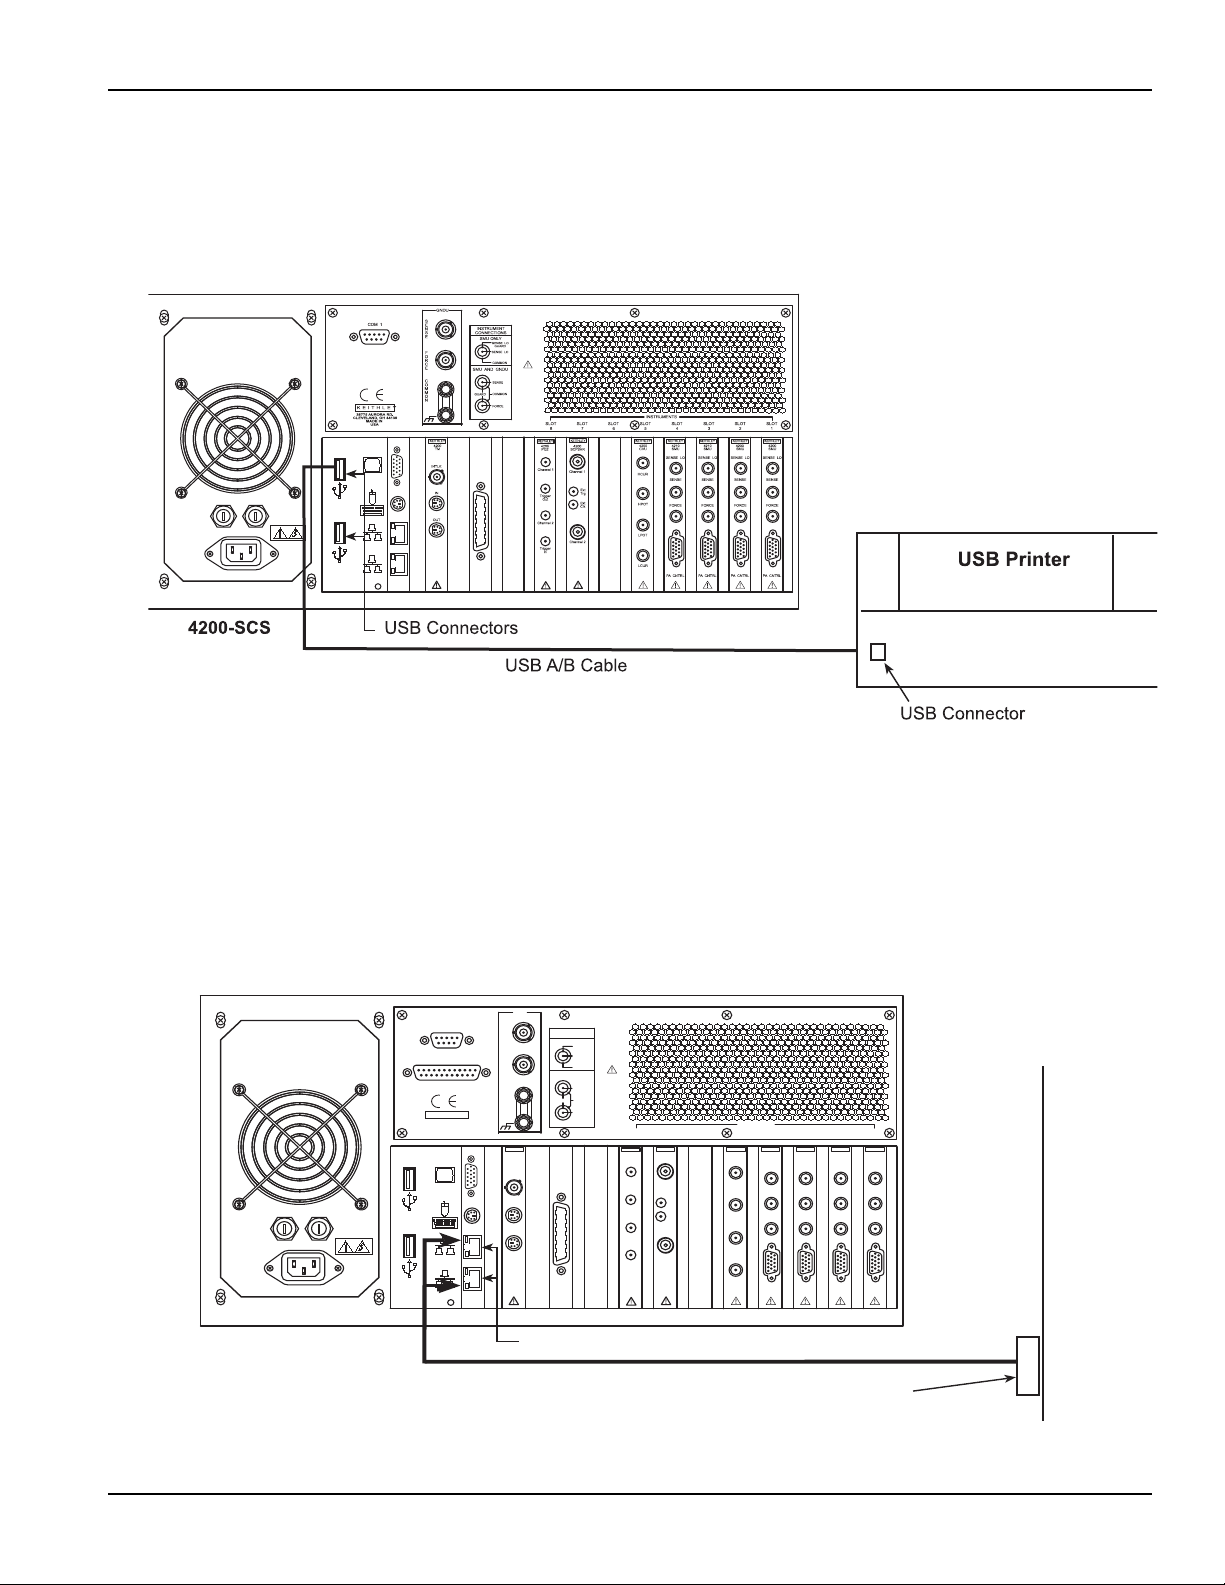
Connecting a printer
As shown in Figure 1-6, you can connect a printer to one of the v2.0 USB connectors.
Figure 1-6
Printer connections
Connecting a LAN
The two LAN connectors on the 4200-SCS are standard RJ-45 connectors intended for use with
unshielded twisted pair (UTP) cable. For best results, use only CAT 5 UTP cables equipped with
RJ-45 connectors to connect your LANs, as shown in Figure 1-7. If IP addresses are statically
assigned, a different IP address will be needed for each of the two LAN ports.
Figure 1-7
LAN connections
4200-900-01 Rev. K / February 2017 Return to Section Topics 1-9
Page 20

Section 1: Getting Started Model 4200-SCS User’s Manual
Model 4200-SCS Hardware Overview
DC source-measure unit (SMU)
This section provides detailed information about several 4200-SCS hardware components, and is
arranged as follows:
• Models 4200-SMU and 4210-SMU overview: Discusses 4200-SMU and 4210-SMU basic
source and measure characteristics, basic circuit configurations, operating boundaries, and
connectors.
• SMU with Model 4200-PA overview: Describes how the 4200-PA extends 4200-SMU and
4210-SMU dynamic range, and covers source and measure characteristics, basic circuit
configurations, operating boundaries, connectors, and mounting methods.
• Ground unit (GNDU): Provides basic information about using the ground unit, including
basic characteristics and connectors.
Models 4200-SMU and 4210-SMU overview
The following paragraphs discuss the basic characteristics of the 4200-SMU and 4210-SMU.
Basic SMU circuit configuration
The basic SMU circuit configuration is shown in Figure 1-8. The SMU operates as a voltage or
current source (depending on source function) in series with an I-Meter, and connected in parallel
with a V-Meter. The voltage limit (V-limit) and current limit (I-limit) circuits limit the voltage or
current to the programmed compliance value. In this local sensing example, the SMU FORCE
terminal is connected to device-under test (DUT) HI, while the DUT LO is connected to COMMON.
See the Reference Manual, Connections and Configuration, page 4-1, and Reference Manual,
Source-Measure Concepts, page 5-1, for details.
1-10 Return to Section Topics 4200-900-01 Rev. K / February 2017
Page 21
Model 4200-SCS User’s Manual Section 1: Getting Started
FORCE
SENSE
COMMON
V-Source I-Source
4200-SMU or 4210-SMU
4200-SMU or 4210-SMU
I-Measure
VI
Source
Control
I-Limit
(Compliance)
V-Limit
(Compliance)
GUARD
100kΩ
100kΩ
Auto Sense
Resistors
SENSE
FORCE
Ground Unit
50kΩ
COMMONCHASSIS
32V
max
Removable
Ground Link
A
DUT
V-MEASURE
V
SENSE LO
GUARD
SENSE
LO
Figure 1-8
Basic SMU source-measure configuration
4200-900-01 Rev. K / February 2017 Return to Section Topics 1-11
Page 22
Section 1: Getting Started Model 4200-SCS User’s Manual
INSTRUMENT
CONNECTIONS
SMU ONLY
SMU AND GNDU
SENSE LO
GUARD
SENSE LO
COMMON
COMMON
FORCE
SENSE
GUARD
4210
SMU
SENSE LO
SENSE
FORCE
PA CNTRL
KEITHLEY
PreAmp
Control
Connector
SENSE LO
Force
and
Sense
Connectors
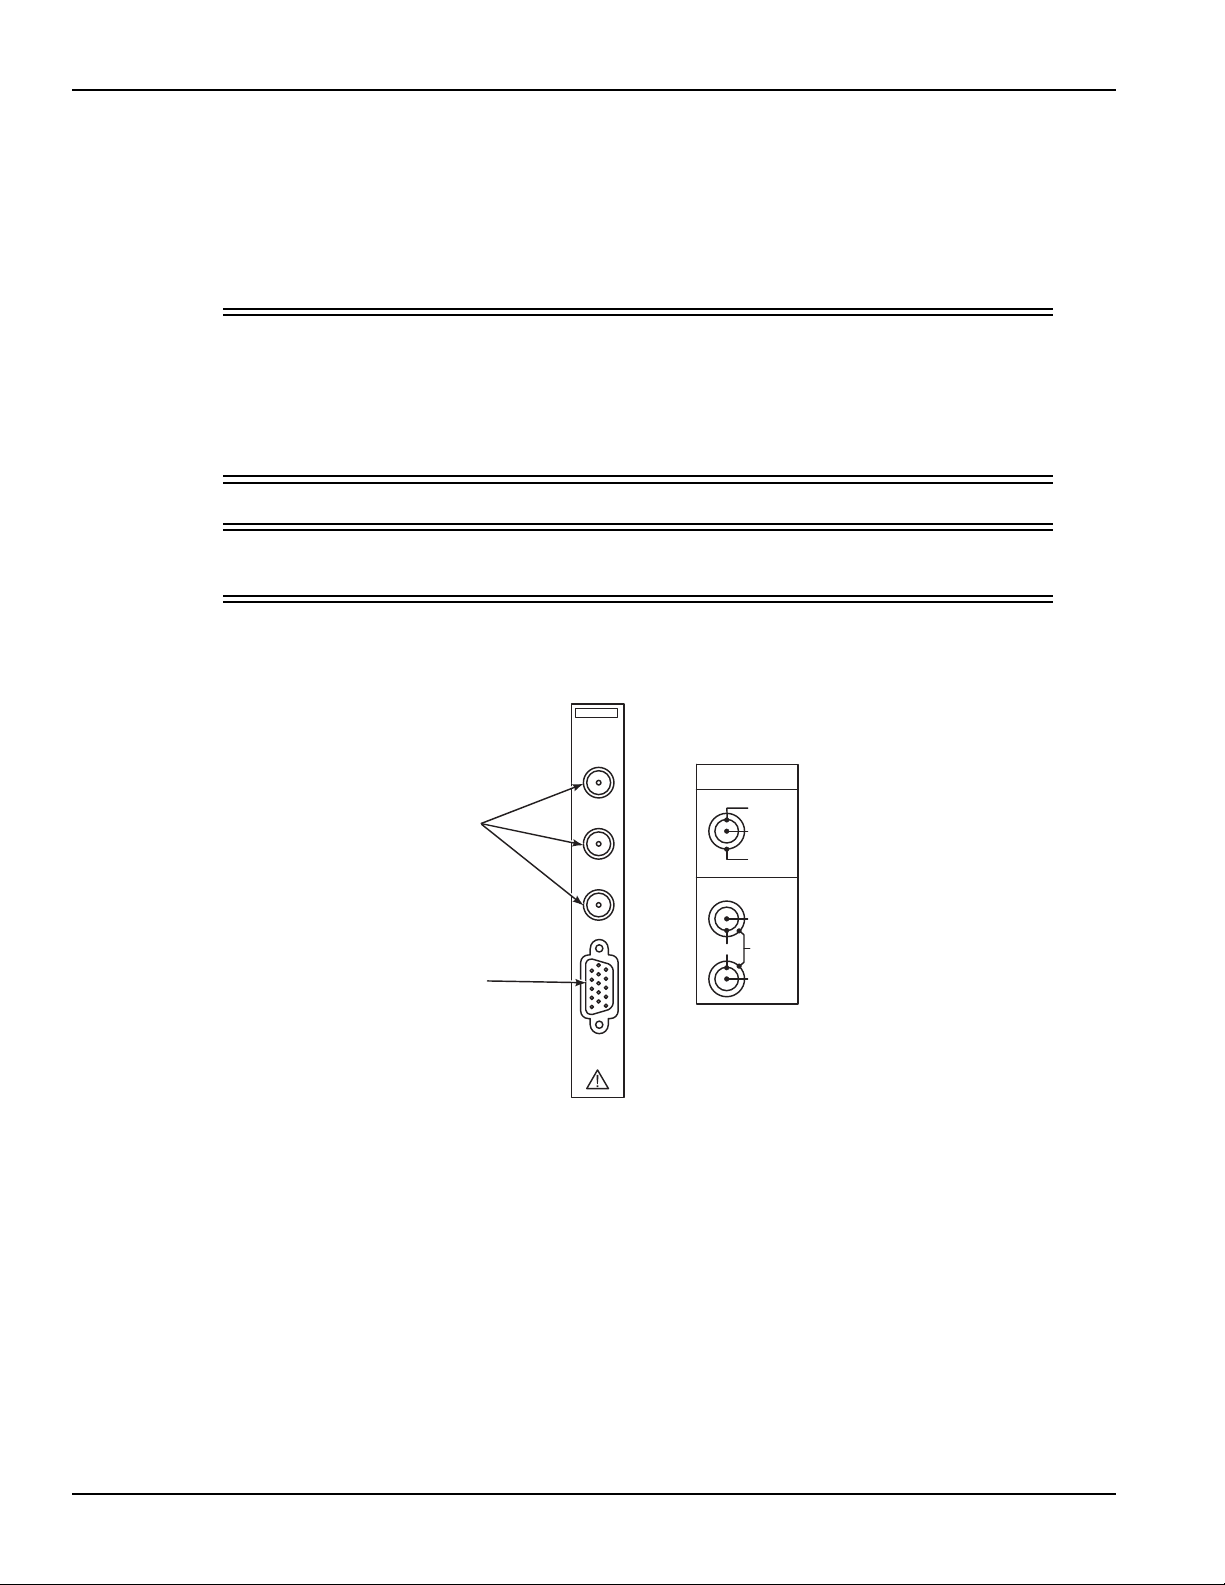
SMU terminals and connectors
The locations and configuration of the 4200-SMU and 4210-SMU terminals are shown in Figure
1-9. Basic information about these terminals is summarized below. Refer to the Reference Manual,
Connections and Configuration, page 4-1, for additional information regarding SMU signal
connections.
WARNING Asserting the interlock will allow the SMU and preamp terminals to become
hazardous, exposing the user to possible electrical shock that could result in
personal injury or death. SMU and preamp terminals should be considered
hazardous even if the outputs are prog rammed to be low v oltage. Pre cautions
must be taken to prevent a shock hazard by surrounding the test device and
any unprotected leads (wiring) with double insulation for 250 V, Category I.
CAUTION The maximum allowed voltage between COMMON and chassis ground is
±32 V DC.
Figure 1-9
Models 4200-SMU and 4210-SMU connectors
FORCE terminal
The FORCE terminal is a miniature triaxial connector used to apply the SMU FORCE signal to the
DUT when a preamp is not being used.
1-12 Return to Section Topics 4200-900-01 Rev. K / February 2017
• The center pin is FORCE
• The inner shield is GUARD
• The outer shield is circuit COMMON
Page 23

Model 4200-SCS User’s Manual Section 1: Getting Started
SENSE terminal
The SENSE terminal is a miniature triaxial connector used to apply the SMU SENSE signal to the
DUT in a remote sense application when the preamp is not being used.
• The center pin is SENSE
• The inner shield is GUARD
• The outer shield is circuit COMMON
Nominal internal auto-sense resistance appears between SENSE and FORCE.
NOTE The SENSE terminal does not need to be connected to the DUT for the SMU to
operate correctly. Remote sensing is automatic. If SENSE is connected to the DUT,
errors due to voltage drops in the FORCE path between the SMU and the DUT will be
eliminated; and, the SMU will sense locally.
SENSE LO terminal
The SENSE LO terminal is a miniature triaxial connector used to apply the SMU SENSE LO signal
to the DUT in a full-Kelvin remote sense application.
• The center pin is SENSE LO
• The inner shield is SENSE GUARD
• The outer shield is circuit COMMON
Nominal internal auto-sense resistance appears between SENSE LO GUARD and COMMON.
NOTE The remote sense capability of the ground unit should be used instead of the SENSE
LO of a SMU. If you need to use the SENSE LO terminal of a SMU, the SENSE LO
terminals of all SMUs being used in that 4200-SCS should be connected to the DUT.
PA CNTRL connector
The PA CNTRL (preamp control) terminal is a 15-pin D connector that provides both power and
signal connections to the 4200-PA remote preamp. The preamp can either be mounted and
connected directly to the SMU, or it can be connected to the SMU using a cable (4200-RPC-X)
when mounted remotely. Refer to SMU with Model 4200-PA overview for more information about
the preamp.
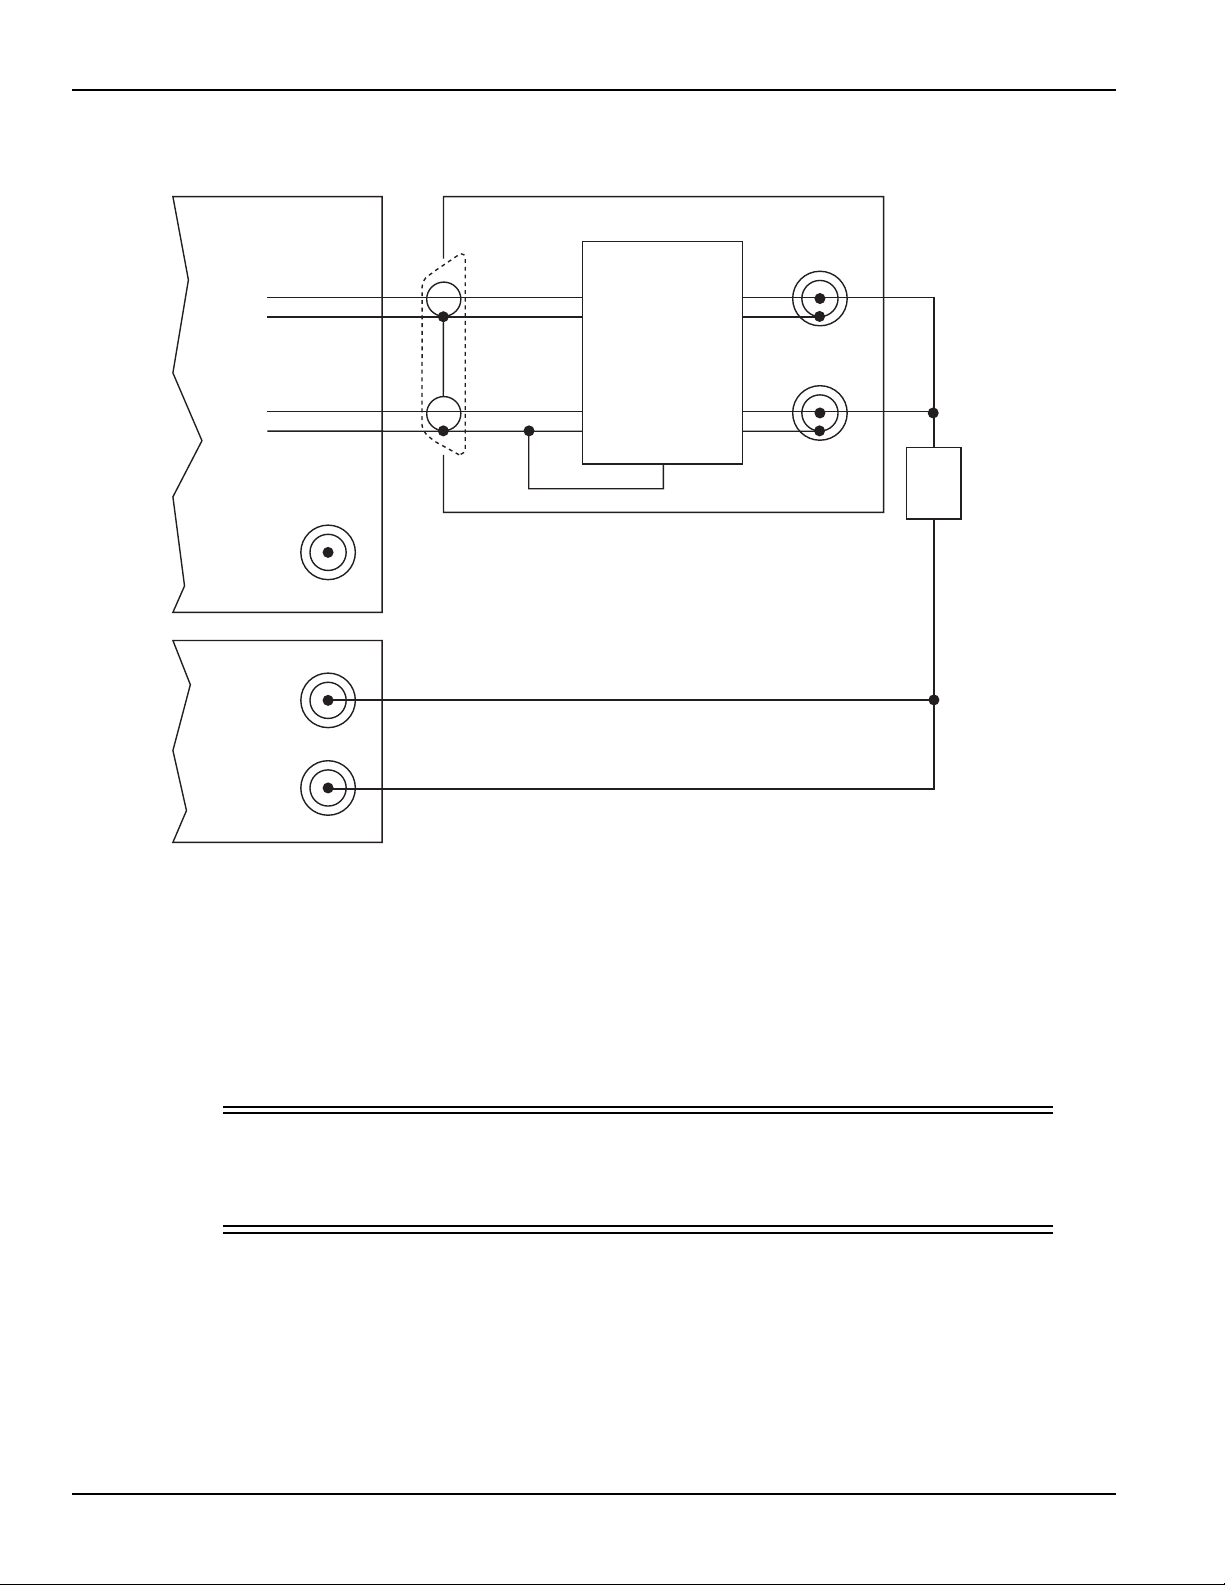
SMU with Model 4200-PA overview
Basic SMU/preamp circuit configuration is shown in Figure 1-10. This configuration is similar to the
SMU configuration discussed earlier, exception the preamp, which adds low-current
source-measure capabilities.
NOTE The preamp FORCE terminal is connected to DUT HI, while DUT LO is connected to
COMMON.
See the Reference Manual, Basic source-measure connections, page 4-3, and Reference Manual,
Source-Measure Concepts, page 5-1, for more source-measure details.
4200-900-01 Rev. K / February 2017 Return to Section Topics 1-13
Page 24
Section 1: Getting Started Model 4200-SCS User’s Manual
4200-SMU
or
4210-SMU
FORCE
SENSE
SENSE
GUARD
GUARD
DUT
FORCE
PreAmp
Control
PreAmplifier
SENSE LO
SENSE
FORCE
Ground
Unit
4200-PA
Figure 1-10
Basic SMU/preamp source-measure configuration
DC preamp
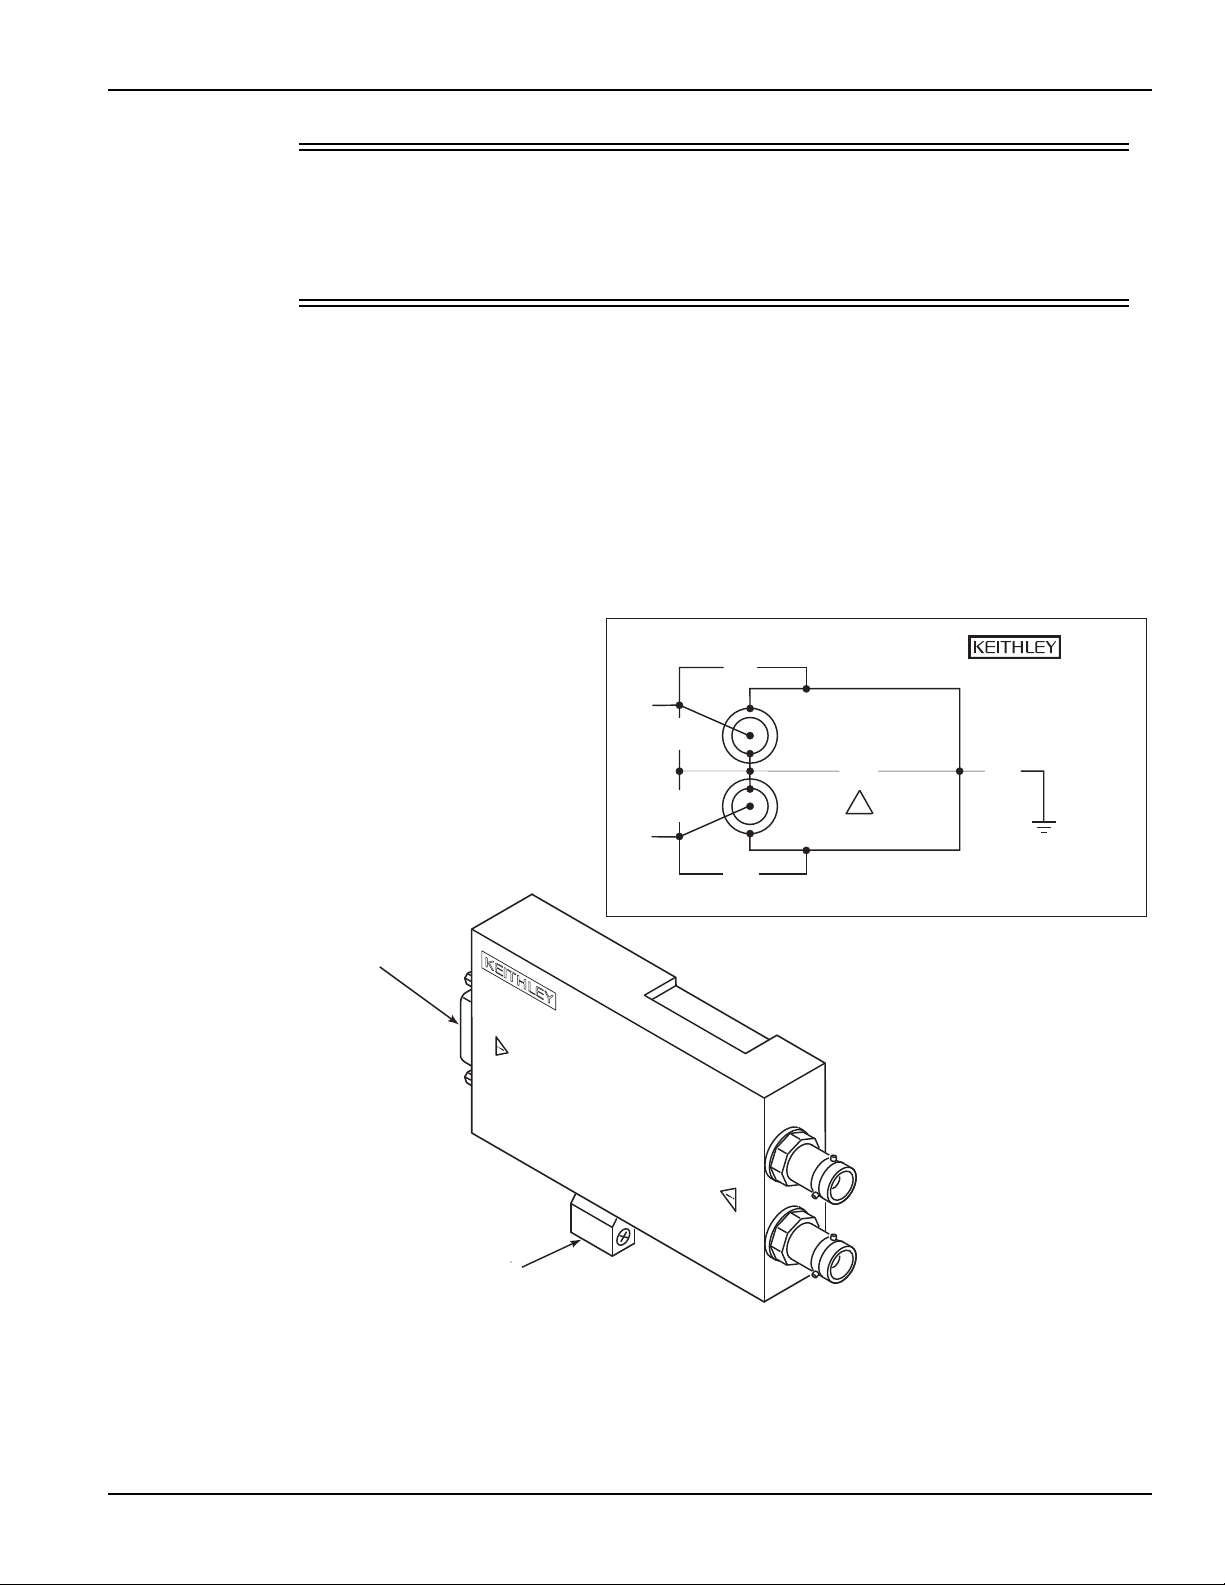
PreAmp terminals and connectors
The locations and configuration of the 4200-PA terminals are shown in Figure 1-11. Basic
information about these terminals is summarized below. For additional information about making
preamp signal connections, refer to the Reference Manual, Basic source-measure connections,
page 4-3.
WARNING The preamp terminals can carry expo sed hazardous vo ltages that c ould result
in personal injury or death if the safety interlock is asserted. See the
Reference Manual, Control and data connections, page 4-20, for additional
information about safety interlock connections.
1-14 Return to Section Topics 4200-900-01 Rev. K / February 2017
Page 25
Model 4200-SCS User’s Manual Section 1: Getting Started
4200-PA-1 REMOTE P
SENSE
FORCE
P
A
RE
MP
CONT
ROL
PreAmp
Control
Connector
Mounting
Foot
COMMON
FORCESENSE
GUARD
250V
PEAK
42V
PEAK
250V
PEAK
250V
PEAK
40V
PEAK
40V
PEAK
WARNING: NO INTERNAL OPERATOR SERVICEABLE
PARTS SERVICE BY QUALIFIED
PERSONNEL ONLY.
PREAMP
CONTROL
CAT I
A
RE
MP
!
MADE IN
U.S.A.
CAUTION The maximum allowed voltages between the preamp signals are:
• COMMON to chassis ground: 32 V peak
• GUARD to COMMON: 250 V peak
• SENSE or FORCE to GUARD: 40 V peak
FORCE terminal
The FORCE terminal is a standard triaxial connector used to apply the preamp FORCE signal to
the DUT.
• The center pin is FORCE
• The inner shield is GUARD
• The outer shield is circuit COMMON
Figure 1-11
Model 4200-PA connectors
4200-900-01 Rev. K / February 2017 Return to Section Topics 1-15
Page 26

Section 1: Getting Started Model 4200-SCS User’s Manual
SENSE terminal
The SENSE terminal is a standard triaxial connector used to apply the preamp SENSE signal to
the DUT in a remote sense application.
• The center pin is SENSE
• The inner shield is GUARD
• The outer shield is circuit COMMON
Nominal internal auto-sense resistance appears between SENSE and FORCE.
NOTE The SENSE terminal does not need to be connected to the DUT for the preamp to
operate correctly. Remote sensing is automatic. If SENSE is connected to the DUT,
errors due to voltage drops in the FORCE path between the preamp and the DUT will
be eliminated; and, the preamp will sense locally.
PreAmp CONTROL connector
The preamp CONTROL connector connects to the SMU PA CNTRL connector and provides both
power and signal connections from the 4200-SMU or 4210-SMU to the 4200-PA preamp.
Multi-frequency capacitance / voltage unit (CVU)
The Model 4210-CVU1 is a multi-frequency (1 kHz to 10 MHz) impedance measurement card that
is installed in the 4200-SCS mainframe. The AC test signal (10 mV RMS to 100 mV RMS) can be
DC voltage biased from -30 V to +30 V.
The CVU measures impedance by sourcing an AC voltage across the device under test (DUT),
and then measures the resulting AC current and phase difference. The capacitance and
conductance are derived parameters from the measured impedance and phase.
Model 4210-CVU card
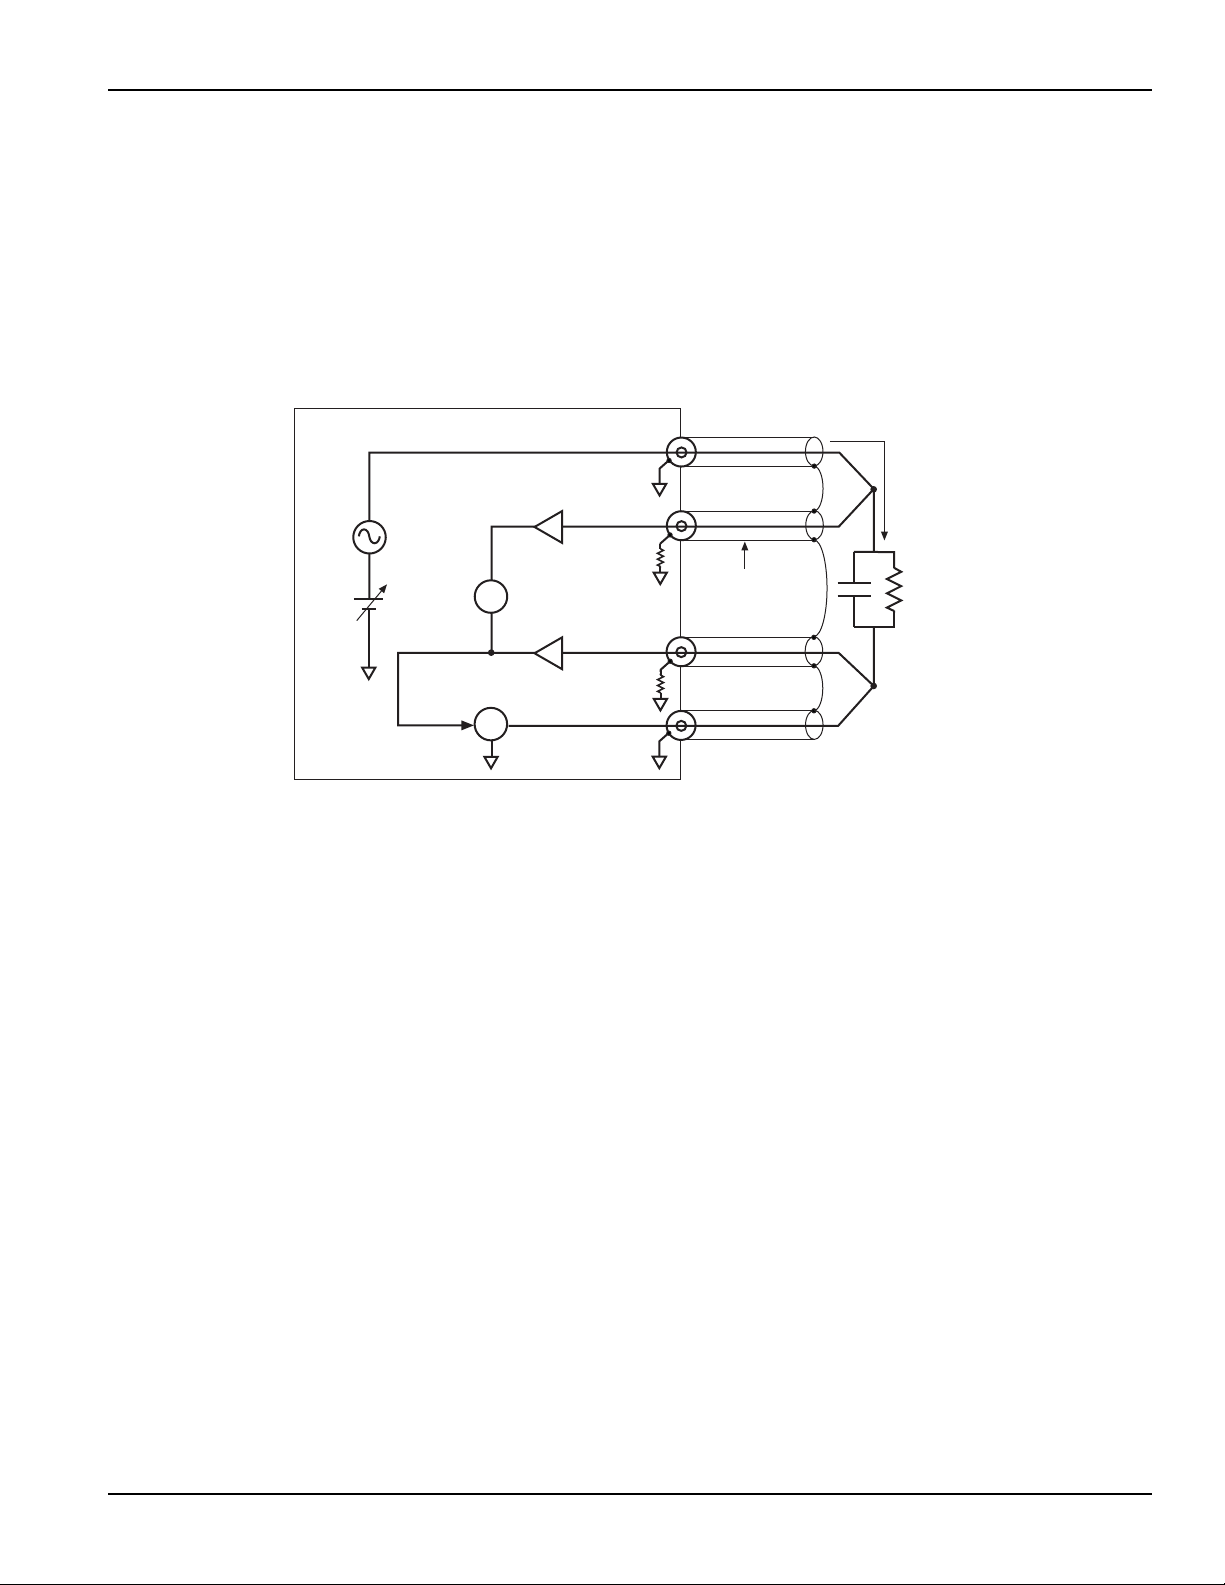
Measurement overview
AC impedance measurement (Z
AC test voltage across the device and measuring the resulting AC current.
The AC current is measured as shown in Figure 1-12. The 4210-CVU uses an auto balance bridge
(ABB) technique to achieve accurate impedance measurements. The purpose of the ABB is to
create a virtual ground at the DUT to minimize measurement error. Every CVU measurement is
taken with ABB active. The ABB will always attempt to lock the low side of the DUT to virtual
ground.
If the ABB fails to lock:
• The measurement is made but may be out of specification.
• The returned data is flagged and colored yellow in the data sheet.
• The graph displays an ABB Not Locked message.
) of the device under test (DUT) is performed by sourcing an
DUT
1. In February 2009, the 4210-CVU replaced the 4200-CVU. The 4210-CVU is identical to the 4200-CVU except that
it extends the frequency range to 1 kHz (1 kHz to 9 kHz in 1 kHz increments).
1-16 Return to Section Topics 4200-900-01 Rev. K / February 2017
Page 27
Model 4200-SCS User’s Manual Section 1: Getting Started
AC
Test
Signal
DC
Bias
4200-CVU
HCUR
Measure
AC Current
HPOT
Measure
AC Voltage
V
LPOT
A
LCUR
DUT
ABB Loop
I
DUT
Red SMA
Cable (1 of 4)*
Shields of the cables must
be connected together near
the DUT.
*
C
DUT
I
DUT
2πfV
AC
--------------------=
C
DUT
= Capacitance of the DUT (f)
f = Test frequency (Hz)
V
AC
= Measured AC voltage (V)
Most common causes of ABB not locked are:
• Mismatched physical cable lengths
• Mismatched physical cable lengths versus the programmed cable length in Keithley
Interactive Test Environment (KITE)
• Improperly torqued SMA cables
• Sub-optimal I-range setting
• Too much parasitic load on the low side of DUT
Figure 1-12
Measurement circuit (simplified)
The capacitive impedance (and conductance) are calculated based on the measured AC
impedance and phase.
The capacitance is calculated from the capacitive impedance and the test frequency using the
following formula:
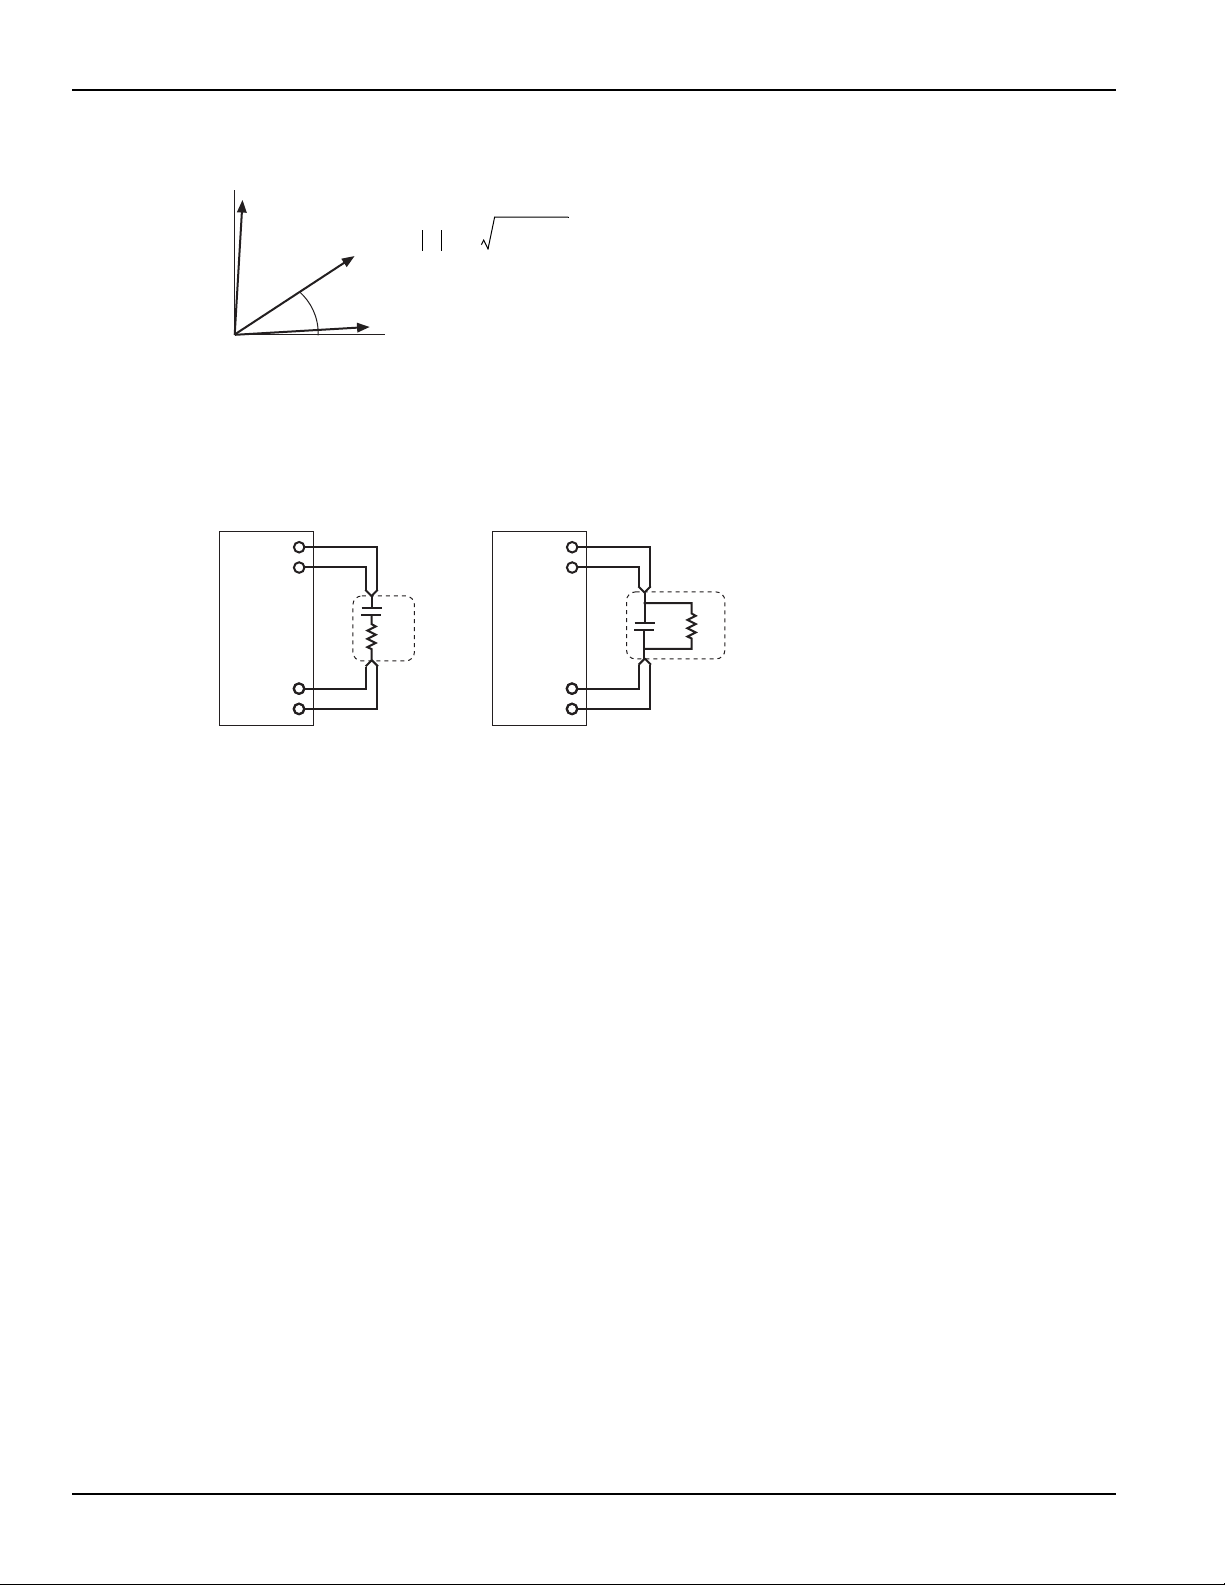
Measurement functions
The 4210-CVU can measure the following parameters:
• Z, Theta Impedance and Phase Angle
• R + jX Resistance and Reactance
• Cp-Gp Parallel Capacitance and Conductance
• Cs-Rs Series Capacitance and Conductance
• Cp-D Parallel Capacitance and Dissipation Factor
• Cs-D Series Capacitance and Dissipation Factor
Figure 1-13 shows the vector diagram and fundamental equations for impedance.
4200-900-01 Rev. K / February 2017 Return to Section Topics 1-17
Page 28
Section 1: Getting Started Model 4200-SCS User’s Manual
ZR2X
2
+=
ZRjX+=
θ arc
X
R
----
tan=
RZθcos=
XZθsin=
Y
1
Z
---= GjB+()=
Z = Impedance
θ = Phase Angle
R = Resistance
X = Reactance
Y = Admittance
G = Conductance
X
R
q
Z
HCUR
HPOT
LPOT
LCUR
4200-CVU
Cs
Rs
Series RC Configuration
HCUR
HPOT
LPOT
LCUR
Cp
Rp
Parallel RC Configuration
DUT
DUT
4200-CVU
Figure 1-13
Vector diagram for impedance (Z)
The simplified model of a DUT is a resistor and a capacitor. As shown in Figure 1-14, the
4210-CVU can measure the DUT as a series configuration of the resistor-capacitor (RC), or as a
parallel RC configuration.
Figure 1-14
Measure models (simplified)
Test signal
The test signal can be set for the following frequencies:
• 1 kHz through 10 kHz in 1 kHz increments
• 10 kHz through 100 kHz in 10 kHz increments
• 100 kHz through 1 MHz in 100 kHz increments
• 1 MHz through 10 MHz in 1 MHz increments
The AC signal output level can be set from 10 mV RMS to 100 mV RMS (1 mV resolution). The
output impedance is 100 Ω (typical).
There are three current measurement ranges available to measure current: 1 µA, 30 µA or 1 mA.
With auto range selected, range selection will be performed automatically.
DC bias function and sweep characteristics
The AC test signal can be biased with a static DC level (-30 V to +30 V), or a voltage sweep (up or
down).
1-18 Return to Section Topics 4200-900-01 Rev. K / February 2017
Page 29

Model 4200-SCS User’s Manual Section 1: Getting Started
0V
Bias
Run Test
Meas
#1
Meas
#2
Meas
#15
Frequency = 1MHz
AC Voltage = 15mVRMS
#Samples = 15
-4.80V
Stop
Meas
#1
0V
Frequency = 1MHz
AC Voltage = 30mVRMS
Start
Step
200mV
Run Test
-4.60V
-5.00V
+5.00V
Step
200mV
Meas
#2
Meas
#3
Meas
#51
0V
100kHz
(Start)
1MHz
(Stop)
200kHz
AC Voltage = 30mVRMS
Bias
Meas
#10
Run Test
Meas
#1
Meas
#2
You can also perform a frequency sweep (up or down):
• DC bias waveform: The DC bias is set to 0V, but can be set to any valid DC bias level (you
specify the number of measurements to perform). (see Figure 1-15)
• DC voltage sweep: You specify the start voltage, stop voltage and step voltage. The number
of data (measurement) points is calculated by the 4210-CVU. (see
Figure 1-16)
• Frequency sweep: You specify the start frequency and the stop frequency; the number of
data (measurement) points is calculated by the 4210-CVU. (see Figure
1-17)
• Voltage list sweep: You specify the voltage levels for the sweep (not shown)
• Step frequency sweep: Includes voltage stepping. A voltage sweep is performed for every
frequency point (not shown)
NOTE Refer to the Forcing functions and meas ure options, p age 3-16 for details on the bias
and sweep forcing functions.
Figure 1-15
DC bias waveform (example)
Figure 1-16
DC voltage sweep (example)
Figure 1-17
Frequency sweep (example)
4200-900-01 Rev. K / February 2017 Return to Section Topics 1-19
Page 30
Section 1: Getting Started Model 4200-SCS User’s Manual
HT
0V
1V
Meas
Meas
Bias
HT = Hold Time
SD = Built-In System Delay
Int = Programmed Interval
Meas = Measure Time
Run
Test
5V
PreSoak
Int
SD
Int
SD
Force-measure timing
Bias function
Timing for the force-measure process for a bias function is shown in Figure 1-18.
When the test is started, the following timing sequence takes place:
1. The DC source outputs the presoak voltage for the hold time period.
2. The DC source goes to the DC bias voltage.
3. After the built-in system delay and time Interval periods, the Model 4210-CVU performs a
measurement. The AC test signal is applied just before the start of the measurement. AC
drive is turned off after the measurement is completed.
4. Step 3 is repeated for every measurement.
Figure 1-18
Force-measure timing
Sweep function
Force-measure timing for a sweep function is similar to the timing for a bias function (shown in
Figure 1-18), with the following differences:
• The hold time is repeated at the beginning each subsequent sweep step.
• A programmed delay is used in place of the interval.
Pulse cards
The Keithley Instruments pulse cards are two-channel, high speed, voltage pulse generator cards
that provide the following types of output:
There are two pulse generator instrument cards available for 4200-SCS:
• 4220-PGU Pulse Generator Unit
• 4225-PMU Ultra-Fast IV Module.
Both cards offer:
• Two output channels
• Standard (2-level) pulse
•Segment ARB
• Full Arb
Each output channels has two output ranges:
• 10 V (into high impedance, 5 V into 50 Ω)
• 40 V (into high impedance, 20 V into 50 Ω)
1-20 Return to Section Topics 4200-900-01 Rev. K / February 2017
®
waveform
Page 31

Model 4200-SCS User’s Manual Section 1: Getting Started
The 4220-PGU is a 2-channel voltage pulse generator. The Model 4225-PMU is also a
2-channel voltage pulse generator, but includes integrated simultaneous current and voltage
measurement with two A/D converters for each channel.
Both can be isolated from the DUTs by a high endurance output relay (HEOR). The HEOR is
typically used for applications that require high-speed, high-volume switching of the output.
A pulse card can be programmed for continuous pulse output or set to output a finite number of
pulses (burst or trig burst triggering modes). The pulse amplitude can be set from
100 mV to 40 V. The pulse period can be set from 20 ns to 1 s with a minimum pulse width of
10 ns. Transition times (pulse rise and pulse fall) can be set independently. Refer to Pulse card
settings for details on all pulse card settings.
NOTE Pulse amplitude can be set as high as 80 V depending on the pulse high and low
levels, pulse output range, and DUT load settings.
Refer to the Reference Manual, Pulse source-measure connections, page 11-38 for details on
pulse card connectors and connections to the DUT.
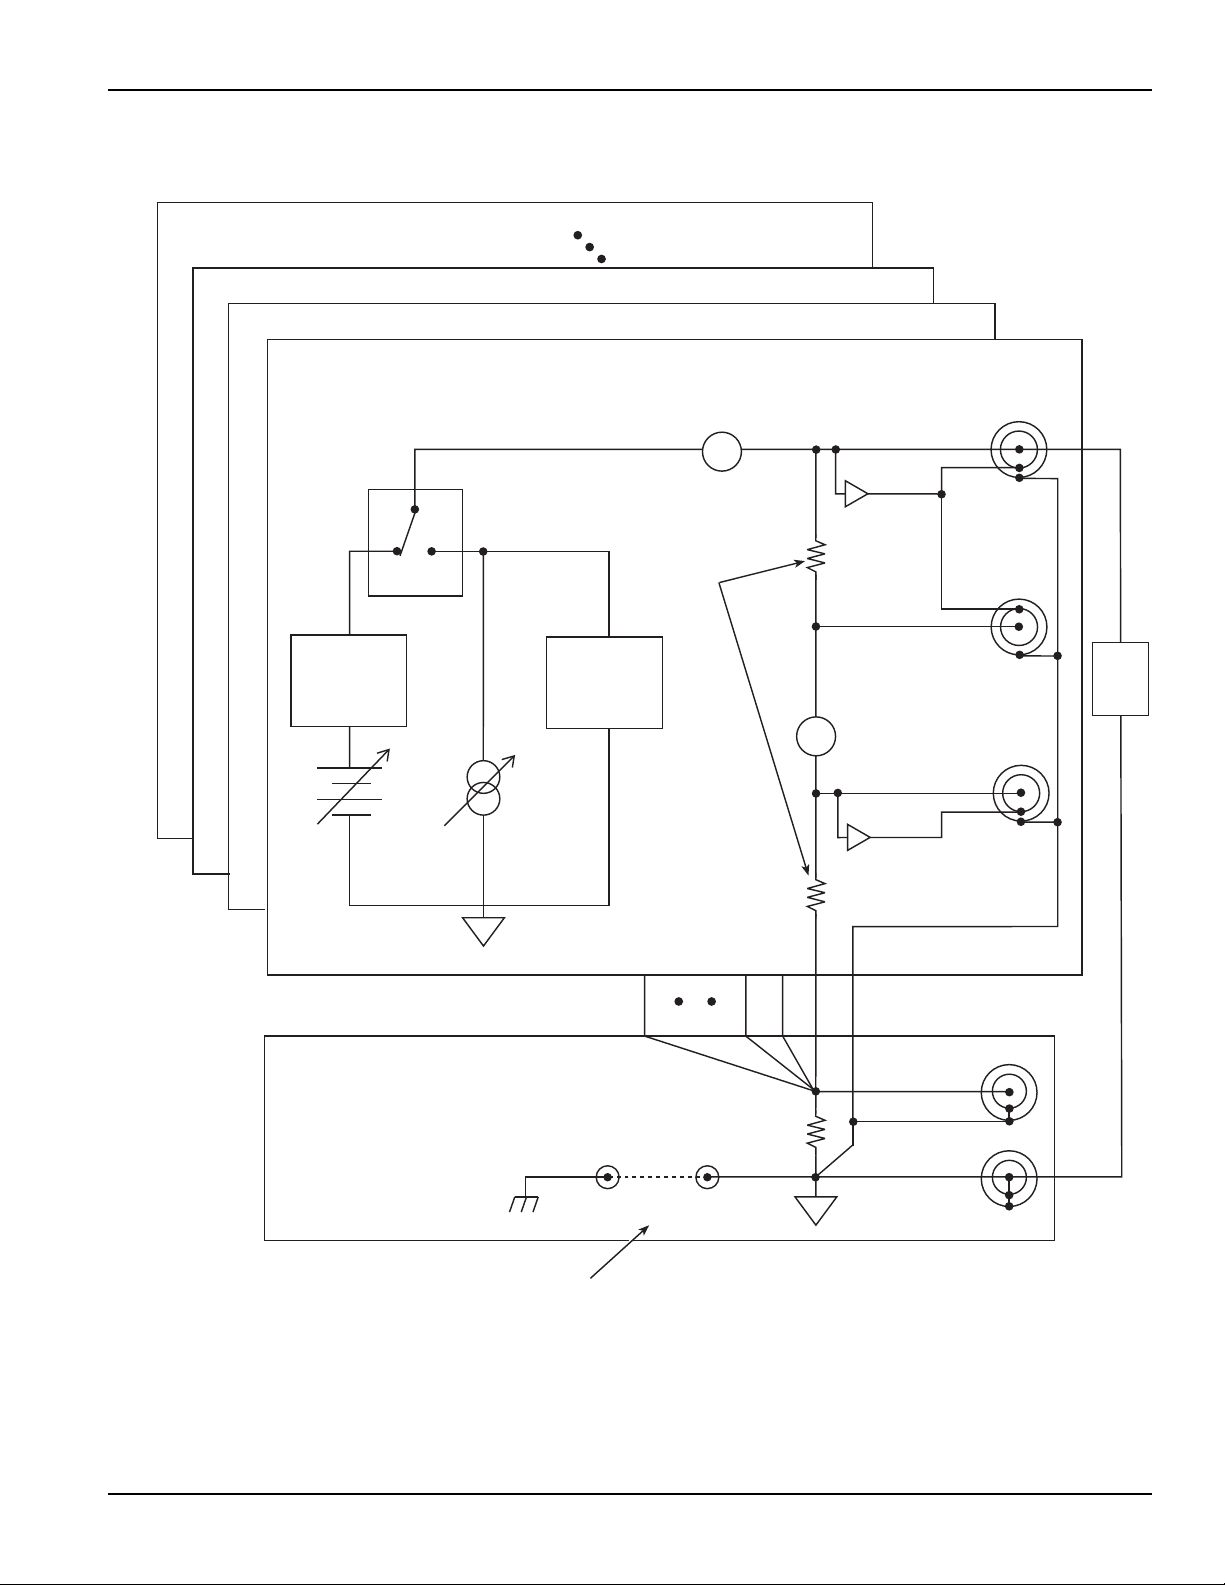
Figure 1-19 shows a simplified schematic of the 4220-PGU pulse card single channel output. The
range relay chooses between the high-speed and high-voltage output ranges. The schematic for
the 4225-PMU is similar except it also includes measure circuitry for both current and voltage (see
Figure 16-2 on page 16-5 in the Reference Manual).
The HEOR provides fast, unlimited, open/close cycles for demanding tests such as flash memory
endurance. The HEOR is also known at the SSR (solid state relay), See Segment ARB waveform
for more details about the typical use of the HEOR, which is a solid-state relay for connecting or
disconnecting a pulse channel from a device terminal.
Figure 1-19
Simplified schematic of each Model 4220-PGU channel
High Endurance
Range Relay:
High Speed or
High Voltage
Output Relay (HEOR):
Closed or Open
About the pulse cards
The following chart shows a comparison of features between the 4220-PGU and the 4225-PMU:
Table 1-1
Feature comparison of pulse cards
Feature 4220-PGU 4225-PMU
Standard (2-level) Pulse Yes Yes
Segment ARB Yes Yes
4200-900-01 Rev. K / February 2017 Return to Section Topics 1-21
Page 32

Section 1: Getting Started Model 4200-SCS User’s Manual
Amplitude
1.0V
Pulse Width
500ns
Fall Transition Time
100ns
1.0V
0.0V
Pulse Period
1µs
Rise Transition Time
100ns
Median
Table 1-1
Feature comparison of pulse cards (continued)
Feature 4220-PGU 4225-PMU
Full Arb (source only) Yes Yes
High Endurance Output Relay
Yes Yes
(solid-state relay; SSR
Integrated Current and Voltage
Measure
Supports option Model 4225-RPM
with lower pulse current measure
ranges and SMU/CVU switching
No Yes
No Yes
Firmware upgrade for the 4200-PG2
The firmware can be upgraded to allow the 4200-PG2 to configure and output Segment ARB and
full arb waveforms. However, since the 4200-PG2 does not have the HEORs and an input trigger
connector, the related operations cannot be performed. These exceptions will be noted where
appropriate in this section.
The instructions to upgrade the firmware of the 4200-PG2 to KITE V6.2 are available by clicking
on the Model 4200-SCS Complete Reference icon on the 4200-SCS desktop. Follow the links for
release notes, then look for the firmware upgrade procedure for the pulse card firmware. See
“Accessing the release notes” on page 1-46 for more information.
Standard pulse
Each channel of a pulse card can be configured for standard pulse output. Figure 1-20 shows an
example of standard pulse output.
A pulse card is a dual-channel pulse generator. Each channel can output high speed (low voltage)
or high voltage (medium speed) pulses. The basic pulse characteristics of the pulse card are listed
in the specification sheet.
Figure 1-20
Standard pulse example (pulse high = 1 V, pulse low = 0 V)
1-22 Return to Section Topics 4200-900-01 Rev. K / February 2017
Page 33

Model 4200-SCS User’s Manual Section 1: Getting Started
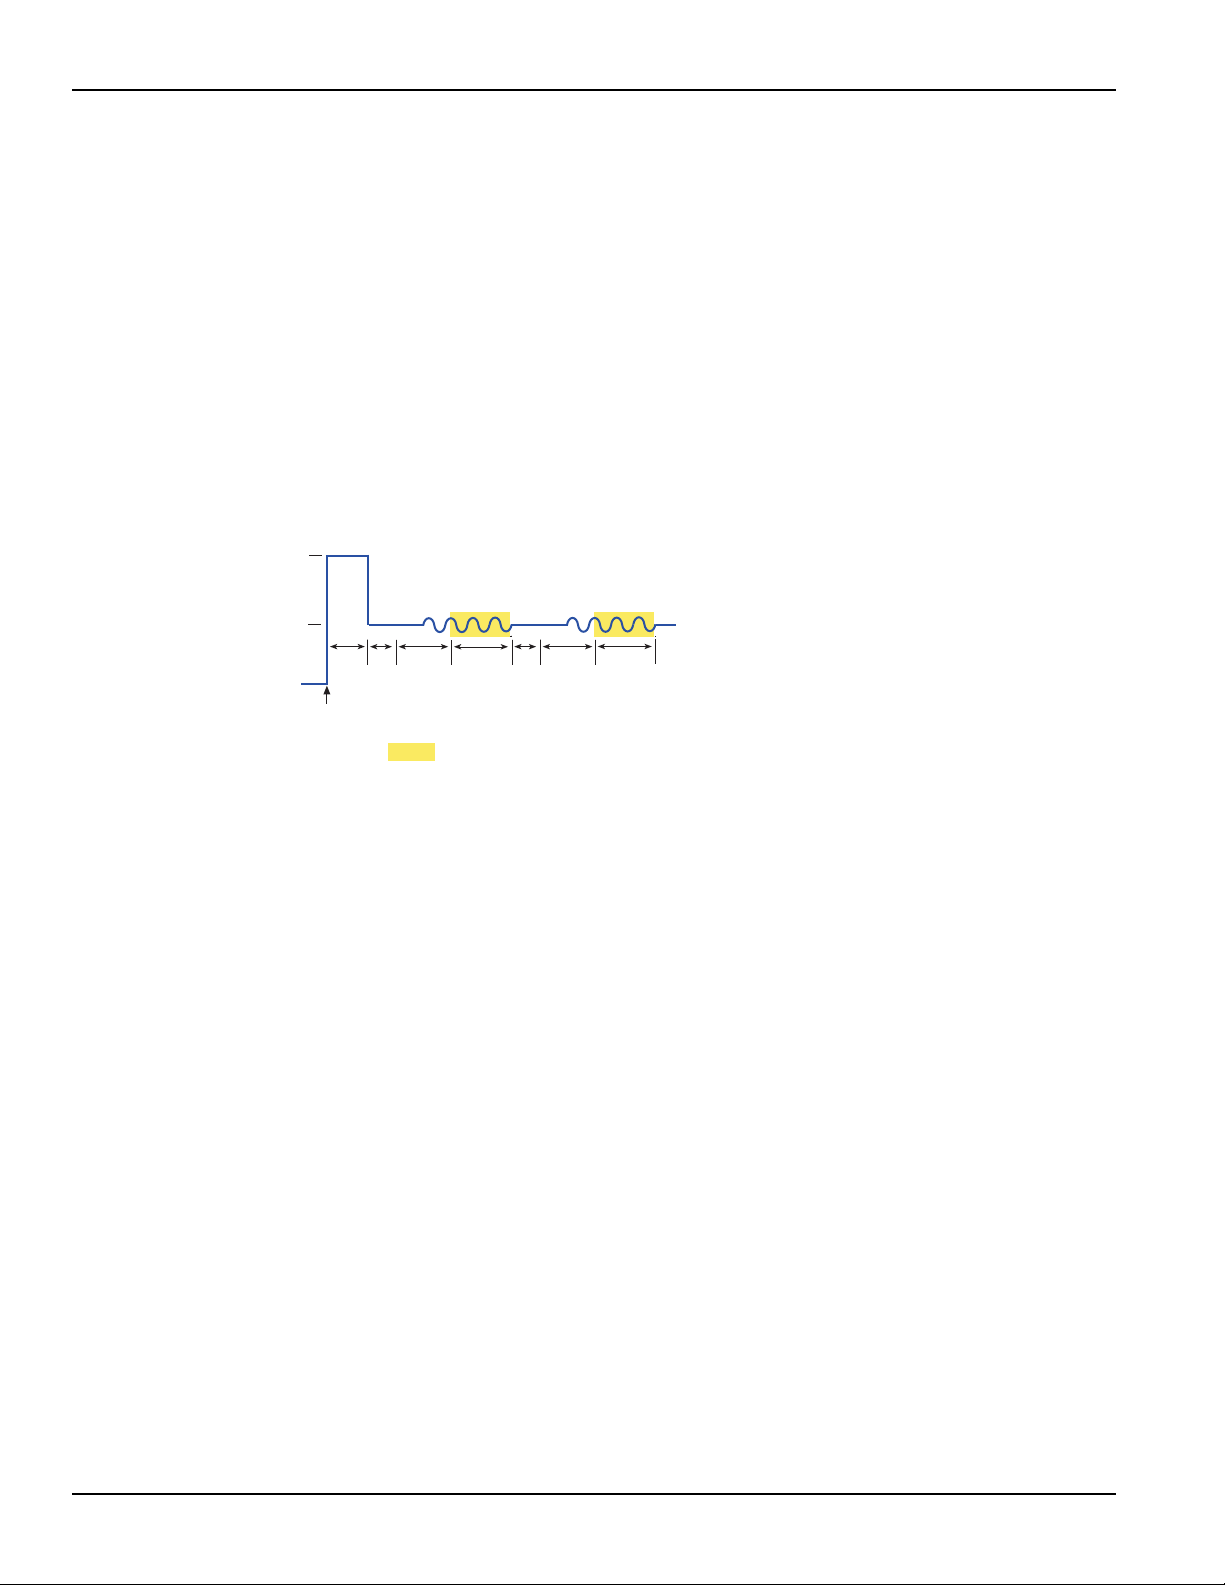
Segment ARB waveform
Each channel of a pulse card can be configured to output its own unique Segment ARB®
waveform. A Segment ARB waveform is composed of user-defined line segments (up to 1024 for
the 4205-PG2 or 2048 for the 4220-PGU and 4225-PMU). Each segment can have a unique time
interval, start value, stop value, output trigger level (TTL high or low) and output relay state (open
or closed).
Figure 1-21 shows an example of a Segment ARB waveform that contains seven segments. It also
shows the programmed trigger levels and open/closed states for the output relay.
Figure 1-21
Segment ARB waveform example
111 1 1 1
0
Start, stop, and time restrictions:
• The start level of the first segment and the stop level of the last segment must be the same.
In Figure 1-21, segment 1 start and segment 7 stop are both set for 0.0 V.
• The stop level for a segment must be the same as the start level for the next segment. In
Figure 1-21, the stop level for Segment 1 is 1.0 V, as is the start level for Segment 2 (no
discontinuities are allowed).
• The minimum time per segment is 20 ns, with increments of 10 ns.
Trigger levels: The segment trigger levels are available at the TRIGGER OUT connector. When
set high (1), a TTL high level will be present at TRIGGER OUT during that time
interval. When set low (0), the trigger goes low for that segment. In Figure 1-21,
trigger is set high for the first three segments, and low for the rest of the segments.
NOTE If both channels of a pulse card are being used, the segment trigger levels for
CHANNEL 1 will be seen at the TRIGGER OUT connector. The trigger levels for
CHANNEL 2 are ignored.
4200-900-01 Rev. K / February 2017 Return to Section Topics 1-23
Page 34

Section 1: Getting Started Model 4200-SCS User’s Manual
High-endurance output relay (HEOR): Each output channel of a pulse card has a high-speed,
solid-state output relay. When this relay is closed, the
waveform segment is output. When opened, the channel
output is electrically isolated (floating) from the DUT. In
Figure 1-22, the output relay is opened during segment
seven. This puts the output in a floating condition. The
minimum time for a segment with a HEOR transition
(open-to-close or close-to-open) is 100 µs for the
4205-PG2 or 25 µs for the 4220-PGU and 4225-PMU.
NOTE If the firmware for the 4200-PG2 has been upgraded to KITE V6.2, it can be used to
configure and output Segment ARB
®
waveforms (see Firmware upgrade for the
4200-PG2 earlier in this section). However, the 4200-PG2 does not have output
relays (HEOR). Therefore, relay control will be ignored.
seg_arb_define:
This function is used to define a Segment ARB waveform. This function includes parameters to
specify the number of segments (nSegments), and arrays for start (startvals), stop
(stopvals), and time values (timevals). It also includes arrays for trigger levels
(triggervals) and output relay states (outputRelayVals). For more information, refer to the
Reference Manual, seg_arb_define, page 8-175.
seg_arb_file:
This function is used to load a Segment ARB waveform into a pulse card. For more information,
refer to the Reference Manual, seg_arb_file, page 8-176.
seg_arb_sequence and seg_arb_wavform:
These more advanced functions can be used by the 4220-PGU and 4225-PMU cards to define a
Segment ARB waveform (see seg_arb_sequence and seg_arb_waveform in Section 8 of the
Reference manual.
NOTE Because of resources necessary to run the Segment ARB engine, an additional
10 ns interval is added to the end of the last segment of a Segment ARB waveform.
During this interval, the output voltage, HEOR, and trigger output values remain the
same as the final value reached in the last segment.
Full arb
NOTE If the firmware for the 4200-PG2 has been upgraded to KITE V6.2, it can be used to
configure and output full arb waveforms (see Firmware upgrade for the 4200-PG2
earlier in this section).
Each channel of the pulse generator can be configured to generate its own unique full arb
waveform. A full arb waveform is made up of user-defined points (up to 262,144).
Each waveform point can have its own unique voltage value. A time interval is set to control the
time spent at each point in the waveform. Figure 1-22 shows an example of a user-defined full arb
waveform. The waveform is made up of 80 voltage points, with the time interval between each
point set to 10 ns.
1-24 Return to Section Topics 4200-900-01 Rev. K / February 2017
Page 35

Model 4200-SCS User’s Manual Section 1: Getting Started
0V
5V
10V
15V
20V
200ns 400ns 600ns 800ns0ns
Points = 80
Time Interval = 10ns
Point Level
1 0.5V
2 1.0V
3 1.5V
39 19.5V
40 20.0V
41 19.5V
78 1.0V
79 0.5V
80 0.0V
The arb_array function is used to define a full arb waveform. This function includes parameters
to specify the number of waveform points (length), the time interval (TimePerPt), an array of
voltage levels (levelArr), and a file name (fname). For more information, refer to the Reference
Manual, arb_array, page 8-156.
The arb_file function is used to load the defined full arb waveform into the pulse generator. For
more information, refer to the Reference Manual, arb_file, page 8-157.
Figure 1-22
Full arb waveform example
KPulse full arb waveforms
The Keithley Pulse tool (KPulse) is a virtual front panel software application used to control the
optional pulse generator cards. KPulse can be used to create, save and output full arb waveforms,
and provides a collection of basic full arb waveform types such as sine, square, triangle, noise,
Gaussian, and calculation. After configuring one of the basic waveform types, you can save it as a
.kaf file. For more information, refer to the How to Generate Basic Pulses in Section 5.
Once a full arb waveform is saved as a .kaf file, it can later be imported back into KPulse. The
waveform can also be loaded into the pulse generator card using the arb_file function. For
more information, refer to the Reference Manual, arb_file, page 8-157.
Pulse card settings
Settings and features for the pulse card are summarized in Section 11 of the reference manual
(see Ta bl e 11 -1 in the reference manual). For more details, see How to Generate Basic Pulses in
Section 5. In addition to short descriptions and default settings, the table includes the following:
• LPT function: The Keithley Instruments Linear Parametric Test Library (LPTLib) function
used for each setting or feature. Refer to the Reference Manual, LPT Library Function
Reference, page 8-90 for details.
• Access level: The access level for each setting. If a setting can be independently set for
each pulse generator channel, its access level is “channel.” Otherwise, the access level is
“card” to indicate that both channels are affected.
• Pulse mode: A checkmark (√ ) is used to indicate which pulse mode is associated to the
setting or feature. The “n/a” notation indicates that the pulse mode is not applicable to that
setting or feature.
4200-900-01 Rev. K / February 2017 Return to Section Topics 1-25
Page 36

Section 1: Getting Started Model 4200-SCS User’s Manual
4205-RBT Remote Bias Tee
Connect to DUT
or Prober
1) When using a SMU PreAmp, use 4200-TRX-X cables for connections. When
NOT using a PreAmp, use 4200-MTRX-X cables for connections.
2) Use SMA cables (male-to-male) for connections.
2
SMA Connectors
(female)
3-Lug Triax Connectors
(female)
Connect to pulse generator card
and/or scope card
2
Connect to
SMU SENSE
1
Connect to
SMU FORCE
1
AC + DC
Output
DC
Sense
20kW
AC Input
DC
Force
Remote bias tee (RBT) and 3-port power divider
The 4205-RBT and power divider are used for the Keithley Instrument’s PulseIV-Complete and
Demo-PulseIV projects. Two RBT adapters and one 3-port power divider are included with the
4200-PIV-A solution bundle. Also included are two 4200-MAG-BASE mounts (that attach bias tee
adapters to the prober platen magnetically). For more information, refer to the Reference Manual,
PulseIV-Complete and Demo-PulseIV projects, page 12-4.
RBT
The RBT adapter (see Figure 1-23) is a coupler for DC bias from a SMU, and pulse output from a
Model 4205-PG2 pulse generator channel. The output of the RBT provides pulse output riding on
the DC V bias.
As shown in Figure 1-23, the RBT has two three-lug female triax connectors for connection to a
SMU (FORCE and SENSE), and two female SMA connectors, one for AC inputs, such as a pulse
generator card and scope card (Model 4200-SCP2HR or 4200-SCP2), and one for AC+DC output
connection to a prober or directly to a DUT.
Figure 1-23 also shows the simplified schematic of the RBT. The capacitor allows pulses from the
pulse generator card to pass through to the output, while blocking DC from the SMU. The
inductors allow DC from the SMU to pass through to the output, while blocking pulses from the
pulse generator.
Figure 1-23
Model 4205-RBT simplified schematic
3-port power divider
The 3-port power divider divides the electrical power equally among its three connectors using a
16.67 W resistor in each “leg” (see Figure 1-24). The power divider is used on the gate of a FET to
provide an impedance matched signal (pulse) path (50 Ω).
As shown in Figure 1-24, the power divider is equipped with two SMA female connectors and one
SMA male connector. The SMA male connector allows the power divider to connect directly to the
RBT (AC input).
1-26 Return to Section Topics 4200-900-01 Rev. K / February 2017
Page 37

Model 4200-SCS User’s Manual Section 1: Getting Started
3-Port
Power
Divider
SMA Male
Connect Directly
to RBT
(AC Input)
S
1
2
SMA Female
Connect to Pulse
Generator Card
Connect to
Scope Card
16.67W
16.67W
16.67W
4200-SMU (1)
4200-SMU (2)
Scope Card
Pulse Generator
Card
DC Bias and Measure
4205-RBT
(1)
4205-RBT
(2)
V
g
Channel 1
Channel 1
Output
V
DD
Tri gger
AC+DC
Output
V
d
Channel 2
AC+DC
Output
Channel 2
(Not Used)
3-port
Power
Divider
1
2
S
AC
Input
DC
Input
AC
Input
DC
Input
Figure 1-24
3-port power divider
Using an RBT and power divider
Figure 1-25 shows a block diagram of the pulse IV (PIV) test system that uses two SMUs, a pulse
generator card (one channel), a scope card (both channels), two RBTs, and the power divider.
The power divider provides impedance matching; an RBT functions as a coupler for DC bias from
a SMU, and pulse output (AC) from a pulse generator card. The output of an RBT provides pulse
output that rides on the DC bias level. The scope card is used to capture pulse waveforms or pulse
readings. The DUT is typically a wafer site (using prober) or a discrete device.
4200-900-01 Rev. K / February 2017 Return to Section Topics 1-27
The capacitor for an RBT functions as a low-impedance component for high-speed pulses, and as
a high-impedance element for DC. This allows the high-speed pulses from the pulse generator
card to pass through to the output, while blocking DC from the SMU.
The inductors of an RBT function as low-impedance components for DC, and as high-impedance
components for high-speed pulses. This allows the DC bias from the SMU to pass through to the
output, while blocking the high-speed pulses from the pulse generator.
Figure 1-25
Block diagram of a PIV test system
Page 38

Section 1: Getting Started Model 4200-SCS User’s Manual
SCP2 (Oscilloscope)
Keithley Instruments offers two scope cards: 4200-SCP2HR and 4200-SCP2. However, only one
scope card at a time can be used in the 4200-SCS system.
The scope card is a modular, dual-channel, high-speed digital storage oscilloscope (DSO). It uses
a high-speed memory digitizer (DC to 700 MHz) and an embedded digital signal processor (DSP).
The scope card has two input channels to capture and analyze a variety of time-varying signals.
KScope, a soft front-panel software used to view pulse waveforms, is included with the
4200-SCP2HR and 4200-SCP2 (see the “How to Generate Basic Pulses” in Section 5 for details).
KScope provides full control of the DSO and allows export of waveform data that is compatible
with Microsoft
environments (for example, National Instruments LabVIEW™, Microsoft® Visual Basic
Microsoft
The primary differences between the two scope cards are ADC resolution and sample rate:
• 4200-SCP2HR: 16-bit resolution, single-channel sampling rate of 400-million samples per
second (400 MS / s)
• 4200-SCP2: 8-bit resolution, single-channel sampling rate of 2.5 billion samples per second
(2.5 GS / s)
®
Excel®. The plug-and-play drivers can be used in most application programming
® Visual C++®).
®, and
Basic pulse characteristics of the two scope cards are listed in Table 1-2. See the supplied ZTEC
User’s Manual for complete specifications of the scope card.
1
NOTE Refer to the Reference Manual, Pulse source-measure connections, page 11-38 for
details about scope card connectors and connections to DUT.
Table 1-2
Scope card characteristics
Scope card
characteristic
Dual channel Simultaneous sampling of both channels Simultaneous sampling of both channels
ADC resolution 16-bit 8-bit
Bandwidth 50 Ω : DC to 250 MHz
1 M Ω : DC to 125 MHz
Maximum input 50 Ω : ±5 V DC
1 M Ω : ±25 V DC
(derated 20 dB / decade above 10 MHz)
Coupling DC or AC DC or AC
AC coupling 50 Ω : 200 kHz high-pass
1 M Ω : 10 Hz high-pass
Probe attenuation 0.9 to 1000:1 0.9 to 1000:1
Analog filter N/A 20 MHz or bypass
Total memory Up to 1 M S per channel
Up to 2 M S per channel (1 channel interleaved)
Sample (S) rate 10 k S / s to 200 M S / s
10 k S / s to 400 M S / s (1 channel interleaved)
Acquisition time range 250 ns to 3355 s 50 ns to 419 s (2 M sample memory)
4200-SCP2HR (ZT410-50K) 4200-SCP2(ZT450-50K)
Specifications
50 Ω : DC to 1 GHz
1 M Ω : DC to 350 MHz
50 Ω : ±5 V DC
1 M Ω : ±150 V DC
(derated 20 dB / decade above 1 MHz)
50 Ω : 200 kHz high-pass
1 M Ω : 10 Hz high-pass
Up to 1 M S per channel
Up to 2 M S per channel (1 channel interleaved)
2.5 k S / s to 1.25 G S / s
2.5 k S / s to 2.5 G S / s (1 channel interleaved)
1. The ZTEC User’s Manual is on your Model 4200-SCS Complete Reference Product Information CD.
1-28 Return to Section Topics 4200-900-01 Rev. K / February 2017
Page 39

Model 4200-SCS User’s Manual Section 1: Getting Started
NOTE Specifications are subject to change; for the latest specifications, visit
www.ztecinstruments.com.
Scope card settings
The following information summarizes the most frequently used settings for the scope. For
detailed information about all scope settings.
Keithley Instruments user modules are used to control waveform acquisition operations of the
scope. New user modules can be created, or existing user modules can be modified (see the
Reference Manual, Keithley Interactive Test Environment (KITE), page 6-1, for details). For more
information about ZTEC, refer to the Model 4200-SCS Complete Reference, ZTEC User’s Manual.
Input impedance, input voltage range, and input voltage offset
Table 1-3 lists the input impedances, voltage ranges, and voltage offsets that can be set for each
input channel. As shown in the table, the setting for each of these parameters depends on the
settings of the other two parameters. For example, to select 50 Ω input impedance, range must
already be set to one of the eight ranges listed in the table for 50 Ω, and voltage offset must not be
set greater than ±10 V.
To avoid settings conflicts, first set voltage offset to 0 V, and then select the 10 V range. These
settings are compatible with both impedance settings. Now you can set impedance, range, and
then offset, in that order.
Table 1-3
Scope impedance, range, and offset settings
1M Ohm impedance 50 Ohm impedance
Model 4200-SCP2HR Model 4200-SCP2 Model 4200-SCP2HR Model 4200-SCP2
Range Offset Range Offset Range Offset Range Offset
50 V pp 0 V 100 V pp ±50 V 10 V pp 0 V 10 V pp ±5 V
25 V pp ±12.5 V 50 V pp ±25 V 5 V pp ±2.5 V 5 V pp ±2.5 V
10 V pp ±5 V 20 V pp ±10 V 2 V pp ±1 V 2 V pp ±1 V
5 V pp ±5 V 10 V pp ±5 V 1 V pp ±1 V 1 V pp ±0.5 V
2.5 V pp ±5 V 5 V pp ±2.5 V 0.5 V pp ±1 V 0.5 V pp ±0.25 V
1.25 V pp ±5 V 2.5 V pp ±1.25 V 0.25 V pp ±1 V 0.25 V pp ±0.125 V
0.5 V pp ±5 V 1 V pp ±0.5 V 0.1 V pp ±1 V 0.1 V pp ±0.05 V
0.25 V pp ±5 V 0.5 V pp ±0.25 V 0.05 V pp ±1 V 0.05 V pp ±0.025 V
——0.2 V pp±0.1 V ————
——0.1 V pp±0.05 V————
Input coupling
Input coupling, which is used to pass or block the DC component of an input signal, can be set to
AC or DC:
• DC coupling passes all frequencies
• AC coupling blocks low frequencies; with high-input impedance (1 M Ω) selected, AC
coupling attenuates frequencies below 10 Hz; with low input impedance (50 Ω) selected, AC
coupling attenuates frequencies below 200 kHz
4200-900-01 Rev. K / February 2017 Return to Section Topics 1-29
Page 40

Section 1: Getting Started Model 4200-SCS User’s Manual
Input filter
For the Model 4200-SCP2 scope, A 20 MHz low-pass analog filter can be applied to the input
signal of each channel. The 20 MHz setting applies the filter, and the bypass setting bypasses the
filter. The Model 4200-SCP2HR does not have the low-pass filter.
Input attenuation
The input signal for each channel can be attenuated by a factor of 0.9 to 1000.0.
Acquisition sample rate
The acquisition sample rate for the two input channels can be set in 1, 2.5, or 5 steps:
• 4200-SCP2HR: 10 kS/s to 200 MS/s (one interleaved channel can be sampled at 400 MS/s)
• 4200-SCP2: 2.5 kS/s to 1.25 GS/s (one interleaved channel can be sampled at 2.5 GS/s)
Sweep mode (triggering)
There are two sweep modes to trigger scope measurements: Normal or auto. In the normal mode,
an internal or external trigger (for example, trigger output from the Model 4205-PG2) is used to
trigger measurements. In the auto mode, triggering is provided automatically by the scope in the
absence of a trigger event.
For normal triggering, trigger initiation can be provided by internal and external sources. The
scope can be set to be triggered by a leading-edge or falling-edge trigger from the Model
4205-PG2. For more information about trigger and arm controls, refer to the Model 4200-SCS
Complete Reference, ZTEC User’s Manual.
Sweep offset reference
The offset reference determines when sampling occurs in relationship to the trigger event. Offset
reference can be set from 0.0 (0 %) to 1.0 (100 %). For the following examples, assume the record
size (sweep points) is 100 samples:
• Post-trigger sampling: With offset reference set to 0.0 (0 %), sampling of all 100 sweep
points will occur after the trigger event.
• Pre-trigger sampling: With offset reference set to 1.0 (100 %), sampling of all 100 sweep
points will occur before the trigger event.
• Pre-trigger and post-trigger sampling: With offset reference set to 0.5 (50 %), 50
samples will be acquired before the trigger event, and 50 samples will be acquired after the
trigger.
A sweep offset time can also be used to affect when sampling occurs.
Sweep offset time
The sweep offset time is the time period between the trigger event and the sweep offset reference.
Offset time can be set from 0 to 665 seconds. For the following examples, assume the record size
(sweep points) is 100 samples and offset time is set to 1 second:
• Delayed sampling from 0% offset reference: With offset reference set to 0.0 (0 %),
sampling for all 100 sweep points will start one second after the trigger event.
• Delayed sampling from 100% offset reference: With offset reference set to 1.0 (100 %),
all 100 samples will have been acquired at the “trigger plus on
e second” point in time.
• Delayed sampling from 50% offset reference: With offset reference set to 0.5 (50 %), 50
samples will have been acquired at the “trigger plus one second” point in time. Sampling will
continue for the other 50 sweep points.
1-30 Return to Section Topics 4200-900-01 Rev. K / February 2017
Page 41

Model 4200-SCS User’s Manual Section 1: Getting Started
Average type (acquisition)
There are four waveform acquisition types that can be set for the scope: Normal, average,
envelope, or equivalent time:
Normal: In normal mode, a single waveform is captured.
Average: In average mode, multiple captured waveforms are averaged.
Envelope: In envelope mode, the minimum and maximum waveform points from multiple
acquisitions are combined to form a waveform (an envelope) that shows min/max changes over
time.
Equivalent time: In equivalent time mode, a picture of a repetitive waveform is constructed by
capturing a small amount of information from each repetition. Because the points appear randomly
along the waveform, it is important to note that an entire waveform may not be constructed unless
there are sufficient repetitions. Unfilled points will be constructed using a zero-order hold and are
flagged with a “1” in the least significant bit (LSB) of the 16-bit waveform code. Also, the number of
points per point can be set using average equivalent time points to increase the resolution of the
waveform.
Average equivalent time points
When using the equivalent time acquisition mode, the number of user-defined points per point for
equivalent time sampling of a waveform can be set. Average equivalent time points can be set
from 2 to 100.
When using equivalent time sampling, any signal up to the analog bandwidth of the scope can be
acquired, regardless of the sample rate. The scope gathers the necessary number of samples
across several triggers. For more information about average equivalent time points command,
refer to the Model 4200-SCS Complete Reference, ZTEC User’s Manual.
Reference channels
Up to four waveforms can be stored in nonvolatile flash memory as reference channels. The
stored waveforms are retained when power is removed. These waveforms are limited to a record
size of 32K samples.
Calculate functions
The scope has two calculation channels to create new waveforms mathematically.
The following calculate functions can be performed:
•Add
• Subtract
• Multiply
•Copy
• Invert
• Integral
• Derivative
• Absolute Value
• Limit test
• Mask test
• Frequency transform
• Time domain transform
4200-900-01 Rev. K / February 2017 Return to Section Topics 1-31
Page 42

Section 1: Getting Started Model 4200-SCS User’s Manual
GNDU
S
E
N
S
E
F
O
R
C
E
C
O
M
M
O
N
The waveforms for a calculation can be input channels (2) and waveforms that are stored in
memory as reference channels (4). For more information about ZTEC, refer to the 4200-SCS
Complete Reference, ZTEC User’s Manual, Chapter 2.
Ground unit (GNDU)
Basic characteristics
The ground unit (see Figure 1-26) provides convenient access to circuit COMMON, which is the
measurement ground signal shared by all installed 4200-SCS instrumentation. In addition, the
GNDU SENSE terminal provides access to the SMU SENSE LO signals.
Figure 1-26
Ground unit
Basic ground unit characteristics are summarized in Table 1-4.
Table 1-4
Basic ground unit characteristics
Characteristic Description
Maximum current (FORCE triax connector) 2.6 A
Maximum current (COMMON binding post connector) 9 A
Maximum FORCE path/cable resistance 1 Ω
Maximum SENSE path/cable resistance 10 Ω
Basic circuit configurations
Ground unit connections
Figure 1-27 shows how the various GNDU signals are related to the SMU signals. Note that the
GNDU FORCE signal is circuit COMMON. The GNDU SENSE terminal is connected to each SMU
SENSE LO signal through a unique auto-sense resistor.
When the GNDU SENSE signal is connected to a DUT, all measurements will be made relative to
this DUT connection.
1-32 Return to Section Topics 4200-900-01 Rev. K / February 2017
Page 43

Model 4200-SCS User’s Manual Section 1: Getting Started
SENSE
FORCE
Ground Unit
50kW
COMMONCHASSIS
32V
max
Removable
Ground Link
Internal 4200-SCS connections
to each SMU SENSE LO signal
4200-SMU
or
4210-SMU
GNDU
SENSE LO
FORCE
SENSE
SENSE
FORCE
DUT
Figure 1-27
Ground unit
Ground unit DUT connections
Figure 1-28 shows the connections necessary to use the GNDU in conjunction with a SMU to
make full-Kelvin remote sense measurements. Similarly, Figure 1-29 includes the preamp.
As shown in these figures, the GNDU FORCE signal provides the return path for SMU or preamp
FORCE current. For detailed information about the ground unit, SMU, and preamp connections,
refer to the Reference Manual, Basic source-measure connections, page 4-3.
Figure 1-28
Full-Kelvin SMU/ground unit connections
4200-900-01 Rev. K / February 2017 Return to Section Topics 1-33
Page 44

Section 1: Getting Started Model 4200-SCS User’s Manual
4200-SMU
or
4210-SMU
GNDU
SENSE LO
FORCE
SENSE
FORCE
SENSE
4200-PA
FORCE
SENSE
DUT
Note: Not used when
PreAmp is attached.
Figure 1-29
Full-Kelvin preamp/ground unit connections
Ground unit terminals and connectors
The locations and configuration of the GNDU terminals are shown in Figure 1-26. Basic
information about these connectors is summarized below. For more information about ground unit
signal connections, refer to the Reference Manual, Basic source-measure connections, page 4-3.
CAUTION The maximum allowed voltage between circuit COMMON and chassis
ground is ±32 V DC.
FORCE terminal
The FORCE terminal is a standard triaxial connector used as a return path for the SMU or preamp
FORCE current.
• The center pin is FORCE
• The inner shield is GUARD
• The outer shield is circuit COMMON
NOTE The ground unit FORCE and GUARD signal terminals are connected to circuit
COMMON.
1-34 Return to Section Topics 4200-900-01 Rev. K / February 2017
Page 45

Model 4200-SCS User’s Manual Section 1: Getting Started
INSTRUMENT
CONNECTIONS
SMU ONLY
SMU AND GNDU
GNDU
SLOT
8
S
E
N
S
E
F
O
R
C
E
C
O
M
M
O
N
SENSE LO
GUARD
SENSE LO
COMMON
COMMON
FORCE
SENSE
GUARD
Chassis (Earth) Ground
SENSE terminal
The SENSE terminal is a standard triaxial connector used to apply the ground unit SENSE signal
to the DUT in a remote sense application.
• The center pin is SENSE
• The inner shield is GUARD
• The outer shield is circuit COMMON
When the ground unit SENSE signal is connected to a DUT, all SMU/preamp measurements will
be made relative to this DUT connection.
COMMON terminal
The COMMON terminal is a binding post that provides access to circuit COMMON.
NOTE Normally, a link is connected between ground unit COMMON and chassis ground,
but it may be necessary to remove the link to avoid measurement problems caused
by ground loops or electrical interference. Refer to the Reference Manual,
Interference, page 5-25 for details.
Chassis ground
This binding post provides a convenient connecting point to system chassis ground for the
purpose of shielding a test fixture.
Figure 1-30
Chassis ground
4200-900-01 Rev. K / February 2017 Return to Section Topics 1-35
Page 46

Section 1: Getting Started Model 4200-SCS User’s Manual
HI
Guard
Common
HI
Guard
Common
DUT
Interlock
Test Fixture
SMU1
SMU2
Connect to safety earth
ground using #18 AWG
wire or larger
Connecting DUTs
Test fixtures
There are two types of test fixtures for the 4200-SCS:
• Low-voltage fixtures (less than ±20 V) and high-voltage (greater than ±20 V).
• High-voltage fixtures require extra precautions to ensure there are no dangerous shock
hazards.
WARNING To avoid exposure to high voltages that could result in personal injury or
death, whenever the interlock of the Mo del 42 00 - S CS is as se rte d , the FO RCE
and GUARD terminals of the SMUs and preamps should be considered highvoltage, even if they are programmed to a non-hazardous volt age current.
Testing with less than ±20 V with SMUs
A test fixture equipped with three-lug triax connectors is necessary to connect the 4200-SCS
discrete device for testing. Figure 1-31 shows a basic test fixture to use with a two-terminal device.
For best performance when testing with less than ±20 V follow these standard industry practices:
• Use a metal test fixture
• Connect the metal fixture to COMMON
• Mount the DUT on high-resistivity terminals (for example, Teflon)
• Guarding will reduce leakage and parasite capacitance that degrades measurement quality
The Keithley Instruments Low Level Measurements Handbook provides an in-depth discussion
about guarding and other techniques that are useful for building quality test fixtures.
Contact a Keithley Instruments sales or service office to obtain a copy.
Figure 1-31
Typical test fixture
1-36 Return to Section Topics 4200-900-01 Rev. K / February 2017
Page 47

Model 4200-SCS User’s Manual Section 1: Getting Started
NOTE The 4200-SCS will function on all current ranges and up to ±20 V without the
interlock being asserted. The maximum voltage on the SMU and preamp terminals is
not hazardous when the interlock is not asserted.
Testing with more than ±20 V
If voltages greater than ±20 V are required for testing, follow these steps:
• Ensure that hazardous voltages are not present when the fixture’s exterior enclosure is
open.
NOTE The 4200-SCS voltage output will be higher when the fixture’s exterior enclosure is
closed.
• Add an interlock switch to the fixture.
• Connect the exterior enclosure to COMMON or safety ground using #18AWG wire or
greater.
• Ensure that the wiring (FORCE, GUARD, and SENSE) within the fixture does not contact
the exterior enclosure.
For more details about the 4200-SCS interlock system, see the Reference Manual, Control and
data connections, page 4-20.
CAUTION Asserting the interlock will allow the SMU and preamp terminals to
become hazardous, possibly exposing the user to high-voltage that could
result in personal injury or death.
SMU and preamp terminals should be considered hazardous even if the
outputs are programmed to be low voltage.
Precautions must be taken to prevent a shock hazard by surrounding the
test device and any unprotected leads (wiring) with double insulation for
250 V, Category I.
Probers
To learn how probe stations are controlled by 4200-SCS through user modules, refer to the
Reference Manual, Using a Probe Station, Appendix G.
Advanced connections
To learn more about advanced connections for controlling a switch matrix, sequencing test on
multiple devices, and customizing a user test module (UTM) refer to the Reference Manual,
Advanced Applications, Appendix O.
4200-900-01 Rev. K / February 2017 Return to Section Topics 1-37
Page 48

Section 1: Getting Started Model 4200-SCS User’s Manual
How to run a basic test
Boot the system and log in
To boot the system and log in:
1. Make sure the power switch is in the O (out) position. The POWER switch is located on the
front panel in lower right-hand corner.
2. Plug the male end of the line cord into a properly grounded AC line power receptacle.
3. Turn on the Model 4200-SCS by pushing in the POWER switch to the I (in) position.
4. When prompted, simultaneously press Ctrl + Alt + Del.
5. At the KIUSER prompt, press ENTER. There is no password for this account.
CAUTION When first starting a KTE-Interactive software tool, you must answer
“YES” to an on-screen license agreement. Answering “No” makes your
system nonfunctional until you reinstall the software.
Open KITE
To start KITE, open the default project, and select the vds-id test:
1. Start KITE by double-clicking the KITE icon on your Microsoft Windows
2. When KITE starts, the default project will open automatically if it has been set as the default
project. The vds-id test will be opened in the Definition tab (see Figure 1-33).
3. If a different project opens, perform the three steps in Figure 1-34 to open the default
project. The project navigator for the default project is shown in Figure 1-33.
NOTE If the project navigator is not displayed when KITE is started, click the View menu
and select the Project Navigator item. The View menu is at the upper left side of the
KITE window. For more information about the project navigator, refer to the
Reference Manual, Project Navigator, page 6-12.
To open a KITE default project, follow the steps in Figure 1-32.
®
desktop.
1-38 Return to Section Topics 4200-900-01 Rev. K / February 2017
Page 49

Model 4200-SCS User’s Manual Section 1: Getting Started
1. From the
File menu,
click Open
Project.
2. Use the
browser to
select the
default project.
3. Click Open to
open the “default”
project.
From your windows browser, use the following
directory path to locate the default.kpr project
file: C:\S4200\kiuser\projects\default.
Figure 1-32
Default project directory
4200-900-01 Rev. K / February 2017 Return to Section Topics 1-39
Page 50

Section 1: Getting Started Model 4200-SCS User’s Manual
Project Navigator
Message Area
Too lba r
KITE Workspace
Selected Test
vds-id test will be
selected by default,
and the Definition tab
will display the test
options.
Double click the vds-id test
icon, and the test Definition
tab as shown in Figure 1-33 is
displayed.
The checkbox for vds-id must be
checked in order to run the test.
If unchecked, click the checkbox
to insert a 4.
Figure 1-33 is an example of the KITE interface default project with the vds-id test selected.
Figure 1-33
KITE interface default project shown with vds-id test selected
Locate and run the vds-id test module
To locate the vds-id test module go to the project navigator as shown in Figure 1-34.
Figure 1-34
Interactive Test Module vds-id
1-40 Return to Section Topics 4200-900-01 Rev. K / February 2017
Page 51

Model 4200-SCS User’s Manual Section 1: Getting Started
Click to set up SMU2
Click to set up SMU3
Click to set up SMU1
Click to set up GNDU
Test definition
The test is defined from the test Definition tab shown in Figure 1-35. As shown in the Definition tab,
the device is connected to three SMUs and one Ground Unit (GNDU). In general, SMU3 is used as
a voltage step function to provide four different gate voltages (2V, 3V, 4V, and 5V). SMU2 is used
to perform a 51 point sweep of drain voltage (0V to 5V) at each gate voltage. A current
measurement is performed at each voltage sweep point.
To define a test:
1. The setup for SMUs and the GNDU can be changed. A settings window is displayed by
clicking the appropriate force measure bar as shown in Figure 1-35.
Figure 1-35
Vds-id Definition tab - How to display a setup window for SMUs and GNDU
2.Figure 1-36 shows the settings dialog box for SMU3. The settings dialog box for the other
SMUs and GNDU are similar.
4200-900-01 Rev. K / February 2017 Return to Section Topics 1-41
Page 52

Section 1: Getting Started Model 4200-SCS User’s Manual
Click to set up
Click to set up
Click to set up
Click to set up
These parameters set
the gate voltage steps:
2V, 3V, 4V, and 5V.
If you make any changes to
the SMU3 setup, click OK to
enter the changes and close
the window.
Figure 1-36
Setup for SMU3
3. After making any changes to the test definition, click Save All on the toolbar to save
the settings.
Run vds-id test
In the project navigator (see Figure 1-34), make sure the vds-id test is highlighted and the
checkbox is checked.
On the toolbar, click the green Run Test button to run the test one time.
NOTE While the test is running, the Run Test button turns gray and the Abort Test button
turns red . Also, the ACTIVE indicator light (located on the lower right-hand
corner of the front panel of the 4200-SCS will be on while the test is running. When
the test is finished, the Run test button turns green.
View and save the sheet data
View data sheet for the vds-id test is displayed by clicking the Sheet tab for the test. Use the tabs
at the bottom of the Sheet to display the data type. A sample data sheet for the vds-id test is
shown in Figure 1-37.
The data sheet for the vds-id test is displayed by clicking the Sheet tab.
1-42 Return to Section Topics 4200-900-01 Rev. K / February 2017
Page 53

Model 4200-SCS User’s Manual Section 1: Getting Started
Click to export data**
Click to display
Data sheet*.
Click to display Calc sheet*.
Click to display Settings sheet*.
Figure 1-37
Sample data sheet for vds-id test
* To select more than one sheet for selective printing, hold down the Ctrl key and then click the
tab.
** The data is saved as a Microsoft® Excel® ( *.xls ) document.
To save the Data sheet:
1. In the KITE workspace, click the Sheet tab to display the test data.
2. In the Sheet tab, click the Save As button as shown in Figure 1-37.
3. From the Save As dialog box, specify a file name and path, and click Save.
NOTE The default directory path for exporting data is C:\S4200\kiuser\export.
View and save the graph data
The graph for the vds-id test is displayed by clicking the Graph tab for the test. A sample graph for
the vsd-id test is shown in Figure 1-38. As shown, there are four I-V curves - one for each gate
voltage. The graph was customized to include the Legend box and use different colors for the
graph series. The Graph Settings menu (shown in Figure 1-39) was used to select the Legend box
and change series colors. For more Graph tab information Refer to the Reference Manual,
Viewing ITM or UTM results graphically: The Graph tab, page 6-23.
4200-900-01 Rev. K / February 2017 Return to Section Topics 1-43
Page 54

Section 1: Getting Started Model 4200-SCS User’s Manual
To display the Graph Settings menu: Right-mouse
click anywhere in the graph area*.
OR
From the Tools menu, select Graph Settings.
Click to select ( 3 ) Legend Box.
Click Graph Properties and then
Series to change the properties
for each of the four series.
Figure 1-38
Sample graph for vds-id test
In Figure 1-38 you can see that the line colors, line patterns, plot symbols, and line widths are
different. To learn how to define the graph line properties see Figure 1-39 below.
Figure 1-39
Graph settings menu
* To learn more about Data Series Properties refer to the Reference Manual, Defining the plot
properties of the graph: colors, line patterns, symbols, line widths, page 6-223.
1-44 Return to Section Topics 4200-900-01 Rev. K / February 2017
Page 55

Model 4200-SCS User’s Manual Section 1: Getting Started
1
2
Firmware upgrade
When the system software is updated, you should upgrade firmware for each 4200-SCS
instrument. Before starting the firmware upgrade, make sure the 4200-SCS is powered by an
uninterruptable power source (see warning). Refer to the release notes for detailed instructions on
the firmware upgrade of 4200-SCS instruments including the specific versions required for each
instrument. See “Accessing the release notes” on page 1-46 for more information.
WARNING Make sure to power the 4200-SCS with an uninterruptable power supply
during the firmware upgrade process. This is important because an
interruption of the firmware upgrade proce ss may damage an instru ment card.
To upgrade the firmware, run the upgrade utility from a command prompt:
Figure 1-40
Graph settings menu
1. Click the Windows start button (1).
2. Type cmd in the search box (2) and press the Enter key. A command window will open.
3. At the command prompt, type fwupgrade, and then press the Enter key.
Figure 1-41 shows the first screen of the utility as well as the warning screen. Note that each
instrument card type will be upgraded separately.
Figure 1-41
Firmware upgrade utility dialog windows
4200-900-01 Rev. K / February 2017 Return to Section Topics 1-45
Page 56

Section 1: Getting Started Model 4200-SCS User’s Manual
Accessing the release notes
You can access the release notes by clicking on the Complete Reference icon on the 4200-SCS
desktop (refer to Figure 1-42), and then clicking the Release Notes link (see the arrow in Figure
1-43).
Figure 1-42
Model 4200-SCS complete reference icon.
Figure 1-43
Complete reference home page
1-46 Return to Section Topics 4200-900-01 Rev. K / February 2017
Page 57

Model 4200-SCS User’s Manual Section 2: Model 4200-SCS Software Environment
Section 2
Model 4200-SCS Software Environment
In this section:
Topic Page
Understanding KITE . . . . . . . . . . . . . . . . . . . . . . . . . . . . . . . . . . 2-3
KITE project structure . . . . . . . . . . . . . . . . . . . . . . . . . . . . . . . . . 2-3
KITE interface . . . . . . . . . . . . . . . . . . . . . . . . . . . . . . . . . . . . . . . . . . . . 2-3
Graphical User Interface . . . . . . . . . . . . . . . . . . . . . . . . . . . . . . . . . 2-4
Project navigator . . . . . . . . . . . . . . . . . . . . . . . . . . . . . . . . . . . . . . . . . 2-5
Project defined . . . . . . . . . . . . . . . . . . . . . . . . . . . . . . . . . . . . . . . . . . . 2-6
Project components . . . . . . . . . . . . . . . . . . . . . . . . . . . . . . . . . . . . . . . 2-7
Sites . . . . . . . . . . . . . . . . . . . . . . . . . . . . . . . . . . . . . . . . . . . . . . . . . . 2-7
Subsites . . . . . . . . . . . . . . . . . . . . . . . . . . . . . . . . . . . . . . . . . . . . . . . 2-7
Devices . . . . . . . . . . . . . . . . . . . . . . . . . . . . . . . . . . . . . . . . . . . . . . . 2-7
Tests . . . . . . . . . . . . . . . . . . . . . . . . . . . . . . . . . . . . . . . . . . . . . . . . . . 2-7
ITMs versus UTMs . . . . . . . . . . . . . . . . . . . . . . . . . . . . . . . . . . . . 2-8
Defining an ITM . . . . . . . . . . . . . . . . . . . . . . . . . . . . . . . . . . . . . . . . . . . 2-10
Defining a UTM . . . . . . . . . . . . . . . . . . . . . . . . . . . . . . . . . . . . . . . . . . . 2-11
How to create your own ITMs . . . . . . . . . . . . . . . . . . . . . . . . . . . 2-13
Understanding the ITM definition tab . . . . . . . . . . . . . . . . . . . . . . . . . 2-13
Understanding the ITM forcing functions . . . . . . . . . . . . . . . . . . . . . 2-13
Understanding dual sweep . . . . . . . . . . . . . . . . . . . . . . . . . . . . . . . . . 2-15
Understanding pulse mode . . . . . . . . . . . . . . . . . . . . . . . . . . . . . . . . . 2-16
How to use the definition tab to configure ITM parameters . . . . . . . 2-17
Match the physical and virtual connections: . . . . . . . . . . . . . . . . . 2-17
Configuring forcing functions for each device terminal . . . . . . . . 2-17
Configuring pulse mode . . . . . . . . . . . . . . . . . . . . . . . . . . . . . . . . . 2-20
Basic test execution . . . . . . . . . . . . . . . . . . . . . . . . . . . . . . . . . . 2-21
Project navigator check boxes . . . . . . . . . . . . . . . . . . . . . . . . . . . . . . 2-21
Tests (ITMs and UTMs) . . . . . . . . . . . . . . . . . . . . . . . . . . . . . . . . . . . 2-21
Device plan . . . . . . . . . . . . . . . . . . . . . . . . . . . . . . . . . . . . . . . . . . . . 2-22
Subsite plan . . . . . . . . . . . . . . . . . . . . . . . . . . . . . . . . . . . . . . . . . . . 2-22
Initialization and termination steps . . . . . . . . . . . . . . . . . . . . . . . . . 2-22
Project plan . . . . . . . . . . . . . . . . . . . . . . . . . . . . . . . . . . . . . . . . . . . . 2-22
Executing an individual test . . . . . . . . . . . . . . . . . . . . . . . . . . . . . . . . 2-22
Selecting a test . . . . . . . . . . . . . . . . . . . . . . . . . . . . . . . . . . . . . . . . . 2-22
Running the test . . . . . . . . . . . . . . . . . . . . . . . . . . . . . . . . . . . . . . . . 2-23
How to display and manage test results . . . . . . . . . . . . . . . . . . 2-24
Data file management . . . . . . . . . . . . . . . . . . . . . . . . . . . . . . . . . . . . . 2-24
Using file and test-result directories . . . . . . . . . . . . . . . . . . . . . . . 2-24
Default user director: C:\S4200\kiuser . . . . . . . . . . . . . . . . . . . . . . 2-24
Devices subdirectory . . . . . . . . . . . . . . . . . . . . . . . . . . . . . . . . . . . . 2-25
Understanding device libraries . . . . . . . . . . . . . . . . . . . . . . . . . . . . 2-25
How to create and add a new device . . . . . . . . . . . . . . . . . . . . . . . 2-27
Projects subdirectory . . . . . . . . . . . . . . . . . . . . . . . . . . . . . . . . . . . . 2-28
Tests subdirectory . . . . . . . . . . . . . . . . . . . . . . . . . . . . . . . . . . . . . . 2-29
Usrlib subdirectory . . . . . . . . . . . . . . . . . . . . . . . . . . . . . . . . . . . . . . 2-31
System directory: C:\S4200\sys . . . . . . . . . . . . . . . . . . . . . . . . . . . 2-31
How to manage numeric test results in Sheet tab . . . . . . . . . . . . . . 2-31
Displaying and analyzing data using Sheet tab . . . . . . . . . . . . . . . 2-31
4200-900-01 Rev. K / February 2017 Return to Section Topics 2-1
Page 58

Section 2: Model 4200-SCS Software Environment Model 4200-SCS User’s Manual
Opening a Sheet tab . . . . . . . . . . . . . . . . . . . . . . . . . . . . . . . . . . . . .2-32
Understanding and using the Data worksheet of a Sheet tab . . . . 2-34
Understanding the formula box of the Data worksheet . . . . . . . . .2-34
Understanding the data-source identifier . . . . . . . . . . . . . . . . . . . .2-35
Saving a worksheet . . . . . . . . . . . . . . . . . . . . . . . . . . . . . . . . . . . . . .2-35
How to manage graphical test results in the Graph tab . . . . . . . . . .2-38
Opening a Graph tab . . . . . . . . . . . . . . . . . . . . . . . . . . . . . . . . . . . . .2-38
Accessing the Graph tab windows . . . . . . . . . . . . . . . . . . . . . . . . .2-39
Opening the graph settings menu . . . . . . . . . . . . . . . . . . . . . . . . . .2-39
Understanding the graph settings menu . . . . . . . . . . . . . . . . . . . .2-40
Defining data to be graphed . . . . . . . . . . . . . . . . . . . . . . . . . . . . . . .2-42
Understanding table columns in the Graph Definition window . .2-42
Understanding buttons in the Graph Definition window . . . . . . . .2-43
Opening and using the Graph Definition window . . . . . . . . . . . . .2-43
KITE library management . . . . . . . . . . . . . . . . . . . . . . . . . . . . . .2-45
Submitting devices, ITMs, and UTMs to libraries . . . . . . . . . . . . . . .2-45
Submitting devices to a library . . . . . . . . . . . . . . . . . . . . . . . . . . . .2-45
Submitting tests to a library . . . . . . . . . . . . . . . . . . . . . . . . . . . . . . . .2-48
2-2 Return to Section Topics 4200-900-01 Rev. K / February 2017
Page 59

Model 4200-SCS User’s Manual Section 2: Model 4200-SCS Software Environment
Understanding KITE
The Keithley Interactive Test Environment (KITE) is the main software component of the KTE
Interactive software tool set. KITE is the primary user interface for the Keithley Instruments Model
4200 Semiconductor Characterization System (SCS). KITE is a versatile tool that facilitates
interactive characterization of an individual parametric test device or automated testing of an entire
semiconductor wafer.
Two additional KTE Interactive software tools augment the capabilities of KITE:
• Keithley User Library Tool (KULT): Used to create test modules, using the C programming
language. These test modules can then be executed by KITE.
• Keithley CONfiguration utility (KCON): Used to manage the configuration and
interconnections between all of the test system components that are controlled by KITE.
A fourth KTE Interactive software tool, the Keithley External Control Interface (KXCI) allows the
Model 4200-SCS to be controlled remotely by an external GPIB controller.
NOTE KXCI and KITE, cannot run simultaneously.
Beginning with KTE Interactive 6.0, two optional KTE Interactive tools have been added:
• Keithley Pulse tool (KPulse): A virtual front panel software application used to control the
optional pulse generator cards. The dual-channel pulse generator cards are integrated
inside the Model 4200-SCS mainframe.
• Keithley Scope tool (KScope): A virtual front panel software application used to control
the optional scope card. The scope card is a dual-channel digital storage oscilloscope that
is integrated inside the Model 4200-SCS mainframe.
Model 4200-SCS Software Environment
Section 2
NOTE Although KScope and KPulse can be launched at the same time as KITE, KScope /
KPulse and KITE cannot communicate with hardware simultaneously.
KITE project structure
This subsection overviews the primary features of KITE. These features allow you to create,
execute, and evaluate tests and complex test sequences, interactively and without programming.
This subsection also overviews use of an essential companion tool, KULT, which allows you to
create libraries of specialized user test modules (UTMs) that run in KITE (KULT is discussed in
detail in the Reference Manual, Keithley User Library Tool (KULT), page 8-1.
KITE interface
The KITE application consists of a variety of graphical user interfaces (GUIs) that allow you
to do the following:
• Customize existing / supplied interactive test modules (ITMs) or create new ITMs from
existing templates.
• Create UTMs from supplied or user-programmed C-code modules.
• Automatically execute tests and associated operations (switch matrix connections, prober
movements, and so on), including:
• A single test for one selected device (transistor, diode, resistor, and so on).
• A sequence of tests for one selected device.
• A sequence of tests for multiple devices, for example, all of the devices contacted by a
prober at a given touchdown or subsite location on a semiconductor wafer.
4200-900-01 Rev. K / February 2017 Return to Section Topics 2-3
Page 60

Section 2: Model 4200-SCS Software Environment Model 4200-SCS User’s Manual
12 4 53
67
• A sequence of tests for an entire project plan, which may include multiple prober
touchdowns for a single semiconductor site (or die):
– For one site
– For multiple sites
• View test results numerically and graphically.
• Analyze test results using built-in parameter extraction tools.
• View the analysis results numerically and graphically.
• Interactively build and edit test / execution sequences using the project navigator.
Graphical User Interface
Figure 2-1 shows the KITE GUI interface. The parts of the GUI are summarized below the figure.
Figure 2-1
KITE interface overview
2-4 Return to Section Topics 4200-900-01 Rev. K / February 2017
Page 61

Model 4200-SCS User’s Manual Section 2: Model 4200-SCS Software Environment
KITE interface descriptions:
1. Project navigator Where a project plan is assembled, edited, displayed, and executed A project plan
defines a series of tests, of various devices, at one or more locations. Double-clicks
here open the definition, configuration, and tool screens. A selection here defines
the starting location when only part of the project plan is to be executed.
2. Site navigator Displays the current site. Typically a die on a semiconductor wafer that is being
evaluated by the project plan. Allows selection of the single site to be evaluated
when only part of the project plan is to be executed. A unique ITM / UTM test
window and data exists for each different site.
3. Menu area Provides choice of icons to select KITE functions.
4. KITE workspace Displays the variety of screens, windows, tabs, message boxes, and so on:
• Configure all project plan components
• Observe evaluation results
• Analyze evaluation results.
5. Toolbar area Displays a variety of icons that can be used to:
• Start and stop all or part of a project plan
• Verify project plan execution
• Insert project plan components
• Save and print project plan files
• View KITE help.
6. Message area Displays KITE error, warning, and execution messages.
7. Status bar Displays descriptions of menu and toolbar items.
Project navigator
The project navigator is the primary interface for building, editing, viewing, specifying, and
accessing project plan components:
• Each project plan component may be added, sequentially or nonsequentially using menu
items or toolbar buttons.
• Single-clicking a navigator component selects it as one of the following:
– A location where a new component may be added or an existing component may be
deleted.
– An individual test, device, or series of devices for which only part of the project plan
may be executed.
• Double-clicking a project navigator component opens access to configuration screens for
the component and, as appropriate, test results, analysis tools, and status information.
Figure 2-2 describes typical project plan components that are displayed in a project navigator,
using the example project plan for illustration. Subsection ITMs versus UTMs on page 2-8
describes the ITM and UTM components in more detail.
For details about building a project plan using the project navigator, refer to the Reference Manual,
Building, modifying, and deleting a Project Plan, page 6-48.
4200-900-01 Rev. K / February 2017 Return to Section Topics 2-5
Page 62

Section 2: Model 4200-SCS Software Environment Model 4200-SCS User’s Manual
Project plan:
• Defines and sequences all subsites to be tested.
• This node allows resequencing of all subsite nodes.
• There is only one
project plan per KITE project.
Subsite plan:
• Defines and sequences all device plans to be tested.
• This node allows resequencing of all device nodes.
Device plan:
• Defined and sequences all tests for a specific device.
• This node allows resequencing of all tests.
Interactive test module (ITM):
• A graphical test definition that requires no programming.
• All test definition, data, and graphing is located here.
• Can be used for all instrumentation internal to the 4200.
User test module (UTM):
• A test definition that is a call into user module written in C.
• All test definition, data, and graphing is located here.
• Can be used for all instrumentation internal and external to the
4200.
• Typically used for switch-matrix connections, prober control, and all
other external GPIB and Ethernet instruments.
Initialization and Termination Steps:
A special UTM that can be run just like any other UTM, however, during
looping, these nodes are called only once at the beginning (Init Steps) or
at the end (Term Steps) of a test looping sequence.
Device unique ID number (UID):
A number assigned to each instance of a same-named project component (for example: ITM, UTM, Device, or Subsite node) and only once
per KITE Project.
NOTE If UID=0, this means that this component can occur only once.
Project navigator check boxes:
These are used to enable and disable each project node and all
of its children. If a particular project node is unchecked, the
project run button will be grayed / disabled and this particular
project node cannot be executed.
Figure 2-2
Project navigator
2-6 Return to Section Topics 4200-900-01 Rev. K / February 2017
Page 63

Model 4200-SCS User’s Manual Section 2: Model 4200-SCS Software Environment
Project defined
Users interact with KITE in the context of project. A project specifies the start-to-finish, repetitive
and nonrepetitive actions and test locations involved in evaluating a semiconductor wafer (or other
collection of circuits). Projects are both created and executed using the KITE GUI.
NOTE Refer to Project plan later in this section. The term “project” is sometimes used to
refer to a “project plan.”
Project components
Because KITE is most valuable for automatic characterization of semiconductor wafers, KITE
projects are organized in a manner consistent with the organization of a modern semiconductor
wafer. A project visits and evaluates locations on the wafer in the following logical hierarchy:
•Project
• Sites (Virtual, can be switched using the Sites Navigator)
• Subsites
• Devices
• Tests
These are the primary components of a project. Two other components, initialization steps and
termination steps, are discussed in the Reference Manual, Project structure, page 6-39. These
components are defined in the next subsections.
Sites
At the macroscopic level, one or more semiconductor dies are built up at a given wafer location.
This location is comprised not only of end product dies, but usually has one or more parametric
test structures or subsites. KITE refers to such a repeating pattern of dies and test structures as a
“site.”
NOTE In KITE, sites can be switched using the site navigator. All KITE sites have the same
subsite, device, and test definitions, and are not repeated in the Project Tree.
Subsites
The terminals of each device on a test structure are connected to a uniformly-spaced series of
contact pads. These pads are used to connect the devices to the probes of a prober. Any single
wafer location that the prober moves to and contacts is called a “subsite” (sometimes referred to
as a test element group (TEG)).
The Model 4200-SCS hardware / KITE software combination was optimized to evaluate test
structures, though it can be effectively used to evaluate dies and discrete components. KITE refers
to each such test structure (or combination of test devices that are tested as a group) as a subsite.
Devices
As described in context under Sites, each test structure contains a series of devices to be
characterized: Transistors, diodes, resistors, capacitors, and so on. A switch matrix is used to
connect the Model 4200-SCS sequentially if the SMUs cannot be connected to all devices
simultaneously.
A “device” is also referred to as a test element, because subsites are often referred to as test
structures or test element groups (TEGs), which are composed of devices.
4200-900-01 Rev. K / February 2017 Return to Section Topics 2-7
Page 64

Section 2: Model 4200-SCS Software Environment Model 4200-SCS User’s Manual
Tests
Once the device is in position, KITE automatically conducts one or more specified tests for each
device on the test structure. Each test generates data and, if desired, parametric curves. A test
includes the following for each terminal of a device:
• The desired voltage or current forcing functions (stimuli).
• The desired voltage or current measurements.
• The associated data analyses and parameter extractions.
The combination of forcing functions and measurements is referred to as the “test definition.”
There are two classes of tests or test modules in KITE: ITMs and UTMs. Both ITMs and UTMs
share common data analysis functions, such as a Microsoft
real-time graph tool.
Key differences between ITMs and UTMs include:
• Interactive test module (ITM): An ITM allows the you to define a test interactively using a
GUI and no coding.
• User test module (UTM): A UTM is defined through C programming of its connected KULT
created user module, but allows the user to configure key test parameters using a GUI.
ITMs versus UTMs
KITE tests and operations are performed through ITMs and UTMs, as shown in Figure 2-2. Figure
2-3 shows the location of the configuration windows of the vds-id ITM and the res_drain-to-
source UTM to their respective locations in the example KITE project plan.
These windows and some associated windows are examined in more detail in the next two
subsections, Defining an ITM, and Defining a UTM.
The primary differences between ITMs and UTMs are summarized in Table 2-1.
Table 2-1
Primary differences between an ITM and a UTM
Is always configured using a series of systematic,
interactive GUIs, without programming.
Is flexible. Keithley Instruments provides default
ITM configurations for most standard devices and
tests; you can perform many of your evaluations
with no changes (or very few) to the default
parameters. However, you can create a new ITM,
or customize any existing ITM, to perform a wide
variety of static and dynamic evaluations. You can
even create an ITM for a generic “n-terminal”
device.
Performs exclusively tasks on internal 4200-SCS
instrumentation.
Is used exclusively for parametric testing. May be used to perform almost any test-related task.
Generated data updates the Data worksheet
real time, as the test executes.
a. The pulse generator card (4205-PG2) and scope card (4200-SCP2 or 4200-SCP2HR) are not supported by ITMs.
b. Refer to the Reference Manual, Viewing ITM or UTM results numerically: The Sheet tab Data worksheet, page 6-21.
®
Excel®-compatible data sheet and a
ITM UTM
Is created and configured by connecting the UTM
name to a user module and entering or modifying the
input parameter values.
Is task-specific. However, you can modify the source
code for a user module that is connected to a UTM
and recompile it to create a new user module. Keithley
Instruments provides the source code for most of the
user modules that are shipped with the 4200-SCS.
User modules are modified using KULT.
a
b
in
Performs tasks on internal 4200-SCS instrumentation
and external instrumentation that is connected to the
4200-SCS IEEE-488 bus or the 4200-SCS RS-232
port.
Generated data updates the Data worksheet after test
execution is complete.
2-8 Return to Section Topics 4200-900-01 Rev. K / February 2017
Page 65

Model 4200-SCS User’s Manual Section 2: Model 4200-SCS Software Environment
ITM
UTM
Figure 2-3
ITMs and UTMs in the project navigator
Defining an ITM
An ITM is defined by the ITM definition tab (displayed by double-clicking the ITM name in the
project navigator) illustrates and explains the ITM definition tab (Figure 2-4 defines the vds-id
ITM, one of the ITMs in the example project plan shown in Figure 2-2 and Figure 2-3). See
Reference Manual, Specifying environment preferences, page 6-338.
4200-900-01 Rev. K / February 2017 Return to Section Topics 2-9
Page 66

Section 2: Model 4200-SCS Software Environment Model 4200-SCS User’s Manual
Timing button and Speed box:
Custom and preconfigured testtiming / noise-rejection selections.
Mode box:
Allows sampling vs. time
mode instead of sweeping
mode.
Schematic of the device
being tested by this ITM.
Workspace window tab:
When workbook mode is enabled (per Reference Manual,
Specifying environment preferences, page 6-338), each project-plan
component window that is active in the KITE workspace can be
accessed quickly by selecting its Workspace window tab.
Exit Conditions button:
Click to set the test exit
conditions.
Output Values button:
Click to set export Output
Values for this test to the
Subsite data sheet.
Instrument-selection box:
Assigns a Model 4200-SCS
instrument to this device terminal.
FORCE MEASURE button:
Click to configure the selected
instrument.
Instrument object: Displays a
summary of the settings for the
instrument object.
Formulator: Mathematical
test results analysis tool.
Sheet tab: Numerical test and
analysis results and test settings.
Graph tab: Graphical
test and analysis results.
Status tab: Test definition
and configuration status.
Tes t No tes tab:
Type in notes about
the project.
Figure 2-4
ITM definition tab
Defining a UTM
For details about defining and configuring an ITM, refer to the Reference Manual, Configuring the
Project Plan ITMs, page 6-86.
This section covers general information about defining a UTM. For specific information about KITE
projects which use either ITM or UTMs, see Reference Manual, KITE projects, page 6-5.
A UTM is defined using the UTM definition tab (displayed by double-clicking the UTM name in the
project navigator). Figure 2-5 and Figure 2-6 illustrate and explain the two versions of the UTM
definition tab. Figure 2-5 defines the PMU-1Ch-Wfm UTM in the PMU-DUT-Examples project. The
PMU-DUT-Examples project has several UTMs for use with the Model 4225-PMU Dual Channel
Pulse I-V instrument card.
Figure 2-5 illustrates the classic view (table-based) version of the of the UTM definition; Figure 2-6
shows the GUI view. The GUI view does not change the operation of the UTM or the overall
project execution. The GUI view (Figure 2-6) uses a variety of ways to enter values: typing text in
2-10 Return to Section Topics 4200-900-01 Rev. K / February 2017
Page 67

Model 4200-SCS User’s Manual Section 2: Model 4200-SCS Software Environment
Workspace window tab:
When workbook mode is
enabled (per
Reference
Manual, Specifying environment
preferences, page 6-338), each
Project-Plan component window
that is active in the KITE
workspace can be accessed
quickly by selecting its
Workspace window tab.
User libraries box:
User modules box:
Parameter entry cells:
Status tab:
Formulator:
Mathematical
test results
analysis tool.
Graph tab:
Graphical test
and analysis results.
Test definition and
Sheet tab:
Numerical test and analysis results
Spreadsheet-like cells where you enter test
parameter values.
Parameter identity cells:
Spreadsheet-like cells where the test-module
parameter names and data types are specified.
Test library selection for the UTM.
Test module selection for the UTM.
and test settings.
configuration status.
Output Values button:
Click to set export Output
Values for this test to the
Subsite data sheet.
Cell display edit box: Displays
contents of selected cell and
allows data entry.
Documentation area: Displays
important information about
the test module.
Test Notes tab:
Type in notes about
the project.
Output Values button:
Click to set export Output
Values for this test to the
Subsite data sheet.
an edit box, clicking on a drop-down list, or selecting a check box or option button. The UTM GUI
view simplifies the presentation of the UTM test parameters by not displaying some of the lessused parameters. Entering a value in the GUI view also places the value into the table-based
classic definition; entering a value in the classic view also places it in the GUI view. If there is a
parameter in the table, but not in the GUI definition, then the table determines the value used by
the UTM.
Figure 2-5
UTM classic definition tab
A UTM is created and configured by first selecting a user library and user module, and then
entering parameter values. For details about defining and configuring a UTM, refer to the
Reference Manual, Configuring the UTMs, page 6-142.
Using the UTM GUI view
To understand the test, read the explanation of the test in the Test Description area (see Figure 2-
6 on page 2-12). Note that the UTM GUI view will typically hide the less-used parameters; these
parameters are available in the classic view. If a parameter's use is unclear, check if the parameter
has any hovertext help (position the mouse pointer over the parameter entry field). Additional
4200-900-01 Rev. K / February 2017 Return to Section Topics 2-11
Page 68

Section 2: Model 4200-SCS Software Environment Model 4200-SCS User’s Manual
User modules box:
Status tab:
Formulator:
Mathematical
test results
analysis tool.
Graph tab:
Graphical test
and analysis results.
Test definition and
Sheet tab:
Numerical test and analysis results
Test module selection
and test settings.
configuration status.
Output Values button:
Click to set export Output
Values for this test to the
Subsite data sheet.
Test Description area: Displ ays
important information about
the test module.
Test Notes tab:
Type in notes about
the project.
Output Values button:
Click to set export Output
Values for this test to the
Subsite data sheet.
User libraries box:
Test library selection
for the UTM.
for the UTM.
Select the view for the
UTM: Classic (table)
or GUI (graphical)
Test Parameters are shown in group boxes (five groups are illustrated in this
figure) that group like values together. Different tests will have different types
and number of parameters. Parameters are input as numbers, drop-down
choices or checkboxes. Hover mouse over parameter input box for additional
information.
Test device or other
graphical illustration
information about parameter usage may also be in the Test Notes tab, or in the test device or other
graphical illustration area.
If a group box has a plus sign (+) in it, then the box is collapsed; click the + to expand the box. A
box will only expand when there is sufficient space to show all of the parameters within the group.
In cases where there are many parameters in the UTM GUI view, it may be necessary to collapse
a group above or below to allow the box to expand.
For a user module, the exact controls and parameter grouping of a UTM GUI view are determined
by the GUI view definition. This is typically created by the same person that created the underlying
user module.
Figure 2-6
UTM GUI definition tab
2-12 Return to Section Topics 4200-900-01 Rev. K / February 2017
Page 69

Model 4200-SCS User’s Manual Section 2: Model 4200-SCS Software Environment
How to create your own ITMs
Understanding the ITM definition tab
To define an ITM, use the ITM definition tab. Display it by double-clicking the ITM name in the
project navigator. Figure 2-4 shows and describes the ITM definition tab, in this case for the vds-
id ITM, which is part of the example project (shown in Figure 2-2 and Figure 2-3).
An ITM definition tab defines the ITM as follows:
• Schematically displays the type of device to be tested by the ITM (FET, BJT, capacitor, and
so on).
• Next to each terminal of the device, displays an “instrument object,” which acts as follows:
– Identifies the terminal (for example, gate, drain, source, collector, anode, and so on).
– Identifies and allows assignment / reassignment of the terminal to match the SMU,
GNDU, or open circuit that is physically connected to the terminal during the test.
– Displays the present forcing-function and measurement options for the terminal.
– Identifies and allows assignment and configuration / reconfiguration of SMU forcing
function and measuring options. A single-click of the force measure button displays the
Forcing Functions / Measure Options window for the terminal.
• Provides access to the Formulator, which allows in-test and post-test data computations.
• Allows setting of preconfigured speed or custom timing parameters for the ITM.
• Allows exit conditions to be set if the source goes into compliance.
• Allows you to select the measured readings (output values) that you want exported to the
Subsite Data sheet.
• Displays the present test mode:
– Sweeping
– Sampling
Understanding the ITM forcing functions
Table 2-2 summarizes the available ITM “forcing functions,” which tells the 4200-SCS how to apply
static or dynamic voltage or current conditions to device terminals.
Table 2-2
SMU Forcing function summary
General
type Name Description and graphical illustrations
Static Open Maintains a zero-current state at the terminal, subject to the maximum voltage compliance of the
connected SMU.
Common Maintains a zero-voltage state at the terminal, subject to the maximum current compliance of the
connected SMU.
Current
bias
Voltage
bias
Maintains a selected constant-current state at the terminal, subject to the user-specified voltage
compliance for the connected SMU.
Maintains a selected constant-voltage state at the terminal, subject to a user-specified current
compliance of the connected SMU.
4200-900-01 Rev. K / February 2017 Return to Section Topics 2-13
Page 70

Section 2: Model 4200-SCS Software Environment Model 4200-SCS User’s Manual
100
10
1000
Current (µA)
Tim e
0.1V Steps, 41 Data Points
4
3
1
2
0
Gate V
oltage (V)
Tim e
Linear sweep Log sweep
Time
Current or
Voltage
Arbitrary
function
Table 2-2 (continued)
SMU Forcing function summary
General
type Name Description and graphical illustrations
Sweep Current
sweep
Vol tage
sweep
Increments a series of current values or voltage values at a rate that is determined by the timing and
speed settings in the ITM definition tab. Generates parametric curve data that is recorded in the Sheet
tab Data worksheet for the ITM and can be plotted in the ITM Graph tab.
List
sweep
Current
List
Sweep
Steps through a list of user-specified current values or voltage values, at a rate that is determined by the
timing and speed settings in the ITM definition tab. Generates parametric data that is recorded in the ITM
Sheet tab Data worksheet and can be plotted in the ITM Graph tab, if appropriate.
Vol tage
List
Sweep
2-14 Return to Section Topics 4200-900-01 Rev. K / February 2017
Page 71

Model 4200-SCS User’s Manual Section 2: Model 4200-SCS Software Environment
0.1V Steps, 51 Data Points
0.1V Steps, 51 Data Points
0.1V Steps, 51 Data Points
0.1V Steps, 51 Data Points
4
3
2
1
0
5
Drain V
oltage (V)
Time
4
3
2
1
0
5
Gate V
oltage (V)
Time
Step 4
Step 3
Step 2
Step 1
At Each Gate Voltage Step, Sweeping the Drain Voltage of the FET
Stepping the Gate Voltage of a FET
Table 2-2 (continued)
SMU Forcing function summary
General
type Name Description and graphical illustrations
Step Current
step
Voltage
step
Increments a current or voltage to two or more levels, each of which is held constant during the progress
of a current sweep, a voltage sweep, a current list sweep, or a voltage list sweep at another terminal. For
each current step or voltage step level, parametric curve data is recorded in the ITM Sheet tab Data
worksheet. The combined data can be plotted in the ITM Graph tab, resulting in a series (family) of
curves.
4200-900-01 Rev. K / February 2017 Return to Section Topics 2-15
For forcing-function details, refer to the Reference Manual, The ForcingFunctionName function
parameters area, page 6-102.
Understanding dual sweep
A SMU that is configured to perform a linear or log sweep, can also be set to perform a dual
sweep. With dual sweep enabled, the SMU will perform two sweeps. The first sweep steps from
the start level to the stop level. The SMU then continues with the second sweep, which steps from
the stop level back to the start level. With dual sweep disabled, the SMU performs a single sweep
that steps from start to stop.
A dual sweep for a slave SMU is typically used with a master SMU that is also set to perform a
dual sweep. The master SMU does not have to be set for dual sweep in order to use dual sweep
for a slave SMU. In this case, setting the master SMU’s sweep points to an even number will
ensure that the slave’s dual sweep is symmetrical. Setting the master SMU count to an odd
number, will cause the slave SMU to repeat the last sweep point.
NOTE The slave SMUs will not automatically set for dual sweep when dual sweep is
enabled for the master SMU. Dual sweep must be enabled individually for each
SMU.
To compare a single sweep to a dual sweep, refer to the Reference manual, Figure 6-135.
Page 72

Section 2: Model 4200-SCS Software Environment Model 4200-SCS User’s Manual
0V
Base Voltage 1V
Level 2V
Off Time
On Time
Cumulative Measurement Time
Time
Understanding pulse mode
To avoid device overheating in some tests, voltages or currents can be applied to a device only for
brief periods at widely spaced intervals. For sweep (linear, log, and list) and bias forcing functions,
a SMU can be set to provide pulse output.
With pulse mode enabled, the following pulse parameters can be set:
•On Time
• Off Time
• Base Voltage (or Base Current)
The base is the level the SMU goes to between sweep points. Pulse “on” and “off” times determine
pulse period and pulse width as follows:
• Pulse period = On Time + Off Time + cumulative measure time (if set to measure)
• Pulse width = On Time
Pulse mode can be selected only when source and measure ranges are fixed. Pulse mode is
disabled if the source or measure range is set to AUTO.
Pulse “on” and “off” times can be set from 5 ms to 10 s. The base voltage (or current) that can be
set is dependent upon the present source range.
An example pulse output for the voltage bias forcing function is shown in Figure 2-7. Pulse output
goes to the specified pulse level during the pulse “on” time. If the SMU is set to measure, the
measurement will occur after the “on” time expires and before the transition to the “off” time level.
This effectively increases the “on” time by the amount of time required to make the measurement.
Minimize this extra time by choosing “custom” in the timing tab and setting delay and filter factor to
0, and A / D Integration factor to 0.01. This is the fastest (but least accurate) measurement timing
scheme. If not set to measure, the output will transition from “on” to “off.”
During pulse “off” time, the pulse output returns to the specified base voltage level. After the “off”
time expires, the output returns to 0 V.
For a sweep forcing function, pulse output steps to the sweep step levels during the pulse “on”
times. During the “off” times, pulse output returns to the specified base voltage (or base current)
level. if set to measure, the measurement will occur after each “on” time period expires and before
the pulse transitions to the “off” time level.
The voltage sweep in Figure 2-8 is a single sweep. If dual sweep is enabled, the test will continue
by going back to the stop level and then step down to the start level. For details, see
Understanding dual sweep, on page 2-15.
Figure 2-7
Pulse mode example: Voltage bias; 2V level, 1V base
2-16 Return to Section Topics 4200-900-01 Rev. K / February 2017
Page 73

Model 4200-SCS User’s Manual Section 2: Model 4200-SCS Software Environment
= Cumulative Measure Time (Data Point)
Dual Sweep Disabled:
(single sweep)
Dual Sweep Enabled:
6
Data Points
3
Data Points
Time
0V
Base Voltage 1V
Start 2V
Stop 4V
3V
On
Time
Off
Time
Off
Time
Off
Time
Tim e
0V
Base Voltage 1V
Start 2V
Stop 4V
3V
Off
Time
Off
Time
Off
Time
Off
Time
Off
Time
Off
Time
On
Time
On
Time
On
Time
On
Time
On
Time
On
Time
On
Time
On
Time
Figure 2-8
Pulse mode examples: Single and dual sweep
1. In the project navigator double-click the ITM that you wish to configure. The definition tab of
2. In the definition tab, review the virtual connections for each device terminal, as listed in the
3. Ensure that the physical device connections match the virtual ( definition tab) device
How to use the definition tab to configure ITM parameters
This topic describes parameter configuration of a library ITM, in which connections and test modes
are preconfigured. For discussions of general ITM configuration, including creation of new ITMs or
customization of existing ITMs, refer to the Reference Manual, Configuring the Project Plan ITMs,
page 6-86.
After inserting library ITMs into your project, configure the setup for each ITM as described in the
subsections that follow in the order in which they appear.
Match the physical and virtual connections:
the ITM window opens by default (see Figure 2-4).
“instrument object” for that terminal (see Figure 2-4).
connections. If necessary, shut down the instrumentation and correct the physical
connections.
CAUTION Physical device-terminal connections must accurately match virtual
connections to avoid bad test results and potential device damage.
4200-900-01 Rev. K / February 2017 Return to Section Topics 2-17
Page 74

Section 2: Model 4200-SCS Software Environment Model 4200-SCS User’s Manual
Configuring forcing functions for each device terminal
With the definition tab for the ITM open, do the following for each device terminal:
1. On the instrument object for the terminal (Figure 2-4), click the FORCE MEASURE button.
The corresponding Forcing Function / Measure Options window appears. The Forcing
Functions / Measure Options window in Figure 2-9 illustrates typical window features.
Figure 2-9
Typical SMU forcing functions / measure options window for an existing library ITM
Figures 2-10, 2-11, and 2-12 illustrate basic options and functions for each part of the Forcing
Functions / Measure Options user interface.
2-18 Return to Section Topics 4200-900-01 Rev. K / February 2017
Page 75

Model 4200-SCS User’s Manual Section 2: Model 4200-SCS Software Environment
Describes the instrument selected for
this device terminal and the mode of the
test being performed. (Sweeping mode
or Sampling mode — in which data is
recorded vs. time for an applied signal).
Select whether a sweep or
step forcing function acts as
a master (independent) or
slave (tracks the master).
1
Select the present forcing
function.
1
Select Dual Sweep.
2
Select whether a sweep is
linear or logarithmic.
1
For a Linear sweep or step Start is the voltage / current at the start
of the sweep, Stop is the voltage / current at the end of the sweep,
and Step is the voltage / current change between steps.
3
Data
Points — calculated automatically from the Start, Stop, and Step
values — is disabled. For a Log sweep, you specify the Data Points
value. The Step value — calculated automatically — is disabled.
Select the SMU
range to be used
when forcing the
specified voltage
or current. Select
dynamically optimized range
(Auto), single best
range for entire
sweep (Best
Fixed), or manually
specified numerical range.
Select and configure
Pulse Mode.
4
Select the SMU current compliance for a
voltage sweep or the voltage compliance
for a current sweep.
Figure 2-10
Instrument information, forcing functions, and voltage sweep function parameters
1
Do not change these parameters, unless you want to customize the ITM — which is beyond the scope of this User’s manual.
2
Dual sweep – with dual sweep enabled, the SMU will sweep from start to stop, and then sweep from stop back to start. When disabled, the SMU will sweep
from start to stop. For details, see Understanding dual sweep on page 2-15.
Figure 2-11
Linear sweep or step, SMU range, Pulse Mode, and SMU current compliance
4200-900-01 Rev. K / February 2017 Return to Section Topics 2-19
3
In a list sweep configuration window, you enter a list of discrete voltages or currents, instead of start, stop, and step values. In a current bias or voltage bias
configuration window, you enter a fixed level value, instead of start, stop, and step values.
4
Pulse mode – Select Pulse Mode to provide pulse output for sweep (linear, log and list) and bias forcing functions. For details, see Understanding pulse mode
on page 2-16.
Page 76

Section 2: Model 4200-SCS Software Environment Model 4200-SCS User’s Manual
Check to enable current
measurement options,
recording of current in the
Sheet tab Data worksheet,
and availability of current
data for plotting in the
Graph tab.
If desired enter
a preferred
data label for
the current (in
lieu of the
default label).
Check to enable voltage
measurement options,
recording of voltage in the
Sheet tab Data worksheet,
and availability of voltage
data for plotting in the
Graph tab.
Check to cause KITE to
log 32-bit measurement-status codes, in
the Data worksheet,
when the ITM executes.
Select dynamically optimized range (Auto),
dynamically optimized
range above a specified
lower limit (Limited
Auto), the one best range
for entire sweep (Best
Fixed), or manually speci-
fied numerical range.
5
If you select Limited
Auto, specify the limit
here.
5
Programmed specifies
logging of as-configured
data values (for example,
calculated from Start,
Stop, Step). Measured
specifies logging of as
measured data values.
6
If desired enter a
preferred data label
for the voltage (in
lieu of the default
label).
Figure 2-12
Measuring Options
5
If sweeping / stepping voltages If sweeping / stepping currents, replaced with programmed and measured buttons, as in right panel.
6
If sweeping / stepping voltages If sweeping / stepping currents, buttons replaced with range settings similar to those in left panel.
2. Referring to the setting explanations in Figure 2-9, 2-10, 2-11, and 2-12 above, configure
the following types of parameters for the device terminal’s forcing function, as appropriate:
• Linear or log for a sweep-type forcing function.
• Dual sweep – sweep from start to stop, and then sweep from stop to start.
• The current or voltage values to be forced:
– Level for a static forcing function
– Start, stop, and step for a step or linear sweep forcing function
– Start, stop, and data points for a log sweep forcing function
– Data points value and list of amperes or volts values for a list sweep
• The default or desired Src Range and compliance
• The default or desired measuring options
3. Click OK. The configuration for this device terminal takes effect and the Forcing Functions /
Measure Options window closes.
4. If using pulse mode, see Configuring pulse mode.
5. Repeat Steps 1 through 3 for the remaining device terminals.
2-20 Return to Section Topics 4200-900-01 Rev. K / February 2017
Page 77

Model 4200-SCS User’s Manual Section 2: Model 4200-SCS Software Environment
Valid forcing functions for Pulse Mode:
• Voltage / Current Bias
• Voltage / Current Sweep (Linear /
Log and Dual Sweep)
• Voltage / Current List Sweep
Dual Sweep - A SMU can perform a dual
current sweep or a dual voltage sweep.
With Dual Sweep selected (3), the SMU
will sweep from Start to Stop, and then
sweep from Stop back to Start. When
disabled, the SMU will sweep from Start
to Stop.
Pulse Mode can be selected ONLY when
source and measure ranges are fixed. In
other words, Pulse Mode is disabled if the
source or measure range is set to AUTO.
Perform the following steps to select and
configure Pulse Mode:
1. Select (3) Pulse Mode, and set the On
Time, Off Time, and Base Voltage (or
Base Current for a current sweep).
2. Click OK.
Configuring pulse mode
With a valid forcing function selected, a SMU can be configured to provide pulse output.
Figure 2-13 explains how to use the pulse mode. The settings in the Forcing Functions / Measure
Options window shown in Figure 2-13 configures a voltage sweep. The pulse mode controls for
the other valid forcing functions are similar.
Figure 2-13
Pulse mode configuration (voltage sweep)
Basic test execution
Project navigator check boxes
As shown in Figure 2-14, each component of the project plan has a check box. A check mark in a
box indicates that the test or plan is enabled. The absence of a check mark indicates that the test
4200-900-01 Rev. K / February 2017 Return to Section Topics 2-21
or plan is disabled. Clicking a check box either inserts a check mark to enable or removes a check
mark to disable. Only enabled (check marked) tests or plans can be run.
There is interaction between the project navigator check boxes and is explained by the
following actions:
Page 78

Section 2: Model 4200-SCS Software Environment Model 4200-SCS User’s Manual
Tests (ITMs and UTMs)
• A check mark can be inserted or removed for any test.
• Inserting a check mark for a test also inserts a check mark for its device plan, its subsite
plan, and the project plan.
Device plan
• Clearing a check mark for a device plan also clears the check marks for all of its subordinate
tests.
• Inserting a check mark for a device plan also inserts check marks for all of its tests.
• Removing the check marks for all the tests in the device plan, also removes the check mark
for the device plan.
Subsite plan
• Removing a check mark for a subsite plan also removes the check marks for all of its device
plans and tests.
• Inserting a check mark for a subsite plan also inserts check marks for all of its device plans
and tests.
• Removing the check marks for all the tests in the subsite plan, also removes the check mark
for the subsite plan.
Initialization and termination steps
• Removing a check mark for initialization or termination steps also removes the check marks
for all of its UTMs.
• Inserting a check mark for initialization or termination steps also inserts check marks for all
of its UTMs.
• Removing the check marks for all the UTMs in the initialization or termination steps, also
removes the check mark for the initialization or termination steps.
Project plan
• Removing a check mark for a project plan also removes the check marks for all of its plans
and tests.
• Inserting a check mark for a project plan also inserts check marks for all of its plans and
tests.
• Removing the check marks for all the tests in the project, also removes the check mark for
the project plan.
NOTE Reference manual, Figure 6-16 shows an example of project plan structure that
shows a mix of enabled and disabled tests.
2-22 Return to Section Topics 4200-900-01 Rev. K / February 2017
Page 79

Model 4200-SCS User’s Manual Section 2: Model 4200-SCS Software Environment
Executing an individual test
Selecting a test
An enabled (check marked) ITM or UTM is selected by clicking the test in the project navigator
(see Figure 2-14). The Run Test / Plan button turns green to indicate that the test is enabled
and ready to be run. Also, the selected-test name is displayed in the Test / Plan Indicator box
located above the project navigator.
The test can also be selected by double-clicking it in the project navigator. The double-click action
places the appropriate ITM or UTM window in the KITE workspace. The ITM and UTM definition
tabs show the test configurations.
NOTE Before executing a test for which data must be labeled with a specific site number,
refer to the Reference Manual, Assigning a site-number label to individual test and
test-sequence data, page 6-30.
Running the test
To run a selected test:
1. Click the green Run Test / Plan button
2.Select Run in the Run menu, or press the F6 keyboard key.
*1
See Figure 2-4 and Figure 2-5.
While the test is running, test data is placed the data sheet. In ITMs data is placed in the data
sheet real time as data is being acquired. In UTMs by default, data is not placed in the data sheet
until after the test has finished running.
In the message area of the KITE window, time stamps indicate:
•Start time
• Stop time
• Total execution time
NOTE You can also start a test by pressing the F6 keyboard key. You can abort a test by
clicking the red Abort Test / Plan toolbar button, by selecting Abort in the Run menu,
or by pressing the PAUSE / BREAK keyboard key.
For detailed information about running individual tests, see Reference Manual, Run execution of
individual tests and test sequences, page 6-162.
1. For details about using the ITM and UTM definition tabs, see Reference Manual, Configuring the Project Plan ITMs,
page 6-86, and Configuring the UTMs on page 6-142.
4200-900-01 Rev. K / February 2017 Return to Section Topics 2-23
Page 80

Section 2: Model 4200-SCS Software Environment Model 4200-SCS User’s Manual
Figure 2-14
Example project plan
How to display and manage test results
Data file management
Using file and test-result directories
KITE application files and test results are stored on the 4200-SCS hard drive by default. However,
KITE projects and various other KITE application files can be stored and used on any available
hard drive, except CD, CD-R, CD-RW drives and write-protected drives or directories.
NOTE Storing application files on a congested network drive can degrade overall test
sequence performance. The best Model 4200-SCS system performance is obtained
by storing all KTE Interactive application files on the Model 4200-SCS internal hard
drive. There, sweep and sampling measurement speed is not affected perceivably by
network traffic or any other embedded PC system activities.
This subsection provides useful information regarding the default organization of KITE application
and data files. Additional information regarding KTE Interactive file management and system
administration is in the Reference Manual, Managing multiple users and systems, page 10-4.
CAUTION Never directly edit KITE application files using a test editing program (with
one exception, noted in How to create and add a new device on page 2-27)
because unexpected results and application crashes can occur.
2-24 Return to Section Topics 4200-900-01 Rev. K / February 2017
Page 81

Model 4200-SCS User’s Manual Section 2: Model 4200-SCS Software Environment
Default user directory
Default user director: C:\S4200\kiuser
By default, all of the sample projects and standard libraries included with KTE Interactive are
stored in the C:\S4200\kiuser directory, as illustrated in Figure 2-15. This folder, is referred to
as the “default user directory.”
Figure 2-15
Default user directory
Note however, that KITE projects, device libraries, and test libraries can be stored and shared on
any accessible disk drive, including a network drive (except CD, CD-R, CD-RW drives and
write-protected drives or directories).
The default user directory contains several subdirectories. Each of these subdirectories is
discussed below under a separate heading.
Devices subdirectory
By default, the Devices subdirectory contains the KITE Device Library that is provided with each
version of KTE Interactive. Also by default, you can access this Device Library when operating
KITE. You can copy devices from this library to their projects or submit devices from their projects
to this library.
NOTE For more information about submitting devices to libraries, refer to the Reference
Manual, Submitting devices, ITMs, and UTMs to libraries, page 6-148.
4200-900-01 Rev. K / February 2017 Return to Section Topics 2-25
Page 82

Section 2: Model 4200-SCS Software Environment Model 4200-SCS User’s Manual
Understanding device libraries
A Device Library is comprised of devices stored in folders that are organized by device category.
To create a new device category, create a new folder in the C:\S4200\kiuser\Devices
directory.
To provide project access to additional device libraries, or to change the KITE Device
Library that appears by default, use the KITE Options window:
Figure 2-16
Device library access selection
*2
•Select Options in the Tools menu.
• On the Directories tab of the KITE Options window that appears, choose Device Libraries
in the Show Directories for: box. See Figure 2-16.
NOTE For more information about Device Library access selection, refer to the
Reference Manual, Customizing directory options, page 6-340.
Each device stored in a Device Library contains the following three types of files:
• A Keithley device (.kdv) file that follows the Microsoft
®
Windows® .ini file format.
• A small bitmap; 16 x 16 dpi (.bmp) file for the device icon that is displayed in the project
navigator.
• A large bitmap; 120x100 dpi (.bmp) file for the device graphic that is displayed on the
definition tab of each ITM that tests the device.
Figure 2-17 shows the files in the Mosfet Device Library folder. Note that a .kdv file and two
bitmap files are listed for each device.
2. The C:\S4200\kiuser\Devices is the factory-default Devices directory. You can also create a new folder in
another Devices directory, (for example, C:\S4200\YourName\Devices).
2-26 Return to Section Topics 4200-900-01 Rev. K / February 2017
Page 83

Model 4200-SCS User’s Manual Section 2: Model 4200-SCS Software Environment
The three files that define
the 3terminal-n-fet device
Figure 2-17
Device files
How to create and add a new device
To create a new device, you must create three files:
• The Keithley device (.kdv) file.
• The small bitmap; 16 x 16 dpi (.bmp) file for the project navigator device icon.
• The large bitmap; 120x100 dpi (.bmp) file for the ITM definition tab device graphic.
The .kdv file can be modified using text editing software, such as Microsoft
files can be modified using bitmap editing software, such as Microsoft
The following procedure illustrates how to add a new device, named new-mosfet, to the
default Device Library:
1. In the C:\S4200\kiuser\Devices\MOSFET directory, locate the following three files,
which define the existing library device called 3terminal-n-fet:
• 3terminal-n-fet.kdv.
• 3terminal-n-fet.bmp for the project navigator device icon.
• 3terminal-n-fet-big.bmp for the ITM definition tab device graphic.
2.Copy 3terminal-n-fet.bmp to a new file called new-mosfet.bmp.
3. If required, modify new-mosfet.bmp using Microsoft
®
Paint®.
4.Copy 3terminal-n-fet-big.bmp file to a new file called new-mosfet-big.bmp.
5. If required, modify the new bitmap using Microsoft
6. Copy the 3terminal-n-fet.kdv file to a new file called new-mosfet.kdv.
®
Paint®.
7. Edit the new-mosfet.kdv file with Notepad® by replacing all occurrences of
“3terminal-n-fet” with “new-mosfet”.
®
Paint®.
®
Notepad®. The .bmp
The edited new-mosfet.kdv file should appear as shown in Figure 2-18. All six lines are
required.
4200-900-01 Rev. K / February 2017 Return to Section Topics 2-27
Page 84

Section 2: Model 4200-SCS Software Environment Model 4200-SCS User’s Manual
Figure 2-18
Contents of the Keithley Device file new-mosfet.kdv
Table 2-3 describes each line of the new-mosfet.kdv file that appears in Figure 2-18.
Table 2-3
Line-item descriptions for a .kdv file
Line-item example Description
[Bitmaps]
Small=new-mosfet.bmp
Big=new-mosfet-big.bmp
[Terminals]
Number=3
Orientation=;N:Drain;S:Source;W
:Gate
Location of bitmap file information.
Name of file to use when displaying the device in the KITE
project navigator.
Name of file to use when displaying the device on a KITE
ITM definition tab.
Location of terminal-label information.
Number of device terminals (8 maximum).
Geographic, or screen, location and name of each device
terminal. Valid locations are as follows:
• N North or top
• NE Northeast or upper right
• E East or right
• SE Southeast or lower right
• S South or bottom
• SW Southwest or lower left
• W West or left
• NW Northwest or upper left
Projects subdirectory
The Projects subdirectory contains the default KITE project library that is provided with each
version of KTE Interactive. By default, you can store KITE projects in this directory. However, KITE
projects can be stored in any location, using the KITE File
Projects are comprised of multiple files stored in a predefined directory structure. All of the project
components are stored in a project folder. Figure 2-19 shows the folders of KITE projects that are
included with KTE Interactive. The expanded default project folder shows the pre-defined
project file structure.
2-28 Return to Section Topics 4200-900-01 Rev. K / February 2017
> Save Project As menu.
Page 85

Model 4200-SCS User’s Manual Section 2: Model 4200-SCS Software Environment
Figure 2-19
KITE project folders
The “default” project
test results are stored
here.
For each project, test results files (.xls worksheet and .kgs graph) are stored in a project
specific data folder, as illustrated in Figure 2-19.
NOTE Refer to the Reference Manual, Test data, page 6-31 for more information about
results files and KITE file-naming conventions.
Projects can be moved from one location to another as long as the entire project folder (with all of
its contents) are relocated.
Tests subdirectory
By default, the Tests subdirectory contains the KITE test library that is provided with each version
of KTE Interactive. Also by default, you can access this test library when operating KITE. You can
copy tests from this library to their projects or submit tests from projects to this library.
NOTE For more information about submitting tests to libraries, refer to the Reference
Manual, Submitting devices, ITMs, and UTMs to libraries, page 6-148.
This test library is comprised of tests that are stored in folders organized by device category. To
create a new test category, create a new folder in the C:\S4200\kiuser\Tests directory.
NOTE The C:\S4200\kiuser\Tests is the factory default Tests directory. You can
create a new folder in another Tests directory, such as
C:\S4200\YourName\Tests.
4200-900-01 Rev. K / February 2017 Return to Section Topics 2-29
Page 86

Section 2: Model 4200-SCS Software Environment Model 4200-SCS User’s Manual
To provide project access to additional test libraries in other directories or to change the
KITE test library that appears by default, use the KITE Options window:
1.Select Options in the Tools menu.
2.On the Directories tab of the KITE Options window that appears, choose Test Libraries in
the Show Directories for: Combo box. See Figure 2-20.
Figure 2-20
Test library access selection
NOTE For more information about test-library access selection, refer to the
Reference Manual, Customizing directory options, page 6-340.
Tests can be submitted to a library with or without including measurement data. By default, data is
included when a test is submitted. Test results files (.xls data and .kgs graph files) are stored in
the test library data folder, as shown in Figure 2-21.
2-30 Return to Section Topics 4200-900-01 Rev. K / February 2017
Page 87

Model 4200-SCS User’s Manual Section 2: Model 4200-SCS Software Environment
If data is included when a test is submitted to
the Tests subdirectory, the data is stored here.
Figure 2-21
Test library results folder
Usrlib subdirectory
By default, the usrlib subdirectory contains the KULT user libraries that are provided with each
version of KTE Interactive. Also by default, you can access all 4200-SCS user libraries when
operating KITE and KULT. For more information about this directory, refer to the Reference
Manual, Managing user libraries, page 8-39.
System directory: C:\S4200\sys
All binary and executable files that KTE Interactive needs to control the 4200-SCS are stored in
the sys folder (directory).
NOTE The files stored in the sys folder (directory) must not be modified, not even by
system administrators. This folder must reside on the 4200-SCS hard drive.
4200-900-01 Rev. K / February 2017 Return to Section Topics 2-31
Page 88

Section 2: Model 4200-SCS Software Environment Model 4200-SCS User’s Manual
How to manage numeric test results in Sheet tab
Displaying and analyzing data using Sheet tab
The Sheet tab of an ITM or UTM window is used to record and manipulate numerical test data and
settings. There is a Sheet tab corresponding to every ITM / UTM for each site. All data in the
worksheets of the Sheet tab is exportable in Microsoft
A Sheet tab is the same as a Microsoft
following three worksheets:
• Data worksheet: The Data worksheet of the Sheet tab records all of the numerical test data
that is generated every time you execute an ITM or a UTM at a given site. The Sheet tab
Data worksheet also records data generated by the formulator.
• Calc worksheet: The Sheet tab Calc worksheet provides a spreadsheet for local data
analysis. If there are multiple same-named instances of an ITM or UTM in a project plan, the
Calc worksheet equations are unique for each instance.
• Settings worksheet: The Sheet tab settings worksheet documents the test configuration
and site number.
A Sheet tab may also contain one or more Append worksheets (Append1, Append2, ... and so on),
as discussed in the Reference Manual, Append execution of tests, test sequences, and Project
Plans, page 6-168. Each Append worksheet behaves like a Data worksheet. However, its data
cannot be plotted on a separate Graph tab graph, only on the same graph as the Data worksheet
data. For more information about Sheet tabs refer to Understanding and using the Data worksheet
of a Sheet tab.
®
Excel® workbook that always contains at least the
®
Excel® format.
Each worksheet contains the following controls:
• A data-source identifier.
• Save as button.
Opening a Sheet tab
To open a Sheet tab:
1. In the site navigator, enter the site number where the ITM or UTM was executed, using the
spin button controls (the little arrows at the right).
2. In the project navigator, double-click the name of the ITM or UTM that acquired the data. An
ITM or UTM window appears displaying the definition tab for the selected ITM or UTM.
NOTE If the project plan contains multiple instances of an ITM or UTM under the same
name, each instance generates its own data and has its own unit identification (UID).
Ensure that you select the correct instance of the ITM or UTM.
3. Click the (ITM or UTM) Sheet tab. The Data worksheet of the Sheet tab appears, as well as
tabs that provide access to the corresponding Calc and Settings worksheets.
Figure 2-22 is the Data worksheet of a Sheet tab for the vds-id ITM, showing data for
multiple sweeps. Figure 2-23 is the Data worksheet of a Sheet tab for the vgs-id ITM,
showing formulator calculation results, in addition to test data.
2-32 Return to Section Topics 4200-900-01 Rev. K / February 2017
Page 89

Model 4200-SCS User’s Manual Section 2: Model 4200-SCS Software Environment
Formulator results
Figure 2-22
Data worksheet of a Sheet tab containing data for multiple sweeps
Figure 2-23
Data worksheet of a Sheet tab containing both data and formulator results
4200-900-01 Rev. K / February 2017 Return to Section Topics 2-33
Page 90

Section 2: Model 4200-SCS Software Environment Model 4200-SCS User’s Manual
NOTE The #REF notation in a cell indicates that a valid value could not be calculated by the
formulator. This occurs when a formulator function needs multiple rows as
arguments, when a calculated value is out of range, when a divide by zero is
attempted, and so on.
In the GM column in Figure 2-23, note the #REF notation in the first row. Each value in the
GM column is a difference coefficient that is calculated as the ratio ΔDrainI / ΔGateV,
where ΔDrainI and ΔGateV are differences between values in the present row and
values in the previous row. Because, no previous row exists before the first row, a valid
calculation is not possible for the first row. Hence, the formulator returns the #REF
notation.
A column will contain multiple instances of #REF if the formulator function requires
multiple prior cells for the calculation. For example, if the MA VG function is using five dat a
points to calculate a moving average of a column contain ing five value s, the first two an d
last two cells will contain #REF.
Understanding and using the Data worksheet of a Sheet tab
The Data worksheet first appears when you open the Sheet tab (see Figures 2-22 and 2-23). The
Data worksheet displays all the data that was last generated by the ITM or UTM for a particular
site. The Data worksheet also contains the results of any formulator calculations that were
performed on the last-generated data.
Features of the Data worksheet are:
• Data is reported in Microsoft
®
Excel®-compatible format, each column containing the results
for one test parameter or for a formulator calculation.
NOTE Some formulator calculations return only a single value.
The display of all columns for the test may span several pages horizontally. The display of
data in a single column may span several pages vertically.
• Each column heading identifies the data below it:
– The name of a test-results parameter (for example, current or voltage) that is assigned
by KITE, by you (for an ITM only), or by the KULT programmer (for a UTM only). For ITM
current and voltage naming, refer to the Reference Manual, Understanding and
configuring the Measuring Options area, page 6-126.
– The name of a formulator results parameter.
• The data-source identifier, the formula box, and the save as button, each of which are
discussed below.
• The contents of the Data worksheet are display-only. However, you can manipulate the
contents of the Data worksheet after linking it to or pasting it in the Calc worksheet.
Understanding the formula box of the Data worksheet
If a column in the Data worksheet contains the results of formulator calculations, you can locally
display the formula (equation) that was used to obtain the results. Display the formula by selecting
it from the formula box, as illustrated in Figure 2-24. The steps in Figure 2-24 display the formula
that was used to obtain the SQRID results in Figure 2-23.
2-34 Return to Section Topics 4200-900-01 Rev. K / February 2017
Page 91

Model 4200-SCS User’s Manual Section 2: Model 4200-SCS Software Environment
Click
Click / Select
The type of test
(ITM or UTM)
Name of the test
Instance of the named test
Number of the site at which
test was performed.
in the project plan: 1st,
.
from which the
data was obtained.
from which the
data was obtained.
this instance of the named
2nd, 3rd, and so on. Same as the
UID number in the Project
Navigator.
Figure 2-24
Displaying a formulator equation using the formula box
Understanding the data-source identifier
The ITM or UTM window tab at the bottom of all Sheet tab windows identifies the source of the
data in the Sheet tab, as shown in Figure 2-25.
Figure 2-25
Data-source identifier
4200-900-01 Rev. K / February 2017 Return to Section Topics 2-35
Page 92

Section 2: Model 4200-SCS Software Environment Model 4200-SCS User’s Manual
Saving a worksheet
Saving a Sheet tab to the project plan
To save the displayed data to the project plan, do one of the following:
• Click Save in the File menu
• Click the single floppy-disk toolbar button
• Press Ctrl+S on the keyboard
Saving the Sheet tab to an external spreadsheet file using the save as button
All data in the Sheet tab for a test is in Microsoft
extension. In other words, the combined worksheets in the Sheet tab (including any Append1,
Append 2, and so on worksheets) effectively comprise a workbook that can be used directly in an
Microsoft
®
Excel®-compatible spreadsheet program.
To save the contents of all Sheet tab worksheets to a designated folder simultaneously in a
single.xls file:
1. Click Save As in the upper right corner of any of the three worksheets. The Save As window
displays, with workbook (*.xls) as the default file type. See Figure 2-26.
®
Excel®-compatible format, with the .xls
Figure 2-26
Data Save As window, configured for workbook files
2. In the Save In edit box of the save as window, select the location for the text file.
3. In the File name edit box of the save as window, Keithley Instruments recommends that you
retain the default selection, which contains the data-source identifier (refer to Understanding
the data-source identifier).
4. In the Save as type box, make no changes; retain the *.xls type.
5. Click Save.
NOTE Do not attempt to use the save as button to save data to the project plan.
Understanding Append worksheets
The following applies to the worksheets that are created by Append executions:
• The data generated for each Append execution of a test is located in an individual
“Appendn” worksheet where “n” designates the nth Append execution. For example, the
worksheets are labeled Append1, Append2, ... and so on.
2-36 Return to Section Topics 4200-900-01 Rev. K / February 2017
Page 93

Model 4200-SCS User’s Manual Section 2: Model 4200-SCS Software Environment
NOTE You can specify the maximum number of Append executions and worksheets (the
maximum value of n). After the maximum number of Append worksheets have been
generated, the data from each Append execut ion replaces the dat a from the previous
Append execution. For example, if the maximum value of n is 4, the data from the
fifth Append execution replaces the data from the fourth Append execution. Refer
also to Reference Manual, Append execution of tests, test sequences, and Project
Plans, page 6-168.
• Each Append worksheet is labeled with a separate tab to distinguish it from the Data
worksheet for the test.
• Each Append worksheet contains the same columns and rows as the Data worksheet for
the test.
• Each Append worksheet may be manipulated in the same way as the Data worksheet for
the test.
See Figure 2-27.
Figure 2-27
Data and Append1 worksheets for a particular vcsat test
NOTE To display hidden Append worksheet tabs, use the scroll buttons located at the left
side of the tabs.
Figure 2-28
Append worksheet tabs
4200-900-01 Rev. K / February 2017 Return to Section Topics 2-37
Page 94

Section 2: Model 4200-SCS Software Environment Model 4200-SCS User’s Manual
Append executions are not restricted to individual tests. An entire test sequence (device plan or
subsite plan) or a project plan may be Append executed “n” times, resulting in “n” separate
Append worksheets for each test in the sequence or project plan. Multi-site Append execution of a
project plan results in multi-level sets of Append worksheets.
Graphing the Append worksheet data
You can graph Append worksheet data in using the same procedure used to graph Data
worksheet data. Refer to Reference Manual, Appending curves from multiple runs on a single
graph, page 6-285.
Deleting Append worksheets
You can delete Append worksheets using the following three methods:
• Clear Append Data method: Involves the Clear Append Data toolbar button / menu item.
• Run method: Involves performing a Run execution.
• Append Sets method: Involves reducing the Project window Append Sets value.
The next subsection outlines advantages and disadvantages for each method.
Clear Append data method for deleting Append worksheets
Use the Clear Append Data function to permanently delete any or all Append worksheets for a
selected test, test sequence, or project plan, either at one specific site or at all sites.
• Advantages:
– Perhaps the easiest, most straightforward method.
– Deletes Append worksheets without modifying the Data worksheets.
• Disadvantages:
– Final Recovery from accidental deletion is not possible.
The Clear Append Data method is explained in the Reference Manual, Deleting Append
worksheets, page 6-182. If there is no Append data for an ITM or UTM, the Append list will be
blank and the selection boxes for ITM / UTM Append data will be disabled.
How to manage graphical test results in the Graph tab
Opening a Graph tab
To open a Graph tab:
1. Open the ITM or UTM window for the selected test by double-clicking the test in the project
navigator.
2. When the ITM or UTM window opens, click the displayed Graph tab. The Graph tab opens.
Figure 2-29 displays an unconfigured graph for the vds-id ITM. The time and date at which the
data was generated are displayed in the upper left corner. However, the axes are labeled and
scaled generically, because no project data has yet been assigned to the axes.
2-38 Return to Section Topics 4200-900-01 Rev. K / February 2017
Page 95

Model 4200-SCS User’s Manual Section 2: Model 4200-SCS Software Environment
Figure 2-29
Example of an unconfigured Graph tab
The vds-id ITM is one of the ITMs that comes installed on your 4200-SCS with sample data,
including a configured graph (Reference manual, Figure 6-6). The vds-id ITM has been used for
illustration purposes through much of Section 6, including construction of the u_build project
(Reference Manual, Building a completely new Project Plan, page 6-48). The definition tab for the
vds-id ITM is shown in multiple places, including at the beginning of this section.
Accessing the Graph tab windows
Several Graph tab windows control the properties of a graph.
You can access these windows in two ways:
• Use the graph settings menu: When defining a graph, you typically access all Graph tab
windows using the graph settings menu.
• Right-click on certain graph components: When certain graph components are already
displayed, you can open context-appropriate edit windows by right-clicking the components.
Applicable graph components include titles, legends, comments, numerical coordinates,
and values displayed through the data variables menu item.
Opening the graph settings menu
Open the graph settings menu by either of the following methods:
• Menu access method I: Right-click in any blank portion of the Graph tab (any place except
on a Graph tab component). The Graph Settings menu appears as a pop-up menu. See
Figure 2-30.
4200-900-01 Rev. K / February 2017 Return to Section Topics 2-39
Page 96

Section 2: Model 4200-SCS Software Environment Model 4200-SCS User’s Manual
The menu
The menu, showing
Graph Properties
submenu
Figure 2-30
Graph settings menu
• Menu access method II: In the tools menu of the KITE window, select graph settings. The
menu that appears is identical to the pop-up menu shown in Figure 2-30.
Understanding the graph settings menu
Each item of the graph settings menu is summarized below:
• Define graph: Defines the parameters to be graphed and the axes on which these
parameters are to be graphed. For more information, refer to Defining data to be graphed
on page 2-42.
• Auto scale: Automatically scales all axes at a single, chosen time. For more information,
refer to the Reference Manual, Automatically scaling the axes, page 6-216.
• Axis properties: Opens the Axes Properties window, which is the main access point for
graph scaling and scale formatting. For more information, refer to the Reference Manual,
Defining the axis properties of the graph, page 6-212.
• Cursors: Opens the Cursors window, from which you can select and format cursors that
display the precise numerical coordinates of specific points on the plot lines. For more
information, refer to the Reference Manual, Numerically displaying plot coordinates using
cursors, page 6-228.
• Line fits: Allows you to fit lines directly to Graph tab plots. Up to two times. Select from the
following types:
–Linear (line through two data points)
–Regression (regression line)
–Exponential
– Logarithmic
–Tangent
• Zoom in: Allows you to enlarge and examine a small, selected part of the graph. For more
information, refer to the Reference Manual, Temporarily enlarging a selected area of the
graph by zooming, page 6-278.
• Zoom out: Restores a graph to the original or previously zoomed size. For more
information, refer to the Reference Manual, Temporarily enlarging a selected area of the
graph by zooming, page 6-278.
2-40 Return to Section Topics 4200-900-01 Rev. K / February 2017
Page 97

Model 4200-SCS User’s Manual Section 2: Model 4200-SCS Software Environment
• Comment: Opens the Comment window, which allows you to add and format a comment.
For more information, refer to the Reference Manual, Adding a comment, page 6-272.
• Data variables: Opens the Data Variables window, from which you can configure the
display of up to four data variables, along with the corresponding names. The data variables
menu item also toggles the data-variable display. For more information about the Data
Variables item, refer to the Reference Manual, Numerically displaying extracted parameters
and other data variables, page 6-256.
• Legend: Toggles the display of an automatically-created legend on and off. For more
information about legends, refer to the Reference Manual, Adding a legend, page 6-270.
• Test Conditions: Displays the primary test conditions used to get the data in the graph. For
more information, refer to the Reference Manual, Displaying test conditions, page 6-263.
• Title: Opens the Title window, which allows you to add and format a title. For more
information, refer to the Reference Manual, Adding a title, page 6-269.
• Graph properties
–Comment: Opens the Comment window, which allows you to add and format a
comment. Same function as comment in the main menu.
–Data variables: Opens the Data Variables window, from which you can configure the
display of up to four data variables, along with the corresponding names. Essentially, the
same as Data Variables in the main menu, except that it allows you to open a Data
Variables window without toggling the data-variables display.
–Graph area: Opens the graph area menu, which allows you to change the graph
foreground and background colors, toggle the time and date display, and make the graph
100% monochrome. For more information, refer to the Reference Manual, Changing
area properties of the graph, page 6-276.
–Legend: Opens the legend properties window, which allows you to reformat the font, text
or background color, or border of the legend. For more information, refer to the
Reference Manual, Adding a legend, page 6-270.
–Series: Opens the Data Series properties window, from which you can define color, line
pattern, plot symbol, and line width for each plot. For more information, refer to the
Reference Manual, Defining the plot properties of the graph: colors, line patterns,
symbols, line widths, page 6-223
.
–Test conditions: Displays the primary test conditions used to obtain the data in the
graph. For more information, refer to the Reference Manual, Displaying test conditions,
page 6-263.
–Title: Opens the title window, which allows you to add and format a title. Same function
as title in the main menu.
• Crosshair: Toggles the display of a pair of intersecting lines that can be positioned
anywhere on the graph. For more information, refer to the Reference Manual, Visually
reading plot coordinates using cross hairs, page 6-241.
• Save as: Opens the save as window, which allows you to save a graph in bitmap (.bmp)
format for use elsewhere, such as in a report. For more information, refer to the Reference
Manual, Saving a graph as a bitmap file, page 6-284.
• Synchronize graphs: For use when the presently open graph is one of several graphs for
the same test (each graph representing the data for a different site). Selecting synchronize
graphs automatically configures the graphs for all sites, identically, using the open graph as
the master. For more information, refer to the Reference Manual, Identically configuring the
graphs resulting from one test executed at multiple sites, page 6-282.
• Move: Toggles between a normal cursor and a crossed-arrow cursor. Moving the crossedarrow cursor moves the graph, allowing you to relocate it on the Graph tab. For more
information, refer to the Reference Manual, Changing the position of a graph, page 6-282.
4200-900-01 Rev. K / February 2017 Return to Section Topics 2-41
Page 98

Section 2: Model 4200-SCS Software Environment Model 4200-SCS User’s Manual
• Reset: Causes colors, graph size, and graph position to be restored to the defaults. For
more information, refer to the Reference Manual, Resetting certain graph properties to KITE
defaults, page 6-284.
• Resize: Toggles between a normal cursor and a ruler cursor. Moving the ruler cursor
expands or contracts the size of the graph. The new size is saved when the graph is saved.
By contrast, selecting Zoom In affects only the view size, which cannot be saved. For more
information, refer to the Reference Manual, Changing the size of a graph, page 6-278.
Defining data to be graphed
The Graph Definition window is used to define the data to be graphed. Figure 2-31 shows the
undefined Graph Definition window for a vds-id ITM.
Figure 2-31
Graph definition window for a vds-id ITM (undefined)
Understanding table columns in the Graph Definition window
The table columns in the Graph Definition window are used as follows:
• Data Series: Lists the names (or other contents
Calc worksheets. If you have generated Append worksheets
column also lists the names of every first-row cell in every Append worksheet. However,
when multiple first-row cells name the same parameter (because multiple sets of data exist
under that name) the following applies:
– The name of the parameter is listed only once under Data Series, because it corresponds
to a family of curves.
– Asterisks (*) appear next to all parameter names listed under Data Series.
• Sheet: Indicates whether the data comes from the Data worksheet, the Calc worksheet, or a
specific Append worksheet.
3. KITE assumes that first-row cells contain variable names. However, a first-row Calc worksheet cell is allowed to
contain a number, and KITE displays such a number under Data Series. Avoid placing numbers (or any unwanted
plot parameter names) in the first row of a Calc worksheet.
4. For more information about generation and use of Append worksheets, refer to Reference Manual, Append execu-
tion of tests, test sequences, and Project Plans, page 6-168, Reference Manual, Understanding and using Append
worksheets of a Sheet tab, page 6-181, and Reference Manual, Appending curves from multiple runs on a single
graph, page 6-285.
2-42 Return to Section Topics 4200-900-01 Rev. K / February 2017
*3
) of every first-row cell of the data and
*4
for the test, the Data Series
Page 99

Model 4200-SCS User’s Manual Section 2: Model 4200-SCS Software Environment
• Column: Lists the parameter’s Data, Calc, or Append worksheet column label (A, B, C, and
so on).
• X, Y1, and Y2: Are the axes of the graph, as follows:
– X is the X axis.
– Y1 is the Y axis on the left side of the graph.
– Y2 is the Y axis on the right side of the graph.
NOTE The scale and label of the Y2 axis are allowed to be different from the scale and label
of the Y1 axis.
The cells under the X, Y1, and Y2 may be selected and deselected by clicking the boxes.
– If you select a cell under X, the corresponding Data Series parameter is plotted on the X
axis. KITE can plot multiple parameters on the X axes when the test does not define a
family of curves (see the Reference Manual, Allow Multiple X’s, page 6-212).
– Similarly, if you select a cell under Y1 or Y2, the corresponding Data Series parameter is
plotted on the Y1 axis or the Y2 axis. KITE can plot multiple parameters on the Y1 and Y2
axes.
Understanding buttons in the Graph Definition window
The buttons of the Graph Definition window are used as follows:
• Clear all: Click the Clear All button to clear all selections under columns X, Y1, and Y2.
NOTE If you click the Clear All button by mistake, click the Cancel button to exit the Graph
Definition window without making any changes.
• Axis properties: A click of the axis properties button opens the axis properties window. You
can also open the axis properties window by selecting axis properties in the graph settings
menu. Before using the axis properties window, refer to the Reference Manual, Defining the
axis properties of the graph, page 6-212.
Opening and using the Graph Definition window
To open and use the Graph Definition window:
1. In the Graph tab, display the graph settings menu by right-clicking the graph or by selecting
Tools
> Graph Settings.
2. In the graph settings menu, select Define Graph. The Graph Definition window opens.
3. Using the Graph Definition window, indicate which parameters are to be plotted and assign
them to appropriate axes by selecting the appropriate X, Y1, and Y2 cells.
4200-900-01 Rev. K / February 2017 Return to Section Topics 2-43
Page 100

Section 2: Model 4200-SCS Software Environment Model 4200-SCS User’s Manual
Figure 2-32
Configured Graph Definition window for a vds-id ITM
4. Click OK. The graph now displays plots of the selected parameters.
In Figure 2-33, the vds-id graph now displays scaled axes and a series of four plots,
based on the selections shown in Figure 2-32. The family of curves corresponds to four sets
of data generated by drain-voltage sweeps at four different gate voltages.
Figure 2-33
View of vds-id graph after Graph Definition window configuration
The axis labels shown in Figure 2-33 are not yet optimally named. KITE inserted the default
data sheet column labels for sweep #1 of the Data Series. For more information about
renaming the axis labels, refer to the Reference Manual, Defining the axis properties of the
graph, page 6-212.
2-44 Return to Section Topics 4200-900-01 Rev. K / February 2017
 Loading...