

Page 1

3PAR InForm Management
Part No. 320-200231 Rev A
July 2010
Console 4.1.0 User’s Guide
Page 2

For Printed Material
Copyright © 2010, 3PAR, Inc. All rights reserved. No part of this publication may be reproduced, stored in a
retrieval system, or transmitted in any form or by any means, electronic, mechanical, photocopying, recording
or otherwise, without the prior written consent of 3PAR, Inc., 4209 Technology Drive, Fremont, CA 94538.
For Electronic Material
The user may print one copy for personal use. Production of multiple copies or copies for sale is strictly
prohibited.
Trademarks
3PAR, the 3PAR logo, InServ, InForm, and InSpire are trademarks or registered trademarks of 3PAR, Inc. All
other trademarks and registered trademarks are the property of their respective owners.
Changes
The material in this document is for information only and is subject to change without notice. While
reasonable efforts have been made in the preparation of this document to assure its accuracy, 3PAR, Inc.
assumes no liability resulting from errors or omissions in this document or from the use of the information
contained herein.
3PAR reserves the right to make changes in the product design without reservation and without notification to
its users.
Page 3

3PAR InForm Management Console 4.1.0 User’s Guide
Table of Contents
Welcome .......................................................................................................... 19
About Units of Measure ...................................................................................... 19
Related Documentation ...................................................................................... 19
Working with the Interface ......................................................................... 20
Components of the Interface .............................................................................. 21
Main Menu Bar.................................................................................................. 22
Main Toolbar .................................................................................................... 25
Management Tree ............................................................................................. 26
Management Tree Structure ........................................................................ 26
Common Actions Panel ...................................................................................... 27
Manager Pane .................................................................................................. 28
System Manager ....................................................................................... 29
Host Manager ............................................................................................ 30
Provisioning Manager ................................................................................. 31
Layout Grid Manager .................................................................................. 32
Remote Copy Manager ............................................................................... 32
Performance Manager ................................................................................ 33
Event Manager .......................................................................................... 34
Task Manager ........................................................................................... 34
Security Manager....................................................................................... 35
Hardware Inventory Manager ...................................................................... 35
Management Window ........................................................................................ 36
Alert/Task/Connection Pane ................................................................................ 37
Status Bar ....................................................................................................... 37
About Introduction Tabs ..................................................................................... 38
Removing the Introduction Tab .................................................................... 38
Restoring the Introduction Tab .................................................................... 38
Selecting Multiple Items ..................................................................................... 39
Refreshing the InForm Management Console ......................................................... 40
Exporting Data ................................................................................................. 40
Filtering ........................................................................................................... 41
Using the Complex Filter ............................................................................. 41
Adding and Applying New Criteria ......................................................... 42
320-200231 Rev A iii
Page 4

3PAR InForm Management Console 4.1.0 User’s Guide
Removing Criteria .............................................................................. 42
Grouping and Ungrouping Criteria ......................................................... 42
Negating Criteria ................................................................................ 42
Using the Quick Filter ................................................................................. 42
Setting Preferences ........................................................................................... 43
Setting Global Preferences .................................................................................. 43
Setting the Display Unit .............................................................................. 44
Setting the WWN Format ............................................................................ 44
Setting the Date and Time Format ............................................................... 44
Resetting Per-Table Format Settings to Default Settings .................................. 44
Configuring Interface, Dialog, and Tab Settings .............................................. 45
Setting Advanced Display Options ................................................................ 45
Setting Per Table References .............................................................................. 45
Column Resizing ........................................................................................ 46
Column Ordering ....................................................................................... 46
Column Visibility ........................................................................................ 46
Choosing Columns ..................................................................................... 47
Table View ................................................................................................ 47
Setting Manager Pane Preferences ....................................................................... 48
Minimizing and Maximizing the Manager Pane ................................................ 48
Resizing the Manager Pane ......................................................................... 48
Customizing the Manager Pane Display ................................................................ 49
Showing Fewer Manager Buttons ................................................................. 49
Showing More Manager Buttons ................................................................... 50
Selecting Manager Buttons to Display ........................................................... 51
Adding and Removing Manager Buttons ........................................................ 52
Restoring Defaults ..................................................................................... 53
Understanding Icons .......................................................................................... 53
Alert Severity Indicators .................................................................................... 53
Status Bar Icons ............................................................................................... 54
System and Component Status Icons ................................................................... 55
Using Help ....................................................................................................... 56
Using the Help Menu Bar .................................................................................... 57
Using the Help Toolbar ....................................................................................... 57
Using the Help Navigator .................................................................................... 58
Using the Table of Contents Tree ................................................................. 58
iv 320-200231 Rev A
Page 5

3PAR InForm Management Console 4.1.0 User’s Guide
Searching the Index ................................................................................... 59
Using the Search Function........................................................................... 59
Using the Glossary ..................................................................................... 59
Using the Favorites Tab .............................................................................. 59
Using the Help Topic Window .............................................................................. 60
Navigating the Help Topic Window ............................................................... 60
Viewing Related Topics ............................................................................... 60
Working with the InServ Storage Server ................................................. 62
Creating Users and Domains ............................................................................... 62
Logging In and Connecting to Systems ................................................................. 62
Forwarding Error Log Files .................................................................................. 63
Working with the System Manager ...................................................................... 64
Viewing System Information ............................................................................... 64
Viewing System Summary Information ................................................................. 65
Viewing all Connected Systems .................................................................... 65
Viewing a Single System ............................................................................. 67
Viewing System Settings .................................................................................... 70
Viewing System Capacity ................................................................................... 72
Viewing System Software ................................................................................... 76
Viewing System Alerts ....................................................................................... 76
Upper Pane ............................................................................................... 77
Lower Pane ............................................................................................... 78
Managing Alerts ................................................................................................ 80
Locating a System ............................................................................................. 80
Editing a System ............................................................................................... 81
Working with Controller Nodes ............................................................................ 82
Viewing Controller Nodes ................................................................................... 83
Viewing the Controller Nodes Summary Screen ..................................................... 84
Viewing Controller Node Alerts ............................................................................ 85
Viewing Controller Nodes Details ......................................................................... 86
Viewing Controller Node Ports Details ................................................................... 88
Viewing Controller Node Power Supplies Details ..................................................... 89
Viewing Controller Node Batteries Details ............................................................. 91
Viewing Controller Node Alerts Details .................................................................. 92
Editing Controller Node Power Supplies ................................................................ 93
320-200231 Rev A v
Page 6

3PAR InForm Management Console 4.1.0 User’s Guide
Editing Controller Node Batteries ......................................................................... 94
Viewing the Controller Node Battery Test Log ........................................................ 94
Resetting the Controller Node Battery Test Log ...................................................... 95
Recharging Controller Node Batteries ................................................................... 95
Working with Drive Cages .................................................................................. 96
Viewing Drive Cages .......................................................................................... 96
Viewing the Drive Cage Summary........................................................................ 97
Viewing Drive Cage Connectivity .................................................................. 98
Viewing Drive Cage Capacity ....................................................................... 99
Viewing Drive Cage Power Supplies .................................................................... 101
Viewing Drive Cage SFPs ................................................................................... 102
Viewing Drive Cage Alerts ................................................................................. 105
Viewing Drive Cage Details ................................................................................ 106
Viewing the Drive Cage Details Summary Tab ...................................................... 106
Viewing the Drive Cage Interface Card Details ...................................................... 110
Viewing the Drive Cage Magazine Details ............................................................. 113
Viewing Drive Cage Physical Disks Details ............................................................ 114
Viewing Drive Cage Power Supply Details ............................................................ 115
Editing Drive Cages .......................................................................................... 116
Locating Drive Cages ........................................................................................ 117
Editing Drive Cage Power Supplies ...................................................................... 117
Working with Ports ........................................................................................... 118
Viewing System Ports ....................................................................................... 118
Viewing Port Summary Information .................................................................... 119
Upper Pane .............................................................................................. 120
Lower Pane .............................................................................................. 120
Port Details Summary ........................................................................ 121
Physical Disks ................................................................................... 125
SFP ................................................................................................. 126
Sessions .......................................................................................... 128
Hosts ............................................................................................... 129
Viewing System Fibre Channel Ports ................................................................... 130
Upper Pane .............................................................................................. 131
Lower Pane .............................................................................................. 133
Fibre Channel Summary ..................................................................... 133
Physical Disks ................................................................................... 136
vi 320-200231 Rev A
Page 7

3PAR InForm Management Console 4.1.0 User’s Guide
SFP ................................................................................................. 137
Hosts ............................................................................................... 139
Viewing System RCFC Ports ............................................................................... 139
Upper Pane .............................................................................................. 140
Lower Pane .............................................................................................. 141
RCFC Port Summary .......................................................................... 141
SFP ................................................................................................. 144
Viewing System iSCSI Ports ............................................................................... 146
Upper Pane .............................................................................................. 147
Lower Pane .............................................................................................. 147
iSCSI Port Summary .......................................................................... 148
Sessions .......................................................................................... 150
Hosts ............................................................................................... 150
Viewing System RCIP Ports ................................................................................ 150
Viewing SFP Information ................................................................................... 153
Viewing System Port Alerts ................................................................................ 157
Configuring Ports ............................................................................................. 159
Configuring Fibre Channel Ports ......................................................................... 160
Configuring iSCSI Ports ..................................................................................... 160
Configuring a Remote Copy over Fibre Channel Port .............................................. 162
Configuring a Remote Copy over IP Port .............................................................. 163
Clearing Port Parameters .................................................................................. 164
Resetting a Port ............................................................................................... 164
Setting a Port Offline ........................................................................................ 165
Initializing a Port .............................................................................................. 165
Synchronizing a Port with the Name Server ......................................................... 166
Issuing an LIP Command .................................................................................. 166
Enabling a Remote Copy Interface ...................................................................... 167
Disabling a Remote Copy Interface ..................................................................... 167
Pinging a Port .................................................................................................. 168
Viewing Physical Disks ...................................................................................... 168
Viewing the Physical Disks Summary Tab ............................................................ 169
Viewing the Physical Disks Tab ........................................................................... 171
Displaying Summary Information ................................................................ 172
Displaying Capacity Information .................................................................. 173
Displaying Chunklet Usage Information ........................................................ 174
320-200231 Rev A vii
Page 8

3PAR InForm Management Console 4.1.0 User’s Guide
Displaying Inventory Information ................................................................ 176
Displaying Environmental Information ......................................................... 177
Displaying State Information ...................................................................... 178
Displaying Paths Information ...................................................................... 179
Viewing the Physical Disks Spares Tab ................................................................ 181
Viewing the Physical Disks Alerts Tab .................................................................. 182
Viewing System Fans ........................................................................................ 183
Working with the Host Manager ............................................................... 184
Viewing Hosts .................................................................................................. 184
Overview of All Hosts ........................................................................................ 185
Overview of a System's Hosts ............................................................................ 186
Viewing Host Information .................................................................................. 188
Upper Pane .............................................................................................. 189
Hosts Tab ......................................................................................... 190
Host Explorer Tab .............................................................................. 192
Lower Pane .............................................................................................. 193
Host Summary Details ....................................................................... 193
VLUN Details .................................................................................... 195
Host Explorer Details ......................................................................... 199
Viewing Paths .................................................................................................. 200
Upper Pane .............................................................................................. 201
Lower Pane .............................................................................................. 202
Active VLUNs .................................................................................... 202
VLUN Templates ................................................................................ 203
Path Summary .................................................................................. 204
Viewing Unassigned Paths ................................................................................. 205
Viewing Host Sets ............................................................................................ 207
Viewing Host Set Details ................................................................................... 208
Working with Hosts .......................................................................................... 210
Creating Hosts ................................................................................................. 210
Editing Hosts ................................................................................................... 212
Removing Hosts ............................................................................................... 214
Adding Hosts to Host Sets ................................................................................. 215
Exporting Virtual Volumes ................................................................................. 215
Working with Host Sets ..................................................................................... 217
viii 320-200231 Rev A
Page 9

3PAR InForm Management Console 4.1.0 User’s Guide
Creating Host Sets ........................................................................................... 217
Editing Host Sets ............................................................................................. 218
Removing Host Sets ......................................................................................... 219
Exporting Virtual Volumes ................................................................................. 220
Working with the Provisioning Manager ................................................. 221
Viewing Provisioning for All Systems ................................................................... 222
Summary Tab .......................................................................................... 223
Alerts Tab ................................................................................................ 224
Viewing Provisioning for a Single System ............................................................. 224
Summary Tab .......................................................................................... 225
Tasks Tab ................................................................................................ 227
Upper Pane .............................................................................................. 227
Lower Pane .............................................................................................. 228
Alerts Tab ................................................................................................ 229
Working with Common Provisioning Groups ......................................................... 229
Viewing Common Provisioning Groups ................................................................. 230
Viewing the Common Provisioning Group Summary Tab ........................................ 230
Viewing the CPGs Tab ....................................................................................... 232
Upper Pane .............................................................................................. 232
Displaying Summary Information ....................................................................... 232
Displaying Allocation Information ....................................................................... 234
Displaying Capacity Information ........................................................................ 235
Displaying Raw Capacity Information .................................................................. 236
Displaying Alert Information .............................................................................. 237
Lower Pane .............................................................................................. 238
Summary Tab .......................................................................................... 238
Settings Tab ............................................................................................ 240
Virtual Volumes Tab .................................................................................. 241
Logical Disks Tab ...................................................................................... 243
Layout Tab .............................................................................................. 244
Alerts Tab ................................................................................................ 244
Viewing the Common Provisioning Group Layout Tab ............................................. 245
Viewing the Common Provisioning Group Alerts Tab .............................................. 245
Creating Common Provisioning Groups ................................................................ 246
Editing a Common Provisioning Group ................................................................. 247
320-200231 Rev A ix
Page 10

3PAR InForm Management Console 4.1.0 User’s Guide
Creating Similar Common Provisioning Groups ..................................................... 249
Saving a Common Provisioning Group as a Template ............................................. 249
Compacting a Common Provisioning Group .......................................................... 250
Removing a Common Provisioning Group ............................................................. 250
Working with Virtual Volumes ............................................................................ 251
Viewing Virtual Volumes .................................................................................... 251
Viewing the Virtual Volumes Summary Tab .......................................................... 252
Viewing the Virtual Volumes Tab ........................................................................ 254
Upper Pane .............................................................................................. 255
Displaying Summary Information ....................................................................... 255
Displaying Allocation Information ....................................................................... 256
Displaying Capacity Information ........................................................................ 257
Displaying Raw Capacity Information .................................................................. 259
Displaying History Information .......................................................................... 260
Displaying Remote Copy Information .................................................................. 261
Lower Pane .............................................................................................. 262
Summary Tab .......................................................................................... 262
Settings Tab ............................................................................................ 264
Advanced Tab .......................................................................................... 266
Logical Disks Tab ...................................................................................... 267
SCSI Reservations Tab .............................................................................. 268
VLUNs Tab ............................................................................................... 270
Layout Tab .............................................................................................. 273
Alerts Tab ................................................................................................ 273
Viewing the Virtual Volumes Layout Tab .............................................................. 274
Viewing the Virtual Volumes Alerts Tab ............................................................... 274
Creating Virtual Volumes ................................................................................... 275
Creating Virtual Volumes (Fully Provisioned from Physical Disks) ............................. 277
Editing Virtual Volumes ..................................................................................... 279
Editing Virtual Volumes (Fully Provisioned from Physical Disks) ............................... 281
Creating Similar Virtual Volumes ........................................................................ 283
Saving a Virtual Volume as a Template ............................................................... 283
Exporting Virtual Volumes ................................................................................. 284
Creating a Remote Copy Group from Virtual Volumes ............................................ 285
Adding a Virtual Volume to a Remote Copy Group ................................................. 286
Moving a Virtual Volume to Another Domain ........................................................ 287
x 320-200231 Rev A
Page 11

3PAR InForm Management Console 4.1.0 User’s Guide
Removing Virtual Volumes ................................................................................. 287
Tuning Virtual Volumes ..................................................................................... 288
Restarting Tuning a Virtual Volume ..................................................................... 289
Rolling Back a Tuned Virtual Volume ................................................................... 289
Working with Virtual Volume Sets ....................................................................... 290
Viewing Virtual Volume Sets .............................................................................. 290
Viewing a Single Virtual Volume Set ............................................................ 291
Creating Virtual Volume Sets ............................................................................. 292
Editing a Virtual Volume Set .............................................................................. 293
Adding a Virtual Volume to a Virtual Volume Set ................................................... 294
Exporting Virtual Volume Sets ............................................................................ 294
Removing a Virtual Volume Set .......................................................................... 295
Working with VLUNs ......................................................................................... 295
Viewing VLUNs ................................................................................................ 296
Active VLUNs Tab ..................................................................................... 296
Displaying Summary Information ....................................................................... 296
Displaying Remote Copy Information .................................................................. 297
VLUN Templates Tab ................................................................................. 298
Upper Pane .............................................................................................. 299
Lower Pane .............................................................................................. 299
Path Summary Tab ................................................................................... 300
Creating VLUNs................................................................................................ 301
Removing VLUNs ............................................................................................. 302
Working with Templates .................................................................................... 302
Viewing Templates ........................................................................................... 303
Upper Pane .............................................................................................. 304
Lower Pane .............................................................................................. 305
Creating Virtual Volume Templates (Thinly Provisioned) ......................................... 305
Editing a Virtual Volume Template (Thinly Provisioned) .......................................... 308
Creating a Virtual Volume Template (Fully Provisioned from Physical Disks) .............. 310
Editing a Virtual Volume Template (Fully Provisioned from Physical Disks) ................ 313
Creating Common Provisioning Group Templates .................................................. 317
Editing a Common Provisioning Group Template ................................................... 320
Copying a Template .......................................................................................... 323
Creating Similar Templates ................................................................................ 323
Removing a Template ....................................................................................... 324
320-200231 Rev A xi
Page 12

3PAR InForm Management Console 4.1.0 User’s Guide
Working with Virtual Copies ............................................................................... 324
Viewing Virtual Copies ...................................................................................... 325
Creating a Virtual Copy ..................................................................................... 325
Editing a Virtual Copy ....................................................................................... 326
Removing a Virtual Copy ................................................................................... 327
Creating a Consistency Group Virtual Copy .......................................................... 327
Creating a Batch Virtual Copy ............................................................................ 328
Promoting a Virtual Copy .................................................................................. 329
Working with Physical Copies ............................................................................. 329
Viewing Physical Copies .................................................................................... 330
Creating a Physical Copy ................................................................................... 330
Editing a Physical Copy ..................................................................................... 331
Removing a Physical Copy ................................................................................. 332
Creating a Consistency Group Physical Copy ........................................................ 332
Stopping a Physical Copy .................................................................................. 333
Resynchronizing a Physical Copy ........................................................................ 333
Promoting a Physical Copy ................................................................................ 334
Working with the Layout Grid Manager .................................................. 335
Viewing Layout Information for All InServs .......................................................... 336
Viewing the Layout Grid for a Single System ........................................................ 337
Viewing the Virtual Volume Layout Grid ....................................................... 337
Viewing the CPG Layout Grid ...................................................................... 338
Viewing the Logical Disk Layout Grid ........................................................... 338
Viewing the Virtual Volumes Layout Screen .......................................................... 339
Viewing the CPGs Layout Screen ........................................................................ 340
Viewing the Logical Disks Layout Screen .............................................................. 341
Viewing the By Logical Disk Screen ..................................................................... 342
Navigation Tree ........................................................................................ 343
Summary Pane ......................................................................................... 343
Logical Disk Layout Pane ........................................................................... 344
Working with the Remote Copy Manager ............................................... 345
Viewing Remote Copy Information ...................................................................... 345
Viewing Available Remote Copy Systems ............................................................. 346
Viewing Remote Copy System Ports .................................................................... 347
RC Ports Tab ............................................................................................ 347
xii 320-200231 Rev A
Page 13

3PAR InForm Management Console 4.1.0 User’s Guide
RCIP Tab ................................................................................................. 349
RCFC Tab ................................................................................................ 351
Inventory Tab .......................................................................................... 354
Viewing Configured Remote Copy Systems .......................................................... 355
Summary Tab .......................................................................................... 356
Remote Copy Link Performance Chart ................................................................. 356
Tasks Tab ................................................................................................ 357
Alerts Tab ................................................................................................ 357
Viewing Remote Copy Groups ............................................................................ 358
Viewing Remote Copy Virtual Volumes ................................................................ 359
Viewing Remote Copy Links ............................................................................... 359
Viewing Remote Copy Targets ............................................................................ 360
Configuring Remote Copy .................................................................................. 361
Configuring Remote Copy Ports .......................................................................... 362
Configuring 1-to-1 Remote Copy ........................................................................ 363
Configuring 1-to-N Remote Copy ........................................................................ 366
Configuring N-to-1 Remote Copy ........................................................................ 369
Configuring Synchronous Long Distance Remote Copy ........................................... 372
Pinging RCIP Links ........................................................................................... 375
Configuring and Pinging the Remote Copy Links ............................................ 375
Pinging the Remote Copy Links ................................................................... 376
Working with Remote Copy Groups ..................................................................... 376
Creating Remote Copy Groups ........................................................................... 376
Starting Remote Copy Groups ............................................................................ 378
Stopping Remote Copy Groups ........................................................................... 378
Synching Remote Copy Groups .......................................................................... 379
Editing Remote Copy Groups ............................................................................. 379
Removing Remote Copy Groups ......................................................................... 381
Working with Remote Copy Links ....................................................................... 381
Creating Remote Copy Links .............................................................................. 382
Removing Remote Copy Links ............................................................................ 382
Pinging RCIP Links ........................................................................................... 383
Configuring and Pinging the Remote Copy Links ............................................ 383
Pinging the Remote Copy Links ................................................................... 383
Working with Remote Copy Targets .................................................................... 384
Creating Remote Copy Targets ........................................................................... 384
320-200231 Rev A xiii
Page 14

3PAR InForm Management Console 4.1.0 User’s Guide
Editing Remote Copy Targets ............................................................................. 386
Removing Remote Copy Targets ......................................................................... 386
Remote Copy Disaster Recovery ......................................................................... 387
Failover Remote Copy Groups ............................................................................ 387
Switch Failover Remote Copy Groups .................................................................. 388
Revert Remote Copy Groups .............................................................................. 389
Recover Remote Copy Groups ............................................................................ 390
Restore Remote Copy Groups ............................................................................ 391
Working with the Performance Manager ................................................ 392
Viewing Performance ........................................................................................ 392
Viewing Performance Over Time ................................................................. 393
Viewing Instantaneous Statistics ................................................................. 394
Creating a New Chart ....................................................................................... 395
Saving a Chart ................................................................................................. 396
Editing a Chart ................................................................................................ 397
Working with the Event Manager ............................................................. 398
Viewing the Alerts Summary .............................................................................. 398
Viewing System Alerts ...................................................................................... 400
Upper Pane .............................................................................................. 401
Lower Pane .............................................................................................. 401
Removing System Alerts ................................................................................... 403
Viewing System Events ..................................................................................... 403
Filtering Events ........................................................................................ 404
Working with the Task Manager ......................................................................... 405
Viewing the Tasks Summary .............................................................................. 405
Displaying Tasks .............................................................................................. 406
Removing Tasks ............................................................................................... 408
Cancelling Tasks .............................................................................................. 408
Working with the Security Manager ......................................................... 409
Viewing the Security System Summary Screen ..................................................... 409
Working with Users .......................................................................................... 412
Viewing Users .................................................................................................. 412
Creating Users ................................................................................................. 414
Editing Users ................................................................................................... 415
Removing Users ............................................................................................... 417
xiv 320-200231 Rev A
Page 15

3PAR InForm Management Console 4.1.0 User’s Guide
Working with Domains ...................................................................................... 417
Viewing Domains ............................................................................................. 418
Viewing Domains for All InServs ................................................................. 418
Viewing Domains for a Single Server ........................................................... 419
Viewing the Domains Summary Tab .................................................................... 419
Viewing the Domains Tab .................................................................................. 422
Summary Information ............................................................................... 422
Capacity Information ................................................................................. 424
Creating Domains ............................................................................................ 425
Editing Domains ............................................................................................... 426
Removing Domains .......................................................................................... 427
Viewing Domain Sets ........................................................................................ 428
Creating Domain Sets ....................................................................................... 429
Editing Domain Sets ......................................................................................... 430
Removing Domain Sets ..................................................................................... 431
Moving Objects from One Domain to Another Domain ........................................... 432
Working with Connections ................................................................................. 433
Viewing User Connections ................................................................................. 433
Removing User Connections .............................................................................. 434
Working with the Hardware Inventory Manager .................................. 435
Viewing the Hardware Inventory Summary Tab .................................................... 436
Viewing the Node Subsystems Tab ..................................................................... 437
Viewing the Node Subsystems Controller Nodes Tab .............................................. 438
Viewing the Node Subsystems CPUs Tab ............................................................. 440
Viewing the Node Subsystems Internal Drives Tab ................................................ 441
Viewing the Node Subsystems Physical Memory Tab ............................................. 443
Viewing the Node Subsystems Adapter Cards Tab ................................................. 444
Viewing the Node Subsystems SFPs Tab .............................................................. 446
Viewing the Node Subsystems Power Supplies Tab ................................................ 447
Viewing the Node Subsystems Batteries Tab ........................................................ 449
Viewing the Cage Subsystems Tab ...................................................................... 450
Viewing the Cage Subsystems Drive Cages Tab .................................................... 451
Viewing the Cage Subsystems Interface Cards Tab ............................................... 452
Viewing the Cage Subsystems SFPs Tab .............................................................. 454
Viewing the Cage Subsystems Magazines Tab ...................................................... 455
320-200231 Rev A xv
Page 16

3PAR InForm Management Console 4.1.0 User’s Guide
Viewing the Cage Subsystems Physical Disks Tab ................................................. 457
Viewing the Cage Subsystems Power Supplies Tab ................................................ 459
Viewing the All Tab ........................................................................................... 460
Glossary .......................................................................................................... 463
Index ............................................................................................................... 471
xvi 320-200231 Rev A
Page 17

3PAR InForm Management Console 4.1.0 User’s Guide
THIS PAGE INTENTIONALLY BLANK
320-200231 Rev A xvii
Page 18

Page 19

3PAR InForm Management Console 4.1.0 User’s Guide
Welcome
Welcome to the 3PAR InForm® Management Console Online Help!
The topics in this Help system contain information about managing 3PAR InServ® Storage
Servers via the InForm Management Console.
The InForm Management Console enables secure configuration and monitoring capabilities
while providing simultaneous access to multiple storage servers.
The InForm Management Console and the topics in this Help system are for use by system
and storage administrators who monitor and direct system configurations and resource
allocation for InServ storage systems.
3PAR technical documents can be found by logging into 3PAR Central's Document Control
System from 3PAR's Support page, at http://support.3PAR.com
Contact your local service provider for technical support and services at:
http://www.3PAR.com/services.html
.
About Units of Measure
.
All units of storage (capacity) are calculated base 2 (x 1,024).
1 KIB = 1,024 bytes
1 MiB = 220 bytes = 1,024 bytes = 1,048,576 bytes
1 GiB = 230 bytes = 1,024 MiB = 1,073,741,824 bytes
1 TiB = 240 bytes = 1,024 GiB = 1,099,511,627,776 bytes
All units of performance (speed) are calculated base 10 (x1000).
1 KB = 1000 bytes
1 MB = 106 bytes = 1000 KIB = 1,000,000 bytes
1 GB = 109 bytes = 1000 MB = 1,000,000,000 bytes
1 TB = 1012 bytes = 1000 GB = 1,000,000,000,000 bytes
Related Documentation
In addition to the topics in this Help system, the following documents also provide
information related to administering InServ Storage Servers:
For information about... Read the...
Installing, starting, and using the
InForm Command Line Interface (CLI)
Using 3PAR Remote Copy software 3PAR Remote Copy User's Guide
Using the InForm Command Line
Interface (CLI)
S-Class and T-Class Storage Server 3PAR InServ S-Class/T-Class Storage
320-200231 Rev A 19
3PAR InForm OS CLI Administrator's
Guide
3PAR InForm OS Command Line
Interface Reference
Page 20

3PAR InForm Management Console 4.1.0 User’s Guide
hardware configurations, component
numbering and layout, and system
cabling
E-Class and F-Class Storage Server
hardware configurations, component
numbering and layout, and system
cabling
Identifying storage server components
and fixing problems
Server Physical Planning Manual
InServ E-Class/F-Class Storage Server
and Third-Party Rack Physical Planning
Manual
InForm OS Messages and Operator's
Guide
Working with the Interface
This topic outlines how to use the InForm Management Console and provides an overview of
the major tasks you can perform.
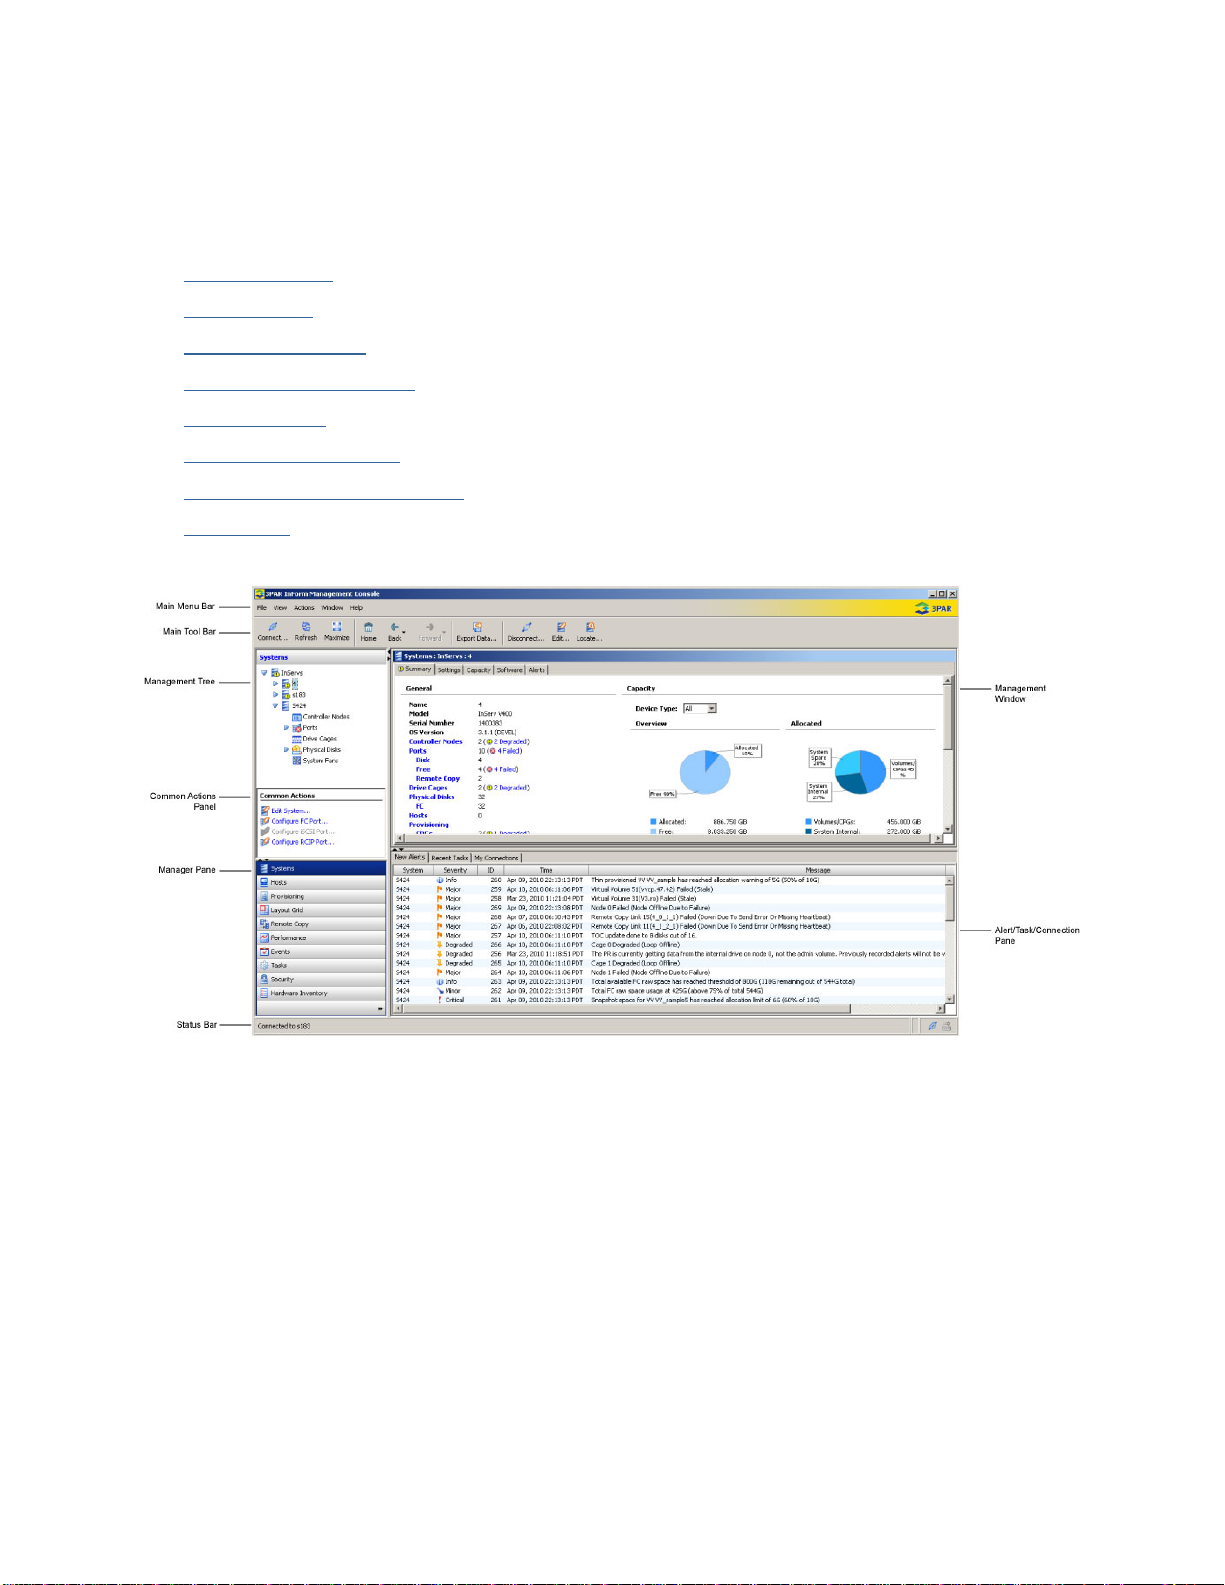
The InForm Management Console interface contains a menu bar, toolbar, management tree,
common actions panel, manager pane, management window, alert/task/connection pane,
and status bar. See Components of the Interface
When starting the InForm Management Console and logging into an InServ Storage Server,
or multiple storage servers, the interface appears displaying the Systems overview screen,
as well as the management tree and alert pane. The status bar is located at the bottom of
the interface.
for further information.
Topics discussed here include:
Components of the Interface
About Introduction Tabs
Selecting Multiple Items
Refreshing the InForm Management Console
Exporting Data
Filtering
Setting Preferences
Understanding Icons
Using Help
20 320-200231 Rev A
Page 21
3PAR InForm Management Console 4.1.0 User’s Guide
Components of the Interface
The InForm Management Console is made up of the following components:
Main Menu Bar
Main Toolbar
Management Tree
Common Actions Panel
Manager Pane
Management Window
Alert/Task/Connection Pane
Status Bar
320-200231 Rev A 21
Page 22

3PAR InForm Management Console 4.1.0 User’s Guide
Main Menu Bar
The following items are available from the Main Menu Bar:
Menu Command Description
File Connect
Exit Closes all windows and exits the InForm GUI.
View Refresh Refreshes the InForm Management Console.
Auto-Refresh
Maximize
Disconnect
Displays the Connect dialog box, allowing you
to connect additional storage server(s).
Displays the Disconnect dialog box, allowing
you to disconnect from storage server(s).
Automatically refreshes the InForm Management
Console. By default, Auto-Refresh is selected.
Expands the Application Window so it consumes
the entire InForm Management Console window.
Export Data
Grid
Preferences
22 320-200231 Rev A
Displays the Export Data window, allowing you
to save table data as CSV or HTML format.
Displays a submenu for setting the Zoom,
<Set|Clear> Grid Sticky, <Show|Hide>
Details Table.
Opens the Preferences window, allowing you to
define Data Format and Look and Feel options
for determining how data is displayed. See
Setting Preferences
.
Page 23

3PAR InForm Management Console 4.1.0 User’s Guide
Actions Systems
Hosts
Provisioning
Remote Copy
Alert
Performance
Displays a submenu providing access to system
level options.
Displays a submenu providing access to host
creation, edit, and removal functions.
Displays a submenu providing access to all
aspects for provisioning storage, including VVs,
VLUNs, CPGs, LDs, and Templates.
Displays a submenu providing access to set up
and edit Remote Copy configurations.
Displays a submenu for working with the
selected alert. See Managing Events and Alerts.
Displays a submenu providing options to
performance charting, including new, open,
save, and edit functions.
Task
Security
Window Cascade
Tile
Tile
Horizontally
Tile Vertically
Displays a submenu allowing you to cancel and
remove tasks.
Displays a submenu providing access for working
with users and domains.
Arranges Application Windows so they overlap
one another, but every window is visible within
the desktop.
Arranges and resizes all Application Windows to
fit inside the desktop.
Tiles all Application Windows horizont ally in the
desktop.
Tiles all Application Windows vertically in the
desktop.
320-200231 Rev A 23
Page 24

3PAR InForm Management Console 4.1.0 User’s Guide
Close All Closes all open Application Windows.
Restore
Minimize Minimizes the selected Application Window.
Maximize Maximizes the selected Application Window.
1...<List of
Help
Open
Windows>
Topics
About 3PAR
InForm
Management
Console
Restores the selected Application Window from
the TasKiBar to the desktop.
Restores the selected Application from the
TasKiBar to the Desktop.
Opens the Help Navigator and the Help Topic
Window, providing access to the InForm
Management Console Online Help system.
Displays the About 3PAR InForm
Management Console dialog box, which
contains version number, software patch, and
copyright information.
24 320-200231 Rev A
Page 25

3PAR InForm Management Console 4.1.0 User’s Guide
Main Toolbar
The Main Toolbar is displayed as follows:
The following default items are available from the Main Toolbar:
Command Description
Connect
Displays the Connect dialog box, allowing you to connect additional
storage server(s).
Refresh Refreshes the InForm Management Console.
Maximize
Expands the Management Window so it consumes the entire InForm
Management Console window.
Restore Restores the Management Window to its original size.
Home
Returns all panes, the Management Tree, and Management Window
to the default view (Systems Introduction).
Back/Forward Returns backward or forward to the previously selected Manager
Pane, Management Tree item, and Management Window display.
Export
Displays the Export Data window, allowing you to save table data as
CSV or HTML format.
Additional actions are displayed on the Main Toolbar depending on the selected manager,
node selected from the Management Tree, and item selected from the Management
Window.
See also:
Management Tree
Manager Pane
Management Window
Working with the Systems Manager
Working with the Hosts Manager
320-200231 Rev A 25
Page 26

3PAR InForm Management Console 4.1.0 User’s Guide
Working with the Provisioning Manager
Working with the Layout Grid Manager
Working with the Remote Copy Manager
Working with the Performance Manager
Working with the Events Manager
Working with the Tasks Manager
Working with the Security Manager
Working with the Hardware Inventory Manager
Management Tree
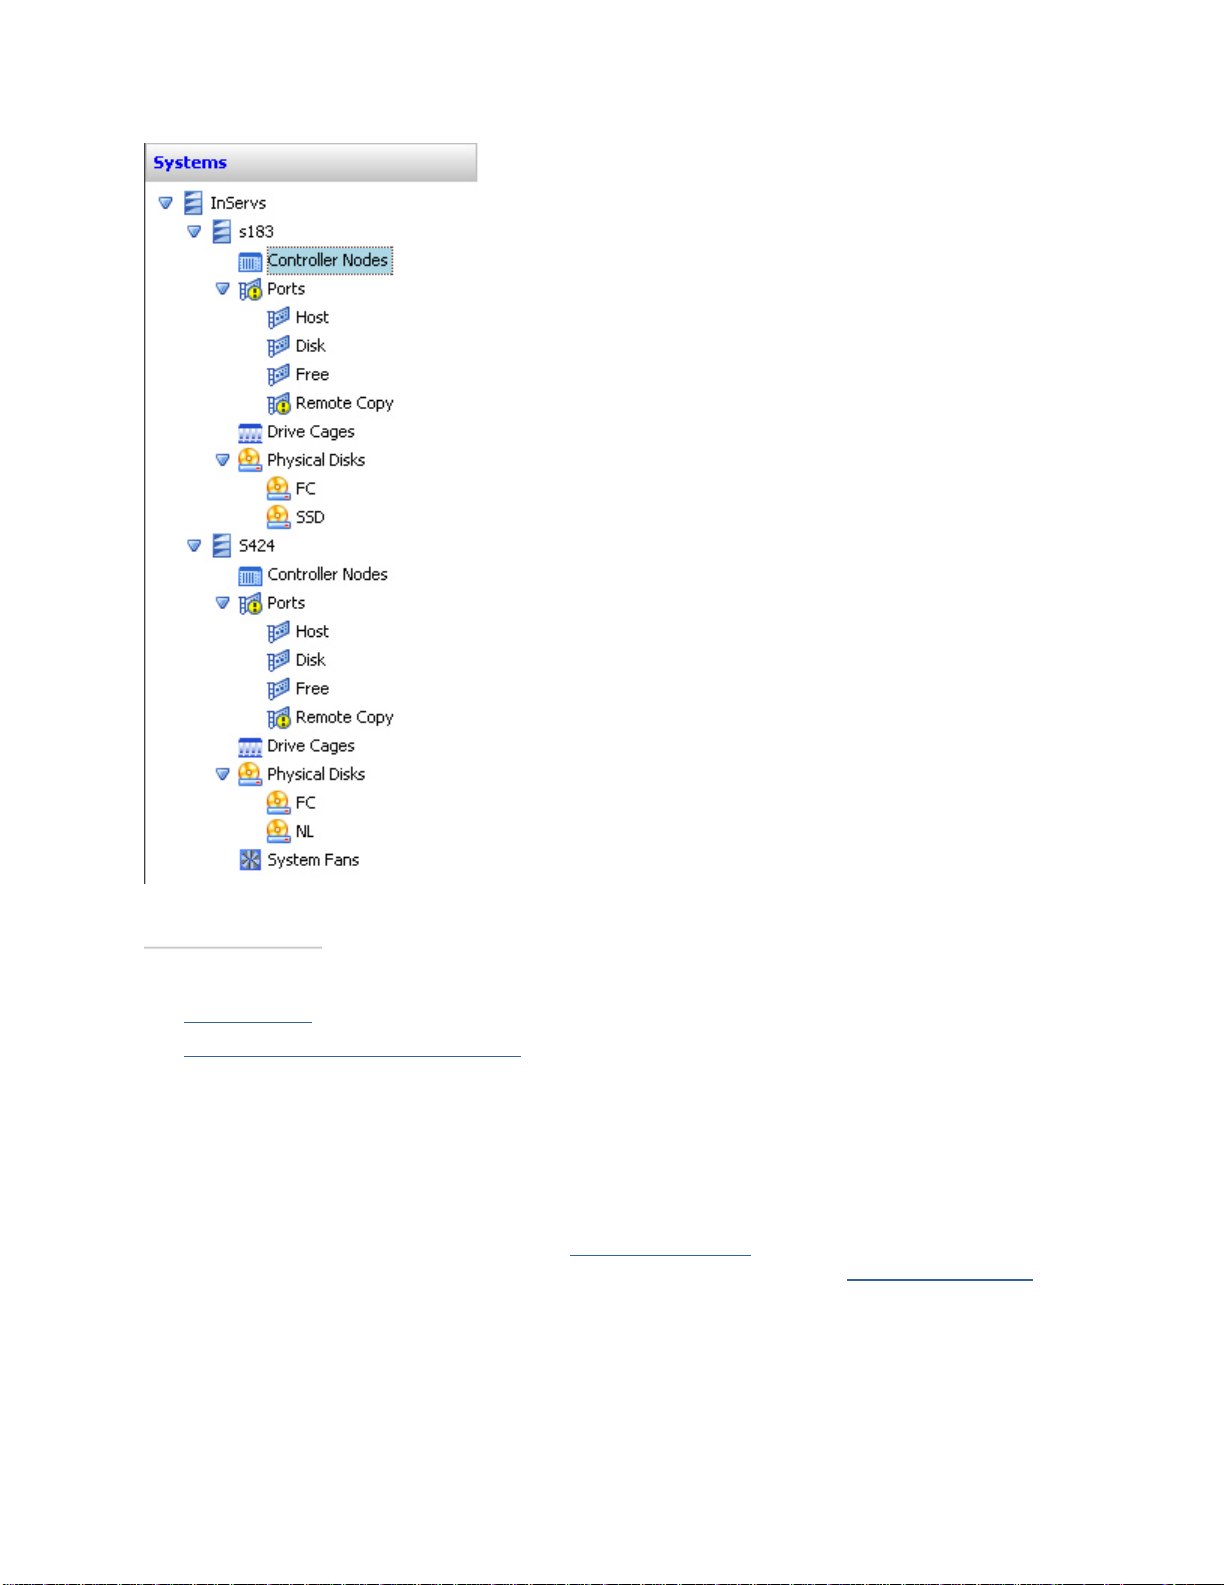
The Management Tree displays information relevant to the selected manager from the
Manager Pane
connected to the InForm Management Console. Additional icons displayed on the
Management Tree are specific to the manager selected. For example, in the figure below the
Management Tree displays icons specific to the Systems manager. The Management Tree
also has shortcut menus that contain useful commands.
. At its most basic, the Management Tree displays which storage servers are
Management Tree Structure
When you click an icon on the Management Tree, the associated data is displayed in the
Management Window
system's ports is displayed.
Each icon displayed with an expandable triangle (
expandable triangle also indicates that that node can be expanded to display additional
information. The Management Tree nodes are displayed in a parent/child relationship. For
example, in the figure below the connected storage servers (s183 and S424) are displayed
as child nodes of the InServs parent node. Ports and Physical Disks are further displayed
as child nodes of the connected servers.
Also included for quick visual reference, Normal
are displayed in the tree to quickly identify systems or related system components that may
require attention.
. For example, if you click the Ports icon, information about a
) to its left is called a node. An
, Degraded , or Failed status icons
26 320-200231 Rev A
Page 27
3PAR InForm Management Console 4.1.0 User’s Guide
See also:
Manager Pane
System and Component Status Icons
Common Actions Panel
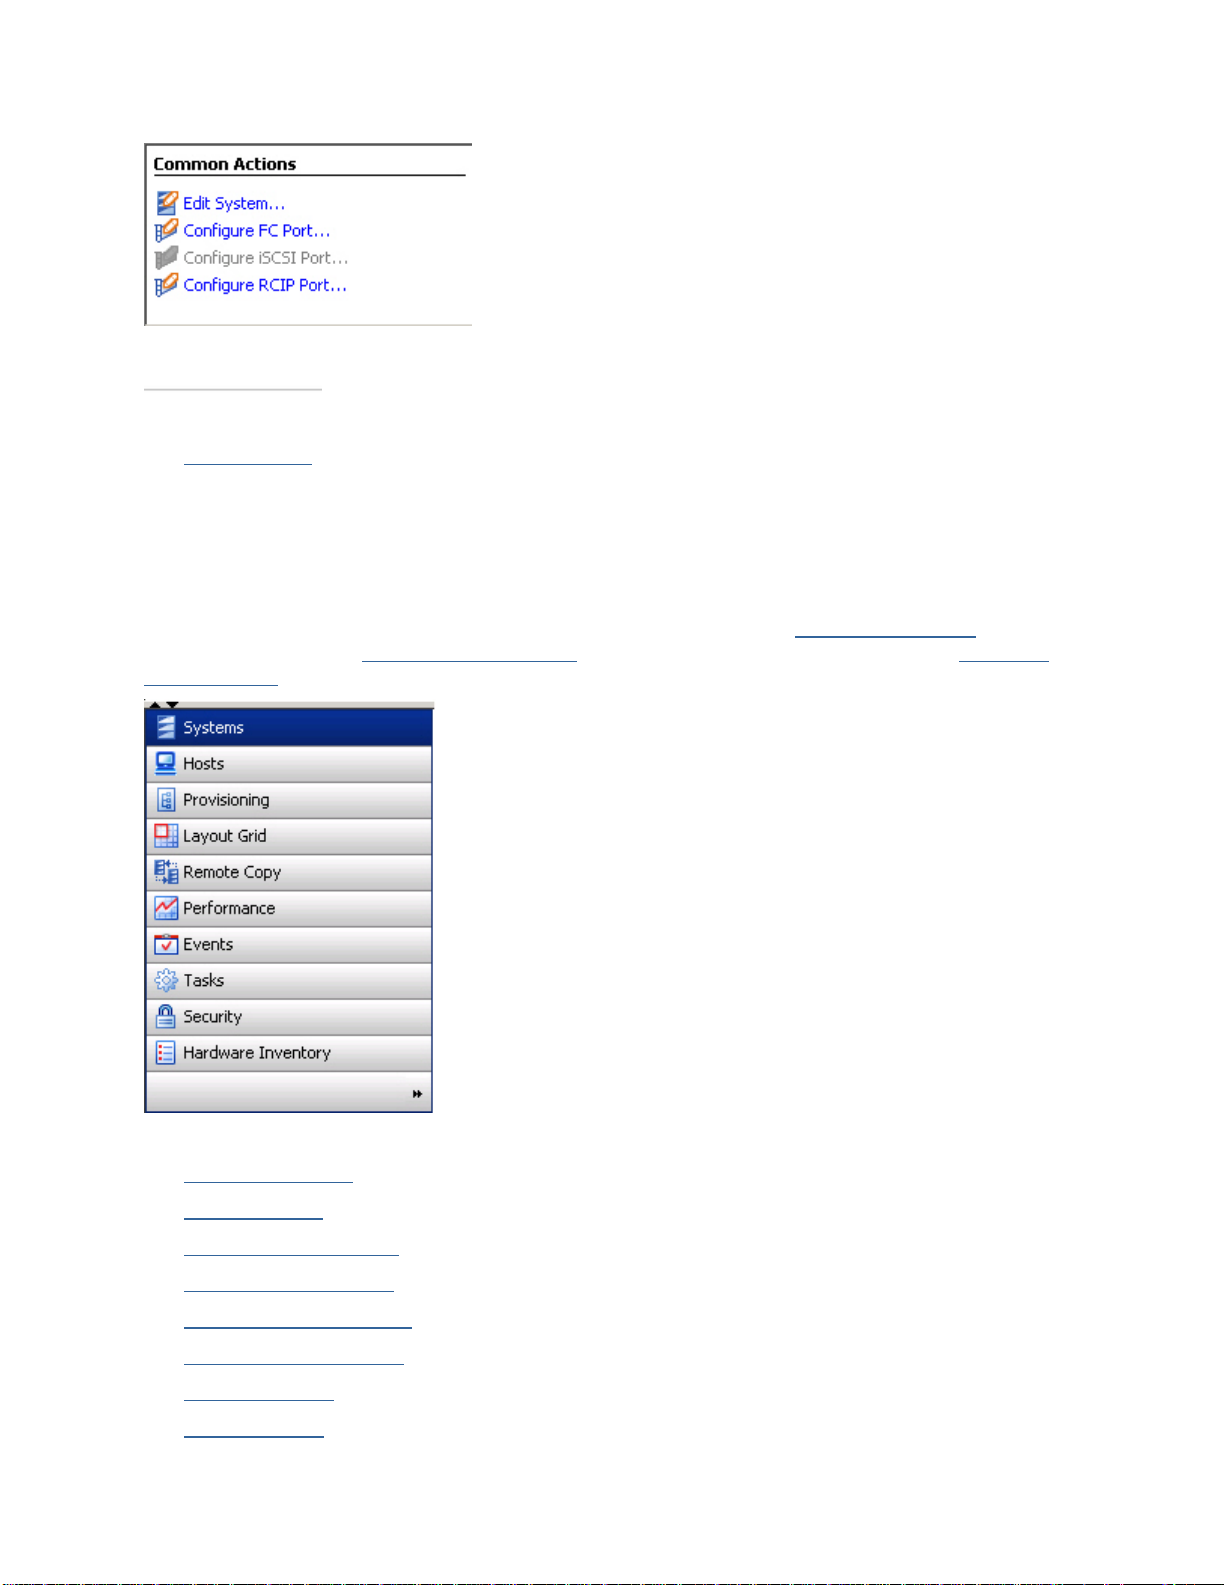
The Common Actions Panel provides quick access to functions commonly performed with
each manager in the Manager Pane. Clicking an action listed in the Common Action Panel
launches that action's wizard. As with the Management Tree
Common Actions Panel are specific to the selected manager from the Management Pane
Unavailable functions are displayed in grey. For example, in the figure below the actions
displayed in the Common Actions panel are specific to the Systems manager selected in the
Manager Pane.
, the functions provided in the
.
320-200231 Rev A 27
Page 28
3PAR InForm Management Console 4.1.0 User’s Guide
See also:
Manager Pane
Manager Pane
Managers are groups of displays and actions, which are specific to different InServ Storage
Server areas of management. The selected manager affects the Management Tree
data displayed in the Management Window
Actions Panel.
, and, if applicable, the actions in the Common
display,
The following managers are contained in the Manager Pane:
System Manager
Host Manager
Provisioning Manager
Layout Grid Manager
Remote Copy Manager
Performance Manager
Event Manager
Task Manager
28 320-200231 Rev A
Page 29
3PAR InForm Management Console 4.1.0 User’s Guide
Security Manager
Hardware Inventory Manager
For instructions on modifying the display of the Manager Pane, see Setting Manager Pane
Preferences and Customizing the Manager Pane Display.
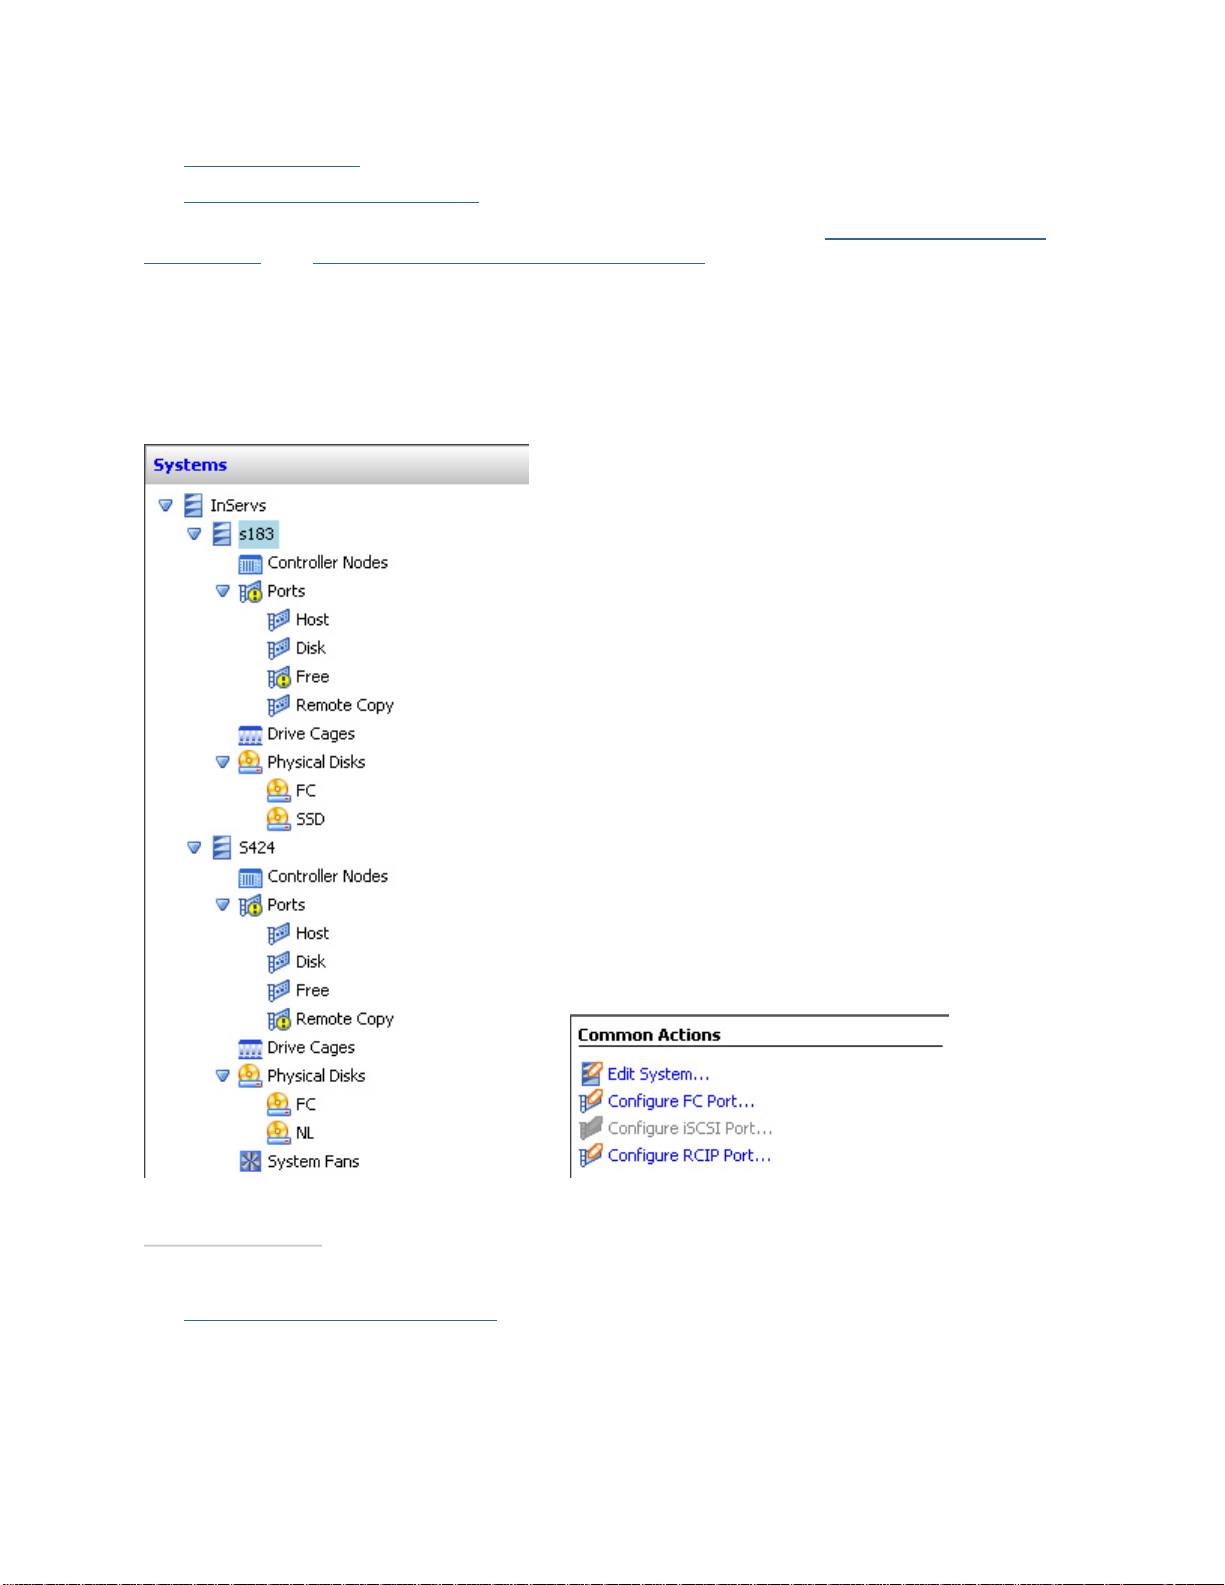
System Manager
The System Manager allows you to view and perform system-level actions and
information. When the System Manager is selected, the Management Tree and Common
Actions Panel appear as follows:
See also:
Working with the System Manager
320-200231 Rev A 29
Page 30

3PAR InForm Management Console 4.1.0 User’s Guide
Host Manager
The Host Manager allows you to view and perform host-specific actions and information.
When the Host Manager is selected, the Management Tree and Common Actions Panel
appear as follows:
See also:
Working with the Host Manager
30 320-200231 Rev A
Page 31

3PAR InForm Management Console 4.1.0 User’s Guide
Provisioning Manager
The Provisioning Manager allows you to view and perform system provisioning actions
and information. When the Provisioning Manager is selected, the Management Tree and
Common Actions Panel appear as follows:
See also:
Working with the Provisioning Manager
320-200231 Rev A 31
Page 32

3PAR InForm Management Console 4.1.0 User’s Guide
Layout Grid Manager
The Layout Grid Manager allows you to view the layout of virtual volumes, Common
Provisioning Groups (CPGs), and logical disks of InServ Storage Servers. When the Layout
Grid Manager is selected, the Management Tree appears as follows:
See also:
Working with the Layout Grid Manager
Remote Copy Manager
The Remote Copy Manager allows you to view and perform Remote Copy actions and
information. When the Remote Copy Manager is selected, the Management Tree and
Common Actions Panel appear as follows:
See also:
Working with the Remote Copy Manager
32 320-200231 Rev A
Page 33

3PAR InForm Management Console 4.1.0 User’s Guide
Performance Manager
The Performance Manager allows you to view system performance information and work
with performance charts. When the Performance Manager is selected, the Management
Tree and Common Actions Panel appear as follows:
See also:
Working with the Performance Manager
320-200231 Rev A 33
Page 34

3PAR InForm Management Console 4.1.0 User’s Guide
Event Manager
The Event Manager allows you to view InServ Storage Servers alerts and events. When
the Event Manager is selected, the Management Tree appears as follows:
See also:
Working with the Events Manager
Task Manager
The Task Manager allows you to view and perform system task actions and information.
When the Task Manager is selected, the Management Tree and Common Actions Panel
appear as follows:
See also:
Working with the Tasks Manager
34 320-200231 Rev A
Page 35

3PAR InForm Management Console 4.1.0 User’s Guide
Security Manager
The Security Manager allows you to view and work with system users, domains, and
connections. When the Security Manager is selected, the Management Tree and Common
Actions Panel appear as follows:
See also:
Working with the Security Manager
Hardware Inventory Manager
The Hardware Inventory Manager allows you to view InServ Storage Servers hardware
components. When the Hardware Inventory Manager is selected, the Management Tree
appears as follows:
See also:
Working with the Hardware Inventory Manager
320-200231 Rev A 35
Page 36

3PAR InForm Management Console 4.1.0 User’s Guide
Management Window
The Management Window displays data, as well as additional options for viewing data. The
data displayed in the Management Window is dependent on the selected manager from the
Manager Pane
and the selected node from the Management Tree.
Also included for quick visual reference, Normal
are displayed in the tree to quickly identify systems or related system components that may
require attention.
In the example below, the Management Window displays system summary data for the
selected node, s183.
, Degraded , or Failed status icons
See also:
Management Tree
Manager Pane
System and Component Status Icons
36 320-200231 Rev A
Page 37

3PAR InForm Management Console 4.1.0 User’s Guide
Alert/Task/Connection Pane
The Alert/Task/Connection pane is provided for quick reference to new system alerts, recent
tasks, and user connections. Each set of information is displayed on its own tab within the
pane.
See also:
Alert Severity Indicators
Viewing System Alerts
Working with the Tasks Manager
Viewing User Connections
Managing Alerts
Status Bar
The Status Bar is located at the bottom of the InForm Management Console.
The left side of the Status Bar displays the last action performed with the InForm
Management Console.
The right side of the Status Bar displays icons representing the highest alert level,
connection status, and data retrieval process status.
The right side of the Status bar also displays an icon for any runtime exceptions. The icon
can be clicked to view details about the exception.
320-200231 Rev A 37
Page 38

3PAR InForm Management Console 4.1.0 User’s Guide
See also:
Alert Severity Indicators
Status Bar Icons
About Introduction Tabs
Managers are groups of displays and actions, which are specific to different InServ Storage
Server areas of management. The selected manager affects the Management Tree
data displayed in the Management Window
Actions Panel. Each manager is provided with an Introduction tab in the Management
Window. Each Introduction tab contains topical overview information about the selected
manager. For example, when selecting the Remote Copy Manager, the Introduction tab
provides overview information about 3PAR Remote Copy and about tasks that can be
performed in the Remote Copy Manager. The left side of the Introduction tabs provide
links to help topics relevant to the selected manager.
, and, if applicable, the actions in the Common
display,
Removing the Introduction Tab
A manager's Introduction tab can be closed at any time by clicking Close Tab in the
upper right corner of the tab.
If you wish to hide all Introduction tabs in the managers:
1. Access the Preferences dialog box from the Main Menu Bar by clicking View >
Preferences.
2. Click the Settings tab.
3. In the Introduction Tabs group box, click Remove All Tabs.
4. Click Apply.
5. Click OK to exit the Preferences dialog box.
Note: Once an Introduction tab is closed or hidden, it will not appear again
until you manually restore the tab via Preferences.
Restoring the Introduction Tab
If you wish to restore closed or hidden Introduction tabs:
1. Access the Preferences dialog box from the Main Menu Bar by clicking View >
Preferences.
2. Click the Settings tab.
3. In the Introduction Tabs group box, click Restore All Tabs.
4. Click Apply.
5. Click OK to exit the Preferences dialog box.
38 320-200231 Rev A
Page 39

3PAR InForm Management Console 4.1.0 User’s Guide
See also:
Management Tree
Manager Pane
Setting Global Preferences
Selecting Multiple Items
The InForm Management Console supports the standard Shift+click functionality to select
a contiguous block of items, and the standard Ctrl+click functionality to select several noncontiguous items. These functions can be used in most of the managers listed in the
Manager Pane
For example, when creating a virtual volume set, you can use specific v irt ual volumes to
form the set by either using the Shift+click or Ctrl+click function to select a group of
virtual volumes.
to facilitate actions.
See also:
Exporting Data
Filtering
Working with the Systems Manager
Working with the Hosts Manager
Working with the Provisioning Manager
Working with the Layout Grid Manager
Working with the Remote Copy Manager
Working with the Performance Manager
Working with the Events Manager
Working with the Tasks Manager
Working with the Security Manager
320-200231 Rev A 39
Page 40

3PAR InForm Management Console 4.1.0 User’s Guide
Refreshing the InForm Management
Console
To refresh the data displayed in the Management Window and Alert/Task/Connection
Panel, click Refresh in the Main Toolbar.
See also:
Main Toolbar
Exporting Data
You can export data as a Comma Separated Variable (CSV) or HTML file from all InForm
Management Console displays (except for Performance).
The Export Data dialog can be accessed by performing one of the following:
Clicking View > Export Data.
Clicking Export Data from the Main Toolbar
To export data in a currently displayed table in the Management Window:
1. Access the Export Data dialog.
2. From the Select a format list, select either CSV Format or HTML Format.
3. From the Destination group box, select either Clipboard (default) or File.
4. If more than one row was selected from the table containing the data to be saved, from
the Range group box, select either All (default) or Selection.
40 320-200231 Rev A
Page 41

3PAR InForm Management Console 4.1.0 User’s Guide
5. Click OK.
6. If you selected File as the save destination, the Save Chart dialog appears. Navigate
and save the file.
Filtering
The InForm Management Console provides a filtering panel, which is located at the top of
most Management Window displays.
The filtering panel provides two filtering options:
Complex Filter
Quick Filter
Using the Complex Filter
The complex filter allows you to define specific criteria by which to search.
Access the complex filter by clicking Filter on the filtering panel.
320-200231 Rev A 41
Page 42

3PAR InForm Management Console 4.1.0 User’s Guide
Note: The entries listed under the Property list correspond to the table
headings displayed in the Management Window.
Adding and Applying New Criteria
1. Select a property from the Property list.
2. Select an operator from the Operator list.
3. Select a value from the Value list.
4. (Optional) Select the Range checKiBox to define a second value to compare against the
first value. This is the same as selecting in range from the Operator list.
5. Click Apply to apply the criteria.
6. To remove listed criteria, click Clear.
7. Continue to add additional criteria as needed. Repeat steps 1 through 5.
Removing Criteria
To remove criteria defined in the Criteria filed, select th e criteria and click Remove.
Grouping and Ungrouping Criteria
To group criteria defined in the Criteria field, select two or more criteria and click Group.
To ungroup a criteria group defined in the Criteria field, select the grouped criteria and
click Ungroup.
Negating Criteria
To negate criteria defined in the Criteria field, select the criteria and click Negate.
See also:
Selecting Multiple Items
Using the Quick Filter
The quick filter allows you to define a quick filter based on what filter text is typed in the
top-right text box. The default behavior is to display rows that have rows matching the
input text.
You can choose to have only certain columns matching the input text by clicking the down
arrow, which is located immediately to the left of the simple filter text box.
42 320-200231 Rev A
Page 43

3PAR InForm Management Console 4.1.0 User’s Guide
Note: The columns displayed in the filter list are dependent on the contents
of the table you are currently viewing, for example ports, physical disks, etc.
Setting Preferences
The InForm Management Console allows you to set global preferences, set preferences for
each table, and set Manager Pane viewing preferences.
Setting Global Preferences
Setting Per Table Preferences
Setting Manager Pane Preferences
Setting Global Preferences
The Preferences dialog box allows you to set global preferences for all systems displayed
on the InForm Management Console. These preferences are saved on the system and
remembered the next time you log in using the InForm Management Console. The
Preferences dialog box contains three tabs; Data Format, Settings, and Advanced.
This topic provides procedures for the following:
Setting the Display Unit
Setting the WWN Format
Setting the Date and Time Format
Resetting Per-Table Format Settings to Default Settings
Configuring Interface, Dialog, and Tab Settings
Setting Advanced Display Options
320-200231 Rev A 43
Page 44

3PAR InForm Management Console 4.1.0 User’s Guide
Access the Preferences dialog box from the Main Menu Bar by clicking View >
Preferences.
Setting the Display Unit
To set the display unit:
1. Select the Data Format tab on the Preferences dialog box.
2. From the Display Unit group box, select the desired option (GB is the default display
unit).
3. If you do not want to display the selected unit on the table heading row, uncheck the
Display Unit on Header checKiBox.
4. Click Apply to continue modifying preferences, or click OK when finished.
Setting the WWN Format
To set the WWN format:
1. Select the Data Format tab on the Preferences dialog box.
2. From the WWN group box, select the desired WWN format (0F0F0F0F0F0F0F0F is
the default format).
3. Click Apply to continue modifying preferences, or click OK when finished.
Setting the Date and Time Format
To set the date and time format:
1. Select the Data Format tab on the Preferences dialog box.
2. From the Data Time group box, select the desired data and time format (Long
Display is the default format).
3. Click Apply to continue modifying preferences, or click OK when finished.
Resetting Per-Table Format Settings to Default Settings
To set reset per-table format settings to their default settings:
1. Select the Data Format tab on the Preferences dialog box.
2. Select the Reset Per-Table Format Preferences to Default checKiBox.
3. Click OK.
See also:
Setting Per Table Preferences
44 320-200231 Rev A
Page 45

3PAR InForm Management Console 4.1.0 User’s Guide
Configuring Interface, Dialog, and Tab Settings
To configure interface and dialog settings:
1. Select the Settings tab on the Preferences dialog box.
2. Select the user interface elements and dialog boxes you wish to view in the InForm
Management Console Interface by selecting the appropriate checKiBoxes.
3. Select whether to view Introduction tabs by clicking Remove All Tabs or Restore All
Tabs.
4. Click Apply to continue modifying preferences, or click OK when finished.
Setting Advanced Display Options
To set advanced display options:
1. Select the Advanced tab on the Preferences dialog box.
2. Select whether to view the Port State of loss sync as failed.
3. Select whether to view physical disk spares, advanced volume properties, logical disks,
and SCSI reservations by selecting the appropriate checKiBoxes.
4. Click Apply to continue modifying preferences, or click OK when finished.
Setting Per Table References
The InForm Management Console allows you to set per-table preferences. These
preferences are saved on the system and remembered the next time you log in using the
InForm Management Console.
Note: The per-table preferences and changes made by manually dragging
and sorting tables override any preferences specified when Setting Global
Preferences.
This topic provides procedures for the following:
Column Resizing
Column Ordering
Column Visibility
Choosing Columns
Table View
320-200231 Rev A 45
Page 46

3PAR InForm Management Console 4.1.0 User’s Guide
Column Resizing
To resize a table column:
1. Place your mouse on the right edge of a table heading row.
2. When the resize pointer appears, click and drag the mouse to resize the column.
Column Ordering
To quickly rearrange the order of displayed table columns, click and drag any column to a
different location in the table.
Note: See Setting Global Preferences to learn how to make global changes to
tables and InForm Management Console display properties using the
Preferences dialog box. Changes made by clicking and dragging columns (as
described in this topic) override any preferences set in the Preferences dialog
box.
See also:
Setting Global Preferences
Column Visibility
To hide a column in a table, right-click the table column heading you wish to hide and click
Hide.
Note: The InForm Management Console does not allow hiding of all columns
in a table.
To show a column in a table, right-click any table column headin g and click Show >
<column heading>.
46 320-200231 Rev A
Page 47

3PAR InForm Management Console 4.1.0 User’s Guide
Choosing Columns
To show, hide, or reorder multiple table columns at one time:
1. Right-click any table heading column and click Choose Columns.
2. To hide columns, select the column from the Show list and click the right arrow button.
3. To show columns, select the column from the Hide list and click the left arrow button.
4. To reorder columns, select the column from the Show list and click the up or down
arrow button.
5. Click OK.
See also:
Selecting Multiple Items
Table View
To apply a saved table view, right-click any table heading column and click Table View >
<table view name>.
To save the current table view as it has been edited by the previous procedures:
1. Right-click any table heading column and click Table View > Save As.
2. Enter a name for the table view you wish to save.
3. Click OK.
To remove a saved table view:
1. Right-click any table heading column and click Table View > Remove.
2. Enter the table view you wish to remove.
3. Click OK.
320-200231 Rev A 47
Page 48

3PAR InForm Management Console 4.1.0 User’s Guide
Setting Manager Pane Preferences
The InForm Management Console allows you to set Manager Pane display preferences.
These preferences are saved on the system and remembered the next time you log in using
the InForm Management Console.
This topic provides procedures for the following:
Minimizing and Maximizing the Manager Pane
Resizing the Manager Pane
Minimizing and Maximizing the Manager Pane
To minimize the Manager Pane, click the down arrow located at the top of the Manager
Pane.
When minimized, each manager in the Manager Pane changes to an icon.
To maximize the Manager Pane, click, the up arrow located at the top of the minimized
Manager Pane.
When maximized, the manager icons are restored to buttons.
The following figures display the Manager Pane maximized (left figure) and minimized (right
figure).
Resizing the Manager Pane
To resize the Manager Pane:
1. Place your mouse on the top edge of the Manager Pane.
2. When the resize pointer appears, click and drag the mouse to resize the column.
48 320-200231 Rev A
Page 49

3PAR InForm Management Console 4.1.0 User’s Guide
Note: When making the Manager Pane smaller, the Manager buttons located
at the bottom of the pane change to icons. The icons are restored to buttons
when enlarging the Manager Pane.
See also:
Customizing the Manager Pane Display
Manager Pane
Customizing the Manager Pane Display
The InForm Management Console allows you to customize the Manager buttons that appear
in the Management Pane. This allows you to set up the Manager Pane to display only
commonly used Managers. Additionally, it allows you to reduce the amount of space used by
the Manager Pane, which can be useful if you have a large Management Tree.
Showing Fewer Manager Buttons
Showing More Manager Buttons
Selecting Manager Buttons to Display
Adding and Removing Manager Buttons
Restoring Defaults
Showing Fewer Manager Buttons
By default, all Manager buttons are displayed in the Manager Pane. To display fewer
buttons:
1. Click the right arrow button at the bottom of the Manager Pane.
2. Click Show Fewer Buttons.
320-200231 Rev A 49
Page 50

3PAR InForm Management Console 4.1.0 User’s Guide
The last Manager button in the Manager Pane is minimized and is displayed as an icon
at the bottom of the Manager Pane.
Repeating steps 1 and 2 continues to minimize Manager buttons and display them as
icons at the bottom of the Manager Pane. For example, if the Hardware Manager button
is minimized, the next Manager button to be minimized is the Security Manager button,
followed by the Tasks Manager button, etc.
Note: The minimized Manager is still functional. Click t he minimized
Manager's icon to invoke that Manager's functionality.
Showing More Manager Buttons
If you have modified the Manager Pane to display fewer Manger buttons, to show more
Manager buttons:
1. Click the right arrow button at the bottom of the Manager Pane.
2. Click Show More Buttons.
50 320-200231 Rev A
Page 51

3PAR InForm Management Console 4.1.0 User’s Guide
The most recently minimized Manager button is restored to the Manager Pane (the leftmost displayed Manager icon).
Repeating steps 1 and 2 continues to restore Manager buttons in the order in which
they were last minimized from the Manager Pane. For example, if the Tasks Manger
button was restored, the next Manager button to be restored is the Security Manager
button, followed by the Hardware Inventory Manager button.
Selecting Manager Buttons to Display
To select Manager buttons to show and hide in the Manager Pane:
1. Click the right arrow button at the bottom of the Manager Pane.
2. Click Choose Buttons.
3. In the Choose Buttons dialog box, select the Manager buttons to display by clicking
one or more Manager and moving to the Show and Hide lists using the right and left
arrow buttons.
320-200231 Rev A 51
Page 52

3PAR InForm Management Console 4.1.0 User’s Guide
4. Select the order in which the Manager buttons in t he Show list are displayed by
selecting a Manager and then clicking the up and down arrow buttons to move the
Manager to its display location.
5. Click OK.
The Manager buttons that you chose to display are displayed in the Manager Pane in the
order you specified. The Manager buttons that you chose to hide are not displayed as
buttons or icons in the Manager Pane.
Adding and Removing Manager Buttons
To remove Manager buttons from the Manager Pane:
1. Click the right arrow button at the bottom of the Manager Pane.
2. Click Add or Remove Buttons > uncheck the Manager button you wish to remove.
Note: After removing a Manager button, the Manager Pane automatically
resizes itself to equal the total length of displayed Manager buttons.
To add Manager buttons to the Manager Pane:
1. Click the right arrow button at the bottom of the Manager Pane.
2. Click Add or Remove Buttons > check the Manager button you wish to add.
52 320-200231 Rev A
Page 53

3PAR InForm Management Console 4.1.0 User’s Guide
Note: When adding a Manager button back to the Manager Pane, yo u must
manually resize the Manager Pane in order for all Manager buttons to display.
See Resizing the Manager Pane.
Restoring Defaults
To restore the default view of the Manger Pane:
1. Click the right arrow button at the bottom of the Manager Pane.
2. Click Restore Defaults.
See also:
Setting Manager Pane Preferences
Manager Pane
Understanding Icons
The InForm Management Console uses icons for quick visual reference of alerts, system
status, and system components and objects status.
Alert Severity Indicators
Status Bar Icons
System and Component Status Icons
Alert Severity Indicators
The alert pane and status bar use the following icons to indicate alert severity levels. On the
status bar, the alert severity indicator tells you the severity level of the most serious alert
for all systems currently connected to the InForm Management Console.
Icon Name Description
Fatal
320-200231 Rev A 53
A fatal event has occurred. It is no longer possible to take
remedial action.
Page 54

3PAR InForm Management Console 4.1.0 User’s Guide
Critical
Major The event requires immediate action.
Minor
Degraded
Informational
The event is critical and requires immediate action.
An event has occurred that requires action, but the situation is
not yet serious.
An aspect of performance or availability may have become
degraded. You must decide if action is necessary.
The event is informational. No action is required other than
acknowledging or removing the alert.
See also:
Status Bar Icons
System and Component Status Icons
Alert/Task/Connection Pane
Status Bar
Managing Alerts
Status Bar Icons
The status bar displays an alert severity indicator, as well as information about your
connection status and the progress of system operations.
The following icons are used:
Icon Name Description
See Alert
Severity
Indicators
Alert Severity
Auto-update not
working
Connected
The status bar displays only the highest severity
level found on connected systems.
Appears when auto-refresh is lost. The InForm
Management Console will not receive any
updated events from the InServ Storage Server.
Appears if at least one system is connected.
54 320-200231 Rev A
Page 55

3PAR InForm Management Console 4.1.0 User’s Guide
Disconnected
No connection Appears when there are no systems connected.
Operation
progress
Exception
Detected
See also:
Status Bar
Alert Severity Indicators
System and Component Status Icons
Viewing the Internal Error Log
Appears if at least one system is being
disconnected or rebooted.
Animated icon that indicates the progress of an
operation.
Appears if a runtime exception has occurred.
System and Component Status Icons
The InForm Management Console provides icons for quick reference, which display the
status of connected systems, system hardware, and system objects in the Management
Tree and the Management Window.
Icon Name Description
Normal
Degraded
Indicates that the component or object is in a healthy state and is
operating normally.
Indicates that the component or object is still operational, how ever
either the performance of the object is degraded or there is a single
point of failure of a dependent component.
A degraded component's status is also reflected in the status of
other components where the degraded component is used. This is
further reflected in the status of the system.
For example, if a physical disk loses one path it can still serve data,
but it is marked as degraded because the loss of the other path
would cause it to fail. Because this component is degraded, this
status is reflected in the components (e.g. drive cage, system) that
320-200231 Rev A 55
Page 56

3PAR InForm Management Console 4.1.0 User’s Guide
contain that disk.
Indicates that the component or object is not operational. Like a
See also:
Failed
Alert Severity Indicators
Status Bar Icons
Management Tree
Management Window
degraded status, the failed status is also reflected in components
and objects where the failed component or object is used.
Using Help
Access the Help topics by clicking Help > Topics from the Main Menu Bar.
The following Help Menu components are discussed further:
Help Menu Bar
Help Toolbar
Help Navigator
56 320-200231 Rev A
Page 57

3PAR InForm Management Console 4.1.0 User’s Guide
Help Topic Window
Using the Help Menu Bar
The following menus and commands are available from the Help Menu Bar:
Menu Command Description
Open
Page
File
Exit Closes the Help system.
Options Set Font Sets the font and size of the Help text.
Opens a help page URL or a local help file.
Note: This feature is not used by the InForm Management
Console Help.
See also:
Using Help
Using the Help Toolbar
Using the Help Navigator
Using the Help Topic Window
Using the Help Toolbar
The following shortcuts are available in the Help Toolbar located at the top of the Help
system window:
Button Command Description
Back Displays the last topic viewed.
320-200231 Rev A 57
Page 58

3PAR InForm Management Console 4.1.0 User’s Guide
Forward
Print Topic Prints the currently displayed topic.
Print Setup Sets up the page to be printed.
Add to
Favorites
See also:
Using Help
Using the Help Menu Bar
Using the Help Navigator
Using the Help Topic Window
Displays the last topic viewed prior to clicking the Back
button.
Adds the displayed topic to the favorites tab in the Help
Navigator.
Using the Help Navigator
The Help Navigator provides the following five tabs:
Table of Contents
Index
Search
Glossary
Favorites
Using the Table of Contents Tree
The Table of Contents tab displays a hierarchical tree that lists all Help system topics. Use
the Table of Contents tab as follows:
Click the Table of Contents tab to see the Help system table of contents.
Double-click any folder icon to see all available topics listed under that subject heading in
the table of contents. Double-clicking a folder icon also displays the first topic for that
book in the Help Topic Window.
Click any bullet icon to see the corresponding topic in the Help Topic Win d ow.
58 320-200231 Rev A
Page 59

3PAR InForm Management Console 4.1.0 User’s Guide
Searching the Index
The Help system index is an alphabetical list of keywords associated with Help system
topics. These keywords are defined and associated with topics by an author. Use the Index
tab as follows:
Click the Index tab to see the Help system index.
Use the scrollbox on the right to scroll through the index contents and then click an entry
to select it, or type the first few letters of a word in the Find box at the top of the index
to jump to a specific entry in the index.
Once you select an index entry, a list of topics appears in the topic list below the index.
Double-click a topic in the topic list to view that topic in Help Topic Window.
Using the Search Function
The Help system search function allows you to search through all Help system contents for a
specific word or words, phrase, or Boolean expression. Use the Search tab as follows:
Click the Search tab to access the Help system search function.
Type a word or words in the Find box and press Enter see a list of topics containing that
word or words.
When you perform a search using the Search tab, results appear in the table below the
search box. Results are ranked according to how well they match your search criteria as
follows:
High
Medium-High
Medium
Low
Click a topic in the results to view that topic in the Help Topic Window.
Using the Glossary
The Glossary tab allows you to view terms and definitions in the Help Navigator Window.
Use the Glossary tab as follows:
Click the Glossary tab to access the Help system glossary.
Type a word or words in the Find box, or choose an item from the list to see the
definition appear in the bottom pane of the Glossary tab.
Using the Favorites Tab
The Favorites tab allows you to view favorite help topics you have added with the Add to
Favorites button on the Main Tool Bar.
To view your favorites, click the Favorites tab and click a saved favorite.
320-200231 Rev A 59
Page 60

3PAR InForm Management Console 4.1.0 User’s Guide
See also:
Using Help
Using the Help Menu Bar
Using the Help Toolbar
Using the Help Topic Window
Using the Help Topic Window
The Help Topic Window displays the contents of the selected Help topic.
Navigating the Help Topic Window
Viewing Related Topics
Navigating the Help Topic Window
Click any Back to the Top arrow to return to the top of a Help topic.
Use the Back and Forward buttons on the Help Toolbar to return to
previously viewed topics.
Use the Previous Topic and Next Topic arrow buttons embedded at the top
and bottom of each Help topic to navigate back and forward between topics in the Table
of Contents.
See also:
Using the Help Toolbar
Viewing Related Topics
At the bottom of many sections in the Help topics are links to related topics.
The following figure displays the Security Manager section of the Manager Pane topic. The
section's related topics follow the See also: text.
60 320-200231 Rev A
Page 61

3PAR InForm Management Console 4.1.0 User’s Guide
See also:
Using Help
Using the Help Menu Bar
Using the Help Toolbar
Using the Help Navigator
320-200231 Rev A 61
Page 62

3PAR InForm Management Console 4.1.0 User’s Guide
Working with the InServ Storage Server
This section contains the following operations:
Creating Users and Domains
Logging In and Connecting to Systems
Forwarding Error Log Files
Creating Users and Domains
A user account is required to access a 3PAR InServ Storage Server via the InForm
Management Console.
To create a user account, see Creating Users
Note: 3PAR Domains requires a 3PAR Domains license. See the 3PAR InForm
OS Concepts Guide for information about licenses.
See also:
Creating Domains
Creating Users
. To create a domain, see Creating Domains.
Logging In and Connecting to Systems
The InForm Management Console allows authorized users to connect to an InServ Storage
Server, or multiple storage severs. In order to connect to an InServ Storage Server, you
must have the following information:
System name or IP address
Username
Password
62 320-200231 Rev A
Page 63

3PAR InForm Management Console 4.1.0 User’s Guide
To connect to an InServ Storage Server:
1. Start the InForm Management Console.
Note: Any systems previously connected to are displayed in the text box
under the IP Address or Name text box. To select multiple systems use
CTRL+click.
2. In the Connect dialog box, enter:
a. the IP address or system name.
b. your user name.
c. your password.
3. If you do not want a secured connection, uncheck the Secure Connection checKiBox.
Otherwise, click OK.
4. By clicking Options, you can modify the Secure Data Port, Unsecured Data Port,
and Event Port check boxes as needed.
Forwarding Error Log Files
If an internal error results in the termination of the InForm Management Console, an error
log file is created in your home directory with the following path and file name:
C:\...\InFormMC\log\InFormMC.log (for Windows® )
or:
informmc/log/informmc.log (for Solaris™ )
An error dialog box similar to the following appears:
If you experience an unexpected internal error while using the InForm Management
Console:
1. Record the exact path and filename specified in the dialog box.
2. Note the action or sequence of actions that you were performing prior to receiving the
error message.
320-200231 Rev A 63
Page 64

3PAR InForm Management Console 4.1.0 User’s Guide
3. Contact your local service provider for technical support and services for instructions on
forwarding the error log file.
Working with the System Manager
The System manager allows you to perform the following:
View System Information
Manage System Alerts
Locate a System
Edit a System
Work with Controller Nodes
Work with Drive Cages
Work with Ports
See also:
Manager Pane
Management Tree
Viewing System Information
Information about your system's provisioning and network settings, capacity, current
software level, and system alerts are displayed in tabular format in the Systems screen.
Information can be displayed for all connected InServ Storage Servers, or per selected
InServ Storage Server.
To view the Systems screen for all connected InServ Storage Servers:
1. Click Systems in the Manager Pane.
2. From the Management Tree, click InServs.
To view the Systems screen for a specific InServ Storage Server:
1. Click Systems in the Manager Pane.
2. From the Management Tree, click the InServ Storage Server you wish view.
For information about each tab displayed in the Systems screen, see:
Viewing System Summary Information
64 320-200231 Rev A
Page 65

3PAR InForm Management Console 4.1.0 User’s Guide
Viewing System Settings
Viewing System Capacity
Viewing System Software
Viewing System Alerts
See also:
Manager Pane
Management Tree
Viewing System Summary Information
To view system summary information, access the Systems screen and then click the
Summary tab.
The contents displayed in the Summary tab differs for all connected systems and for a
single system.
Viewing all Connected Systems
Viewing a Single System
Viewing all Connected Systems
If you are viewing information for all connected systems, the Summary tab is displayed as
follows:
The Summary tab can be filtered to display Summary information and Descriptor
information for all connected systems.
The following information is displayed when filtering by Summary information:
Column Description
Name
The InServ Storage Server name. Each name displayed is a link
to that server's Summary
information.
Serial Number The system serial number.
320-200231 Rev A 65
Page 66

3PAR InForm Management Console 4.1.0 User’s Guide
Model The storage server model number.
OS Version The InForm OS version running on the server.
State
FC Total
FC Allocated
Percentage
The current state of the storage server, Normal, Degraded, or
Failed.
The total amount of space available from Fibre Channel devices
(in GiB).
The percentage of used allocated Fibre Channel device space.
FC Free The amount of free Fibre Channel device capacity (in GiB).
NL Total
NL Allocated
Percentage
The total amount of space available from Near Line devices (in
GiB).
The percentage of used allocated Near Line device space.
NL Free The amount of free Near Line device capacity (in GiB).
SSD Total The total amount of space available from SSD devices (in GiB).
SSD Allocated
Percentage
The percentage of used allocated SSD device space.
SSD Free The amount of free SSD device capacity (in GiB).
Up Since The date and time the system was brought online.
Connection State The current connection state, either Active or Inactive.
Note: The InForm Management Console displays the devices currently
installed in your system. For example, if y ou do not have Fibre Channel drives
installed, the FC entries will not appear.
The following information is displayed when filtering by Descriptor information:
Column Description
Name
The InServ Storage Server name. Each name displayed is a link to that
server's Summary
information.
66 320-200231 Rev A
Page 67

3PAR InForm Management Console 4.1.0 User’s Guide
Serial
Number
Model The storage server model number.
Location The physical location of the server (if entered during server setup).
Owner The owner of the server (if entered during server setup).
Contact
Comments Any notes about the server (if entered during server setup).
The system serial number.
Contact information for the server owner (if entered during server
setup).
Viewing a Single System
If you are viewing information for a single system, the Summary tab is displayed as
follows:
320-200231 Rev A 67
Page 68

3PAR InForm Management Console 4.1.0 User’s Guide
The Summary tab for a single system displays the following information:
Group Field Description
Name The storage server's name.
Model The model number of the storage server.
General
Serial
Number
The storage server's serial number.
OS Version The current InForm OS version.
Controller
Nodes
The total number of controller nodes.
Ports The total number of ports in the system.
Host The number of host ports.
Disk The number of disk ports.
Free The number of free ports.
Remote Copy The number of Remote Copy ports.
Drive Cages The total number of drive cages.
Physical
Disks
The total number of physical disk drives.
FC The number of Fibre Channel drives.
NL The number of Near Line drives.
SSD The number of SSD drives.
Note: The InForm Management Console displays the devices currently installed in your
system. For example, if you do not have Fibre Channel drives installed, the FC field will not
appear on the Summary tab.
Hosts The total number of hosts.
Provisioning
CPGs The total number of CPGs.
Virtual
Volumes
The total number of virtual volumes.
68 320-200231 Rev A
Page 69

3PAR InForm Management Console 4.1.0 User’s Guide
Resources
Capacity
Health
CPU Usage
Control
Memory
The current CPU usage in MHz and percentage.
The current control memory usage in GiB and percentage.
Data Memory The current data memory usage in GiB and percentage.
List of device types. The selected device type affects the
Device
display of the data displayed in the Overview and
Allocated fields.
The overview of allocated and free space per device type in
Overview
the system displayed graphically, in percentage, and in
GiB.
The amount of allocated space used by provisioning,
Allocated
sparing, and internal system structures and processes
(such as logging logical disks, admin volume, etc.)
displayed graphically, in percentage, and in GiB.
Up Since The date and time the storage server was brought online.
New Alerts
State
Any new alerts. Any displayed alerts are links to the
Systems Alerts
tab.
The state of the storage server; Normal, Degraded, or
Failed. See System and Component Status Icons
.
State
Description
See also:
Editing a System
Locating a System
Working with Drive Cages
Working with Controller Nodes
Working with Ports
A description of the displayed state.
320-200231 Rev A 69
Page 70

3PAR InForm Management Console 4.1.0 User’s Guide
Viewing System Settings
To view a specific system's settings information, access the Systems screen and then
click the Settings tab.
The Settings tab appears as follows:
The Settings tab displays the following information:
Group Field Description
FC Raw Space
Alert
System
Parameter
Note: The InForm Management Console displays the devices currently installed in your
system. For example, if you do not have Fibre Channel drives installed, the FCRaw Space
Alert field will not appear on the Settings tab.
NL Raw Space
Alert
SSD Raw Space
Alert
Copy Space
Reclaim
Maximum
Volume
Retention Time
The raw space alert threshold (in GiB) for Fibre
Channel devices.
The raw space alert threshold (in GiB) for Near
Line devices.
The raw space alert threshold (in GiB) for SSD
devices.
Indicates if the copy space reclaim feature is
Enabled or Disabled.
The set maximum volume retention time.
Descriptors Location Location of the server (if entered).
70 320-200231 Rev A
Page 71

Network
Configuration
3PAR InForm Management Console 4.1.0 User’s Guide
Owner The owner of the server (if entered).
Contact Contact information (if entered).
Comments Any notes about the server (if entered).
Radio buttons indicating if you wish to view either
IPv4/IPv6
IP Address The server's IP address.
Subnet Mask (If IPv4 was selected) The subnet mask.
Prefix
Active Node
IPv4 or IPv6 network configuration informat ion. If
your system is not configured for IPv6, the IPv6
button is disabled.
(If IPv6 was selected) The decimal value indicating
the number of contiguous, higher-order bits of the
address that make up the network portion of the
address.
The active system node.
Status
Default Route
NTP Server
The status of the server.
The default routing IP address.
The NTP server, if any.
320-200231 Rev A 71
Page 72

3PAR InForm Management Console 4.1.0 User’s Guide
Viewing System Capacity
To view a single system's capacity information, access the Systems screen and then click
the Capacity tab.
Raw capacity for the selected InServ Storage Server is displayed for Total, Fibr e Channel,
Near Line, and Solid State capacities. Each of these top level capacity items can be
further expanded to the following:
Note: In the normal situation, the capacity displays show you the space that
is consumed by provisioning (e.g. CPGs, Volumes, and underlying LDs) and
the space that is reserved by the system for spares.
When chunklets or PDs fail, the data that was on those chunklets is moved
onto the spares. The total amount of space consumed by provisioning does not
change, nor does the total amount of spares in the system. However, there is
an overlap in the numbers because the used spares are counted in the total
number of spares (total spares = unused + used spares) AND in the
provisioning (because parts of the LDs/CPGs/Volumes) are now using those
spares. In this case, an asterisk (*) appears to indicate that the numbers will
not add up due to this shared space.
72 320-200231 Rev A
Page 73

+ Total
+ Allocated
+ Volumes
+ Base Volumes
3PAR InForm Management Console 4.1.0 User’s Guide
Field Description
Total
amount of
usable
storage on
the storage
server.
Amount of
storage
capacity
currently
allocated.
Amount of
storage
allocated to
volumes.
Amount of
volume
space
allocated to
base
volumes.
- User
- Copy
- Admin
+ CPGs
+ Copy
+ Admin
- Used
- Unused
Amount
allocated for
base volume
user space,
copy space
and admin
space.
Amount of
volume
space
allocated to
CPGs.
Amount of
CPG space
allocated to
Copy.
Amount of
Copy space
that is used
or not used.
Amount of
CPG space
allocated to
320-200231 Rev A 73
Page 74

3PAR InForm Management Console 4.1.0 User’s Guide
admin.
- Unmapped
+ System
- Internal
+ Spares
- Used
- Unused
Amount of
admin space
that is used
or not used.
Amount of
volume
space that is
not mapped.
Amount of
allocated
space used
by the
system.
Amount of
system
space used
internally.
Amount of
space
allocated to
spares.
+ Free
- Initialized
- Uninitialized
- Used
- Unused
Spare space
allocated for
LDs when
underlying
PDs have
failed.
Unused
space.
Amount of
free space
on the
system,
regardless
of initialized
or not.
Amount of
initialized
free space
on the
system.
Amount of
uninitialized
free space
74 320-200231 Rev A
Page 75

3PAR InForm Management Console 4.1.0 User’s Guide
on the
system. This
includes any
chunklets
that are
currently
being
cleaned.
- Failed
Amount of
failed space.
Total
amount of
Fibre
+ Fibre Channel
Channel
(FC) storage
on the
storage
server.
Note: Subcontents of the Fibre Channel Total display are identical to the Total display at
the top of this table.
Total
amount of
+ Nearline
Nearline
(NL) storage
on the
storage
server.
Note: Subcontents of the Nearline Total display are identical to the Total display at the
top of this table.
Total amount
of Solid State
(SSD) storage
+ Solid State
on the
storage
server.
Note: Subcontents of the Solid State Total display are identical to the Total display at
the top of this table.
Note: Only device types (Fibre Channel, Nearline, and Solid State) that
are on your system are displayed. For example, if your system contains only
Fibre Channel drives, only Fibre Channel capacity is displayed.
320-200231 Rev A 75
Page 76

3PAR InForm Management Console 4.1.0 User’s Guide
See also:
Working with the Hardware Inventory Manager
Viewing System Software
To view a single system's software information, access the Systems screen and then click
the Software tab.
The Software tab displays the Component Versions of each software feature and the
License information. By default, the Component Versions include the CLI Server,
System Manager, Kernel, and TPD Kernel Code. The License information includes
Enabled Features and the Key Generation Date.
If you wish to view the build level of the Component Versions, click the Show Build
Levels checKiBox.
If you wish to view versions of all system software, click Show All Versions.
Viewing System Alerts
To view system alert information, access the Systems screen and then click the Alerts
tab.
or
1. In the Manager Pane, click Events.
2. In the Management Tree, click the InServs node or a system node.
3. In the Management Window, click the Alerts tab.
76 320-200231 Rev A
Page 77
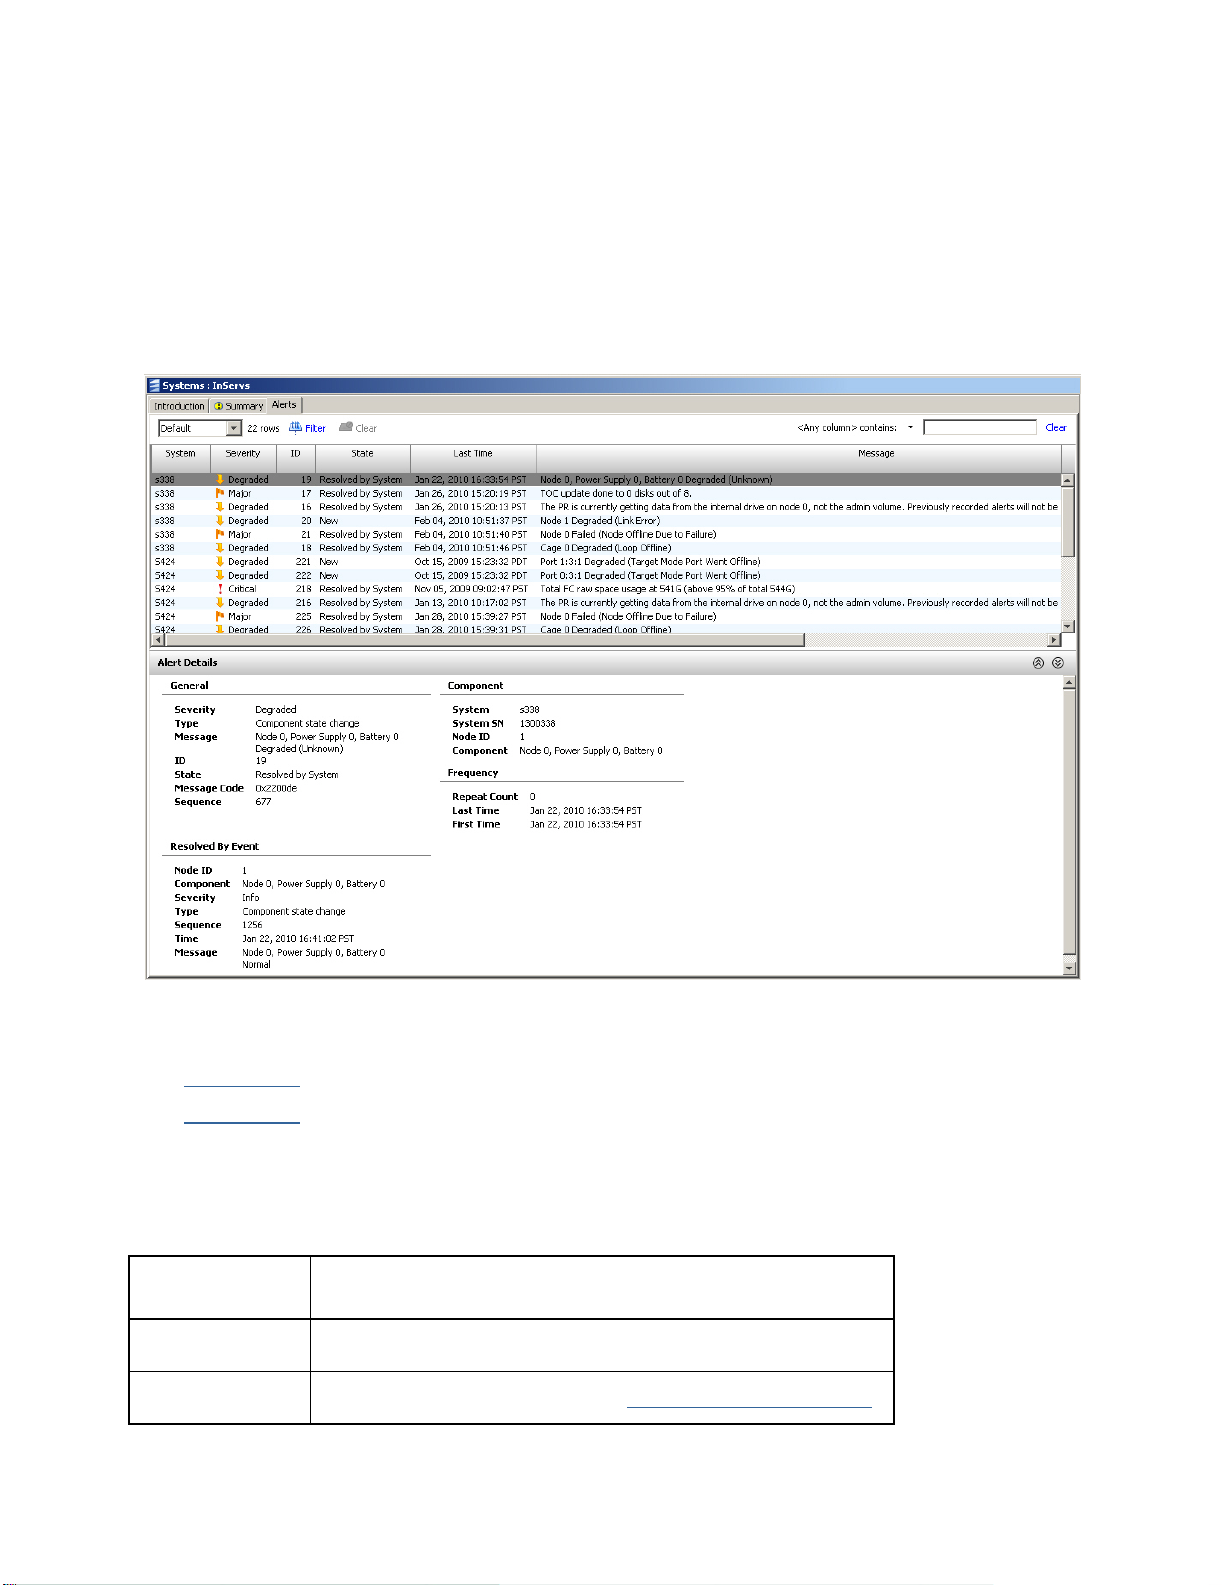
3PAR InForm Management Console 4.1.0 User’s Guide
The Alerts tab is split into an upper pane and lower pane. The upper pane display a
summary of the alerts. The lower pane displays the details of an alert selected in the upper
pane.
The information displayed in the Alerts tab is nearly identical between the information
displayed for all connected systems and information displayed for a single system, with the
only exception being an additional System column appears in the upper pane for all
connected systems. The following figure displays the Alerts tab for all connected systems.
The upper and lower panes are described in greater detail below.
Upper Pane
Lower Pane
Upper Pane
The upper pane of the Alerts tab displays the following:
Column Description
System The system on which the alert occurred.
Severity The severity of the alert. See Alert Severity Indicators.
320-200231 Rev A 77
Page 78

3PAR InForm Management Console 4.1.0 User’s Guide
ID The alert ID.
State The alert state.
Last Time The last occurrence of the alert.
Message A brief description of the alert.
Repeat Count The number of times the alert has been issued.
First Time The first occurrence of the alert.
Lower Pane
The lower pane of the Alerts tab displays detailed information about an alert selected in the
upper pane. The lower pane displays the following information:
Group Field Description
Severity The alert severity. See Alert Severity Indicators
Type The alert type.
Message A brief description of the alert.
General
Resolved by Event
ID The alert ID.
State The alert state.
Message Code The alert message code.
Sequence The alert sequence.
Node ID The controller node ID.
Component The component for which the alert was issued.
.
Severity The alert severity. See Alert Severity Indicators.
Type The alert type.
78 320-200231 Rev A
Page 79

Component
3PAR InForm Management Console 4.1.0 User’s Guide
Sequence The alert sequence.
Time The time the alert was resolved.
Message A brief description of the alert.
System The name of the server that generated the alert.
System SN The server's serial number.
Node ID The node ID.
Component The affected system components.
Repeat Count The number of times the alert was issued.
Frequency
See also:
Alert Severity Indicators
Alert/Task/Connection Pane
Viewing the Alerts Summary
Managing Alerts
Viewing System Events
Exporting Data
Last time The last occurrence of the alert.
First time The first occurrence of the alert.
320-200231 Rev A 79
Page 80

3PAR InForm Management Console 4.1.0 User’s Guide
Managing Alerts
Once you have accessed and viewed the system alerts, either from the
Alert/Task/Connection Pane
the following actions to any selected alert.
Acknowledge the alert
Mark the alert as new
Mark the alert as fixed
Remove the alert
To apply an action to an alert:
If you accessed the alert from the Alert/Task/Connection Pane, right-click the alert and
click Acknowldege, Mark as Fixed, Remove, or Show Details.
If you accessed the alert from the Alerts tab on the Systems screen, right-click the alert
and click Acknowldege, Mark as Fixed, Mark as New, Remove, or Show Details.
or from the Alerts tab on the Systems screen, you can apply
See also:
Alert/Task/Connection Pane
Viewing System Alerts
Alert Severity Indicators
Locating a System
This operation helps locate an InServ Storage Server by oscillating the node status LEDs
amber and green on all nodes of the storage server. If desired, the LEDs in all connected
drive cages are also set amber or oscillate, depending on the drive cage type.
Note: This operation can only be performed by users with Super, Service,or
Edit privilege levels.
To locate an InServ Storage Server:
1. Click Systems in the Manager Pane.
2. From the Management Tree, right-click the InServ Storage Server you wish to locate
and then click Locate System.
3. Select a Duration for the LED(s) to oscillate (from 1 and 255 seconds).
80 320-200231 Rev A
Page 81

3PAR InForm Management Console 4.1.0 User’s Guide
4. Optionally, if you want the drive cage LEDs to turn amber or oscillate as well, click the
Include Cage(s) checKiBox.
5. Click OK to start the locate.
Note: This operation can only be performed by users with Super, Service,or
Edit privilege levels.
See also:
Manager Pane
Management Tree
Editing a System
You can edit the identification, identification information, properties, and alert settings for
any InServ Storage Server connected to the InForm Management Console.
Note: Editing storage servers can only be performed by users with Super,
Service, and Edit privilege levels.
To edit a storage server, access the Edit System wizard.
1. In the Manager Pane, click Systems.
2. In the Management Tree, click the system you wish to edit.
3. In the Common Actions Panel, click Edit System.
The Edit System wizard appears.
In the Edit System wizard, edit the following information as needed:
1. In the General group box, select the following:
a. Name - enter a new system name.
b. FC Raw Space Alert - Select whether to enable or disable the raw space alert for
Fiber Channel drives. If Enabled, enter a value from 100 to 100,000 GiB.
c. NL Raw Space Alert - Select whether to enable or disable the raw space alert for
Nearline drives. If Enabled, enter a value from 100 to 100,000 GiB.
d. SSD Raw Space Ale rt - Select whether to enable or disable the raw space alert for
SSD drives. If Enabled, enter a value from 100 to 100,000 GiB.
320-200231 Rev A 81
Page 82

3PAR InForm Management Console 4.1.0 User’s Guide
Note: These fields only appear for devices installed on the system. For
example, if your system contains no SSD drives, the SSD Raw Space Alert
field will not be present.
e. Select whether to enable or disable the Copy Space Reclaim feature, which
reclaims logical disk space.
f. To select a Maximum Volume Retention time, select Enabled, select hour(s) or
day(s), and then enter a value of 1 to 1,825 (days) or 1 to 43,800 (hours).
2. In the Descriptors group box, enter the following:
a. Location - Enter the physical location of the storage server; for example, Lab 1.
b. Owner - Enter the owner of the storage server.
c. Contact - Enter any contact information.
d. Comments - Enter any relevant notes about the storage server.
3. Click OK.
The storage server is updated accordingly.
See also:
Manager Pane
Management Tree
Common Actions Panel
Viewing System Information
Working with Controller Nodes
The InForm Management Console allows you to:
View Controller Nodes
Edit Controller Node Power Supplies
Edit Controller Node Batteries
Recharge Controller Node Batteries
82 320-200231 Rev A
Page 83

3PAR InForm Management Console 4.1.0 User’s Guide
Viewing Controller Nodes
The Controller Nodes screen displays summary information about system controller nodes
and node components. The Controller Nodes screen is divided into an upper pane, which
displays summary information about the nodes, and a lower pane, which displays detailed
information about the nodes and node components.
To access the Controller Nodes screen:
1. Click Systems in the Manager Pane.
2. In the Management Tree, select Controller Nodes under the system whose controller
node information you wish to view.
The upper pane of the Controller Nodes screen is provided with two tabs; Summary and
Alerts.
The lower pane of the Controller Nodes screen provides five tabs; Summary, Ports,
Power Supplies, Batteries, and Alerts.
For information about the upper pane, see:
Viewing the Controller Nodes Summary Screen
Viewing Controller Nodes Alerts
For information about the lower pane, see:
Viewing Controller Nodes Details
Viewing Controller Node Ports Details
Viewing Controller Nodes Power Supplies Details
Viewing Controller Nodes Batteries Details
Viewing Controller Nodes Alerts Details
See also:
Manager Pane
Management Tree
320-200231 Rev A 83
Page 84

3PAR InForm Management Console 4.1.0 User’s Guide
Viewing the Controller Nodes Summary
Screen
To view the Controller Nodes Summary screen:
1. Access
2. In the upper pane, click the Summary tab.
The Summary tab appears as follows:
The Summary tab provides the following information:
Column Description
ID The node ID.
Name The node name.
the Controller Nodes screen.
State
Status LED The current status of the node, as indicated by the node LED.
Ports The total number of ports on the node.
Control
Memory
Data Memory The amount of data memory (in GiB).
Cache
Availability
84 320-200231 Rev A
The current state of the node; either Normal, Degraded, or Failed.
See System and Component Status Icons
The amount of control memory (in GiB).
The percentage of available cache space.
.
Page 85

3PAR InForm Management Console 4.1.0 User’s Guide
See also:
Viewing Controller Nodes
System and Component Status Icons
Viewing Controller Node Alerts
To view the Controller Node alerts screen:
1. Access
2. In the upper pane, click the Alerts tab.
The Alerts tab appears as follows:
The Alerts tab provides the following information:
Column Description
Severity The severity of the alert. See Alert Severity Indicators.
ID The alert ID.
the Controller Nodes screen.
State The alert state.
Last Time The last occurrence of the alert.
Message A brief description of the alert.
Repeat Count The number of times the alert has been issued.
First Time The first occurrence of the alert.
320-200231 Rev A 85
Page 86

3PAR InForm Management Console 4.1.0 User’s Guide
See also:
Viewing Controller Nodes
Viewing Controller Nodes Alerts Details
Alert Severity Indicators
Managing Alerts
Viewing Controller Nodes Details
To view the Controller Node details screen:
1. Access
2. In the upper pane, click the Summary tab.
3. Select a node.
4. In the lower pane, click the Summary tab.
The Summary tab appears as follows:
the Controller Nodes screen.
86 320-200231 Rev A
Page 87

3PAR InForm Management Console 4.1.0 User’s Guide
The Summary tab provides the following information:
Group Field Description
Position The position of the node in the node chassis.
Name The node name.
Online Indicates if the node is online.
General
InForm OS
Version
The InForm OS version.
Slots The total number of slots on the node.
Free The number of unused slots on the node.
Ports The total number of ports on the node.
Control
Memory
The amount of control memory, in GiB.
Data Memory The amount of data memory, in GiB.
Cache
Availability
Status LED
The percentage of available cache.
The current status of the node, as indicated by the node
LED.
New Alerts Any new alerts. See Alert Severity Indicators
.
Health
State
State
Description
Control
Memory
Current state of the node, either Normal, Degraded,
or Failed. See System and Component Status Icons.
Description of the node state.
The amount of used control memory, displayed in GiB
and percentage.
Physical
Memory
Data Memory
The amount of used data memory, displayed in GiB and
percentage.
320-200231 Rev A 87
Page 88

3PAR InForm Management Console 4.1.0 User’s Guide
CPU CPU Usage
See also:
Viewing the Controller Nodes Summary Screen
Alert Severity Indicators
System and Component Status Icons
The current CPU usage, displayed in MHz and
percentage.
Viewing Controller Node Ports Details
To view the Controller Node Ports detail screen:
1. Access
2. In the upper pane, click the Summary tab.
3. Select a node.
4. In the lower pane, click the Ports tab.
the Controller Nodes screen.
The Ports tab appears as follows:
88 320-200231 Rev A
Page 89

3PAR InForm Management Console 4.1.0 User’s Guide
The Ports tab provides the following information:
Group Column Description
Cards
Ports
Type
Position The position of the card in node:slot format.
Ports The number of ports on the interface.
Max Rate The maximum rate in Gbps.
Type
Connected
Device Type
Speed The speed of the port in Gbps.
Count The number of ports.
The type of interface card, either Ethernet or Fibre Channel
(FC).
The port type, Fibre Channel (FC), iSCSI, Remote Copy over
IP (RCIP), or Remote Copy over Fibre Channel (RCFC).
The connected device type, Free, Disk, Host, or InServ.
See also:
Viewing the Controller Nodes Summary Screen
Working with Ports
Viewing Controller Node Power Supplies
Details
To view the Controller Node Power Supplies details screen:
1. Access
2. In the upper pane, click the Summary tab.
3. Select a node.
4. In the lower pane, click the Power Supplies tab.
the Controller Nodes screen.
320-200231 Rev A 89
Page 90

3PAR InForm Management Console 4.1.0 User’s Guide
The Power Supplies tab appears as follows:
The Power Supplies tab provides the following information:
Column Description
Node ID The node ID.
Power
Supply ID
Serial
Number
State
Fan State
The power supply ID.
The power supply serial number.
The state of the power supply. See System and Component Status
Icons.
The fan state, Normal, Degraded, or Failed. See System and
Component Status Icons.
Fan Speed The current fan speed.
Battery State
The power supply battery state, Normal, Degraded, or Failed. See
System and Component Status Icons
See also:
System and Component Status Icons
Viewing the Controller Nodes Summary Screen
.
90 320-200231 Rev A
Page 91

3PAR InForm Management Console 4.1.0 User’s Guide
Viewing Controller Node Batteries Details
To view the Controller Node Batteries details screen:
1. Access
2. In the upper pane, click the Summary tab.
3. Select a node.
4. In the lower pane, click the Batteries tab.
The Batteries tab appears as follows:
The Batteries tab provides the following information:
Column Description
Node ID The node ID.
the Controller Nodes screen.
Power Supply ID The power supply ID.
Battery ID The battery ID.
Serial Number The battery serial number.
State
Charge State The charge state of the battery.
Charge Level The charge level of the battery.
Maximum Battery
Life
Test In Progress Indicates if any tests are in progress.
The state of the battery. See System and Component Status
Icons.
The battery's maximum life.
320-200231 Rev A 91
Page 92

3PAR InForm Management Console 4.1.0 User’s Guide
Expiration Time The battery expiration date.
See also:
System and Component Status Icons
Viewing the Controller Nodes Summary Screen
Viewing Controller Node Alerts Details
To view the Controller Node Alerts details screen:
1. Access
2. In the upper pane, click the Summary tab.
3. Select a node.
4. In the lower pane, click the Alerts tab.
The Alerts tab displays the information for a specific node as selected in the upper pane
and appears as follows:
The Alerts tab provides the following information:
Column Description
Severity The severity of the alert. See Alert Severity Indicators.
the Controller Nodes screen.
ID The alert ID.
State The alert state.
Last Time The last occurrence of the alert.
92 320-200231 Rev A
Page 93

3PAR InForm Management Console 4.1.0 User’s Guide
Message A brief description of the alert.
Repeat Count The number of times the alert has been issued.
First Time The first occurrence of the alert.
See also:
Alert Severity Indicators
Viewing the Controller Nodes Summary Screen
Viewing Controller Nodes Alerts
Editing Controller Node Power Supplies
The InForm Management Console allows you to edit the serial number of a controller node
power supply.
1. In the Manager Pane, click Systems.
2. In the Management Tree, click Controller Nodes under the system whose power
supply you wish to edit.
3. In the lower Controller Node Details pane displayed in Management Window, select
the Power Supplies tab.
4. Right-click the power supply whose serial number you wish to edit and click Edit.
5. Enter a new alphanumeric serial number in the Serial Number field using numeric
characters 0 to 9 and alphabetic characters A to F.
6. Click OK.
See also:
Manager Pane
Management Tree
Management Window
Viewing Controller Nodes Power Supplies Details
320-200231 Rev A 93
Page 94

3PAR InForm Management Console 4.1.0 User’s Guide
Editing Controller Node Batteries
The InForm Management Console allows you to edit controller node batteries.
1. In the Manager Pane, click Systems.
2. In the Management Tree, click Controller Nodes under the system whose batteries
you wish to edit.
3. In the lower Controller Node Details pane displayed in Management Window, select
the Batteries tab.
4. Right-click the battery you wish to edit and click Edit.
5. Enter a new alphanumeric serial number in the Serial Number field using numeric
characters 0 to 9 and alphabetic characters A to F.
6. Enter a new battery expiration date in the Expiration Time field. You can alternately
click the calendar button to the right of the field and select a date from the calendar
that appears.
7. Click OK.
See also:
Manager Pane
Management Tree
Management Window
Viewing the Controller Node Battery Test
Log
To view the controller node battery test log:
1. In the Manager Pane, click Systems.
2. In the Management Tree, click Controller Nodes under the system whose batteries
you wish to edit.
3. In the lower Controller Node Details pane displayed in Management Window, select
the Batteries tab.
4. Right-click the battery whose test log you wish to view and click Show Test Log.
94 320-200231 Rev A
Page 95

3PAR InForm Management Console 4.1.0 User’s Guide
Resetting the Controller Node Battery
Test Log
To reset the controller node battery test log:
1. In the Manager Pane, click Systems.
2. In the Management Tree, click Controller Nodes under the system whose batteries
you wish to edit.
3. In the lower Controller Node Details pane displayed in Management Window, select
the Batteries tab.
4. Right-click the battery whose test log you wish to reset and click Reset Test Log.
5. Click Yes when prompted for confirmation.
Recharging Controller Node Batteries
The InForm Management Console allows you to recharge controller node batteries.
1. In the Manager Pane, click Systems.
2. In the Management Tree, click Controller Nodes under the system whose batteries
you recharge.
3. In the lower Controller Node Details pane displayed in Management Window, select
the Batteries tab.
4. Right-click the battery you wish to recharge and click Re-charge.
5. Click Yes when the battery recharge confirmation dialog box appears.
See also:
Manager Pane
Management Tree
Management Window
320-200231 Rev A 95
Page 96

3PAR InForm Management Console 4.1.0 User’s Guide
Working with Drive Cages
The InForm Management Console allows you to:
View Drive Cages
Edit Drive Cages
Locate Drive Cages
Edit Drive Cage Power Supplies
Viewing Drive Cages
The Drive Cages screen displays summary information about system drive cages and drive
cage components.
To access the Drive Cages screen:
1. Click Systems in the Manager Pane.
2. In the Management Tree, select Drive Cages under the system whose drive cage
information you wish to view.
The Drive Cages screen provides four tabs, Summary, Power Supplies, SFPs, and
Alerts. For information about each, see:
Viewing the Drive Cage Summary
Viewing Drive Cage Power Supplies
Viewing Drive Cage SFPs
Viewing Drive Cage Alerts
Additionally, you can view drive cage details. See:
Viewing Drive Cage Details
See also:
Manager Pane
Management Tree
96 320-200231 Rev A
Page 97

3PAR InForm Management Console 4.1.0 User’s Guide
Viewing the Drive Cage Summary
To view the Drive Cage Summary screen:
1. Access
2. In the upper pane, click the Summary tab.
The Summary tab appears as follows:
The Summary tab provides the following information:
Column Description
Name The drive cage name.
State The drive cage state. See System and Component Status Icons.
the Drive Cages screen.
Model The drive cage model.
Loop A
Loop B
Speed The port speed in Gbps.
Disks
FC Total
FC Allocated
Percentage
SSD Total
The port on the InServ Storage Server to which the A loop is
connected.
The port on the InServ Storage Server to which the B loop is
connected.
The number of disks in the drive cage. The bottom of the Disks
column displays a total disk count.
The total Fibre Channel capacity in GiB. The bottom of the FC Total
column displays total FC capacity.
The percentage of used Fibre Channel capacity. The bottom of the
FC Allocated Percentage column displays the total used
percentage.
The total SSD capacity in GiB. The bottom of the SSD Total column
displays total SSD capacity.
320-200231 Rev A 97
Page 98

3PAR InForm Management Console 4.1.0 User’s Guide
SSD Allocated
Percentage
Note: The device types displayed in the summary are dependent on the devices installed in
your system. For example, if you have Near Line and disk drives installed, the summary will
display NL (Near Line) Total, NL Allocated Percentage columns.
The Summary tab can be further filtered to view drive cage connectivity and drive cage
capacity.
Viewing_Drive_Cage_Connectivity
Viewing_Drive_Cage_Capacity
The percentage of used SSD capacity. The bottom of the SSD
Allocated Percentage column displays the total used percentage.
Viewing Drive Cage Connectivity
To view drive cage connectivity information, select Connectivity from the filter list.
The connectivity summary appears as follows:
The following information is provided:
Column Description
Name The drive cage name.
State The drive cage state. See System and Component Status Icons.
Distance the drive cage is from the controller node port. (0 = directly
Position A
Revision A
Position B
Revision B Version of firmware running on the controller for the B loop.
connected to InServ ports, 1= there is one device between the node and
this drive cage, etc).
Version of firmware running on the controller for the A loop.
Distance the drive cage is from the controller node port. (0 = directly
connected to InServ Storage Server ports, 1= there is one device
between the node and this drive cage, etc).
98 320-200231 Rev A
Page 99

3PAR InForm Management Console 4.1.0 User’s Guide
A0 Port Controller node initiat o r port connected to drive cage port A0.
A1 Port Controller node initiat o r port connected to drive cage port A1.
A2 Port
(for DC3
drive cages)
A3 Port
(for DC3
drive cages)
B0 Port Controller node initiator port connected to drive cage port B0 .
B1 Port Controller node initiator port connected to drive cage port B1.
B2 Port
(for DC3
drive cages)
Controller node initiator port connected to drive cage port A2.
Controller node initiator port connected to drive cage port A3.
Controller node initiator port connected to drive cage port B2.
B3 Port
(for DC3
drive cages)
Daisy
Chained
Controller node initiator port connected to drive cage port B3.
Indicates whether the drive cages are daisy chained.
Viewing Drive Cage Capacity
To view drive cage capacity information, select Capacity from the filter list.
The capacity summary appears as follows:
320-200231 Rev A 99
Page 100

3PAR InForm Management Console 4.1.0 User’s Guide
The following information is provided:
Column Description
Name The drive cage name.
State The drive cage state. See System and Component Status Icons.
FC Total
FC Free
FC Allocated
FC Allocated
Percentage
SSD Total
SSD Free
SSD Allocated
SSD Allocated
Percentage
Note: The device types displayed in the summary are dependent on the devices installed in
your system. For example, if you have Near Line and disk drives installed, the summary will
display NL (Near Line) Total, NL Allocated Percentage, etc. columns.
The total Fibre Channel capacity in GiB. The bottom of the FC Total
column displays total FC capacity.
The amount of free Fibre Channel space in GiB. The bottom of the
FC Free column displays total free FC capacity.
The amount of allocated Fibre Channel space in GiB. The bottom of
the FC Allocated column displays total allocated FC capacity.
The percentage of used Fibre Channel capacity. The bottom of the
FC Allocated Percentage column displays the total used
percentage.
The total SSD capacity in GiB. The bottom of the SSD Total column
displays total SSD capacity.
The amount of free SSD space in GiB. The bottom of the SSD Free
column displays total free SSD capacity.
The amount of allocated SSD space in GiB. The bottom of the SSD
Allocated column displays total allocated SSD capacity.
The percentage of used SSD capacity. The bottom of the SSD
Allocated Percentage column displays the total used percentage.
100 320-200231 Rev A
 Loading...