

Page 1

System Fault Management C.07.05.08.01 administrator guide
HP-UX 11i v3
HP Part Number: 5900-2058
Published: March 2012
Page 2

© Copyright 2012 Hewlett-Packard Development Company, L.P
Legal Notices
©Copyright 2012 Hewlett-Packard Development Company, L.P.Confidential computer software. Valid license from HP required for possession, use
or copying. Consistent with FAR 12.211 and 12.212, Commercial Computer Software, Computer Software Documentation, and Technical Data
for Commercial Items are licensed to the U.S. Government under vendor’s standard commercial license.
The information contained herein is subject to change without notice. The only warranties for HP products and services are set forth in the express
warranty statements accompanying such products and services. Nothing herein should be construed as constituting an additional warranty. HP shall
not be liable for technical or editorial errors or omissions contained herein.
UNIX is a registered trademark of The Open Group. Intel and Itanium are trademarks or registered trademarks of Intel Corporation or its subsidiaries
in the United States and other countries.
Page 3

Contents
1 Introduction...............................................................................................7
Overview................................................................................................................................7
Features and benefits................................................................................................................7
Components of SFM.................................................................................................................9
EVWEB..............................................................................................................................9
EMT...................................................................................................................................9
CIMUtil..............................................................................................................................9
IPMI event viewer.................................................................................................................9
Providers.............................................................................................................................9
instance providers...........................................................................................................9
Indication providers.......................................................................................................12
Cron job...........................................................................................................................15
User interfaces.......................................................................................................................15
HP Systems Insight Manager...............................................................................................15
HP System Management Homepage.....................................................................................15
Architecture...........................................................................................................................15
2 Installing the SFM software........................................................................18
Prerequisites...........................................................................................................................18
Installing the SFM software from the media................................................................................19
Installing using the TUI........................................................................................................19
Installing using the CLI........................................................................................................21
Installing the SFM software from the web...................................................................................22
Verifying the installation..........................................................................................................22
Verifying the installation using the TUI...................................................................................23
Verifying the installation using the CLI...................................................................................24
Removing the SFM software.....................................................................................................24
Removing the software using the TUI.....................................................................................24
Removing the software using the CLI.....................................................................................27
Verifying removal of the SFM software.......................................................................................27
Verifying removal using the TUI............................................................................................27
Verifying removal using the CLI............................................................................................28
3 Configuring indication providers.................................................................29
Configuring indication filters....................................................................................................29
Configuring error logging in SFM.............................................................................................30
Configuring the monitoring mode.............................................................................................30
4 Administering indications and instances using HP SIM..................................32
Creating subscriptions and viewing indications using HP SIM ......................................................32
Creating subscriptions........................................................................................................32
Viewing Indications............................................................................................................37
Viewing instances...................................................................................................................43
5 Administering indications and instances using HP SMH.................................44
Viewing instances...................................................................................................................44
Viewing information about processors...................................................................................44
Viewing information about memory......................................................................................45
Viewing information about System Summary..........................................................................46
Viewing information about Cooling Devices...........................................................................46
Viewing Power Supply instances..........................................................................................46
Viewing Temperature status and events.................................................................................46
Viewing Voltage status and events........................................................................................46
Contents 3
Page 4

Viewing FRU information.....................................................................................................46
Viewing information about Management Processor.................................................................47
Viewing information about Firmware information....................................................................47
Viewing information about Onboard Administrator.................................................................47
Viewing information about Complex-wide info.......................................................................47
Viewing information about Cell Board..................................................................................47
Viewing Partition information...............................................................................................47
Viewing information about Blade.........................................................................................47
Viewing information about Cell Blade...................................................................................48
Viewing Health Test report of Memory..................................................................................48
Viewing Health Test report of Processors...............................................................................48
Administering indications using Evweb......................................................................................49
Evweb overview.................................................................................................................49
Launching Evweb for administration......................................................................................50
Creating Evweb event subscriptions......................................................................................50
Creating an event subscription using the GUI....................................................................51
Creating an event subscription using the CLI.....................................................................51
Copying and creating a new event subscription using the GUI............................................51
Modifying Evweb event subscriptions....................................................................................52
Modifying an event subscription using the GUI..................................................................52
Modifying an event subscription using the CLI...................................................................53
Copying and modifying an event subscription using the GUI...............................................54
Deleting Evweb event subscriptions.......................................................................................55
Deleting an event subscription using the GUI....................................................................55
Deleting an event subscription using the CLI......................................................................55
Configuring E-mail Consumer..............................................................................................56
Viewing event subscriptions using Evweb...................................................................................56
Viewing Evweb event subscriptions.......................................................................................56
Viewing a summary of an Evweb event subscription using the GUI.......................................56
Viewing a Summary of an Evweb event Subscription using the CLI.......................................57
Viewing details of an event subscription using the GUI.......................................................57
Viewing details of an event subscription using the CLI........................................................58
Viewing external event subscriptions.....................................................................................58
Viewing an external event subscription using the GUI.........................................................58
Viewing external event subscriptions using the CLI.............................................................59
Viewing indications using Evweb..............................................................................................59
Launching Evweb for viewing WBEM indications...................................................................60
Searching for the subscribed WBEM events...........................................................................60
Filtering WBEM events using the GUI...............................................................................60
Searching for the subscribed WBEM events using the GUI..................................................61
Searching for the subscribed WBEM events using the CLI...................................................61
Viewing summary information about WBEM events................................................................61
Viewing summary information using GUI..........................................................................62
Viewing summary information using CLI...........................................................................62
Viewing detailed information about WBEM events.................................................................62
Viewing detailed information using GUI...........................................................................62
Viewing Detailed Information using CLI............................................................................62
Deleting WBEM Events from the Event Archive.......................................................................62
Deleting an Event using GUI...........................................................................................62
Deleting an Event using CLI............................................................................................63
Viewing Low Level Logs using Evweb.........................................................................................63
Overview..........................................................................................................................63
Searching Low Level Logs using Simple Search.......................................................................64
Searching Low Level Logs using Advanced Search..................................................................65
Searching Low Level Logs using CLI..................................................................................65
4 Contents
Page 5

Viewing List of Low Level Logs..............................................................................................65
Viewing List Of Low Level Logs using GUI.........................................................................66
Viewing List Of Low Level Logs using CLI...........................................................................66
Viewing Details of Low Level Logs.........................................................................................66
Viewing Details Of Low Level Logs using GUI....................................................................67
Viewing Details Of Low Level Logs using CLI.....................................................................67
Tracing Evweb........................................................................................................................67
Enabling Tracing using the Evweb GUI.................................................................................69
Enabling Tracing using the Evweb CLI...................................................................................69
Modifying Tracing using the Evweb GUI...............................................................................70
Modifying Tracing using the Evweb CLI.................................................................................70
Disabling Tracing using the Evweb GUI................................................................................70
Disabling Tracing using the Evweb CLI..................................................................................71
Querying the Common Error Repository.....................................................................................71
EMT Overview...................................................................................................................71
Launching EMT..................................................................................................................72
Querying the CER using Simple Search................................................................................72
Querying CER for Events using the GUI............................................................................72
Querying CER for Events using the CLI.............................................................................72
Querying CER using Advanced Search.................................................................................73
Viewing an Event from CER.................................................................................................73
Viewing Summary Information using the GUI....................................................................73
Viewing Summary Information using the CLI......................................................................73
Viewing Detailed Information using the GUI......................................................................74
Viewing Detailed Information using the CLI.......................................................................74
Administering Events in CER.....................................................................................................74
Adding a Custom Solution..................................................................................................74
Adding a Custom Solution using the GUI..........................................................................74
Adding a Custom Solution using the CLI...........................................................................75
Modifying a Custom Solution...............................................................................................75
Modifying a Custom Solution using the GUI......................................................................75
Modifying a Custom Solution using the CLI.......................................................................76
Deleting a Custom Solution ................................................................................................76
Deleting a Custom Solution using the GUI........................................................................76
Deleting a Custom Solution using the CLI..........................................................................76
Tracing EMT..........................................................................................................................77
Enabling Tracing using the EMT GUI....................................................................................77
Enabling Tracing using the EMT CLI......................................................................................78
Modifying Tracing using the EMT GUI..................................................................................78
Modifying Tracing using the EMT CLI....................................................................................78
Disabling Tracing using the EMT GUI...................................................................................78
Disabling Tracing using the EMT CLI.....................................................................................78
6 Troubleshooting SFM................................................................................79
Troubleshooting instance providers............................................................................................79
Troubleshooting indication providers.........................................................................................84
Troubleshooting EVWEB..........................................................................................................89
A EMT Message Definition...........................................................................93
B Interpretation of HP SMH instances.............................................................96
Processor instances.................................................................................................................97
Memory instances..................................................................................................................98
System Summary instances.....................................................................................................101
Cooling Device instances.......................................................................................................103
Power supply instances..........................................................................................................104
Contents 5
Page 6

Temperature instances...........................................................................................................105
Voltage instances..................................................................................................................106
FRU Information instances......................................................................................................107
Management Processor instances...........................................................................................108
Firmware Information instances...............................................................................................109
Enclosure Information instances..............................................................................................110
Complex-wide Info instances..................................................................................................111
Cell Board instances.............................................................................................................113
Partition Information instances................................................................................................115
Blade instances....................................................................................................................117
Cell Blade instances..............................................................................................................118
Launch the Onboard Administrator.........................................................................................119
C Syslog property order.............................................................................120
Glossary..................................................................................................121
Index.......................................................................................................124
7 Support and other resources....................................................................126
About this document ............................................................................................................126
Intended audience................................................................................................................126
Publishing history..................................................................................................................126
Document organization.........................................................................................................126
Typographic conventions...................................................................................................127
HP-UX release name and release identifier..........................................................................127
New and changed information in this edition...........................................................................128
Related information...............................................................................................................128
HP welcomes your comments.................................................................................................128
6 Contents
Page 7

1 Introduction
The System Fault Management (SFM) supports HP Integrity Superdome 2 (HP Superdome 2), HP
Integrity BL860c i2, BL870c i2 & BL890c i2 Server Blades and rx2800 i2 in addition to other HP
Integrity Servers. All the features supported on systems running the HP-UX 11i v3 operating system
are available for HP Integrity Servers.
This chapter introduces you to the System Fault Management (SFM) software and the tools that
SFM includes.
The chapter discusses the following topics:
• “Overview” (page 7)
• “Features and benefits” (page 7)
• “Components of SFM” (page 9)
• “User interfaces” (page 15)
• “Architecture” (page 15)
Overview
The SFM software is a collection of tools used to monitor the health of HP servers running HP-UX
and deconfiguring the CPU, memory etc. based on the events. SFM retrieves information about a
system’s hardware devices such as CPU, memory, power supply, and cooling devices. SFM operates
within the Web-Based Enterprise Management (WBEM) environment.
WBEM is an industry-wide standards-based initiative to aid the management of large scale systems.
WBEM has the following components:
• A WBEM infrastructure, such as HP WBEM services. SFM uses the Common Information Model
Object Manager (CIMOM) WBEM service to route query requests and responses between
WBEM providers and clients. Clients must be compliant with the Common Information Model
(CIM) (2.7.2 or later) schema of the Distributed Management Task Force (DMTF).
• A WBEM-based network management application, such as the HP Systems Insight Manager
(HP SIM) and HP System Management Homepage (HP SMH), a user interface for controlling
and monitoring resources within a large-scale system. SFM can use HP SIM to display query
information for local and remote systems.
• WBEM providers that obtain information. SFM includes instance and indication providers,
which are one set of WBEM providers among many. SFM providers query and provide system
hardware property and event information.
You must be familiar with WBEM technology before reading this guide. For more information on
WBEM technology, see the HP WBEM Services for HP-UX and Linux System Administrator's Guide
and HP WBEM Services Release Notes at:
http://www.hp.com/go/hpux-networking-docs
Features and benefits
SFM dynamically queries property information about a hardware device on a local or remote
system. It offers the following features and benefits:
• Displays information on standards-compliant graphical and command-line system management
applications, such as HP SIM and HP SMH.
• Operates within the WBEM environment.
• Supports the Central Management Server (CMS) running on HP-UX, Linux®, or Windows®.
Overview 7
Page 8

• Enables you to view and administer WBEM indications.
• Provides the same features and benefits as those found in the EMS hardware monitors.
NOTE: SFM is the replacement of EMS hardware monitors.
8 Introduction
Page 9

Components of SFM
This section discusses the following topics:
• EVWEB
• Error Management Technology (EMT)
• CIMUtil
• IPMI Event Viewer
• providers
EVWEB
EVWEB is a component of SFM that enables you to administer and view WBEM indications
generated on the local system on which SFM is installed. For more information on EVWEB, see
“Evweb overview” (page 49).
EMT
EMT is a component of SFM that enables you to view and administer information about errors
which can occur on the server. For more information on EMT, see “EMT Overview” (page 71).
CIMUtil
SFM introduces the CIMUtil command. Using CIMUtil, you can enumerate instances related to
various devices and create filters, handlers, and subscriptions supported by SFM. For more
information on CIMUtil, see man CIMUtil
IPMI event viewer
Starting March 2009 release, the IPMI Event Viewer, slview will be delivered as part of
SysFaultMgmt. In the earlier releases it was delivered as part of Online Diagnostics bundle. IPMI
Event Viewer is used to display low-level system log information.
Starting September 2009 release, the IPMI Event Viewer support will be available for the new IPMI
event format.
Providers
SFM providers are components of SFM that retrieve information about the inventory on a system
and the events that occur on the hardware resources. SFM providers can be classified as instance
providers or as indication providers.
instance providers
On request, an SFM instance provider dynamically queries the local or remote system for the
property information described in Table 1 and reports the information to the CIMOM.
Table 1 Instance providers
DescriptionInstance provider
The Blade instance provider retrieves the following information:Blade
• Blade ID
• Blade Physical location
• Blade Hardware path
• Blade Serial number
• Blade Part number
• Blade Status
Components of SFM 9
Page 10

Table 1 Instance providers (continued)
DescriptionInstance provider
NOTE: The Blade instance provider is available on HP Integrity BL860c
i2/BL870c i2/BL890c i2 Server Blades, HP Integrity Superdome 2.
The CPU instance provider gathers the following types of information:CPU
• Logical processor information, such as:
• Physical processor chip information, such as chip revisions and
• Location details, such as:
The Memory instance provider gathers the following types of information:Memory
• Memory slot information
• Memory module information, such as:
The Memory instance provider depends on the EMS Wrapper provider to
update the memory inventory on HP 9000 and HP Integrity servers.
Current clock speed◦
◦ Processor family
◦ Processor status information, including configuration and
deconfiguration, failure status, and active and inactive status
◦ Load percentage
architecture revisions
◦ Location attributes such as cabinet number, cell number, slot number,
and so on. Only information for filled slots is available.
◦ Processor IDs
◦ Serial number
◦ Part number
◦ Memory capacity
◦ Module form factor
◦ Module status (for example, configuration status, failure status)
Environmental
DAS provider
The Environmental instance provider gathers information about the following
hardware components:
• Fans
• Power supply
• Bulk power supply
• AC input lines
Enumeration of Power supply and Fan on a blade system is not supported.
The FMD instance provider does the following:Filter Metadata (FMD)
• Provides the ability to predefine a filter in a repository
• Ensures that chosen indications are logged to the Event Archive
• Creates HP-advised subscriptions when SFM is installed
The Firmware Revision provider retrieves the following types of information:Firmware Revision
• System firmware revision
• Management Processor (MP) firmware revision
Starting with HP-UX 11i v3 March 2009 release, SFM does not monitor
information of storage disks or disk enclosures. However, the DAS provider
collects inventory details of the direct attached storage disks and monitors
the systems for errors.
10 Introduction
Page 11

Table 1 Instance providers (continued)
DescriptionInstance provider
For more information on the DAS provider, see the HP-UX WBEM Direct
Attached Storage (DAS) provider Data Sheet and Release Notes at: http://
www.hp.com/go/hpux-wbem-docs
Retrieves information about the management processor on the system.Management Processor
The Enclosure instance provider retrieves the following types of information:Enclosure
• Onboard Administrator (OA) description
• OA IP address
• OA MAC address
• URL to launch the OA
NOTE: The Enclosure instance provider is available on all integrity Blade
systems except for BL60p and HP Integrity Superdome 2.
Temperature Sensor
Record Log
ComputerSystem Chassis provider
The Temperature Sensor provider retrieves the following types of information:
Describes properties such as sensor number, current temperature reading,
and temperature sensor status.
• Sensor number
• Current temperature reading
• Temperature sensor status
• Processor temperature
• Memory board temperature
On HP 9000 and HP Integrity ® systems running a supported version of
HP-UX, the Temperature Sensor provider retrieves information related to the
ambient temperature in the system. On HP 9000 and HP Integrity ® system
not supporting the system and numeric sensor, the Temperature Sensor
instance provider doesn’t retrieve any information.
Enables event analysis tools such as Web-Based Enterprise Services (WEBES)
to access details of indications generated by the SFMIndicationProvider
that are available in the SFM database, for event analysis. The provider
also supports MCA logs. Event analysis tools can access MCA log details
for event analysis.
For more information, see Recordlog and MCA indication provider at:
http://bizsupport1.austin.hp.com/bc/docs/support/SupportManual/
c02578184/c02578184.pdf
Retrieves properties such as the serial number, product ID, and virtual
Universally Unique ID (UUID). It provides the following details related to the
physical system:
• SerialNumber
• ProductId
• Model
The ComputerSystem Chassis provider provides the following details related
to the logical server:
• VirtualSerialNumber
• VirtualUUID
These values are retained when an OS instance is moved to another server.
Consolidated Status provider
The Consolidated Status provider provides the overall health status of various
subsystems of the managed node. The overall health status is consolidated
from the health status of individual status providers registered with WBEM.
The SFM providers that contribute to the overall health status are:
Components of SFM 11
Page 12

Table 1 Instance providers (continued)
Indication providers
SFM includes four indication providers, the EMS Wrapper provider, the Event Manager Common
Information Model (EVM CIM) provider, SFMIndicationProvider and MCA indication provider.
Table 2 describes the SFM indication providers.
Table 2 Indication providers
DescriptionInstance provider
Blade
CPU
Memory
Environmental
Firmware Revision
Management Processor
Enclosure
Temperature Sensor
DescriptionIndication provider
The EMS Wrapper provider does the following:EMS Wrapper provider
1. Converts hardware events generated by the EMS Hardware
Monitors into WBEM indications.
2. Reports the WBEM indications to the CIMOM. Using a
WBEM-based management application, such as HP SIM, you
can subscribe to and receive Event Monitoring Service (EMS)
events generated on a remote system. On the system on which
SFM is installed, you can use an SFM tool, called EVWEB, to
view and administer events through the HP SMH interface.
The following EMS Hardware Monitors are supported on HP 9000
servers running the HP-UX 11i v3 operating system:
• LPMC (now CPU) (lpmc_em)
• Memory (dm_memory)
• Core HW (dm_core_hw)
• Chassis Code (dm_chassis)
• Integrity Core Hardware Monitor(ia64_corehw)
• IPMI Forward Progress Log Monitor (fpl_em)
The following EMS Hardware Monitors are supported on HP
Integrity® servers running the HP-UX 11i v3 operating system:
• Corrected Platform Error Monitor (cpe_em)
• IPMI Forward Progress Log Monitor (fpl_em)
• CMC Monitor (cmc_em)
• Itanium Core Hardware Monitor(ia64_corehw)
• Itanium Memory Monitor (memory_ia64)
NOTE: This provider and WBEM to EMS Consumer is not
supported on HP Integrity BL860c i2, BL870c i2 & BL890c i2
Server Blades, HP Integrity rx2800 i2 server, and HP Integrity
Superdome 2.
For a list of EMS Event Descriptions, see:
http://www.hp.com/go/
hpux-diagnostics-online-events
12 Introduction
The EVM CIM provider does the following:EVM CIM provider
Page 13

Table 2 Indication providers (continued)
DescriptionIndication provider
1. Converts hardware, software, and kernel events generated by
the EVM into WBEM indications.
2. Reports the WBEM indications to the CIMOM. Using a
WBEM-based management application, such as HP SIM, you
can subscribe to and receive EVM events generated on a
remote system. On the system on which SFM is installed, you
can use an SFM tool, called EVWEB, to view and administer
events through the HP SMH interface.
3. Logs messages logged by EVMCimProvider in
/var/opt/sfm/EvmCimProvider.log log file.
SFMIndicationProvider
The SFMIndicationProvider generates indications that are compliant
with the WBEM standards. On HP Integrity systems, it replaces
the following EMS monitors:
• cmc_em
• cpe_em
• memory_ia64
• fpl_em
• ia64_corehw
On HP 9000 systems, it replaces the following EMS monitors:
• fpl_em
• ia64_corehw
On HP Superdome 2, the core analysis engine monitors core
hardware and generates events. DPR and PCI Error Recovery
events are generated on HP-UX . The following indication providers
generate the event respectively:
• CMC_IndicationProviderIA
• PCIeIndicationProvider
You can choose to use either the SFMIndicationProvider or the
EMS monitors that it replaces, to monitor your hardware. The
remaining EMS monitors continue to function as usual irrespective
of whether you choose the SFMIndicationProvider or the EMS
monitors that it replaces. If you choose the SFMIndicationProvider,
it does the following:
1. Generates WBEM indications equivalent to the events that the
monitors it replaces generate.
2. Reports these WBEM indications to the CIMOM.
In the WBEM indication details, the provider name displayed
corresponds with the device to which the indication is related. For
example, if the name of the provider displayed in the event details
is MemoryIndicationProviderIA, the event is related to
memory. For a complete list of the names of providers displayed
in the WBEM indication details, in the SFM mode, see
Table 6 (page 40). The provider names indicate the device to
which the event is related.
For a list of WBEM indications and their details, see the SFM Event
Descriptions at:
http://www.hp.com/go/hpux-diagnostics-sfm-events
MCA indication provider
The MCA indication provider generates an indication when
Machine Check Abort (MCA) logs are present due to an MCA.
The MCA indication provider is available on all HP 9000 and
Integrity systems except for HP Integrity Superdome 2.
Components of SFM 13
Page 14

NOTE: The following apply to indication providers:
• The terms events and indications are used interchangeably.
• Although both EMS Wrapper provider and EVM CIM provider generate events related to
system hardware, the nature of events are different.
In addition, the support for CPUIndicationProvider and MemoryIndicationProvider has been added
with additional support for hardware events on HP Integrity BL860c i2, BL870c i2 &
BL890c i2 Server Blades. The support for MemoryIndicationProvider has been added for
Legacy memory events and that for MemoryIndicationProviderIA for HP Integrity BL860c
i2, BL870c i2 & BL890c i2 Server Blades, HP Integrity Superdome 2 and
rx2800 i2 servers. For the listing of new events reported by SFM on these indication providers,
see the SFM Event Descriptions.
CIMOM identifies the SFM providers using SFMProviderModule. If a provider is not working
properly, SFMProviderModule stops all the SFM providers.
Table 3 Instance / Indication providers support
2
√√√CPUProvider and
CPUStatusProvider
PA-RISC providerInstance / Indication providers
IA legacy provider
1
IA NGIS providers
BladeStatusProvider
MemoryStatus provider
EnclosureStatusProvider
instance provider
ХBladeProvider and
Supported only on BL860c
i2, BL870c i2 & BL890c i2
√Memory provider and
Supported only on BL860c
i2, BL870c i2 & BL890c i2
ХEnclosureProvider and
Supported only on BL860c
i2, BL870c i2 & BL890c i2
√
Not supported on HP
√√Field Replaceable Unit (FRU)
Not supported on HP
√√
ХХ√EMDProvider
√√√Environmental
√
Superdome 2
√√
√√√MPProvider and MPStatusProvider
√√√CSChassisProvider
√√√RecordLog provider
√
Superdome 2
Х√√EMS Wrapper provider
14 Introduction
√√ХEVM CIM provider
√√√SFMIndicationProvider
√XMCAIndicationProvider
Not supported on HP
√
Superdome 2
√√√Temperature Sensor
√√√Firmware Revision provider
X√√StatusChangeIndication provider
Page 15

1
Legacy : HP Integrity platforms supporting processors prior Intel 9300.
2
NGIS : HP Integrity platfroms supporting Intel 9300 processors
Table 4 (page 15) lists the detection status of SFMIndication providers
Table 4 Representation of Monitors
Detection statusProvider
asynchronousCPUIndicationProvider
pollingMCAIndicationProvider
asynchronousCMC_IndicationProviderIA
asynchronousCPE_IndicationProviderIA
asynchronousCoreHardwareIndicationProvider
asynchronousChassisIndicationProvider
polling and asynchronousDiskIndicationProvider
pollingFPL_IndicationProvider
pollingSEL02_IndicationProvider
asynchronousLPMC_IndicationProvider
asynchronousMemoryIndicationProvider
Cron job
SFM includes the following features from the HP-UX 11i v3 February 2007 release:
• Cron job: When restart is attempted, /opt/sfm/bin/restart_sfm.sh script handles
restart if module is in degraded state.
• Vacuum cron job: Configured to be invoked once a day, the vacuum cron job is used to free
up unused memory space of SFM PostgresSQL database.
User interfaces
You can use two types of interfaces to view SFM provider queries: HP SIM and HP SMH. This
section describes these interfaces.
HP Systems Insight Manager
HP SIM is a WBEM-based user interface for controlling and monitoring resources within a large-scale
system. You can use HP SIM to create subscriptions and to view indications and instances on a
remote system. You must install HP SIM on the CMS. You can use HP SIM to launch HP SMH.
HP System Management Homepage
HP SMH is a secure, Web-based management application. You must install HP SMH on a local
system to view hardware configuration, status data, performance metrics, system thresholds, and
software version control information. You can also launch HP SMH from HP SIM remotely.
asynchronousPCIeIndicationProvider
Architecture
Figure 1 illustrates the architecture of SFM installed on a client system. The client system is managed
by the CMS.
User interfaces 15
Page 16
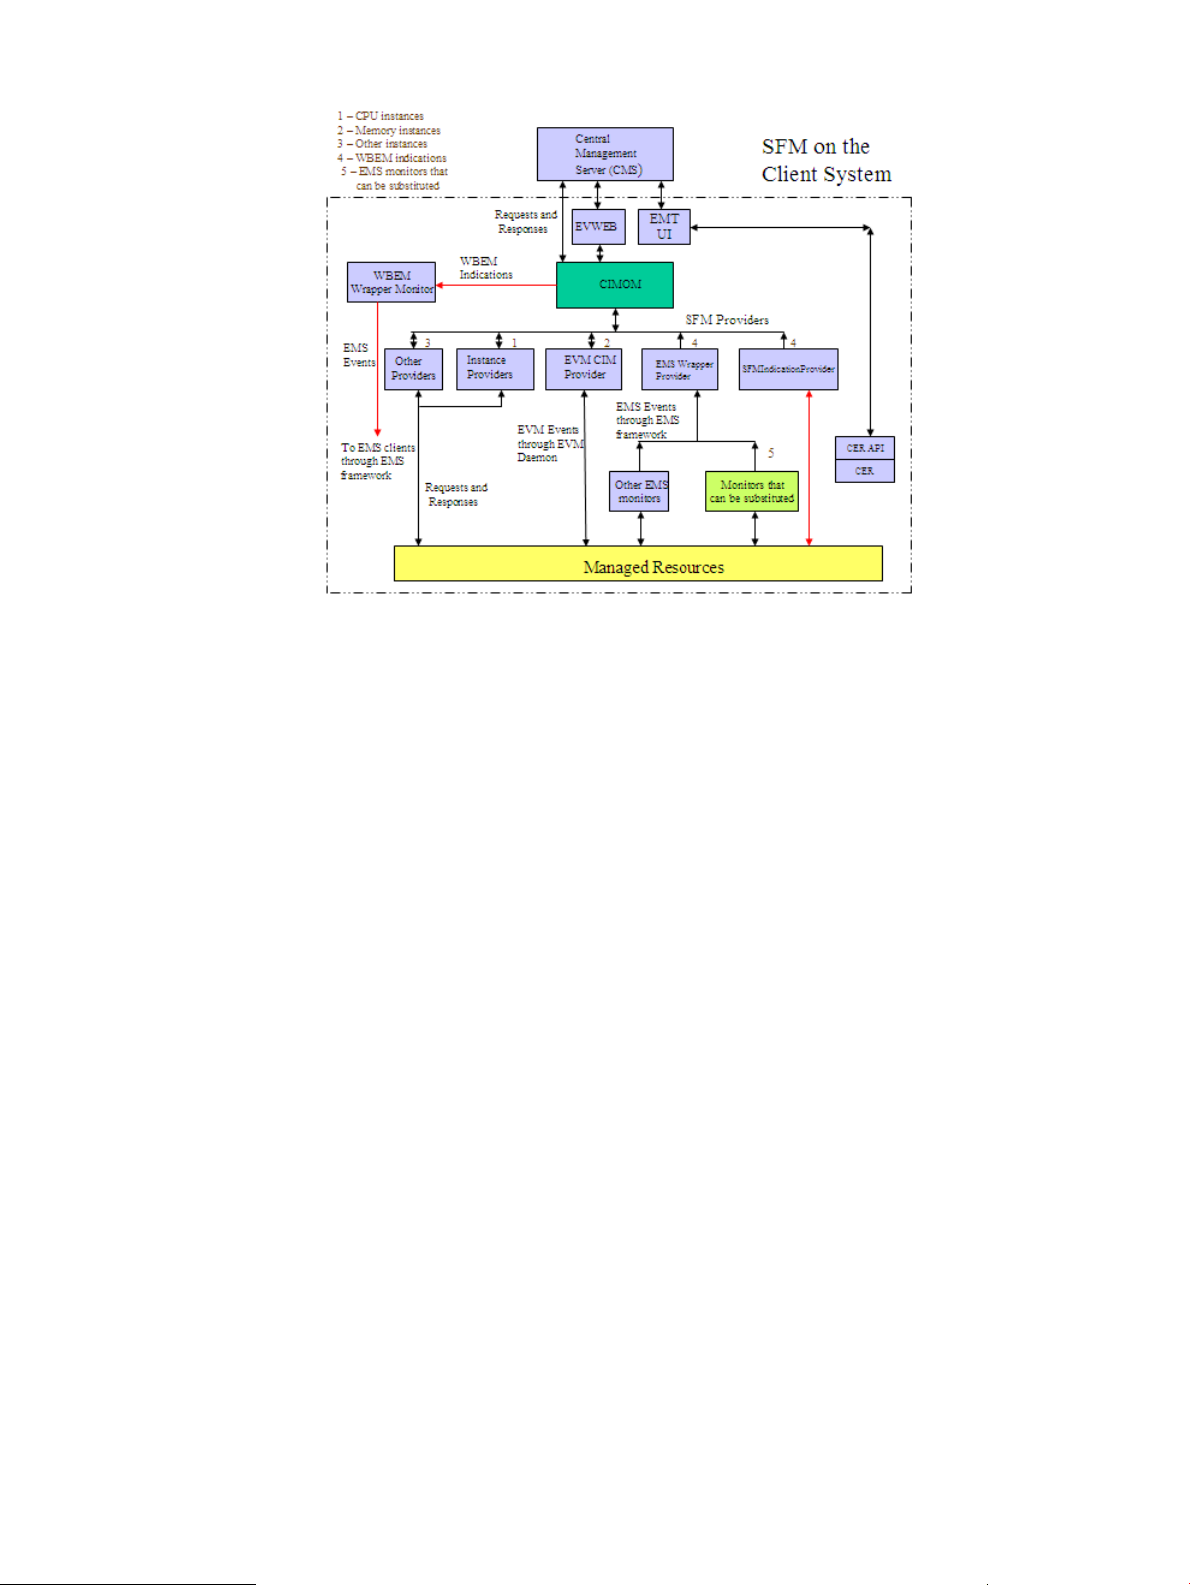
Figure 1 Block Diagram of SFM
The following list describes the sequence of events when a request is made for information:
1. The CIMOM receives requests from the CMS for information about devices.
2. The CIMOM directs the requests to the appropriate SFM provider, for example, the CPU
instance provider.
3. The SFM provider queries the associated hardware device for property information.
4. The SFM provider returns the query information to the CIMOM.
5. The CIMOM conveys the responses from the provider to the CMS.
You can view the information using HP SIM on the remote system and HP SMH on the local
system.
The following list describes the sequence of events when an event is generated from an EMS
monitor:
1. EVWEB and CMS subscriptions are created.
2. The EMS Wrapper provider receives events generated by the EMS monitors through the EMS
framework.
3. The provider converts these events into WBEM indications and reports these indications to the
CIMOM.
4. CIMOM directs these indications to the CMS that has created subscriptions for indications.
EVWEB retrieves the errors that occurred on the local system and stores the indications either
in the Event Archive or in your E-mail box, or both, depending on your configuration.
You can view indications using HP SIM on the remote system and HP SMH on the local system.
The sequence of events if you choose to use the SFMIndicationProvider instead of the EMS monitors
it substitutes, is as follows:
1. EVWEB and CMS subscriptions are created.
2. The SFMIndicationProvider generates WBEM indications that are triggered by errors on devices
that it monitors.
3. The provider reports these WBEM indications to the CIMOM.
16 Introduction
Page 17

4. The CIMOM directs these indications to EVWEB and to the CMS that has created subscriptions
for indications. EVWEB then stores the indications either in the Event Archive, in syslog, or in
your E-mail box, or all, depending on your configuration.
Indications can be viewed using HP SIM on the remote system and HP SMH on the local
system.
5. The indications generated by the SFMIndicationProvider, and reported to the CIMOM, can
also be directed to the EMS framework through the WBEM Wrapper Monitor. The WBEM
Wrapper Monitor converts the WBEM indications into EMS events and directs them to the
EMS framework.
EMS clients can receive these events, along with the other events generated by the EMS
monitors, through the EMS framework.
NOTE:
a. Only those indications that are generated by the SFMIndicationProvider in the SFM
monitoring mode, can be directed to the EMS framework through the WBEM Wrapper
Monitor. Indications generated by the EMS Wrapper provider in the EMS monitoring
mode, cannot be directed to the EMS framework.
b. You can continue to receive all events from EMS Hardware Monitors through the EMS
framework along with the indications on EVWEB and CMS.
The following list describes the sequence of events when an event is generated by EVM:
1. EVWEB and CMS subscriptions are created.
2. The EVM CIM provider receives events posted by the posting clients through the EVM Daemon.
3. The provider converts these events into WBEM indications and reports these indications to the
CIMOM.
4. CIMOM directs these indications to EMT and the CMS that has created subscriptions for
indications. EVWEB retrieves the errors that occurred on the local system and stores the
indications either in the Event Archive, in syslog, or in your E-mail box, or all, depending on
your configuration.
You can view indications using HP SIM on the remote system and HP SMH on the local system.
Architecture 17
Page 18

2 Installing the SFM software
The System Fault Management (SFM) software is installed by default with the HP-UX 11i v3
Operating Environment (OE) media. However, at some point you may need to install the SFM
software separately. This chapter describes how to install the SFM software as a standalone
component on the HP-UX 11i v3 operating system.
This chapter discusses the following topics:
• “Prerequisites” (page 18)
• “Installing the SFM software from the media” (page 19)
• “Installing the SFM software from the web” (page 22)
• “Verifying the installation” (page 22)
• “Removing the SFM software” (page 24)
• “Verifying removal of the SFM software” (page 27)
Prerequisites
Starting with HP-UX 11i v3 September 2011 release, SysFaultMgmt and its dependencies are
available through HP-UX WBEM Management Bundle (WBEMMgmtBundle). This Mega bundle
is available only on HP Software Depot. It is recommended to install the products together from
the WBEMMgmtBundle due to the product dependency. For installation steps, see “Installing the
SFM software from the web” (page 22)
Following are the prerequisites for installing the March 2012 version of SFM software:
• HP-UX 11i v3 February 2007 release or later
• OpenSSL Version A.00.09.08g.001 or later
• EVM-EventMgr B.11.31 September 2007 or later
• SysMgmtBase Version B.00.02.03 (Interface) or later
• WBEMSvcs Version A.02.09.02.00 or later
• PHCO_40289 (for Itanium only)
• SysMgmtWeb (HP-UX Web-Based System Management User Interface) Version A.3.0.0.2,
September 2009 release or later
• HP Systems Insight Manager (HP SIM) Version C.06.01 or later
• ProviderSvcsBase Version C.07.00.07.01, March 2012 release or later
• SysMgmtPlus Version A.04.00, September 2010 release or later
• OnlineDiag Version B.11.31.06.xx on HP 9000 systems only, September 2009 release or
later
A.04.20.31EMS Version
D.06.00STM Version
18 Installing the SFM software
Page 19
NOTE:
• The listed versions of the software are the minimum supported requirements. Subsequent
versions are compatible with this version of SFM unless otherwise noted.
• WBEM Services, Online Diagnostics, SysMgmtWeb, and HP SIM are available on the
Operating Environment (OE) media and can be selected for install during the SFM installation.
• HP System Management Homepage (SMH) – bundled in SysMgmtWeb. You cannot access
the EvWEB GUI (Event Viewer, Subscription Administration and Log Viewer interface), EMT(Error
Management Technology) GUI and IPMI Event Viewer GUI without HP SMH. The command
line interface for EVWEB, EMT and IPMI Event Viewer (Slview) will still be accessible.
• HP Systems Insight Manager (HP SIM) is an optional install. However, HP recommends using
the latest available version to remotely administer indications and instances. The minimum
requirements are the June 2010 release:
HP SIM 6.1 with Update 1 - HP-UX (C.06.01.00.00.04).
Installing the SFM software from the media
This section describes the two ways in which you can install the SFM software from the HP-UX 11i
v3 OE media:
• Using the terminal user interface (TUI)
• Using the command-line interface (CLI)
Installing using the TUI
To install the SFM software using the TUI, complete the following steps:
1. Log in to the system as a superuser.
2. Mount the CD to a location of your choice as in the following example:
# mount /dev/dsk/c1t2d0 /tmp/cdrom
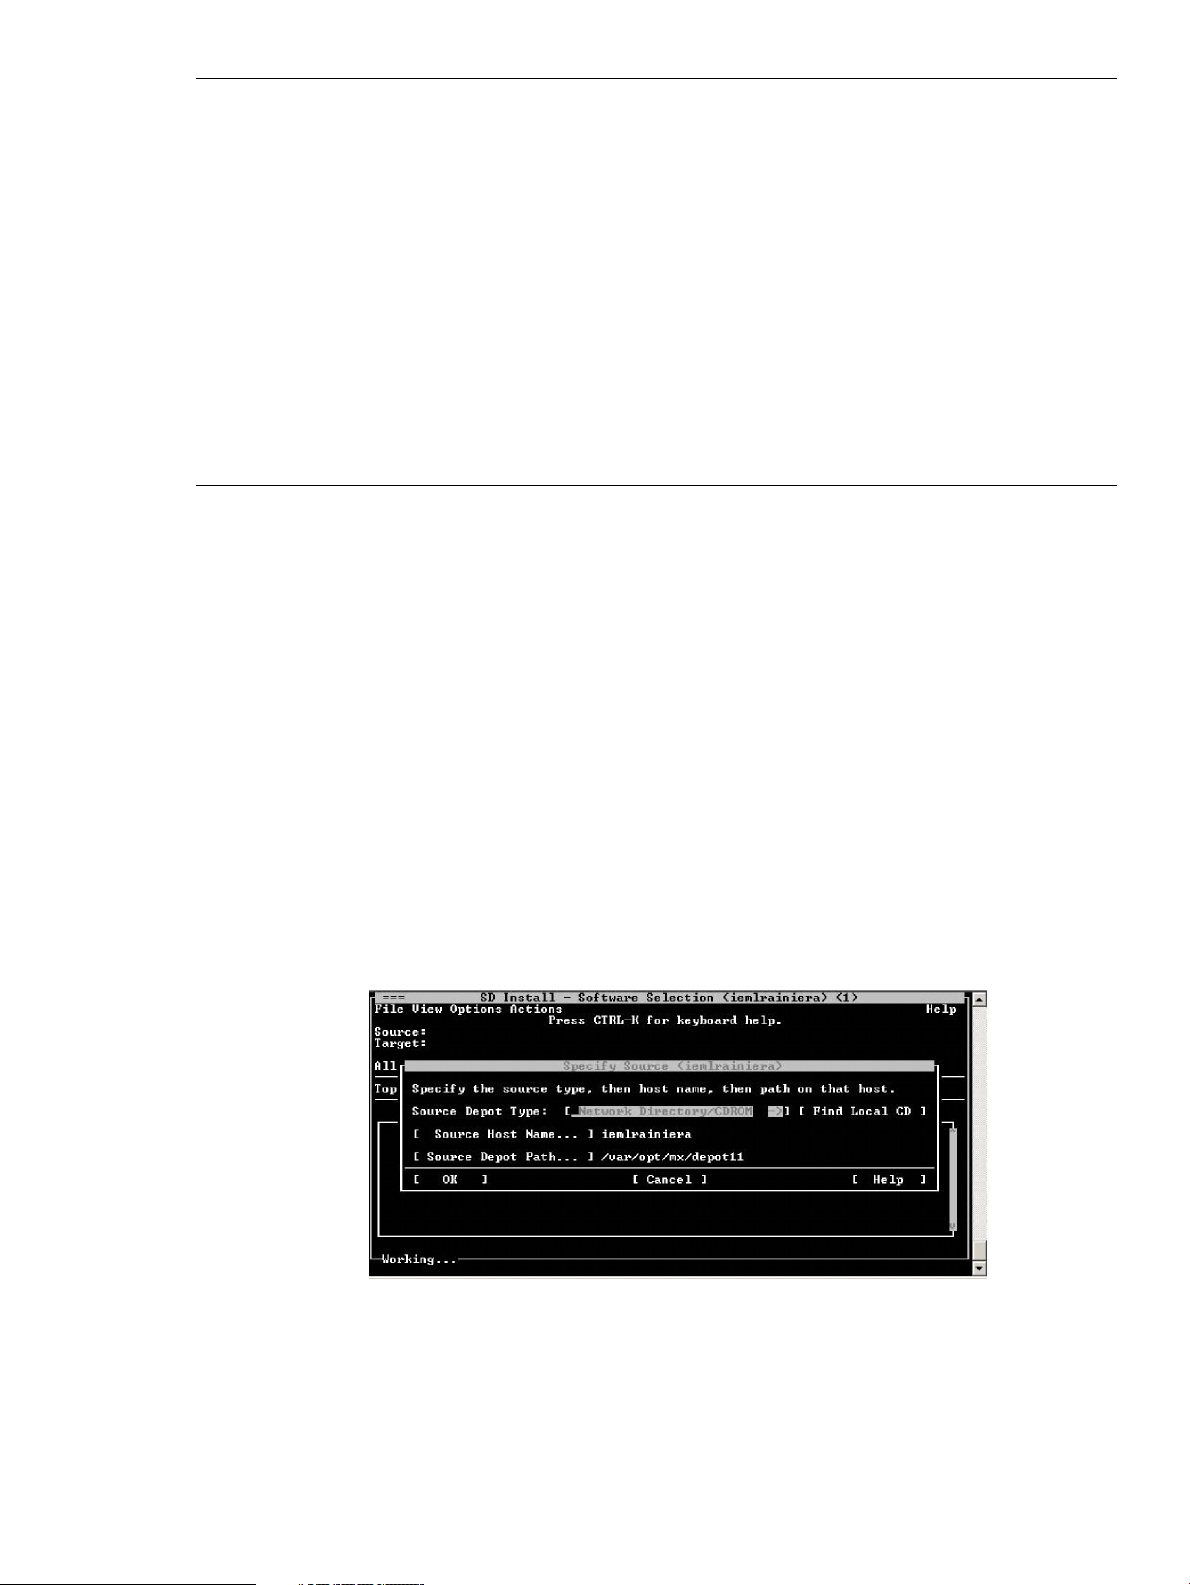
3. Enter the following command at the HP-UX prompt:
# swinstall
The SD Install - Software Selection window appears as shown in the following figure:
4. In the Specify Source window, select the appropriate location and click OK. The SD Install Software Selection window is displayed.
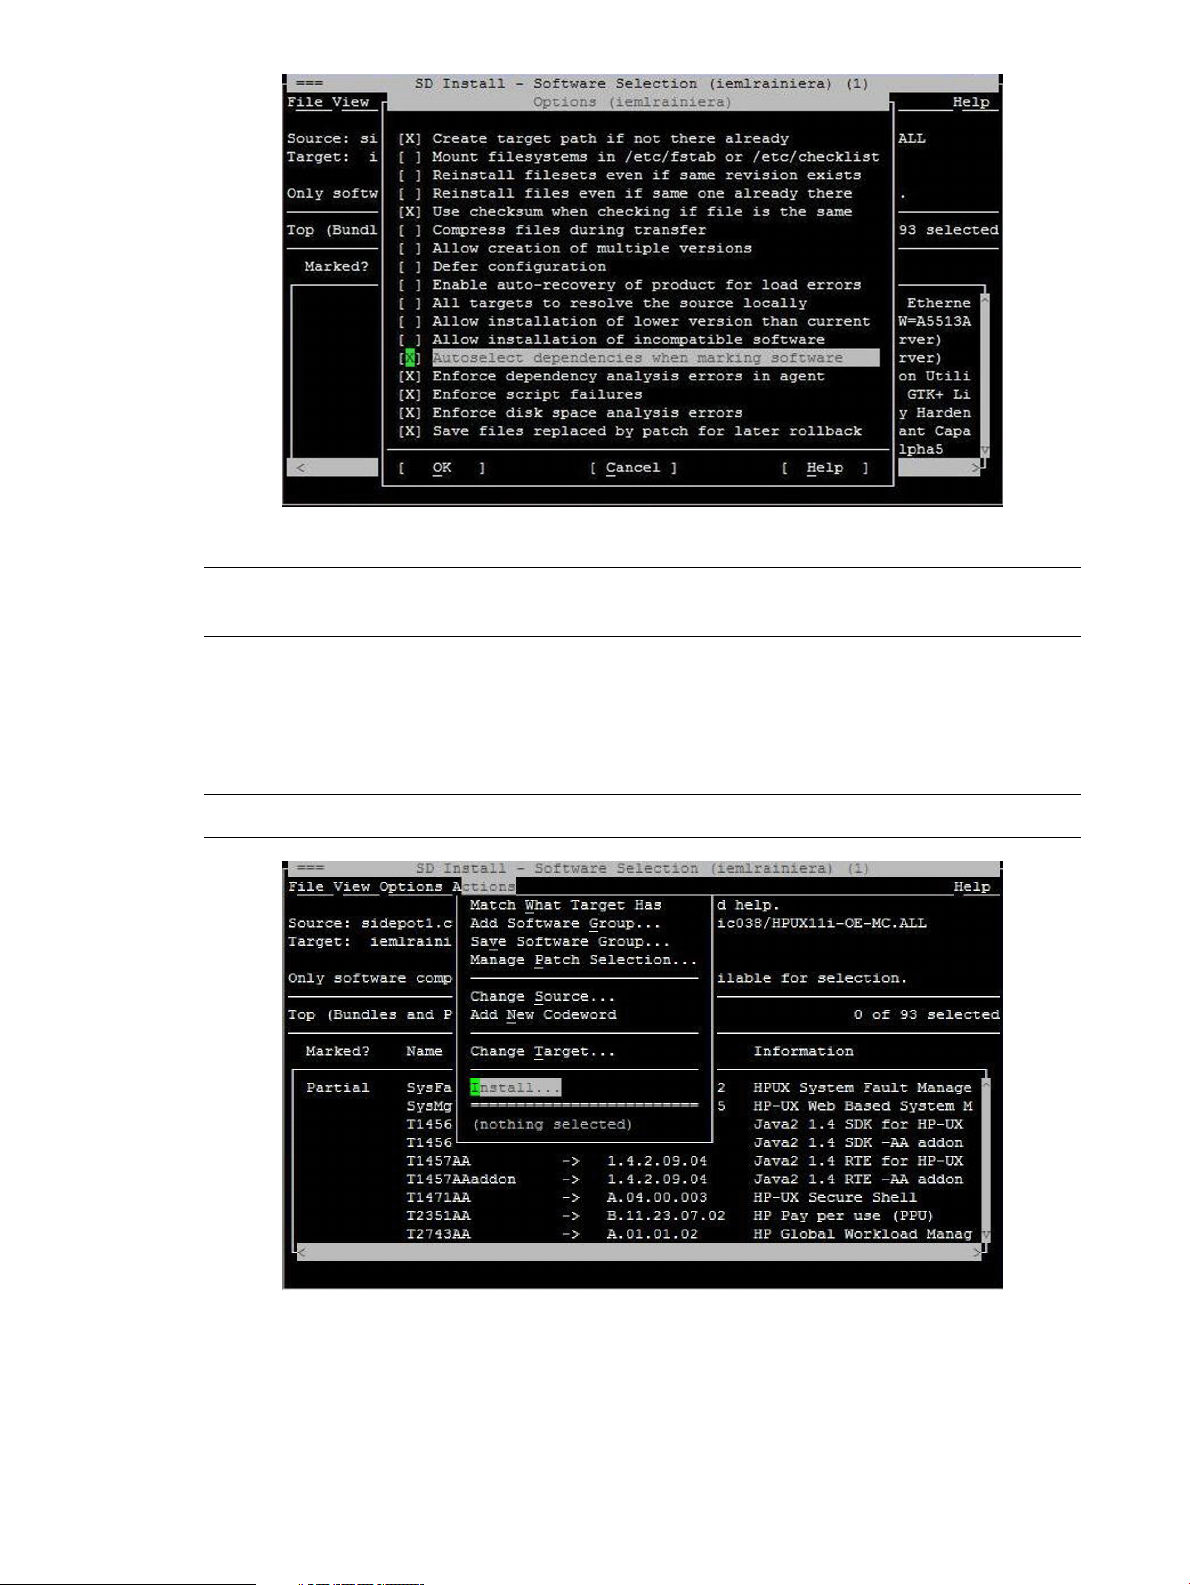
5. In the SD Install - Software Selection window, select Options-> Autoselect dependencies when
marking software.
6. Select Enforce dependency analysis errors in agent, and click OK, as shown in the following
figure. The Note window is displayed.
Installing the SFM software from the media 19
Page 20
Selecting these options automatically installs all the dependencies.
NOTE: The system selects some options by default. However, you must select the two options
mentioned in step 5 to automatically install the prerequisites.
7. Click OK in the Note window to confirm the selection of dependencies.
8. In the SD Install - Software Selection window, select Actions->Install, as shown in the following
figure. You will need to install SysFaultMgmt, OnlineDiag and ProviderSvcsBase product
together from the DiagProdCollection bundle due to the product dependency. Verify the depot
by using swverify command.
NOTE: SFM is automatically configured after it is installed.
The following figure displays the beginning of the configuration phase:
20 Installing the SFM software
Page 21
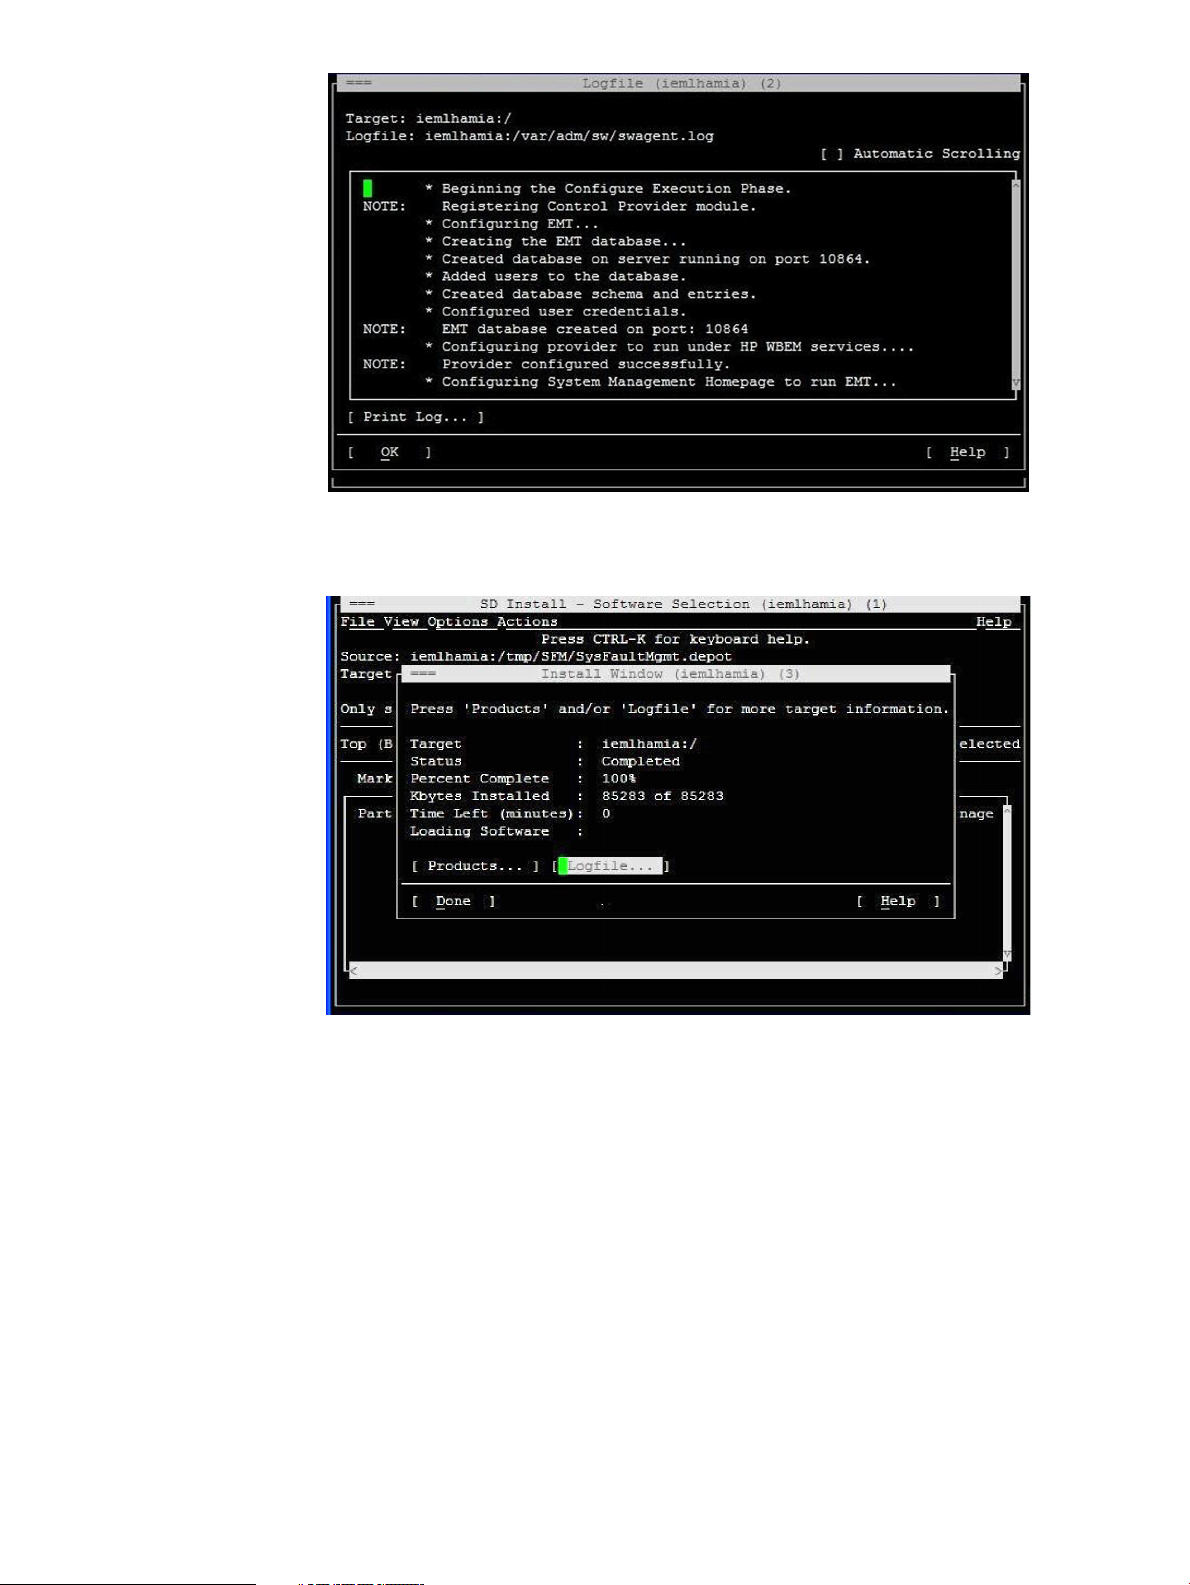
When the SFM software installs, the Install window appears indicating that the SFM software
is installed successfully, as shown in the following figure:
9. Unmount the CD. To unmount, enter the following command at the HP-UX prompt:
# unmount /tmp/cdrom
10. To verify whether the SFM software is installed properly, enter the following command at the
HP-UX prompt:
# swlist | grep SysFaultMgmt
If the SFM software is installed properly, SysFaultMgmt and the version number of the SFM
software are displayed in the output. If the SFM software is not installed properly, you must
repeat the installation procedure. For more information, see “Verifying the installation”
(page 22).
Installing using the CLI
To install the SFM software using CLI, complete the following steps:
1. Log in to the system as a superuser.
2. Mount the CD to a location of your choice, as in the following example:
# mount /dev/dsk/c1t2d0 /tmp/cdrom
Installing the SFM software from the media 21
Page 22

3. To install the SFM software and all the dependencies, enter the following command at the
HP-UX prompt:
# swinstall -x autoselect_dependencies=true -x
enforce_dependencies=true -s /tmp/cdrom SysFaultMgmt
4. Unmount the CD. To unmount, enter the following command at the HP-UX prompt:
# unmount /tmp/cdrom
5. To verify whether the SFM software is installed properly, enter the following command at the
HP-UX prompt:
# swlist | grep SysFaultMgmt
If the SFM software is installed properly, SysFaultMgmt and the version number of the SFM
software appear in the output. If the SFM software is not installed properly, you must repeat
the installation procedure. For more information, see “Verifying the installation” (page 22).
Installing the SFM software from the web
Starting with HP-UX 11i v3 March 2009 release, OnlineDiag and SysFaultMgmt products are
available through HP-UX Diagnostics Products Collection (DiagProdCollection) Mega bundle. This
Mega bundle is available only on web. You will require to install SysFaultMgmt, OnlineDiag and
ProviderSvcsBase product together from the DiagProdCollection bundle due to the product
dependency.
To install the SFM software from the Software Depot, complete the following steps:
1. Go to HP Software depot at: http://www.hp.com/go/softwaredepot
2. Search for WBEMMgmtBundle and select WBEM Management bundle for HP-UX 11i v3. The
Overview page is displayed. This page provides the details of solution for installation/upgrade
of WBEM Management products bundle.
3. Go to the Installation page and review Prerequisites to ensure that your system meets the
requirements.
4. Select the Receive for Free >> option at the bottom right of the page.
5. Select the appropriate release of the HP-UX operating system.
6. Enter your registration information. Read and accept the terms and conditions.
7. Click Next >> at the bottom right of the page.
8. Click the appropriate link under Download Software to download the software. Save the
software in a local directory on your system, for example, /tmp/SysFaultMgmt.depot.
9. To install the product, login as superuser and enter the following command:
# swinstall -s <full path of depot> SysFaultMgmt
For example,
# swinstall -s /tmp/SysFaultMgmt.depot SysFaultMgmt
10. To verify whether the SFM software is installed properly, enter the following command at the
HP-UX prompt:
# swlist | grep SysFaultMgmt
If the SFM software is installed properly, SysFaultMgmt and the version number appear in the
output. If the SFM software is not installed properly, you must repeat the installation procedure.
For more information, see “Verifying the installation” (page 22).
Verifying the installation
This section describes how to verify the SFM software installation using the TUI and the CLI.
22 Installing the SFM software
Page 23
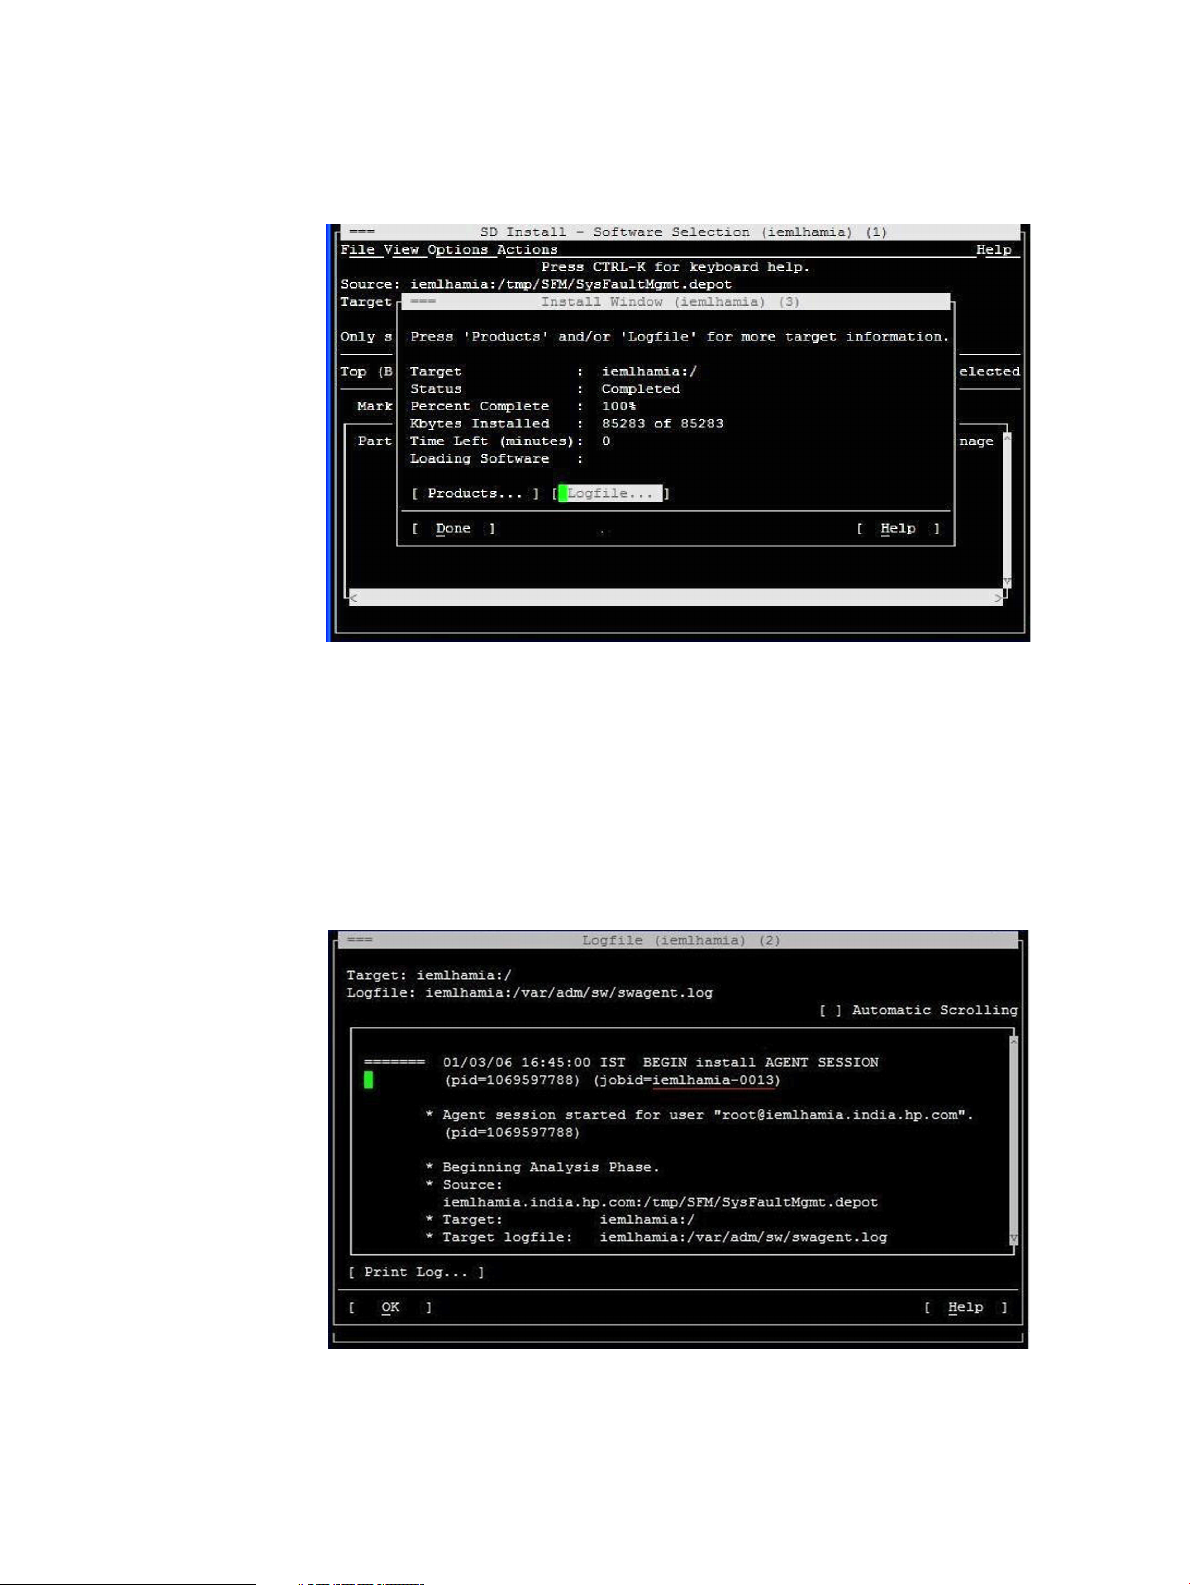
Verifying the installation using the TUI
To verify the SFM software installation, complete the following steps:
1. Log in to the system as a superuser.
2. Click Logfile in the Install window, as shown in the following figure:
The Logfile, which includes details about the installation, is displayed. If there are no errors
in the Logfile, the SFM software is installed properly. If the SFM software is not installed
properly, you must repeat the installation procedure.
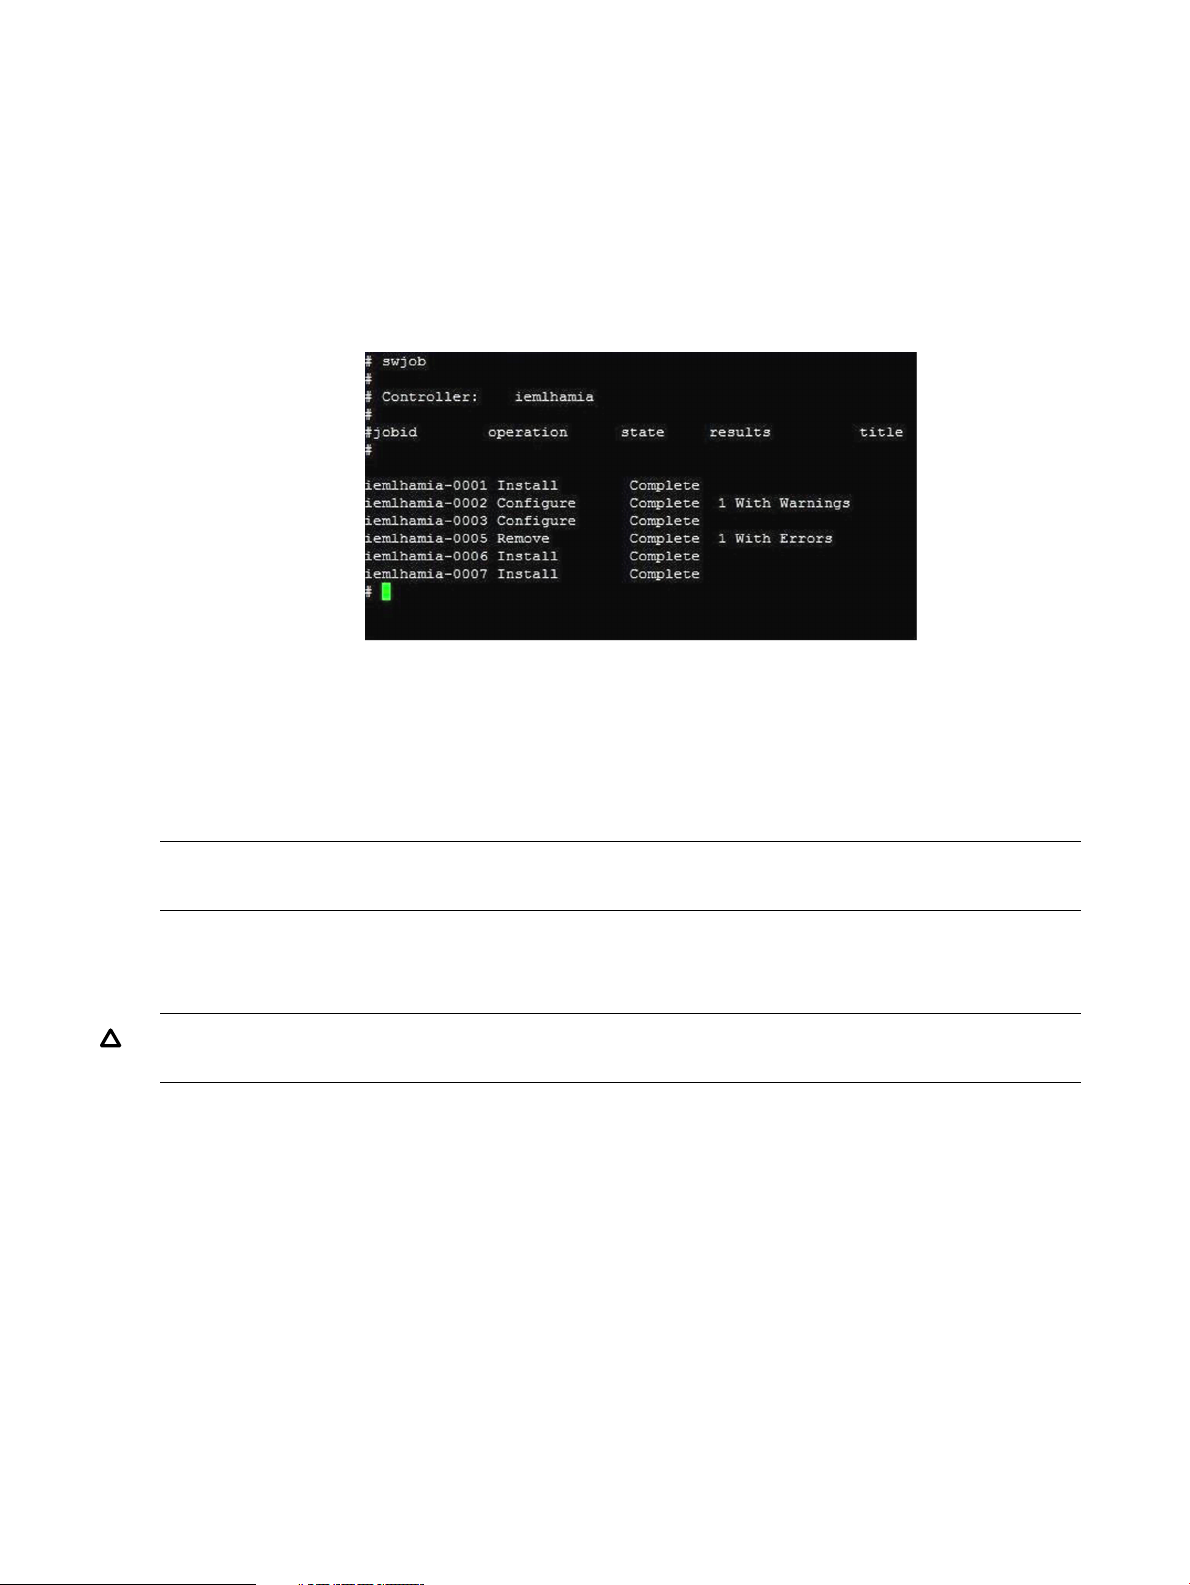
3. For information about errors related to installation, enter the following command at the HP-UX
prompt:
# swjob -a log <jobid> @ <system name>:/
The jobid is available in the Logfile, as underlined in the Logfile window, in the following
figure:
For example, enter the following command at the HP-UX prompt:
# swjob -a log iemlhamia-0013 @ iemlhamia.india.hp.com:/
Verifying the installation 23
Page 24
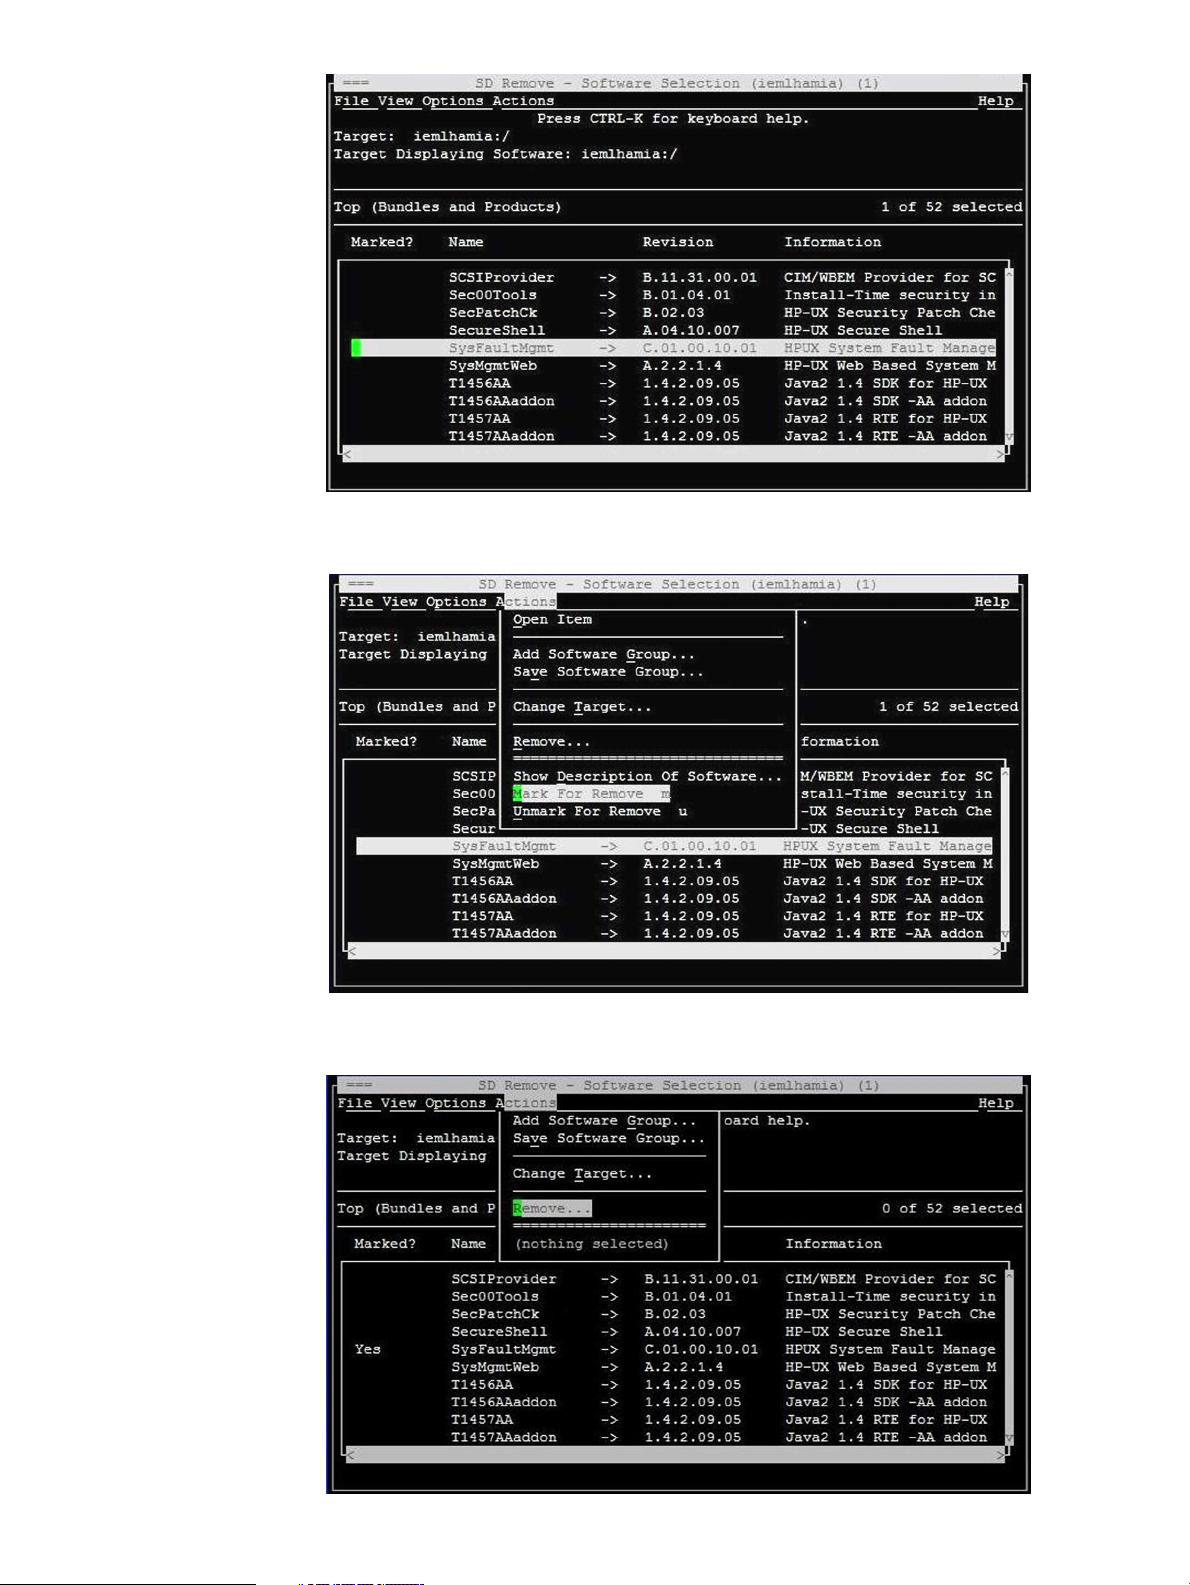
Verifying the installation using the CLI
To verify your installation using the CLI, complete the following steps:
1. Log in to the system as a superuser.
2. Enter the following command at the HP-UX prompt:
# swjob
If the output contains no errors, the SFM software is installed properly. Otherwise, you must
install the SFM software again.
A sample output is shown in the following figure:
3. For information about installation-related errors, enter the following command at the HP-UX
prompt:
# swjob -a log <jobid> @ <system name>:/
For example, enter the following command at the HP-UX prompt:
# swjob -a log iemlhamia-0005 @ iemlhamia.india.hp.com:/
NOTE: The logs to /var/opt/sfm/log/install.log are written when SFM is getting
installed.
Removing the SFM software
This section describes how to remove of the SFM software using the TUI and the CLI.
CAUTION: Removing the SFM software makes your system vulnerable to failure. Also, all the
software products that depend on the SFM software may not work properly.
Removing the software using the TUI
To remove the SFM software from your system, complete the following steps:
1. Log in to the system as a superuser.
2. Enter the following command at the HP-UX prompt:
# swremove
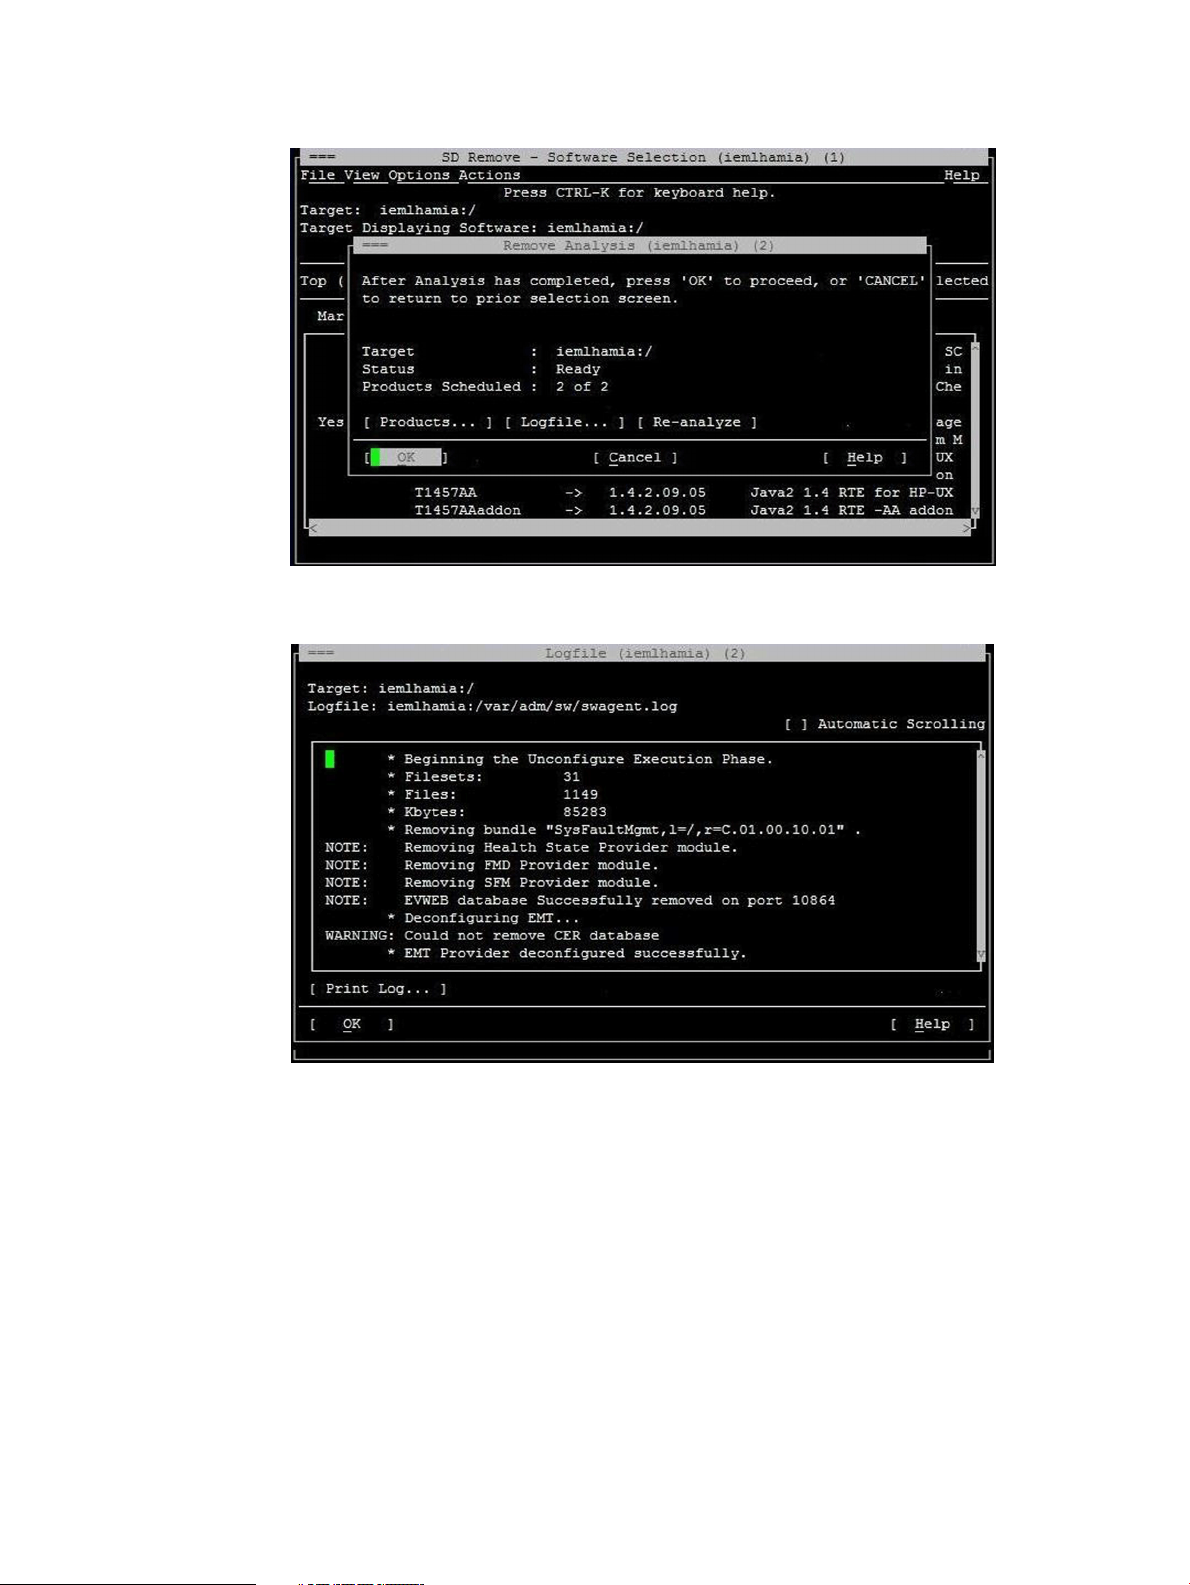
3. Select SysFaultMgmt in the SD Remove window, as shown in the following figure:
24 Installing the SFM software
Page 25
4. Select Actions->Mark for Remove in the SD Remove window, as shown in the following figure:
5. Select Actions->Remove, as shown in the following figure:
Removing the SFM software 25
Page 26
6. Click OK in the Remove Analysis window to confirm the removal of the SFM software, as
shown in the following figure:
The following figure is a sample of the removal process in progress:
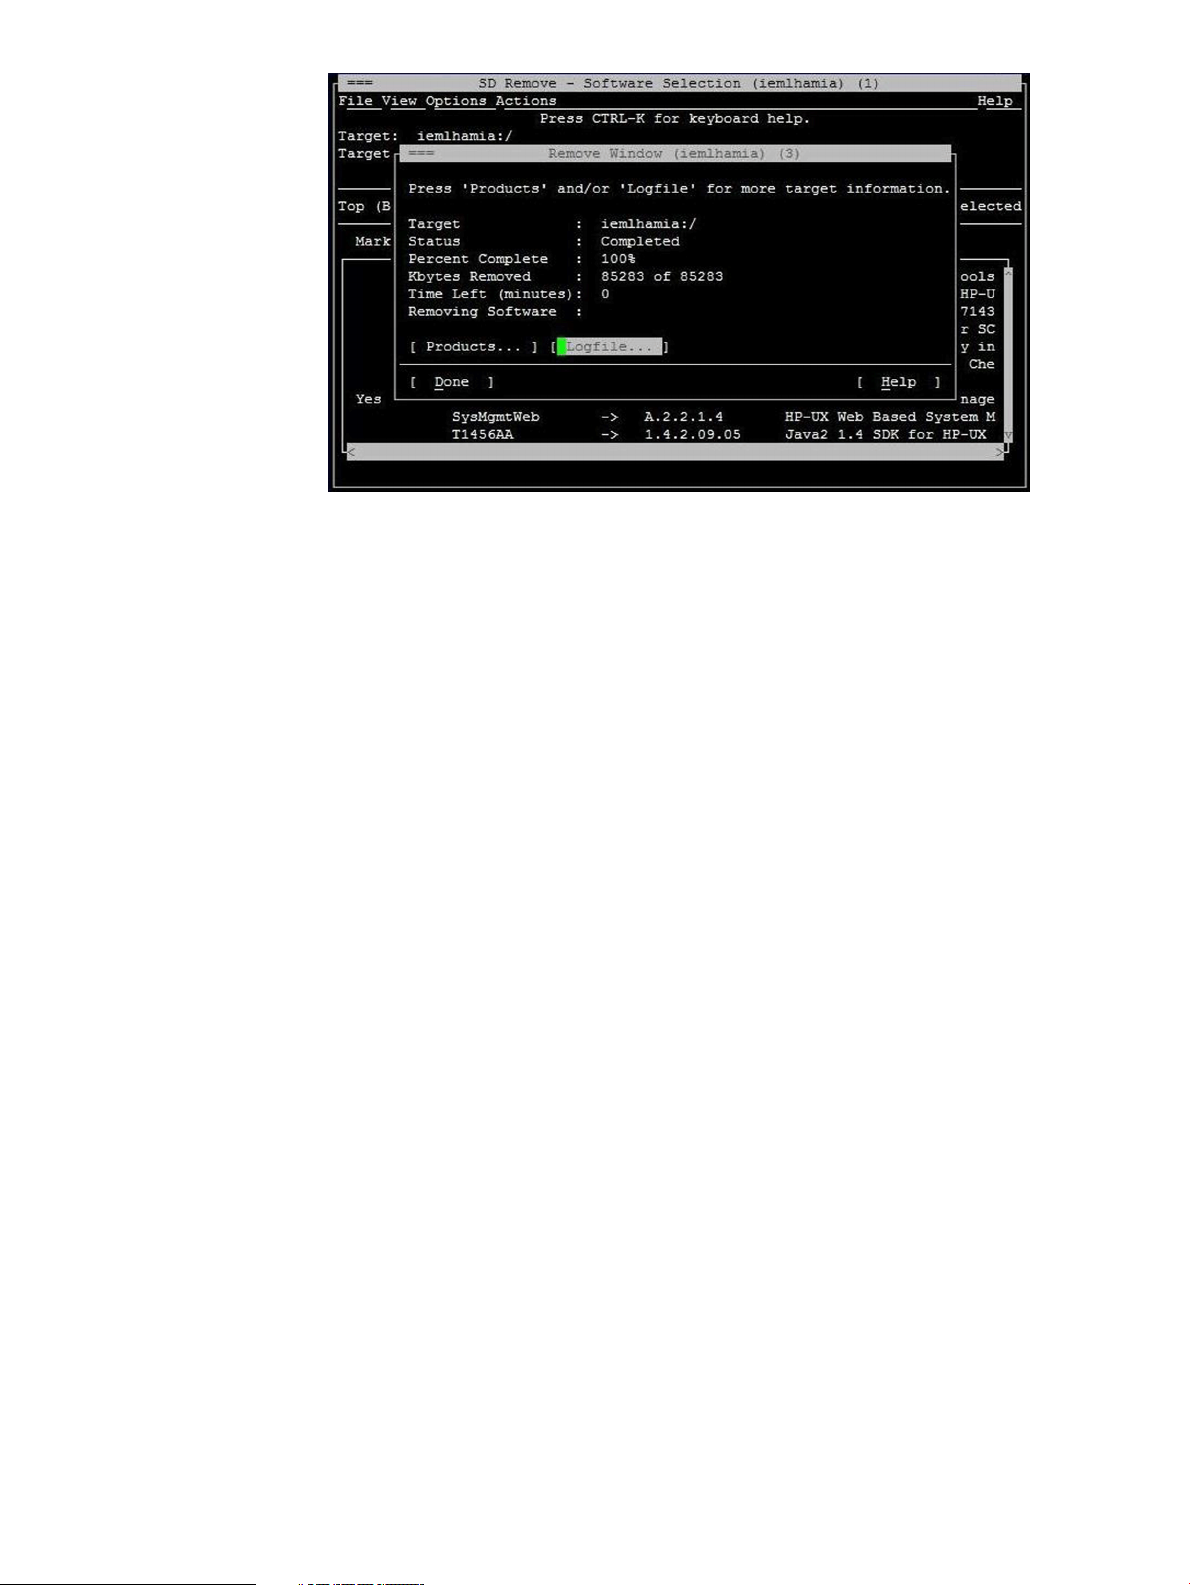
7. When the SFM software is removed, the Remove Window is displayed, as shown in the
following figure:
26 Installing the SFM software
Page 27
8. To verify whether the SFM software is removed properly, enter the following command at the
HP-UX prompt:
# swlist | grep SysFaultMgmt
If the SFM software is removed properly, SysFaultMgmt and the version number of the SFM
software does not appear in the output. If the SFM software is not removed properly, you must
repeat the removal procedure. For more information, see “Verifying removal of the SFM
software” (page 27).
Removing the software using the CLI
To remove the SFM software from your system, complete the following steps:
1. Log in to the system as a superuser.
2. Enter the following command at the HP-UX command prompt:
# swremove SysFaultMgmt
3. To verify whether the SFM software is removed properly, enter the following command at the
HP-UX prompt:
# swlist | grep SysFaultMgmt
If the SFM software is removed properly, SysFaultMgmt and the version number of the SFM
software do not appear in the output. If the SFM software is not removed properly, you must
repeat the removal procedure. For more information, see “Verifying removal of the SFM
software” (page 27).
Verifying removal of the SFM software
This section describes how to use the TUI and the CLI to verify whether the SFM software is removed
successfully.
Verifying removal using the TUI
To verify whether the SFM software is removed successfully, complete the following steps:
1. Log in to the system as a superuser.
2. Click Logfile in the Remove Window.
If there are no errors in the Logfile, the SFM software is removed successfully. If the SFM
software is not removed properly, you must repeat the removal procedure. See “Removing
the SFM software” (page 24) for instructions on how to remove the SFM software.
Verifying removal of the SFM software 27
Page 28

3. For information about errors related to the removal of SFM, enter the following command at
the HP-UX prompt:
# swjob -a log <jobid> @ <system name>:/
The jobid is available in the Logfile.
Verifying removal using the CLI
To verify if the SFM software is removed successfully, complete the following steps:
1. Log in to the system as a superuser.
2. Enter the following command at the HP-UX prompt:
# swjob
If the output contains no errors, the SFM software is removed successfully. If the SFM software
is not removed properly, you must repeat the removal procedure. See “Removing the SFM
software” (page 24) for instructions on how to remove the SFM software.
3. For information about errors related to the removal of the SFM software, enter the following
command at the HP-UX prompt:
# swjob -a log <jobid> @ <system name>:/
The jobid is available in the output of the swjob command.
28 Installing the SFM software
Page 29

3 Configuring indication providers
This chapter describes how to configure indication filters, error logging, and the
SFMIndicationProvider.
Configuring indication filters
You must configure the indication filters to view desired indications. You use the Filter Metadata
provider (FMD) to configure indication filters that deliver important or desired indications, for
example, indications with a certain severity. The provider also ensures that all the indications that
HP recommends for system management are logged in the Event Archive, available at
/var/opt/psb/db/pgsql. Logging indications in the archive helps track all the events that are
generated.
Filters are classified as follows:
• HP-Defined Filters
HP-Defined filters are defined by HP, and are present in the FMD repository at the time of
installation. You can list, enable or disable the HP-Defined filters. Indications fulfilling the
conditions in the HP-Defined filters are logged in the Event Archive. To confirm the HP-Defined
Filters, enter the following command at the HP-UX prompt:
# sfmconfig -m list -t HP
The following output is displayed:
Filter Name : General Filter
Filter Type : HP Defined Filter
Filter Unique Identifier : 1
Filter Query : Select * from HP_DeviceIndication
Filter Query Language : WQL
Filter Source Namespace : root/cimv2
Filter Description : General Device Indications.
Filter State : Enabled Filter State
Filter Last Operation : No Operation
To disable the HP-Defined filters, enter the following command at the HP-UX prompt:
# sfmconfig -m disable -t HP -n 'General Filter' -u 1
To revert the settings, enter the following command at the HP-UX prompt:
# sfmconfig -m enable -t HP -n 'General Filter' -u 1
• Admin-Defined Filters
Admin-Defined filters are defined by the administrator. HP does not provide any Admin-Defined
filter. To list, create, delete, modify, enable, and disable Admin-Defined filters, use the
sfmconfig command. By default, the FMD provider does not log indications fulfilling the
conditions in the Admin-Defined filters, in the Event Archive. You must modify the Admin-Defined
filters to log indications in the Event Archive.
To add an Admin-Defined Filter, enter the following command at the HP-UX prompt:
# sfmconfig -m add -n <filter name> -s {ENABLE|DISABLE} -l {WQL|CQL}
-q <query> -ns <name space> -d <description>
For example,
# sfmconfig -m add -n AdminFilter_2 -s ENABLE -l WQL -q "Select *
from HP_AlertIndication where (PerceivedSeverity >= 4)" -ns
root/cimv2 -d "Admin Filter"
The following output is displayed:
Filter Name : AdminFilter_2
Filter Type : Admin Defined Filter
Configuring indication filters 29
Page 30

Filter Unique Identifier : 10002
Filter Query : Select * from HP_AlertIndication where (PerceivedSeverity >= 4)
Filter Query Language : WQL
Filter Source Namespace : root/cimv2
Filter Description : Admin Filter
Filter State : Enabled Filter State
Filter Last Operation : Add Filter
HP_AlertIndication is derived from CIM_AlertIndication and HP_DeviceIndication is derived
from HP_HardwareIndication. HP_HardwareIndication is derived from HP_AlertIndication.
WBEM severities must be used while specifying the filter query. For more information on the
WBEM severity, see Table 5 (page 39).
For more information on the sfmconfig command, and its options, see the sfmconfig
(1M) manpage.
Configuring error logging in SFM
Logging information about the internal operational errors of SFM such as system call errors is
called, error logging. You can configure error logging parameters, such as severity, logging target,
and the number of backup files by using the sfmconfig command. To configure these parameters,
complete the following steps:
1. Modify the /var/opt/sfm/conf/FMLoggerConfig.xml configuration file using a text
editor.
2. For the changes made in the /var/opt/sfm/conf/FMLoggerConfig.xml configuration
file to take effect, enter the following command at the HP-UX prompt:
# /opt/sfm/bin/sfmconfig -c /var/opt/sfm/conf/FMLoggerConfig.xml
For more information about the sfmconfig command, enter the following command at the HP-UX
prompt:
# man sfmconfig
NOTE: You can configure the parameters by using the command-line interface (CLI) only.
Configuring the monitoring mode
This section describes how to configure the monitor mode. It also describes how to switch the
monitor mode between SFM and EMS.
To confirm the current monitoring mode, enter the following command at the HP-UX prompt:
# /opt/sfm/bin/sfmconfig -w -q
To switch the monitoring mode from EMS to SFM, enter the following command at the HP-UX
prompt:
# /opt/sfm/bin/sfmconfig -w -s
The /var/opt/sfm/log/.sfmconfig.log log file gets created in the switch script while
switching modes.
./ext/stm/switch.sh: /opt/sfm/bin/CIMUtil -w
/var/opt/sfm/log/.sfmconfig.log
NOTE: Starting with the HP-UX 11i v3 March 2008 release, SFM is the default monitoring mode.
However, you can switch to the OnlineDiag monitoring mode. Switching the monitoring mode
from SFM to EMS on HP Integrity BL860c i2, BL870c i2 & BL890c i2 Server Blades, rx2800 i2
and HP Superdome 2 servers is not available.
To check whether the SFMIndicationProvider is working properly, send a memory test event by
entering the following command at the HP-UX prompt:
# /opt/sfm/bin/sfmconfig -t -m
The following output indicates that the SFMIndicationProvider is working properly:
30 Configuring indication providers
Page 31

Sending test event for memory monitor.
NOTE: You can also send test events for other devices that the SFMIndicationProvider monitors.
For information on the devices monitored by the SFMIndicationProvider, see Table 2 (page 12).
To view the list of events, enter the following command at the HP-UX prompt:
# evweb eventviewer -L
A list of events along with the details such as event number, severity, and event category are
displayed by querying the Event Archive.
To view the details of an event, enter the following command at the HP-UX prompt:
# evweb eventviewer -E -n <event number>
The details of the specified event such as the summary, description, probable cause, and
recommended actions for the error are displayed.
For details on SFM event information, see the event.log file at:
/var/opt/sfm/log/event.log
For all events, and for severities logged to syslog, see Table 5 (page 39).
To switch back from the SFM monitoring mode to the EMS monitoring mode, enter the following
command at the HP-UX prompt:
# /opt/sfm/bin/sfmconfig -w -e
Configuring the monitoring mode 31
Page 32

4 Administering indications and instances using HP SIM
This chapter describes System Fault Management (SFM) administration on a remote system using
HP Systems Insight Manager (HP SIM).
NOTE: You can perform similar tasks using other management applications that are compliant
with the Common Information Model (CIM) (2.7.2) schema (or later) of the Distributed Management
Task Force (DMTF).
The terms events and indications are used interchangeably in this document.
This chapter addresses the following topics:
• “Creating subscriptions and viewing indications using HP SIM ” (page 32)
• “Viewing instances” (page 44)
Creating subscriptions and viewing indications using HP SIM
To view instances and events generated on a managed system, you must create subscriptions.
When you create subscriptions on the Central Management Server (CMS) using HP SIM, indications
are delivered to the CMS whenever an event occurs on the managed system.
NOTE: By default, cimserver does not allow non-privileged user to create subscriptions. This
operation can be performed only by a superuser.
However, you can override this default behavior by setting the configuration parameter
enableSubscriptionsForNonprivilegedUsers to true in the cimserver using the
cimconfig command. Since enableSubscriptionsForNonprivilegedUsers is not a
dynamic configuration property, you cannot change it when cimserver is running. For more
information, view cimcofig manpage.
This section discusses the following topics:
• “Creating subscriptions” (page 32)
• “ Viewing Indications” (page 37)
Creating subscriptions
To create subscriptions using HP SIM, complete the following steps:
1. Enter the following URL to launch HP SIM on your browser: http://<system name>:<port
number>/
The system name is the name of the CMS.
For example: http://abc.com:280/
The HP SIM home page is launched.
32 Administering indications and instances using HP SIM
Page 33

2. To create subscriptions, select Options-->Protocol Settings-->Global Protocol Settings in the HP
SIM Home page, as shown in Figure 4-1.
Figure 2 HP SIM Home Page
The Global Protocol Settings window is displayed, as shown in Figure 4-2.
Figure 3 Global protocol settings
3. In Figure 4-2, under default WBEM settings, select Enable WBEM. Click OK to save your
settings.
Creating subscriptions and viewing indications using HP SIM 33
Page 34

4. Select Configure->Configure or Repair Agents, as shown in Figure 4-3.
Figure 4 Configuration
The Configure or Repair agents window is displayed, as shown in Figure 4-4.
Figure 5 Configure or Repair Agents
5. From the Add targets by selecting from: list in Figure 3-4, select All systems to view and select
the systems. Selecting the name of the system enables you to view indications occurring on
34 Administering indications and instances using HP SIM
Page 35

the selected system. The list of systems is displayed in the Select Target Systems window, as
shown in Figure 6.
Figure 6 Select Target Systems
6. To select all the systems in the network, select the Select “All Systems” itself check box, as
shown in Figure 4-5. Click Apply. The Verify Target Systems window is displayed, as shown
in Figure 4-6.
Figure 7 Verify Target Systems
Creating subscriptions and viewing indications using HP SIM 35
Page 36
7. Select the appropriate check box to verify the target systems and click Next, as shown in
Figure 4-6. The Enter credentials window is displayed, as shown in Figure 4-7.
Figure 8 Enter credentials
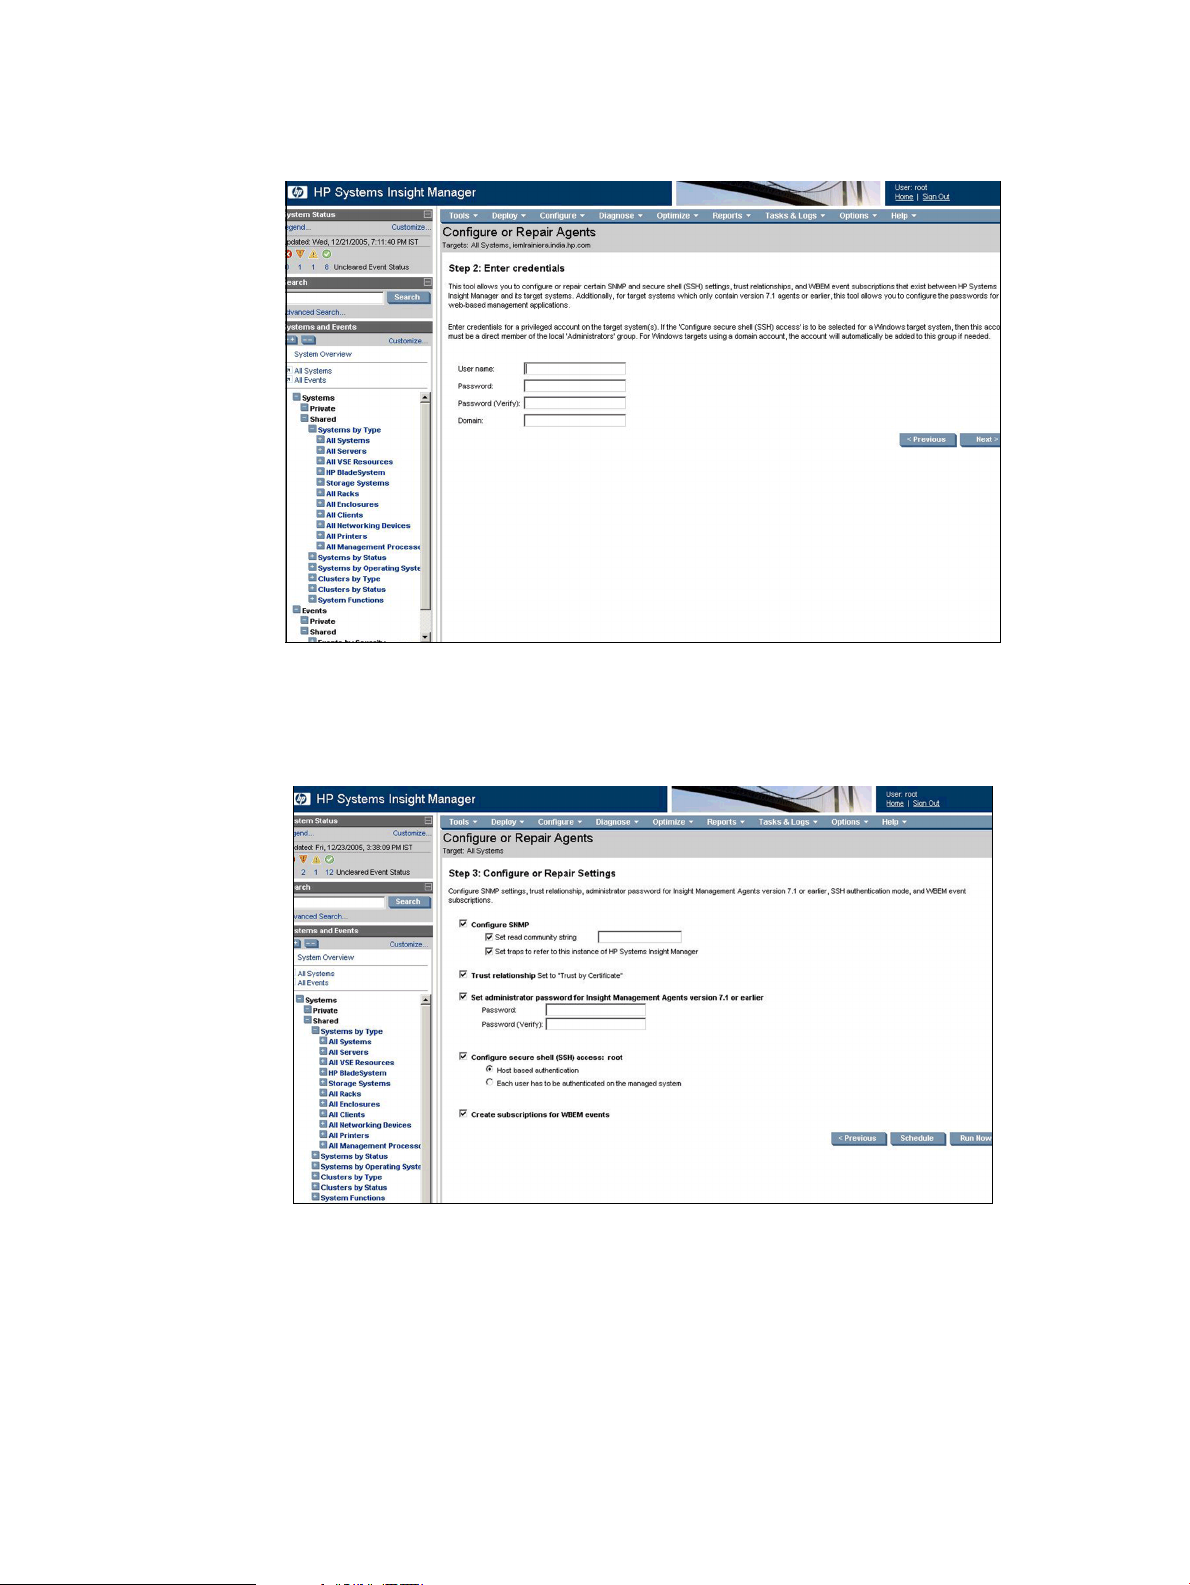
8. Enter your credentials in the given fields, as shown in Figure 4-7. Click Next. The Configure
or Repair settings window is displayed, as shown in Figure 4-8.
Figure 9 Configure or Repair settings
9. On the Configure or Repair settings window, click Run Now. The Task Results window is
displayed, as shown in Figure 4-9. The Task Results window states that the indication
Subscription is successfully created.
The next time an event is generated on the selected system, you can view the event in the
events list.
36 Administering indications and instances using HP SIM
Page 37

Figure 10 Task Results
10. To obtain a printable report of the indication subscription details, click View Printable Report
at the bottom of the window. The report is displayed, as shown in Figure 4-10.
Figure 11 Printable Report of the indication Subscription
NOTE: For more information, see the HP Systems Insight Manager 6.3 Installation and
Configuration Guide for HP-UX at: http://www.hp.com/go/hpsim
Viewing Indications
To view the list of events generated on the selected systems, complete the following steps:
Creating subscriptions and viewing indications using HP SIM 37
Page 38

1. Select All Events in the left pane of the HP SIM window. The list of events is displayed, as
shown in Figure 4-11.
Figure 12 Events list
2. To view the details of an event, select the event. The details are displayed at the bottom of
the same window, as shown in Figure 4-12.
Figure 13 Event Details
38 Administering indications and instances using HP SIM
Page 39

3. To obtain the printable version of the event details, click View Printable Details at the bottom
of the window. The printable report is displayed in a new window, as shown in Figure 4-13.
Figure 14 Printable event Details
To create subscriptions and view indications using the CLI, see “Creating an event subscription
using the CLI” (page 51) “Searching for the subscribed WBEM events using the CLI” (page 61)
and “Viewing Detailed Information using CLI” (page 62)
The ProviderName in the event Details window indicates the provider that generated the event.
NOTE: For more information, see the HP Systems Insight Manager Installation and User’s Guide
at: http://www.hp.com/go/hpsim
Table 5 maps the EMS, WBEM and Evweb event Severities.
Table 5 EMS, WBEM and Evweb events severity values
Evweb severityWBEM severityEMS severity
0 Unknown
3 Major warning
there are no severities.
4 Minor
5 Major
0 UnknownMapped to Unknown in evweb, when
1 Normal0 Unknown0 Unknown
2 Other1 OtherNA
3 Information2 Information1 Information
4 Warning3 Degraded/Warning2 Minor Warning
5 Minor
6 Major
Creating subscriptions and viewing indications using HP SIM 39
Page 40

Table 5 EMS, WBEM and Evweb events severity values (continued)
Evweb severityWBEM severityEMS severity
7 Critical6 Critical4 Serious
7 Critical7 Fatal/Non-recoverable5 Critical
NOTE:
• Perceived severities in Syslog is same as WBEM severities.
• The WBEM severities are standard. Their number can be seen as the severity value for the
actual events recorded in /var/opt/sfm/log/event.log. The Evweb severity numbering
matches the HP SMH system status. It is one number more than the WBEM severity. However,
HP SMH uses the corresponding severity strings to display the system status, Therefore the
severity string is more important than the severity number.
• Evweb is a plug -in in HP SMH, it adapts Evweb severity to HP SMH. The WBEM severities
description is different from Evweb severities description. The following are the differences in
mapping reasons:
◦ "Fatal/Non-recoverable” in WBEM is regarded as “Critical” in Evweb
◦ "Unknown" in WBEM means that WBEM can get the status of event/entity, and it is NOT
other errors (like, Fatal), so Evweb regards it as “Normal”
◦ "NA" in WBEM means that WBEM cannot get the status of event/entity, so Evweb regards
it as "Unknown".
In the SFM mode although the SFMIndicationProvider is generating the events, the name of the
provider displayed in the event details is one of the following providers mentioned under provider
in Table 4–2, depending on the device to which the event is related. Table 6 (page 40) maps the
EMS Hardware Monitors and the corresponding WBEM providers.
Table 6 Representation of Monitors
PA-RISC providerMonitor
CPE_IndicationProviderIAcpe_em
DiskIndicationProviderdisk_em
1
Legacy : HP Integrity platforms supporting processors prior Intel 9300.
2
NGIS : HP Integrity platfroms supporting Intel 9300 processors
3
Supported additionally on HP Integrity BL860c i2, BL870c i2 & BL890c i2 Server Blades and rx2800 i2
4
This provider is supported only on HP Superdome 2 servers.
5
This provider is not shipped as part of SFM from March 2009 release.
IA legacy provider
CPE_IndicationProviderIA
DiskIndicationProvider
1
IA NGIS providers
CPU_IndicationProviderIACMC_IndicationProviderIACMC_IndicationProviderIAcmc_em
3
5
PCIeIndicationProvider
ChassisIndicationProviderChassisIndicationProviderChassisIndicationProviderdm_chassis
DiskIndicationProvider
FPL_IndicationProviderFPL_IndicationProviderFPL_IndicationProviderfpl_em
SEL02_IndicationProviderSEL02_IndicationProviderSEL02_IndicationProvideria64_corehw
MemoryIndicationProviderMemoryIndicationProviderIAMemoryIndicationProvidermemory_ia64
2
4
——CoreHardwareIndicationProviderdm_core_hw
5
——LPMC_IndicationProviderlpmc_em
Table 7 compares the EMS Hardware Monitors properties with the equivalent EMS Wrapper
provider / Native indication provider properties.
40 Administering indications and instances using HP SIM
Page 41

Table 7 Property Representation
EMS wrapper provider / Native indication providerEMS Hardware Monitors
EventTimeEvent Time
PerceivedSeveritySeverity
EventIDEvent
SystemNameSystem
SummarySummary
DescriptionDescription of Error
Probable Cause/ Recommended Action
Table 8 Command Representation
Deleting a
monitoring request
Sending a test event
of a device to UP.
Viewing details of an
event
# /etc/opt/resmon/lbin/monconfig
Enter D at the main menu selection prompt.
#
/etc/opt/resmon/lbin/send_test_event
<monitor name>
# set_fixed -n <resource name>Changing the status
# resdata -r <resource name> -R
<request id> -a|-m|-u [-n <notify
id>] [-h <host name>] -M <monitor
key>]
ProbableCauseDescription and
RecommendedAction (these two are separate fields)
SystemSerialNumberSystem Serial Number
HWManufacturerInquiryVendorID
HWLogicalLocationPhysical Device Path
DeviceModelInquiryProductID
DeviceControllerLogicalLocationPhysicalDevicePath
In SFMIn EMSTask
# evweb subscribe -D -f -n
<subscription name>
# sfmconfig -t -<valid monitor
name>
# sfmconfig -a -r -t <device name>
-d <device id>
# evweb eventviewer -E -n
<EvArchNo>
Table 9 (page 41) displays the default event destinations for Online Diagnostics.
Table 9 Default Monitoring Requests for Each Monitor
Online DiagnosticsSeverity levelsDefault notification method
textlog: /var/opt/resmon/log/event.logAllTextlog
AvailableMAJOR WARNINGSyslog
SERIOUS
CRITICAL
E-MAIL address: rootMAJOR WARNINGE-MAIL
SERIOUS
CRITICAL
AvailableAllEvweb DB
(evweb eventviewer -L)
Creating subscriptions and viewing indications using HP SIM 41
Page 42

NOTE: The Severity levels in Table 4-5 indicate EMS severity.
Table 10 (page 42) displays the default event destinations for SysFaultMgmt.
Table 10 Default monitoring requests for each monitor
Default notification
method
CRITICAL
FATAL/NON-RECOVERABLE
SysFaultMgmtSeverity levels
textlog: /var/opt/sfm/log/event.logAllTextlog
AvailableMAJORSyslog
Not AvailableNoneE-MAIL
AvailableAllEvweb DB
(evweb eventviewer -L)
NOTE: The Severity levels in Table 4-6 indicate WBEM severity.
For a list of WBEM indications generated by all the monitors, see the EMS event descriptions at:
http://www.hp.com/go/hpux-diagnostics-online-events
Table 11 (page 42) lists all the values as Status in sfmconfig -a -L.
Table 11
Status values
UNKNOWN
OTHER
OK
DEGRADED
STRESSED
PREDICTIVE FAILURE
ERROR
NONRECOVERABLE ERROR
STARTING
STOPPING
STOPPED
IN SERVICE
NO CONTACT
LOST COMMUNICATION
ABORTED
DORMANT
SUPPORTING ENTITY IN ERROR
COMPLETED
42 Administering indications and instances using HP SIM
Page 43

The sfmconfig -a -r command is used to change the state of a subsystem. When this command
is not working with processor, the user should check for errors. When a CPU is deactivated on a
system due to an action taken against an error symptom, the user tries to use sfmconfig command
to make the CPU state back to OK The change does not happen unless the processor which is
faulty is replaced or it is acquitted from the Onboard Administrator on HP Superdome 2.
Viewing instances
To view information about processors, memory, cooling devices, power supplies, and disks,
complete the following steps:
1. On the System Page of HP SIM, click System Management Homepage, as shown in Figure
4–14.
Figure 15 System Page
The HP SMH home page is displayed.
2. Perform the relevant steps described in “Viewing instances” (page 44).
Viewing instances 43
Page 44

5 Administering indications and instances using HP SMH
This chapter describes the SFM administration tasks that you can perform using HP SMH on a local
system.
This chapter addresses the following topics:
• “Viewing instances” (page 44)
• “Administering indications using Evweb” (page 49)
• “Viewing event subscriptions using Evweb” (page 56)
• “Viewing indications using Evweb” (page 59)
• “Tracing Evweb” (page 67)
• “EMT Overview” (page 71)
• “Querying the Common Error Repository” (page 71)
• “Administering Events in CER” (page 74)
• “Tracing EMT” (page 77)
Viewing instances
This section describes the tasks you must perform to view instances. This section discusses the
following topics:
• “Viewing information about processors” (page 44)
• “Viewing information about memory” (page 45)
• “Viewing information about System Summary” (page 46)
• “Viewing information about Cooling Devices” (page 46)
• “Viewing Power Supply instances” (page 46)
• “Viewing Temperature status and events” (page 46)
• “Viewing Voltage status and events” (page 46)
• “Viewing FRU information” (page 46)
• “Viewing information about Management Processor” (page 47)
• “Viewing information about Firmware information” (page 47)
• “Viewing information about Onboard Administrator” (page 47)
• “Viewing information about Complex-wide info” (page 47)
• “Viewing information about Cell Board” (page 47)
• “Viewing Partition information” (page 47)
• “Viewing information about Blade” (page 47)
• “Viewing information about Cell Blade” (page 48)
• “Viewing Health Test report of Memory” (page 48)
• “Viewing Health Test report of Processors” (page 48)
Viewing information about processors
To obtain information about processors, such as the processor type, architecture revision, and
processor speed, complete the following steps:
44 Administering indications and instances using HP SMH
Page 45

NOTE: Starting September 2009 release, in HP SMH GUI, you can refer to “The equivalent
command line” option, to view command line information about processors. For more information,
view cprop manpage. See "man cprop"
1. Select Show All under System on the HP SMH home page.
The system page is displayed.
Figure 16 System Management Homepage
2. Select Processors under System on the HP SMH home page.
Information about the processors is displayed.
3. To return to the HP SMH home page, click on Home.
Viewing information about memory
To obtain information about memory, such as the memory location, serial number, part number,
and the events related to memory, complete the following steps:
1. Select Memory under System on the HP SMH home page.
Information about the memory is displayed.
2. To return to the HP SMH home page, click on Home.
Viewing instances 45
Page 46

Viewing information about System Summary
To obtain information about system summary, such as the model, role, UUID, UUID (Logical), Serial
number, Serial number (Logical) and many more, complete the following steps:
1. Select System Summary under System on the HP SMH home page.
System summary information is displayed.
2. To return to the HP SMH home page, click on Home.
Viewing information about Cooling Devices
To view information about the cooling devices on the system, such as the status, location, the type
of fans, and HashID, complete the following steps:
1. Select Cooling under System on the HP SMH home page.
Information about cooling devices is displayed in the Cooling Status window.
2. To return to the HP SMH home page, click on Home.
Viewing Power Supply instances
To view information about the power supplies, such as the status, power supply type, part number
and serial number, complete the following steps:
1. Select Show All under System on the HP SMH home page.
The system page is displayed.
2. Select Power under System on the HP SMH home page.
Information about the power status is displayed in the Power Status window.
3. To return to the System Management Homepage home, click on Home.
Viewing Temperature status and events
To view the temperature status and events related to temperature, complete the following steps:
1. Select Show All under System on the HP SMH home page.
The system page is displayed.
2. Select Temperature on the system page.
The temperature status of the system is displayed in the Temperature Status window.
3. To return to the System Management Homepage home, click on Home.
Viewing Voltage status and events
To view the voltage status and events related to voltage, complete the following steps:
1. Select Show All under System on the HP SMH home page.
2. Select Voltage on the system page.
The voltage status of the system and the events related to voltage are displayed in the Voltage
Status window.
3. To return to the HP SMH home page, click on Home.
Viewing FRU information
To obtain the FRU (Field Replaceable Unit) Information, such as name, serial number, and HashID,
complete the following steps:
1. Select FRU information under System on the HP SMH home page.
Information about the FRU is displayed.
2. To return to the HP SMH home page, click on Home.
46 Administering indications and instances using HP SMH
Page 47

Viewing information about Management Processor
To obtain information about the Management Processor (MP), such as its IP address, status, and
URL, complete the following steps:
1. Select Management Processor under System on the HP SMH home page.
Information about the management processor is displayed.
2. To return to the HP SMH home page, click on Home.
Viewing information about Firmware information
To obtain information about the firmware information, such as the system firmware information
and the MP firmware version, complete the following steps:
1. Select Firmware information under Software on the HP SMH home page.
The Firmware information is displayed.
2. To return to the HP SMH home page, click on Home.
Viewing information about Onboard Administrator
To obtain information about the Onboard Administrator (OA), such as the OA description, OA IP
address, and OA MAC address, complete the following steps:
1. Select Enclosure Information under Enclosure on the HP SMH home page.
Information about the OA is displayed.
2. To return to the HP SMH home page, click on Home.
Viewing information about Complex-wide info
To obtain information about the Complex-wide Info, such as the Complex name, Model in
Complex-wide Info page; Cabinet ID, Type in Cabinet Info page; and Cell Slot, Architecture in
Complex Cell page, complete the following steps:
1. Select Complex-wide Info under Enclosure on the HP SMH home page.
Information about the Complex—wide Info is displayed.
2. To return to the HP SMH home page, click on Home.
Viewing information about Cell Board
To obtain information about the Cell Board, such as the Firmware Version, Status, and Core IO,
complete the following steps:
1. Select Cell Board under System on the HP SMH home page.
Information about the Cell Board is displayed.
2. To return to the HP SMH home page, click on Home.
Viewing Partition information
To obtain the Partition Information, such as the Partition Name, Type, and ID, complete the following
steps:
1. Select Partition Information under System on the HP SMH home page.
Information about the Partition Information is displayed.
2. To return to the HP SMH home page, click on Home.
Viewing information about Blade
To obtain information about the Blade, such as the Onboard Administrator and HashID, complete
the following steps:
Viewing instances 47
Page 48

1. Select Blade under System on the HP SMH home page.
Information about the Blade is displayed.
2. To return to the HP SMH home page, click on Home.
Viewing information about Cell Blade
To obtain information about the Cell Blade, such as the Status, Hardware Path and OA partition
Information of the enclosures, complete the following steps:
1. Select Cell Blade under System on the HP SMH home page.
Information about the Cell Blade is displayed.
2. To return to the HP SMH home page, click on Home.
Viewing Health Test report of Memory
NOTE: Health Test support is available when the feature is installed by ProviderSvcsBase. For
information on installing Health Test feature, see ProviderSvcsBase Release Notes
To obtain information about the Health Test for Memory, such as Component, Device, Test Name,
Test Description, Impact on System, Logging Level, and many more, complete the following steps:
1. Select Memory under System on the HP SMH home page.
Information about the Memory is displayed.
2. Select Health Test tab on the Memory page to run a configured Health Test.
3. Select the option Basic Health Test to run basic test configured in the system.
4. Click Run to execute the Memory Health Test.
The Memory Health Test results are displayed in the View Health Test Results pane.
NOTE: Memory Health Test Results can also be viewed from the command line interface
(CLI).
5. To return to the HP SMH home page, click on Home.
For more information, see HP System Management Homepage Online Help. In HP SMH, go to the
Help menu.
Viewing Health Test report of Processors
NOTE: Health Test support is available when the feature is installed by ProviderSvcsBase. For
information on installing Health Test feature, see ProviderSvcsBase Release Notes
To obtain information about the Health Test for Processor/CPU, such as Component, Device, Test
Name, Test Description, Impact on System, Logging Level, and many more, complete the following
steps:
1. Select Processors under System on the HP SMH home page.
Information about the Processors is displayed.
2. Select Health Test tab on the Processors page to run a configured Health Test.
3. Select the option Basic Health Test to run basic test configured in the system.
4. Click Run to execute the CPU Health Test.
The CPU Health Test results are displayed in the View Health Test Results pane.
NOTE: CPU Health Test Results can also be viewed from the command line interface (CLI).
5. To return to the HP SMH home page, click on Home.
48 Administering indications and instances using HP SMH
Page 49

For more information, see HP System Management Homepage Online Help. In HP SMH, go to the
Help menu.
Administering indications using Evweb
This section provides an overview of Evweb and describes how to use Evweb for administrative
tasks, such as creating and managing subscriptions for indications.
This section addresses the following topics:
• “Evweb overview” (page 49)
• “Launching Evweb for administration” (page 50)
• “Creating Evweb event subscriptions” (page 50)
• “Modifying Evweb event subscriptions” (page 52)
• “Deleting Evweb event subscriptions” (page 55)
• “Configuring E-mail Consumer” (page 56)
NOTE: You must be an administrator to create, modify, and delete event subscriptions.
Evweb overview
The SFM includes a user component called Evweb, which enables you to administer and view
WBEM indications generated on the local system on which SFM is installed.
Evweb includes the following components:
• Event Subscription Administration – to subscribe to indications
• Event Archive database – to store indications you have subscribed to
• Event Viewer – to view indications present in the Event Archive
• Indication Consumer for Event Archive – to store indications in the Event Archive
• Indication Consumer for E-mail – to send indications to your e-mail address
Evweb provides the following user interfaces to create and manage event subscriptions and view
indications:
• Browser-based Graphical User Interface (GUI)
• Command-Line Interface (CLI)
Evweb supports the following user groups:
• Administrator
• Non-administrator
In the CLI, any user with root privileges is an administrator. However, in the HP SMH GUI, the
user groups in Evweb are mapped internally to the user groups defined in HP SMH.
The Administrator user group in HP SMH maps to administrators in Evweb. The Operator and the
User user group in HP SMH map to non-administrators in Evweb.
For information on how to configure user groups in HP SMH, see the HP System Management
Homepage User’s Guide at:
http://www.hp.com/go/hpux-diagnostics-docs
EVWEB supports new IO & Storage native indication providers to display additional info for the
following providers:
HPUXSASNativeIndicationProviderModule
HPUXRAIDSANativeIndicationProviderModule
HPUXFCNativeIndicationProviderModule
Administering indications using Evweb 49
Page 50

HPUXStorageNativeProviderModule
These native indication provider support is available on the HP Integrity Servers.
Launching Evweb for administration
You can launch Evweb either through the CLI or through the HP SMH GUI.
To launch Evweb for administering event subscriptions using the CLI, enter the following command
at the HP-UX prompt:
# evweb subscribe
To use HP SMH GUI to launch Evweb for administering event subscription, complete the following
steps:
1. Log in to HP SMH.
To log in to HP SMH, enter http://<hostname>:2301 in the address bar of the Web
browser. The HP SMH login screen is displayed.
2. Enter your user name and password in the appropriate text boxes.
3. Click Sign In on the login screen.
The HP SMH home page is displayed.
4. Select Tools in the main menu.
The Tools page is displayed. This page displays the applications that are plugged into HP
SMH.
5. Select Subscription administration in Evweb.
The Event subscription administration page is displayed.
You can perform various administrative tasks such as creating, modifying, and deleting event
subscriptions on this page.
Creating Evweb event subscriptions
You can create event subscriptions for the WBEM indications that you want to monitor. You can
create the following event subscription types using Evweb:
• Admin Defined event subscriptions – Event Subscriptions created using the sfmconfig
command are called Admin Defined event subscriptions. You can modify and delete Admin
Defined event subscriptions using the sfmconfig command. For more information about
customizing event filters via sfmconfig command, see “Configuring indication filters” (page
29). You cannot use the evweb list, evweb subscribe, or the evweb eventviewer command to
create and delete Admin Defined event subscriptions.
• Event subscriptions created using the HP SMH GUI (Event subscription administration) – You
can create these event subscriptions using the GUI or the CLI. You can modify and delete the
event subscriptions that are created using Event subscription administration.
To create an event subscription using Event subscription administration, you must specify the
following:
◦ A unique name for the event subscription
◦ Criteria such as device, event ID, and the severity of the event
◦ The location where the event must be stored
You can create an event subscription using the following methods:
• Create a completely new event subscription.
• Copy an existing event subscription and modify it.
50 Administering indications and instances using HP SMH
Page 51

Creating an event subscription using the GUI
To create a new event subscription, complete the following steps:
1. Repeat steps 1-5 from “Launching Evweb for administration” (page 50).
2. Select Create subscription in the action pane on the top right corner of the Event subscription
administration page.
The Create subscription page is displayed.
3. Provide appropriate information in the fields present in the Create subscription page.
NOTE: It is mandatory to specify a unique name for creating an event subscription.
4. To view the command line equivalent of creating event subscriptions using GUI, click Preview
on the Create subscription page. This step is optional.
5. Select Create on the Create subscription page.
Evweb creates the event subscription and displays a confirmation message.
6. Click OK on the confirmation message window.
For more information on creating subscription using the HP SMH GUI, select Help on the action
pane of the Create subscription page.
Creating an event subscription using the CLI
To create an event subscription using the CLI, enter the following command at the HP-UX prompt:
# evweb subscribe -C -n <subscription name>
Where:
-C is an option used to create event subscriptions.
-n is a switch used to specify a name for an event subscriptions.
A message stating that the execution of the evweb subscribe command was successful is
displayed on the screen.
NOTE: The -n switch is mandatory.
You can also use the following switches with the -C option:
• (-e [eq|ne|le|ge|bw][:] <severity level1>[,<severity level2>])
• (-i <EventID>)
• (-v <event category name>)
• (-o <provider name>)
• (-s <syslog>)
• -r
For more information on creating event subscriptions using CLI, see evweb_subscribe(1).
Copying and creating a new event subscription using the GUI
You can reuse the existing subscriptions to create another subscription. To create an event
subscription by copying an existing event subscription, complete the following steps:
1. Repeat steps 1-5 from “Launching Evweb for administration” (page 50).
2. Select the event subscription you want to copy, from the event subscription table.
3. Select Copy and create subscription in the action pane on the top right corner of the Event
subscription administration page.
The Copy and create subscription page is displayed.
4. Modify the required fields.
Administering indications using Evweb 51
Page 52

IMPORTANT: The subscription criteria is not copied when you copy an HP Advised event
subscription. Therefore, ensure that you specify the subscription criteria in the Copy and create
subscription page.
NOTE: It is mandatory to specify a unique name in the Subscription name.
5. Select Create on the Copy and create subscription page.
Evweb creates the event subscription and displays a confirmation message.
6. Click OK on the confirmation message window.
NOTE: There is no CLI equivalent for this action. The Copy and create subscription feature
is available only on the HP SMH GUI.
For more information on creating an event subscription by copying an existing event subscription
using the HP SMH GUI, select Help on the action pane of the Copy and create subscription page.
Modifying Evweb event subscriptions
You can modify an event subscription by modifying the criteria and location. However, the fields
that you are allowed to modify depend on the type of event subscription you select. You can modify
more than one subscription at a time.
NOTE: The HP Known event subscriptions are classified as HP Advised and Admin Defined.
In HP Advised event subscriptions, the events are stored in the event archive by default. The default
location of the events cannot be modified. However, you can direct the events to your e-mail
address or to the syslog. You cannot change any other subscription criteria.
In Admin Defined event subscriptions, the events are stored in the event archive by default. The
default location of the events can be modified. You can store events in the Event Archive, in syslog,
or direct them to your e-mail address, or do all. You cannot change any other subscription criteria.
In event subscriptions created using Evweb, you can change all criteria except the name of the
subscription.
You can modify an event subscription in the following ways:
• Modify a single event subscription.
You can modify a single event subscription using the modify feature by selecting the event
subscription from the event subscription table.
• Modify similar criteria in multiple event subscriptions.
You can modify similar criteria in multiple event subscriptions by using the Copy and modify
subscription feature.
Modifying an event subscription using the GUI
To modify an event subscription, complete the following steps:
1. Repeat steps 1-5 from “Launching Evweb for administration” (page 50).
2. Select Modify subscription in the action pane on the top right corner of the page.
The Modify subscription page is displayed.
3. Select the event subscription, which you want to modify, from the Event subscription Table.
4. Modify the required fields.
5. To view the command line equivalent of modifying event subscriptions using the GUI, click
Preview on the Modify subscription page. This step is optional.
52 Administering indications and instances using HP SMH
Page 53

6. Select Modify in the Modify subscription page.
Evweb modifies the event subscription and displays a confirmation message.
7. Click OK on the confirmation message window.
For more information on modifying an event subscription using the HP SMH GUI, select Help on
the action pane of the Modify event subscription page.
Modifying an event subscription using the CLI
To modify an event subscription using the CLI, enter the following command at the HP-UX prompt:
# evweb subscribe -M -n<subscription name> -v<event category name> -s
<syslog>
Where:
-M is an option used to modify event subscriptions.
-n is a switch used to specify a name for an event subscriptions.
-v is a switch used to specify the category of an event.
-s is a switch used to specify the syslog location of an event.
A message stating that the execution of the evweb subscribe command was successful is
displayed on the screen.
NOTE: The -n switch is mandatory.
You can also use the following switches with the -M option:
• (-e [eq|ne|le|ge|bw][:] <severity level1>[,<severity level2>])
• (-i <EventID>)
• (-o <provider name>)
• (-s <syslog>)
• -r
To modify an event subscription, you must specify the criteria and the location. Following are the
ways in which you can modify an event subscription:
If you specify only the subscription criteria and not the destination, then:
• If you do not specify the -r option and the location, the current location is removed and the
subscription criteria are updated.
• If you specify the -r option but not the location, the current location is retained and only the
subscription criteria are updated.
Administering indications using Evweb 53
Page 54

Example 1
# evweb subscribe -L
Subscription Name HP Known Is Deprecated Event Archive Email Syslog
====================== ======== ============== ============== ======== ========
HP_defaultSyslog FALSE FALSE FALSE FALSE TRUE
test FALSE FALSE TRUE FALSE FALSE
HP_General Filter@1_V1 TRUE FALSE TRUE FALSE FALSE
# evweb subscribe -Mn test -r
The execution of 'evweb subscribe' command was successful.
# evweb subscribe -L
Subscription Name HP Known Is Deprecated Event Archive Email Syslog
====================== ======== ============== ============== ======== ========
HP_defaultSyslog FALSE FALSE FALSE FALSE TRUE
test FALSE FALSE TRUE FALSE FALSE
HP_General Filter@1_V1 TRUE FALSE TRUE FALSE FALSE
• If you specify both subscription criteria and location, then both of them are updated.
• If you specify the location but not the criteria, the location is updated but the original criteria
are retained.
For more information on modifying event subscriptions using the CLI, see evweb_subscribe(1).
Copying and modifying an event subscription using the GUI
To modify an event subscription by copying an existing event subscription, complete the following
steps:
1. Repeat steps 1-5 from “Launching Evweb for administration” (page 50).
2. Select the event subscriptions you want to copy, from the event subscription table.
3. Select Copy and modify subscription in the action pane on the top right corner of the page.
The criteria and the destination information is copied. The copy and modify subscription page
is displayed.
4. Select the event subscriptions you want to modify by selecting the respective check boxes.
5. Modify the required fields.
NOTE: You can modify multiple subscriptions at-a-time. You must specify a unique name in
the Subscription name.
6. Select Modify in the Copy and modify subscription page.
Evweb modifies the event subscriptions and displays a confirmation message.
7. Click OK on the confirmation message window.
NOTE: The Copy and modify subscription feature is available only on the GUI.
54 Administering indications and instances using HP SMH
Page 55

IMPORTANT: The subscription criteria are not copied when you copy an HP Advised event
subscription. Therefore, ensure that you specify the subscription criteria in the Copy and modify
subscription page.
For more information on copying and modifying an event subscription using the HP SMH GUI,
select Help on the action pane of the Copy and Modify event Subscription page.
Deleting Evweb event subscriptions
You must periodically delete event subscriptions that are not required. You can delete a single
event subscription or multiple event subscriptions at a time.
Deleting an event subscription using the GUI
To delete an event subscription, complete the following steps:
1. Repeat steps 1-5 from “Launching Evweb for administration” (page 50).
2. Select Delete subscription in the action pane on the top right corner of the Event Subscription
Administration page.
The Delete subscriptions page is displayed.
3. Select the event subscriptions you want to delete, by selecting the appropriate check boxes.
4. Select Delete on the Delete subscription page.
The event subscriptions are deleted and a confirmation message is displayed.
5. Click OK on the confirmation message window.
NOTE: You cannot delete HP Advised event subscriptions and Admin Defined event subscriptions.
For more information on deleting an event subscription using the HP SMH GUI, select Help on the
action pane of the Delete event subscription page.
NOTE: HP recommends deleting all unwanted event subscriptions. Retaining a large number of
event subscriptions may increase the size of the Event Archive, and may affect the tasks you perform
using Event subscriptions administration.
Deleting an event subscription using the CLI
To delete an event subscription using the CLI, enter the following command at the HP-UX prompt:
# evweb subscribe -D -f -n <subscription name>
NOTE: The -n switch is mandatory.
Where:
-D is an option used to delete event subscriptions.
-n is a switch used to specify a name for an event subscriptions.
-f is a switch used to force the command. This switch can be used only with the -D option. If
the -f switch is not used, Evweb prompts for a confirmation before deleting an event
subscription.
A message stating that the execution of the evweb subscribe command was successful is
displayed on the screen.
NOTE: Using the CLI, you can delete only one event subscription at a time.
For more information on deleting event subscriptions using the CLI, see evweb_subscribe(1).
Administering indications using Evweb 55
Page 56

Configuring E-mail Consumer
The E-mail Consumer is a component of Evweb that receives indications from the WBEM Services
and redirects them to an SMTP server. Normally, the local system itself is the e-mail server. In such
cases, you need not configure the E-mail Consumer.
If the e-mail server is not on the local system, you must configure the E-mail Consumer.
To configure the E-mail Consumer, complete the following steps:
1. Open the /var/opt/sfm/conf/evweb.conf file on the system.
2. Change the IP address, FULLNAME, and the FROMADDR (From Address) of the host and save
the file.
The IP address is the address of the e-mail server. The FULLNAME refers to the complete name
of the e-mail server. The FROMADDR refers to e-mail address that sends the event notifications.
Following is a sample evweb.conf file with IP address, FULLNAME, and the FROMADDR
configured:
<EVWEB>
<CONSUMER>
<EMAILCONSUMER>
<EMAILSERVER>
<IP>127.0.0.1</IP>
<FULLNAME>localhost</FULLNAME>
</EMAILSERVER>
<FROMADDR>evweb@hp.com</FROMADDR>
</EMAILCONSUMER>
</CONSUMER>
</EVWEB>
3. Enter the following command at the HP-UX prompt:
# /opt/sfm/bin/sfmconfig -c /var/opt/sfm/conf/evweb.conf
Viewing event subscriptions using Evweb
This section describes how to perform non-administration tasks, such as viewing event subscriptions.
This section addresses the following topics:
• “Viewing Evweb event subscriptions” (page 56)
• “Viewing external event subscriptions” (page 58)
You can view HP Known subscriptions and user defined subscriptions using Evweb. You can also
view event subscriptions that are created using tools other than Evweb (referred to as external
subscriptions).
HP Known event subscriptions are created by default during the installation of the SysFaultMgmt
bundle. However, administrators can also create HP Known event subscriptions, using the
/opt/sfm/bin/sfmconfig command.
HP provides some event subscriptions with Evweb. These event subscriptions are known as HP
Advised event subscriptions. By default, the HP Advised event subscriptions store the events in the
Event Archive.
Viewing Evweb event subscriptions
You can view summary and detailed information about event subscriptions using Evweb.
Viewing a summary of an Evweb event subscription using the GUI
To view a summary of the event subscriptions, repeat steps 1-5 from “Launching Evweb for
administration” (page 50).
The Event subscription administration page is displayed.
56 Administering indications and instances using HP SMH
Page 57

The Event subscription administration page displays a summary of the the event subscriptions, in
a tabular format. In this document, this table is referred to as the event subscription summary table.
For more information on viewing a summary of an evweb event subscription using the HP SMH
GUI, select Help on the action pane of the event subscription page.
Viewing a Summary of an Evweb event Subscription using the CLI
To view the summary of an Evweb event subscription using the CLI, enter the following command
at the HP-UX prompt:
# evweb subscribe -L -b internal
Where:
-L is an option used to list all the event subscriptions.
-b is a switch used to display information about event subscriptions in brief.
internal is an argument used to display information about HP kown event subscriptions and
event subscriptions created using Evweb.
A summary of event subscriptions is displayed in a tabular format, as shown in Figure 17.
Figure 17 Summary of Evweb event Subscriptions
Table 12 describes the fields in the event Subscription Summary table.
Table 12 Evweb event subscriptions
DescriptionField
Displays the name of an event subscription.Subscription Name
HP Known
Is Deprecated
Event Archive
Email
Syslog
Displays TRUE if the subscription is HP Known. Displays FALSE if the
subscription is not HP Known.
Displays TRUE if the subscription is deprecated. Displays FALSE if the
subscription is not deprecated. This field is applicable to HP Advised
subscriptions only.
Displays TRUE if the subscription criterion is configured to store the WBEM
indications in the Event Archive. Displays FALSE if the subscription criterion
is not configured to store the WBEM indications in the Event archive.
Displays TRUE if the subscription criterion is configured to send an e-mail
to the specified e-mail address, when a WBEM indication is generated.
Displays FALSE if the subscription is not configured to send an e-mail.
Displays TRUE if the subscription criterion is configured to store the WBEM
indications in the Syslog. Displays FALSE if the subscription criterion is not
configured to store the WBEM indications in the syslog.
For information on viewing the summary of Evweb event subscriptions using the CLI, see
evweb_subscribe(1).
Viewing details of an event subscription using the GUI
To view details of an event subscription, complete the following steps:
1. Repeat steps 1-5 from “Launching Evweb for administration” (page 50).
The Event subscription administration page displays the event subscription Table.
Viewing event subscriptions using Evweb 57
Page 58

2. Select the event subscription from the event subscription Table.
The details of the event subscription is displayed at the end of the event subscription Table.
For more information on viewing the details of an Evweb event subscription using the HP SMH
GUI, select Help on the action pane of the event subscription page.
Viewing details of an event subscription using the CLI
To view the details of an Evweb event subscription using the CLI, enter the following command at
the HP-UX prompt:
# evweb subscribe -E -n <subscription name>
Where:
-E is an option used to display details of an event subscription.
-n is a switch used to specify the name of an event subscription.
A table with detailed information about event subscriptions is displayed, as shown in Figure 18.
Figure 18 Details of an event subscription
Table 13 describes the fields in the Details of an Event Subscription page.
Table 13 Details of an event subscriptions
DescriptionField
Displays the name of an event subscription.Subscription name
Subscription criteria
Subscription destination
Displays the criteria that are specified for the subscription, for example,
severity, event ID, event category, device, and so on.
Displays the destination where the WBEM indications are stored, for
example, event Archive, e-mail address, and syslog.
Viewing external event subscriptions
Event subscriptions created by tools and interfaces other than Evweb are called external event
subscriptions. This section describes how to view external event subscriptions using Evweb.
Viewing an external event subscription using the GUI
To view an external event subscription, complete the following steps:
1. Repeat steps 1-5 from “Launching Evweb for administration” (page 50).
The Event subscription administration page displays the event subscription table.
2. Select View external subscription in the action pane on the top right corner of the page.
The View external subscriptions page is displayed.
58 Administering indications and instances using HP SMH
Page 59

For more information on viewing external event subscription using the HP SMH GUI, select Help
on the action pane of the View external event subscription page.
Viewing external event subscriptions using the CLI
To view the summary of an Evweb event subscription using the CLI, enter the following command
at the HP-UX prompt:
# evweb subscribe -L -b external
Where:
-L is an option used to list all the event subscriptions.
-b is a switch used to display information about event subscriptions in brief.
external is an argument used to display information about external event subscriptions.
A list of event subscriptions is displayed in a tabular format, as shown in Figure 19.
Figure 19 External event subscriptions
The field names of the external event subscriptions are different from the ones created using Evweb.
However, field names of both external event subscriptions and subscriptions created using Evweb,
can be matched. Table 14 describes the fields in the View external event subscriptions page.
Table 14 External event subscriptions
For information on viewing external subscriptions using the CLI, see evweb_subscribe(1).
Viewing indications using Evweb
This section describes how to perform non-administration tasks related to viewing WBEM indications
using Evweb.
This section addresses the following topics:
• “Launching Evweb for viewing WBEM indications” (page 60)
• “Searching for the subscribed WBEM events” (page 60)
DescriptionField
Displays the filter name consisting of an event subscriptions.Filter name
Displays the handler name consisting of an event subscriptions.Handler name
Displays the destination where the indications are stored.Destination URL
Displays the subscription criteria.Query
• “Viewing summary information about WBEM events” (page 61)
• “Viewing detailed information about WBEM events” (page 62)
• “Deleting WBEM Events from the Event Archive” (page 62)
Viewing indications using Evweb 59
Page 60

NOTE: Evweb enables both administrators and non-administrators to search and view WBEM
events. However, only administrators can delete WBEM events.
The Event Viewer enables you to view, search, and delete WBEM events that are present in the
Event Archive. It also enables you to view both detailed and summary information of WBEM events.
You can also search for WBEM events stored in the Event Archive using the advanced search
feature. To enhance search results, the Event Archive is divided into Current and History Event
archive. By default, the Current event archive contains the latest events that are generated on an
HP-UX 11i v3 system.
The events stored in the Current event archive are automatically moved to the History Event Archive
based on the following parameters, which ever occurs first:
• The events are older than 10 days.
• The page size of the Current event archive is greater than 100.
• Events older than 365 days are purged from the history event archive. This results in a phased
elimination of old events.
These values are defined as XML elements surrounded by <EvwebDBConfig> tag in /var/opt/
sfm/conf/DBConfig.xml. If they are changed, enter the following command at the HP-UX
prompt:
# /opt/sfm/bin/sfmconfig -c /var/opt/sfm/conf/DBConfig.xml
Launching Evweb for viewing WBEM indications
You can launch Evweb either through the CLI or through the HP SMH GUI.
To launch Evweb using the CLI, enter the following command at the HP-UX prompt:
# evweb eventviewer –L
To launch Evweb for viewing WBEM indications using the HP SMH GUI, complete the following
steps:
1. Log in to the HP SMH.
To log in to HP SMH, enter http://<hostname>:2301 in the address bar of the Web
browser. The HP SMH login screen is displayed.
2. Enter your user name and password in the appropriate text boxes.
3. Click Sign In on the login screen.
The HP SMH home page is displayed.
4. Select Logs in the main menu.
The Logs page is displayed. This page displays the applications that are plugged in to HP
SMH.
5. Select Event viewer in Evweb.
The Event viewer page is displayed.
You can view and delete WBEM indications using the Event viewer.
Searching for the subscribed WBEM events
Evweb enables you to search the Event archive for subscribed WBEM events. The Evweb GUI
provides a link, EMT Search, using which you can obtain error, cause, and recommended solutions
for errors that may be generated on an HP-UX 11i v3 system. For more information about how to
use EMT to search for WBEM events, see “Querying the Common Error Repository” (page 71).
Filtering WBEM events using the GUI
The Event Viewer GUI enables you to filter the WBEM events based on their severity level.
60 Administering indications and instances using HP SMH
Page 61

To filter the WBEM events based on their severity, complete the following steps:
1. Repeat steps 1-5 from “Launching Evweb for viewing WBEM indications” (page 60).
2. Select Critical to search for critical events.
Similarly, select Major, Minor, Warning, Information, Other, Normal, or Unknown to search
for the respective WBEM events.
3. To view all events, select All Events.
For more information on performing a quick search of WBEM events using the HP SMH GUI, select
Help on the action pane of the List Events page.
Searching for the subscribed WBEM events using the GUI
To perform an advanced search of the WBEM events, complete the following steps:
1. Repeat steps 1-5 from “Launching Evweb for viewing WBEM indications” (page 60).
2. Select advanced search on the right pane of the Event Viewer page.
The advanced search page is displayed.
3. Provide appropriate information in the text boxes and fields present in the advanced search
page.
4. Click search on the advanced search page.
Based on the search criteria, the WBEM events are displayed in a tabular format in the Event
viewer page.
For more information on searching for the WBEM events using the HP SMH GUI, select Help on
the action pane of the advanced search page.
Searching for the subscribed WBEM events using the CLI
To search WBEM events using the CLI, enter the following command at the HP-UX prompt:
# evweb eventviewer -L
Where:
-L is an option used to list all the WBEM events.
A list of WBEM events is displayed.
You can also use the following switches with the -L option:
• -e [eq|ne|le|ge|bw][:] <severity level1>[,<severity level2>]
• -v <event category names>
• -i <EventID>
• -r[is|be|en|co][:](<string to be searched>)
• -a(<number for age>(:)(yy|mm|dd|hh)
• -t[eq|le|ge|bw] (<mm:dd:yyyy:hh:mi:ss>)[,<mm:dd:yyyy:hh:mi:ss>]
• -s[asc|desc] (<summary list column name>)
• -o(<offset number>) -c(<count of events>)
• -b [history|current]
For information on searching the WBEM events using the CLI, see evweb_eventviewer(1).
Viewing summary information about WBEM events
You can view summary information about events stored in the Event Archive database.
Viewing indications using Evweb 61
Page 62

Viewing summary information using GUI
To view summary information about WBEM events, repeat steps 1-5 from “Launching Evweb for
viewing WBEM indications” (page 60).
The List Events page is displayed. The List Events table displays summary information about the
WBEM events that are stored in the Event Archive.
For more information on viewing summary information of the WBEM events using the HP SMH
GUI, select Help on the action pane of the List Events page.
Viewing summary information using CLI
To view WBEM events using the CLI, enter the following command at the HP-UX prompt:
# evweb eventviewer -L -x -f
Where:
-L is an option used to list all the WBEM events.
-x is a switch used to display the summary and detailed information of all events matching the
search criteria.
-f is an optional switch used to force the command. The -f switch can be used only with the
-x switch.
A list of WBEM events is displayed on the screen.
Viewing detailed information about WBEM events
You can view the details of a WBEM event using Evweb.
Viewing detailed information using GUI
To view detailed information about the WBEM events, complete the following steps:
1. Repeat steps 1-5 from “Launching Evweb for viewing WBEM indications” (page 60).
2. Select the desired WBEM event in the List Events table.
The Details of the Event page is displayed. This page includes a table that provides detailed
information about the WBEM events.
For information on viewing detailed information of the WBEM events using the HP SMH GUI, select
Help on the action pane of the List Events page.
Viewing Detailed Information using CLI
To view detailed information on WBEM events using the CLI, enter the following command at the
HP-UX prompt:
# evweb eventviewer -E -n <event ID>
Where:
-E is an option used to view details of a WBEM event.
-n is a switch used specify the event ID of the WBEM event.
The screen displays detailed information about the WBEM events.
For information on viewing detailed information of WBEM events using the CLI, see
evweb_eventviewer(1).
Deleting WBEM Events from the Event Archive
You can delete a single event or multiple events at a time.
Deleting an Event using GUI
To delete an event, complete the following steps:
62 Administering indications and instances using HP SMH
Page 63

1. Repeat steps 1-5 from “Launching Evweb for viewing WBEM indications” (page 60).
2. Select Delete Events in the action pane on the top right corner of the page.
The Delete Events page is displayed.
3. Select the event you want to delete by selecting the appropriate check box.
You can delete more than one WEBM event at a time.
4. Select Delete in the List Events page.
Evweb deletes the event from the event archive database and displays a confirmation message.
5. Click OK on the confirmation message window.
For information on deleting WBEM events using the HP SMH GUI, select Help on the action pane
of the Delete Events page.
Deleting an Event using CLI
To delete WBEM events using the CLI, enter the following command at the HP-UX prompt:
# evweb eventviewer -D
Where:
-D is an option used to delete all the WBEM events.
You can also use the following switches with the -D option:
• -e [eq|ne|le|ge|bw][:]<severity level1>[,<severity level2>]
• -v <cevent category names>
• -i <EventID>
• -r[is|be|en|co][:](<string to be searched>)
• -a(<number for age>(:)(yy|mm|dd|hh)
• -t[eq|le|ge|bw] (<mm:dd:yyyy:hh:mi:ss>)[,<mm:dd:yyyy:hh:mi:ss>]
• -s[asc|desc] (<summary list column name>)
• -f
• -n <comma separated Event Numbers>
• -b [history|current]
For information on deleting WBEM events using the CLI, see evweb_eventviewer(1).
Viewing Low Level Logs using Evweb
This section describes how to perform administration tasks such as searching and viewing low
level log information.
This section discusses the following topics:
• “Overview” (page 63)
• “Searching Low Level Logs using Simple Search” (page 64)
• “Searching Low Level Logs using Advanced Search” (page 65)
• “Viewing List of Low Level Logs” (page 65)
• “Viewing Details of Low Level Logs” (page 66)
Overview
The low level log is required to view information about hardware details and system errors.
Viewing Low Level Logs using Evweb 63
Page 64

The Log Viewer enables you to view low level log information from the log database on a local
HP-UX system. The low level log information include Log Id, Log Index, Device Id, Device Type,
and Time of occurrence.
You can find the low level log information in both Current Log Database and Archive Log Database.
By default, the most recent low level log information is stored in the current log database.
The low level log information is automatically transferred from the Current Log Database to the
Archive Log Database based on either of the following criterion, or whichever occurs first:
• The age of the log is greater than 10 days. Logs older than 10 days are automatically stored
in the Archive Log Database.
• The page size of the database exceeds 140.
Records in the archive log database are saved for one year. The number of pages in the Archive
Log Database size is 340. These values are defined as XML elements surrounded by <DBConfig>
tag in /var/opt/sfm/conf/DBConfig.xml. If they are changed, enter the following command
at the HP-UX prompt:
# /opt/sfm/bin/sfmconfig -c /var/opt/sfm/conf/DBConfig.xml
sfmDBUtil
The sfmDB utility is used to create a backup of the Postgres database. It can also be used to restore
the same.
/opt/sfm/bin/sfmDBUtil
Two operations can be performed using the utility:
• Backup: Back up is the process of taking backup of all the databases including current and
archived database. It is initiated by the administrator. The administrator must execute this
utility with the argument bkup with the destination file name. The data directory is considered
to be the destination.
/opt/sfm/bin/sfmDBUtil bkup dbbackup
• Restore: Restore is the process of restoring backed up data and it is initiated by the
administrator. The administrator must execute this utility with the argument restore with the
source file name. The data directory is considered to be the source.
/opt/sfm/bin/sfmDBUtil restore dbbackup
Searching Low Level Logs using Simple Search
To search the log database for low level logs using Log Viewer, complete the following steps:
1. Log in to the System Management Homepage.
To log in to HP SMH, enter http://<hostname>:2301 in the address bar of a Web
browser. The HP SMH login screen is displayed.
2. Enter your user name and password in the appropriate text boxes.
3. Click Sign In on the login screen.
The HP SMH home page is displayed.
4. Select Logs on the main menu.
The Logs page is displayed.
5. Select Log Viewer in the Evweb box.
The Log Viewer page is displayed.
6. Provide appropriate information in the fields present in the Log Viewer page.
7. Click Search on the Log Viewer page.
Based on the search criteria, the log records are displayed in a tabular format.
64 Administering indications and instances using HP SMH
Page 65

For information on searching the log database using GUI, select Help on the action pane of the
Log Viewer page.
Searching Low Level Logs using Advanced Search
To search the log database for low level logs using Log Viewer, complete the following steps:
1. Repeat steps 1-5 from “Searching Low Level Logs using Simple Search” (page 64).
2. Select Advanced Search on the right pane of the Log Viewer page.
The Advanced Search page is displayed.
3. Provide appropriate information in the fields present in the Advanced Search page.
4. Click Search on the Advanced Search page.
Based on the search criteria, the log records are displayed in a tabular format in the Log
Viewer page.
For information on searching the log database using GUI, select Help on the action pane of the
Advanced Search page present on the Log Viewer page.
Searching Low Level Logs using CLI
To search for low level log information using the CLI, enter the following command at the HP-UX
prompt:
# evweb logviewer -L -e
Where:
-L is an option used to obtain a list of low level log summary.
-e is an option used to specify whether the –L option must include the low level details and the
summary information of the low level logs.
You can also use the following switches with the -L option:
• -i <Log ID>
• -n <Log Index>
• -j <Log Type>
• -x <Device ID>
• -y <Device Type>
• -a age_number[:][yy|mm|dd]
• -t [eq|le|ge|bw][:]<mm:dd:yyyy>[,mm:dd:yyyy]
NOTE: The -a and the -t switches are mutually exclusive and can be used with the -L
option only.
• -s [LogId|LogIndex|DeviceId|DeviceType|TimeOfOccurence]
• -o <Offset Number> -c <Number of Logs>
NOTE: The -s, -o,and the -c switches can be used with the -L option only.
For information on searching for low level log information using the CLI, see evweb_logviewer(1).
Viewing List of Low Level Logs
You can view a list of low level logs summary using the Log Viewer. The list of low level logs are
tabulated and include information, such as Log ID, Log Index, Device ID, Device Type, and Time
of occurrence. In this document, this table is referred to as the Logs Summary Table. The Logs
Summary Table is a result of the search operation.
Viewing Low Level Logs using Evweb 65
Page 66

Viewing List Of Low Level Logs using GUI
To view a list of low level logs using Log Viewer, complete the following steps:
1. Repeat steps 1-5 from “Searching Low Level Logs using Simple Search” (page 64).
2. Depending on the information you have, perform either a simple search or an advanced
search.
Based on the search criteria, the log records are displayed in a tabular format.
For information on viewing the low level logs using GUI, select Help on the action pane of the Log
Viewer page.
Viewing List Of Low Level Logs using CLI
To view a list of low level logs using the CLI, enter the following command at the HP-UX prompt:
# evweb logviewer -L
Where:
-L is an option used to obtain a list of low level log summary.
You can also use the following switches with the -L option:
• -i <Log ID>
• -n <Log Index>
• -j <Log Type>
• -x <Device ID>
• -y <Device Type>
• -a age_number[:][yy|mm|dd]
• -t [eq|le|ge|bw][:]<mm:dd:yyyy>[,mm:dd:yyyy]
NOTE: The -a and the -t switches are mutually exclusive and can be used with the -L
option only.
• -s [LogId|LogIndex|DeviceId|DeviceType|TimeOfOccurence]
• -o <Offset Number> -c <Number of Logs>
NOTE: The -s, -o,and the -c switches can be used with the -L option only.
Following is an example of how the low level logs are listed using the following command:
# evweb logviewer -L
Log Id Log Index Device Id Device Type Time of detection
====== ========= ========= =========== =======================
41 0 0 Memory Wed Dec 30 2009 00:36:1
40 0 0 Memory Thu Dec 10 2009 20:38:2
39 0 0 Memory Thu Dec 10 2009 20:31:3
38 0 0 Memory Thu Dec 10 2009 20:25:0
37 0 0 Memory Sun Dec 6 2009 23:37:08
For information on viewing a list of low level logs using the CLI, see evweb_logviewer(1).
Viewing Details of Low Level Logs
You can view a details of low level logs using the Log Viewer. The detailed information about the
low level logs include information, such as Log ID, Log Index, Log Type, Device ID, Device Type,
Time of occurrence, and dump of the low level logs in hexadecimal format.
66 Administering indications and instances using HP SMH
Page 67

Viewing Details Of Low Level Logs using GUI
To view details of low level logs using Log Viewer, complete the following steps:
1. Repeat steps 1-5 from “Searching Low Level Logs using Simple Search” (page 64).
2. Depending on the information you have, perform either a simple search or an advanced
search.
Based on the search criteria, the log records are displayed in the Log Summary Table.
3. Select the desired low level log from the Log Summary Table.
The details of a low level log is displayed in the Log Viewer page.
For information on viewing the low level logs using GUI, select Help on the action pane of the Log
Viewer page.
Viewing Details Of Low Level Logs using CLI
To view details of low level logs using the CLI, enter the following command at the HP-UX prompt:
# evweb logviewer -E -i <Log ID> -n <Log Index>
Where:
-E is an option used to obtain details of low level log information.
-i is a switch used to specify the Log ID.
-n is a switch used to specify the Log Index.
You can also use the following switch with the -E option:
• -r
Following is an example of how the low level logs details are displayed using the command options:
# evweb logviewer -Ei 40 -r
Low Level Log Details
=====================
Log Id : 40
Log Index : 0
Log Type : Server
Device Id : 0
Device Type : Memory
Time of occurence : Thu Dec 10 2009 19:38:25
Buffer
0000000 0 2bc 0 0 4b21 beb1 0 d30
0000010 509 0 0 0 500 200 300d 0
0000020 2538 300 1112 920 0 0 0 0
0000030 0 0 0 0 f7fa 29e4 b73c d411
0000040 bca7 80 c73c 8881 500 0 80d 0
0000050 4000 0 0 0 0 0 0 0
0000060 0 0 0 0 0 0 0 0
For information on viewing details of low level logs using the CLI, see evweb_logviewer(1).
Tracing Evweb
This section provides an overview of tracing and information about the various trace levels in
Evweb. This section also describes administrative tasks, such as enabling, modifying, and disabling
tracing.
This section addresses the following topics:
• “Enabling Tracing using the Evweb GUI” (page 69)
• “Enabling Tracing using the Evweb CLI” (page 69)
• “Modifying Tracing using the Evweb GUI” (page 70)
• “Modifying Tracing using the Evweb CLI” (page 70)
Tracing Evweb 67
Page 68

• “Disabling Tracing using the Evweb GUI” (page 70)
• “Disabling Tracing using the Evweb CLI” (page 71)
Tracing is a feature that enables you to log and report errors. You can use tracing to log information
about problems encountered while using Evweb. In this document, this information is referred to
as trace records. The trace records are stored in the /var/opt/sfm/log/sfm.log file. The
logs are written when SFM is running. These logs are Warning, informational, Milestone etc based
on the kind of severity set by the user. You can send the sfm.log file to the HP support center
whenever you encounter a problem.
Following is a sample of the information logged in sfm.log.
01/04/06 06:50:08 EVMAN_COMMANDS ERROR 1069627450 1 Subscription with
this name already exist, Please choose different name and try again.
Table 15 describes the fields included in the sfm.log file.
Table 15 Entries in sfm.log
DescriptionField
Displays the date when the message was logged in the sfm.log file.Date
Displays the time when the message was logged in the sfm.log file.Time
Module Name
Displays the name of the module or the providers that logged the message
in the sfm.log file, for example, EVWEB_CLI and FMDProviders.
Displays the severity of the message logged in the sfm.log file.Severity
Displays the 10-digit process ID.Process ID
Displays the thread ID.Thread ID
Displays the text message.Message
To change the default location of the sfm.log file, you must configure the
/var/opt/sfm/conf/FMLoggerConfig.xml file.
You can enable, modify, and disable tracing for an Evweb session. A session is the duration
between a login and a logout. At the end of a session, tracing is automatically disabled. In an
active session, the trace level remains valid until you modify it.
Evweb provides the following trace levels in the descending order of severity:
• 1-Critical
• 2-Error
• 3-Warning
• 4-Information
Table 16 describes the trace levels in Evweb.
Table 16 Trace Levels
DescriptionTrace Level
The system logs only those situations in Evweb that cause major failures.1-Critical
Example: The database server is not functioning properly or is down.
The system logs those situations that generate an error.2-Error
Example: There is more than one subscription name. Evweb accepts only
one subscription name.
Critical situations are also logged at the Error trace level.
The system logs situations that result in warning messages.3-Warning
68 Administering indications and instances using HP SMH
Page 69

Table 16 Trace Levels (continued)
DescriptionTrace Level
Example: A warning is generated when the default setting is modified.
Both critical and error situations are logged at the Warning trace level.
The system logs situations that result in information messages.4-Information
Example: An information message is generated when a non-administrator
attempts to perform a task that can be performed only by an administrator.
Critical, error, and warning situations are logged at the Information trace
level.
The default trace level is Warning. If you set tracing to a particular severity level, all messages of
that severity and above are logged in the log file.
The administrative commands for creating, modifying, and deleting subscriptions, and deleting
events are stored in the /var/sam/log/samlog.log file. From the GUI, you can access the
samlog.log file from HP SMH home page -> Logs -> Samlog.
NOTE: Tracing is available for administrators only.
Enabling Tracing using the Evweb GUI
To enable tracing, complete the following steps:
1. Log in to the System Management Homepage.
To log in to HP SMH, enter http://<hostname>:2301 in the address bar of a Web
browser. The HP SMH login screen is displayed.
2. Enter your user name and password in the appropriate text boxes.
3. Click Sign In on the login screen.
The HP SMH home page is displayed.
4. Do one of the following:
• Select Tools -> Subscription Administration.
or
• Select Logs -> Event Viewer.
NOTE: The Enable Tracing option is not displayed if tracing is already enabled. Instead,
the Disable Tracing and the Modify Tracing options are displayed.
5. Select Enable Tracing available at the top right corner of the page.
The Enable tracing page is displayed.
6. Set the trace level by selecting the level from the trace level list.
7. Select Enable Tracing.
The tracing level is set and a confirmation message is displayed.
8. Click OK on the confirmation message window.
For more information on enabling tracing using the HP SMH GUI, select Help on the action pane
of either the Event Viewer or the Event Subscription Administration page.
Enabling Tracing using the Evweb CLI
To enable tracing using the Evweb CLI, you must export the environment variable,
EVWEB_TRACE_LEVEL. To export the environment variable, enter the following command at the
HP-UX prompt:
Tracing Evweb 69
Page 70

# export EVWEB_TRACE_LEVEL=<trace value>
Tracing is now enabled. The trace value is the trace level that you have set.
Modifying Tracing using the Evweb GUI
To modify tracing, complete the following steps:
1. Log in to the System Management Homepage.
To log in to HP SMH, enter http://<hostname>:2301 in the address bar of a Web
browser. The HP SMH login screen is displayed.
2. Enter your user name and password in the appropriate text boxes.
3. Click Sign In on the login screen.
The HP SMH home page is displayed.
4. Do one of the following:
• Select Tools -> Subscription Administration.
or
• Select Logs -> Event Viewer.
NOTE: The Modify Tracing option is not displayed if tracing is not enabled.
5. Select Modify Tracing available at the top right corner of the page.
The Modify Tracing page is displayed.
6. Change the trace level by selecting the level from the trace level list.
7. Select Modify Tracing.
The tracing level is modified and a confirmation message is displayed.
8. Click OK on the confirmation message window.
For more information about modifying tracing using the HP SMH GUI, select Help on the action
pane of either the Event Viewer or the Event Subscription Administration page.
Modifying Tracing using the Evweb CLI
To modify tracing using the Evweb CLI, enter the following command at the HP-UX prompt:
# export EVWEB_TRACE_LEVEL=<new trace value>
Tracing is now modified. The new trace value is the trace level that you have set.
Disabling Tracing using the Evweb GUI
To disable tracing, complete the following steps:
1. Log in to the System Management Homepage.
To log in to HP SMH, enter http://<hostname>:2301 in the address bar of a Web
browser. The HP SMH login screen is displayed.
2. Enter your user name and password in the appropriate text boxes.
3. Click Sign In on the login screen.
The HP SMH home page is displayed.
4. Do one of the following:
• Select Tools -> Subscription Administration.
or
• Select Logs -> Event Viewer.
70 Administering indications and instances using HP SMH
Page 71

NOTE: The Disable Tracing option is not displayed if tracing is not enabled.
5. Select Disable Tracing available on the top right corner of the page.
The tracing is disabled and a confirmation message is displayed.
6. Click OK on the confirmation message window.
For more information on disabling tracing using the HP SMH GUI, select Help on the action pane
of either the Event Viewer or the Event Subscription Administration page.
Disabling Tracing using the Evweb CLI
To disable tracing using the Evweb CLI, you must reset the trace value. To reset the trace value,
enter the following command at the HP-UX prompt:
# unset EVWEB_TRACE_LEVEL
Tracing is now disabled.
NOTE: Tracing is automatically disabled at the end of an Evweb session.
Querying the Common Error Repository
This section provides an overview of Error Management Technology (EMT), and describes how to
query and view events present in Common Error Repository (CER).
This section addresses the following topics:
• “EMT Overview” (page 71)
• “Launching EMT” (page 72)
• “Querying the CER using Simple Search” (page 72)
• “Querying CER using Advanced Search” (page 73)
• “Viewing an Event from CER” (page 73)
EMT Overview
The SFM includes a user component called EMT, which enables you to view the error messages
that are generated on an HP-UX 11i v3 system. The EMT includes Common Error Repository (CER),
which is an online, searchable, and updateable error repository. The CER contains error metadata.
Error metadata is collective information about an error such as error description, error number,
error type, severity, cause of the error, and corrective actions. The EMT also includes the cerupdate
tool, which enables you to update CER with product specific error information.
The EMT supports the following user interfaces:
• Browser-based Graphical User Interface (GUI)
• Command-Line Interface (CLI)
The EMT supports the following user groups:
• Administrator
• Non-administrator
In the CLI, any user with superuser privileges is an administrator. However, in the HP System
Management Homepage (HP SMH) GUI, the user groups in EMT are mapped internally to the user
groups defined in the HP SMH.
The Administrator user group in the HP SMH maps to administrators in EMT. The Operator and
the User user groups in the HP SMH map to non-administrators in EMT.
For information about configuring user groups in HP SMH, see the HP System Management
Homepage User’s Guide at:
Querying the Common Error Repository 71
Page 72

http://www.hp.com/go/smh-docs
Launching EMT
You can launch EMT either through the CLI or the GUI.
To launch EMT using the CLI, enter the following command at the HP-UX prompt:
# /opt/sfm/bin/emtui
To launch EMT using the HP SMH GUI, complete the following steps:
1. Log in to the HP SMH.
To log in to the HP SMH, enter http://<hostname>:2301 in the address bar of the Web
browser.
The HP SMH login screen is displayed.
2. Enter your user name and password in the appropriate text boxes.
3. Click Sign In on the login screen.
The HP SMH home page is displayed.
4. Select Tools in the main menu.
The Tools page is displayed. This page displays various applications that are plugged in to
the HP SMH.
5. Select Query or Customize Error Data in Error Management Technology.
The Simple Search page is displayed.
Querying the CER using Simple Search
To query the CER using the Simple Search feature, you can use either the HP SMH GUI or the CLI.
EMT enables you to query the CER for system-specific events. This feature reduces the query time,
and is available in both GUI and CLI modes
Querying CER for Events using the GUI
To query the CER for events using the HP SMH GUI, complete the following steps:
1. Repeat steps 1-5 from “Launching EMT” (page 72).
2. Provide appropriate information in the text boxes and fields present in the Simple Search
page.
3. Click Search on the Simple Search page.
Based on the search criteria, the Simple Search page displays the events in a tabular format.
For more information about querying CER using HP SMH GUI, select Help on the action pane of
the Simple Search page.
Querying CER for Events using the CLI
To query CER for events using the CLI, enter the following command at the HP-UX prompt:
#emtui { -q <querystring> [-w<matchtype>]} | { -i <errornum> }
Where:
-q is an option that enables you to specify a query string to query the CER for information about
errors, cause, and recommended actions.
-w is an option that enables you to specify the match type.
72 Administering indications and instances using HP SMH
Page 73

Following are the match types:
• any (default) - Searches for at least one word specified in the query string.
• all - Searches for all words specified in the query string.
• phrase - Searches for the exact phrase specified in the query string.
-i is an option that enables you to specify the error number. Error number is a unique
identification number for the errors present in CER.
You can also use the following switches with the -q option:
• -c { all | <category> }
• -l { lt| le | eq | ge | gt } [ <severity> ]
• -s { all | hp | other}
For more information on querying CER using the CLI, see emtui(1).
Querying CER using Advanced Search
To query the CER for events using the Advanced Search feature HP SMH GUI, complete the following
steps:
1. Repeat steps 1-5 from “Launching EMT” (page 72).
2. Select Advanced Search on the right pane of the Simple Search page.
The Advanced Search page is displayed.
3. Provide appropriate information in the text boxes and fields present in the Advanced Search
page.
4. Click Search on the Advanced Search page.
Based on the search criteria, the Advanced Search page displays the events in a tabular format.
For more information about querying the CER using the Advanced Search feature on the HP SMH
GUI, select Help on the action pane of the Advanced Search page.
Viewing an Event from CER
You can view the summary of events and detailed information about an event present in CER. The
List Events page displays the search results in a tabular format. In this document, this table is referred
to as the Error Summary Table.
Viewing Summary Information using the GUI
The Error Summary Table displays the summary information of events present in CER. The events
are displayed in the reverse chronological order. You can sort the events by the column heading.
By default, the Error Summary Table is sorted in the descending order of severity level. To toggle
the sort order, click on the column heading. You can sort only one column at a time.
To view summary information about events stored in CER using the HP SMH GUI, complete the
following steps:
1. Repeat steps 1-5 from “Launching EMT” (page 72).
2. Query CER for error metadata using the Simple Search or the Advanced Search feature.
The List Events page, which contains the Error Summary Table, is displayed.
For information about viewing summary information of events in CER using the HP SMH GUI, select
Help on the action pane of the List Events page.
Viewing Summary Information using the CLI
To view summary information about events in CER using the CLI, enter the following command at
the HP-UX prompt:
Querying the Common Error Repository 73
Page 74

# emtui -b
Where:
-b is an option used to view information about events in brief.
A list of events in CER is displayed.
For more information on viewing summary information about an event in CER using the CLI, see
emtui(1).
Viewing Detailed Information using the GUI
You can view detailed information about an event by clicking on any row in the Error Summary
Table.
To view detailed information about an event stored in CER using the HP SMH GUI, complete the
following steps:
1. Repeat steps 1-5 from “Launching EMT” (page 72).
2. Query CER for error metadata using the Simple Search or the Advanced Search feature.
3. Click on the desired row in the Error Summary Table.
The Detailed Error Information pane is displayed. The Detailed Error Information pane displays
detailed information about the event.
For information on viewing detailed information about an event using the HP SMH GUI, select
Help on the action pane of the Detailed Error Information pane.
Viewing Detailed Information using the CLI
To view detailed information about an event in CER using the CLI, enter the following command
at the HP-UX prompt:
# emtui -v
Where:
-v is an option used to view detailed information about an event from the CER.
For more information on viewing details of an event using the CLI, see emtui(1).
Administering Events in CER
This section describes how to administer events using EMT.
This section addresses the following topics:
• “Adding a Custom Solution” (page 74)
• “Modifying a Custom Solution” (page 75)
• “Deleting a Custom Solution ” (page 76)
Apart from querying and viewing events stored in CER, EMT enables you to add, modify, and
delete solutions. The solution that you add for an event is called a custom solution. You can add,
modify, and delete custom solutions to multiple causes at a time.
Adding a Custom Solution
If you are a system administrator, you can add your own solution for an error generated on a
HP-UX system. The custom solution is permanently stored in CER and is available to all EMT users.
Adding a Custom Solution using the GUI
To add a custom solution using the HP SMH GUI, complete the following steps:
1. Repeat steps 1-5 from “Launching EMT” (page 72).
2. Search for the event from CER using either the Simple Search or the Advanced Search feature.
74 Administering indications and instances using HP SMH
Page 75

3. Click on the desired event from the Event Summary Table.
The details of the event is displayed in the Detailed Error Information (Administrative View)
pane.
4. If there is no cause associated with the event, skip to Step 5. If a cause is associated with the
event, select the cause for the event from the Detailed Error Information (Administrative View)
pane.
You can select multiple causes for an event.
5. Click Add Solution to Selected Causes on the right corner of the Detailed Error Information
(Administrative View) pane.
The Add a Custom Solution page is displayed.
6. Provide appropriate information in the text boxes in the Add a Custom Solution page, and
click Add Solution.
A confirmation message is displayed.
7. Click OK on the confirmation message window.
The new custom solution is displayed on the Detailed Error Information (Administrative View)
pane.
For more information about adding a custom solution using the HP SMH GUI, select Help on the
action pane of the Add a Custom Solution page.
Adding a Custom Solution using the CLI
To add a custom solution using the CLI, enter the following command at the HP-UX prompt:
# emtui -a<solution text>
Where:
-a is an option used to add a custom solution.
You can also use the following switches with the -a option:
• -c <cause number>
• -i <error number>
For information about adding a custom solution using the CLI, see emtui(1).
Modifying a Custom Solution
You can use either the HP SMH GUI or the CLI to modify a custom solution in CER.
Modifying a Custom Solution using the GUI
To modify a custom solution using the HP SMH GUI, complete the following steps:
1. Repeat steps 1-5 from “Launching EMT” (page 72).
2. Repeat steps 2 and 3 from “Adding a Custom Solution using the GUI” (page 74).
3. If there is no cause associated with the event, skip to Step 4. If a cause is associated with the
event, select the cause for the event from the Detailed Error Information (Administrative View)
pane.
You can select multiple causes for an event.
4. Click Modify Selected Solution on the right corner of the Detailed Error Information
(Administrative View) pane.
The Modify a Custom Solution page is displayed.
5. Modify the information in the text boxes in the Modify a Custom Solution page, and click
Modify Solution.
A confirmation message is displayed.
Administering Events in CER 75
Page 76

6. Click OK on the confirmation message window.
The modified custom solution is displayed on the Detailed Error Information (Administrative
View) pane.
For more information about modifying a custom solution using the HP SMH GUI, select Help
on the action pane of the Modify a Custom Solution page.
Modifying a Custom Solution using the CLI
To modify a custom solution using the CLI, enter the following command at the HP-UX prompt:
# emtui -m <modified text>
Where:
-m is an option used to modify a custom solution.
You can also use the following switches with the -m option:
• -c <cause number>
• -i <error number>
For information about modifying a custom solution using the CLI, see emtui(1).
Deleting a Custom Solution
You can use either the HP SMH GUI or the CLI to delete a custom solution present in the CER.
Deleting a Custom Solution using the GUI
To delete a custom solution using the HP SMH GUI, complete the following steps:
1. Repeat steps 1-5 from “Launching EMT” (page 72).
2. Repeat steps steps 2 and 3 from “Adding a Custom Solution using the GUI” (page 74).
3. Click Delete Selected Solution on the Detailed Error Information (Administrative View) pane.
The Delete a Custom Solution page is displayed. This page displays the custom solution and
the error metadata.
4. Click Delete Selected Solution on the Delete a Custom Solution page.
A confirmation message is displayed.
5. Click OK on the message box.
The custom solution is permanently removed from the CER.
For more information about deleting a custom solution using the HP SMH GUI, select Help on the
action pane of the Delete a Custom Solution page.
Deleting a Custom Solution using the CLI
To delete a custom solution using the CLI, enter the following command at the HP-UX prompt:
# emtui -d -u <user solution number>
Where:
-d is an option used to delete a custom solution present in the CER.
-u is an option used to specify the number associated with the custom solution that you want to
delete.
You can also use the following switches with the -m option:
• -c<cause number>
• -i <error number>
For information on deleting custom solution in the CER using the CLI, see emtui(1).
76 Administering indications and instances using HP SMH
Page 77

Tracing EMT
This section provides an overview of tracing and information about the various trace levels in EMT.
This section also describes how to enable, modify, and disable tracing.
This section addresses the following topics:
• “Enabling Tracing using the EMT GUI” (page 77)
• “Enabling Tracing using the EMT CLI” (page 78)
• “Modifying Tracing using the EMT GUI” (page 78)
• “Modifying Tracing using the EMT CLI” (page 78)
• “Disabling Tracing using the EMT GUI” (page 78)
• “Disabling Tracing using the EMT CLI” (page 78)
Tracing is a feature that enables you to log and report errors. You can use tracing to log information
about problems encountered while using EMT. In this document, this information is called trace
records. The trace records are stored in the /var/opt/hpsmh/logs/error_log file. You can
send the error_log file to the HP support center whenever you encounter a problem.
Following is a sample of the information logged in the error_log file.
[Mon Nov 06 01:10:07 2006] [error] [client 15.76.96.40] 11/06/06 01:10:07 emtuicmd INFORMATIONAL 22253 1
Processing request to add action data, referer: <address>.
Table 17 describes the fields included in the error_log file.
Table 17 Entries in error_log
To change the default location of the error_log file, you must configure the /opt/hpsmh/
conf/smhpd.conffile.
Tracing using EMT is similar to tracing using Evweb. For information about the various trace levels,
see “Tracing Evweb” (page 67).
Enabling Tracing using the EMT GUI
To enable tracing using the EMT GUI, complete the following steps:
1. Repeat steps 1-5 from “Launching EMT” (page 72).
NOTE: The Enable Tracing option is not displayed if tracing is already enabled. Instead,
the Disable Tracing and the Modify Tracing option are displayed.
DescriptionField
Displays the date when the message was logged in the error_log file.Date
Displays the time when the message was logged in the error_log file.Time
Displays the severity of the error.Trace level
Displays the IP address of the client system.IP address
Displays messages that are generated on the client system.Message
Displays the program that has generated the log.Address
2. Select Enable Tracing on the top right corner of the page.
The Enable Tracing page is displayed.
3. Set the trace level by selecting the level from the trace level list.
4. Select Enable Tracing.
The tracing level is set and a confirmation message is displayed.
5. Click OK on the confirmation message window.
Tracing EMT 77
Page 78

For more information about enabling tracing using the HP SMH GUI, select Help on the action
pane of the Enable Tracing page.
Enabling Tracing using the EMT CLI
To enable tracing using the EMT CLI, you must export the environment variable, EMTUI_TRACE.
To export EMTUI_TRACE, enter the following command at the HP-UX prompt:
# export EMTUI_TRACE=<trace value>
Tracing is now enabled. The trace value is the trace level that you want to set.
Modifying Tracing using the EMT GUI
To modify tracing the HP SMH GUI, complete the following steps:
1. Repeat steps 1-5 from “Launching EMT” (page 72).
NOTE: The Modify Tracing option is not displayed if tracing is not enabled.
2. Select Modify Tracing on the top right corner of the page.
The Modify Tracing page is displayed.
3. Change the trace level by selecting the level from the trace level list.
4. Select Modify Tracing.
The tracing level is modified and a confirmation message is displayed.
5. Click OK on the confirmation message window.
For more information about modifying tracing using the HP SMH GUI, select Help on the action
pane of the Modify Tracing page.
Modifying Tracing using the EMT CLI
To modify tracing using the EMT CLI, enter the following command at the HP-UX prompt:
# export EMT_TRACE_LEVEL=<new trace value>
Tracing is now modified. The new trace value is the trace level that you want to set.
Disabling Tracing using the EMT GUI
To disable tracing using the HP SMH GUI, complete the following steps:
1. Repeat steps 1-5 from “Launching EMT” (page 72).
NOTE: The Disable Tracing option is not displayed if tracing is not enabled.
2. Select Disable Tracing on the top right corner of the Simple Search page.
The tracing is disabled and a confirmation message is displayed.
3. Click OK on the confirmation message window.
For more information about disabling tracing using the HP SMH GUI, select Help on the action
pane of the Disable Tracing page.
Disabling Tracing using the EMT CLI
To disable tracing using the EMT CLI, you must reset the trace value. To reset the trace value, enter
the following command at the HP-UX prompt:
# unset EMT_TRACE_LEVEL
Tracing is now disabled.
NOTE: Tracing is automatically disabled at the end of an EMT session.
78 Administering indications and instances using HP SMH
Page 79

6 Troubleshooting SFM
This chapter describes how to troubleshoot SFM providers and EVWEB. This chapter addresses
the following topics:
• “Troubleshooting instance providers” (page 79)
• “Troubleshooting indication providers” (page 84)
• “Troubleshooting EVWEB” (page 89)
NOTE: For information on issues with oserrorlogd, see the Using PSB Components section of
the ProviderSvcsBase administrator guide.
Troubleshooting instance providers
This section describes techniques for troubleshooting instance providers, such as the CPU instance
provider, Memory instance provider, Filter Metadata (FMD) provider, and Environmental providers.
Table 18 Troubleshooting instance providers
not return any value.
Object Manager (CIMOM) is not
running.
SolutionCauseProblem
Enter the following command at the HP-UX prompt:Cause 1Requests for instances do
# ps -eaf | grep cimserverThe Common Information Model
If the name cimserver is displayed in the output,
the CIMOM is running properly. If cimserver is not
displayed in the output, stop the CIMOM by entering
the following command at the HP-UX prompt:
# cimserver -s
To restart the CIMOM, enter the following command
at the HP-UX prompt:
# cimserver
The provider is not registered
properly.
To register the provider, complete the following steps:Cause 2
1. Enter the following command at the HP-UX prompt:
# cimprovider -ls | grep
SFMProviderModule
2. If the following output is displayed, all the
providers are registered properly:
SFMProviderModule OK
3. If the output displayed is different from this output,
the provider module is not registered. To register
the provider module, enter the following command
at the HP-UX prompt:
# cimmof -nroot/PG_InterOp
/opt/sfm/schemas/mof/SFMProvidersR.mof
4. If no errors are displayed, the provider module is
registered successfully. Ignore this step and move
to step 6. If errors are displayed, restart the
CIMOM by entering the following commands at
the HP-UX prompt:
# cimserver -s
# cimserver
5. After the CIMOM restarts, follow the process from
the step 1 mentioned above.
6. After the provider module is registered, create a
link between the SFM providers and the CIMOM
Troubleshooting instance providers 79
Page 80

Table 18 Troubleshooting instance providers (continued)
SolutionCauseProblem
by entering the following command at the HP-UX
prompt:
On Itanium-based systems, enter:
# ln -s
/opt/sfm/lib/libsfmproviders.1\
/opt/wbem/providers/lib/libsfmproviders.so
On PA-RISC-based systems, enter:
# ln -s
/opt/sfm/lib/libsfmproviders.1\
/opt/wbem/providers/lib/libsfmproviders.sl
7. To check whether the link is created, enter the
following command at the /opt/wbem/
providers/lib directory:
# ls -l
Following is a sample output indicating that the
link is created:
On Itanium-based systems:
# lrwxr-xr-x 1 root sys 30 Jan 12
06:56 libsfmproviders.so ->
/opt/sfm/lib/libsfmproviders.1
On PA-RISC-based systems:
# lrwxr-xr-x 1 root sys 30 Jan 12
6:56 libsfmproviders.sl ->
/opt/sfm/lib/libsfmproviders.1
Cause 3
SFMProviderModule is not running.
If the link is already present, the following error
message appears:
# ln:
/opt/wbem/providers/lib/libsfmproviders.sl
exists
To check if SFMProviderModule is running, enter the
following command at the HP-UX prompt:
# cimprovider -ls
Following is a sample output of the command:
MODULE
STATUS
OperatingSystemModule OK
ComputerSystemModule OK
ProcessModule OK
IPProviderModule OK
SFMProviderModule
Degraded
If the status of SFMProviderModule is Degraded as
displayed in the given output, SFMProviderModule
is not running.
To enable SFMProviderModule, complete the
following steps:
1. Enter the following command at the HP-UX prompt
to disable SFMProviderModule:
# cimprovider –d –m
SFMProviderModule
2. Enter the following command at the HP-UX prompt
to enable SFMProviderModule:
# cimprovider –e –m
SFMProviderModule
80 Troubleshooting SFM
Page 81

Table 18 Troubleshooting instance providers (continued)
SolutionCauseProblem
Alternatively, you can enter the following
command at the HP-UX prompt to start
SFMProviderModule:
# sh /opt/sfm/bin/restart_sfm.sh
The logs to /var/opt/sfm/log/state.log
are written when SFM is in Degraded State and
is getting re-enabled by the script.
NOTE: The script restarts SFM only if
SFMProviderModule is in Degraded state.
3. Enter the following command at the HP-UX prompt
to check if the SFMProviderModule is running:
# cimprovider -ls
If the status of SFMProviderModule is OK,
SFMProviderModule is running properly.
Otherwise, repeat steps 1 to 3.
Table 19 Troubleshooting instance providers
Problem: The serial number and part number property of memory modules, or bulk power supplies are not available.
SolutionCause
Either or both of the following can be the
cause of this problem:
• These properties are not supported on
the system.
• The provider is not configured properly.
Complete the following steps to check whether the part number and serial
number are supported on the given system, and whether the provider is
configured properly:
1. Enter the following command at the HP-UX prompt:
# mstm
2. Select System in the product list.
3. Click Tools –> Information –> Run.
If the name of the property is displayed in the output, the property is
supported.
NOTE: Not all properties are supported on every supported system.
Table 20 Troubleshooting instance providers
Problem: Requests for instances do not return any value.
SolutionCauses
Enter the following command at the HP-UX prompt:Cause 1
# ps -eaf | grep cimserverThe Common Information Model Object
Manager (CIMOM) is not running.
If the name cimserver is displayed in the output, the CIMOM is
running properly. If cimserver is not displayed in the output, stop the
CIMOM by entering the following command at the HP-UX prompt:
# cimserver -s
To restart the CIMOM, enter the following command at the HP-UX
prompt:
# cimserver
The provider is not registered properly.
To register the provider, complete the following steps:Cause 2
1. Enter the following command at the HP-UX prompt:
# cimprovider -ls | grep SFMProviderModule
2. If the following output is displayed, all the providers are registered
properly:
SFMProviderModule OK
Troubleshooting instance providers 81
Page 82

Table 20 Troubleshooting instance providers (continued)
Problem: Requests for instances do not return any value.
SolutionCauses
3. If the output displayed is different from this output, the provider
module is not registered. To register the provider module, enter the
following command at the HP-UX prompt:
# cimmof -nroot/PG_InterOp
/opt/sfm/schemas/mof/SFMProvidersR.mof
4. If no errors are displayed, the provider module is registered
successfully. Ignore this step and move to step 6. If errors are
displayed, restart the CIMOM by entering the following commands
at the HP-UX prompt:
# cimserver -s
# cimserver
5. After the CIMOM restarts, follow the process from the step 1
mentioned above.
6. After the provider module is registered, create a link between the
SFM providers and the CIMOM by entering the following command
at the HP-UX prompt:
On Itanium-based systems, enter:
# ln -s /opt/sfm/lib/libsfmproviders.1\
/opt/wbem/providers/lib/libsfmproviders.so
On PA-RISC-based systems, enter:
# ln -s /opt/sfm/lib/libsfmproviders.1\
/opt/wbem/providers/lib/libsfmproviders.sl
7. To check whether the link is created, enter the following command
at the /opt/wbem/providers/lib directory:
# ls -l
Following is a sample output indicating that the link is created:
On Itanium-based systems:
# lrwxr-xr-x 1 root sys 30 Jan 12 06:56
libsfmproviders.so ->
/opt/sfm/lib/libsfmproviders.1
On PA-RISC-based systems:
# lrwxr-xr-x 1 root sys 30 Jan 12 6:56
libsfmproviders.sl ->
/opt/sfm/lib/libsfmproviders.1
Cause 3
SFMProviderModule is not running.
82 Troubleshooting SFM
If the link is already present, the following error message appears:
# ln: /opt/wbem/providers/lib/libsfmproviders.sl
exists
To check if SFMProviderModule is running, enter the following
command at the HP-UX prompt:
# cimprovider -ls
Following is a sample output of the command:
MODULE STATUS
OperatingSystemModule OK
ComputerSystemModule OK
ProcessModule OK
IPProviderModule OK
SFMProviderModule Degraded
If the status of SFMProviderModule is Degraded as displayed in the
given output, SFMProviderModule is not running.
To enable SFMProviderModule, complete the following steps:
Page 83

Table 20 Troubleshooting instance providers (continued)
Problem: Requests for instances do not return any value.
SolutionCauses
1. Enter the following command at the HP-UX prompt to disable
SFMProviderModule:
# cimprovider –d –m SFMProviderModule
2. Enter the following command at the HP-UX prompt to enable
SFMProviderModule:
# cimprovider –e –m SFMProviderModule
Alternatively, you can enter the following command at the HP-UX
prompt to start SFMProviderModule:
# sh /opt/sfm/bin/restart_sfm.sh
NOTE: The script restarts SFM only if SFMProviderModule is in
Degraded state.
3. Enter the following command at the HP-UX prompt to check if the
SFMProviderModule is running:
# cimprovider -ls
If the status of SFMProviderModule is OK, SFMProviderModule is
running properly. Otherwise, repeat steps 1 to 3.
Contact your HP support personnel to correct the problem.Cause 4
The cron job is not working.
Table 21 Troubleshooting instance providers
Problem: First request on systems does not return with required information immediately.
SolutionCause
Requested information is being collected.
The following message is displayed:
Inventory is being built
currently. Please try after some
time.
Wait a while, then request for the information again. providers respond
with requested information when information has been gathered.
Table 22 Troubleshooting instance providers
Problem: Indications fulfilling the conditions defined in the HP-Known HP-Defined filters, are not logged in the Event
Archive.
SolutionCause
The HP-Known filters and HP-Known
subscriptions have been deleted from
the CIMOM.
Create the following EnumerateInstances.xml file and save it in any
location:
<?xml version="1.0" encoding="utf-8"?>
<CIM CIMVERSION="2.0" DTDVERSION="2.0">
<MESSAGE ID="25000" PROTOCOLVERSION="1.0">
<SIMPLEREQ>
<IMETHODCALL NAME="EnumerateInstances">
<LOCALNAMESPACEPATH>
<NAMESPACE NAME="root"/>
<NAMESPACE NAME="cimv2"/>
</LOCALNAMESPACEPATH>
<IPARAMVALUE NAME="ClassName">
<CLASSNAME NAME="HP_KnownFilter"/>
</IPARAMVALUE>
</IMETHODCALL>
</SIMPLEREQ>
</MESSAGE>
</CIM>
Troubleshooting instance providers 83
Page 84

Table 22 Troubleshooting instance providers (continued)
Problem: Indications fulfilling the conditions defined in the HP-Known HP-Defined filters, are not logged in the Event
Archive.
SolutionCause
To execute the file, enter the following command at the HP-UX prompt:
# wbemexec <full path>/EnumerateInstances.xml
The full path is the absolute path of the EnumerateInstances.xml file.
This recreates HP-Known filters and HP-Known subscriptions in the CIMOM
repository, and the indications start logging in the Event Archive.
Troubleshooting indication providers
This section describes the techniques for troubleshooting the EMS Wrapper provider and the Event
Manager Common Information Model (EVM CIM) provider.
Table 23 Troubleshooting indication providers
Problem: Only two IPMI events are logged in the evweb eventviewer when sfmconfig -t -a command is used
to log test events.
SolutionCause
This occurs when there is an excessive usage of more than
90% of /var filesystem and oserrlogd stops writing into
osel files in the directory /var/opt/psb/oselogs.
To view test events to backbone, memory and processor,
reduce the usage of /var filesystem to less than 90% and
seed test events using sfmconfig -t -a command.
Table 24 Troubleshooting indication providers
Problem: Indications corresponding to events generated by the Event Monitoring Service (EMS) monitors, are not logged
in the Events List.
SolutionCauses
Enter the following command at the HP-UX prompt:Cause 1
# ps -eaf | grep cimserverCIMOM is not running.
If the name cimserver is displayed in the output, the CIMOM is running properly.
If cimserver is not displayed in the output, stop the CIMOM by entering the following
command at the HP-UX prompt:
# cimserver -s
To restart the CIMOM, enter the following command at the HP-UX prompt:
# cimserver
Cause 2
The provider module is not
registered. # cimprovider -l -s
To check whether the provider module is registered, and to check its status, enter
the following command at the HP-UX prompt:
MODULE STATUS
OperatingSystemModule OK
ComputerSystemModule OK
ProcessModule OK
IPProviderModule OK
SFMProviderModule Degraded
If the status displayed is not OK, the provider module is not registered properly.
To register the provider module, enter the following command at the HP-UX prompt:
# cimmof -nroot/PG_InterOp
/opt/sfm/schemas/mof/SFMProvidersR.mof
If no errors messages are displayed, the provider module is registered properly.
If errors are displayed, restart the CIMOM by entering the following commands
at the HP-UX prompt:
# cimserver -s
84 Troubleshooting SFM
Page 85

Table 24 Troubleshooting indication providers (continued)
Problem: Indications corresponding to events generated by the Event Monitoring Service (EMS) monitors, are not logged
in the Events List.
SolutionCauses
# cimserver
After the CIMOM restarts, enter the following command at the HP-UX prompt to
register the provider module:
# cimmof -nroot/PG_InterOp
/opt/sfm/schemas/mof/SFMProvidersR.mof
After the provider module is registered, create a link between the SFM providers
and the CIMOM by entering the following command at the HP-UX prompt:
On Itanium-based systems, enter:
# ln -s /opt/sfm/lib/libsfmproviders.1\
/opt/wbem/providers/lib/libsfmproviders.so
On PA-RISC-based systems, enter:
# ln -s /opt/sfm/lib/libsfmproviders.1\
/opt/wbem/providers/lib/libsfmproviders.sl
To check whether the link is created, enter the following command at the
/opt/wbem/providers/lib directory:
# ls -l
Following is a sample output indicating that the link is created:
On Itanium-based systems:
# lrwxr-xr-x 1 root sys 30 Jan 12 06:56 libsfmproviders.so
-> /opt/sfm/lib/libsfmproviders.1
On PA-RISC-based systems:
# lrwxr-xr-x 1 root sys 30 Jan 12 6:56 libsfmproviders.sl
-> /opt/sfm/lib/libsfmproviders.1
If the link is already present, the following error message appears:
# ln: /opt/wbem/providers/lib/libsfmproviders.sl exists
Cause 3
The provider is not registered
under the module. # cimprovider -l -m SFMProviderModule
To check whether the provider is registered under a module, enter the following
command at the HP-UX prompt:
The following sample output on Itanium-based systems indicates that the provider
is registered under the module:
HPUX_ControlProvider
FMDProvider
EMArchiveConsumer
EMEmailConsumer
TemperatureSensorInstanceProvider
CPUProvider
CPUStatusProvider
EMSWrapperProvider
SFMIndicationProvider
EventIndicationConsumer
MemoryProvider
MemoryStatusProvider
StateChangeIndicationProvider
ChassisProvider
CoolingStatusProvider
PowerStatusProvider
ThermalProvider
VoltageProvider
MPProvider
MPStatusProvider
FirmwareRevisionProvider
EMDProvider
WBEMToEMSConsumer
SubscriptionConfigAssociationProvider
Troubleshooting indication providers 85
Page 86

Table 24 Troubleshooting indication providers (continued)
Problem: Indications corresponding to events generated by the Event Monitoring Service (EMS) monitors, are not logged
in the Events List.
SolutionCauses
ThrottlingConfigInstanceProvider
HealthStateProvider
RecordLogProvider
CSChassisProvider
FRUProvider
MCAIndicationProvider
BladeProvider
BladeStatusProvider
EnclosureProvider
EnclosureStatusProvider
EvmCimProvider
NOTE: The following providers on Itanium-based systems, though registered, are
active only on a Blade system:
BladeProvider
BladeStatusProvider
EnclosureProvider
EnclosureStatusProvider
The following sample output on PA-RISC-based systems indicates that the provider
is registered under the module:
HPUX_ControlProvider
FMDProvider
EMArchiveConsumer
EMEmailConsumer
TemperatureSensorInstanceProvider
CPUProvider
CPUStatusProvider
EMSWrapperProvider
SFMIndicationProvider
EventIndicationConsumer
MemoryProvider
MemoryStatusProvider
StateChangeIndicationProvider
ChassisProvider
CoolingStatusProvider
PowerStatusProvider
ThermalProvider
VoltageProvider
MPProvider
MPStatusProvider
FirmwareRevisionProvider
EMDProvider
WBEMToEMSConsumer
SubscriptionConfigAssociationProvider
ThrottlingConfigInstanceProvider
HealthStateProvider
RecordLogProvider
CSChassisProvider
FRUProvider
EvmCimProvider
Cause 4
Subscriptions do not exist.
86 Troubleshooting SFM
Create the following enumerateInstances_sub.xml file and save it in any
location:
<?xml version="1.0" encoding="utf-8"?>
<CIM CIMVERSION="2.0" DTDVERSION="2.0">
<MESSAGE ID="25000" PROTOCOLVERSION="1.0">
<SIMPLEREQ>
<IMETHODCALL NAME="EnumerateInstances">
<LOCALNAMESPACEPATH>
<NAMESPACE NAME="root"/>
<NAMESPACE NAME="PG_InterOp"/>
</LOCALNAMESPACEPATH>
Page 87

Table 24 Troubleshooting indication providers (continued)
Problem: Indications corresponding to events generated by the Event Monitoring Service (EMS) monitors, are not logged
in the Events List.
SolutionCauses
<IPARAMVALUE NAME="ClassName">
<CLASSNAME NAME="CIM_IndicationSubscription"/>
</IPARAMVALUE>
</IMETHODCALL>
</SIMPLEREQ>
</MESSAGE>
</CIM>
To enumerate instances, enter the following command at the HP-UX prompt:
# wbemexec <full path>/enumerateInstances_sub.xml
The full path is the absolute path of the enumerateInstances_sub.xml file.
The output of this command indicates the presence of subscriptions, as shown in
the following sample output:
<INSTANCENAME CLASSNAME="CIM_IndicationFilter">
<KEYBINDING NAME="CreationClassName">
<KEYVALUE VALUETYPE="string">
CIM_IndicationFilter
</KEYVALUE>
</KEYBINDING>
<KEYBINDING NAME="Name">
<KEYVALUE VALUETYPE="string">
EventConsumerFilter
</KEYVALUE>
</KEYBINDING>
<KEYBINDING NAME="SystemCreationClassName">
<KEYVALUE VALUETYPE="string">
CIM_ComputerSystem
</KEYVALUE>
</KEYBINDING>
<KEYBINDING NAME="SystemName">
<KEYVALUE VALUETYPE="string">
hpdst348
</KEYVALUE>
</KEYBINDING>
</INSTANCENAME>
</VALUE.REFERENCE>
</KEYBINDING>
<KEYBINDING NAME="Handler">
<VALUE.REFERENCE>
<INSTANCENAME CLASSNAME="CIM_IndicationHandlerCIMXML">
<KEYBINDING NAME="CreationClassName">
<KEYVALUE VALUETYPE="string">
CIM_IndicationHandlerCIMXML
</KEYVALUE>
</KEYBINDING>
<KEYBINDING NAME="Name">
<KEYVALUE VALUETYPE="string">
EventConsumerHandler
</KEYVALUE>
</KEYBINDING>
<KEYBINDING NAME="SystemCreationClassName">
<KEYVALUE VALUETYPE="string">
CIM_ComputerSystem
</KEYVALUE>
</KEYBINDING>
<KEYBINDING NAME="SystemName">
<KEYVALUE VALUETYPE="string">
hpdst348
</KEYVALUE>
</KEYBINDING>
</INSTANCENAME>
</VALUE.REFERENCE>
Troubleshooting indication providers 87
Page 88

Table 24 Troubleshooting indication providers (continued)
Problem: Indications corresponding to events generated by the Event Monitoring Service (EMS) monitors, are not logged
in the Events List.
SolutionCauses
</KEYBINDING>
</INSTANCENAME>
Cause 5
The indication providers are not
loaded properly.
To check if the indication providers are loaded properly, complete the following
steps :
1. Open the /var/opt/sfm/conf/FMLoggerConfig.xml file.
2. Using an editor, change the severity of logs from WARNING to
INFORMATIONAL.
3. Enter the /opt/sfm/bin/sfmconfig command with the
/var/opt/sfm/conf/FMLoggerConfig.xml option:
# /opt/sfm/bin/sfmconfig -c
/var/opt/sfm/conf/FMLoggerConfig.xml
4. Enter the following command to generate a sample indication:
# /etc/opt/resmon/lbin/send_test_event <monitor_name>
For example:
# /etc/opt/resmon/lbin/send_test_event disk_em
Events generated by the disk_em monitor are translated into indications and
reported to the CMS. You can view these indications in the Events List.
NOTE: You can create sample indications using only those monitors that are
supported on your system. For the list of monitors supported on your system,
see the EMS Wrapper provider Data Sheet posted at: http://www.hp.com/
go/hpux-diagnostics-docs
5. Open the /var/opt/sfm/log/sfm.log file.
NOTE: The /var/opt/sfm/log/sfm.log file is the file specified in the
Target field of the FMLoggerConfig.xml file.
Following is an example of how the sfm.log file is displayed when you change
the logging level to INFORMATIONAL, indicating that the provider is loaded
properly:
04/19/04 03:36:32 EMSWrapper INFORMATIONAL 9596 Using port 49173
04/19/04 03:36:32 EMSWrapper INFORMATIONAL 9596 provider Enabled
04/19/04 03:38:03 EMSWrapper INFORMATIONAL 9599 Registration
for
/storage/events/disks/default/0_0_0_2_0.6.0 Accepted. RequestID
: 63700993
04/19/04 03:38:03 EMSWrapper INFORMATIONAL 9599 Registration
for
/system/events/chassis/chassis_log Accepted. RequestID : 64552961
04/19/04 03:38:03 EMSWrapper INFORMATIONAL 9599 Registration
for
/system/events/core_hw/core_hw Accepted.
RequestID : 65404929
Use the information available in the file to analyze the problem.
6. When you complete testing, revert to the default severity settings in the
FMLoggerConfig.xmlfile using a text editor. If you do not revert to the default
settings, the logs consume more disk space.
Cause 6
SFMProviderModule is not running.
88 Troubleshooting SFM
To check if SFMProviderModule is running, enter the following command at the
HP-UX prompt:
# cimprovider -ls
Following is a sample output of the command:
MODULE STATUS
OperatingSystemModule OK
ComputerSystemModule OK
ProcessModule OK
IPProviderModule OK
SFMProviderModule Degraded
Page 89

Table 24 Troubleshooting indication providers (continued)
Problem: Indications corresponding to events generated by the Event Monitoring Service (EMS) monitors, are not logged
in the Events List.
SolutionCauses
If the status of SFMProviderModule is Degraded as displayed in the given output,
SFMProviderModule is not running.
To enable SFMProviderModule, complete the following steps:
1. Enter the following command at the HP-UX prompt to disable
SFMProviderModule:
# cimprovider –d –m SFMProviderModule
2. Enter the following command at the HP-UX prompt to enable
SFMProviderModule:
# cimprovider –e –m SFMProviderModule
Alternatively, you can run the following script at the HP-UX prompt to start
SFMProviderModule:
# sh /opt/sfm/bin/restart_sfm.sh
NOTE: The script restarts SFM only if SFMProviderModule is in Degraded
state.
3. Enter the following command at the HP-UX prompt to check if the
SFMProviderModule is running:
# cimprovider -ls
If the status of SFMProviderModule is OK, SFMProviderModule is running
properly. Otherwise, repeat steps 1 to 3.
Troubleshooting EVWEB
Table 25 Troubleshooting EVWEB
While you are deleting an
event stored in the Event
Archive, the following
error message is
displayed:
An error occurred
while deleting the
event.
While you are accessing
an event from the Event
Archive, either of the
following errors are
displayed:
Could not fetch the
details of the
events.
The connection to
the database could
not be established.
EVWEB is unable to
delete an event from the
Event Archive. The Event
Archive Database
service is not running
properly.
You receive the first
message, if EVWEB is
unable to access the
details of an event stored
in the Event Archive. The
second message
indicates that the
EVWEB is unable to
establish a connection
with the Event Archive.
SolutionCauseProblem
To check the status of the Event Archive Database service, enter
the following command at the HP-UX prompt:
# ps -eaf | grep sfmdb
If the output of this command is sfmdb, the Event Archive
Database service is running.
If the Event Archive Database service has stopped, enter the
following command at the HP-UX prompt to start the service:
On Itanium # /sbin/init.d/psbdb start
On PA-RISC # /sbin/init.d/sfmdb start
If the Event Archive Database service is running and the problem
persists, check for error logs in the
/var/opt/sfm/log/sfm.log file. For further assistance,
contact the HP support center.
To check the status of the Event Archive Database service, enter
the following command at the HP-UX prompt:
# ps -eaf | grep sfmdb
If the output of this command is sfmdb, the Event Archive
Database service is running properly.
If the Event Archive Database service is stopped, enter the
following command at the HP-UX prompt to start the service:
On Itanium # /sbin/init.d/psbdb start
On PA-RISC # /sbin/init.d/sfmdb start
Troubleshooting EVWEB 89
Page 90

Table 25 Troubleshooting EVWEB (continued)
SolutionCauseProblem
WBEM Indications are not
logged in to the Event
Archive.
The Event Archive
Database service is not
running properly. /var/opt/sfm/log/sfm.log file. For further assistance,
Cause 1
SFMProviderModule is
not running.
If the Event Archive Database service is running and the problem
persists, check for error logs in the
contact the HP support center.
To check if SFMProviderModule is running, enter the following
command at the HP-UX prompt:
# cimprovider -ls
Following is a sample output of the command:
MODULE STATUS
OperatingSystemModule OK
ComputerSystemModule OK
ProcessModule OK
IPProviderModule OK
SFMProviderModule Degraded
If the status of SFMProviderModule is Degraded as displayed in
the given output, SFMProviderModule is not running.
To enable SFMProviderModule, complete the following steps:
1. Enter the following command at the HP-UX prompt to disable
SFMProviderModule:
# cimprovider –d –m SFMProviderModule
2. Enter the following command at the HP-UX prompt to enable
SFMProviderModule:
# cimprovider –e –m SFMProviderModule
Alternatively, you can run the following script at the HP-UX
prompt to start SFMProviderModule:
# sh /opt/sfm/bin/restart_sfm.sh
NOTE: The script restarts SFM only if SFMProviderModule
is in Degraded state.
3. Enter the following command at the HP-UX prompt to check
if the SFMProviderModule is running:
# cimprovider -ls
If the status of SFMProviderModule is OK, SFMProviderModule
is running properly. Otherwise, repeat steps 1 to 3.
WBEM Indications are not
mailed to your email
address.
90 Troubleshooting SFM
Cause 2
Event mails are blocked
as SPAM mails because
the sender address of
event mails,
evweb@hp.com, is not
allowed to send a mail
in your different domain
network.
SFMProviderModule is
not running.
If you still encounter the same issue, check for error logs in the
/var/opt/sfm/log/sfm.log file. For further assistance,
contact the HP support center.
Change the sender address defined in
/var/opt/sfm/conf/evweb.conf to suit your domain.
Enter the following command at the HP-UX prompt:
# /opt/sfm/bin/sfmconfig -c
/var/opt/sfm/conf/evweb.conf
To check if SFMProviderModule is running, enter the following
command at the HP-UX prompt:
# cimprovider -ls
Following is a sample output of the command:
MODULE STATUS
OperatingSystemModule OK
ComputerSystemModule OK
ProcessModule OK
Page 91

Table 25 Troubleshooting EVWEB (continued)
SolutionCauseProblem
IPProviderModule OK
SFMProviderModule Degraded
If the status of SFMProviderModule is Degraded as displayed in
the given output, SFMProviderModule is not running.
To enable SFMProviderModule, complete the following steps:
1. Enter the following command at the HP-UX prompt to disable
SFMProviderModule:
# cimprovider –d –m SFMProviderModule
2. Enter the following command at the HP-UX prompt to enable
SFMProviderModule:
# cimprovider –e –m SFMProviderModule
Alternatively, you can run the following script at the HP-UX
prompt to start SFMProviderModule:
# sh /opt/sfm/bin/restart_sfm.sh
NOTE: The script restarts SFM only if SFMProviderModule
is in Degraded state.
3. Enter the following command at the HP-UX prompt to check
if the SFMProviderModule is running:
# cimprovider -ls
If the status of SFMProviderModule is OK, SFMProviderModule
is running properly. Otherwise, repeat steps 1 to 3.
The response time for a
command used to view
indications from the Event
Archive is long.
What is "su: + tty??
root-sfmdb" only once
logged in syslog.log?
The locale on your
system is set to a
language other than
English.
/sbin/rc2.d/S550psbdb
(IA) or
/sbin/rc2.d/S550sfmdb
(PA), runs at the system
start-up, the su command
is issued in the script to
launch a postmaster
process as the sfmdb
user. "+" in the message
indicates the su attempt
is successful (if "-" is
present instead of "+", it
indicates the attempt
fails).
This message is
harmless, it does not
indicate a problem with
the installation
If you still encounter the same issue, check for error logs in the
/var/opt/sfm/log/sfm.log file. For further assistance,
contact the HP support center.
To improve performance of the Event Viewer, set the locale to
English.
You can safely ignore this message.When the startup script,
Both EMS and SFM log
the same symptom in the
syslog.
The syslog functionality
is available from SFM
To disable EMS logging events to syslog, complete the following
steps:
Troubleshooting EVWEB 91
Page 92

Table 25 Troubleshooting EVWEB (continued)
SolutionCauseProblem
Version C.06.00.07.01,
September 2009
release, to provide a
summary of event
information of critical
and serious events. The
default subscription to
syslog
HP_defaultSyslog is
configured. When events
with major or critical
levels are detected at
SFM diag mode, an
event is sent to the EMS
framework through the
WBEM Wrapper
Monitor or the EMS
Wrapper Monitor. EMS
is configured to log
events with Major
Warning, Serious or
Critical severity levels to
the syslog. Even after
switching to the EMS
mode, the same
behavior occurs.
1. Delete the monitoring request using monconfig. Enter the
following command to delete the monitoring request:
# /etc/opt/resmon/lbin/monconfig
2. Select the delete option to delete the request.
(D)elete a monitoring request
3. The current monitor configuration is:
1) Send events generated by all monitors
with severity >= MAJOR WARNING to SYSLOG
2) Send events generated by all monitors
with severity >= INFORMATION to TEXTLOG
/var/opt/resmon/log/event.log
3) Send events generated by all monitors
with severity >= MAJOR WARNING to EMAIL root
4) Send events generated by monitors
/storage/events/disks/default
with severity > CRITICAL to SNMP
5) Send events generated by monitors
/storage/events/disks/default
with severity > MAJOR WARNING to SNMP
6) Send events generated by monitors
/system/events/ipmi_fpl
with severity = CRITICAL to SNMP
with comment:
no
7) Send events generated by monitors
/system/events/memory_ia64
/system/events/system_status
with severity = CRITICAL to SNMP
The OpCmsg notification
is not available in SFM
SFM does not provide
the same functionality as
EMS
Enter number of monitoring request to delete
{(Q)uit,(H)elp} 1
4. Enter 1 to delete events with MAJOR WARNING severity.
5. To disable the email facility from EMS, delete the following
monitoring request using monconfig:
3) Send events generated by all monitors
with severity >= MAJOR WARNING to EMAIL
root
Install HP Operations Manager Software for UNIX agent (HTTPS)
on HP-UX. Configure a policy used by HTTPS agent to monitor
WBEM indications logged in syslog as follows:
MMM DD HH:MM:SS xxxxx CIM Indication (default
format):ProviderName =
SEL02_IndicationProvider, PerceivedSeverity =
2, EventID = 103
MMM DD HH:MM:SS xxxxx CIM Indication (default
format):EventID = 8, PerceivedSeverity = 2,
ProviderName = StateChangeIndicationProvider
For more information, see the HP Operations Manager Software
for UNIX documentation.
For the property order logged in syslog, see “ Syslog property
order” (page 120)
92 Troubleshooting SFM
Page 93

A EMT Message Definition
Following is a sample EMT Message file:
$ Descriptor Header begins
$ <> DescriptorID=0000023100000010800000AA006D2EA3
$ <> ProductName = myProduct
$ <> ProductID = ID
$ <> ProductEmailAlias=myproduct@abc.com
$ <> OrgName = myorg
$ <> OrgType = ISV
$ <> Subsystem={(Type=EMS, Name= dm_chassis),(Type=WBEM, Name=FileSystemProvider)}
$ <> ProductCategory=Kernel
$ <> MsgCat={ID=1,(Path=./ lvmcommonmessages.cat, Locale= ja_JP.utf8)}
$ <> IncludeSets={1}
$ <> Version = hpux1131
$ <> HeaderEnd
$set 1
$ <> Summary Reference=1/1/8
$ <> Severity= Major
$ <> Keyword = CPU_STOP
$ <> Platform=Orca_IA,Orca_PA
$ <> Cause={(ID=1, Reference=1/1/1), (ID=2, Reference=1/1/2)}
$ <> Action={(ID=1, Reference=1/1/1)}
$ <> Cause_Action={(CauseID=1, ActionID={1}), (CauseID=2, ActionID={1})}
1 This is a warning message.
Table 26 lists the tags used in the EMT Message file, their description, and usage.
Table 26 EMT Message File Description
DescriptionID
ProductName
ProductEmailAlias
ProductID
Subsystem
A unique identifier for an EMT Message file.
You can obtain the Descriptor ID from the
EMT registration site. Every EMT Message
file must have a Descriptor ID.
Specify the product name that is provided
during the registration process. Every EMT
Message file must have a product name.
Specify an e-mail address that can be used
by HP to communicate with you. E-mail
address of the product owner must be
specified.
Specify the product ID obtained during the
registration process.
Specify the type of organization.OrgType
Specify the name of your organization.OrgName
Provide a type and name for a subsystem.
Following are the subsystem types and their
corresponding names:
• WBEM – provider Name
• EVM – Poster Name
• EMS – Monitor Name
• NETTL – Subsystem ID
You must specify at least one subsystem type
and name.
UsageDescriptionTag
DescriptorID=
0000023100000010800000AA006D2EA3
ProductName=myProduct
ProductEmailAlias=myproduct@hp.com
ProductID = ID
OrgType=IHV
OrgName = organizationName
Subsystem={(Type=EMS, Name=
dm_chassis), (Type=WBEM,
Name=FileSystemProvider)}
93
Page 94

Table 26 EMT Message File Description (continued)
UsageDescriptionTag
ProductCategory
MsgCat
IncludeSets
Version
Summary
Specify one or more of the following product
categories that best describes your product:
• Hardware
• Network
• IO
• Kernel
• Commands
• Others
Specify a list of message catalogs. The
MsgCat tag has the following attribute:
ID – A unique number used to identify an
error message.
Specify a number or a set of numbers
associated with the error message.
Specify the version number of the product.
The version number is mandatory.
Marks the end of the header.HeaderEnd
Specify the reference to the catalog file,
which contains the summary for the error
message. For example, if you specify
Summary Reference=2/3/5, the string from
catalog Id=2, set Id=3, and message Id=5
is read.
ProductCategory=
Kernel,IO,Network
MsgCat={(ID=1,
Path=../../../bin/cat/en_US.iso88591/module1.cat,LocaleName=
en_US.utf8),(Path=../../../bin/cat/en_US.iso88591/module2.cat,Locale=
ja_JP.utf8)}
IncludeSets={1-4,5,7,8-11}
Version=HPUX1131
HeaderEnd
Summary Reference=2/3/5
Platform
Cause
Action
Cause_Action
Specify a keyword for the error.Keyword
Specify severity of the message.Severity
Specify the platform to which the error
message is associated with. You cannot
share error metadata across platforms.
Specify the cause for an error. The Cause
tag is mandatory and has the following
attributes:
• ID – A unique number used to identify
the cause of an error.
• Reference – Points to another error
message, which is the cause for the
current error message.
Specify the corrective action for an error.
The Action tag is mandatory and has the
following attributes:
• ID – A unique number used to identify
the corrective action for an error.
• Reference – Points to another error
message, which has the same corrective
action as that of the current error.
Used to associate a cause with an action for
a specific error message. The Cause_Action
tag is mandatory if there is more than one
cause and at least one corrective action for
a given error message. However, if there is
Keyword = CPU_STOP
Severity=4
Platform=Generic
Cause={(ID=1, Reference=1/1/1), (ID=2,
Reference=2/3/8), (ID=3, Reference=2/4/6),
(ID=4, Reference=2/4/12)}
Action={(ID=1, Reference=1/3/3), (ID=2,
Reference=3/2/7), (ID=3, Reference=2/2/5),
(ID=4, Reference=2/2/16)}
Cause_Action={(CauseID=1,
ActionID={1,2}), (CauseID=2, ActionID=3),
(CauseID=3, ActionID={2,3})}
94 EMT Message Definition
Page 95

Table 26 EMT Message File Description (continued)
only one cause and one or more corrective
action for a given error message, the Action
tags are associated with the Cause tag. In
such a situation, the Cause_Action tag is not
mandatory. For any error, a cause can be
specified without specifying the corrective
action. However, a corrective action cannot
be specified without specifying a cause.
WBEMDetail
Specify WBEM specific details of a
message. The WBEMDetail tag is mandatory
if one of the subsystems specified in the
Header is of type WBEM. The WBEMDetail
tag has the following attributes:
• EventID – This ID must be unique within
a WBEM provider.
• AlertType – The value ranges from 1 to
8.
• ProbableCause – The value ranges from
0 to130.
• EventCategory – The value ranges from
0 to 46.
• OtherSeverity – Required only if Severity
= 1, else it can be omitted.
• OtherAlertType – Required only if
AlertType = 1, else it can be omitted.
• OtherEventCategory – Required only if
EventCategory = 1, else it can be
omitted.
UsageDescriptionTag
WBEMDetail EventID=123, AlertType=1,
ProbableCause=7,
EventCategory=21,OtherAlertType=”My own alert
type”OtherSeverity=”My own
Severity”OtherEventCategory=”My own category”
MonitorDetail
EVMDetail
NETTLDetail
Specify the details of a message pertaining
to EMS Monitor. The MonitorDetail tag is
mandatory if one of the subsystems specified
in the Header is of type MonitorDetail. For
error messages that are generated by EMS
Monitors or the EMS framework, the
MonitorDetail tag must not be used.
Specify the details of a message pertaining
to EVM. The EVMDetail tag is mandatory if
one of the subsystems specified in the
Header is of type EVM.
Specify the details of a message pertaining
to NETTL. The NETTLDetail tag is mandatory
if one of the subsystems specified in the
Header is of type NETTL.
Monitordetail EventNumber=123
EVMDetail
EVMName=sys.unix.filesystem
NETTLDetail
ErrorID=7,Severity=Information
95
Page 96

B Interpretation of HP SMH instances
This appendix describes the fields and enables you to interpret the instances in the HP SMH property
pages. It addresses the following topics:
• “Processor instances” (page 97)
• “Memory instances” (page 98)
• “System Summary instances” (page 101)
• “Cooling Device instances” (page 103)
• “Power supply instances” (page 104)
• “Temperature instances” (page 105)
• “Voltage instances” (page 106)
• “FRU Information instances” (page 107)
• “Management Processor instances” (page 108)
• “Firmware Information instances” (page 109)
• “Enclosure Information instances” (page 110)
• “Complex-wide Info instances” (page 111)
• “Cell Board instances” (page 113)
• “Partition Information instances” (page 115)
• “Blade instances” (page 117)
• “Cell Blade instances” (page 118)
• “Launch the Onboard Administrator” (page 119)
96 Interpretation of HP SMH instances
Page 97

Processor instances
This section describes the processor instances.
Figure 20 Sample Processors property page
Table 27 (page 97) describes the fields and enables you to interpret the values displayed in
Figure 20 (page 97).
Table 27 Description of the Processors Fields and Values
DescriptionFields and Values
Status
Location
Indicates the status of the processors. An OK status indicates that all the processors are
functioning properly. Click Events to see the details of the errors.
Identifies an instance of the device.Device ID
Indicates the physical position of the processor.Tag
Indicates the location of the processor. Attributes such as Cabinet Number, Cell Slot, and Slot
Number help narrow down the location of the processor.
Indicates the type of the processor.Processor Type
Indicates the processor architecture revision.Architecture Revision
Indicates the ID of the processor firmware.Firmware ID
Indicates the processor data bus width.Processor Capability
Indicates the processor speed in MHz.Processor Speed
Identifies an instance of the device.HashID
Processor instances 97
Page 98

Memory instances
This section describes the memory instances.
Figure 21 Sample Memory property page
Table 28 (page 98) and Table 29 (page 99) describes the fields and enables you to interpret the
values displayed in Figure 21 (page 98).
Table 28 Description of the Memory Slots Fields and Values
DescriptionFields and Values
Status
Location
98 Interpretation of HP SMH instances
Indicates the status of the memory module. An OK status indicates that all the modules are
configured properly. If the status of the memory module indicates an error, click Events to see
the details of the errors.
Indicates the location of the memory. Attributes such as Cabinet Number, Cell Slot, and DIMM
Slot help narrow down the location of the memory module.
Indicates the capacity of the memory.Size
Indicates the type of the module.Module Type
Indicates the type of the memory.Memory Type
Indicates the serial number of the memory.Serial Number
Page 99

Table 28 Description of the Memory Slots Fields and Values (continued)
DescriptionFields and Values
Indicates the part number of the memory.Part Number
Identifies an instance of the device.HashID
Table 29 Description of the Empty Slots Fields and Values
DescriptionFields and Values
Location
Indicates the location of the memory. Attributes such as Cabinet Number, Cell Slot, and DIMM
Slot help narrow down the location of the memory module.
Helps narrow down the memory module location by indicating the slot number.Location Identifiers
Indicates the physical position of the memory module.Physical Position
Identifies an instance of the device.HashID
Figure 22 Sample Memory property page on HP Superdome 2
Table 30 (page 99) describes the fields and enables you to interpret the values displayed in
Figure 22 (page 99).
Table 30 Description of the Memory Slots Fields and Values
DescriptionFields and Values
Logical memory information
Indicates the URL to launch the nPartition information page on the OA.Partition Management
Indicates the total available memory in the current system.Total Available
Memory
Memory instances 99
Page 100

Table 30 Description of the Memory Slots Fields and Values (continued)
DescriptionFields and Values
Logical memory information
Physical memory information
Indicates the URL to launch the blade information page on the OA.Device Bay
Information
NOTE: Memory information displayed is as viewed from a hard partition (nPar).
100 Interpretation of HP SMH instances
 Loading...