

HP StorageWorks 16-EL, StorageWorks 2/16, StorageWorks 8B, StorageWorks Fabric OS 3.1.x Reference Manual
Page 1

reference
guide
hp StorageWorks
diagnostic and system error
messages version 3.1.x
Product Version: 3.1.x
First Edition (July 2003)
Part Number: AA-RUPZA-TE
This reference guide lists Fabric OS diagnostic and system error messages. The probable cause
and recommended course of action is provided for each message.
Page 2

© 2003 Hewlett-Packard Development Company, L.P.
Hewlett-Packard Company makes no warranty of any kind with regard to this material, including, but not limited to,
the implied warranties of merchantability and fitness for a particular purpose. Hewlett-Packard shall not be liable for
errors contained herein or for incidental or consequential damages in connection with the furnishing, performance,
or use of this material.
This document contains proprietary information, which is protected by copyright. No part of this document may be
photocopied, reproduced, or translated into another language without the prior written consent of Hewlett-Packard.
The information contained in this document is subject to change without notice.
UNIX® is a registered trademark of The Open Group.
Hewlett-Packard Company shall not be liable for technical or editorial errors or omissions contained herein. The
information is provided “as is” without warranty of any kind and is subject to change without notice. The warranties
for Hewlett-Packard Company products are set forth in the express limited warranty statements for such products.
Nothing herein should be construed as constituting an additional warranty.
Printed in the U.S.A.
Diagnostic and System Error Messages Version 3.1.x Reference Guide
First Edition (July 2003)
Part Number: AA-RUPZA-TE
Page 3

contents
About this Guide. . . . . . . . . . . . . . . . . . . . . . . . . . . . . . . . . . . . . . . . . . . . . . . . . . . .9
Audience. . . . . . . . . . . . . . . . . . . . . . . . . . . . . . . . . . . . . . . . . . . . . . . . . . . . . . . . . . . . . . . . . . 9
Related Documentation . . . . . . . . . . . . . . . . . . . . . . . . . . . . . . . . . . . . . . . . . . . . . . . . . . . . . . 9
Conventions . . . . . . . . . . . . . . . . . . . . . . . . . . . . . . . . . . . . . . . . . . . . . . . . . . . . . . . . . . . . . . 10
Document Conventions . . . . . . . . . . . . . . . . . . . . . . . . . . . . . . . . . . . . . . . . . . . . . . . . . . 10
Text Symbols . . . . . . . . . . . . . . . . . . . . . . . . . . . . . . . . . . . . . . . . . . . . . . . . . . . . . . . . . . 10
Getting Help . . . . . . . . . . . . . . . . . . . . . . . . . . . . . . . . . . . . . . . . . . . . . . . . . . . . . . . . . . . . . . 11
HP Technical Support . . . . . . . . . . . . . . . . . . . . . . . . . . . . . . . . . . . . . . . . . . . . . . . . . . . 11
HP Storage Website . . . . . . . . . . . . . . . . . . . . . . . . . . . . . . . . . . . . . . . . . . . . . . . . . . . . . 11
HP Authorized Reseller . . . . . . . . . . . . . . . . . . . . . . . . . . . . . . . . . . . . . . . . . . . . . . . . . . 12
1 Introduction to System Error Messages. . . . . . . . . . . . . . . . . . . . . . . . . . . . . . . . . . .13
Error Message Severity Levels. . . . . . . . . . . . . . . . . . . . . . . . . . . . . . . . . . . . . . . . . . . . . . . . 13
Overview of System Logs . . . . . . . . . . . . . . . . . . . . . . . . . . . . . . . . . . . . . . . . . . . . . . . . . . . 15
System Error Log . . . . . . . . . . . . . . . . . . . . . . . . . . . . . . . . . . . . . . . . . . . . . . . . . . . . . . . 16
Syslogd Daemon . . . . . . . . . . . . . . . . . . . . . . . . . . . . . . . . . . . . . . . . . . . . . . . . . . . . . . . 16
Port Logs . . . . . . . . . . . . . . . . . . . . . . . . . . . . . . . . . . . . . . . . . . . . . . . . . . . . . . . . . . . . . 17
System Console . . . . . . . . . . . . . . . . . . . . . . . . . . . . . . . . . . . . . . . . . . . . . . . . . . . . . . . . 17
View or Configure System Logs . . . . . . . . . . . . . . . . . . . . . . . . . . . . . . . . . . . . . . . . . . . . . . 17
Reading a System Error Message. . . . . . . . . . . . . . . . . . . . . . . . . . . . . . . . . . . . . . . . . . . . . . 19
Viewing System Error Messages from Advanced Web Tools. . . . . . . . . . . . . . . . . . . . . 19
Displaying the Error Log without Page Breaks . . . . . . . . . . . . . . . . . . . . . . . . . . . . . . . . 19
Displaying the Error Log with Page Breaks . . . . . . . . . . . . . . . . . . . . . . . . . . . . . . . . . . 20
Clearing the Switch Error Log. . . . . . . . . . . . . . . . . . . . . . . . . . . . . . . . . . . . . . . . . . . . . 21
Sample Error Log Message . . . . . . . . . . . . . . . . . . . . . . . . . . . . . . . . . . . . . . . . . . . . . . . 21
Responding to a System Error Message. . . . . . . . . . . . . . . . . . . . . . . . . . . . . . . . . . . . . . . . . 22
Looking Up an Error Message. . . . . . . . . . . . . . . . . . . . . . . . . . . . . . . . . . . . . . . . . . . . . 22
Gathering Information About the Problem . . . . . . . . . . . . . . . . . . . . . . . . . . . . . . . . . . . 23
Common Responses. . . . . . . . . . . . . . . . . . . . . . . . . . . . . . . . . . . . . . . . . . . . . . . . . . . . . 24
Contents
3Diagnostic and System Error Messages Version 3.1.x Reference Guide
Page 4

Contents
2 System Error Messages . . . . . . . . . . . . . . . . . . . . . . . . . . . . . . . . . . . . . . . . . . . . . .25
AS_ System Error Messages . . . . . . . . . . . . . . . . . . . . . . . . . . . . . . . . . . . . . . . . . . . . . . . . . 26
AS-CTMALLOC . . . . . . . . . . . . . . . . . . . . . . . . . . . . . . . . . . . . . . . . . . . . . . . . . . . . . . . 26
Bloom_System Error Messages . . . . . . . . . . . . . . . . . . . . . . . . . . . . . . . . . . . . . . . . . . . . . . . 27
BLOOM-BAD_ID . . . . . . . . . . . . . . . . . . . . . . . . . . . . . . . . . . . . . . . . . . . . . . . . . . . . . . 27
BLOOM-BUF_RECLAIMED. . . . . . . . . . . . . . . . . . . . . . . . . . . . . . . . . . . . . . . . . . . . . 27
BLOOM-MINI_BUFFER . . . . . . . . . . . . . . . . . . . . . . . . . . . . . . . . . . . . . . . . . . . . . . . . 28
BLOOM-NO_BUFFERS. . . . . . . . . . . . . . . . . . . . . . . . . . . . . . . . . . . . . . . . . . . . . . . . . 28
BLOOM-RAMINIT_TO . . . . . . . . . . . . . . . . . . . . . . . . . . . . . . . . . . . . . . . . . . . . . . . . . 29
BLOOM-STUCK_WAIT . . . . . . . . . . . . . . . . . . . . . . . . . . . . . . . . . . . . . . . . . . . . . . . . 29
ERRLOG_System Error Messages. . . . . . . . . . . . . . . . . . . . . . . . . . . . . . . . . . . . . . . . . . . . . 31
ERRLOG-LOGCLRD . . . . . . . . . . . . . . . . . . . . . . . . . . . . . . . . . . . . . . . . . . . . . . . . . . . 31
ERRLOG-NV_DISABLE . . . . . . . . . . . . . . . . . . . . . . . . . . . . . . . . . . . . . . . . . . . . . . . . 31
ERRLOG-NV_LOG_CLRD . . . . . . . . . . . . . . . . . . . . . . . . . . . . . . . . . . . . . . . . . . . . . . 32
ERRLOG-NV_LOG_RESIZE. . . . . . . . . . . . . . . . . . . . . . . . . . . . . . . . . . . . . . . . . . . . . 32
ERRLOG-SET_MSG_SAVE_LVL . . . . . . . . . . . . . . . . . . . . . . . . . . . . . . . . . . . . . . . . 33
FABRIC_System Error Messages . . . . . . . . . . . . . . . . . . . . . . . . . . . . . . . . . . . . . . . . . . . . . 34
FABRIC-ASYNC . . . . . . . . . . . . . . . . . . . . . . . . . . . . . . . . . . . . . . . . . . . . . . . . . . . . . . 34
FABRIC-NO_ALIASID . . . . . . . . . . . . . . . . . . . . . . . . . . . . . . . . . . . . . . . . . . . . . . . . . 34
FABRIC-SEGMENTED . . . . . . . . . . . . . . . . . . . . . . . . . . . . . . . . . . . . . . . . . . . . . . . . . 35
FABRIC-SIZE_EXCEEDED . . . . . . . . . . . . . . . . . . . . . . . . . . . . . . . . . . . . . . . . . . . . . 35
FABRIC-WEBTOOL_DISABLE . . . . . . . . . . . . . . . . . . . . . . . . . . . . . . . . . . . . . . . . . . 36
FABRIC-WEBTOOL_LIFE . . . . . . . . . . . . . . . . . . . . . . . . . . . . . . . . . . . . . . . . . . . . . . 36
FCIU_System Error Messages . . . . . . . . . . . . . . . . . . . . . . . . . . . . . . . . . . . . . . . . . . . . . . . . 38
FCIU-IUBAD. . . . . . . . . . . . . . . . . . . . . . . . . . . . . . . . . . . . . . . . . . . . . . . . . . . . . . . . . . 38
FCIU-IUCOUNT . . . . . . . . . . . . . . . . . . . . . . . . . . . . . . . . . . . . . . . . . . . . . . . . . . . . . . . 39
FCP_System Error Messages . . . . . . . . . . . . . . . . . . . . . . . . . . . . . . . . . . . . . . . . . . . . . . . . . 40
FCP-PROBE_TIMEOUT . . . . . . . . . . . . . . . . . . . . . . . . . . . . . . . . . . . . . . . . . . . . . . . . 40
FCPH_System Error Messages. . . . . . . . . . . . . . . . . . . . . . . . . . . . . . . . . . . . . . . . . . . . . . . . 41
FCPH-EXCHBAD . . . . . . . . . . . . . . . . . . . . . . . . . . . . . . . . . . . . . . . . . . . . . . . . . . . . . . 41
FCPH-EXCHFREE . . . . . . . . . . . . . . . . . . . . . . . . . . . . . . . . . . . . . . . . . . . . . . . . . . . . . 42
FLOOD_System Error Messages . . . . . . . . . . . . . . . . . . . . . . . . . . . . . . . . . . . . . . . . . . . . . . 44
FLOOD-INVLSR. . . . . . . . . . . . . . . . . . . . . . . . . . . . . . . . . . . . . . . . . . . . . . . . . . . . . . . 44
FLOOD-LINKCNT . . . . . . . . . . . . . . . . . . . . . . . . . . . . . . . . . . . . . . . . . . . . . . . . . . . . . 44
FSPF_System Error Messages . . . . . . . . . . . . . . . . . . . . . . . . . . . . . . . . . . . . . . . . . . . . . . . . 46
FSPF-INPORT. . . . . . . . . . . . . . . . . . . . . . . . . . . . . . . . . . . . . . . . . . . . . . . . . . . . . . . . . 46
FSPF-NBRCHANGE. . . . . . . . . . . . . . . . . . . . . . . . . . . . . . . . . . . . . . . . . . . . . . . . . . . . 46
FSPF-REMDOMAIN . . . . . . . . . . . . . . . . . . . . . . . . . . . . . . . . . . . . . . . . . . . . . . . . . . . 47
4 Diagnostic and System Error Messages Version 3.1.x Reference Guide
Page 5

Contents
FSPF-SCN . . . . . . . . . . . . . . . . . . . . . . . . . . . . . . . . . . . . . . . . . . . . . . . . . . . . . . . . . . . . 47
FSPF-SECTION. . . . . . . . . . . . . . . . . . . . . . . . . . . . . . . . . . . . . . . . . . . . . . . . . . . . . . . . 48
FSPF-VERSION . . . . . . . . . . . . . . . . . . . . . . . . . . . . . . . . . . . . . . . . . . . . . . . . . . . . . . . 48
HLO_System Error Messages . . . . . . . . . . . . . . . . . . . . . . . . . . . . . . . . . . . . . . . . . . . . . . . . 50
HLO-DEADTIMEOUT. . . . . . . . . . . . . . . . . . . . . . . . . . . . . . . . . . . . . . . . . . . . . . . . . . 50
HLO-HLOTIMEOUT . . . . . . . . . . . . . . . . . . . . . . . . . . . . . . . . . . . . . . . . . . . . . . . . . . . 51
HLO-INVHLO. . . . . . . . . . . . . . . . . . . . . . . . . . . . . . . . . . . . . . . . . . . . . . . . . . . . . . . . . 51
LSDB_System Error Messages . . . . . . . . . . . . . . . . . . . . . . . . . . . . . . . . . . . . . . . . . . . . . . . 53
LSDB-LSID . . . . . . . . . . . . . . . . . . . . . . . . . . . . . . . . . . . . . . . . . . . . . . . . . . . . . . . . . . . 53
LSDB-MAXINCARN . . . . . . . . . . . . . . . . . . . . . . . . . . . . . . . . . . . . . . . . . . . . . . . . . . . 53
LSDB-NOLOCALENTRY . . . . . . . . . . . . . . . . . . . . . . . . . . . . . . . . . . . . . . . . . . . . . . . 54
LSDB-NOLSR . . . . . . . . . . . . . . . . . . . . . . . . . . . . . . . . . . . . . . . . . . . . . . . . . . . . . . . . . 54
MCAST_System Error Messages. . . . . . . . . . . . . . . . . . . . . . . . . . . . . . . . . . . . . . . . . . . . . . 55
MCAST-ADDBRANCH . . . . . . . . . . . . . . . . . . . . . . . . . . . . . . . . . . . . . . . . . . . . . . . . . 55
MCAST-ADDPORT . . . . . . . . . . . . . . . . . . . . . . . . . . . . . . . . . . . . . . . . . . . . . . . . . . . . 55
MCAST-REMPORT . . . . . . . . . . . . . . . . . . . . . . . . . . . . . . . . . . . . . . . . . . . . . . . . . . . . 56
MPATH_System Error Messages. . . . . . . . . . . . . . . . . . . . . . . . . . . . . . . . . . . . . . . . . . . . . . 57
MPATH-NOPARENT. . . . . . . . . . . . . . . . . . . . . . . . . . . . . . . . . . . . . . . . . . . . . . . . . . . 57
MPATH-NOPARENTLSR . . . . . . . . . . . . . . . . . . . . . . . . . . . . . . . . . . . . . . . . . . . . . . . 57
MPATH-UNREACHABLE. . . . . . . . . . . . . . . . . . . . . . . . . . . . . . . . . . . . . . . . . . . . . . . 58
MQ_System Error Messages . . . . . . . . . . . . . . . . . . . . . . . . . . . . . . . . . . . . . . . . . . . . . . . . . 59
MQ-MSGTYPE . . . . . . . . . . . . . . . . . . . . . . . . . . . . . . . . . . . . . . . . . . . . . . . . . . . . . . . . 59
MQ-QREAD . . . . . . . . . . . . . . . . . . . . . . . . . . . . . . . . . . . . . . . . . . . . . . . . . . . . . . . . . . 60
MQ-QTHR . . . . . . . . . . . . . . . . . . . . . . . . . . . . . . . . . . . . . . . . . . . . . . . . . . . . . . . . . . . . 63
MQ-QWRITE . . . . . . . . . . . . . . . . . . . . . . . . . . . . . . . . . . . . . . . . . . . . . . . . . . . . . . . . . 64
MS_System Error Messages. . . . . . . . . . . . . . . . . . . . . . . . . . . . . . . . . . . . . . . . . . . . . . . . . . 65
MS-INVALID_CTRESP . . . . . . . . . . . . . . . . . . . . . . . . . . . . . . . . . . . . . . . . . . . . . . . . . 65
MS-OUT_RESOURCES . . . . . . . . . . . . . . . . . . . . . . . . . . . . . . . . . . . . . . . . . . . . . . . . . 66
MS-PLDBSEG. . . . . . . . . . . . . . . . . . . . . . . . . . . . . . . . . . . . . . . . . . . . . . . . . . . . . . . . . 66
MS-PLSTATE . . . . . . . . . . . . . . . . . . . . . . . . . . . . . . . . . . . . . . . . . . . . . . . . . . . . . . . . . 68
MS-RCSFAILED. . . . . . . . . . . . . . . . . . . . . . . . . . . . . . . . . . . . . . . . . . . . . . . . . . . . . . . 69
MS-TIME_OUT. . . . . . . . . . . . . . . . . . . . . . . . . . . . . . . . . . . . . . . . . . . . . . . . . . . . . . . . 70
MS-UNEXPECTED_IUDATASZ . . . . . . . . . . . . . . . . . . . . . . . . . . . . . . . . . . . . . . . . . 70
MS-UNSTABLE_DCOUNT . . . . . . . . . . . . . . . . . . . . . . . . . . . . . . . . . . . . . . . . . . . . . . 71
MS-UNSTABLE_FABRIC . . . . . . . . . . . . . . . . . . . . . . . . . . . . . . . . . . . . . . . . . . . . . . . 71
NBFSM_System Error Messages. . . . . . . . . . . . . . . . . . . . . . . . . . . . . . . . . . . . . . . . . . . . . . 73
NBFSM-DUPEPORTSCN . . . . . . . . . . . . . . . . . . . . . . . . . . . . . . . . . . . . . . . . . . . . . . . 73
NBFSM-NGBRSTATE . . . . . . . . . . . . . . . . . . . . . . . . . . . . . . . . . . . . . . . . . . . . . . . . . . 74
5Diagnostic and System Error Messages Version 3.1.x Reference Guide
Page 6

Contents
NBFSM-XMITFLAG . . . . . . . . . . . . . . . . . . . . . . . . . . . . . . . . . . . . . . . . . . . . . . . . . . . 74
PS_System Error Messages . . . . . . . . . . . . . . . . . . . . . . . . . . . . . . . . . . . . . . . . . . . . . . . . . . 75
PS-ASSERT. . . . . . . . . . . . . . . . . . . . . . . . . . . . . . . . . . . . . . . . . . . . . . . . . . . . . . . . . . . 75
PS-MALLOC. . . . . . . . . . . . . . . . . . . . . . . . . . . . . . . . . . . . . . . . . . . . . . . . . . . . . . . . . . 75
PS-TASKCREATE . . . . . . . . . . . . . . . . . . . . . . . . . . . . . . . . . . . . . . . . . . . . . . . . . . . . . 76
RAPID_System Error Messages. . . . . . . . . . . . . . . . . . . . . . . . . . . . . . . . . . . . . . . . . . . . . . . 77
RAPID-AUTH_ERR . . . . . . . . . . . . . . . . . . . . . . . . . . . . . . . . . . . . . . . . . . . . . . . . . . . . 77
RCS_System Error Messages. . . . . . . . . . . . . . . . . . . . . . . . . . . . . . . . . . . . . . . . . . . . . . . . . 78
RCS-APP_NOTREG . . . . . . . . . . . . . . . . . . . . . . . . . . . . . . . . . . . . . . . . . . . . . . . . . . . . 78
RCS-LOCAL_REJECT . . . . . . . . . . . . . . . . . . . . . . . . . . . . . . . . . . . . . . . . . . . . . . . . . . 78
RCS-RCSENABLED. . . . . . . . . . . . . . . . . . . . . . . . . . . . . . . . . . . . . . . . . . . . . . . . . . . . 79
RCS-RCSENOMEM . . . . . . . . . . . . . . . . . . . . . . . . . . . . . . . . . . . . . . . . . . . . . . . . . . . . 79
RCS-RCSDISABLED . . . . . . . . . . . . . . . . . . . . . . . . . . . . . . . . . . . . . . . . . . . . . . . . . . . 80
RTWR_System Error Messages. . . . . . . . . . . . . . . . . . . . . . . . . . . . . . . . . . . . . . . . . . . . . . . 81
RTWR-FAILED. . . . . . . . . . . . . . . . . . . . . . . . . . . . . . . . . . . . . . . . . . . . . . . . . . . . . . . . 81
RTWR-TRANSMIT . . . . . . . . . . . . . . . . . . . . . . . . . . . . . . . . . . . . . . . . . . . . . . . . . . . . 84
SEC_System Error Messages . . . . . . . . . . . . . . . . . . . . . . . . . . . . . . . . . . . . . . . . . . . . . . . . . 85
SEC-RSENDFAIL . . . . . . . . . . . . . . . . . . . . . . . . . . . . . . . . . . . . . . . . . . . . . . . . . . . . . . 85
SEC-SECDBFAIL . . . . . . . . . . . . . . . . . . . . . . . . . . . . . . . . . . . . . . . . . . . . . . . . . . . . . . 86
SEC-SECDLFAIL . . . . . . . . . . . . . . . . . . . . . . . . . . . . . . . . . . . . . . . . . . . . . . . . . . . . . . 86
SEC-SECINFO . . . . . . . . . . . . . . . . . . . . . . . . . . . . . . . . . . . . . . . . . . . . . . . . . . . . . . . . 87
SEC-SECINFORM . . . . . . . . . . . . . . . . . . . . . . . . . . . . . . . . . . . . . . . . . . . . . . . . . . . . . 87
SEC-SEC_STATS . . . . . . . . . . . . . . . . . . . . . . . . . . . . . . . . . . . . . . . . . . . . . . . . . . . . . . 88
SEC-SECVIOL_API . . . . . . . . . . . . . . . . . . . . . . . . . . . . . . . . . . . . . . . . . . . . . . . . . . . . 89
SEC-SECVIOL_HTTP . . . . . . . . . . . . . . . . . . . . . . . . . . . . . . . . . . . . . . . . . . . . . . . . . . 89
SEC-SECVIOL_TELNET. . . . . . . . . . . . . . . . . . . . . . . . . . . . . . . . . . . . . . . . . . . . . . . . 90
SECLIB_System Error Messages. . . . . . . . . . . . . . . . . . . . . . . . . . . . . . . . . . . . . . . . . . . . . . 91
SECLIB-SECVIOL_DCC . . . . . . . . . . . . . . . . . . . . . . . . . . . . . . . . . . . . . . . . . . . . . . . . 91
SECLIB-SECVIOL_LOGIN_API. . . . . . . . . . . . . . . . . . . . . . . . . . . . . . . . . . . . . . . . . . 92
SECLIB-SECVIOL_LOGIN_HTTP . . . . . . . . . . . . . . . . . . . . . . . . . . . . . . . . . . . . . . . . 92
SECLIB-SECVIOL_LOGIN_MODEM . . . . . . . . . . . . . . . . . . . . . . . . . . . . . . . . . . . . . 93
SECLIB-SECVIOL_LOGIN_REMOTE. . . . . . . . . . . . . . . . . . . . . . . . . . . . . . . . . . . . . 94
SECLIB-SECVIOL_LOGIN_SERIAL . . . . . . . . . . . . . . . . . . . . . . . . . . . . . . . . . . . . . . 95
SECLIB-SECVIOL_MSaccess . . . . . . . . . . . . . . . . . . . . . . . . . . . . . . . . . . . . . . . . . . . . 96
SECLIB-SECVIOL_MSfwrd . . . . . . . . . . . . . . . . . . . . . . . . . . . . . . . . . . . . . . . . . . . . . 97
SECLIB-SECVIOL_MSop . . . . . . . . . . . . . . . . . . . . . . . . . . . . . . . . . . . . . . . . . . . . . . . 97
SECLIB-SECVIOL_RSNMP . . . . . . . . . . . . . . . . . . . . . . . . . . . . . . . . . . . . . . . . . . . . . 98
SECLIB-SECVIOL_SCC . . . . . . . . . . . . . . . . . . . . . . . . . . . . . . . . . . . . . . . . . . . . . . . . 98
6 Diagnostic and System Error Messages Version 3.1.x Reference Guide
Page 7

Contents
SECLIB-SECVIOL_WSNMP. . . . . . . . . . . . . . . . . . . . . . . . . . . . . . . . . . . . . . . . . . . . . 99
SLAP_System Error Messages. . . . . . . . . . . . . . . . . . . . . . . . . . . . . . . . . . . . . . . . . . . . . . . 100
SLAP_CERTCHECKFAIL . . . . . . . . . . . . . . . . . . . . . . . . . . . . . . . . . . . . . . . . . . . . . . 100
SLAP_MALLOCFAIL . . . . . . . . . . . . . . . . . . . . . . . . . . . . . . . . . . . . . . . . . . . . . . . . . 100
SLAP_SECPOLICYINIT . . . . . . . . . . . . . . . . . . . . . . . . . . . . . . . . . . . . . . . . . . . . . . . 101
SLAP_SIGNCHECKFAIL . . . . . . . . . . . . . . . . . . . . . . . . . . . . . . . . . . . . . . . . . . . . . . 101
SLAP_WWNCHECKFAIL. . . . . . . . . . . . . . . . . . . . . . . . . . . . . . . . . . . . . . . . . . . . . . 102
SWITCH_System Error Messages . . . . . . . . . . . . . . . . . . . . . . . . . . . . . . . . . . . . . . . . . . . . 103
SWITCH-SECVIOL_DCC . . . . . . . . . . . . . . . . . . . . . . . . . . . . . . . . . . . . . . . . . . . . . . 103
TRACK_System Error Messages. . . . . . . . . . . . . . . . . . . . . . . . . . . . . . . . . . . . . . . . . . . . . 104
TRACK-CONFIG_CHANGE . . . . . . . . . . . . . . . . . . . . . . . . . . . . . . . . . . . . . . . . . . . . 104
TRACK-FAILED_LOGIN . . . . . . . . . . . . . . . . . . . . . . . . . . . . . . . . . . . . . . . . . . . . . . 106
TRACK-LOGIN . . . . . . . . . . . . . . . . . . . . . . . . . . . . . . . . . . . . . . . . . . . . . . . . . . . . . . 106
TRACK-LOGOUT . . . . . . . . . . . . . . . . . . . . . . . . . . . . . . . . . . . . . . . . . . . . . . . . . . . . 107
TRACK-TRACK_OFF . . . . . . . . . . . . . . . . . . . . . . . . . . . . . . . . . . . . . . . . . . . . . . . . . 107
TRACK-TRACK_ON . . . . . . . . . . . . . . . . . . . . . . . . . . . . . . . . . . . . . . . . . . . . . . . . . . 108
TS_System Error Messages . . . . . . . . . . . . . . . . . . . . . . . . . . . . . . . . . . . . . . . . . . . . . . . . . 109
TS-CLKSVRERR . . . . . . . . . . . . . . . . . . . . . . . . . . . . . . . . . . . . . . . . . . . . . . . . . . . . . 109
TS-NTPQFAIL . . . . . . . . . . . . . . . . . . . . . . . . . . . . . . . . . . . . . . . . . . . . . . . . . . . . . . . 109
TS-TSINFO . . . . . . . . . . . . . . . . . . . . . . . . . . . . . . . . . . . . . . . . . . . . . . . . . . . . . . . . . . 110
TS-TS_SVR_ERRCODE_EXITS . . . . . . . . . . . . . . . . . . . . . . . . . . . . . . . . . . . . . . . . . 111
TS-TSSVREXITS . . . . . . . . . . . . . . . . . . . . . . . . . . . . . . . . . . . . . . . . . . . . . . . . . . . . . 111
UCAST_System Error Messages . . . . . . . . . . . . . . . . . . . . . . . . . . . . . . . . . . . . . . . . . . . . . 112
UCAST-DOUBLEPATH. . . . . . . . . . . . . . . . . . . . . . . . . . . . . . . . . . . . . . . . . . . . . . . . 112
UPATH_System Error Messages . . . . . . . . . . . . . . . . . . . . . . . . . . . . . . . . . . . . . . . . . . . . . 113
UPATH-UNREACHABLE . . . . . . . . . . . . . . . . . . . . . . . . . . . . . . . . . . . . . . . . . . . . . . 113
ZONE_System Error Messages . . . . . . . . . . . . . . . . . . . . . . . . . . . . . . . . . . . . . . . . . . . . . . 114
ZONE-DUPLICATE_ENTRY . . . . . . . . . . . . . . . . . . . . . . . . . . . . . . . . . . . . . . . . . . . 114
ZONE-ENFORCEMIX . . . . . . . . . . . . . . . . . . . . . . . . . . . . . . . . . . . . . . . . . . . . . . . . . 115
ZONE-INCORRECT_FA_CONFIG . . . . . . . . . . . . . . . . . . . . . . . . . . . . . . . . . . . . . . . 116
ZONE-INCORRECT_ENFORCEMENT . . . . . . . . . . . . . . . . . . . . . . . . . . . . . . . . . . . 116
ZONE-INSUFF_PID_COUNT . . . . . . . . . . . . . . . . . . . . . . . . . . . . . . . . . . . . . . . . . . . 117
ZONE-IOCTLFAIL . . . . . . . . . . . . . . . . . . . . . . . . . . . . . . . . . . . . . . . . . . . . . . . . . . . . 117
ZONE-NOLICENSE . . . . . . . . . . . . . . . . . . . . . . . . . . . . . . . . . . . . . . . . . . . . . . . . . . . 118
ZONE-PORT_OUT_OF_RANGE . . . . . . . . . . . . . . . . . . . . . . . . . . . . . . . . . . . . . . . . 118
ZONE-SOFTZONING. . . . . . . . . . . . . . . . . . . . . . . . . . . . . . . . . . . . . . . . . . . . . . . . . . 119
ZONE-TRANSCOMMIT . . . . . . . . . . . . . . . . . . . . . . . . . . . . . . . . . . . . . . . . . . . . . . . 120
ZONE-WWNINPORT. . . . . . . . . . . . . . . . . . . . . . . . . . . . . . . . . . . . . . . . . . . . . . . . . . 120
7Diagnostic and System Error Messages Version 3.1.x Reference Guide
Page 8

Contents
ZONE-WWNSPOOF. . . . . . . . . . . . . . . . . . . . . . . . . . . . . . . . . . . . . . . . . . . . . . . . . . . 121
ZONE-WWNZONECHECK . . . . . . . . . . . . . . . . . . . . . . . . . . . . . . . . . . . . . . . . . . . . . 121
ZONE-ZONEGROUPADDFAIL . . . . . . . . . . . . . . . . . . . . . . . . . . . . . . . . . . . . . . . . . 122
A Error Message Tables . . . . . . . . . . . . . . . . . . . . . . . . . . . . . . . . . . . . . . . . . . . . . .123
All Messages. . . . . . . . . . . . . . . . . . . . . . . . . . . . . . . . . . . . . . . . . . . . . . . . . . . . . . . . . . . . . 123
Panic-Level Messages . . . . . . . . . . . . . . . . . . . . . . . . . . . . . . . . . . . . . . . . . . . . . . . . . . . . . 128
Critical-Level Messages . . . . . . . . . . . . . . . . . . . . . . . . . . . . . . . . . . . . . . . . . . . . . . . . . . . . 128
Error-Level Messages. . . . . . . . . . . . . . . . . . . . . . . . . . . . . . . . . . . . . . . . . . . . . . . . . . . . . . 129
Warning-Level Messages . . . . . . . . . . . . . . . . . . . . . . . . . . . . . . . . . . . . . . . . . . . . . . . . . . . 131
Informational-Level Messages . . . . . . . . . . . . . . . . . . . . . . . . . . . . . . . . . . . . . . . . . . . . . . . 133
Debug-Level Messages. . . . . . . . . . . . . . . . . . . . . . . . . . . . . . . . . . . . . . . . . . . . . . . . . . . . . 134
Index . . . . . . . . . . . . . . . . . . . . . . . . . . . . . . . . . . . . . . . . . . . . . . . . . . . . . . . . . .137
Figures
1 Error log without page breaks . . . . . . . . . . . . . . . . . . . . . . . . . . . . . . . . . . . . . . . . . . . . . 20
2 Error log with page breaks . . . . . . . . . . . . . . . . . . . . . . . . . . . . . . . . . . . . . . . . . . . . . . . . 21
3 Sample error log message . . . . . . . . . . . . . . . . . . . . . . . . . . . . . . . . . . . . . . . . . . . . . . . . 21
Tables
1 Text Conventions . . . . . . . . . . . . . . . . . . . . . . . . . . . . . . . . . . . . . . . . . . . . . . . . . . . . . . . 10
2 Error Message Severity Levels . . . . . . . . . . . . . . . . . . . . . . . . . . . . . . . . . . . . . . . . . . . . 15
3 Commands to View or Configure System Logs . . . . . . . . . . . . . . . . . . . . . . . . . . . . . . . 17
4 Error Message Field Description . . . . . . . . . . . . . . . . . . . . . . . . . . . . . . . . . . . . . . . . . . . 22
5 Alphabetical List of Messages . . . . . . . . . . . . . . . . . . . . . . . . . . . . . . . . . . . . . . . . . . . . 123
6 Panic-Level Error Messages . . . . . . . . . . . . . . . . . . . . . . . . . . . . . . . . . . . . . . . . . . . . . 128
7 Critical-Level Error Messages . . . . . . . . . . . . . . . . . . . . . . . . . . . . . . . . . . . . . . . . . . . . 129
8 Error-Level Error Messages. . . . . . . . . . . . . . . . . . . . . . . . . . . . . . . . . . . . . . . . . . . . . . 129
9 Warning-Level Error Messages . . . . . . . . . . . . . . . . . . . . . . . . . . . . . . . . . . . . . . . . . . . 131
10 Informational-Level Messages. . . . . . . . . . . . . . . . . . . . . . . . . . . . . . . . . . . . . . . . . . . . 133
11 Debug-Level Messages . . . . . . . . . . . . . . . . . . . . . . . . . . . . . . . . . . . . . . . . . . . . . . . . . 134
8 Diagnostic and System Error Messages Version 3.1.x Reference Guide
Page 9

about this
guide
This reference guide provides comprehensive information to help you administer,
operate, maintain, and troubleshoot your Storage Area Network (SAN) switch and
your SAN.
The major topics discussed in this chapter are:
■ Audience on page 9
■ Related Documentation on page 9
■ Conventions on page 10
■ Getting Help on page 11
Audience
This reference guide is intended for use by systems administrators and technicians
experienced with networking, Fibre Channel, and SAN technologies.
Related Documentation
For a list of related documents included with this product, see the “Related
Documents” section of the Release Notes that came with this product.
About this Guide
About this Guide
For the latest information, documentation, and firmware releases, visit the HP
StorageWorks website:
To access the technical documentation:
— Locate the networked storage section of the Web page.
—Under networked storage, go to the by type subsection.
— Click SAN infrastructure. The SAN infrastructure page displays.
— Locate the fibre channel switches section.
http://www.hp.com/country/us/eng/prodserv/storage.html
.
9Diagnostic and System Error Messages Version 3.1.x Reference Guide
Page 10
About this Guide
— Click the appropriate product name. The product overview page
displays. Go to the product information section.
— Click technical documents.
For information about Fibre Channel standards, visit the Fibre Channel Industry
Association website, located at
Conventions
Conventions consist of Document Conventions and Text Symbols.
Document Conventions
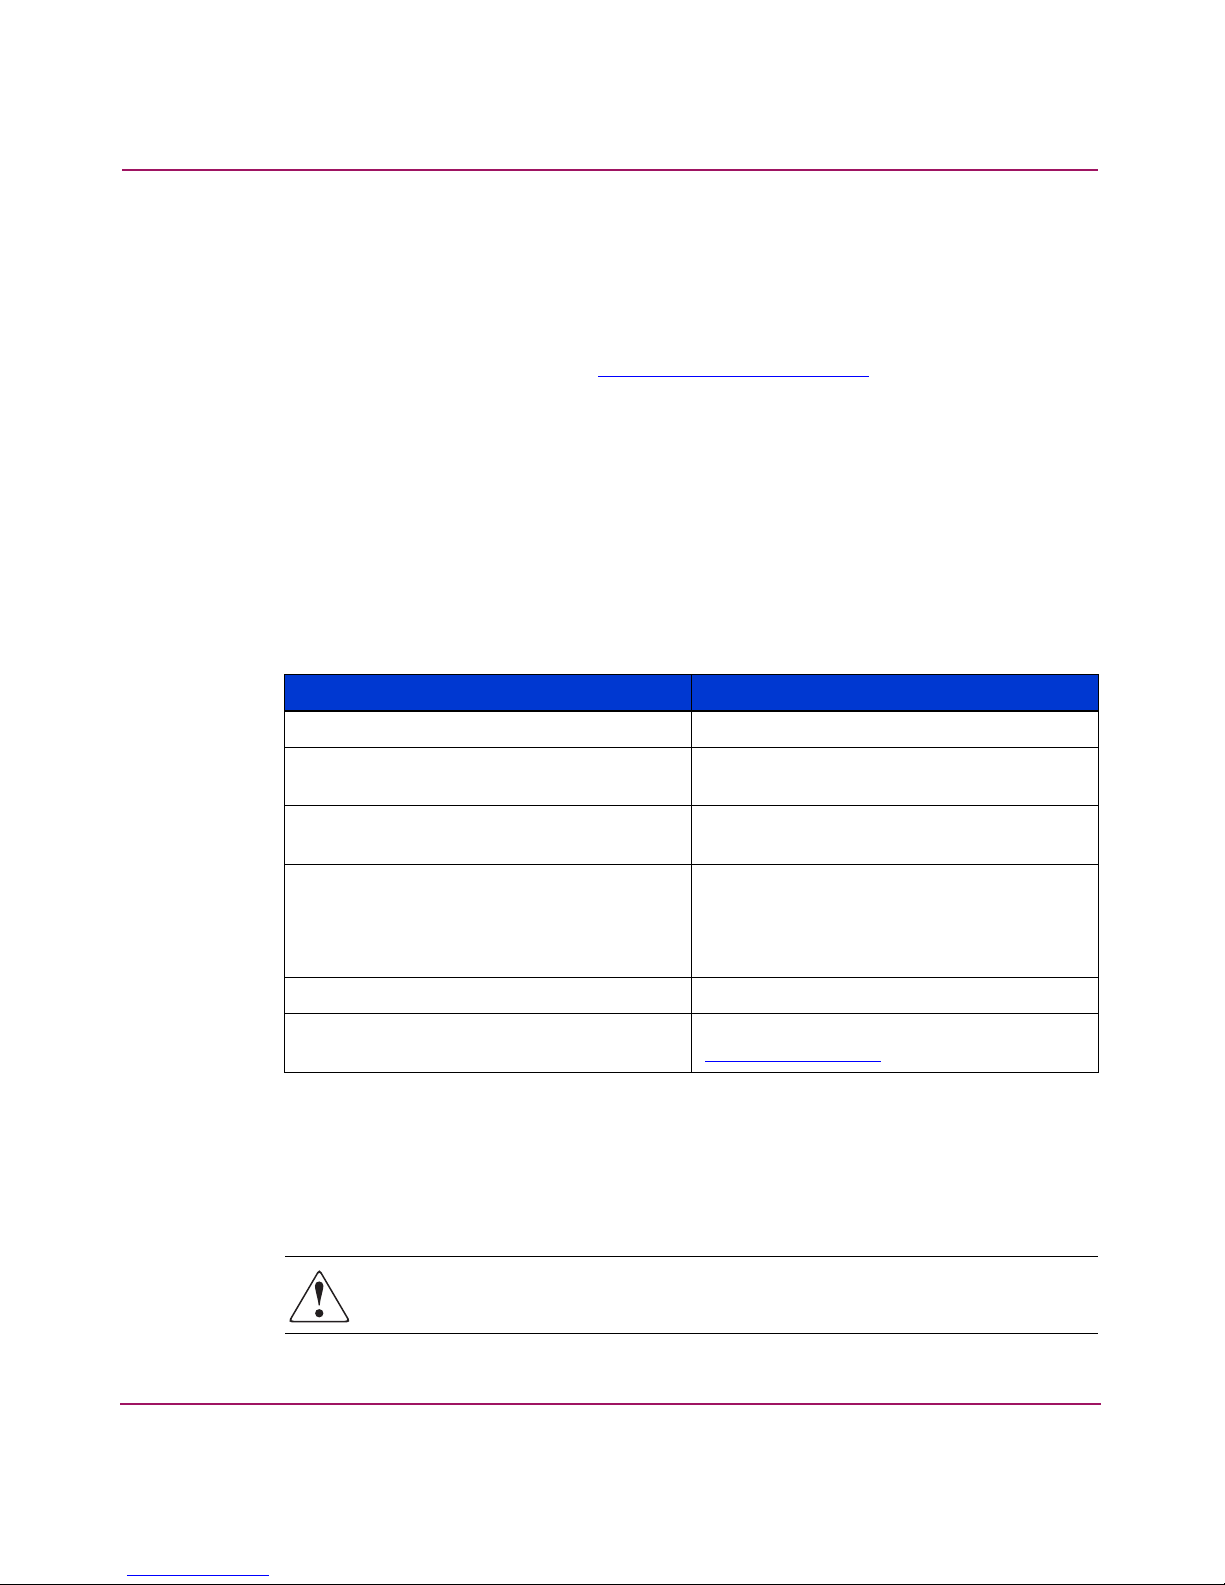
The text conventions used in this document are specified in Tab le 1.
Table 1: Text Conventions
Cross-reference links Blue text: Figure 1
http://www.fibrechannel.org
Element Convention
.
Text Symbols
Key and field names, menu items,
buttons, and dialog box titles
File names, application names, and text
emphasis
User input, command and directory
names, and system responses (output
and messages)
Variables <monospace, italic font>
Website addresses Blue, underlined sans serif font text:
Bold
Italics
Monospace font
COMMAND NAMES are uppercase
monospace font unless they are case
sensitive
http://www.hp.com
The following symbols may be found in the text of this guide. They have the
following meanings.
WARNING: Text set off in this manner indicates that failure to follow
directions in the warning could result in bodily harm or death.
10 Diagnostic and System Error Messages Version 3.1.x Reference Guide
Page 11

Caution: Text set off in this manner indicates that failure to follow directions
could result in damage to equipment or data.
Note: Text set off in this manner presents commentary, sidelights, or interesting points
of information.
Getting Help
For answers to questions not covered in this document, contact an HP authorized
service provider or access our website:
HP Technical Support
Telephone numbers for worldwide technical support are listed on the HP website:
http://www .hp.com/support/
About this Guide
http://www.hp.com
.
. From this website, select the country of origin.
Note: For continuous quality improvement, calls may be recorded or monitored.
Be sure to have the following information available before calling:
■ Technical support registration number (if applicable)
■ Product serial numbers
■ Product model names and numbers
■ Applicable error messages
■ Operating system type and revision level
■ Detailed, specific questions
HP Storage Website
The HP website has the latest information on this product, as well as the latest
drivers. Access storage at:
storage .html
http://www .hp.com/country/us/eng/prodserv/
. From this website, select the appropriate product or solution.
Diagnostic and System Error Messages Version 3.1.x Reference Guide
11
Page 12

About this Guide
HP Authorized Reseller
For the name of your nearest HP authorized reseller:
■ In the United States, call 1-800-345-1518
■ In Canada, call 1-800-263-5868
■ Elsewhere, see the HP website for locations and telephone numbers:
http://www .hp .com
.
12 Diagnostic and System Error Messages Version 3.1.x Reference Guide
Page 13

Introduction to System Error
Messages
This book supports Fabric OS version 3.1.x and contains diagnostic and system
error messages, with recommended responses to the messages. Error messages are
arranged alphabetically, first by module and then by individual message. A typical
module contains multiple error messages. Each error message description consists
of the following:
■ The message text
■ An explanation of the message or its probable cause
■ A recommended user response
■ The message’s severity level.
There may be more than one cause and more than one recommended course of
action for any given message. This document provides the most probable cause
and recommends the typically most beneficial response.
This chapter provides an introduction to the error log system and consists of the
following major topics:
1
■ Error Message Severity Levels on page 13
■ Overview of System Logs on page 15
■ View or Configure System Logs on page 17
■ Reading a System Error Message on page 19
■ Responding to a System Error Message on page 22
Error Message Severity Levels
There are six levels of severity, ranging from 0 (panic) to 5 (debug). The
definitions of the severity levels are quite general and should be used as guidelines
for troubleshooting. In each case, you should thoroughly assess each error log
description before taking a recovery action.
13Diagnostic and System Error Messages Version 3.1.x Reference Guide
Page 14

Introduction to System Error Messages
If you have any questions, collect the applicable data and then contact technical
support for further clarification.
Telephone numbers for worldwide technical support are listed on the HP website:
http://www .hp.com/support/
The severity levels are specified in Tab le 2 .
. From this website, select the country of origin.
14 Diagnostic and System Error Messages Version 3.1.x Reference Guide
Page 15

Introduction to System Error Messages
Table 2: Error Message Severity Levels
Severity Level Description
0 = Panic Panic-level messages indicate that a specific software subsystem has detected a
fatal or irrecoverable error condition—for example, memory allocation failure,
system call failure, and software detection of misbehaving ASIC or hardware
subsystems. Such errors indicate either partial or complete failure of a subsystem.
A panic frequently results in a reboot of a single-processor switch or a failover of a
StorageWorks Core switch operating in a fully redundant state.
1 = Critical Critical-level messages indicate serious problems detected by the software that will
eventually cause a partial or complete failure of a subsystem—for example, a
power supply or sensor failure can generate a critical level error message. Some
critical errors may overlap in severity with panic-level errors.
2 = Error Error-level messages indicate conditions that may not be fatal. These messages are
considered less severe than panic- or critical-level error messages. For example,
error-level messages may indicate timeouts seen on certain operations, failures of
certain operations after retries, invalid parameters, or failure to perform a
requested operation.
3 = Warning Warning-level messages are less severe than error-level messages. These messages
may indicate temporary failures detected by a software module or the detection of
a parameter under monitoring that exceeded a specific threshold value.
4 = Informational Informational-level messages require no corrective or recovery action. They record
events in the system—for example, the disabling of a port or the clearing of a
switch error log—and provide a description of those events to the user.
5 = Debug Debug-level messages are produced by code inserted to inform HP that a
suspected problem has occurred.
Overview of System Logs
This section describes the System Logs and the types of messages saved in the
System Logs, and explains how to view the information in the log files.
Note: The contents of the Port Logs and instructions for setting up syslogd are discussed
HP StorageWorks HP StorageWorks Fabric OS Procedures Guide
in the
the Panic Trace Logs are intended for support use only.
l
. The contents of
15Diagnostic and System Error Messages Version 3.1.x Reference Guide
Page 16

Introduction to System Error Messages
System Error Log
The Fabric OS maintains an internal System Error Log of all diagnostic and
system error messages. The internal log buffers are limited in size; when the
internal buffers are full, new messages overwrite old messages.
The following are features of the System Error Log:
■ Each switch has a System Error Log. Messages are lost over power cycles and
reboots.
■ The System Error Log can save a maximum of 1536 messages in RAM. That
is a total of 256 messages for each error message level (panic, error, warning,
informational, and debug).
■ The System Error Log is implemented as a circular buffer. When more than
the maximum number of entries are added to the log file, old entries are
overwritten by new ones.
■ The errdump and errorshow commands display all the system error
messages.
Syslogd Daemon
Syslogd is a process that runs on UNIX or Linux systems that reads and logs
messages to the system console, log files, other machines, and users specified by
its configuration file. Refer to the manual pages and related documentation for
your particular UNIX host system for more information on the syslogd process
and its capabilities.
The Fabric OS can be configured to use a UNIX-style syslog daemon (syslogd)
process to read system events and error messages and forward these messages to
users and/or write the events to log files on a remote UNIX host system.
The SAN switch can be configured to send error log messages to a UNIX host
system that supports syslogd. This host system can be configured to receive error
and event messages from the switch and store them in files on the computer hard
drive. This enables the storage of switch error log messages on a host system and
overcomes the size limitations of the internal log buffers on the SAN switch.
The host system can be running UNIX, Linux, or any other operating system, as
long as it supports standard syslogd functionality. The Core switch or 2 Gb SAN
switch do not assume any particular operating system to be running on the host
system. The only requirement is that the host system must support standard
syslogd to receive error log messages from the StorageWorks Core switch or
StorageWorks 2 Gb SAN switch.
16 Diagnostic and System Error Messages Version 3.1.x Reference Guide
Page 17

Port Logs
Introduction to System Error Messages
For information on configuring the syslogd functionality, refer to the HP
StorageWorks Fabric OS Procedures Guide.
The Fabric OS maintains an internal log of all port activity. Each switch or logical
switch maintains a log file for each port. Port Logs are circular log files that can
save up to 8000 entries per logical switch. When the log is full, new log entries
overwrite the oldest entries. Port Logs capture switch-to-device, device-to-switch,
some deviceA-to-deviceB, and control information. Port Logs are not persistent
and are lost over power cycles and reboots.
Use the portlogshow command to display the Port Logs for a particular port.
Refer to the HP StorageWorks Fabric OS Procedures Guide for information on
interpreting the output from the portlogdump command.
Note: The Port Log functionality is completely separate from the System Error Log
functionality. Typically, Port Logs are used to troubleshoot connection of devices.
s
System Console
The system console displays messages through the serial port. If you telnet into
the Ethernet port, you will not receive console messages. The system console
displays both system error messages and panic trace messages. These messages
are mirrored only to the system console and are always saved in one of the system
logs.
View or Configure System Logs
Tabl e 3 lists commands that are used to view or configure the error logs.
Table 3: Commands to View or Configure System Logs
Command Description
agtcfgdefault Reset the SNMP recipients to default values.
agtcfgset Configure the SNMP recipients.
agtcfgshow Display the current configuration of the SNMP recipients.
errclear Clear the error log.
17Diagnostic and System Error Messages Version 3.1.x Reference Guide
Page 18

Introduction to System Error Messages
Table 3: Commands to View or Configure System Logs (Continued)
Command Description
errdump Display the entire error log with no page breaks.
errshow Display the entire error log with page breaks.
memshow Display the current memory usage of the switch.
poterrshow Display the port error summary.
portflagsshow Display the port status bitmaps for all ports in a switch.
portlogclear Clear the Port Log. If the Port Log is disabled, this
portlogdisable Disable the Port Log facility.
portlogdump Display the Port Log without page breaks.
portlogdumpport Display the Port Log of specified port without page breaks.
portloginshow Display port logins.
portlogpdisc Set or clear the debug pdisc_flag.
command enables it.
portlogreset Enable the Port Log facility.
portlogresize Resize the Port Log to the specified number of entries.
portlogshow Display the Port Log with page breaks.
portlogshowport Display the Port Log of the specified port with page
breaks.
setdbg Set the level of debug messages reported by a particular
module.
seterrlvl Set the level of errors reported by a particular module.
setverbose Set the verbose level of a particular module within the
Fabric OS.
supportshow Execute a list of diagnostic and error display commands.
The output is used by technical support to diagnose and
correct problems with the switch. The output from this
command can be very long.
syslogdipadd Add an IP address as a recipient of event or error
messages.
syslogdipremove Remove an IP address as a recipient of event or error
messages.
syslogdipshow View the currently configured IP addresses that are
recipients of event or error messages.
18 Diagnostic and System Error Messages Version 3.1.x Reference Guide
Page 19

Introduction to System Error Messages
Reading a System Error Message
This section explains how to read system error messages. Typically, system error
messages are generated by the various modules in the Fabric OS. They are
dumped in the System Error Log and, depending on severity, may be saved to
memory or to flash memory.
Viewing System Error Messages from Advanced Web Tools
To view the System Error Log for a switch from Advanced Web Tools:
1. Launch Advanced Web Tools.
2. Select the desired switch from the Fabric Tree.
The Switch View appears.
3. Select the Switch Events button from the Switch View.
A Switch Events Report appears.
4. View the switch events and messages.
Displaying the Error Log without Page Breaks
To display the Switch Error Log without page breaks:
1. Log in to the switch as the admin user.
2. Enter the errdump command at the command line.
An error log, similar to that shown in Figure 1, displays.
19Diagnostic and System Error Messages Version 3.1.x Reference Guide
Page 20

Introduction to System Error Messages
switch:admin> errdump
Error 04
-------0x76 (fabos): Mar 25 08:26:44 (1)
Switch: 1, Info TRACK-LOGIN, 4, Successful login
Error 03
-------0x576 (fabos): Mar 24 16:01L44 (12)
Switch: 1, info TRACK-CONFIG_CHANGE, 4, Config file change from
task:ZNIPC
Error 02
-------0x2f0 (fabos): Mar 24 15:07:01
Switch: 1, Warning FW-STATUS_SWITCH status changed from
HEALTHY/OK to Marginal/Warning
Error 01
-------0x271 (fabos): mar 24 15:04:06
Switch: 1, Info EM-BOOT, 4, restart reason: Failover
switch:admin>
Figure 1: Error log without page breaks
Displaying the Error Log with Page Breaks
To display the error log with page breaks:
1. Log in to the switch as the admin user.
2. Enter the errclear command to clear the System Error Log.
An error log, similar to that shown in Figure 2, displays.
20 Diagnostic and System Error Messages Version 3.1.x Reference Guide
Page 21

switch:admin> errshow
Error 497
-------0x4a5 (fabos): Oct 03 04:40:14
Switch: 0, Info TRACK-LOGIN, 4, Successful login
.
.
.
Type <CR> to continue, Q<CR> to stop: q
Figure 2: Error log with page breaks
Clearing the Switch Error Log
To clear the error log for a particular switch:
1. Log in to the switch as the admin user.
Introduction to System Error Messages
2. Enter the errclear command to clear the System Error Log.
Sample Error Log Message
Figure 3 shows a typical message from the error log.
Error 1001
-------0x253 (fabos): Nov 03 14:11:53
Switch: 1, Error EM-CP_ERR, 2, CP in slot 5 set to faulty because
of CP ERROR
Figure 3: Sample error log message
The fields in this error message are explained in Table 4.
21Diagnostic and System Error Messages Version 3.1.x Reference Guide
Page 22

Introduction to System Error Messages
Table 4: Error Message Field Description
Example Variable Name Description
Error 1001 Error Log buffer
number
Nov 03 14:11:53 Date and time The date and time the error message occurred.
Switch: 1 Switch: <number> The logical switch that was affected (
Error Severity level The severity of the message as Panic, Critical,
EM-CP_ERR Error module - error
code
2 Severity level The severity of the error as a number:
CP in slot 5 set
to faulty
because of CP
ERROR
Error description Error-specific data, such as the reason for the
Displays a rotating number that describes the
position of this error message in the buffer. This
number is not permanently affiliated with the
error itself and should not be used when
contacting Technical Support.
number
values are 0 and 1).
Error, Warning, Informational, or Debug.
The name of the module that generated the error
and the code name for the error.
0 = Panic
1 = Critical
2 = Error
3 = Warning
4 = Informational
5 = Debug
error.
Responding to a System Error Message
This section shows how to respond to system error messages.
Looking Up an Error Message
Chapter 2 lists error messages alphabetically by module. To find a specific
message, either scroll through the list or activate the link directly to the message
from one of the lists in Appendix A.
22 Diagnostic and System Error Messages Version 3.1.x Reference Guide
Page 23

Chapter 2 provides the following information for each message:
■ Message text
■ Firmware module that generated the error
■ Module and code name for the error
■ Probable cause
■ Recommended action
■ Severity level
Gathering Information About the Problem
The following are recommended actions for troubleshooting a system error
message. Note that all of the information collected here should be provided to
Technical Support if you require troubleshooting assistance.
■ Run supportshow and pdshow and save the output.
■ Document the sequence of events leading up to the problem:
Introduction to System Error Messages
— What actions did you take before the problem occurred?
— Is the problem repeatable?
— What configuration is required to produce the problem?
■ Answer the following questions:
— Did a failover occur?
— Was security enabled?
— Was POST enabled?
— Are Serial Port (Console) Logs available?
— Which CP was master?
— What was the last change made?
23Diagnostic and System Error Messages Version 3.1.x Reference Guide
Page 24

Introduction to System Error Messages
Common Responses
The following are common responses to system error messages:
■ Run supportshow and pdshow and provide the output to Technical
Support.
■ Gather logs.
■ Watch for reoccurrence.
■ Reinstall firmware.
■ Reboot the machine.
■ Revert to previous firmware version.
■ Call support.
24 Diagnostic and System Error Messages Version 3.1.x Reference Guide
Page 25

System Error Messages
This chapter contains all of the System Error Messages in alphabetical order. To
find a specific message, you can either scroll through the list or activate the link
directly to the message from one of the lists in Appendix A.
This chapter provides information on the following message types:
AS_ System Error Messages on page 26
Bloom_System Error Messages on page 27
ERRLOG_System Error Messages on page 31
FABRIC_System Error Messages on page 34
FCIU_System Error Messages on page 38
FCP_System Error Messages on page 40
FCPH_System Error Messages on page 41
FLOOD_System Error Messages on page 44
2
FSPF_System Error Messages on page 46
HLO_System Error Messages on page 50
LSDB_System Error Messages on page 53
MCAST_System Error Messages on page 55
MPATH_System Error Messages on page 57
MQ_System Error Messages on page 59
MS_System Error Messages on page 65
NBFSM_System Error Messages on page 73
PS_System Error Messages on page 75
RA PID_System Error Messages on page 77
RCS_System Error Messages on page 78
RTWR_System Error Messages on page 81
25Diagnostic and System Error Messages Version 3.1.x Reference Guide
Page 26

System Error Messages
SEC_System Error Messages on page 85
SECLIB_System Error Messages on page 91
SLAP_System Error Messages on page 100
SWITCH_System Error Messages on page 103
TRACK_System Error Messages on page 104
TS_System Error Messages on page 109
UCAST_System Error Messages on page 112
UPATH_System Error Messages on page 113
ZONE_System Error Messages on page 114
AS_ System Error Messages
Alias Server provides a multi-casting capability; a single frame can be delivered to
multiple ports. The user defines a group of ports identified by the Alias ID and
delivers a frame to that group using the Alias ID. The Alias Server daemon tracks
the Alias ID.
AS-CTMALLOC
Message
<switch number> Error AS-CTMALLOC, 2, <variable> : ctMalloc for <number of
bytes> bytes failed <variable>
Explanation
Memory allocation failure. Fabric OS error.
Recommended Action
Copy the name of the error (AS-CTMALLOC) and then call Technical Support.
Severity
Error
26 Diagnostic and System Error Messages Version 3.1.x Reference Guide
Page 27

Bloom_System Error Messages
Bloom_System Error Messages
BLOOM is the name of the current ASIC chip. BLOOM error messages come
from the BLOOM ASIC driver for this chip.
BLOOM-BAD_ID
Message
<switch number> Warning BLOOM-BAD_ID, 3, <port number> IU in <message
string> has bad ID (S_ID = <SID number>, D_ID = <DID number>)
Explanation
A bad source ID or destination ID was reported on the specified slot and port
number.
Recommended Action
Run portlogdisable and supportshow (in order) to capture debug
information and then contact Technical Support. Technical Support may also ask
for additional debug information from POST and systemtest.
Severity
Warn ing
BLOOM-BUF_RECLAIMED
Message
<switch number> Info BLOOM-BUF_RECLAIMED, 4, <port number>
Explanation
If the specified port was previously disabled because no buffer was available, the
port is now enabled because a buffer has been made available in the same quad.
27Diagnostic and System Error Messages Version 3.1.x Reference Guide
Page 28

System Error Messages
Recommended Action
No action required.
Severity
Informational
BLOOM-MINI_BUFFER
Message
<switch number> Warning BLOOM-MINI_BUFFER, 3, <quad number>
Explanation
Two or more bad hardware buffers are reported from the specified quad.
Recommended Action
Run portlogdisable and supportshow (in order) to capture debug
information and then contact Technical Support. Technical Support may also ask
for additional debug information from POST and systemtest.
Severity
Warn ing
BLOOM-NO_BUFFERS
Message
<switch number> Warning BLOOM-NO_BUFFERS, 3, <port number>
Explanation
The specified port was disabled due to lack of available buffers. This usually
happens when one or more ports in the same quad are configured as long distance.
28 Diagnostic and System Error Messages Version 3.1.x Reference Guide
Page 29

Bloom_System Error Messages
Recommended Action
Disable one or more other ports in the same quad to enable the specified slot and
port
Severity
Warn ing
BLOOM-RAMINIT_TO
Message
<switch number> Critical BLOOM-RAMINIT_TO, 1, <port number> <port index>
failed to init RAM @ <offset>, busy status = <busy index>
Explanation
RAM initialization cannot be completed within the expected time for the specified
port number.
Recommended Action
Copy the error message information, run portlogdisable and
supportshow (in order) to capture debug information and then contact
Technical Support. Technical Support may also ask for additional debug
information from POST and systemtest.
Severity
Critical
BLOOM-STUCK_WAIT
Message
<switch number> Panic BLOOM-EXCESSIVE_BUSY_MINI, 0, <port number> <Loop
status> <TX-from-RX status> busy <busy buffer value> <message string>
Explanation
One of the following situations occurred when the port was busy transitioning to
the next state on the specified slot and port:
29Diagnostic and System Error Messages Version 3.1.x Reference Guide
Page 30

System Error Messages
■ <waiting for OPEN state>
Explanation: The specified port could not transition to the OPEN state.
■ <waiting for CLOSE state>
Explanation: The specified port could not transition to the CLOSE state.
■ <init stuck at bloomLPC waiting for OPEN state>
Explanation: The specified port could not transition to the OPEN state when
executing the Loop Port Control (LPC) command.
Recommended Action
Copy the error message information, run portlogdisable and
supportshow (in order) to capture debug information and then contact
Technical Support. Technical Support may also ask for additional debug
information from POST and systemtest.
Severity
Panic
30 Diagnostic and System Error Messages Version 3.1.x Reference Guide
Page 31

ERRLOG_System Error Messages
The error log subsystem collects information about the system’s health, as well as
warning or information conditions from various subsystems. The error log
subsystem then displays the collected information in text format on the system
console. It then stores required error messages in nonvolatile storage so the
information can be retrieved and displayed later.
ERRLOG-LOGCLRD
Message
<switch number> Info ERRLOG-LOGCLRD, 4, Error log cleared
Explanation
Informational message stating that the error log was cleared using the telnet
command errclear.
ERRLOG_System Error Messages
Recommended Action
No action required.
Severity
Informational
ERRLOG-NV_DISABLE
Message
<switch number> Info ERRLOG-NV_DISABLE, 4, Persistent error log will be
disabled soon...
Explanation
An informational message stating that the Persistent (nonvolatile) Error Log was
disabled by the telnet command errnvlogdisable issued by the user.
31Diagnostic and System Error Messages Version 3.1.x Reference Guide
Page 32

System Error Messages
Recommended Action
No action required.
Severity
Informational
ERRLOG-NV_LOG_CLRD
Message
<switch number> Info ERRLOG-NV_LOG_CLRD, 4, Persistent error log cleared
Explanation
An informational message stating that the Persistent (nonvolatile) Error Log has
been cleared with the errclear -p command.
Recommended Action
No action required.
Severity
Informational
ERRLOG-NV_LOG_RESIZE
Message
<switch number> Info ERRLOG-NV_LOG_RESIZE, 4, Persistent error log is
resized to <number of errors in log> entries
Explanation
An informational message stating that the number of errors in the Persistent
(nonvolatile) Error Log has been changed and can now store <number of
errors in log> entries. The default size is 1024. It can be resized to any
value between 1024 and 2068.
32 Diagnostic and System Error Messages Version 3.1.x Reference Guide
Page 33

ERRLOG_System Error Messages
Recommended Action
No action required.
Severity
Informational
ERRLOG-SET_MSG_SAVE_LVL
Message
<switch number> Info ERRLOG-SET_MSG_SAVE_LVL, 4, Error Log message save
level is set to <error level>
Explanation
An informational message that states the severity levels of the error messages that
are set to be saved in the Persistent (nonvolatile) Error Log. For example, if the
level is set to 3, then 0-, 1-, 2-, and 3-level error messages will be saved.
The maximum number of persistent messages is 256. HP recommends that you
always set the Persistent Error Log to record at least Panic errors (level 0) and
Critical errors (level 1). If the log fills up, more critical messages take precedence
over less critical messages in the log.
The severity levels of error messages are:
■ 0 = Panic
■ 1 = Critical
■ 2 = Error
■ 3 = Warning
■ 4 = Informational
■ 5 = Debug
Recommended Action
No action required.
Severity
Informational
33Diagnostic and System Error Messages Version 3.1.x Reference Guide
Page 34

System Error Messages
FABRIC_System Error Messages
FA B RI C refers to a network of Fibre Channel switches. The FABRIC_System
error messages come from the fabric daemon. Fabricd implements the Fibre
Channel Switch Fabric (FCSF) standard. Fabricd follows the FCSF standard for
the fabric initialization process, such as determining the E_ports, assigning unique
domain IDs to switches, creating a spanning tree, throttling the trunking process,
and distributing the domain and alias list to all switches in the fabric.
FABRIC-ASYNC
Message
<switch number> Warning FABRIC-ASYNC, 3, port: <port number>, req iu:
<IU sent>, state: <command sent>, resp iu: <response IU>, state
<response IU state> “unexpected resp async state”
Explanation
The Information Unit response was invalid for the specified command sent.
Recommended Action
Copy the error message and then call Technical Support.
Severity
Warn ing
FABRIC-NO_ALIASID
Message
<switch number> Warning FABRIC-NO_ALIASID, 3, fabGaid: no free multicast
alias IDs
Explanation
The fabric does not have available multicast alias IDs to assign to the alias server.
34 Diagnostic and System Error Messages Version 3.1.x Reference Guide
Page 35

FABRIC_System Error Messages
Recommended Action
Verify Alias IDs using the fabricshow command on the principal switch.
Severity
Warn ing
FABRIC-SEGMENTED
Message
<switch number> Warning FABRIC-SEGMENTED, 3, port <port number>,
<description of segmentation>
Explanation
The port is segmented from a neighboring switch. The error message provides a
description and additional information regarding segmentation.
Recommended Action
Verify that the specified port is segmented using the command switchshow.
Using information provided in <description of segmentation>, correct the reason
for segmentation.
Severity
Warn ing
FABRIC-SIZE_EXCEEDED
Message
<switch number> Critical FABRIC-SIZE_EXCEEDED, 1, “Critical fabric size
<number of switches in fabric> exceeds configuration <number of allowed
switches> Switch status marginal. Contact Technical Support.”
Explanation
There are too many switches in the fabric.
35Diagnostic and System Error Messages Version 3.1.x Reference Guide
Page 36

System Error Messages
Recommended Action
Reduce the size of the fabric. Remove switches until the number of switches
meets the supported configuration. Contact Technical Support to answer any
questions.
Severity
Critical
FABRIC-WEBTOOL_DISABLE
Message
<switch number> Critical FABRIC-WEBTOOL_DISABLE, 1, Webtool is disabled.
Explanation
Web Tools is disabled until the fabric size meets the supported configuration.
Recommended Action
Remove switches from the fabric until the fabric meets the supported
configuration. Web Tools will automatically be enabled.
Severity
Critical
FABRIC-WEBTOOL_LIFE
Message
<switch number> Critical FABRIC-WEBTOOL_LIFE, 1, Webtool will be disabled
in <number> days and <number> hours and <number> minutes
Explanation
If the fabric size exceeds the supported configuration, then Web Tools will be
disabled in the specified number of days, hours, and minutes.
36 Diagnostic and System Error Messages Version 3.1.x Reference Guide
Page 37

Recommended Action
Remove switches from the fabric until the fabric meets the supported
configuration.
Severity
Critical
FABRIC_System Error Messages
37Diagnostic and System Error Messages Version 3.1.x Reference Guide
Page 38

System Error Messages
FCIU_System Error Messages
Fibre Channel Information Unit (FCIU) error messages are reported from the
Fibre Channel Physical (FCPH) layers of code. The FCPH layers of code are
FC-0, FC-1, and FC-2 of the Fibre Channel protocol.
FCIU-IUBAD
Message
<switch number> Debug FCIU-IUBAD, 5, invalid iu <IU pointer>
Explanation
An invalid IU (Information Unit) was reported. The <IU pointer> provides a
pointer to the IU causing the error message. This error message can be caused by
one of the following conditions:
■ NULL IU pointer
■ NULL IU header pointer
■ NULL IU data pointer or no IU data
■ Size of the IU is larger than the memory allocation size
Recommended Action
Run the supportshow command to display the error message trace information
that shows where the IU error message occurred. Copy the trace-back information
printed with this error. Contact Technical Support with both sets of information.
Severity
Debug
38 Diagnostic and System Error Messages Version 3.1.x Reference Guide
Page 39

FCIU_System Error Messages
FCIU-IUCOUNT
Message
<switch number> Critical FCIU-IUCOUNT, 1, count <0 iu <IU Pointer>
Explanation
The number of Information Units (IUs) in use (allocated) is less than zero, but a
task or application is trying to return an IU; this return is an invalid action. The
<IU Pointer> provides a pointer to the IU causing the error message.
Recommended Action
Run the supportshow command to find the error message trace information to
learn where the IU error message occurred. Copy the trace-back information
printed with this error. Contact Technical Support with both sets of information.
Severity
Critical
39Diagnostic and System Error Messages Version 3.1.x Reference Guide
Page 40

System Error Messages
FCP_System Error Messages
The Fibre Channel Protocol (FCP) application is responsible for probing the
devices attached on the loop port. The switch uses probing to identify the devices
attached on the loop ports and to update the Name Server with the information.
FCP-PROBE_TIMEOUT
Message
<switch number> Warning FCP-PROBE_TIMEOUT, 3, AL_PA <ALPA address> on port
<port number> did not respond
Explanation
The FCP switch probes devices on the loop port; probing timed out on the
specified port for the specified ALPA (arbitrated loop physical address).
Port number values can be 0-15; the ALPA range is any value 00 - FF.
Recommended Action
Retry the action. If the error persists, contact Technical Support.
Severity
Warn ing
40 Diagnostic and System Error Messages Version 3.1.x Reference Guide
Page 41

FCPH_System Error Messages
FCPH_System Error Messages
Fibre Channel Physical (FCPH) layer error messages are a result of “exchange”
errors. Exchanges are the exchange of information units with identification and
management mechanisms. This is a basic “hand-shaking” between two Fibre
Channel ports.
FCPH-EXCHBAD
Message
<switch number> Critical FCPH-EXCHBAD, 1, bad xid <Exchange ID>, x:
<Exchange Data0>, <Exchange Data1>, <Exchange Data2>, <Exchange Data3>,
<Exchange Data4>, <Exchange Data5>, <Exchange Data6> [iu: <IU Pointer>;
header: <IU Header0>, <IU Header1>, <IU Header2>, <IU Header3>]
Explanation
A bad (invalid) exchange ID was reported.
The following information is provided in the error message:
■ <Exchange Data0> - The Fibre Channel header exchange ID for the
Originator (O) and Responder (R): format [OOOORRRR].
■ <Exchange Data1> - The Fibre Channel source ID.
■ <Exchange Data2> - The Fibre Channel responder ID.
■ <Exchange Data3> - The exchange status flags.
■ <Exchange Data4> - The physical port number.
■ <Exchange Data5> - The Fibre Channel class of service.
■ <Exchange Data6> - The receiver unsolicited registry index.
■ <IU Pointer> - The pointer Information Unit.
■ <IU Header0> - The Fibre Channel routing control bits (R)_ and destination
ID (D): format [RRDDDDDD].
■ <IU Header1> - The Fibre Channel destination ID (D) and unused bits (X):
format [XXDDDDDD].
■ <IU Header2> - The Fibre Channel header fields type (T) and frame control
(F): format [TTFFFFFF].
■ <IU Header3> - The Fibre Channel header fields sequence ID, Data Field
Control, and Sequence Count.
41Diagnostic and System Error Messages Version 3.1.x Reference Guide
Page 42

System Error Messages
Recommended Action
Run the supportshow command; the error message trace information will
show where the Information Unit (IU) error message occurred. Copy the
trace-back information printed with this error. Contact Technical Support with
both sets of information.
Severity
Critical
FCPH-EXCHFREE
Message
<switch number> Debug FCPH-EXCHFREE, 5, xid <Exchange ID> free, x:
<Exchange Data0>, <Exchange Data1>, <Exchange Data2>, <Exchange Data3>,
<Exchange Data4>, <Exchange Data5>, <Exchange Data6>, <Exchange Data7> iu:
unknown
Explanation
The exchange ID has already been freed.
The following information is provided in the error message:
■ <Exchange Data0> - The Fibre Channel header exchange ID for the
Originator (O) and Responder (R): format [OOOORRRR].
■ <Exchange Data1> - The Fibre Channel source ID.
■ <Exchange Data2> - The Fibre Channel responder ID.
■ <Exchange Data3> - The exchange status flags.
■ <Exchange Data4> - The physical port number.
■ <Exchange Data5> - The Fibre Channel class of service.
■ <Exchange Data6> - The receiver unsolicited registry index.
■ <Exchange Data7> - Reserved for future use.
42 Diagnostic and System Error Messages Version 3.1.x Reference Guide
Page 43

Recommended Action
Run the supportshow command; the error message trace information shows
where the IU error message occurred. Copy the trace-back information printed
with this error. Contact Technical Support with both sets of information.
Severity
Debug
FCPH_System Error Messages
43Diagnostic and System Error Messages Version 3.1.x Reference Guide
Page 44

System Error Messages
FLOOD_System Error Messages
FLOOD is a part of the FSPF (Fabric Shortest Path First) protocol that handles
synchronization of the Link State Database (LSDB) and propagation of the Link
State Records (LSR).
FLOOD-INVLSR
Message
<switch number> Warning FLOOD-INVLSR, 3, Unknown LSR type: port
<port number>, type <LSR header type>
Explanation
The Link State Record (LSR) type is unknown. The following two LSR header
types are the only known types: 1 for Unicast and 3 for Multicast.
Recommended Action
The record will be discarded. No user action is required.
Severity
Warn ing
FLOOD-LINKCNT
Message
<switch number> Warning FLOOD-LINKCNT, 3, Link count exceeded in received
LSR, value = <link count number>
Explanation
The acceptable link count received was exceeded in the Link State Record.
44 Diagnostic and System Error Messages Version 3.1.x Reference Guide
Page 45

Recommended Action
The record will be discarded. No user action is required.
Severity
Warn ing
FLOOD_System Error Messages
45Diagnostic and System Error Messages Version 3.1.x Reference Guide
Page 46

System Error Messages
FSPF_System Error Messages
Fabric Shortest Path First (FSPF) is a link state routing protocol that is used to
determine how frames should be routed. These error messages cover protocol
errors.
FSPF-INPORT
Message
<switch number> Error FSPF-INPORT, 2, Input Port <port number> out of range
Explanation
The specified input port number is out of range; it does not exist on the switch.
Recommended Action
The frame will be discarded; no user action is required.
Severity
Error
FSPF-NBRCHANGE
Message
<switch number> Info FSPF-NBRCHANGE, 4, Wrong neighbor ID <port number> in
Hello
Explanation
Wrong Domain ID from neighbor (adjacent) switch in the Hello message from the
specified port. This can occur when a Domain ID for a switch has been changed.
46 Diagnostic and System Error Messages Version 3.1.x Reference Guide
Page 47

FSPF_System Error Messages
Recommended Action
No action required.
Severity
Informational
FSPF-REMDOMAIN
Message
<switch number> Error FSPF-REMDOMAIN, 2, Remote Domain ID <domain number>
out of range, input port = <port number>
Explanation
The specified remote Domain ID is out of range.
Recommended Action
The frame will be discarded; no user action is required.
Severity
Error
FSPF-SCN
Message
<switch number> Warning FSPF-SCN, 3, Illegal SCN, port <port number>, state
<state code>
Explanation
An invalid Switch Change Notification (SCN) was reported for the specified port.
The valid SCNs are 1 (on line), 2 (off line), 3 (testing), 4 (faulty), 5 (E_Port), 6
(F_Port), 7 (segmented), and 8 (T_Port).
47Diagnostic and System Error Messages Version 3.1.x Reference Guide
Page 48

System Error Messages
Recommended Action
The SCN will be ignored. No user action is required.
Severity
Warn ing
FSPF-SECTION
Message
<switch number> Error FSPF-SECTION, 2, Wrong Section Id <section number>,
should be 0, input port = <port number>
Explanation
An incorrect section ID was reported from the specified input port. HP supports
only Section ID 0 (zero).
Recommended Action
Verify that the reported Section ID is 0 (zero).
Severity
Error
FSPF-VERSION
Message
<switch number> Error FSPF-VERSION, 2, FSPF Version <FSFP version> not
supported, input port = <port number>
Explanation
The specified FSPF version is not supported on the specified input port.
48 Diagnostic and System Error Messages Version 3.1.x Reference Guide
Page 49

Recommended Action
Update the FSPF version by loading the correct version of firmware.
Severity
Error
FSPF_System Error Messages
49Diagnostic and System Error Messages Version 3.1.x Reference Guide
Page 50

System Error Messages
HLO_System Error Messages
HLO is a part of the Fabric Shortest Path First (FSPF) protocol that handles the
HELLO protocol between adjacent switches. The HELLO protocol establishes
connectivity with a neighbor switch, establishes the identity of the neighbor
switch, and exchanges FSPF parameters and capabilities.
HLO-DEADTIMEOUT
Message
<switch number> Error HLO-DEADTIMEOUT, 2, Incompatible Inactivity timeout
<dead timeout> from port <port number>, correct value <value>
Explanation
The HELLO message was incompatible. The dead timeout value does not match
the value specified in the FSPF protocol. Since the dead timeout value is
incompatible, the local switch will not accept FSPF frames from the remote
switch.
Recommended Action
The dead timeout value of the remote switch must be made compatible with the
value specified in the FSPF protocol. See the manufacturer’s documentation to
change this value.
Severity
Error
50 Diagnostic and System Error Messages Version 3.1.x Reference Guide
Page 51

HLO_System Error Messages
HLO-HLOTIMEOUT
Message
<switch number> Error HLO-HLOTIMEOUT, 2, Incompatible Hello timeout <HELLO
timeout> from port <port number>, correct value <correct value>
Explanation
The HELLO message was incompatible and timed out on the specified port. Since
the HELLO timeout value is incompatible (the HELLO timeout value does not
match the value specified in the FSPF protocol), the local switch will not accept
FSPF frames from the remote switch.
Recommended Action
The HELLO timeout value of the remote switch must be made compatible with
the value specified in the FSPF protocol. See the manufacturer’s documentation to
change this value.
Severity
Error
HLO-INVHLO
Message
<switch number> Error HLO-INVHLO, 2, Invalid Hello received from port
<port number>, Domain = <domain ID>, Remote Port = <remote port ID>
Explanation
The HELLO message received from the specified local port, domain ID, and
remote port ID was reported to be invalid.
51Diagnostic and System Error Messages Version 3.1.x Reference Guide
Page 52

System Error Messages
Recommended Action
Since the HELLO message from the remote switch is incompatible with the local
switch, the local switch will not accept FSPF frames from the remote switch. The
HELLO message of the remote switch must be made compatible with the value
specified in the FSPF protocol. See the manufacturer’s documentation to change
this value. Call Technical Support with questions.
Severity
Error
52 Diagnostic and System Error Messages Version 3.1.x Reference Guide
Page 53

LSDB_System Error Messages
LSDB_System Error Messages
The Link State Database (LSDB) is a part of the Fabric Shortest Path First (FSPF)
protocol that manages the Link State Database.
LSDB-LSID
Message
<switch number> Error LSDB-LSID, 2, Link State ID <link state ID> out of
range
Explanation
The Link State Database ID is out of the acceptable range.
Recommended Action
This record will be discarded. No user action is required.
Severity
Error
LSDB-MAXINCARN
Message
<switch number> Info LSDB-MAXINCARN, 4, Local Link State Record reached max
incarnation
Explanation
The local Link State Database reached the maximum number of incarnations.
Recommended Action
No action required. The incarnation number will wrap around.
Severity
Informational
53Diagnostic and System Error Messages Version 3.1.x Reference Guide
Page 54

System Error Messages
LSDB-NOLOCALENTRY
Message
<switch number> Critical LSDB-NOLOCALENTRY, 1, No database entry for local
Link State Record, domain <local domain>
Explanation
There is no local Link State Record entry in the Link State Database.
Recommended Action
Perform a switch disable and enable.
Severity
Critical
LSDB-NOLSR
Message
<switch number> Warning LSDB-NOLSR, 3, No Link State Record for domain
<local domain>
Explanation
There is no Link State Database record for the specified local domain.
Recommended Action
Perform a switch disable and enable.
Severity
Warn ing
54 Diagnostic and System Error Messages Version 3.1.x Reference Guide
Page 55

MCAST_System Error Messages
MCAST_System Error Messages
MCAST is the multicast portion of Fabric Shortest Path First (FSPF); see
FSPF_System Error Messages on page 46. These error messages cover broadcast
and multicast protocol errors.
MCAST-ADDBRANCH
Message
<switch number> Error MCAST-ADDBRANCH, 2, Add branch failed: Mcast Grp =
<group number>, Port = <port number>
Explanation
The add branch failed to build up a tree-like connectivity between ISL ports from
a specified MCAST group.
Recommended Action
Perform a port disable and enable on port <port number>.
Severity
Error
MCAST-ADDPORT
Message
<switch number> Warning MCAST-ADDPORT, 3, Add port failed: Mcast Grp =
<group number>, Src = <port number>, Dest = <port number>
Explanation
The add port failed to configure a port to be a member of a specified MCAST
group.
55Diagnostic and System Error Messages Version 3.1.x Reference Guide
Page 56

System Error Messages
Recommended Action
Verify that the MCAST group ID is valid (0 through 254).
Severity
Warn ing
MCAST-REMPORT
Message
<switch number> Warning MCAST-REMPORT, 3, Remove port failed: Mcast Grp =
<group number>, Src = <port number>, Dest = <port number>
Explanation
The Remove Port failed to cancel the membership of a specified MCAST group
for a port.
Recommended Action
Verify that the MCAST group ID is valid (0 through 254).
Severity
Warn ing
56 Diagnostic and System Error Messages Version 3.1.x Reference Guide
Page 57

MPATH_System Error Messages
MPATH_System Error Messages
Multicast Path (MPATH) uses the Shortest Path First (SPF) algorithm to
dynamically compute a broadcast tree.
MPATH-NOPARENT
Message
<switch number> Error MPATH-NOPARENT, 2, Null parent, lsId = <number>
Explanation
A null parent was reported. MPATH uses a tree structure in which the parent is
used to connect to the root of the tree.
Recommended Action
No user action required. Call Technical Support if the error persists.
Severity
Error
MPATH-NOPARENTLSR
Message
<switch number> Error MPATH-NOPARENTLSR, 2, Null lsrP, lsId =
<ls ID number>
Explanation
The Link State Record is null.
Recommended Action
No action required. If the error is not persistent, it is not a problem.
Severity
Error
57Diagnostic and System Error Messages Version 3.1.x Reference Guide
Page 58

System Error Messages
MPATH-UNREACHABLE
Message
<switch number> Warning MPATH-UNREACHABLE, 3, No minimum cost path in
candidate list
Explanation
No minimum-cost path (FSPF MPath) is available in the candidate list (the
candidate list is customer-defined).
Recommended Action
No action required.
Severity
Warn ing
58 Diagnostic and System Error Messages Version 3.1.x Reference Guide
Page 59

MQ_System Error Messages
MQ_System Error Messages
Message Queues (MQs) are used for inter-process communication. Message
queues allow many messages of variable length to be queued. Any process or
Interrupt Service Routine (ISR) can write messages to a message queue. Any
process can read messages from a message queue.
MQ-MSGTYPE
Message
<switch number> Error MQ-MSGTYPE, 2, mqRead, queue = <queue name>, queue ID
= <queue ID> type = <message type>
Explanation
An unexpected message has been received in the specified message queue. The
message queue name and the type of the message are indicated in the message.
The following variables can be displayed in the error message:
■ <queue name>
— err_q
—fspf_q
—restart_q
■ <queue ID> <message type>
—0MSG_IU
—1MSG_SCN
—2MSG_TX
—3MSG_INTR
—4MSG_STR
—5MSG_TO
— 6MSG_ASYNC_IU
— 7MSG_LINIT_IU
— 8MSG_RSCN
—9MSG_IOCTL
59Diagnostic and System Error Messages Version 3.1.x Reference Guide
Page 60

System Error Messages
— 10MSG_ACCEPT
— 11MSG_IU_FREE
—12MSG_US
— 13MSG_EXT_RSCN
— 14MSG_RDTS_START
— 15MSG_RDTS_SENDEFP
— 16MSG_RDTS_RESET
Recommended Action
Run the mqshowall command and record the output. Provide the mqshowall
output and the error message to Technical Support.
Severity
Error
MQ-QREAD
Message
<switch number> Critical MQ-QREAD, 1, mqRead, queue = <queue name>, queue
ID = <queue ID>, msg = <message ID>
Explanation
A read from the specified message queue was unsuccessful because there were no
messages immediately available (read with no wait) or because the message
occurred after some timeout period (read with timeout). The name of the message
queue and the queue ID are indicated in this error log message.
The following variables can be displayed in the error message:
■ <queue name>
—as_q
— err_q
—diag_q
— fabric_q
60 Diagnostic and System Error Messages Version 3.1.x Reference Guide
Page 61

—fspf_q
— qloop_q
—RDTS_q
— zone_realtime_q
—zone_q
—restart_q
— embSW_q
— pb_q
—fcp_q
—rt_q
— apims_q
—ms_q
—msAsync_q
MQ_System Error Messages
—ms2ns_q
—ns_q
—nsirc_q
— tns_q
— nscam_q
—restart_q
— timer_q
— response_q
— receive_q
— transmit_q
— scn_q
—smb_q
— snmp_agt_q
—famib_q
— fru_q
—ts_q
61Diagnostic and System Error Messages Version 3.1.x Reference Guide
Page 62

System Error Messages
■ <queue ID> <message type>
—0MSG_IU
—1MSG_SCN
—2MSG_TX
—3MSG_INTR
—4MSG_STR
—5MSG_TO
— 6MSG_ASYNC_IU
— 7MSG_LINIT_IU
— 8MSG_RSCN
—9MSG_IOCTL
— 10MSG_ACCEPT
— 11MSG_IU_FREE
—12MSG_US
— 13MSG_EXT_RSCN
— 14MSG_RDTS_START
— 15MSG_RDTS_SENDEFP
— 16MSG_RDTS_RESET
Recommended Action
Run the mqshowall command and record the output. Provide both the
mqshowall output and the error message to Technical Support.
Severity
Critical
62 Diagnostic and System Error Messages Version 3.1.x Reference Guide
Page 63

MQ_System Error Messages
MQ-QTHR
Message
<switch number> Debug MQ-QTHR, 5, mqWrite: msg threshold exceeded, queue =
<queue name>, queue ID = <queue ID#>, # of msgs = <number of messages>
Explanation
An attempt to write a message to the specified message queue has exceeded the
message threshold. This indicates that messages are written to this queue faster
than they are read. The name of the message queue, the queue ID, and the number
of messages currently in the queue are provided in this error log message.
See the MQ-READ message description for a list of variables that can be
displayed in this error message.
Recommended Action
Severity
Run the mqshowall command and record the output. Provide both the
mqshowall output and the error message to Technical Support.
Debug
63Diagnostic and System Error Messages Version 3.1.x Reference Guide
Page 64

System Error Messages
MQ-QWRITE
Message
<switch number> Critical MQ-QWRITE, 1, mqWrite, queue = <queue name>, queue
ID = <queue ID> msg = <message ID>, errno = <error number>
Explanation
An attempt to write a message to the specified message queue has failed. The
name of the message queue, the queue ID, the message ID, and the error number
are provided in the error log message.
See the MQ-QREAD message for the list of variables that can be displayed in this
error message.
Recommended Action
Run the mqshowall command and record the output. Provide both the
mqshowall output and the error message to Technical Support.
Severity
Critical
64 Diagnostic and System Error Messages Version 3.1.x Reference Guide
Page 65

MS_System Error Messages
MS_System Error Messages
The Management Server (MS) provides a single access point that allows the user
to obtain information about the Fibre Channel fabric topology and attributes. MS
provides for both monitoring and control of the following areas:
■ The Fabric Configuration Server provides for the configuration management
of the fabric.
■ The Unzoned Name Server provides access to Name Server information that
is not subject to Zone constraints.
■ The Fabric Zone Server provides access to, and control of, Zone information.
MS-INVALID_CTRESP
Message
<switch number> Error MS-INVALID_CTRESP, 2, MS Invalid CT Response from
<domain>
Explanation
The MS received an invalid Common Transport (CT) response from <domain>.
The MS expects either a CT accept Information Unit (IU) or a reject IU. The MS
received neither response, which violates the Fibre Channel Generic Services
(FC-GS) specification.
Recommended Action
Check the integrity of the interconnect element at the specified domain.
Severity
Error
65Diagnostic and System Error Messages Version 3.1.x Reference Guide
Page 66

System Error Messages
MS-OUT_RESOURCES
Message
<switch number> Error MS-OUT_RESOURCES, 2, MS Failure while initializing
<action>
Explanation
The Management Server (MS) failed while initializing the specified <action>.
The following can be displayed as <action>:
■ <while writing to ms_els_q>
Explanation: Unable to write a message to the MS Extended Link Service
Queue.
■ <while inserting timer to timer list>
Explanation: Unable to add timer to resource.
Recommended Action
The switch may be temporarily busy and out of resources to respond to a request.
If the error occurs frequently, check the available memory on the switch using
memshow and then contact Technical Support.
Severity
Error
MS-PLDBSEG
Message
<switch number> Warning MS-PLDBSEG, 3, MS Platform Segmented port =
<port number> (<reason for segmentation> D = <domain>)
Explanation
The Management Server (MS) has segmented from another switch <domain> at
the specified port <port number> due to errors or inconsistencies defined in the
MS Platform Service.
66 Diagnostic and System Error Messages Version 3.1.x Reference Guide
Page 67

MS_System Error Messages
The following <reasons for segmentation> can be displayed:
■ <EXGPLDB failed: Unable to activate platform>
Explanation: Exchange of Platform Service database between fabrics has
failed because activation of MS Platform Services failed on the other switch.
Recommended Action: The other switch may not support MS Platform
Service. Check capability using the command mscapabilityshow.
■ <PLCOMIT failed: Unable to activate platform>
Explanation: Exchange of Platform Service database between fabrics has
failed due to the failure of conditional activation of MS Platform Services on
the other switch.
Recommended Action: Contact Technical Support.
■ <EXGPLDB failed: Platform DB not mergeable>
Explanation: Exchange of Platform Service database between fabrics has
failed due to conflicting databases between the switches.
Recommended Action: Ensure mergeability of connecting fabrics. For
example, some DB objects may have conflicting definitions. Issue the
command msplatshow to show content of DB and check for conflicts.
■ <EXGPLDB failed: DB size exceeds limit>
Explanation: Exchange of Platform Service database between fabrics has
failed due to the violation of the size allowance for the MS Platform database.
Recommended Action: Ensure that the merged databases will not have a
final database size that exceeds the MS Platform database size limitation of
32 kB.
■ <Timeout: Ran out of retry count>
Explanation: Exceeded number of tries to merge MS Platform database with
another fabric. Errors may be present in the fabric intercommunication.
Recommended Action: Check the cable and logical link to ensure healthy
cable connections and retry the fabric merge. If the error recurs, contact
Technical Support.
■ <Security: security conflict>
Explanation: Security is currently enforced and the configuration state of the
MS Platform Service between merging fabrics is inconsistent.
67Diagnostic and System Error Messages Version 3.1.x Reference Guide
Page 68

System Error Messages
Recommended Action: A fabric may have both enabled and disabled MS
Platform Service states. Make both fabrics consistent using the commands
msplmgmtactivate and msplmgmtdeactivate.
Recommended Action
See individual <reasons for segmentation> in the Explanation section for
MS-PLDBSEG.
Severity
Warn ing
MS-PLSTATE
Message
<switch number> Debug MS-PLSTATE, 5, MS Platform Service Unstable
(<function code>: <message string> D = <domain number>)
Explanation
The Management Server (MS) Platform Service is unstable.
The following variables can be displayed:
■ <function code> invoking error
— <capmat> - msPlCapMatrix
— <CA> - msPlCondActivate
■ <message string>
— <No Resp for GCAP from>
Explanation: Switch did not respond to a request for GCAP (MS Get
Capabilities) command.
Recommended Action: No user action required.
— <GCAP sup but not PL by>
Explanation: GCAP (MS Get Capabilities) is supported, but the flag for
MS Platform Service is not set. Inconsistency observed.
Recommended Action: Set the flag for the MS Platform Service.
68 Diagnostic and System Error Messages Version 3.1.x Reference Guide
Page 69

— <GCAP Rejected (reason =BUSY) by>
— <Reject EXGPLDB from>
■ <domain number>
Explanation: This is the target domain that caused the error. It is unique to
the fabric.
Recommended Action
See individual <message string> in Explanation above.
Severity
MS_System Error Messages
Explanation: GCAP (MS Get Capabilities) is not supported by another
switch.
Recommended Action: No action required.
Explanation: Request to exchange platform database was rejected. The
other switch may be busy.
Recommended Action: No action required.
Debug
MS-RCSFAILED
Message
<switch number> Debug MS-RCSFAILED, 3, MS RCS failed. MS CT command =
<Command Transport command> RCS reason =<RCS reason code>
(<RCS reason code string>)
Explanation
Usage of the Reliable Commit Service (RCS) has failed in MS.
The specified Management Server (MS) <Command Transport command >
command for an RCS request failed for the specified <RCS reason code> and is
described in more detail in the <RCS reason code string>.
Recommended Action
Copy error message information and then contact Technical Support.
69Diagnostic and System Error Messages Version 3.1.x Reference Guide
Page 70

System Error Messages
Severity
Debug
MS-TIME_OUT
Message
<switch number> Error MS-TIME_OUT, 2, MS time out while <error>
Explanation
The Management Server (MS) timed out while acquiring a resource.
The following is displayed as the <error>:
■ <acquiring elsSemaRNID lock>
Explanation: Unable to acquire a semaphore lock for RNID.
Recommended Action
Reboot the switch and retry the request. If error recurs, contact Technical Support.
Severity
Error
MS-UNEXPECTED_IUDATASZ
Message
<switch number> Error MS-UNEXPECTED_IUDATASZ, 2, MS Unexpected iu_data_sz=
<number of bytes>
Explanation
The Management Server (MS) received Information Unit (IU) data of unexpected
size. The IU payload and the IU size may be inconsistent with each other or with
the command that is currently being processed.
Recommended Action
Retry the operation. If the error recurs, contact Technical Support.
70 Diagnostic and System Error Messages Version 3.1.x Reference Guide
Page 71

MS_System Error Messages
Severity
Error
MS-UNSTABLE_DCOUNT
Message
<switch number> Debug MS-UNSTABLE_DCOUNT, 5, MS detected ONLY 1 Domain
<domain in local resource>.
Explanation
The Management Server (MS) detected an unstable count of domains in its own
local resource.
Recommended Action
The fabric could be unstable. Try the operation again later or contact Technical
Support.
Severity
Debug
MS-UNSTABLE_FABRIC
Message
<switch number> Debug MS-UNSTABLE_FABRIC, 5, MS detected Unstable
Fabric(function code): <message string> d= <domain number>).
Explanation
The Management Server (MS) detected an unstable fabric; the command or
operation may not be successfully completed. The following elements appear in
the message:
■ <function code> invoking error
— <MsgPlatDBProc> - msPlatMsgPlatDBProc
— <MsgGCAP> - msPlatMsgGCAP
— <MsgPl(D)ACTV> - MsPlayMsgActivateProc
71Diagnostic and System Error Messages Version 3.1.x Reference Guide
Page 72

System Error Messages
■ <message string>
— <DOMAIN_INVALID for a req from>
— <No WWN for>
■ <domain number>
Explanation: Target domain that caused error. Unique to the fabric.
Recommended Action
Copy the error message string and then contact Technical Support.
Severity
Debug
Explanation: Domain is invalid for a request.
Explanation: Unable to acquire the World Wide Name for corresponding
domain.
72 Diagnostic and System Error Messages Version 3.1.x Reference Guide
Page 73

NBFSM_System Error Messages
NBFSM_System Error Messages
NBFSM is a part of the Fabric Shortest Path First (FSPF) protocol that handles a
neighboring or adjacent switch’s Finite State Machine.
Input to FSM is an event that moves a neighboring or adjacent switch (directly
connected to the local switch) from one state to another, based on specific events.
For example, when two switches are connected to each other using an ISL
(interswitch link) cable, they will be in the Init State. After both switches receive
HELLO messages, they move to the Database Exchange State, and so on.
NBFSM states are Down (0), Init (1), Database Exchange (2), Database
Acknowledge Wait (3), Database Wait (4), and Full (5).
NBFSM-DUPEPORTSCN
Message
<switch number> Debug NBFSM-DUPEPORTSCN, 5, Duplicate E_Port SCN from port
<port number> in state <state change number>
Explanation
A duplicate E_Port State Change Number was reported.
Recommended Action
No action required.
Severity
Debug
73Diagnostic and System Error Messages Version 3.1.x Reference Guide
Page 74

System Error Messages
NBFSM-NGBRSTATE
Message
<switch number> Error NBFSM-NGBRSTATE, 2, Wrong input: <state name> to
neighbor FSM, state <current state name>, port <port number>
Explanation
The wrong input was sent to the neighbor Finite State Machine.
Recommended Action
The input will be discarded. No user action is required.
Severity
Error
NBFSM-XMITFLAG
Message
<switch number> Warning NBFSM-XMITFLAG, 3, DB_XMIT_SET flag not set in
state <current state name> input <state name>, port <port number>
Explanation
From the current state, the database transmit set flag was not set for the specified
input state on the specified port.
Recommended Action
No user action required.
Severity
Warn ing
74 Diagnostic and System Error Messages Version 3.1.x Reference Guide
Page 75

PS_System Error Messages
PS_System Error Messages
The Performance Server daemon measures the amount of traffic between end
points or it measures traffic with particular frame formats, such as SCSI frames, IP
frames, and customer-defined frames.
PS-ASSERT
Message
<switch number> Error PS-ASSERT, 2, ASSERT <#> PS: Assertion failed <expr>
<file>:<line> Function: <function>() <argument1> <argument2> <argument3>
Explanation
The software assertion failed. The <#> is the number of arguments in the
assertion, <expr> is the expression causing the assertion, <file> is the file name,
<line> is the line number, and <function> is the function name. The <arguments
1,2,3> provide additional information about this assertion.
Recommended Action
Run the supportshow command, copy the error message output, and send both
to Technical Support.
Severity
Error
PS-MALLOC
Message
<switch number> Error PS-MALLOC, 2, malloc failed <argument 1>
Explanation
The switch failed memory allocation. The information provided in <argument 1>
describes where in the code the error occurred, for engineering troubleshooting.
75Diagnostic and System Error Messages Version 3.1.x Reference Guide
Page 76

System Error Messages
Recommended Action
Run the supportshow command for further information regarding memory
allocation. Copy the output and the error message and send both to Technical
Support.
Severity
Error
PS-TASKCREATE
Message
<switch number> Error PS-TASKCREATE, 2, PS: taskCreate() failed to create
task <argument 1>
Explanation
The Performance Server daemon failed to create a PSD task. The variable
<argument 1> provides details about this failure.
Recommended Action
Run the supportshow command and then contact Technical Support.
Severity
Error
76 Diagnostic and System Error Messages Version 3.1.x Reference Guide
Page 77

RA PID_System Error Messages
RAPID_System Error Messages
The Remote API Daemon (RAPID) is used by Fabric Access for API-related
tasks.
RAPID-AUTH_ERR
Message
<switch number> Warning RAPID-AUTH_ERR, 3, Authentication Error: client
<IP address> has bad credentials: <bad user name and password pair>
Explanation
An authentication error was reported. The specified address client <IP address>
has bad credentials.
Recommended Action
Severity
Enter the correct root, admin, or user name and password pair from the Fabric
Access API host.
Warn ing
77Diagnostic and System Error Messages Version 3.1.x Reference Guide
Page 78

System Error Messages
RCS_System Error Messages
Reliable Commit Service (RCS) System Error Messages get requests from
Zoning, Security, or the Management Server to pass data messages to switches in
the fabric. RCS then asks Reliable Transport Write and Read (RTWR) to deliver
the messages. RCS also acts as a gatekeeper and limits the number of outstanding
requests per Zoning, Security, or Management Server module.
RCS-APP_NOTREG
Message
<switch number> Error RCS-APP_NOTREG, 0, Application <application name> not
registered, HA State Replication ineffective
Explanation
If the specified application is not registered with RCS, then RCS returns this error.
Recommended Action
Collect <application name> information provided in the message and call
Technical Support.
Severity
Error
RCS-LOCAL_REJECT
Message
<switch number> Information RCS-LOCAL_REJECT, 1, State <current state>,
Application <application ID> returned <reject reason>
Explanation
The specified application on another switch rejected this RCS transaction with the
specified reject reason; RCS then returns this error and aborts the current
transaction. The current state describes at what point in the transaction the reject
occurred.
78 Diagnostic and System Error Messages Version 3.1.x Reference Guide
Page 79

Recommended Action
For the first reject, wait until the other user finishes; then resend the transaction. If
this reject occurs again, examine the correctness of the data being passed. If the
data is correct, collect information provided in the error message and call
Technical Support.
Severity
Informational
RCS-RCSENABLED
Message
<switch number> Debug RCS-RCSENABLED, 5, RCS has been enabled.
Explanation
RCS_System Error Messages
The RCS feature has been enabled.
Recommended Action
None required.
Severity
Debug
RCS-RCSENOMEM
Message
<switch number> Error RCS-RCSENOMEM, 2, Failed to allocate memory:
<function name>
Explanation
Memory has not been allocated. The specified RCS function failed to allocate
memory.
79Diagnostic and System Error Messages Version 3.1.x Reference Guide
Page 80

System Error Messages
Recommended Action
Check memory usage on the switch. Collect <function name> information
provided in the message and call Technical Support.
Severity
Error
RCS-RCSDISABLED
Message
<switch number> Debug RCS-RCSDISABLED, 5, RCS has been disabled. Some
switches in the fabric do not support this feature
Explanation
The RCS feature has been disabled on the local switch because not all switches in
the fabric support RCS. Currently, versions 2.6, 3.1, and 4.1 support the RCS
feature.
Recommended Action
Upgrade firmware to support RCS.
Severity
Debug
80 Diagnostic and System Error Messages Version 3.1.x Reference Guide
Page 81

RTWR_System Error Messages
RTWR_System Error Messages
Reliable Transport Write and Read (RTWR) helps deliver data messages to
specific switches in the fabric or to all of the switches in the fabric. For example, if
some of the switches are not reachable or are offline, RTWR returns an
“unreachable” message to the caller, allowing the caller to take the appropriate
action. If a switch does not respond, RTWR retries 100 times.
RTWR-FAILED
Message
<switch number> Error RTWR-FAILED, 2, RTWR <routine: error message>,
<detail 1>, <detail 2>, <detail 3>, <detail 4>, <detail 5>
Explanation
The RTWR failed. The variable <routine: error message> provides the name of
the routine having the error, and, if displayed, specific error information is
provided following the colon. The <details 1 2 3 4 5> provide additional
information to help the user or Technical Support isolate the problem.
The error message can display any of the following <details>:
■ <rtwrInit: No Memory>, 0x9abc, 0x8def, 100, 50, 123
Explanation: RTWR has run out of memory inside the rtwrInit function.
<detail 1>, if non-zero, contains the pointer of the payload received.
<detail 2>, if non-zero, contains the switch ID of the destination domain.
<detail 3>, if non-zero, contains the size of memory you should allocate.
<detail 4>, if non-zero, contains the thread ID.
<detail 5>, if non-zero, contains the process ID.
Recommended Action: Check the memory usage on the switch.
■ <rtwrTask: mqRead failed>, 0, 0, 0, 0, 0
Explanation: Cannot read from a message queue; could be out of memory.
Recommended Action: Check the memory usage on the switch or call
Technical Support.
■ <rtwrTask exited unexpectedly>, 0, 0, 0, 0, 0
Explanation: Internal error
Recommended Action: Call Technical Support.
81Diagnostic and System Error Messages Version 3.1.x Reference Guide
Page 82

System Error Messages
■ <rtwrRequest: No memory>, 0, 0, 0, 0, 0
■ <rtwrAsyncMultiRequest>, 0, 0, 0, 0, 0
■ <rtwrAsyncMultiRequest: pidlist_copy failed>, 0, 0, 0, 0, 0
■ <rtwrSyncRequest>, 0, 0, 0, 0, 0
Explanation: RTWR has run out of memory inside the rtwrInit function.
<detail 1>, if non-zero, contains the pointer of the payload received.
<detail 2>, if non-zero, contains the switch ID of the destination domain.
<detail 3>, if non-zero, contains the size of memory you should allocate.
<detail 4>, if non-zero, contains the thread ID.
<detail 5>, if non-zero, contains the process ID.
Recommended Action: Check the memory usage on the switch.
Explanation: Internal error.
Recommended Action: Call Technical Support.
Explanation: Out of memory.
Recommended Action: Check the memory usage on the switch or call
Technical Support.
Explanation: Internal error.
Recommended Action: Call Technical Support.
■ <rtwrSyncRequest: Unreachable domain>, 0xff, domain, 0x9abc, domain,
0xff
Explanation: Domain is not reachable.
Recommended Action: Use fabricshow to see if the domain is offline.
Check the physical ISLs for the domain.
■ <rtwrSyncRequest: Cannot create sync. semaphore>, 0, 0, 0, 0, 0
Explanation: Out of memory.
Recommended Action: Check the memory usage on the switch or call
Technical Support.
■ <rtwrSyncRequest: Cannot write message queue>, 0, 0, 0, 0, 0
Explanation: Out of memory.
Recommended Action: Check the memory usage on the switch or call
Technical Support.
■ <rtwrSyncRequest: semaTake failed>, 0, 0, 0, 0, 0
Explanation: Internal error.
Recommended Action: Call Technical Support.
■ <rtwrMsgProcess: msg NULL>, 0, 0, 0, 0, 0
Explanation: An empty message has been received. Internal error.
Recommended Action: Call Technical Support.
82 Diagnostic and System Error Messages Version 3.1.x Reference Guide
Page 83

RTWR_System Error Messages
■ <rtwrRequestProcess: target_bm Null>, 0, 0, 0, 0, 0
Explanation: Out of memory.
Recommended Action: Check the memory usage on the switch or call
Technical Support
■ <rtwrRequestProcess: cannot allocate fcAsyncMultiCB_t>, 0, 0, 0, 0, 0
Explanation: Out of memory.
Recommended Action: Check the memory usage on the switch or call
Technical Support.
■ <rtwrRequestProcess: rtwrMultiTransmit failed>, 0, 0, 0, 0, 0
Explanation: Transmission of payload to multiple destinations failed.
Recommended Action: Call Technical Support.
■ <rtwrRespProcess>, 0, 0, 0xff, 0xff, 0xff
Explanation: Invalid pointer to payload.
Recommended Action: Call Technical Support.
■ <rtwrRespProcess>, ...
Explanation: Internal error.
Recommended Action: Call Technical Support.
■ <rtwrRespProcess: realease_kiu failed>, ..., 0,0
Explanation: Internal error.
Recommended Action: Call Technical Support.
■ <rtwrRespProcess: no such state>, 0, 0, 0, 0, 0
Explanation: Internal error.
Recommended Action: Call Technical Support.
■ <rtwrTransmit>, domain, ...
Explanation: Transmission problem to specified domain.
Recommended Action: Use fabricshow to see if domain is offline. Check
the physical ISLs for the domain. Call Technical Support.
■ <rtwrTransmit: fcAsyncMultiSend failed>, 0, 0, 0, 0, 0
Explanation: Internal error.
Recommended Action: Call Technical Support.
Recommended Action
See action provided with each appropriate message above.
Severity
Error
83Diagnostic and System Error Messages Version 3.1.x Reference Guide
Page 84

System Error Messages
RTWR-TRANSMIT
Message
<switch number> warning RTWR-TRANSMIT, 3, RTWR <error message>, <detail 1>,
<detail 2>, <detail 3>, <detail 4>, <detail 5>
Explanation
RTWR has exhausted the maximum number of retries sending data to the
specified domain. Details are as follows:
■ <error message>: RTWR Transmit; maximum retries exhausted
■ <detail 1>: Port
■ <detail 2>: Domain
■ <detail 3>: Retry Count
■ <detail 4>: Status
■ <detail 5>: Process ID
Recommended Action
Using the fabricshow command, determine whether the specified Domain ID
is offline. Call Technical Support if the error persists.
Severity
Warn ing
84 Diagnostic and System Error Messages Version 3.1.x Reference Guide
Page 85

SEC_System Error Messages
This section describes security errors, warnings, and information that occur during
secure-related data management or fabric merge in secure mode. Administrators
should pay more attention to secure fabric to distinguish between internal switch
or fabric operation error or external attack. In case of external attack, the
administrator should react properly to stop the attack and protect the fabric.
SEC-RSENDFAIL
Message
<switch number> Error SEC-RSENDFAIL, 2, RCS process fails: %s
Explanation
The Reliable Commit Service (RCS) process failed to complete. RCS is a reliable
mechanism to transfer data from one switch to the other switches within the
fabric. This mechanism guarantees that either all switches update to the new
database or none of them update to the new database. This process can fail if one
switch in the fabric is either busy or in an error state that cannot accept the
database.
SEC_System Error Messages
Recommended Action
RCS is used when the security database is changed by a command issued by
security (for example, secpolicysave, secpolicyactivate,
secversionreset, and the like). If the switch is busy, the command may fail
the first time only. Retry after first fail. If the command fails consistently, contact
Technical Support.
Severity
Error
85Diagnostic and System Error Messages Version 3.1.x Reference Guide
Page 86

System Error Messages
SEC-SECDBFAIL
Message
<switch number> Warning SEC-SECDBFAIL, 3, Security data fails: %s
Explanation
This message occurs when the receiving switch fails to validate the security
database sent from the primary Fibre Channel switch. Probable causes for this
error can be that the data package is corrupted, the time stamp on the package is
out of range as a result of replay attack or out of sync time service, or the signature
verification failed. Signature verification failure can be caused by an internal error,
such as losing the primary public key, or it may be caused by an invalid database.
Recommended Action
Issue the secfabricshow command to verify that the fabric is still consistent.
All the switches should be in the Ready state. If a switch is in the Error state, the
database may not be correctly updated for that specific switch. Follow the
standard recovery process. The error may also be a result of an internal corruption
or a hacker attack to the secure fabric.
Severity
Warn ing
SEC-SECDLFAIL
Message
<switch number> Warning SEC-SECDLFAIL, 3, Fail to download security data to
domain <domain number> after <number of retries> retries
Explanation
The specified domain number failed to download security data after the specified
number of attempts. The primary will segment the failure switch after 30 tries.
The failure switch may have had some internal error and failed to accept the
database download.
86 Diagnostic and System Error Messages Version 3.1.x Reference Guide
Page 87

Recommended Action
Reset the version stamp on the switch to 0 and then rejoin the switch to the fabric.
If the switch consistently fails, contact Technical Support.
Severity
Error
SEC-SECINFO
Message
<switch number> Info SEC-SECINFO, 4 %s
Explanation
The switch has an unexpected error, such as low memory, queue full, failure to set
password, or failure to set SNMP string.
SEC_System Error Messages
Recommended Action
Depending on the information in the message, you should check the status of the
switch and then retry the process or command. If the problem persists, contact
Technical Support.
Severity
Informational
SEC-SECINFORM
Message
<switch number> Info SEC-SECINFORM, 4, Primary FCS receives data request
from domain <domain number>
87Diagnostic and System Error Messages Version 3.1.x Reference Guide
Page 88

System Error Messages
Explanation
The primary Fibre Channel Switch (FCS) received a data request from the
specified domain. For example, if the switch fails to update the database or is
attacked (data injection), a message is generated to the primary FCS to try to
correct and re-synchronize with the rest of the switches in the fabric.
Recommended Action
Check the fabric status using secfabricshow to verify that the fabric is not
being attacked by unauthorized users.
Severity
Informational
SEC-SEC_STATS
Message
<switch number> Warning SEC-SEC_STATS, 3, Security statistics error: %s
Explanation
The switch logs each error for any statistic-related security command
(secstatsshow, secstatsreset) to keep track of any security violations
on the switch. The counter is updated automatically when a security violation
occurs. This message may also occur if the updating counter fails.
Recommended Action
If the message is the result of a user command, retry the statistic command. If the
problem persists, contact Technical Support.
Severity
Warn ing
88 Diagnostic and System Error Messages Version 3.1.x Reference Guide
Page 89

SEC_System Error Messages
SEC-SECVIOL_API
Message
<switch number> Info SEC-SECVIOL_API, 4, Security violation: Unauthorized
host with IP address <IP address> tries to establish API connection.
Explanation
A security violation was reported. The specified unauthorized host attempted to
establish an API connection.
Recommended Action
Check to see whether an unauthorized host is accessing the switch through an API
connection. Take appropriate action.
Severity
Informational
SEC-SECVIOL_HTTP
Message
<switch number> Info SEC-SECVIOL_HTTP, 4, Security violation: Unauthorized
host with IP address <IP address> tries to establish HTTP connection.
Explanation
A security violation was reported. The specified unauthorized host attempted to
establish an HTTP connection.
89Diagnostic and System Error Messages Version 3.1.x Reference Guide
Page 90

System Error Messages
Recommended Action
Check to see whether an unauthorized host is accessing the switch through an API
connection. If so, determine who owns the host and why they are trying to access
the switch management via the API. Ask them to stop if they should not be
accessing the switch. If they should be accessing the switch, then add the host to
the security database so that it is authorized.
Severity
Informational
SEC-SECVIOL_TELNET
Message
<switch number> Info SEC-SECVIOL_TELNET, 4, Security violation:
Unauthorized host with IP address <IP address> tries to establish TELNET
session.
Explanation
A security violation was reported. The specified unauthorized host attempted to
establish a Telnet connection.
Recommended Action
Check to see whether an unauthorized host is accessing the switch through an API
connection. Take appropriate action.
Severity
Informational
90 Diagnostic and System Error Messages Version 3.1.x Reference Guide
Page 91

SECLIB_System Error Messages
SECLIB_System Error Messages
The SECLIB (Security Library) is a facility used by the FabOS modules. The
SECLIB provides functionality for enforcement of policies, identification of the
switch’s role in the fabric, and other tasks. Switch Connection Control (SCC),
Device Connection Control (DCC), Management Server (MS), and Internet
Protocol (IP) policies are enforced and Fibre Channel Switch (FCS) and non-FCS
roles are identified, using the SECLIB functions.
SECLIB-SECVIOL_DCC
Message
<switch number> Info SECLIB-SECVIOL_DCC, 4, Security violation:
Unauthorized device <device node name> tries to flogin to port <port number>
of switch <port node name>.
Explanation
A security violation was reported. The specified unauthorized device attempted to
flogin to the specified port and switch.
Recommended Action
Check DCC policy and verify that the specified device is allowed in the fabric and
is included in the DCC policy. If the specified device is not included in the policy,
add it to the policy. If the device is not allowed, this is a valid violation message
and an unauthorized entity is trying to gain access to the fabric. Action should be
taken as specified by your enterprise security policy.
Severity
Informational
91Diagnostic and System Error Messages Version 3.1.x Reference Guide
Page 92

System Error Messages
SECLIB-SECVIOL_LOGIN_API
Message
<switch number> Info SECLIB-SECVIOL_LOGIN_API, 4, Security violation: Login
failure attempt via API. IP Addr: <IP address>
Explanation
A security violation was reported. The specified unauthorized host attempted to
log in through an API connection; the login failed.
Recommended Action
Check API policy and verify that all hosts allowed to access the fabric are
included in the API policy. If the host is allowed in the fabric but not included in
the policy, add it to the policy.
If the host is not allowed in the fabric, this is a valid violation message and an
unauthorized entity is trying to access the fabric. Appropriate action should be
taken as specified by your enterprise security policy.
Severity
Informational
SECLIB-SECVIOL_LOGIN_HTTP
Message
<switch number> Info SECLIB-SECVIOL_LOGIN_HTTP, 4, Security violation:
Login failure attempt via HTTP. IP Addr: <IP address>
Explanation
A security violation was reported. The specified unauthorized device attempted to
log in through an HTTP connection; the login failed.
92 Diagnostic and System Error Messages Version 3.1.x Reference Guide
Page 93

SECLIB_System Error Messages
Recommended Action
Check the HTTP policy and verify that all hosts allowed access to the fabric are
included in the HTTP policy. If the host is allowed in the fabric but not included in
the policy, add it to the policy.
If the host is not allowed in the fabric, this is a valid violation message and an
unauthorized entity is trying to access the fabric. Appropriate action should be
taken as specified by your enterprise security policy.
Severity
Informational
SECLIB-SECVIOL_LOGIN_MODEM
Message
<switch number> Info SECLIB-SECVIOL_LOGIN_MODEM, 4, Security violation:
Login failure attempt via Modem.
Explanation
A security violation was reported. An unauthorized device attempted to log in
through a modem connection; the login failed.
Recommended Action
Check the serial policy and verify that the connection is allowed. If the connection
is allowed but not specified, allow connection from the serial policy.
If your serial policy does not allow connection, this is a valid violation message
and an unauthorized entity is trying to access the fabric. Appropriate action should
be taken as specified by your enterprise security policy.
Note: The serial policy controls both modem and serial access, so enabling access in
the serial policy will enable both modem and serial access.
Severity
Informational
93Diagnostic and System Error Messages Version 3.1.x Reference Guide
Page 94

System Error Messages
SECLIB-SECVIOL_LOGIN_REMOTE
Message
<switch number> Info SECLIB-SECVIOL_LOGIN_REMOTE, 4, Security violation:
Login failure attempt via TELNET/SSH/RSH. IP Addr: <IP address>
Explanation
A security violation was reported. The specified unauthorized remote device
attempted to log in through a Telnet or SSH connection; the login failed.
Recommended Action
Check the Telnet policy and verify that all hosts allowed access to the fabric
through Telnet or SSH are included in the Telnet policy. If the host is allowed
access to the fabric but is not included in the Telnet policy, add it to the policy.
If the host is not allowed access to the fabric, this is a valid violation message and
an unauthorized entity is trying to access the fabric. Appropriate action should be
taken as specified by your enterprise security policy.
Note: Telnet Policy controls access for both Telnet and SSH connections.
Severity
Informational
94 Diagnostic and System Error Messages Version 3.1.x Reference Guide
Page 95

SECLIB_System Error Messages
SECLIB-SECVIOL_LOGIN_SERIAL
Message
<switch number> Info SECLIB-SECVIOL_LOGIN_SERIAL, 4, Security violation:
Login failure attempt via SERIAL.
Explanation
A security violation was reported. An unauthorized device attempted to log in
through a serial connection; the login failed.
Recommended Action
Check the serial policy and verify that the connection is allowed. If the connection
is allowed but not specified, allow connection from serial policy.
If the serial policy does not allow connection, this is a valid violation message and
an unauthorized entity is trying to access the fabric. Appropriate action should be
taken as specified by your enterprise security policy.
Severity
Note: The serial policy controls both modem and serial access, so enabling access in
serial policy will enable both modem and serial access.
Informational
95Diagnostic and System Error Messages Version 3.1.x Reference Guide
Page 96

System Error Messages
SECLIB-SECVIOL_MSaccess
Message
<switch number> Info ECLIB-SECVIOL_MSaccess, 4, Security violation:
Unauthorized access from MS device node name <device node name>, device
port name <device port name>.
Explanation
A security violation was reported. The specified unauthorized Management
Server (MS) device attempted to establish a connection.
Recommended Action
Check the management server policy and verify that the connection is allowed. If
the connection is allowed but not specified, allow connection in the MS policy.
If the MS policy does not allow connection, this is a valid violation message and
an unauthorized entity is trying to access the fabric. Appropriate action should be
taken as specified by your enterprise security policy.
Severity
Informational
96 Diagnostic and System Error Messages Version 3.1.x Reference Guide
Page 97

SECLIB_System Error Messages
SECLIB-SECVIOL_MSfwrd
Message
<switch number> Info SECLIB-SECVIOL_MSfwrd, 4, Security violation: MS
command is forwarded from non primary FCS switch.
Explanation
A security violation was reported. A Management Server command was
forwarded from a non-primary Fibre Channel switch.
Recommended Action
No action required.
Severity
Informational
SECLIB-SECVIOL_MSop
Message
<switch number> Info SECLIB-SECVIOL_MSop, 4, Security violation: MS device
<device wwn> operates on non primary FCS switch.
Explanation
A security violation was reported. A Management Server device is operating on a
non-primary Fibre Channel switch.
Recommended Action
No action required.
Severity
Informational
97Diagnostic and System Error Messages Version 3.1.x Reference Guide
Page 98

System Error Messages
SECLIB-SECVIOL_RSNMP
Message
<switch number> Info SECLIB-SECVIOL_RSNMP, 4, Security violation:
Unauthorized host with IP address <IP address> tries to do SNMP read
operation.
Explanation
A security violation was reported. The specified unauthorized host attempted to
perform a Read SNMP operation (RSNMP).
Recommended Action
Check the RSNMP policy to verify that all of the hosts allowed access to the
fabric through SNMP read operations are included in the RSNMP policy. If the
host is allowed access to the fabric but not included in the RSNMP policy, add the
host to the policy.
If the host is not allowed access to the fabric, this is a valid violation message and
an unauthorized entity is trying to access the fabric. Appropriate action should be
taken as specified by your enterprise security policy.
Severity
Informational
SECLIB-SECVIOL_SCC
Message
<switch number> Info SECLIB-SECVIOL_SCC, 4, Security violation:
Unauthorized switch <switch wwn> tries to join secure fabric.
Explanation
A security violation was reported. The specified unauthorized switch attempted to
join the secure fabric.
98 Diagnostic and System Error Messages Version 3.1.x Reference Guide
Page 99

SECLIB_System Error Messages
Recommended Action
Check the Security Connection Control Policy (SCC Policy specifies the WWNs
of switches allowed in the fabric) to verify which switches are allowed in the
fabric. If the switch is allowed in the fabric but is not included in the SCC policy,
add the switch to the policy.
If the switch is not allowed in the fabric, this is a valid violation message and an
unauthorized entity is trying to access the fabric. Appropriate action should be
taken as specified by your enterprise security policy.
Severity
Informational
SECLIB-SECVIOL_WSNMP
Message
<switch number> Info SECLIB-SECVIOL_WSNMP, 4, Security violation:
Unauthorized host with IP address <IP address> tries to do SNMP write
operation.
Explanation
A security violation was reported. The specified unauthorized host attempted to
perform a write SNMP operation (WSNMP).
Recommended Action
Check the WSNMP policy and verify which hosts are allowed access to the fabric
through SNMP. If the host is allowed access to the fabric but is not included in the
policy, add the host to the policy.
If the host is not allowed access to the fabric, this is a valid violation message and
an unauthorized entity is trying to access the fabric. Appropriate action should be
taken as specified by your enterprise security policy.
Severity
Informational
99Diagnostic and System Error Messages Version 3.1.x Reference Guide
Page 100

System Error Messages
SLAP_System Error Messages
This section describes Switch Link Authentication Protocol (SLAP) error
messages. In secure mode every E-port goes through mutual authentication before
the E-port formation is completed. The following error messages describe the
failures that can occur during this authentication process. The administrator
should pay close attention, since these failures can have serious security
implications for the SAN.
SLAP_CERTCHECKFAIL
Message
<switch number> Error SLAP-CERTCHECKFAIL, 3, Security Violation:
Certificate verification failed on port %d
Probable Cause
The certificate on a port could not be verified against the root certificate.
Recommended Action
A switch is trying to join a fabric and its certificate is not valid. This could be
someone trying to get into the fabric who is not allowed. If it is a switch that
should be allowed, acquire a certificate for it. If it should not be allowed, the
switch should be disconnected from the fabric.
Severity
Error
SLAP_MALLOCFAIL
Message
<switch number> Error SLAP-MALLOCFAIL, 3, Malloc failed in SLAP daemon
Probable Cause
The SLAP daemon could not allocate memory.
100 Diagnostic and System Error Messages Version 3.1.x Reference Guide
 Loading...