

Page 1

HP Storage Essentials Storage Resource
Management Report Optimizer Software 6.0
Building Reports Using the Web Intelligence Java
Report Panel
First edition: July 2008
Page 2

Legal and notice information
© Copyright 2002-2008 Hewlett-Packard Development Company, L.P.
Hewlett-Packard Company makes no warranty of any kind with regard to this material, including, but not limited to, the implied
warranties of merchantability and fitness for a particular purpose. Hewlett-Packard shall not be liable for errors contained herein or
for incidental or consequential damages in connection with the furnishing, performance, or use of this material.
This document contains proprietary information, which is protected by copyright. No part of this document may be photocopied,
reproduced, or translated into another language without the prior written consent of Hewlett-Packard. The information is provided
“as is” without warranty of any kind and is subject to change without notice. The only warranties for HP products and services are
set forth in the express warranty statements accompanying such products and services. Nothing herein should be construed as
constituting an additional warranty. HP shall not be liable for technical or editorial errors or omissions contained herein.
Microsoft and Windows are registered trademarks of Microsoft Corporation. Oracle is a registered trademark of Oracle
Corporation. Sun, Solaris, Sun StorEdge, and Java are trademarks or registered trademarks of Sun Microsystems, Inc. in the United
States and other countries. AIX and IBM are registered trademarks of International Business Machines Corporation in the United
States, other countries or both. SGI and IRIX are registered trademarks of Silicon Graphics, Inc. Netscape is a registered trademark
of Netscape Communications Corporation in the United States and other countries. HDS and HiCommand are registered
trademarks of Hitachi Data Systems. HP, HP-UX, and OpenVMS, Tru64 UNIX are registered trademark of Hewlett-Packard
Development Company. QLogic is a trademark of QLogic Corporation. Emulex is a registered trademark of Emulex Corporation.
HBAnyware is a trademark of Emulex Corporation.
UNIX is a registered trademark in the U.S. and in other countries, exclusively licensed through X/Open Company, Ltd.
Other product and company names mentioned herein may be the trademarks of their respective owners.
Building Reports Using the Web Intelligence Java Report Panel
Page 3

Contents
1 About Web Intelligence . . . . . . . . . . . . . . . . . . . . . . . . . . . . . . . . . . . . . . . . . 15
How Web Intelligence performs business intelligence over the web . . . . . . . . . . . . . . . . . . . . . . 15
Interacting with Web Intelligence reports . . . . . . . . . . . . . . . . . . . . . . . . . . . . . . . . . . . . . . . . . 15
Viewing and printing reports . . . . . . . . . . . . . . . . . . . . . . . . . . . . . . . . . . . . . . . . . . 15
Drilling results . . . . . . . . . . . . . . . . . . . . . . . . . . . . . . . . . . . . . . . . . . . . . . . . . . . . 15
Performing on-report analysis . . . . . . . . . . . . . . . . . . . . . . . . . . . . . . . . . . . . . . . . . 16
Creating and editing Web Intelligence documents . . . . . . . . . . . . . . . . . . . . . . . . . . . . . . . . . . 17
Web Intelligence Java Report Panel . . . . . . . . . . . . . . . . . . . . . . . . . . . . . . . . . . . . . 17
Web Intelligence Query – HTML . . . . . . . . . . . . . . . . . . . . . . . . . . . . . . . . . . . . . . . 17
Web Intelligence HTML Report Panel . . . . . . . . . . . . . . . . . . . . . . . . . . . . . . . . . . . . 19
Contents
2 Getting up and running . . . . . . . . . . . . . . . . . . . . . . . . . . . . . . . . . . . . . . . . . 21
Overview . . . . . . . . . . . . . . . . . . . . . . . . . . . . . . . . . . . . . . . . . . . . . . . . . . . . . . . . . . . . . . 21
Logging in and out of InfoView . . . . . . . . . . . . . . . . . . . . . . . . . . . . . . . . . . . . . . . . . . . . . . . 21
Logging into InfoView . . . . . . . . . . . . . . . . . . . . . . . . . . . . . . . . . . . . . . . . . . . . . . . . . . . 21
Logging out of InfoView . . . . . . . . . . . . . . . . . . . . . . . . . . . . . . . . . . . . . . . . . . . . . . . . . . 22
Selecting your Web Intelligence document editor . . . . . . . . . . . . . . . . . . . . . . . . . . . . . . . . . . . 22
3 Creating and editing Web Intelligence documents. . . . . . . . . . . . . . . . . . . . . . . 25
Overview . . . . . . . . . . . . . . . . . . . . . . . . . . . . . . . . . . . . . . . . . . . . . . . . . . . . . . . . . . . . . . 25
Creating new documents . . . . . . . . . . . . . . . . . . . . . . . . . . . . . . . . . . . . . . . . . . . . . . . . . . . . 25
Editing existing documents. . . . . . . . . . . . . . . . . . . . . . . . . . . . . . . . . . . . . . . . . . . . . . . . . . . 26
Setting your Java Report Panel options . . . . . . . . . . . . . . . . . . . . . . . . . . . . . . . . . . . . . . . . . . 28
Java Report Panel interface tour . . . . . . . . . . . . . . . . . . . . . . . . . . . . . . . . . . . . . . . . . . . . . . . 29
Toolbars . . . . . . . . . . . . . . . . . . . . . . . . . . . . . . . . . . . . . . . . . . . . . . . . . . . . . . . . . . 30
Report tabs . . . . . . . . . . . . . . . . . . . . . . . . . . . . . . . . . . . . . . . . . . . . . . . . . . . . . . . . 30
4 Building basic data providers . . . . . . . . . . . . . . . . . . . . . . . . . . . . . . . . . . . . . 33
Overview . . . . . . . . . . . . . . . . . . . . . . . . . . . . . . . . . . . . . . . . . . . . . . . . . . . . . . . . . . . . . . 33
Understanding data providers and universes . . . . . . . . . . . . . . . . . . . . . . . . . . . . . . . . . . . . . . 33
What is a data provider? . . . . . . . . . . . . . . . . . . . . . . . . . . . . . . . . . . . . . . . . . . . . . . . . . 33
Data providers and queries are based on universes . . . . . . . . . . . . . . . . . . . . . . . . . . . . . . . 34
What does a universe contain? . . . . . . . . . . . . . . . . . . . . . . . . . . . . . . . . . . . . . . . . . . . . . 34
What types of objects can you use in a query? . . . . . . . . . . . . . . . . . . . . . . . . . . . . . . . . . . 35
Classes and Subclasses . . . . . . . . . . . . . . . . . . . . . . . . . . . . . . . . . . . . . . . . . . . . . . . . . . 35
Creating and running a query . . . . . . . . . . . . . . . . . . . . . . . . . . . . . . . . . . . . . . . . . . . . . . 36
Why build a query? . . . . . . . . . . . . . . . . . . . . . . . . . . . . . . . . . . . . . . . . . . . . . 36
How do you use the universe to build a query? . . . . . . . . . . . . . . . . . . . . . . . . . . . 36
What happens when you run a query? . . . . . . . . . . . . . . . . . . . . . . . . . . . . . . . . 37
What happens when you interrupt run query? . . . . . . . . . . . . . . . . . . . . . . . . . . . 37
Returned data is stored for analysis . . . . . . . . . . . . . . . . . . . . . . . . . . . . . . . . . . . . . . . . . . 37
Building Reports Using the Web Intelligence Java Report Panel 3
Page 4

Building a simple query. . . . . . . . . . . . . . . . . . . . . . . . . . . . . . . . . . . . . . . . . . . . . . . . . . . . . 37
Overview . . . . . . . . . . . . . . . . . . . . . . . . . . . . . . . . . . . . . . . . . . . . . . . . . . . . . . . . . . . . 38
Using the Data tab. . . . . . . . . . . . . . . . . . . . . . . . . . . . . . . . . . . . . . . . . . . . . . . . . . . . . . 38
Opening and closing a class folder. . . . . . . . . . . . . . . . . . . . . . . . . . . . . . . . . . . . . . . . 38
Building the query . . . . . . . . . . . . . . . . . . . . . . . . . . . . . . . . . . . . . . . . . . . . . . . . . . . . . . 39
Setting the scope of analysis . . . . . . . . . . . . . . . . . . . . . . . . . . . . . . . . . . . . . . . . . . . . . . . . . 40
What is a scope of analysis? . . . . . . . . . . . . . . . . . . . . . . . . . . . . . . . . . . . . . . . . . . . . . . 40
Setting levels of analysis . . . . . . . . . . . . . . . . . . . . . . . . . . . . . . . . . . . . . . . . . . . . . . . . . . 41
How many scope of analysis levels can you set? . . . . . . . . . . . . . . . . . . . . . . . . . . . . . . . . . 41
Viewing and editing the SQL behind the query definition. . . . . . . . . . . . . . . . . . . . . . . . . . . . . . 43
Defining query properties . . . . . . . . . . . . . . . . . . . . . . . . . . . . . . . . . . . . . . . . . . . . . . . . . . . 44
Query property options . . . . . . . . . . . . . . . . . . . . . . . . . . . . . . . . . . . . . . . . . . . 45
Running a simple query . . . . . . . . . . . . . . . . . . . . . . . . . . . . . . . . . . . . . . . . . . . . . . . . . . 47
Creating a simple query . . . . . . . . . . . . . . . . . . . . . . . . . . . . . . . . . . . . . . . . . . . . . . . . . . 47
Working with query contexts . . . . . . . . . . . . . . . . . . . . . . . . . . . . . . . . . . . . . . . . . . . . . . . . . 49
What is an ambiguous query? . . . . . . . . . . . . . . . . . . . . . . . . . . . . . . . . . . . . . . . . . . . . . 49
What is a context?. . . . . . . . . . . . . . . . . . . . . . . . . . . . . . . . . . . . . . . . . . . . . . . . . . . . . . 49
Defining how contexts are used in a query . . . . . . . . . . . . . . . . . . . . . . . . . . . . . . . . . . . . . 50
Interrupting data providers. . . . . . . . . . . . . . . . . . . . . . . . . . . . . . . . . . . . . . . . . . . . . . . . . . . 51
About Incompatible objects in data providers. . . . . . . . . . . . . . . . . . . . . . . . . . . . . . . . . . . . . . 52
Incompatible objects and SQL . . . . . . . . . . . . . . . . . . . . . . . . . . . . . . . . . . . . . . . . . . . . . . 53
How Web Intelligence handles incompatible objects . . . . . . . . . . . . . . . . . . . . . . . . . . . . . . 53
5 Working with combined queries . . . . . . . . . . . . . . . . . . . . . . . . . . . . . . . . . . . 55
Overview . . . . . . . . . . . . . . . . . . . . . . . . . . . . . . . . . . . . . . . . . . . . . . . . . . . . . . . . . . . . . . 55
Types of combined query . . . . . . . . . . . . . . . . . . . . . . . . . . . . . . . . . . . . . . . . . . . . . . . . . . . 55
What can you do with combined queries?. . . . . . . . . . . . . . . . . . . . . . . . . . . . . . . . . . . . . . . . 56
How does Web Intelligence generate combined queries?. . . . . . . . . . . . . . . . . . . . . . . . . . . 56
Building a combined query . . . . . . . . . . . . . . . . . . . . . . . . . . . . . . . . . . . . . . . . . . . . . . . . . . 57
Combined query structure . . . . . . . . . . . . . . . . . . . . . . . . . . . . . . . . . . . . . . . . . . . . . . . . . . . 58
Combined query precedence . . . . . . . . . . . . . . . . . . . . . . . . . . . . . . . . . . . . . . . . . . . . . . . . . 59
Multiple combined queries . . . . . . . . . . . . . . . . . . . . . . . . . . . . . . . . . . . . . . . . . . . . . . . . 60
6 Including multiple data providers. . . . . . . . . . . . . . . . . . . . . . . . . . . . . . . . . . . 63
Overview . . . . . . . . . . . . . . . . . . . . . . . . . . . . . . . . . . . . . . . . . . . . . . . . . . . . . . . . . . . . . . 63
Using multiple data providers. . . . . . . . . . . . . . . . . . . . . . . . . . . . . . . . . . . . . . . . . . . . . . . . . 63
Defining multiple data providers in a document . . . . . . . . . . . . . . . . . . . . . . . . . . . . . . . . . . . . 64
Duplicating data providers . . . . . . . . . . . . . . . . . . . . . . . . . . . . . . . . . . . . . . . . . . . . . . . . 67
Renaming data providers . . . . . . . . . . . . . . . . . . . . . . . . . . . . . . . . . . . . . . . . . . . . . . . . . 68
Moving data providers . . . . . . . . . . . . . . . . . . . . . . . . . . . . . . . . . . . . . . . . . . . . . . . . . . . 69
Purging data from multiple data providers . . . . . . . . . . . . . . . . . . . . . . . . . . . . . . . . . . . . . . . . 70
Synchronizing multiple data providers. . . . . . . . . . . . . . . . . . . . . . . . . . . . . . . . . . . . . . . . . . . 70
7 Merging dimensions from multiple data providers . . . . . . . . . . . . . . . . . . . . . . . 73
Overview . . . . . . . . . . . . . . . . . . . . . . . . . . . . . . . . . . . . . . . . . . . . . . . . . . . . . . . . . . . . . . 73
Merging dimensions . . . . . . . . . . . . . . . . . . . . . . . . . . . . . . . . . . . . . . . . . . . . . . . . . . . . . . . 73
In what situations do you merge dimensions? . . . . . . . . . . . . . . . . . . . . . . . . . . . . . . . . . . . 73
Which dimensions do you merge? . . . . . . . . . . . . . . . . . . . . . . . . . . . . . . . . . . . . . . . . . . . 74
4
Page 5

Merging dimensions . . . . . . . . . . . . . . . . . . . . . . . . . . . . . . . . . . . . . . . . . . . . . . . . . . . . 74
Automatic merging . . . . . . . . . . . . . . . . . . . . . . . . . . . . . . . . . . . . . . . . . . . . . . . . . . . . . 75
Working with merged dimensions in reports . . . . . . . . . . . . . . . . . . . . . . . . . . . . . . . . . . . . . . 76
Understanding the effects of merged dimensions . . . . . . . . . . . . . . . . . . . . . . . . . . . . . . . . . . . 77
Synchronizing data providers with different aggregation levels . . . . . . . . . . . . . . . . . . . . . . . 77
Extending the values returned by merged dimensions . . . . . . . . . . . . . . . . . . . . . . . . . . . . . . 78
Detail objects and merged dimensions . . . . . . . . . . . . . . . . . . . . . . . . . . . . . . . . . . . . . . . . . . 79
Filtering merged dimensions . . . . . . . . . . . . . . . . . . . . . . . . . . . . . . . . . . . . . . . . . . . . . . . 80
Report filters and merged dimensions . . . . . . . . . . . . . . . . . . . . . . . . . . . . . . . . . . . . . . 80
Section filters and merged dimensions . . . . . . . . . . . . . . . . . . . . . . . . . . . . . . . . . . . . . . 81
Block filters and merged dimensions . . . . . . . . . . . . . . . . . . . . . . . . . . . . . . . . . . . . . . . 81
Drilling on merged dimensions . . . . . . . . . . . . . . . . . . . . . . . . . . . . . . . . . . . . . . . . . . . . . 81
8 Filtering data retrieval using query filters . . . . . . . . . . . . . . . . . . . . . . . . . . . . . 83
Overview . . . . . . . . . . . . . . . . . . . . . . . . . . . . . . . . . . . . . . . . . . . . . . . . . . . . . . . . . . . . . . 83
How query filters work . . . . . . . . . . . . . . . . . . . . . . . . . . . . . . . . . . . . . . . . . . . . . . . . . . . . . 83
The difference between query filters and report filters . . . . . . . . . . . . . . . . . . . . . . . . . . . . . . 84
Query filters . . . . . . . . . . . . . . . . . . . . . . . . . . . . . . . . . . . . . . . . . . . . . . . . . . . . . . . . 84
Report filters. . . . . . . . . . . . . . . . . . . . . . . . . . . . . . . . . . . . . . . . . . . . . . . . . . . . . . . . 84
What makes up a filter? . . . . . . . . . . . . . . . . . . . . . . . . . . . . . . . . . . . . . . . . . . . . . . . . . . 85
What objects can I filter on the query? . . . . . . . . . . . . . . . . . . . . . . . . . . . . . . . . . . . . . . . . 85
Which operator should I choose? . . . . . . . . . . . . . . . . . . . . . . . . . . . . . . . . . . . . . . . . . . . 86
Different from, Not in List and Except . . . . . . . . . . . . . . . . . . . . . . . . . . . . . . . . . . . . . . 88
How do I specify the value(s)? . . . . . . . . . . . . . . . . . . . . . . . . . . . . . . . . . . . . . . . . . . . . . . 88
How many filters can I apply to a query? . . . . . . . . . . . . . . . . . . . . . . . . . . . . . . . . . . . . . . 89
Can I filter data without including the filtered object among the report data? . . . . . . . . . . . . . 89
Types of query filters . . . . . . . . . . . . . . . . . . . . . . . . . . . . . . . . . . . . . . . . . . . . . . . . . . . . . . . 89
Using predefined filters . . . . . . . . . . . . . . . . . . . . . . . . . . . . . . . . . . . . . . . . . . . . . . . . . . . . . 90
Creating custom query filters . . . . . . . . . . . . . . . . . . . . . . . . . . . . . . . . . . . . . . . . . . . . . . . . . 91
Using the quick filter option to create filters . . . . . . . . . . . . . . . . . . . . . . . . . . . . . . . . . . . . . 92
Using the Query Editor to create filters . . . . . . . . . . . . . . . . . . . . . . . . . . . . . . . . . . . . . . . . 93
Combining multiple filters on a query . . . . . . . . . . . . . . . . . . . . . . . . . . . . . . . . . . . . . . . . . . . 95
How you combine query filters . . . . . . . . . . . . . . . . . . . . . . . . . . . . . . . . . . . . . . . . . . . . . 96
Combining simple filters with combined filters . . . . . . . . . . . . . . . . . . . . . . . . . . . . . . . . . . . 97
Using And . . . . . . . . . . . . . . . . . . . . . . . . . . . . . . . . . . . . . . . . . . . . . . . . . . . . 97
Using Or . . . . . . . . . . . . . . . . . . . . . . . . . . . . . . . . . . . . . . . . . . . . . . . . . . . . . 98
Using And and Or . . . . . . . . . . . . . . . . . . . . . . . . . . . . . . . . . . . . . . . . . . . . . . 98
Using Or and And . . . . . . . . . . . . . . . . . . . . . . . . . . . . . . . . . . . . . . . . . . . . . . 98
Applying query filters to business questions . . . . . . . . . . . . . . . . . . . . . . . . . . . . . . . . . . . . . . . 99
Retrieving a range of values . . . . . . . . . . . . . . . . . . . . . . . . . . . . . . . . . . . . . . . . . . . . . . . 99
Using the In list operator to define filters . . . . . . . . . . . . . . . . . . . . . . . . . . . . . . . . . . . . . . 100
Retrieving data that includes a specific alphanumeric string . . . . . . . . . . . . . . . . . . . . . . . . 101
9 Filtering data using subqueries and database ranking . . . . . . . . . . . . . . . . . . . 105
Overview . . . . . . . . . . . . . . . . . . . . . . . . . . . . . . . . . . . . . . . . . . . . . . . . . . . . . . . . . . . . . 105
What is a subquery?. . . . . . . . . . . . . . . . . . . . . . . . . . . . . . . . . . . . . . . . . . . . . . . . . . . . . . 105
What can you do with subqueries? . . . . . . . . . . . . . . . . . . . . . . . . . . . . . . . . . . . . . . . . . 105
Building Reports Using the Web Intelligence Java Report Panel 5
Page 6

How do subqueries work? . . . . . . . . . . . . . . . . . . . . . . . . . . . . . . . . . . . . . . . . . . . . . . . 105
Building a subquery . . . . . . . . . . . . . . . . . . . . . . . . . . . . . . . . . . . . . . . . . . . . . . . . . . . . 106
Subquery parameters . . . . . . . . . . . . . . . . . . . . . . . . . . . . . . . . . . . . . . . . . . . . . . . . . . . 107
How the subquery components combine . . . . . . . . . . . . . . . . . . . . . . . . . . . . . . . . . . . . . . 109
What is a database ranking?. . . . . . . . . . . . . . . . . . . . . . . . . . . . . . . . . . . . . . . . . . . . . . . . 109
What can you do with a database ranking? . . . . . . . . . . . . . . . . . . . . . . . . . . . . . . . . . . . 110
How does a database ranking work?. . . . . . . . . . . . . . . . . . . . . . . . . . . . . . . . . . . . . . . . 110
Ranking parameters . . . . . . . . . . . . . . . . . . . . . . . . . . . . . . . . . . . . . . . . . . . . . . . . . . . . 110
Creating a database ranking . . . . . . . . . . . . . . . . . . . . . . . . . . . . . . . . . . . . . . . . . . . . . 111
10Building prompt filters on data providers . . . . . . . . . . . . . . . . . . . . . . . . . . . . 113
Overview . . . . . . . . . . . . . . . . . . . . . . . . . . . . . . . . . . . . . . . . . . . . . . . . . . . . . . . . . . . . . 113
What are prompts?. . . . . . . . . . . . . . . . . . . . . . . . . . . . . . . . . . . . . . . . . . . . . . . . . . . . . . . 113
What makes up a prompt? . . . . . . . . . . . . . . . . . . . . . . . . . . . . . . . . . . . . . . . . . . . . . . . 114
What objects can I filter with a prompt? . . . . . . . . . . . . . . . . . . . . . . . . . . . . . . . . . . . . . . 115
Which operator should I choose? . . . . . . . . . . . . . . . . . . . . . . . . . . . . . . . . . . . . . . . . . . 115
Choosing how prompts display . . . . . . . . . . . . . . . . . . . . . . . . . . . . . . . . . . . . . . . . . . . . 118
Merging prompts on multiple data providers . . . . . . . . . . . . . . . . . . . . . . . . . . . . . . . . . . . 119
The criteria for merging prompts . . . . . . . . . . . . . . . . . . . . . . . . . . . . . . . . . . . . 119
The display properties of the merged prompt . . . . . . . . . . . . . . . . . . . . . . . . . . . 120
The List of Values used by the merged prompt. . . . . . . . . . . . . . . . . . . . . . . . . . . 120
Adding prompts to documents . . . . . . . . . . . . . . . . . . . . . . . . . . . . . . . . . . . . . . . . . . . . . . . 120
Applying multiple prompts . . . . . . . . . . . . . . . . . . . . . . . . . . . . . . . . . . . . . . . . . . . . . . . . . . 121
Combining multiple prompts . . . . . . . . . . . . . . . . . . . . . . . . . . . . . . . . . . . . . . . . . . . . . . 121
11Inserting and formatting tables . . . . . . . . . . . . . . . . . . . . . . . . . . . . . . . . . . . 125
Overview . . . . . . . . . . . . . . . . . . . . . . . . . . . . . . . . . . . . . . . . . . . . . . . . . . . . . . . . . . . . . 125
Web Intelligence table templates . . . . . . . . . . . . . . . . . . . . . . . . . . . . . . . . . . . . . . . . . . . . . 125
Vertical tables . . . . . . . . . . . . . . . . . . . . . . . . . . . . . . . . . . . . . . . . . . . . . . . . . . . . . . . . 126
Horizontal tables . . . . . . . . . . . . . . . . . . . . . . . . . . . . . . . . . . . . . . . . . . . . . . . . . . . . . . 126
Crosstabs . . . . . . . . . . . . . . . . . . . . . . . . . . . . . . . . . . . . . . . . . . . . . . . . . . . . . . . . . . . 126
Crosstabs with dimensions in the body . . . . . . . . . . . . . . . . . . . . . . . . . . . . . . . . . . . . 127
Forms. . . . . . . . . . . . . . . . . . . . . . . . . . . . . . . . . . . . . . . . . . . . . . . . . . . . . . . . . . . . . . 128
Working in Structure or Results View. . . . . . . . . . . . . . . . . . . . . . . . . . . . . . . . . . . . . . . . . . . 128
Adding tables to reports . . . . . . . . . . . . . . . . . . . . . . . . . . . . . . . . . . . . . . . . . . . . . . . . . . . 129
Duplicating tables. . . . . . . . . . . . . . . . . . . . . . . . . . . . . . . . . . . . . . . . . . . . . . . . . . . . . . . . 134
Applying a different template to existing tables . . . . . . . . . . . . . . . . . . . . . . . . . . . . . . . . . . . 135
Adding or removing table rows or columns . . . . . . . . . . . . . . . . . . . . . . . . . . . . . . . . . . . . . . 138
Moving or swapping table rows or columns. . . . . . . . . . . . . . . . . . . . . . . . . . . . . . . . . . . . . . 141
Replacing table columns and rows . . . . . . . . . . . . . . . . . . . . . . . . . . . . . . . . . . . . . . . . . . . . 143
Modifying tables to create crosstabs . . . . . . . . . . . . . . . . . . . . . . . . . . . . . . . . . . . . . . . . . . . 144
Clearing cells and removing tables . . . . . . . . . . . . . . . . . . . . . . . . . . . . . . . . . . . . . . . . . . . . 146
Clearing cell contents from tables . . . . . . . . . . . . . . . . . . . . . . . . . . . . . . . . . . . . . . . . . . 146
Removing tables from reports . . . . . . . . . . . . . . . . . . . . . . . . . . . . . . . . . . . . . . . . . . . . . 147
Formatting tables and table cells . . . . . . . . . . . . . . . . . . . . . . . . . . . . . . . . . . . . . . . . . . . . . 148
Formatting table or cell backgrounds . . . . . . . . . . . . . . . . . . . . . . . . . . . . . . . . . . . . . . . . 149
Formatting borders . . . . . . . . . . . . . . . . . . . . . . . . . . . . . . . . . . . . . . . . . . . . . . . . . . . . 152
6
Page 7

Formatting values on table cells . . . . . . . . . . . . . . . . . . . . . . . . . . . . . . . . . . . . . . . . . . . . 153
Sizing cells . . . . . . . . . . . . . . . . . . . . . . . . . . . . . . . . . . . . . . . . . . . . . . . . . . . . . . . . . . 153
Setting properties for table headers and footers . . . . . . . . . . . . . . . . . . . . . . . . . . . . . . . . . . . 155
Setting page layout for tables. . . . . . . . . . . . . . . . . . . . . . . . . . . . . . . . . . . . . . . . . . . . . . . . 156
Selecting display properties for empty table cells . . . . . . . . . . . . . . . . . . . . . . . . . . . . . . . . . . 157
Showing or hiding empty tables, rows, columns . . . . . . . . . . . . . . . . . . . . . . . . . . . . . . 157
Avoiding duplicate row aggregation. . . . . . . . . . . . . . . . . . . . . . . . . . . . . . . . . . . . . . . . . . . 158
Copying tables. . . . . . . . . . . . . . . . . . . . . . . . . . . . . . . . . . . . . . . . . . . . . . . . . . . . . . . . . . 158
12Displaying information in free-standing cells . . . . . . . . . . . . . . . . . . . . . . . . . . 161
Overview . . . . . . . . . . . . . . . . . . . . . . . . . . . . . . . . . . . . . . . . . . . . . . . . . . . . . . . . . . . . . 161
What are free-standing cells?. . . . . . . . . . . . . . . . . . . . . . . . . . . . . . . . . . . . . . . . . . . . . . . . 161
Inserting text, images, and formulas . . . . . . . . . . . . . . . . . . . . . . . . . . . . . . . . . . . . . . . . . . . 162
Inserting information about the report data . . . . . . . . . . . . . . . . . . . . . . . . . . . . . . . . . . . . . . 164
Inserting page number information . . . . . . . . . . . . . . . . . . . . . . . . . . . . . . . . . . . . . . . . . . . . 165
Page Number. . . . . . . . . . . . . . . . . . . . . . . . . . . . . . . . . . . . . . . . . . . . . . . . . 166
Page Number/Total Pages . . . . . . . . . . . . . . . . . . . . . . . . . . . . . . . . . . . . . . . . 166
Total Number of Pages . . . . . . . . . . . . . . . . . . . . . . . . . . . . . . . . . . . . . . . . . . 166
Adding text to page number cells . . . . . . . . . . . . . . . . . . . . . . . . . . . . . . . . . . . . . . . . . . 167
Formatting free-standing cells . . . . . . . . . . . . . . . . . . . . . . . . . . . . . . . . . . . . . . . . . . . . . . . . 167
Copying free-standing cells . . . . . . . . . . . . . . . . . . . . . . . . . . . . . . . . . . . . . . . . . . . . . . . . . 168
13Inserting and formatting charts . . . . . . . . . . . . . . . . . . . . . . . . . . . . . . . . . . . 169
Overview . . . . . . . . . . . . . . . . . . . . . . . . . . . . . . . . . . . . . . . . . . . . . . . . . . . . . . . . . . . . . 169
About charts and chart templates . . . . . . . . . . . . . . . . . . . . . . . . . . . . . . . . . . . . . . . . . . . . . 169
Choosing the appropriate chart template . . . . . . . . . . . . . . . . . . . . . . . . . . . . . . . . . . . . . 169
Bar charts . . . . . . . . . . . . . . . . . . . . . . . . . . . . . . . . . . . . . . . . . . . . . . . . . . . . . . . . 169
Line charts . . . . . . . . . . . . . . . . . . . . . . . . . . . . . . . . . . . . . . . . . . . . . . . . . . . . . . . . 170
Area charts . . . . . . . . . . . . . . . . . . . . . . . . . . . . . . . . . . . . . . . . . . . . . . . . . . . . . . . 170
Pie charts. . . . . . . . . . . . . . . . . . . . . . . . . . . . . . . . . . . . . . . . . . . . . . . . . . . . . . . . . 170
Radar, Polar, and scatter charts . . . . . . . . . . . . . . . . . . . . . . . . . . . . . . . . . . . . . . . . . 170
Creating charts . . . . . . . . . . . . . . . . . . . . . . . . . . . . . . . . . . . . . . . . . . . . . . . . . . . . . . . . . 170
Selecting chart templates . . . . . . . . . . . . . . . . . . . . . . . . . . . . . . . . . . . . . . . . . . . . . . . . 171
Changing existing tables and charts to different chart types . . . . . . . . . . . . . . . . . . . . . . . . . . . 175
Applying different templates to charts. . . . . . . . . . . . . . . . . . . . . . . . . . . . . . . . . . . . . . . . 175
Dragging a different chart template onto a table or chart. . . . . . . . . . . . . . . . . . . . . . . . 176
Removing charts . . . . . . . . . . . . . . . . . . . . . . . . . . . . . . . . . . . . . . . . . . . . . . . . . . . . . . . . . 178
Working with charts . . . . . . . . . . . . . . . . . . . . . . . . . . . . . . . . . . . . . . . . . . . . . . . . . . . . . . 179
Setting page layout for charts . . . . . . . . . . . . . . . . . . . . . . . . . . . . . . . . . . . . . . . . . . . . . 179
Positioning charts on the report page . . . . . . . . . . . . . . . . . . . . . . . . . . . . . . . . . . . . . . . . 179
Positioning charts in relation to other charts or tables . . . . . . . . . . . . . . . . . . . . . . . . . . . . . 179
Setting page breaks for charts. . . . . . . . . . . . . . . . . . . . . . . . . . . . . . . . . . . . . . . . . . . . . 180
Formatting charts . . . . . . . . . . . . . . . . . . . . . . . . . . . . . . . . . . . . . . . . . . . . . . . . . . . . . . . . 180
About 2D charts . . . . . . . . . . . . . . . . . . . . . . . . . . . . . . . . . . . . . . . . . . . . . . . . . . . . . . 181
About 3D charts . . . . . . . . . . . . . . . . . . . . . . . . . . . . . . . . . . . . . . . . . . . . . . . . . . . . . . 181
About pie charts . . . . . . . . . . . . . . . . . . . . . . . . . . . . . . . . . . . . . . . . . . . . . . . . . . . . . . 182
Chart formatting options . . . . . . . . . . . . . . . . . . . . . . . . . . . . . . . . . . . . . . . . . . . . . . . . . 183
Building Reports Using the Web Intelligence Java Report Panel 7
Page 8

Setting the chart size . . . . . . . . . . . . . . . . . . . . . . . . . . . . . . . . . . . . . . . . . . . . . . . . . . . 183
Inserting and formatting titles for charts . . . . . . . . . . . . . . . . . . . . . . . . . . . . . . . . . . . . . . 184
Displaying charts with a 2D or 3D look . . . . . . . . . . . . . . . . . . . . . . . . . . . . . . . . . . . . . . 185
Adding background colors . . . . . . . . . . . . . . . . . . . . . . . . . . . . . . . . . . . . . . . . . . . . . . . 186
Formatting chart borders . . . . . . . . . . . . . . . . . . . . . . . . . . . . . . . . . . . . . . . . . . . . . . . . 186
Displaying chart floors and walls . . . . . . . . . . . . . . . . . . . . . . . . . . . . . . . . . . . . . . . . . . . 187
Formatting axis legends . . . . . . . . . . . . . . . . . . . . . . . . . . . . . . . . . . . . . . . . . . . . . . . . . 187
Formatting axis labels . . . . . . . . . . . . . . . . . . . . . . . . . . . . . . . . . . . . . . . . . . . . . . . . . . 189
Formatting axis values and axis markers. . . . . . . . . . . . . . . . . . . . . . . . . . . . . . . . . . . . . . 190
Changing axis scales from linear to logarithmic. . . . . . . . . . . . . . . . . . . . . . . . . . . . . . . . . 193
Linear scales. . . . . . . . . . . . . . . . . . . . . . . . . . . . . . . . . . . . . . . . . . . . . . . . . . 193
Logarithmic scales . . . . . . . . . . . . . . . . . . . . . . . . . . . . . . . . . . . . . . . . . . . . . . 194
Choosing chart data display options . . . . . . . . . . . . . . . . . . . . . . . . . . . . . . . . . . . . . . . . 194
Showing or hiding charts with no data. . . . . . . . . . . . . . . . . . . . . . . . . . . . . . . . . . . . . . . 196
Showing/hiding empty charts . . . . . . . . . . . . . . . . . . . . . . . . . . . . . . . . . . . . . . . . . . 196
Creating custom colors for chart elements . . . . . . . . . . . . . . . . . . . . . . . . . . . . . . . . . . . . . 197
Copying charts. . . . . . . . . . . . . . . . . . . . . . . . . . . . . . . . . . . . . . . . . . . . . . . . . . . . . . . . . . 197
14Formatting numbers and dates . . . . . . . . . . . . . . . . . . . . . . . . . . . . . . . . . . . 199
Overview . . . . . . . . . . . . . . . . . . . . . . . . . . . . . . . . . . . . . . . . . . . . . . . . . . . . . . . . . . . . . 199
Default formats. . . . . . . . . . . . . . . . . . . . . . . . . . . . . . . . . . . . . . . . . . . . . . . . . . . . . . . . . . 199
Applying predefined formats . . . . . . . . . . . . . . . . . . . . . . . . . . . . . . . . . . . . . . . . . . . . . . . . 199
Defining custom formats . . . . . . . . . . . . . . . . . . . . . . . . . . . . . . . . . . . . . . . . . . . . . . . . . . . 202
Quick reference to characters for creating custom cell formats. . . . . . . . . . . . . . . . . . . . . . . 203
Formatting cells displaying number and currency data. . . . . . . . . . . . . . . . . . . . . 204
Characters for formatting cells displaying date and time data. . . . . . . . . . . . . . . . 206
15Using sections, breaks, and sorts. . . . . . . . . . . . . . . . . . . . . . . . . . . . . . . . . . 211
Overview . . . . . . . . . . . . . . . . . . . . . . . . . . . . . . . . . . . . . . . . . . . . . . . . . . . . . . . . . . . . . 211
Using sections to group data on reports . . . . . . . . . . . . . . . . . . . . . . . . . . . . . . . . . . . . . . . . 211
What makes up a section? . . . . . . . . . . . . . . . . . . . . . . . . . . . . . . . . . . . . . . . . . . . . . . . 213
Creating sections. . . . . . . . . . . . . . . . . . . . . . . . . . . . . . . . . . . . . . . . . . . . . . . . . . . . . . 214
Creating subsections . . . . . . . . . . . . . . . . . . . . . . . . . . . . . . . . . . . . . . . . . . . . . . . . . . . 216
Setting section properties . . . . . . . . . . . . . . . . . . . . . . . . . . . . . . . . . . . . . . . . . . . . . . . . 216
Setting the page layout for sections . . . . . . . . . . . . . . . . . . . . . . . . . . . . . . . . . . . . . . . . . 217
Removing sections . . . . . . . . . . . . . . . . . . . . . . . . . . . . . . . . . . . . . . . . . . . . . . . . . . . . . 219
Using breaks to group data on tables . . . . . . . . . . . . . . . . . . . . . . . . . . . . . . . . . . . . . . . . . . 220
What is a break?. . . . . . . . . . . . . . . . . . . . . . . . . . . . . . . . . . . . . . . . . . . . . . . . . . . . . . 220
How is a break different from a section? . . . . . . . . . . . . . . . . . . . . . . . . . . . . . . . . . . . . . 220
How is data sorted when you insert a break? . . . . . . . . . . . . . . . . . . . . . . . . . . . . . . . . . . 221
Inserting breaks . . . . . . . . . . . . . . . . . . . . . . . . . . . . . . . . . . . . . . . . . . . . . . . . . . . . . . . 221
Using multiple breaks . . . . . . . . . . . . . . . . . . . . . . . . . . . . . . . . . . . . . . . . . . . . . . . . . . . 223
Removing breaks . . . . . . . . . . . . . . . . . . . . . . . . . . . . . . . . . . . . . . . . . . . . . . . . . . . . . . 224
. . . . . . . . . . . . . . . . . . . . . . . . . . . . . Setting display properties and page layout for breaks 224
Break display properties . . . . . . . . . . . . . . . . . . . . . . . . . . . . . . . . . . . . . . . . . 225
Break page layout properties . . . . . . . . . . . . . . . . . . . . . . . . . . . . . . . . . . . . . . 225
Using sorts to organize sections and data on tables . . . . . . . . . . . . . . . . . . . . . . . . . . . . . . . . 226
8
Page 9

Available sort orders . . . . . . . . . . . . . . . . . . . . . . . . . . . . . . . . . . . . . . . . . . . . . . . . . . . 227
Applying ascending or descending sorts . . . . . . . . . . . . . . . . . . . . . . . . . . . . . . . . . . . . . 227
Applying custom sorts . . . . . . . . . . . . . . . . . . . . . . . . . . . . . . . . . . . . . . . . . . . . . . . . . . 228
Prioritizing the order of multiple sorts on the same table . . . . . . . . . . . . . . . . . . . . . . . . . . . 228
16Ranking Data . . . . . . . . . . . . . . . . . . . . . . . . . . . . . . . . . . . . . . . . . . . . . . . 229
Overview . . . . . . . . . . . . . . . . . . . . . . . . . . . . . . . . . . . . . . . . . . . . . . . . . . . . . . . . . . . . . 229
Ranking workflows . . . . . . . . . . . . . . . . . . . . . . . . . . . . . . . . . . . . . . . . . . . . . . . . . . . . . . . 229
Creating a ranking using the Web Intelligence interface . . . . . . . . . . . . . . . . . . . . . . . . . . . 230
Ranking parameters . . . . . . . . . . . . . . . . . . . . . . . . . . . . . . . . . . . . . . . . . . . . . . . . . . . . 231
Ranking examples . . . . . . . . . . . . . . . . . . . . . . . . . . . . . . . . . . . . . . . . . . . . . . . . . . . . . 232
Ranking and sorts . . . . . . . . . . . . . . . . . . . . . . . . . . . . . . . . . . . . . . . . . . . . . . . . . . . . . 235
Tied rankings . . . . . . . . . . . . . . . . . . . . . . . . . . . . . . . . . . . . . . . . . . . . . . . . . . . . . . . . 235
Ranking and data order . . . . . . . . . . . . . . . . . . . . . . . . . . . . . . . . . . . . . . . . . . . . . . . . . 236
17Filtering the values displayed in reports . . . . . . . . . . . . . . . . . . . . . . . . . . . . . 239
Overview . . . . . . . . . . . . . . . . . . . . . . . . . . . . . . . . . . . . . . . . . . . . . . . . . . . . . . . . . . . . . 239
How report filters work . . . . . . . . . . . . . . . . . . . . . . . . . . . . . . . . . . . . . . . . . . . . . . . . . . . . 239
What makes up a report filter? . . . . . . . . . . . . . . . . . . . . . . . . . . . . . . . . . . . . . . . . . . . . 240
What objects can I filter? . . . . . . . . . . . . . . . . . . . . . . . . . . . . . . . . . . . . . . . . . . . . . . . . 242
Which operator should I choose? . . . . . . . . . . . . . . . . . . . . . . . . . . . . . . . . . . . . . . . . . . 242
How do I specify the value(s)? . . . . . . . . . . . . . . . . . . . . . . . . . . . . . . . . . . . . . . . . . . . . . 244
How many filters can I include in a report? . . . . . . . . . . . . . . . . . . . . . . . . . . . . . . . . . . . . 245
The difference between query filters and report filters . . . . . . . . . . . . . . . . . . . . . . . . . . . . . 246
Creating custom report filters . . . . . . . . . . . . . . . . . . . . . . . . . . . . . . . . . . . . . . . . . . . . . . . . 246
Applying multiple filters to a report . . . . . . . . . . . . . . . . . . . . . . . . . . . . . . . . . . . . . . . . . . . . 251
Viewing the filters applied to the report . . . . . . . . . . . . . . . . . . . . . . . . . . . . . . . . . . . . . . . . . 252
Editing and removing report filters . . . . . . . . . . . . . . . . . . . . . . . . . . . . . . . . . . . . . . . . . . . . 254
18Using standard calculations . . . . . . . . . . . . . . . . . . . . . . . . . . . . . . . . . . . . . 257
Overview . . . . . . . . . . . . . . . . . . . . . . . . . . . . . . . . . . . . . . . . . . . . . . . . . . . . . . . . . . . . . 257
Working with standard calculations . . . . . . . . . . . . . . . . . . . . . . . . . . . . . . . . . . . . . . . . . . . 257
What standard calculations are available? . . . . . . . . . . . . . . . . . . . . . . . . . . . . . . . . . . . . 257
Inserting calculations in tables and crosstabs . . . . . . . . . . . . . . . . . . . . . . . . . . . . . . . . . . . . . 258
Inserting a calculation in a table or crosstab. . . . . . . . . . . . . . . . . . . . . . . . . . . . . . . . . 258
Inserting multiple calculations . . . . . . . . . . . . . . . . . . . . . . . . . . . . . . . . . . . . . . . . . . . . . . . . 260
Removing calculations. . . . . . . . . . . . . . . . . . . . . . . . . . . . . . . . . . . . . . . . . . . . . . . . . . . . . 261
19Using alerters to highlight key results . . . . . . . . . . . . . . . . . . . . . . . . . . . . . . . 263
Overview . . . . . . . . . . . . . . . . . . . . . . . . . . . . . . . . . . . . . . . . . . . . . . . . . . . . . . . . . . . . . 263
How alerters work . . . . . . . . . . . . . . . . . . . . . . . . . . . . . . . . . . . . . . . . . . . . . . . . . . . . . . . 263
What makes up an alerter?. . . . . . . . . . . . . . . . . . . . . . . . . . . . . . . . . . . . . . . . . . . . . . . 264
How many conditions can you include in an alerter? . . . . . . . . . . . . . . . . . . . . . . . . . . . . . 265
What are sub-alerters? . . . . . . . . . . . . . . . . . . . . . . . . . . . . . . . . . . . . . . . . . . . . . . . . . . 265
Where can you apply alerters? . . . . . . . . . . . . . . . . . . . . . . . . . . . . . . . . . . . . . . . . . . . . 266
How many alerters can you include in a document?. . . . . . . . . . . . . . . . . . . . . . . . . . . . . . 266
How many alerters can you apply to a single table column or row?. . . . . . . . . . . . . . . . . . . 266
What highlighting changes can alerters activate? . . . . . . . . . . . . . . . . . . . . . . . . . . . . . . . 266
Building Reports Using the Web Intelligence Java Report Panel 9
Page 10

How are alerters applied to tables with breaks? . . . . . . . . . . . . . . . . . . . . . . . . . . . . . . . . 267
Creating alerters. . . . . . . . . . . . . . . . . . . . . . . . . . . . . . . . . . . . . . . . . . . . . . . . . . . . . . . . . 268
Formatting alerters . . . . . . . . . . . . . . . . . . . . . . . . . . . . . . . . . . . . . . . . . . . . . . . . . . . . . . . 275
Applying multiple conditions . . . . . . . . . . . . . . . . . . . . . . . . . . . . . . . . . . . . . . . . . . . . . . . . 280
Adding sub-alerters. . . . . . . . . . . . . . . . . . . . . . . . . . . . . . . . . . . . . . . . . . . . . . . . . . . . . . . 282
Switching alerters on or off . . . . . . . . . . . . . . . . . . . . . . . . . . . . . . . . . . . . . . . . . . . . . . . . . 287
Prioritizing alerters . . . . . . . . . . . . . . . . . . . . . . . . . . . . . . . . . . . . . . . . . . . . . . . . . . . . . . . 289
Editing, duplicating, and removing alerters . . . . . . . . . . . . . . . . . . . . . . . . . . . . . . . . . . . . . . 291
Using formulas to create advanced alerters . . . . . . . . . . . . . . . . . . . . . . . . . . . . . . . . . . . . . . 295
Building the condition for the alerter using the formula language . . . . . . . . . . . . . . . . . . . . . 297
Creating alerters that display strings in cells where values meet the alerter condition(s). . . . . . 297
Including a text, formula, or hyperlink for the alerter formatting . . . . . . . . . . . . . . . . . . . . . . 302
20Creating custom calculations . . . . . . . . . . . . . . . . . . . . . . . . . . . . . . . . . . . . 307
Overview . . . . . . . . . . . . . . . . . . . . . . . . . . . . . . . . . . . . . . . . . . . . . . . . . . . . . . . . . . . . . 307
Creating formulas. . . . . . . . . . . . . . . . . . . . . . . . . . . . . . . . . . . . . . . . . . . . . . . . . . . . . . . . 307
Using the Formula toolbar. . . . . . . . . . . . . . . . . . . . . . . . . . . . . . . . . . . . . . . . . . . . . . . . 308
Using the Formula Editor. . . . . . . . . . . . . . . . . . . . . . . . . . . . . . . . . . . . . . . . . . . . . . . . . 310
Including text in cells . . . . . . . . . . . . . . . . . . . . . . . . . . . . . . . . . . . . . . . . . . . . . . . . . . . 311
Saving formulas as variables. . . . . . . . . . . . . . . . . . . . . . . . . . . . . . . . . . . . . . . . . . . . . . 311
About functions . . . . . . . . . . . . . . . . . . . . . . . . . . . . . . . . . . . . . . . . . . . . . . . . . . . . . . . . . 312
About operators . . . . . . . . . . . . . . . . . . . . . . . . . . . . . . . . . . . . . . . . . . . . . . . . . . . . . . . . . 312
Mathematical operators . . . . . . . . . . . . . . . . . . . . . . . . . . . . . . . . . . . . . . . . . . . . . . . . . 312
Conditional operators . . . . . . . . . . . . . . . . . . . . . . . . . . . . . . . . . . . . . . . . . . . . . . . . . . 313
Logical operators. . . . . . . . . . . . . . . . . . . . . . . . . . . . . . . . . . . . . . . . . . . . . . . . . . . . . . 313
Context operators . . . . . . . . . . . . . . . . . . . . . . . . . . . . . . . . . . . . . . . . . . . . . . . . . . . . . 313
Function-specific operators . . . . . . . . . . . . . . . . . . . . . . . . . . . . . . . . . . . . . . . . . . . . . . . 313
Defining the calculation context . . . . . . . . . . . . . . . . . . . . . . . . . . . . . . . . . . . . . . . . . . . . . . 314
What are calculation contexts? . . . . . . . . . . . . . . . . . . . . . . . . . . . . . . . . . . . . . . . . . . . . 314
Default calculation contexts. . . . . . . . . . . . . . . . . . . . . . . . . . . . . . . . . . . . . . . . . . . . . . . 314
Default contexts in a vertical table. . . . . . . . . . . . . . . . . . . . . . . . . . . . . . . . . . . . . . . . 315
Default context in a horizontal table . . . . . . . . . . . . . . . . . . . . . . . . . . . . . . . . . . . . . . 315
Default contexts in a crosstab . . . . . . . . . . . . . . . . . . . . . . . . . . . . . . . . . . . . . . . . . . . 316
Default contexts in a section . . . . . . . . . . . . . . . . . . . . . . . . . . . . . . . . . . . . . . . . . . . . 317
Default contexts in a break. . . . . . . . . . . . . . . . . . . . . . . . . . . . . . . . . . . . . . . . . . . . . 318
Modifying the default calculation context using extended syntax. . . . . . . . . . . . . . . . . . . . . . . . 318
What is extended syntax? . . . . . . . . . . . . . . . . . . . . . . . . . . . . . . . . . . . . . . . . . . . . . 318
What is an input context? . . . . . . . . . . . . . . . . . . . . . . . . . . . . . . . . . . . . . . . . . . . . . 318
Specifying dimensions in input and output contexts . . . . . . . . . . . . . . . . . . . . . . . . . . . . 319
What is an output context? . . . . . . . . . . . . . . . . . . . . . . . . . . . . . . . . . . . . . . . . . . . . 319
Specifying input and output contexts . . . . . . . . . . . . . . . . . . . . . . . . . . . . . . . . . . . . . . 320
Extended syntax context operators . . . . . . . . . . . . . . . . . . . . . . . . . . . . . . . . . . . . . . . 323
The In context operator . . . . . . . . . . . . . . . . . . . . . . . . . . . . . . . . . . . . . . . . . . 323
The ForEach context operator . . . . . . . . . . . . . . . . . . . . . . . . . . . . . . . . . . . . . . 325
The ForAll context operator . . . . . . . . . . . . . . . . . . . . . . . . . . . . . . . . . . . . . . . 325
Extended syntax keywords . . . . . . . . . . . . . . . . . . . . . . . . . . . . . . . . . . . . . . . . . . . . . . . 326
The Report keyword . . . . . . . . . . . . . . . . . . . . . . . . . . . . . . . . . . . . . . . . . . . . . . . . . 326
10
Page 11

The Section keyword . . . . . . . . . . . . . . . . . . . . . . . . . . . . . . . . . . . . . . . . . . . . . . . . . 327
The Break keyword . . . . . . . . . . . . . . . . . . . . . . . . . . . . . . . . . . . . . . . . . . . . . . . . . . 328
The Block keyword . . . . . . . . . . . . . . . . . . . . . . . . . . . . . . . . . . . . . . . . . . . . . . . . . . 329
The Body keyword . . . . . . . . . . . . . . . . . . . . . . . . . . . . . . . . . . . . . . . . . . . . . . . . . . 330
Using keywords to make reports generic . . . . . . . . . . . . . . . . . . . . . . . . . . . . . . . . . . . . . 331
Examples of useful formulas . . . . . . . . . . . . . . . . . . . . . . . . . . . . . . . . . . . . . . . . . . . . . . . . . 333
21Web Intelligence functions . . . . . . . . . . . . . . . . . . . . . . . . . . . . . . . . . . . . . . 337
Overview . . . . . . . . . . . . . . . . . . . . . . . . . . . . . . . . . . . . . . . . . . . . . . . . . . . . . . . . . . . . . 337
What is a function? . . . . . . . . . . . . . . . . . . . . . . . . . . . . . . . . . . . . . . . . . . . . . . . . . . . . . . 337
Function prototypes . . . . . . . . . . . . . . . . . . . . . . . . . . . . . . . . . . . . . . . . . . . . . . . . . . . . 337
Using functions. . . . . . . . . . . . . . . . . . . . . . . . . . . . . . . . . . . . . . . . . . . . . . . . . . . . . . . . . . 338
Function examples and descriptions . . . . . . . . . . . . . . . . . . . . . . . . . . . . . . . . . . . . . . . . . . . 339
Function reference . . . . . . . . . . . . . . . . . . . . . . . . . . . . . . . . . . . . . . . . . . . . . . . . . . . . . . . 341
22Saving formulas as variables . . . . . . . . . . . . . . . . . . . . . . . . . . . . . . . . . . . . 343
Overview . . . . . . . . . . . . . . . . . . . . . . . . . . . . . . . . . . . . . . . . . . . . . . . . . . . . . . . . . . . . . 343
Creating, editing, and deleting variables. . . . . . . . . . . . . . . . . . . . . . . . . . . . . . . . . . . . . . . . 343
Creating formulas . . . . . . . . . . . . . . . . . . . . . . . . . . . . . . . . . . . . . . . . . . . . . . . . . . . . . 343
Saving formulas as variables. . . . . . . . . . . . . . . . . . . . . . . . . . . . . . . . . . . . . . . . . . . . . . 343
Associating details with dimensions. . . . . . . . . . . . . . . . . . . . . . . . . . . . . . . . . . . . . . . 346
Editing and deleting variables . . . . . . . . . . . . . . . . . . . . . . . . . . . . . . . . . . . . . . . . . . . . . 346
Using variables to simplify formulas . . . . . . . . . . . . . . . . . . . . . . . . . . . . . . . . . . . . . . . . . . . 346
Simplifying a variance formula with variables . . . . . . . . . . . . . . . . . . . . . . . . . . . . . . . . . . 347
23Troubleshooting formulas . . . . . . . . . . . . . . . . . . . . . . . . . . . . . . . . . . . . . . . 351
Overview . . . . . . . . . . . . . . . . . . . . . . . . . . . . . . . . . . . . . . . . . . . . . . . . . . . . . . . . . . . . . 351
#DIV/0 . . . . . . . . . . . . . . . . . . . . . . . . . . . . . . . . . . . . . . . . . . . . . . . . . . . . . . . . . . . . . . . 351
#MULTIVALUE . . . . . . . . . . . . . . . . . . . . . . . . . . . . . . . . . . . . . . . . . . . . . . . . . . . . . . . . . . 351
#OVERFLOW. . . . . . . . . . . . . . . . . . . . . . . . . . . . . . . . . . . . . . . . . . . . . . . . . . . . . . . . . . . 352
#SYNTAX . . . . . . . . . . . . . . . . . . . . . . . . . . . . . . . . . . . . . . . . . . . . . . . . . . . . . . . . . . . . . 352
#INCOMPATIBLE . . . . . . . . . . . . . . . . . . . . . . . . . . . . . . . . . . . . . . . . . . . . . . . . . . . . . . . . 352
#RANK . . . . . . . . . . . . . . . . . . . . . . . . . . . . . . . . . . . . . . . . . . . . . . . . . . . . . . . . . . . . . . . 352
#DATASYNC . . . . . . . . . . . . . . . . . . . . . . . . . . . . . . . . . . . . . . . . . . . . . . . . . . . . . . . . . . . 353
#CONTEXT . . . . . . . . . . . . . . . . . . . . . . . . . . . . . . . . . . . . . . . . . . . . . . . . . . . . . . . . . . . . 353
#SECURITY . . . . . . . . . . . . . . . . . . . . . . . . . . . . . . . . . . . . . . . . . . . . . . . . . . . . . . . . . . . . 353
#RECURSIVE . . . . . . . . . . . . . . . . . . . . . . . . . . . . . . . . . . . . . . . . . . . . . . . . . . . . . . . . . . . 354
#ERROR . . . . . . . . . . . . . . . . . . . . . . . . . . . . . . . . . . . . . . . . . . . . . . . . . . . . . . . . . . . . . . 354
24Setting up documents for drill analysis . . . . . . . . . . . . . . . . . . . . . . . . . . . . . . 355
Overview . . . . . . . . . . . . . . . . . . . . . . . . . . . . . . . . . . . . . . . . . . . . . . . . . . . . . . . . . . . . . 355
What is drill? . . . . . . . . . . . . . . . . . . . . . . . . . . . . . . . . . . . . . . . . . . . . . . . . . . . . . . . . . . . 355
Setting your drill options . . . . . . . . . . . . . . . . . . . . . . . . . . . . . . . . . . . . . . . . . . . . . . . . . . . 356
Available drill options . . . . . . . . . . . . . . . . . . . . . . . . . . . . . . . . . . . . . . . . . . . . . . . . . . 356
Start drill on the existing report or on a duplicate report . . . . . . . . . . . . . . . . . . . . . . . . 356
Being prompted if a drill action requires additional data . . . . . . . . . . . . . . . . . . . . . . . . 357
Synchronizing or not synchronizing drill on all blocks in the report . . . . . . . . . . . . . . . . . 357
Showing or hiding the Drill toolbar . . . . . . . . . . . . . . . . . . . . . . . . . . . . . . . . . . . . . . . 358
Building Reports Using the Web Intelligence Java Report Panel 11
Page 12

Query drill . . . . . . . . . . . . . . . . . . . . . . . . . . . . . . . . . . . . . . . . . . . . . . . . . . . . . . . . 359
Setting your drill options . . . . . . . . . . . . . . . . . . . . . . . . . . . . . . . . . . . . . . . . . . . . . . . . . 359
Making documents drillable. . . . . . . . . . . . . . . . . . . . . . . . . . . . . . . . . . . . . . . . . . . . . . . . . 361
Specifying the scope of analysis for a document . . . . . . . . . . . . . . . . . . . . . . . . . . . . . . . . 361
About drill paths and hierarchies . . . . . . . . . . . . . . . . . . . . . . . . . . . . . . . . . . . . . . . . . . . 362
Beginning your drill session . . . . . . . . . . . . . . . . . . . . . . . . . . . . . . . . . . . . . . . . . . . . . . . . . 364
Starting drill mode . . . . . . . . . . . . . . . . . . . . . . . . . . . . . . . . . . . . . . . . . . . . . . . . . . . . . 364
Drilling on dimensions in tables and sections . . . . . . . . . . . . . . . . . . . . . . . . . . . . . . . . . . . . . 366
Drilling down . . . . . . . . . . . . . . . . . . . . . . . . . . . . . . . . . . . . . . . . . . . . . . . . . . . . . . . . 368
Drilling up . . . . . . . . . . . . . . . . . . . . . . . . . . . . . . . . . . . . . . . . . . . . . . . . . . . . . . . . . . 369
Drilling by. . . . . . . . . . . . . . . . . . . . . . . . . . . . . . . . . . . . . . . . . . . . . . . . . . . . . . . . . . . 370
Choosing a drill path when more than one is possible . . . . . . . . . . . . . . . . . . . . . . . . . . . . 373
Retrieving more levels of data to the report . . . . . . . . . . . . . . . . . . . . . . . . . . . . . . . . . . . . 374
Drilling on measures in tables and sections . . . . . . . . . . . . . . . . . . . . . . . . . . . . . . . . . . . . . . 376
Synchronizing drill across multiple tables and charts. . . . . . . . . . . . . . . . . . . . . . . . . . . . . . . . 378
Synchronizing the drill on all blocks in a report . . . . . . . . . . . . . . . . . . . . . . . . . . . . . . . . . 378
Drilling on only the selected block in a report . . . . . . . . . . . . . . . . . . . . . . . . . . . . . . . . . . 379
Drilling on charts . . . . . . . . . . . . . . . . . . . . . . . . . . . . . . . . . . . . . . . . . . . . . . . . . . . . . . . . 380
Drilling on dimensions via chart axes . . . . . . . . . . . . . . . . . . . . . . . . . . . . . . . . . . . . . . . . 380
Drilling on measures in charts . . . . . . . . . . . . . . . . . . . . . . . . . . . . . . . . . . . . . . . . . . . . . 382
Limitations when drilling on measures on certain chart types . . . . . . . . . . . . . . . . . . . . . . . . 383
Drilling on axis legends . . . . . . . . . . . . . . . . . . . . . . . . . . . . . . . . . . . . . . . . . . . . . . . . . 384
Using filters when you drill. . . . . . . . . . . . . . . . . . . . . . . . . . . . . . . . . . . . . . . . . . . . . . . . . . 385
Using the Drill toolbar . . . . . . . . . . . . . . . . . . . . . . . . . . . . . . . . . . . . . . . . . . . . . . . . . . 385
Changing filter values during drill analysis . . . . . . . . . . . . . . . . . . . . . . . . . . . . . . . . . . . . 386
Adding and removing filters . . . . . . . . . . . . . . . . . . . . . . . . . . . . . . . . . . . . . . . . . . . . . . 387
Inserting the DrillFilters cell into your report . . . . . . . . . . . . . . . . . . . . . . . . . . . . . . . . . . . . 389
Saving reports with filters . . . . . . . . . . . . . . . . . . . . . . . . . . . . . . . . . . . . . . . . . . . . . . . . 389
Refreshing data in a report with prompts . . . . . . . . . . . . . . . . . . . . . . . . . . . . . . . . . . . . . 390
Using query drill. . . . . . . . . . . . . . . . . . . . . . . . . . . . . . . . . . . . . . . . . . . . . . . . . . . . . . . . . 391
When do you use query drill? . . . . . . . . . . . . . . . . . . . . . . . . . . . . . . . . . . . . . . . . . . . . . 392
Drilling with query drill . . . . . . . . . . . . . . . . . . . . . . . . . . . . . . . . . . . . . . . . . . . . . . . . . . 392
Drilling down . . . . . . . . . . . . . . . . . . . . . . . . . . . . . . . . . . . . . . . . . . . . . . . . . . . . . . 392
Drilling up . . . . . . . . . . . . . . . . . . . . . . . . . . . . . . . . . . . . . . . . . . . . . . . . . . . . . . . . 393
Query drill and the scope of analysis . . . . . . . . . . . . . . . . . . . . . . . . . . . . . . . . . . . . . 393
Query drill and other reports based on the same data provider . . . . . . . . . . . . . . . . . . . 393
Query drill and drill snapshots . . . . . . . . . . . . . . . . . . . . . . . . . . . . . . . . . . . . . . . . . . 393
Activating query drill . . . . . . . . . . . . . . . . . . . . . . . . . . . . . . . . . . . . . . . . . . . . . . . . . . . 394
Ending Drill Mode . . . . . . . . . . . . . . . . . . . . . . . . . . . . . . . . . . . . . . . . . . . . . . . . . . . . . . . 394
Ending your drill session. . . . . . . . . . . . . . . . . . . . . . . . . . . . . . . . . . . . . . . . . . . . . . . . . 394
Saving your drilled results. . . . . . . . . . . . . . . . . . . . . . . . . . . . . . . . . . . . . . . . . . . . . . . . 394
Printing your report in drill mode . . . . . . . . . . . . . . . . . . . . . . . . . . . . . . . . . . . . . . . . . . . 395
25Saving and deleting Web Intelligence documents . . . . . . . . . . . . . . . . . . . . . . 397
Overview . . . . . . . . . . . . . . . . . . . . . . . . . . . . . . . . . . . . . . . . . . . . . . . . . . . . . . . . . . . . . 397
Saving Web Intelligence documents to InfoView. . . . . . . . . . . . . . . . . . . . . . . . . . . . . . . . . . . 397
Deleting Web Intelligence documents . . . . . . . . . . . . . . . . . . . . . . . . . . . . . . . . . . . . . . . . . . 398
12
Page 13

Saving documents as Excel or PDF files . . . . . . . . . . . . . . . . . . . . . . . . . . . . . . . . . . . . . . . . . 398
Saving Web Intelligence documents as Excel Spreadsheets. . . . . . . . . . . . . . . . . . . . . . . . . 399
Generating Web Intelligence documents to PDF . . . . . . . . . . . . . . . . . . . . . . . . . . . . . . . . 399
26Linking documents with OpenDocument . . . . . . . . . . . . . . . . . . . . . . . . . . . . . 401
Overview . . . . . . . . . . . . . . . . . . . . . . . . . . . . . . . . . . . . . . . . . . . . . . . . . . . . . . . . . . . . . 401
How OpenDocument works . . . . . . . . . . . . . . . . . . . . . . . . . . . . . . . . . . . . . . . . . . . . . . . . . 401
Using prompts to filter results in the opened document . . . . . . . . . . . . . . . . . . . . . . . . . . . . 401
Supported document types. . . . . . . . . . . . . . . . . . . . . . . . . . . . . . . . . . . . . . . . . . . . . . . . . . 402
OpenDocument syntax . . . . . . . . . . . . . . . . . . . . . . . . . . . . . . . . . . . . . . . . . . . . . . . . . . . . 402
OpenDocument parameters . . . . . . . . . . . . . . . . . . . . . . . . . . . . . . . . . . . . . . . . . . . . . . 402
Further information on syntax and parameters. . . . . . . . . . . . . . . . . . . . . . . . . . . . . . . . . . 411
URL encoding. . . . . . . . . . . . . . . . . . . . . . . . . . . . . . . . . . . . . . . . . . . . . . . . . . . . . . 411
Trailing spaces . . . . . . . . . . . . . . . . . . . . . . . . . . . . . . . . . . . . . . . . . . . . . . . . . . . . . 411
Case sensitivity. . . . . . . . . . . . . . . . . . . . . . . . . . . . . . . . . . . . . . . . . . . . . . . . . . . . . 411
Length limit . . . . . . . . . . . . . . . . . . . . . . . . . . . . . . . . . . . . . . . . . . . . . . . . . . . . . . . 411
Prompts for OLAP Intelligence report targets . . . . . . . . . . . . . . . . . . . . . . . . . . . . . . . . . 411
Using the lsS parameter with OLAP Intelligence . . . . . . . . . . . . . . . . . . . . . . . . . . . . . . 411
Using the lsM parameter with OLAP Intelligence . . . . . . . . . . . . . . . . . . . . . . . . . . . . . . 412
Sub-reports. . . . . . . . . . . . . . . . . . . . . . . . . . . . . . . . . . . . . . . . . . . . . . . . . . . . . . . . 412
27Printing Web Intelligence documents . . . . . . . . . . . . . . . . . . . . . . . . . . . . . . . 413
Overview . . . . . . . . . . . . . . . . . . . . . . . . . . . . . . . . . . . . . . . . . . . . . . . . . . . . . . . . . . . . . 413
Printing the reports in documents . . . . . . . . . . . . . . . . . . . . . . . . . . . . . . . . . . . . . . . . . . . . . 413
How Web Intelligence organizes page breaks . . . . . . . . . . . . . . . . . . . . . . . . . . . . . . . . . 414
Printing reports in Web Intelligence documents . . . . . . . . . . . . . . . . . . . . . . . . . . . . . . . . . 414
Index . . . . . . . . . . . . . . . . . . . . . . . . . . . . . . . . . . . . . . . . . . . . . . . . . . . . . . . 417
Building Reports Using the Web Intelligence Java Report Panel 13
Page 14

14
Page 15

1
About Web Intelligence
How Web Intelligence performs business intelligence over the web
Web Intelligence provides business users an easy to use interactive and flexible user
interface for building and analyzing reports on corporate data over the web, on secured
intranets and extranets. The Web Intelligence software is installed by your administrator on
a web server on your corporate network.
To use Web Intelligence from you local computer, you log into the business intelligence
portal InfoView via your Internet browser. Then, depending on your security profile, you
can interact with the reports in corporate documents or edit or build your own documents
using a Web Intelligence report panel or query panel.
Interacting with Web Intelligence reports
Depending on your security profile and on how Web Intelligence is deployed across your
organization, you can view, analyze, or enhance and modify the data displayed on
reports.
Viewing and printing reports
Once logged into the business intelligence portal InfoView, you can access Web
Intelligence documents and view reports. Onscreen navigation is made easy with
page-to-page navigation buttons and a document map that allows you to jump from
section to section or report to report.
Drilling results
The same document can provide the information adapted to each user due to prompts that
request each user, who opens the document, to specify the data they want to return to the
reports.
When you print reports, Web Intelligence automatically generates a copy of reports in
Portable Document Format (PDF) format for optimum print quality.
Drilling on Web Intelligence reports in
analyze the detailed data behind the displayed results. You can turn the report you are
Building Reports Using the Web Intelligence Java Report Panel 15
HTML or in Interactive format enables you to
Page 16

viewing into a drillable report or drill on a duplicate of the original report to retain a
version of the results before your drill analysis.
Once you have found the information you need, you can save a snapshot of the drilled
report to share the results of your analysis with other Web Intelligence users, or save the
document in Excel or Portable Document (PDF) format to print or email to other business
contacts.
Performing on-report analysis
Viewing Web Intelligence reports in
reports and fine-tune the data reports contain, to highlight the information that most
interests you on demand.
Interactive view format enables you to enhance
On-Report Analysis is designed for:
• users who need to build data providers and then want to build reports
• report consumers who need to manipulate the reports created by others
With On-Report Analysis you can:
• view document metadata to understand the data behind reports and see how reports
are structured and filtered
• filter and sort results
• add new tables and charts
• add formulas and create variables
• format and change the layout of charts and tables
• slice and dice results by adding other data to charts and tables
Full information on how to use On-Report Analysis can be found in Performing On-Report
Analysis with Web Intelligence.
About Web Intelligence16
Page 17

Note: On-report analysis of Web Intelligence reports in Interactive view format is only
available, if your administrator has deployed Web Intelligence in JSP mode.
Creating and editing Web Intelligence documents
You can create or edit Web Intelligence documents using one of several tools:
• Java Report Panel
• Query – HTML
• HTML Report Panel
This section explains the differences between each tool.
Web Intelligence Java Report Panel
The Java Report Panel is designed for users who need more flexibility with designing
report layout and defining formulas and variables. A graphical Formula Editor enables
you to build formulas rapidly using drag-and-drop.
Note: The Web Intelligence Java Report Panel is available if your administrator has
deployed Web Intelligence in ASP mode and if your administrator has deployed Web
Intelligence in JSP mode.
Web Intelligence Query – HTML
Designed for users requiring a pure HTML environment to build data providers, Web
Intelligence Query – HTML offers the ability to define the data content of documents on
multiple data sources. You can use Query – HTML to create new documents from scratch
Building Reports Using the Web Intelligence Java Report Panel 17
Page 18

or edit the data providers in documents created using any of the other Web Intelligence
tools.
Used together with On-Report Analysis, Query – HTML provides a complete solution for
building data providers and designing powerful reports in a pure HTML environment.
Once you have run the data providers to generate a standard report, you can leverage
Web Intelligence On-Report Analysis features to format multiple reports, add formulas, and
create variables.
About Web Intelligence18
Page 19

Note: Web Intelligence Query – HTML and On-Report Analysis in Interactive view format
are only available, if your administrator has deployed Web Intelligence in JSP mode.
Web Intelligence HTML Report Panel
Designed for users who need to build basic reports, the HTML Report Panel provides query
and report features in a simple wizard-like interface. Each document is based on a single
data source and can contain multiple reports, displaying different subsets of information.
In addition, the HTML Report Panel is 508 compliant and can be customized for
specialized deployments.
Note: The Web Intelligence HTML Report Panel is only available, if your administrator has
deployed Web Intelligence in JSP mode.
This guide tells you how to build reports using the Java Report Panel. For information on
performing on-report analysis on Web Intelligence reports, see Performing On-Report
Analysis with Web Intelligence. For information on using Web Intelligence Query – HTML,
see Building data providers Using Web Intelligence Query – HTML. For information on
using the Web Intelligence HTML Report Panel, see Building Reports Using the Web
Intelligence HTML Report Panel.
Building Reports Using the Web Intelligence Java Report Panel 19
Page 20

About Web Intelligence20
Page 21

2
Getting up and running
Overview
You access the Web Intelligence Java Report Panel via InfoView, the corporate business
intelligence portal.
This chapter tells you how to:
•
log in and out of InfoView
• select the Java Report Panel as your Web Intelligence document editor
Logging in and out of InfoView
You access Web Intelligence by using your web browser to log into InfoView, the
corporate business intelligence portal. Once you are in InfoView, you can analyze Web
Intelligence reports and create or edit Web Intelligence documents.
This section tells you how to:
• log into InfoView
• log out of InfoView
Logging into InfoView
Before you can use InfoView and Web Intelligence you need the following information:
• a URL to the InfoView server
• the InfoView server name and port number
• your login and password
• your authentication, which controls the InfoView resources available to you
Note: Contact your administrator for this information, if necessary.
Logging into InfoView
To log into InfoView:
1. Launch your web browser.
2. Point your browser to the InfoView bookmark or URL.
The InfoView login page appears.
3. If the
System box is blank, type the name of the InfoView server followed by a colon
(:), and then type the port number.
Building Reports Using the Web Intelligence Java Report Panel 21
Page 22

For example, if the name of the InfoView server is corpbusintell and the port number is
4200, then type: corpbusintell:4200
Your administrator can provide you with this system information.
4. In the
5. In the
6. In the
7. Click Log On.
Username box, type your user name.
Password box, type your password.
Authentication box, select the authentication provided to you by your
administrator.
The InfoView home page appears.
To find out how to edit or create Web Intelligence documents, see ”Creating and
editing Web Intelligence documents” on page 25. To find out how to access Web
Intelligence documents, see the Performing On-Report Analysis with Web Intelligence
guide.
Logging out of InfoView
When you finish using InfoView or Web Intelligence you need to log out, instead of simply
closing your web browser.
Note: Before logging out of InfoView, verify that any documents you have open are
saved. For information on saving documents, see ”Saving Web Intelligence documents to
InfoView” on page 397.
Logging out of InfoView enables:
• you to save any user settings you modified during your InfoView session
• your administrator to track how many users are logged into the system at any given
time and to optimize InfoView and Web Intelligence to best serve the needs of yourself
and other users
Logging out of InfoView
To log out of InfoView:
• Click the Logout button.
The login page appears. You are logged out of InfoView.
Selecting your Web Intelligence document editor
To edit or create documents using the Java Report Panel, you need to verify your Web
Intelligence Document Preferences are set accordingly. Information on how to do this is
provided below.
Getting up and running22
Page 23

Note: If you are using Web Intelligence deployed in ASP mode, only the Java Report
Panel is available. It is therefore not necessary to select the Java Report Panel on the Web
Intelligence Document Preferences page.
Note: Information on setting your options for viewing, analyzing, and interacting with
reports is provided in the Performing On-Report Analysis on Web Intelligence Reports
guide, since these options do not affect how you use the Web Intelligence Java Report
Panel.
Setting your Create/Edit options
To set your create/edit options:
1. Click the
2. Click the
The
3. In the
4. Click
Preferences button on the InfoView toolbar.
Web Intelligence Document Preferences tab.
Web Intelligence Document Preferences page appears.
Select a report panel section, click Java Report Panel.
OK.
InfoView displays the page you were on previously.
To find out how to create documents, see ”Creating new documents” on page 25. To
find out how to edit documents, see ”Editing existing documents” on page 26.
Building Reports Using the Web Intelligence Java Report Panel 23
Page 24

Getting up and running24
Page 25

3
Creating and editing Web Intelligence documents
Overview
You create and edit reports in Web Intelligence documents by launching a Web
Intelligence report panel from InfoView. This guide tells you how to create and edit
documents using the Java Report Panel.
This chapter tells you how to:
•
create new documents
• edit existing documents
• set your Java Report Panel options
Note: Before you can edit or create a Web Intelligence document using the Java Report
Panel, you need to verify that the Java Report Panel is selected on the
Document Preferences
Create/Edit options” on page 23.
page in InfoView. To find out how to do this, see ”Setting your
Web Intelligence
Creating new documents
You create Web Intelligence documents by selecting a universe in InfoView. Each universe
maps to a database containing corporate business information. When you connect to a
universe, Web Intelligence launches a report panel automatically. You use the report panel
to define the data and the reports you want to include in the new document.
Note: Before you can edit or create a Web Intelligence document using the Java Report
Panel, you need to verify that the Java Report Panel is selected on the
Document Preferences
Create/Edit options” on page 23.
Selecting a universe and launching a report panel
To select a universe and launch a report panel:
1. On the InfoView Home page, click New Document.
Web Intelligence
page in InfoView. To find out how to do this, see ”Setting your
Building Reports Using the Web Intelligence Java Report Panel 25
Page 26

2. Click the title of the universe on which you want to create a document.
The Web Intelligence report panel opens.
NOTE: The first time you use the Java Report Panel, Web Intelligence
automatically downloads a Java applet to your computer. If your computer is using
Microsoft Windows 2000 as its operating system, you must be logged into your
computer as Administrator to download the applet.
You define the data selection and the report structure for the new document using the
Web Intelligence report panel selected on the
Preferences
Intelligence document editor” on page 22.
To see how to build documents using the Web Intelligence Java Report Panel, see
”Building basic data providers” on page 33.
page in InfoView. For more information, see ”Selecting your Web
Editing existing documents
You open and edit Web Intelligence documents from InfoView, the corporate business
intelligence portal. If you have not already logged into InfoView, see ”Logging in and out
of InfoView” on page 21.
This icon indicates a universe
Web Intelligence Document
Note: Before you can edit or create a Web Intelligence document using the Java Report
Panel, you need to verify that the Java Report Panel is selected on the Web Intelligence
Document Preferences page in InfoView. To find out how to do this, see ”Setting your
Create/Edit options” on page 23.
There are two ways to open a Web Intelligence document in edit mode:
• view the document first and then switch to Edit mode
• switch to edit mode directly without viewing the document contents first
Viewing a document and switching to Edit mode
To view a document and then switch to Edit mode:
1. Make sure you are logged into InfoView.
For full information, see ”Logging into InfoView” on page 21.
2. On the InfoView home page, navigate to the document you want to open.
You do this by clicking the folders in
keyword or the title of the document in the
Creating and editing Web Intelligence documents26
My Folders or Public Folders, or by entering a
Search box on the InfoView home page.
Page 27

The list of documents appears.
3. Click the document title.
4. If the document contains any prompts, you need to select the value(s) you want returned
to the document, and then click Run Query.
The Java Report Panel launches and displays the document.
Editing a Web Intelligence document directly
To edit a Web Intelligence document directly:
1. Make sure you are logged into InfoView.
For full information, see ”Logging into InfoView” on page 21.
2. On the InfoView home page, navigate to the document you want to open.
You do this by clicking the folders in
keyword or the title of the document in the
My Folders or Public Folders, or by entering a
Search box on the InfoView home page.
The list of documents appears.
3. Click
Modify below the document name.
Modify
4. If the document contains any prompts, you need to select the value(s) you want returned
to the document, and then click Run Query.
Building Reports Using the Web Intelligence Java Report Panel 27
Page 28

The Java Report Panel launches and displays the reports in the document.
NOTE: To edit Web Intelligence documents using the Java Report Panel, the Java
Report Panel needs to be selected on the Web Intelligence Document Preferences
page in InfoView. To find out how to do this, see ”Setting your Create/Edit options”
on page 23.
Setting your Java Report Panel options
You can personalize the following display settings of the Web Intelligence Java Report
Panel to help you position report elements on report pages:
• define the unit for measurement
• display a grid to help align page elements
• use snap to grid to reposition page elements accurately
• define grid spacing
Setting your Java Report Panel options
To set your Java Report Panel Options
1. Click the User Settings button in the Java Report Panel toolbar.
The
User Settings dialog box appears.
Creating and editing Web Intelligence documents28
Page 29

2. Specify measurement settings for the document properties and define grid settings here.
3. Click OK.
Web Intelligence saves your new settings. The new settings are applied the next time
you launch the Java Report Panel.
Java Report Panel interface tour
The Java Report Panel provides a rich interface for working with Web Intelligence
documents.
You interact with documents in two ways:
• through toolbars
• through report tabs
This is what the the interface looks like:
Main toolbar
Formatting toolbar
Pagination toolbar
Report tabs
Report toolbar
(Docked in new
position)
Configure View menu
Toggle Auto Hide icon
Set the object order on
the Data tab by
clicking here
Building Reports Using the Web Intelligence Java Report Panel 29
Page 30

Toolbars
The following table describes the Java Report Panel toolbars:
Toolbar name Description
Main Used to save and print reports, to switch
between Query and Report view, to
show/hide the other toolbars and to
select default interface configurations.
Note: The Main toolbar is always visible
in Report View and Query View (when
you are working in the Query Panel).
Formatting Used to set font styles and backgound
colors.
Reporting Used to work with reporting functionality
such as filters, alerters and ranking
Page Navigation Used to navigate through a report
You display and hide the toolbars by selecting/deselecting the Configure View >
Toolbars > <toolbar name> option on the Main toolbar or right-clicking any of the
toolbars and selecting/deselecting the toolbars on the menu that appears.
Report tabs
Creating and editing Web Intelligence documents30
You can drag toolbars and dock them in a new position just as you can with products such
as Microsoft Word. For example, you can drag a toolbar from a horizontal position across
the top of the interface to a vertical position along the left-hand side.
The Java Report Panel has four report tabs as described in the following table:
Name Description
Data Contains the objects (universe objects and variables)
available to be placed in a report.
You can order the objects either alphabetically or by
query (if your report contains more than one query) by
clicking the Arranged By arrow at the bottom of the
tab and selecting the order type.
Page 31

Name Description
Templat e Used to add tables, charts and free-standing cells to a
report. (See, for example, ”Creating a table by
selecting a template” on page 131.)
Map Describes the report structure graphically.
Properties Used to set the properties associated with the
currently-selected report element.
The property list changes depending on the selected
element. For example, if you select a cell, the tab lists
the properties associated with cells. If you select a
table, the tab lists those properties associated with
tables.
The report elements for which the Properties tab
contains groups of properties are: report, section, free
cells, table cells, charts, headers and footers.
You set properties either directly in the Properties tab,
in the space to the right of the property, or you click the
button or arrow that displays in the space to the right of
the property when you select it. This button displays the
appropriate dialog box for setting the property.
When you select a property, Web Intelligence displays
a short help text to at the bottom of the tab to explain
what the property does.
You can select multiple report elements of different
types. In this case the Properties tab shows only those
properties that are common to all types.
Note: You do not set document properties in the
Properties tab. To set document properties, right-click
on a report outside any of the above elements and
select Document Properties from the menu to display
the Document Properties tab.
The Java Report Panel has four default configurations for the tabs. You access these
configurations from the Configure View menu on the Main toolbar.
Building Reports Using the Web Intelligence Java Report Panel 31
Page 32

The following table describes the default configurations:
Name Description
Data • All tabs appear on the left with the Data
tab at the front.
Data/Properties • All tabs appear on the left.
• The Properties tab appears below the
other three.
Data/Properties on
Right
Collapsed
Data/Properties
• The Data, Templates and Map tabs
appear on the left.
• The Properties tab appears on the right.
• The Data, Templates and Map tabs
appear collapsed in toolbar form down
the left side of the screen.
• The Properties tab appears collapsed
down the right side.
• You click on the tab icon in the collapsed
toolbar to display the tab. If another tab
on the same toolbar is currently
displayed it is replaced by the tab you
click.
• You click the Toggle auto hide icon in
the top right corner of an extended tab
to revert the tab to its extended position.
• You click the Toggle auto hide icon on
an extended tab to revert the tab to its
collapsed position.
Creating and editing Web Intelligence documents32
Page 33

4
Building basic data providers
Overview
This chapter describes how you can build a basic report by creating and running a data
provider using objects in a universe. It explains the fundamentals of universes and
describes the objects that you use to construct a query.
It includes information on the following:
•
understanding data providers and universes
• building a simple data provider
• setting a scope of analysis, to include additional data for analysis
• viewing and editing the SQL generated for the data provider
• defining data provider properties, to return data more efficiently
• selecting a context, to direct a data provider to return specific data
• incompatible objects
Understanding data providers and universes
You access data in a database by running data providers using objects in a universe. This
section describes what a data provider is, how you use a universe to build and run data
providers to get the data you need, and how to create reports using the Web Intelligence
Java Report Panel.
What is a data provider?
A data provider contains one or more queries that return data from a database. A query
requests data from the database. If the data is available, then the requested data is
returned by default in the form of a table which contains rows and columns.
When you build a query, you are creating a request for information from a database. A
request can be very simple, for example; give me total sales in California for the first
quarter of last year, or more complicated, for example; give me an average age of
customers who bought sweaters during the spring television promotion in Paris.
Queries are sent to the databases in a language called SQL (Structured Query Language).
However, when you use Web Intelligence you do not have to know any SQL. The Web
Intelligence report panel presents the information available in the database as objects that
have names and meanings familiar to you. These objects are organized in a structure
called a universe.
You build data providers by combining objects in a universe. The universe translates the
objects presented in your business language to SQL, and then sends the request for
Building Reports Using the Web Intelligence Java Report Panel 33
Page 34

information to the database. Web Intelligence can generate SQL data providers of
unlimited length. When the data is returned to the Web Intelligence report panel, it is
presented in a table form, with columns that have the same names as the objects that you
used in the query. The data is arranged in rows.
Data providers and queries are based on universes
You build data providers and queries in the Java panel using objects in a universe. A
universe is a representation of the information available in a database. This information is
presented in everyday terms that describe your business situation. The universe appears on
the Data tab to the left of the Result Objects and Query Filters panes.
What does a universe contain?
Universes are made up of objects and classes. These are described below:
Universe
component
Object Named component that maps to data or a derivation of
Building basic data providers34
Description
data in the database. You use objects in a query to retrieve
data for your reports. For example, some of the objects in a
sales universe would be Products, Region, and Sales
Revenue.
Data tab
Result Objects pane
Query Filters pane
Page 35

Universe
component
Class Logical grouping of objects. Each class has a meaningful
Description
name, for example; the class Store contains the objects
State, City, and Store name.
What types of objects can you use in a query?
Objects can represent different types of information:
Table 0.1:
Object Examples Description
Dimension Retrieves the data that will provide
the basis for analysis in a report.
Dimension objects typically retrieve
character-type data, for example;
customer names, line names, or
dates.
Detail Provides descriptive data about a
dimension. A detail is always
attached to the dimension for which
it provides additional information.
For example, Age is a detail object
that is associated with Customer
Details
dimension. Address provides
additional information on customers.
Measure Retrieves numeric data that is the
Classes and Subclasses
Objects are grouped into folders called classes. Each class can also contain one or more
subclasses. Subclasses contain objects that are a further subcategory of the objects in the
upper level of the class.
The role of classes is to organize the objects into logical groups. When you create data
providers on the universe, classes help you to find the objects that represent the
information that you want to use in a query.
result of calculations on data in the
database. For example; Revenue is
the calculation of the number of
items sold multiplied by item price.
Measure objects are often located in
a Measures class.
Building Reports Using the Web Intelligence Java Report Panel 35
Page 36

Classes and Objects are presented in a tree structure as follows:
Each folder represents a class
Each icon within a class represents an
object
Details are under dimensions
Store details is a subclass of Store
You can search for classes and objects in the tree by selecting an item in the tree, then
typing a letter. You can refine the search by typing further letters. For example, if you type
“y“ then “e”, Web Intelligence first searches for objects beginning with “T, then “searches
for objects begninning with “ye“.
The objects that correspond to the search condition are selected in the tree.
Creating and running a query
You use a universe to create a query in much the same way that you use nouns and verbs
to construct a sentence. The dimension objects form the subject matter for the query. These
are the objects that contain the information you want to retrieve, and a measure gives the
query its required action, it tells the query what to do with the information represented by
the dimensions.
Why build a query?
You build a query to answer a business question that requires data from a database. The
query is your means to ask the database for information.
How do you use the universe to build a query?
The universe is displayed in the Query Manager. From the Query Manager, you select the
dimensions and details that represent the information that you want to retrieve, and add
them to a work space called the Results Objects pane. You add one or two measure
objects that represent the calculation, or the action that you want to perform on the
information.
Once you have constructed your query, you then run the query against the database.
Building basic data providers36
Page 37

What happens when you run a query?
When you run a query, you retrieve the information from the database represented by the
objects that you have added to the Results Objects pane. The request for information is
processed in the database, and the results are sent back to the Web Intelligence Java
Report Panel in the form of a document. The document contains all the information that you
asked for in the query, arranged in table columns and rows.
What happens when you interrupt run query?
You can interrupt a query before Web Intelligence has returned all the data to the
document.Interrupting a query is useful if you realize you want to change the definition of
the query after you have already clicked the Run Query or the Refresh button. For full
information on the options you can choose when you interrupt a query, see ”Interrupting
data providers” on page 51.
Returned data is stored for analysis
The data that is returned in a query is stored in the document. It is convenient to visualize
the returned data as being organized as a cube. In the document, the data is displayed as
a table. The table is a flat, two dimensional view of the of the data cube.
Each of the columns in a returned document represents an axis in the cube. You can edit
the document by swapping and manipulating the data within the cube on any axis. When
you swap or change data between different axis, the new result is again projected as a
flat table in the resulting document.
The data stored in the cube allows you to create a report that corresponds to your business
needs without having to send another query to the database.
If you want to add information to the document that is not in the cube, then you must add
the object to the query and run the query again to get the new information.
Building a simple query
Before you can create a query, you must firstly start the Web Intelligence Java panel and
select a universe. Refer to the chapter “Creating and Editing Web Intelligence Documents”
for more information on connecting to a universe.
Once you are connected to a universe, the universe objects appear in the Query
Manager. You build a query by selecting objects in the Query Manager Data page, and
adding them to the Results Objects pane. You can set various properties for the query, and
then run the query to get the data for each object.
The following is an overview of the steps that you follow to build a query. Each stage is
described in more detail in its corresponding section. A procedure for the whole process is
given in the section ”Building and running a simple query” on page 48.
You can control the amount and type of data that is returned for an object by setting filters
on the object. This is described in ”” on page 83.
Building Reports Using the Web Intelligence Java Report Panel 37
Page 38

Overview
An overview of the query building process appears below:
What you do to build a query See the section
Navigate the Query Manager to
find the objects that you want to
use in the query.
Select and add objects to a query ”Building the query” on page 39
Set the scope of analysis ”Setting the scope of analysis” on
Set properties for the data
providers
Run the query ”Running a simple query” on
Using the Data tab
The objects that you can use in a query are contained in a universe. The universe is
displayed on the
Within a universe, objects are organized in folders called classes which are arranged in a
tree view in the Data tab. Each class is attached to the tree by a node. You click the node
alternatively to open the class folder to display its objects or close the class folder to hide
its objects.You navigate through the objects in a universe by expanding and closing
classes.
Opening and closing a class folder
Data tab at the left of the Result Objects and Query Filter panes.
”Using the Data tab” on page 38
page 40
”Defining query properties” on
page 44
page 47
You open a class folder to display its objects. You close a class folder to hide its contents.
Opening a class folder is called expanding a class.
To expand a class:
• Click the + sign next to the class that contains the object that you want to use in a
query.
Or
Double-click a class folder.
The class expands. The objects contained in the class appear in the tree view.
To close a class:
• Click the - sign next to the class that you want to close.
Or
Double-click an open class folder.
Building basic data providers38
Page 39

The class closes. The objects contained in the class are no longer displayed.
Building the query
You build a query by selecting objects in the Data tab and dragging them onto the Result
Objects pane. You can add objects one-by-one or add all the objects in a class folder at
once. You can also remove objects from the Result Objects pane at any time.
This section of this guide tells you how to:
• add an object to a query
• add all the objects in one class to a query
• remove an object from a query
Adding an object to a query
To add an object to a query:
1. Verify you are in Query View.
The Edit Query button is pressed in when you are working in Query View.
2. In the Data tab, open a class.
The class expands to show the objects that belong to the class.
3. Select an object and drag it over to the Result Objects pane.
The object or class appears in the Result Objects pane.
Adding all the objects in a class to a query
To add all the objects in a class to a query:
1. Verify you are in Query View.
The Edit Query button is pressed in when you are working in Query View.
Building Reports Using the Web Intelligence Java Report Panel 39
Page 40

2. Select a class and drag it over to the Result Objects pane.
All of the objects in the class appear in the Result Objects pane.
Removing an object from a query
To remove an object from a query:
1. Make sure you are in Query View.
The Edit Query button is pressed in when you are working in Query View.
2. Select an object in the Result Objects pane.
3. Drag the object over to the Data tab.
Or
Click Delete.
The object is removed from the Result Objects pane. The next time you run the query
the object is not included in the query definition.
Setting the scope of analysis
In a universe, the objects within each class are usually represented in a hierarchy. For
example, a class called Time period contains the objects Year, Quarter, Month, and
Week arranged in a hierarchy as follows:
Note: The hierarchy does not always correspond to the order of dimensions within a class.
This is because the hierarchies can be customized at the universe level by your
administrator, using BusinessObjects Designer.
What is a scope of analysis?
The scope of analysis for a query is extra data that you can retrieve from the database to
give more details on the data returned by each of the objects in a query. This extra data
does not appear in the initial result document, but it remains available in the data cube, so
Building basic data providers40
Page 41

you can pull this data in to the report to allow you to access more detail at any time. This
process of refining the data to lower levels of detail is called drilling down on an object.
In the universe, the scope of analysis corresponds to the hierachical levels below the object
selected for a query. For example, a scope of analysis of one level down for the object
Year, would include the object Quarter, which appears immediately under Year.
You can set this level when you build a query. It allows objects lower down the hierarchy
to be included in the query, without them appearing in the Results Objects pane. The
hierarchies in a universe allow you to choose your scope of analysis, and correspondingly
the level of drill available.
You can also create a custom scope of analysis by selecting specific dimensions to the
Scope of Analysis pane.
Note: You cannot define a scope of analysis when working in Query Drill mode. Query
Drill defines the scope automatically in response to drill actions.
Setting levels of analysis
When you set the scope of analysis for a query, you include dimensions one or more levels
down the hierarchy tree for each dimension that you have added to the Result Objects
pane.
When you run the query, the dimensions included in the scope of analysis are returned to
the cube for that document, but are not projected onto the reports that the document
contains. They can be added to the reports at any time, without having to run the query
again. Values for the dimensions in the scope of analysis can also be viewed by switching
a report to Drill mode, and then drilling down to them from the values displayed on the
report. (For full information on performing drill analysis, see ”Setting up documents for drill
analysis” on page 355.)
How many scope of analysis levels can you set?
You can set the following levels for scope of analysis:
Level Description
None Only the objects that appear in the Results Objects
pane are included in the query.
One level down
Two levels down
Three levels down
Custom All objects added manually to the Scope of
For each object in the Results pane, one, two, or
three objects lower down the hierarchy tree are
included in the query. The data from these objects
is stored in the cube until you add them to the
document.
Analysis panel are included in the query.
Building Reports Using the Web Intelligence Java Report Panel 41
Page 42

Note: Including a scope of analysis in a document increases the document size
significantly. This is because the data necessary for the scope you specify is saved with the
document, even though it is not visible in the reports unless you start drill mode and drill
down to the data to display the corresponding values.
In order to minimize the size of documents and optimize performance, we recommend that
you only include a scope of analysis in documents where you are certain that users will
need to drill.
Setting the Scope of Analysis
To set the scope of analysis:
1. Verify that you are in Quer y View.
The Edit Query button on the Web Intelligence toolbar is pressed in when you are in
Query View.
2. Click the Show/Hide Scope of Analysis Pane button so that it appears pressed in.
The Scope of Analysis panel appears at the bottom of the Result Objects pane. The
default scope of analysis is None.
Each dimension in the Result Objects pane appears in the Scope of Analysis pane.
Scope of Analysis pane
3. Click the down arrow in the
Scope of Analysis drop-down list box.
4. Select a level for the scope of analysis.
Building basic data providers42
Page 43

The level appears in the list box and the dimensions that are hierarchically below each
dimension in the Result Objects pane appear in the Scope of Analysis pane.
[Quarter] and [Month] appear under [Year]
[SKU desc] and [Color] appear under [Category]
5. If you want to add selected dimensions to the scope of analysis or create a custom
scope of analysis, select dimensions in the Query Manager and drag them across to
the
Scope of Analysis panel.
Viewing and editing the SQL behind the query definition
When you build a query, Web Intelligence automatically generates the appropriate SQL
to retrieve the data from the database that you are accessing. You can view and edit this
SQL.
Viewing the SQL behind a query
To view the SQL behind a query:
1. Verify you are in Query view.
If the reports are displayed, click
2. On the query panel toolbar, click
Edit Query to go to Query view.
View SQL.
The SQL Viewer dialog box appears, displaying the SQL behind the query.
3. If you want to re-use the SQL in another application, click Copy to copy the SQL to the
clipboard.
Sometimes Web Intelligence generates more than one SQL statement to satisfy a query.
Web Intelligence runs each SQL query seperately, then resolves the results. This occurs in
the following situations:
• Your query contains incompatible objects. (For more information on incompatible
objects, see ”How Web Intelligence handles incompatible objects” on page 53.)
• Your document contains multiple data providers. (For more information on multuple
data providers, see ”Including multiple data providers” on page 63 on
Building Reports Using the Web Intelligence Java Report Panel 43
page 63.)
Page 44

• You have used a combined query and the database does not support the combination
operator you used. (For more information on combined queries, see ”Working with
combined queries” on page 55 on
In each case you see a hierarchical view of the SQL queries on the left of the dialog box.
The root item of the hierarchy is labelled according to the reason why the SQL was
generated in multiple queries. For example, if the SQL was generated from a combined
query using MINUS, the root item is Minus; if the SQL was generated from a query
containing incompatible objects, the root item is Synchronization.
Viewing the SQL behind a query with mutliple SQL statements
To view the SQL:
1. Verify you are in Query view.
If the reports are displayed, click
2. On the query panel toolbar, click
The SQL Viewer dialog box appears, displaying the SQL behind the query.
3. In the left pane, click the root item to expand the hierarchy of SQL queries. (The queries
are name Select 1, Select 2... in the hierarchy.)
4. Click the the query you want to view to display the SQL in the right pane.
If you want to re-use the SQL in another application, click Copy to copy the SQL to the
clipboard.
Editing the SQL behind a query
page 55.)
Edit Query to go to Query view.
View SQL.
1. Verify you are in Query view.
If the reports are displayed, click
2. On the query panel toolbar, click
The SQL Viewer dialog box appears, displaying the SQL behind the query.
3. Click Use custom SQL.
The SQL becomes editable.
4. Edit the SQL then click Validate to ensure that it is correct.
5. Click Save to save the new SQL.
Defining query properties
You can set properties for the query that can optimize the time taken for the query to run,
or the amount of data returned, set security options, specify the order of prompts in the
report, and control potential ambiguous query results. The query properties options are
grouped together in sections on the
Building basic data providers44
Edit Query to go to Query view.
View SQL.
Properties tab in Query View.
Page 45

Query property options
You can set the following query properties:
Query Property Available Options and Description
Name • The name you specify for the selected query is
displayed on the corresponding query tab.
Data • Retrieve duplicate rows
In a database, the same data may be repeated
over many rows. You can choose to have these
repeated rows returned in a query, or to have
only unique rows returned.
Limits • Max rows retrieved
Maximum number of rows of data that can be
returned when a query is run. If you only need a
certain amount of data, you can set this value to
limit the number of rows of data that is returned to
your document. This prevents a query from taking
too much time or from returning unnecessary data
to the document.
NOTE: The Max rows retrieved setting
can be overridden by the limits set by your
administrator in your security profile. For
example, if you set the Max rows
retrieved setting in the HTML report panel to
400 rows, but your security profile limits you
to 200 rows, only 200 rows of data will be
retrieved when you run the query.
• Max retrieval time
Maximum time that a query can run before the
query is stopped. This can be useful when a query
is taking too long due to an excess of data, or
network problems. You can set a time limit so a
query can stop within a reasonable time.
Building Reports Using the Web Intelligence Java Report Panel 45
Page 46

Query Property Available Options and Description
Security • Allow other users to edit all data
providers
When selected, other users who have the
appropriate editing rights can access Query
View and modify the data providers in the
document. When cleared, only the report creator
can modify the data providers. This option is
selected by default. Unlike the other query
properties, which only apply to the selected
query, this option applies to all of the data
providers in the document.
Prompt Order • Prompts are listed in the list. You can use the up
and down arrows to move a prompt up or down
the list to change the order.
Contexts
(Contexts are
described in the
section ”Working
with query
contexts” on
page 49)
• Context list
Displays contexts selected during the previous
refresh of the report.
• Reset contexts on refresh
When selected, you are prompted to choose a
context each time a query requiring a context is
run. When unselected, Web Intelligence retains
the context specified the first time you run the
query.
• Clear contexts
All selected contexts are removed from the
context list. The user is prompted to select a
context when the report is refreshed.
Setting query properties
To set query properties:
1. Verify that you are in Quer y View.
The
Edit Query button is pressed in when you are working in Query View.
2. Click the Properties tab.
Building basic data providers46
Page 47

The Query Properties options appear.
3. Click the Fold/Unfold arrows at the top right of each section of the options to expand
or close the property groups.
4. Select or type query property options.
For a full explanation of each option, see ”Query property options” on page 45.
The modifications you make to the query properties are applied immediately.
Running a simple query
Once you have built your query by adding the required objects to the Result Objects pane,
set the scope of analysis and defined query properties, you are ready to run the query.
When you run a query, the universe asks the database to find the data that corresponds to
the demands of each of the objects in the query. You run a query by clicking the Run
Query button.
Creating a simple query
Before you can create a query you must ensure that you have connected to a universe from
the InfoView portal. For full information, see ”Logging in and out of InfoView” on page 21
Building Reports Using the Web Intelligence Java Report Panel 47
Page 48

and ”Selecting a universe and launching a report panel” on page 25. Once the universe
is available in the Java Report Panel, you can start building a query.
Building and running a simple query
To build and run a simple query:
1. Verify that you are in Quer y View.
The Edit Query button is pressed in when you are in Query View.
2. Click the + sign next to the class folder containing the object you want to include in the
query.
The class expands to show objects.
3. Select an object and drag it into the Result Objects pane.
Or
Double-click an object.
The object appears in the Result Objects pane.
4. Repeat steps
2. and 3. for each object that you want to include in the query.
5. If you want to set a scope of analysis level, do the following:
•Click the Scope of Analysis button on the Query toolbar
• Select a level for the scope of analysis from the Scope of Analysis drop-down list
box.
6. Click the Run Query button.
Web Intelligence generates a report that contains a vertical table displaying the results
of the query. Each table column corresponds to an object added in the Result Objects
pane. Data for each of those objects appears in the table rows.
The report and table use the Web Intelligence default layout and formatting. You can
modify the data contents and formatting of the report as you wish. For full information,
see the chapters in the section called ”Working with Reports” on page 161.
Building basic data providers48
Page 49

Working with query contexts
When you create a query, or refresh a report, you may be asked to choose a context
before the query can run. In a universe, contexts are implemented to avoid ambiguous
data providers. This section describes what is an ambiguous query, how contexts are
used, and explains how you can choose a context to ensure that your query returns
relevant information.
What is an ambiguous query?
An ambiguous query is a query that contains one or more objects that can potentially
return two different types of information.
In a universe, certain dimensions may have values that are used for two different purposes
in the database. For example, the [Country] dimension in the query below can return two
types of information:
• Customers and the country in which they spent their vacation.
• Customers and the country for which they have made their reservation.
The role that Country plays in this query is ambiguous. A country value can be either the
country where a vacation was sold, or a country where a vacation is reserved. One is
existing information (sales), and the other is future information (reservations).
To avoid ambiguities in a query, the universe designer identifies the different ways that
objects can be used in the universe, and implements restrictions on how these objects can
be combined. These restrictions are called contexts.
What is a context?
A context is a defined group of objects that share a common business purpose. This
business purpose is usually the type of information that these related objects represent. For
example, a sales context is a grouping of all the objects that can be used to create sales
data providers. A reservations context is a grouping of all the objects that can be used in
reservation data providers. Contexts are defined in a universe by the universe designer.
You can combine any object within the same context to create a query. You can also
combine objects in different contexts. If you use an object that is common to both contexts,
Web Intelligence will try to determine the context that best fits the other objects in the
query.
If it can not determine a context, you are prompted to choose the context that you want to
apply to the query. For example, When you run the query above, a dialog box appears
Building Reports Using the Web Intelligence Java Report Panel 49
Page 50

asking you to choose whether you want the country information to be sales or reservations
information.
Defining how contexts are used in a query
In Web Intelligence you can customize how contexts are used in a report.
You can set the following options to determine how contexts are used when you refresh a
report:
Option Description
Reset contexts on refresh • When selected, you are prompted to
choose a context each time a query
requiring a context is run.
• When cleared, a query is run
automatically using the context used on
previous refresh.
Clear contexts Clears the contexts listed in the list after the
first refresh.
When you run a query, or refresh a report that can result in an ambiguous query, a dialog
box appears asking you to select a context.
Selecting context properties
To select context properties:
1. Verify that you are in Quer y View.
2. Click the Properties tab.
The Query Properties options appear.
Building basic data providers50
Page 51

3. In the Context section of the Query Properties, select or clear the Reset contexts on
refresh check box.
Or
If you want to remove all existing contexts saved in the report, click the Clear contexts
button.
This does not remove the context from the universe.
Selecting a context
To select a context:
1. From the Select a Context box, click one of the listed contexts.
This is the context that contains the data that is relevant to your query.
2. Click OK.
The query is run for the selected context.
Interrupting data providers
When you interrupt a query, only partial data is returned to the document. The values
displayed in the document do not accurately reflect the definition in the query. Before
returning the data to the document, Web Intelligence requests you to choose which version
of the data you want retrieved.
Interrupting a query
To interrupt a query:
Building Reports Using the Web Intelligence Java Report Panel 51
Page 52

1. On the Retrieving Data dialog box, click Cancel.
NOTE: The Retrieving Data dialog box appears when you click Run Query or
Refresh Data to retrieve the latest values from the database to a document.
The Interrupt Data Retrieval dialog box appears.
2. Select one of the following options:
• Restore the results from the previous data retrieval – Web Intelligence
restores the values to the document that were retrieved the last time the query was
run. The values displayed will not be the most up to date information available on
the database. You can run the query later to return the up to date values from the
database.
• Purge all data from the document – Web Intelligence displays the document
empty of values. The structure and formatting of the document is retained. You can
run the query later to return the up to date values from the database.
• Return the partial results – Web Intelligence displays the new values retrieved so
far in the appropriate parts of the document. The rest of the document will display
the values retrieved the last time the query was run.
3. Click OK.
Web Intelligence displays the results on the reports, according to the option you
selected.
About Incompatible objects in data providers
Sometimes it is not possible to use certain combinations of objects in data providers. This
situation arises when objects bear no relationship to one another. These objects are called
incompatible objects.
For example, the Island Resorts Marketing universe contains the [Reservation Year] and
[Revenue] objects, which are incompatible. This is because there is no revenue associated
with a reservation. Revenue is generated only when the customer is invoiced. The
underlying database structure reflects this; you cannot build a query that aggregates
revenue by reservation year because there is no such thing as revenue by reservation year.
In other words, the aggregation context that you specified for the [Revenue] object does
not exist.
Building basic data providers52
Page 53

Incompatible objects and SQL
When you build a query, Web Intelligence generates SQL behind the scenes. This SQL is
run against the database to produce a result that Web Intelligence displays in a report. For
a query to be free of incompatible objects, Web Intelligence must be able to generate a
single SQL query to retrieve the data. If this is not possible, the query contains
incompatible objects.
How Web Intelligence handles incompatible objects
If a report requires more than one SQL query to provide its data, Web Intelligence places
the data from each query in a separate block, as shown below.
Web Intelligence does not allow you to place incompatible objects in the same block by
dragging and dropping. You can create a block with incompatible objects by using the
formula bar to type the names of the objects. In this case the incompatible objects appear
as #INCOMPATIBLE.
Building Reports Using the Web Intelligence Java Report Panel 53
Page 54

Building basic data providers54
Page 55

5
Working with combined queries
Overview
”Building basic data providers” on page 33 on page 55 describes how to create basic
data providers. The data providers described in that chapter contain one query only. You
can create much more powerful data providers by including combined queries. Combined
queries are multiple queries on the same universe that return a single set of data.
Note: You cannot create combined queries across multiple universes.
Types of combined query
You can combine queries in three relationships:
• union
• intersection
• minus
In a union combination, Web Intelligence takes the all the data from both queries,
eliminates duplicate rows, and builds a combined data set.
In an intersection combination, Web Intelligence returns the data that is common to both
queries.
In a minus combination, Web Intelligence returns the data in the first query that does not
appear in the second.
Example: Union, intersect and minus queries
In this example you have two queries that return lists of countries as shown in the following
table:
Query Values
Query 1 US; UK; Germany; France
Query 2 US; Spain
Building Reports Using the Web Intelligence Java Report Panel 55
Page 56

Depending on the type of combined query, Web Intelligence returns the following values:
Combination type Values
UNION US; UK; Germany; France; Spain
INTERSECTION US
MINUS UK; Germany; France
What can you do with combined queries?
Combined queries allow you to answer questions that are otherwise difficult or impossible
to frame in a single Web Intelligence query.
Example: Return a data set using a combined query
The Island Resorts Marketing sample universe contains the dimension Year, which is
associated with guests who have already stayed in a resort, and Reservation Year, which
is associated guests who have reserved to stay in the future. Because of the structure of the
database and universe, these objects are incompatible, which means that you cannot
include them in the same block in a report. (For more information on incompatible objects,
see ”About Incompatible objects in data providers” on page 52.)
What if you want to return a single list of years that includes those years where more than
n guests stayed in a resort and those years where more than n guests reserved to stay in a
resort? You can do this using a combined query, as follows:
Query Returns
Query 1 Years where more than n
guests stayed in a resort
UNION
Query 2 Years where more than n
guests reserved to stay in a
resort
The union between these two queries returns the list of years that you want.
How does Web Intelligence generate combined queries?
If your database supports the type of combination in your query, combined queries work
at the database level: they alter the query that Web Intelligence submits to the database.
They do so by generating SQL (Structured Query Language) queries containing UNION,
INTERSECT and MINUS operators.
Working with combined queries56
Page 57

Note: SQL is the standard query language of relational databases, although each
database has its own dialect.
If your database does not support the type of combination in your query, Web Intelligence
performs the query at the report level by generating multiple SQL queries whose data it
resolves after retrieval from the database. For more information on the SQL generated by
Web Intelligence, see ”Viewing and editing the SQL behind the query definition” on
page 43.
Building a combined query
You build a combined query in the Query Panel.
To build a combined query
1. Create an initial query in the Query Panel.
2. Click Combined Query on the toolbar.
Web Intelligence adds a copy of the initial query to the data provider. The second
query has the following characteristics:
• It contains the same report objects as the original query.
• It does not contain the filters defined on the original query.
• It is combined with the original query in a UNION relationship.
Building Reports Using the Web Intelligence Java Report Panel 57
Page 58

The individual queries in the combined queries are named Combined Query n.
Combined query
button
Combined queries and type of
combination
3. To switch to a query, click Combined Query n.
4. To change the combination type, double-click on the operator. The operator moves
through the sequence UNION, INTERSECTION, MINUS.
5. Build each query within the combined query as you build any normal Web Intelligence
query.
6. Click Run Query.
To edit a combined query
1. Click on the Combined Query n you want to edit.
2. Edit the query as you edit a normal Web Intelligence query.
To delete a combined query
1. Right-click the Combined Query n you want to delete.
2. Select Remove on the menu.
Combined query structure
The queries within a combined query must return the same number of objects of the same
data type and the objects must be in the same order. You cannot combine queries when
the number of objects in the query results and the data types of those objects are not
identical. For example, you cannot combine a query than returns Year with a query that
Working with combined queries58
Page 59

returns Year and Revenue, and you cannot combine a query that returns Year with a query
that returns Revenue.
You must also pay attention to the semantics of your combined queries. While it is
possible to combine a query that returns Year with a query that returns Region if both
dimensions are of the same data type, the result - a mixed list of years and regions - is
unlikely to be meaningful. Typically, if your first query contains a Year dimension, your
second query also contains a dimension that returns a list of years.
Example: Return a list of years and reservation years based on the numbers of guests
This example describes the workflow for the query described in ”Return a data set using a
combined query” on page 56. You want to build a query that returns a list of years
consisting of years where more than n guests stayed in a resort and years where more
than n guests reserved to stay in a resort. To do this:
1. Select the Island Resorts Marketing universe in the list of universes to open the Query
Panel.
2. Drag the Year object to the Result Objects pane.
3. Drag the Number of Guests object to the Query Filters pane and create a report filter
that restricts the Number of Guests to greater than n. (For more information on
building query filters, see ”Filtering data retrieval using query filters” on page 83 on
page 55.)
4. Click Combined Query.
The Combined Query pane appears in the bottom left of the Query panel with the two
queries joined by union.
5. Click on the second query and remove the Year and Number of Guests objects.
6. Drag the Reservation Year object to the Result Objects pane.
7. Drag the Future Guests object to the Query Filters pane and create a report filter that
restricts the future guests to greater than n.
8. Click Run Query.
9. The query returns the combined list of years and reservation years.
Combined query precedence
It is important to understand the order in which Web Intelligence executes query
combinations in a combined query. The order of execution is crucial in determining the
final result.
In the simplest form of combined query you combine two or more queries in a relationship
as follows:
Query 1
INTERSECTION Query 2
Query 3
In such a case, Web Intelligence first finds the set of data that represents the
union/intersection/minus between Combined Query n and Combined Query n + 1, then
Building Reports Using the Web Intelligence Java Report Panel 59
Page 60

finds the union/intersection/minus between that data set and the data returned by
Combined Query n + 2. Web Intelligence continues in this way through all the queries in
the relationship. This gives the following result for the above example:
Query Data
Query 1 US; UK; France; Germany
Query 2 US; France; Finland
INTERSECTION of 1 and 2US; France
Query 3 US; Spain
Final INTERSECTION US
Multiple combined queries
You can combine multiple queries in complex relationships to determine the order of
execution, as in the following example:
Web Intelligence processes query groups from right to left as they appear in the Query
Panel, and from top to bottom within each group. (Higher-precedence groups, such as the
MINUS group in the above example, appear indented to the right in the Query Panel.) In
the above query Web Intelligence first determines the result of the minus combination then
finds the intersection of this result with the result of Combined Query 3 as shown in the
following table:
Query Result
Query 1 US; UK; Spain; Germany
Query 2 Germany
Query 1 MINUS Query 2 US; UK; Spain
Query 3 US; Spain; Finland
Working with combined queries60
Page 61

Query Result
(Query 1 MINUS Query 2)
US; Spain
INTERSECTION
Query 3
Note: If your database directly supports the type of combined query you wish to execute,
Web Intelligence generates SQL containing combination operators. (For more information
see ”How does Web Intelligence generate combined queries?” on page 56.) In this case
the order of precedence depends on the order of precedence defined in the database. See
your Web Intelligence administrator for more details.
Setting the order of precedence
1. Build the first query in the Query Panel.
2. Click Combined Query.
3. Repeat steps 1 and 2 until you have built all the component queries.
4. To increase the precedence of a pair of queries, drag and drop a query on to the
query with which you want to associate it in the higher-precedence pair.
Web Intelligence indents the source and target queries in the drag-and-drop operation
and combines them by default in a UNION.
5. Continue adding queries to the higher-precedence group by dragging and dropping
them on to the space between any two queries already in the group.
6. To create further higher-precedence groups within an existing higher-precedence
group, repeat steps 4 and 5.
7. Double-click the combination operators of all the groups in the query to change them as
required.
The query appears in a form similar to the following in the Query Panel. (In this
example the MINUS combination has the higher precedence.)
8. Click Run Query.
Building Reports Using the Web Intelligence Java Report Panel 61
Page 62

Working with combined queries62
Page 63
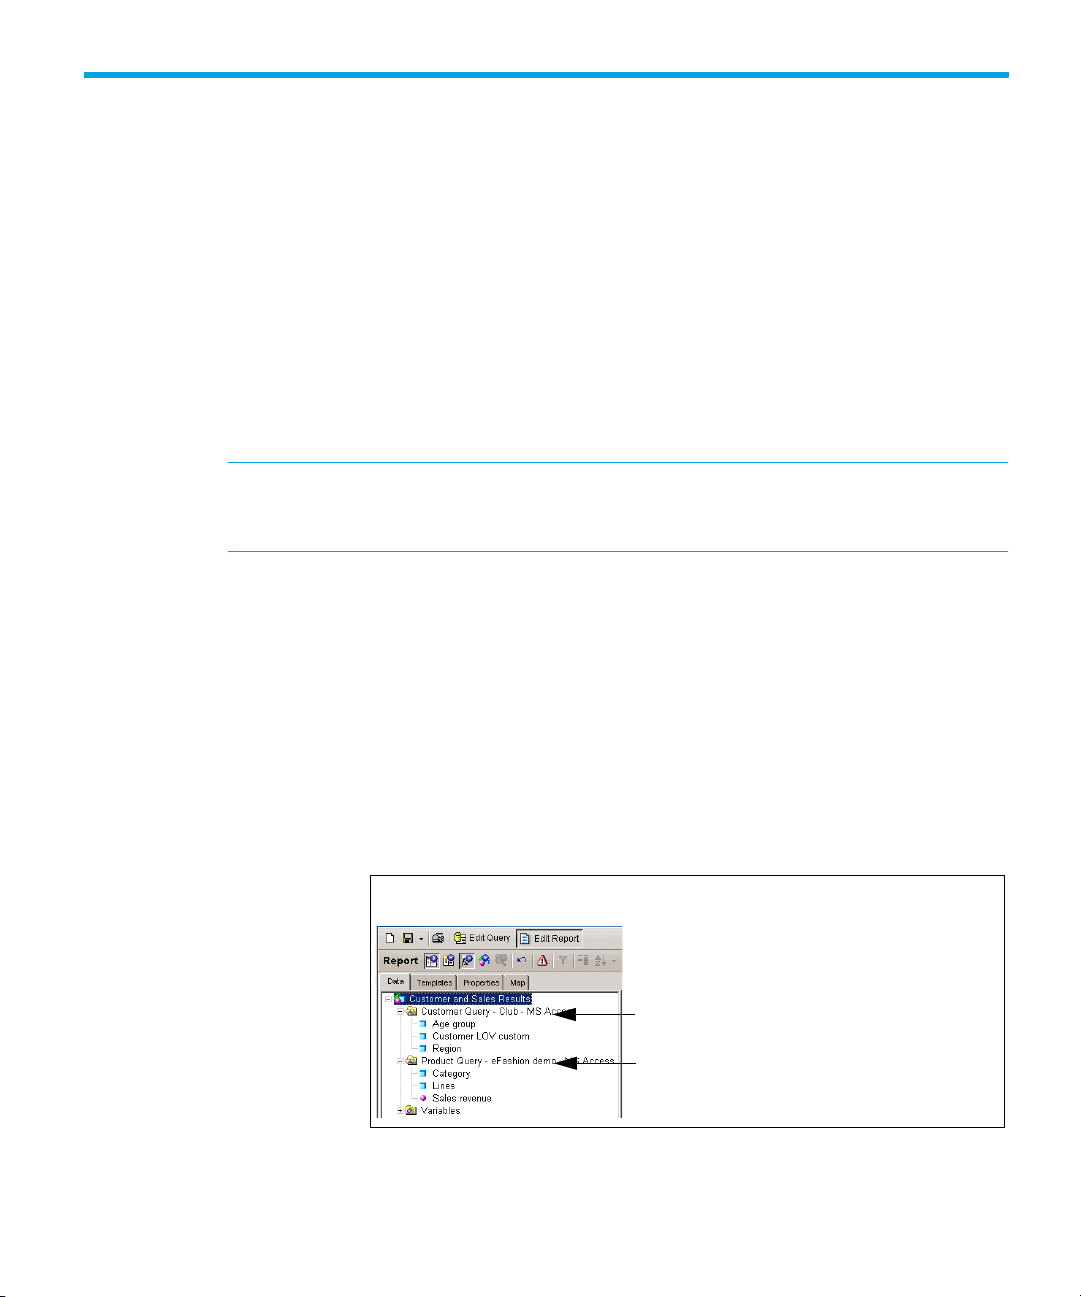
6
Including multiple data providers
Overview
This chapter tells you how you can include multiple data providers in a single document.
It includes the following information:
•
using multiple data providers
• defining multiple data providers in a document
• purging data from multiple data providers
Note: This chapter tells you how to add data providers to documents that already include
a first data provider. For information about creating new documents and building the first
data provider, see ”Building basic data providers” on page 33.
Using multiple data providers
You can include one or multiple data providers in a single Web Intelligence document.
When you include multiple data providers, those data providers can be based on a single
universe or on multiple universes available in InfoView.
Example: Include product sales data and customer data in the same document
In this example, your corporate data for product line sales is available on one universe
and data on customers is available on another universe. You want to present product line
sales results and information on customer age groups in the same report. To do this, you
create a single document that includes two data providers; one query on each universe.
You can then include and format results from both data providers on the same report.
Query 1 - on the customer universe
Query 2 - on the product line sales universe
The Data tab in Report View shows the two data
Building Reports Using the Web Intelligence Java Report Panel 63
Page 64

Note: You cannot include objects from different universes in the same report block (that is,
in the same table or chart). For full information, see ”For more information on merged
dimensions, see ”Merging dimensions from multiple data providers” on page 73 on
page 63.” on page 71.
Defining multiple data providers in a document
Defining multiple data providers in a single document is necessary when the data you
want to include in a document is available on multiple universes, or when you want to
create several differently-focused data providers on the same universe. You can define
multiple data providers when you can build a new document or add more data providers
to an existing document. You can present the information from all of the data providers on
a single report or on multiple reports in the same document.
Note: A maximum number of 15 data providers is supported per document.
This section of this chapter tells you how to:
• add a new query
• rename a query
• duplicate a query
• move a query
Note: This chapter tells you how to add data providers to documents that already include
a first query. For information about creating new documents and building the first query,
see ”Building basic data providers” on page 33.
Adding a new query to a document
To add a new query to a document:
1. With the Java Report Panel open, make sure you are in Query View.
The Edit Query button is pressed in when you are in Query View.
The query or data providers already defined for the document appear here.
Including multiple data providers64
Page 65

(If you require information on creating a new document and defining the first query,
refer to ”Building basic data providers” on page 33.)
Add Query button
The name of each query displays on a Query tab
2. Click the Add Query button on the Query toolbar.
The Universe dialog box appears.
You can create a new query on a universe already used in the document or select a
different universe.
Building Reports Using the Web Intelligence Java Report Panel 65
Page 66

3. In either of the two lists, select the universe on which you want to define a query.
4. Click OK.
The new query pane appears.
The query tab for the new query displays the default name for data providers: Query
followed by a number that indicates the total number of data providers in the
document; for example Allow other users to edit all data providers. You can rename
the query with a more meaningful name now or later. (See ”Renaming a query” on
page 68.)
5. Define the objects, filters, and scope of analysis, and properties you want for the
query.
The data content, scope of analysis, and filters you define here will only apply to the
selected query. The query properties, you define only apply to the selected query, with
the exception of the option Allow other users to edit all data providers. This option
applies to all of the data providers in the document.
For full information about the options you can select for query properties, see ”Defining
query properties” on page 44.
6. If you want to return the data from just the new query now, click the arrow next to the
Run Query button on the toolbar, then select the new query from the drop-down list of
data providers.
Or
If you want to return the data from all of the data providers in the entire document,
simply click the Run Query button on the toolbar.
Including multiple data providers66
Page 67

The New Query dialog box appears.
You need to choose how you want to include the data from the new query into the
document.
7. Select the appropriate option:
If you want to... Then select...
Display the data on a new
report in the document,
Display the data on the
currently selected report in a
new table,
Include the data in the
document without displaying
the data on a report,
(You can add the objects
returned by the query to the
report(s) later.)
1. Click OK.
Web Intelligence runs the new query and returns the data to the document. The data is
included as you specified.
You can rename the new query (see ”Renaming a query” on page 68), or build further
data providers, or duplicate the query and then edit the duplicate before returning the
data to the document (see ”Duplicating a query” on page 68 below).
Duplicating data providers
If you want to build a different query on a universe already included in the document,
you can duplicate the existing query on that universe and then modify it, instead of
starting from scratch.
Insert a table in a new report
Insert a table in the current
report
Include the result objects in the
document without generating a
table
Building Reports Using the Web Intelligence Java Report Panel 67
Page 68

Duplicating a query
To duplicate a query:
1. Make sure you are in Query View.
The Edit Query button is pressed in when you are in Query View.
2. Select a the query you want to duplicate by right-clicking the appropriate query tab at
the bottom of the report panel.
3. Right-click the query tab and then select Duplicate Query from the drop-down menu.
Web Intelligence creates a duplicate of the selected query and adds it to the report
panel.
You can edit the data definition of the duplicate query. For full information, see
”Building and running a simple query” on page 48.
Renaming data providers
By default, Web Intelligence names each query by a number in sequence. For
example, the first query is named Query 1, the second query is named Query 2 and
so on. You can rename data providers with more meaningful names to reflect the data
each query includes.
Renaming a query
To rename a query:
1. Make sure you are in Query View.
The Edit Query button is pressed in when you are in Query View.
Including multiple data providers68
Page 69

Either right-click the tab of the query you want to rename and then select Rename
Query from the shortcut menu.
Or
With the query tab you want to rename selected, click the Properties tab.
The Query Properties sub-tab appears.
2. In the Name box, type the name for the query.
3. Press the Enter key.
The new name appears on the Query tab.
Moving data providers
You can also change the order in which the data providers are run by moving the data
providers before or after the other data providers in the document. This is particularly
useful if different data providers in the document include prompts. You can define the
order in which the prompts will appear when users refresh the document, by ordering the
data providers accordingly.
For example, if Query 1 has a prompt on [Sales Region] and Query 2 has a prompt on
[Service Line], you can ensure that the prompt for Service Line appears to users first, by
moving Query 2 before Query 1.
Moving a query
To move a query:
1. Make sure you are in Query View.
The Edit Query button is pressed in when you are in Query View.
2. Right-click the tab of the query you want to move.
3. Select Move Query from the shortcut menu.
Building Reports Using the Web Intelligence Java Report Panel 69
Page 70

A sub-menu appears.
4. Depending on where you want to move the query, select Left or select Right.
The selected query moves accordingly.
Purging data from multiple data providers
When you purge data from a document you remove all data from the document, while
leaving the document structure intact. If the document contains multiple data providers, you
can purge specific data providers within the document.
Note: If you view purged reports in Results View, charts are not visible. To view the
structure of purged reports with charts, click View Structure.
Purging all the data providers in the document
To purge all the data providers in a document:
• Click the Purge button on the toolbar.
The values are removed from all report cells throughout the document. To return the
data to the document, click Refresh Data.
Purging data from a specific query
To purge a specific query in a document:
1. Click the arrow next to the Purge button on the toolbar.
A drop-down menu lists the data providers in the document.
2. Select the query you want to purge.
The values are removed from the report cells that contain data from the selected query.
To return the data to the document, click the arrow next to the Refresh Data button,
and then select the query you purged.
Synchronizing multiple data providers
Web Intelligence allows you to synchronize the data from multiple data providers by
creating merged dimensions. You create a merged dimension from existing dimensions
whose data is related. For example, if you have data providers showing revenue by city
and projected revenue by city, it makes sense to synchronize the data providers on the city
dimension. This allows you to create reports showing the relationship between projected
and actual revenue.
Including multiple data providers70
Page 71

For more information on merged dimensions, see ”Merging dimensions from multiple data
providers” on page 73 on
page 63.
Building Reports Using the Web Intelligence Java Report Panel 71
Page 72

Including multiple data providers72
Page 73

7
Merging dimensions from multiple data providersMerging dimensions from multiple data
providers
Overview
This chapter describes how to synchronize multiple data providers in a Web Intelligence
report by merging them on common dimensions. After merging common dimensions you
can place dimensions from different data providers in the same block.
Merged dimensions and data synchronization are new in Web Intelligence XI R2. They
enormously increase the power and flexibility of Web Intelligence by allowing you to
synthesise data from different sources in the same report, rather than simply including the
data.
For example, if you have one database that contains detailed customer information and
another database that contains sales data, you can synchronize the two data sources
around the customer.
This chapter includes information on the following topics:
• merging dimensions
• working with merged dimensions in reports
• understanding the effects of merged dimensions
Merging dimensions
”Including multiple data providers” on page 63 on page 63 describes how you can
include multiple data providers in a Web Intelligence document. You often need to
synchronize the data returned by these data providers. You do this by incorporating
common dimensions into a merged dimension.
In what situations do you merge dimensions?
You merge dimensions when your report draws related data from different data providers.
For example, you have a report showing revenue and sales targets. The report contains
sections based on the year, and each section shows revenue and sales targets. If revenue
and sales target data comes from two different data providers, Web Intelligence does not
know that it is related. You tell Web Intelligence that the data is related by merging the two
data providers on the common dimension, year.
When you merge dimensions, Web Intelligence creates a new dimension that contains all
the values from the original dimensions that make up the merged dimension. You use this
dimension in reports as you use any other report object. You can add report objects from
Building Reports Using the Web Intelligence Java Report Panel 73
Page 74

all the data providers synchronized through the merged dimension in the same block as
the merged dimension.
Which dimensions do you merge?
The only restriction that Web Intelligence imposes on merged dimensions is that they must
be of the same data type: for example, character data. But it does not make sense to
merge unrelated dimensions even when their data types are the same. For example, it
does not make sense to merge a dimension containing customer names with a dimension
containing sales regions.
Merged dimensions often have the same name in both data sources, but this is not
obligatory. It can make sense to merge dimensions with different names if they contain
related data.
To merge dimensions correctly you need to be aware of the semantics of the data (what
the data refes to) in the different data sources. The dimension data types and names are
an approximate guide only to dimensions’ suitability for merging.
Merging dimensions
To merge dimensions:
1. Click Merge Dimensions button on the toolbar.
The Merge Dimensions dialog box appears.
2. Select the dimensions you want to merge in the boxes at the top of the dialog box.
Merging dimensions from multiple data providers74
Page 75

NOTE: When you select a dimension, all dimensions of different data types are
disabled because you cannot merge dimensions of different data types.
3. Click Values to view the values associated with the dimensions.
4. Click Merge.
The Create Merged Dimension dialog box appears. You use this dialog box to specify
the properties of the merged dimension.
5. Select the dimension in the Source Dimension drop-down list.
The source dimension provides the default name, description and number formats for
the merged dimension.
6. Type the merged dimension name in the Merged Dimension Name box and the
merged dimension description in the Description box.
7. Click OK.
The merged dimension name appears in the Merged Dimensions box and the
dimensions that are part of the merged dimension appear in the boxes alongside it.
Because an original dimension can be part of one merged dimension only, it no longer
appears in the box above that lists the original dimensions in the query.
8. Click OK to close the Merged Dimensions dialog box.
Web Intelligenceadds the merged dimensions to the list of merged dimensions in the
Data tab.
Automatic merging
You can set Web Intelligence to merge dimensions automatically under the following
circumstances:
• The dimensions have the same name
• The dimensions have the same data type
Building Reports Using the Web Intelligence Java Report Panel 75
Page 76

• The dimensions are in the same universe.
To do this:
1. Right-click outside any block or chart and click Document Properties on the popup
menu.
2. Click Auto-merge dimensions.
Working with merged dimensions in reports
Once you have created a merged dimension you can include it in a report as you include
any other report object. Merged dimensions appear under the Merged Dimensions folder
in the Data tab. You can expand each merged dimension to see the dimensions that are
merged in it.
Editing merged dimensions
To edit a merged dimension:
1. In the Data tab, select the dimension in the Merged Dimensions folder and click the
right mouse button.
2. Select Edit Merged Dimension from the menu.
The Merged Dimensions dialog box appears.
3. Edit the merged dimensions as described in ”Merging dimensions” on page 74.
Deleting merged dimensions
To delete a merged dimension:
1. Select the dimension in the Merged Dimensions folder and click the right mouse button.
2. Select Delete Merged Dimension from the menu.
The merged dimension is deleted.
Adding merged dimensions to reports
To add a merged dimension to a report:
1. Select the dimension in the Merged Dimensions folder and drag it to the report.
The dimension is added to the report and shows all values from all dimensions merged
in it.
Merging dimensions from multiple data providers76
Page 77

Understanding the effects of merged dimensions
Data synchronization through merged dimensions adds enormous power to Web
Intelligence. Merged dimensions also have implications for the results that Web
Intelligence displays in certain situations. You need to understand these implications to
work effectively with merged dimensions and synchronized data.
The following sections describe these situations.
Synchronizing data providers with different aggregation levels
You can synchronize data providers with different aggregation levels. This can have
implications for the way in which Web Intelligence calculates measures.
Example: Synchronizing data providers with different aggregation levels
In this example you have two data providers as follows:
Customer Year Revenue
Jones 2004 1,500
Jones 2005 2,000
Smith 2005 1,200
Customer Number of sales
Jones 12
Smith 10
If you merge the two data providers and the table properties Avoid Duplicate Rows
Aggregation and Show Rows with Empty Dimensions are unchecked, Web
Intelligence returns the following:
Customer Year Revenue Number of
sales
Jones 2004 1,500 12
Jones 2005 2,000 12
Smith 2005 1,200 10
(For more information on the Avoid Duplicate Rows Aggregation and Show Rows
with Empty Dimensions properties, see the Web Intelligence online help.)
Building Reports Using the Web Intelligence Java Report Panel 77
Page 78

Web Intelligence cannot determine the number of sales per year for customer Jones
because the data provider that stores the number of sales does not break them down by
year. Web Intelligence therefore reproduces the total number of sales on each row.
Note: Although the Number of Sales values are duplicated, if you add a standard
calculation to the bottom of the column (for example a Sum or Average calculation), the
result is correct.
One way of adressing this issue is to add the dimensions to the second data provider that
allow Web Intelligence to calculate to the appropriate level of data. If this is not possible,
you must be aware of any situations where Web Intelligence cannot aggregate the data to
the necessary level of detail.
Extending the values returned by merged dimensions
Merged dimensions are a new concept in Web Intelligence XI R2. Synchronizing data
providers already exists in Desktop Intelligence/BusinessObjects but it does not involve the
creation of a new merged dimension. BusinessObjects reports use the original dimensions
that make up a merged dimension in Web Intelligence.
You can use these original dimensions in a Web Intelligence report. When you place them
in the report, Web Intelligence returns by default only those dimension values that have
corresponding values in the data providers synchronized through the merge. You need to
be aware of this when migrating reports from Desktop Intelligence and BusinessObjects
because BusinessObjects/Desktop Intelligence behaves differently.
Example: Web Intelligence and Desktop Intelligence/BusinessObjects behavior when
dimensions are merged
You have a report with the following data providers:
Country of origin Revenue
Germany 470
Country of origin Revenue
Japan 499
If you include the Country of Origin dimension from Data Provider 1and the Revenue
measure from Data Provider 2 in the same block, Web Intelligence returns the following
result:
Country of origin Revenue
Germany
The same block in Desktop Intelligence/BusinessObjects returns the following result:
Country of origin Revenue
Germany
Japan 499
Merging dimensions from multiple data providers78
Page 79

The block is different in Desktop Intelligence/BusinessObjects because BusinessObjects
extends the values of the Country of Origin dimension through the values returned by the
Revenue measure.
You can alter the Web Intelligence default behavior so that it corresponds with Desktop
Intelligence/BusinessObjects behavior in this situation.
Extending dimension values in Web Intelligence
To extend dimension values in Web Intelligence:
1. Right-click your report outside any blocks or charts and select Document Properties
on the shortcut menu.
The Document Properties pane appears on the right side of the report.
2. Check the Extend merged dimension values option.
Detail objects and merged dimensions
Detail objects are associated with dimensions and provide additional information about
the dimension. (For more information on detail objects, see ”What types of objects can
you use in a query?” on page 35.)
Web Intelligence XI R2 requires a one-to-one relationship between dimensions and details
(this means that a detail object can have one value only for each value of its associated
dimension) and does not take detail objects into account when synchronizing data. The
following example illustrates why this is necessary.
Example: Synchronizing data providers with detail objects
In this example you have two data providers as follows:
Customer Address Revenue
John London 10,000
Paul Liverpool 15,000
Customer Age
John 25
Paul 28
If you create a merged Customer dimension to synchronize the data providers, and
Address can have more than one value for each customer, the result is ambiguous because
there is no common value around which WebIntelligence can synchronize the data:
Building Reports Using the Web Intelligence Java Report Panel 79
Page 80

For example, Paul might also have an address in London, which means that there is no
unique ‘Paul’ row with which WebIntelligence can synchronize Paul’s age:
Customer Address Age
John London
Paul Paris
Paul London
John 25
Paul 28
If the relationship between Customer and Address is one-to-one, WebIntelligence can
ignore Address in the synchronization. This removes the ambiguity::
Customer Address Age
John London 25
Paul Paris 28
Previous versions of WebIntelligence, as well as Desktop Intelligence and BusinessObjects,
allow a one-to-many relationship between dimensions and details. If you migrate a report
created using any of these products and the detail object contains multiple values, Web
Intelligence places the #MULTIVALUE error in the detail cell.
You can solve this in Web Intelligence XI R2 by checking the Avoid Duplicate Row
Aggregation property.
For more information on working with variables, see ”Creating, editing, and deleting
variables” on page 343.
Filtering merged dimensions
Merging dimensions has implications for the way in which Web Intelligence applies filters.
Note: You cannot apply a filter a on merged dimension. You apply filters on the
dimensions that make up the merged dimension.
Report filters and merged dimensions
When you apply a report filter to a dimension that is part of a merged dimension, Web
Intelligence applies the filter to all data providers that are synchronized through the
merged dimension.
Merging dimensions from multiple data providers80
Page 81

Example: Filtering a merged dimension
In this example you have a report with the following data providers, which are merged on
the Country dimension:
Country Resort Revenue
France French Riviera 835,420
US Bahamas Beach 971,444
US Hawaiian Club 1,479,660
Country Future Guests
France 46
US 56
If you apply the filter
block to give the following result:
Country Future Guests
US 56
If the Country dimensions are not merged the second block is unaffected by the filter.
Country=”US” to the first block, Web Intelligence also filters the second
Section filters and merged dimensions
When a dimension that is part of a merged dimension is set as a section header, any filter
applied to the section also applies to blocks from synchronized data providers within the
section. If Country is set as the section header in the example ”Filtering a merged
dimension” on page 81 and the filter
Intelligence filters both blocks in the section—(Resort, Revenue) and (Country, Number of
Guests)—so that only those rows appear where the country dimension is equal to “US”,
even though Country in the second block comes from a synchronized data provider.
Block filters and merged dimensions
When you apply a block filter to a dimension that is part of a merged dimension, Web
Intelligence applies the filter to the block. Web Intelligence does not apply the filter to
other data providers synchronized through the merged dimension.
Drilling on merged dimensions
When you merge dimensions, the new merged dimension belongs to the hierarchies of all
dimensions involved in the merge.
Country=”US” is applied to the section, Web
Building Reports Using the Web Intelligence Java Report Panel 81
Page 82

Merging dimensions from multiple data providers82
Page 83

8
Filtering data retrieval using query filters
Overview
You limit the data returned to a Web Intelligence document by applying filters when you
define the query. Using query filters enables you to secure the data you don’t want specific
user groups to see and limits the size of the documents stored on your network. When you
run the query or refresh the document data, Web Intelligence returns only the values that
meet the query filter definitions.
This chapter tells you about:
•
how query filters work
• the different types of query filter
• using predefined filters
• creating custom filters
• combining multiple filters on a single query
• editing and removing query filters
• applying query filters to business questions
This chapter explains how to apply filters to objects in a query using the Java Report Panel.
How query filters work
When you build a query on a universe, you can filter the query to limit the data Web
Intelligence returns to the document. Query filters retrieve a sub-set of the data from the
database and return the corresponding values to the document. You define filters that
match the criteria of specific business questions. For example, you can filter the [Year]
dimension to view only sales revenue for Year 2003; or filter the [Annual Income]
dimension to view only customers whose annual income is equal to or greater than
$1.5M.
Including query filters on the data definition of the query enables you to:
• retrieve only the data you need to answer a specific business question
• hide the data you don’t want specific users to see when they access the document
• minimize the quantity of data returned to the document to optimize performance
Example: In 4Q2002, which stores in my sales region gained margins above $13K?
As Regional Marketing Manager for Texas, you are only interested in analyzing margins
for Texas, but the sales universe includes data US-wide. In addition, you only want to view
information for stores where margins reached over your 4Q 2002 quarterly target figure:
Building Reports Using the Web Intelligence Java Report Panel 83
Page 84

$130K. To create a document with only the information you need, you apply the following
query filters:
Year = 200
Quarter = Q$
State = Texas
Margin >= 130,000
To avoid displaying the filtered values Texas, 2002, and Q4 in the table columns Year,
Quarter, and State, you exclude the [Year], [Quarter], and [State] objects from the Result
Objects pane. When you generate the report, the report values correspond to Texas stores
with 4Q 2002 margins greater than or equal to $130K:
Store name Sales revenue Margin
e-Fashion Houston $307,914 $133,802
e-Fashion Houston Leighton $316,252 $136,055
This enables you to filter the report for the specific values that interest you and to minimize
the values displayed in the table.
The difference between query filters and report filters
Query filters
Report filters
Filtering data retrieval using query filters84
You can apply filters at two levels within a document:
• query filters – these filters are defined on the query; they limit the data retrieved from
the data source and returned to the Web Intelligence document
• report filters – these filters limit the values displayed on reports, tables, charts, sections
within the document, but they don’t modify the data that is retrieved from the data
source; they simply hide values at the report level
You define query filters in Query View. Users without the security profile to edit the query
cannot modify the query filters you define. This ensures that the data saved with a
document is appropriate for those who view or analyze the data within that document.
Note: Query filters decrease the time it takes to run the reports in the document and limit
the size of the document to the data relevant to the users who consult it. Query filters also
ensure document security.
Filters you apply to the data displayed in the report are called report filters. You use report
filters to limit the values displayed in the reports within a document. You can filter each
Page 85

report to display a different subset of the same data. The data hidden by the report filters
remains saved with the Web Intelligence document. You can modify the report filters to
display different data in the report or remove the report filters altogether to display all the
data defined in the query. You define report filters in Report View.
For information on using report filters, see ”How report filters work” on page 239.
Note: When you add a report filter, it is possible to create an aggregation context that
Web Intelligence is unable to process because you have made some of the objects in the
report incompatible. For more information on incompatible objects, see ”About
Incompatible objects in data providers” on page 52.
What makes up a filter?
To create a filter, you need to specify three elements:
• a filtered object
• an operator
• a value(s) or comparison object
Example: Filtering the data source to retrieve only values for the Accessories product
line
For example, to display data only for the Accessories product line, you select:
an operator: Equal to
filtered object: [Lines]
When you run the query, Web Intelligence applies the operator to the filtered object and
retrieves the value(s) from the database that correspond to the value(s) you specified.
You can filter multiple objects in a query. For example, you can create another filter on the
[Sales Revenue] measure to focus your data to a more specific range of results. When you
run the report again, Web Intelligence applies both query filters.
What objects can I filter on the query?
You can define custom query filters on any dimension, measure, or detail object listed on
the Data tab in Query View. You can also use predefined filters created by your
administrator at the universe level. Predefined filters appear with the universe objects and
are indicated by the filter icon.
Building Reports Using the Web Intelligence Java Report Panel 85
a value: Accessories
Page 86

For example, you can filter the [Year] dimension to return values for a specific year, filter
the [Revenue] measure to return values for a range of revenue figures, or filter the [Postal
Code] detail to return values for a specific postal area. For an illustrated description and
examples of dimensions, measures, and details, see ”What types of objects can you use in
a query?” on page 35.
Note: Your administrator can prevent objects from being filtered. If you create filters on
these objects, when you try to run the query a warning appears listing the filters that you
cannot use. You need to remove these filters from the query in order to run the query.
Which operator should I choose?
It is important to understand the effect of each operator available to you when you define
a filter. The table below lists the operators available for query filters and provides an
example of each operator in the context of a business question:
To obtain data... for example... select... to create the filter...
equal to a value
you specify,
different from a
value you
specify,
greater than a
value you
specify,
greater than or
equal to a value
you specify,
lower than a
value you
specify,
lower than or
equal to a value
you specify,
between two
values you
specify that
includes those
two values,
retrieve data for
the US only,
retrieve data for
all quarters
except Q4,
retrieve data for
customers aged
over 60,
retrieve data for
revenue starting
from $1.5M
upward,
retrieve data for
exam grades
below 40,
customers whose
age is 30 or less,
weeks starting at
week 25 and
finishing at 36
(including week
25 and week 36),
Equal to [Country] Equal to
US.
Not Equal to[Quarter] Not Equal
to Q4
Greater
than
Greater
than or
equal to
Less than [Exam Grade] Less
Less than or
equal to
Between [Weeks] Between
[Customer Age]
Greater than 60
[Revenue] Greater
than or equal to
1000500
than 40
[Age] Less than or
equal to 30
25 and 36
Filtering data retrieval using query filters86
Page 87

To obtain data... for example... select... to create the filter...
outside the
range of two
values you
specify,
the same as
several values
you specify,
different from
the multiple
values you
specify,
for which there
is no value
entered on the
database,
all the weeks of
the year, except
for weeks 25
through 36 (week
25 and week 36
are not included),
you only want to
retrieve data for
the following
countries: the US,
Japan, and the
UK,
you don’t want to
retrieve data for
the following
countries: the US,
Japan, and the
UK,
customers without
children (the
children column
on the database
has Null as the
data entry),
Not
between
[Weeks] Not
Between 25 and
36
In list [Country] In list ‘US;
Japan; UK’
Not in list [Country] Not in list
‘US; Japan; UK’
Is null [Children] Is null
for which a
value was
entered on the
database,
that includes a
specific string,
that doesn’t
include a
specific string,
customers with
children (the
children column
on the database
does not have
Null as the data
entry),
customers whose
date of birth is
1972,
customers whose
date of birth is not
1972,
Building Reports Using the Web Intelligence Java Report Panel 87
Is not Null [Children] Is not
Null
Matches
pattern
Different
from pattern
[DOB] Matches
pattern, ‘72’
[DOB] Different
from pattern, ‘72’
Page 88

To obtain data... for example... select... to create the filter...
that
corresponds to
two values you
specify,
that
corresponds to
one value you
specify and
does not
correspond to
another value
you specify
telco customers
who have both a
fixed telephone
and a mobile
phone,
telco customers
who have a fixed
telephone, but
don’t have a
mobile phone,
Different from, Not in List and Except
Different from, Not in list, and Except are all operators that exclude certain data from
your query results. For example, you could use this query filter to obtain a list of customers
who have not bought accessories:
Lines Different From Accessories
However, the filter illustrated above would not exclude customers who had bought
accessories, if these customers had also bought other line products from your company.
The same is true if you use the Not in list operator.
Both [Account Type]
Both “fixed” and
“mobile”
Except [Account Type]
“fixed” Except
“mobile”
If you used Except, the query would exclude all customers who had bought accessories,
whether they had bought other line products from your company or not.
How do I specify the value(s)?
When you define query filters, you specify the value(s) you want Web Intelligence to
retrieve from the database and return to the document. For example, if you want to limit
the document data to data for one or more countries, the value(s) you define will be the
names of those countries, such as the US and Japan.
There are two ways you can define the values for a filter using the Java Report Panel:
• type the value yourself – this is called a constant
• ask Web Intelligence to prompt you with the list of values present on the database so
you can select the values you want to retrieve
Filtering data retrieval using query filters88
Page 89

The following table gives examples of when it is more efficient to type a constant or select
value(s) from list:
If... for example... then...
the list of values on the
dimension or detail you
are filtering is long and
you are sure of how to
spell the value you want
to filter;
you are not sure how to
spell the value(s) you
want to filter;
names of months or
numbers for specific
years,
customer names or
product lines, which can
change frequently and
include unusual spellings,
type a constant.
select value(s) from
the List of Values.
How many filters can I apply to a query?
You can apply one or multiple filters to a single query. For example, to retrieve data for
stores with long opening hours and only for stores in specific US states, you can combine a
pre-defined filter with a custom filter:
Stores with long opening hours
AND
State in list: California, Florida, New York
For information on how to combine multiple query filters, see ”Combining multiple filters on
a query” on page 95.
Can I filter data without including the filtered object among the report data?
If you don’t want to include a filtered object on the Data tab of reports, you can filter the
object without including the object on the Result Objects pane. This is useful if you want to
filter a query to limit the document information to specific values, but you don’t want other
users who modify the reports to see the filtered object.
Types of query filters
You can apply four types of filters to data providers when you build data providers using
the Java Report Panel:
• predefined filters – created by your administrator
• custom filters – you define on the query
• prompts – you define these dynamic filters to display a question or a list of values so
you or other users can select different filter value(s) at each document refresh
• advanced filters – subqueries and rankings
You can combine all four types of filters on a single query.
Building Reports Using the Web Intelligence Java Report Panel 89
Page 90

This chapter explains how to use the following two filter types:
• predefined filters
• custom filters
For information on creating prompts, see ”Building prompt filters on data providers” on
page 113. For information on creating advanced filters, see ”Filtering data using
subqueries and database ranking” on page 105.
Note: Use query filters systematically when you create Web Intelligence documents to:
• ensure the document data is relevant to your analysis
• optimize the time it takes to return the data to the reports in documents
• minimize the size of documents stored on your system
Using predefined filters
Predefined filters are a method of making the specific data you most typically need for
reports permanently available in the Web Intelligence data tab. They are created by an
administrator and saved with the universe. Predefined filters often contain complex
expressions that require a detailed knowledge of the database structure. Including
predefined filters on the universe means you don’t need to create the same custom filters
every time you create new Web Intelligence documents based on the same universe.
Example: Targeting only privileged customers with a new store card payment scheme
In this example, you are a sales representative who wants to analyze the number of
purchases by customer by year, in order to target an incentive campaign for a new type of
store card payment scheme. Only those customers who are high spenders interest you.
Your administrator has created a filter on the universe, called Privileged Customers, to
make it easy for users building documents to analyze only those customers. When you use
this prdefined filter as a query filter, the data returned to the report table or chart will only
include data for the customers your company considers privileged customers.
Note: As a Web Intelligence user, you cannot edit predefined filters. This needs to be
done by an administrator. Predefined filters can only be used to filter the query, they
cannot be used to filter specific reports, sections, or blocks in the document.
Including a predefined query filter
To include a predefined query filter:
1. Make sure you are in Query View.
The Edit Query button is pressed in when you are in Query View. Web Intelligence
displays the universe objects on the Data tab.
2. Double-click the objects you want to include in the query.
Filtering data retrieval using query filters90
Page 91

Or
Drag and drop the objects onto the Result Objects pane.
The objects appear on the Result Objects pane.
For step-by-step instructions on selecting objects to build a query, see ”Adding an
object to a query” on page 39.
3. Double-click the predefined filter.
Or
Drag-and-drop the predefined filter to the Query Filters pane.
The predefined filter appears on the Query Filters pane.
When you run the query, the data corresponding to the query filter(s) you selected is
returned to the report.
You can apply multiple filters to the same query by combining predefined filters with
custom filters. For more information, see ”Combining multiple filters on a query” on
page 95.
NOTE: Predefined filters are created and edited by your administrator. As a Web
Intelligence user, you cannot view the component parts of predefined filters or edit
predefined filters.
Creating custom query filters
You create custom query filters to limit document data to information corresponding to:
• a specific business question
• the business information needs of a specific group of users
For example, you can create custom filters to retrieve sales results data for specific dates,
products, or services, or to view customer information only for customers who are high
wage earners or who live in a particular region.
Example: Analyzing year 2002 sales revenue figures at large stores nationwide
In this example, you are a finance officer who wants to analyze the revenue figures for the
larger stores nationwide at your company. The universe you connect to contains data for
all stores for all years. You create the following filters:
Year = 2002
AND
Sales floor size group greater than 3000-3999
The custom filters, which you defined and applied to the [Store Floor Size] and [Year]
dimensions, limits the values returned to the document to values for year 2002 for larger
stores.
You can define custom query filters two ways:
Building Reports Using the Web Intelligence Java Report Panel 91
Page 92

• Using the Quick Filter option – allows you to quickly select one or multiple values from
a list of value(s)
• Using the Filter Editor – allows you to select from many operators and to either type or
select the value(s)
Using the quick filter option to create filters
Quick filters allow you to quickly define the value(s) you want to retrieve for a specific
object without launching the Filter Editor. By default, Quick filters use the Equal to operator
if you select a single value or the In list operator if you select multiple values.
For example:
• If you select the [Payment Status] dimension and the value “unpaid” you create the
filter:
[Payment Status] Equal to “unpaid”
• If you select the [Country] dimension and the values US, Japan, Germany, you create
the filter:
[Country] In list “US;Japan;Germany”
Creating a query filter using the quick filter option
To create a query filter using the quick filter option:
1. Make sure you are in Query View.
The Edit Query button is pressed in when you are working in Query View.
2. Make sure the Query Filters pane is visible.
If the pane is not displayed, click the Show/Hide Filter Pane button.
Query Filters pane
3. In the Data tab, select the object you want to filter and drag it to the Result Objects
pane.
Filtering data retrieval using query filters92
Page 93

4. Reselect the object on the Result Objects panel and click the Add Quick Filter button
on the Report toolbar.
The List of Values dialog box appears. The values for the selected object are listed.
5. Select the value(s) you want to retrieve from the database.
For example, to filter the query for values in Q1, select the [Quarter] dimension, then
select Q1 from the list of values.
6. Click OK.
The new filter appears on the Query Filters pane.
When you run the query or refresh the document, Web Intelligence retrieves only the
values that correspond to the filter.
You can apply multiple filters to the same query. See ”Combining multiple filters on a
query” on page 95.
Using the Query Editor to create filters
Using the Query Editor allows you to choose from a range of operators to define the filter
condition and to either select values from the List of Values or to type a constant when you
define the filter value(s).
Creating a custom query filter using the Filter Editor
To create a custom query filter using the Filter Editor:
1. Make sure you are in Query View.
The Edit Query button is pressed in when you are working in Query View.
2. On the Query toolbar, click the Show/Hide Filter Pane button to display the Query
Filters pane.
Building Reports Using the Web Intelligence Java Report Panel 93
Page 94

The Query Filters pane is where Web Intelligence displays all the filters defined on the
query.
Query Filters pane
For information on how to define the result objects you want Web Intelligence to
retrieve to the document, see ”Building and running a simple query” on page 48.
3. Select the object you want to filter and drag it to the Query Filters pane.
The query filter appears in outline in the Query Filters pane.
4. Click the arrow next to the default operator (In List) and select the query operator from
the list of operators.
5. Click the arrow on the right of the query filter and select Constant, Value(s) from List
or Object.
6. Type/select the constant, list of values or object you want to include in the filter.
7. Click OK.
The new filter appears in the Query Filters pane.
8. To remove the filter, right-click it and select Remove from the menu.
9. To edit the filter, repeat steps 4-7 above.
When you run the query, only data corresponding to the query filter is returned to the
report.
NOTE: You can choose to display the filtered values in the report, by including the
object you filter in the Result Objects pane, or filter the object without displaying the
filtered values, by excluding the object you filter from the Result Objects pane.
You can apply multiple filters to the same query. See ”Combining multiple filters on a
query” on page 95.
Filtering data retrieval using query filters94
Page 95

Combining multiple filters on a query
Typical business questions require to retrieve information that matches more than one
criteria. For example, if you are analyzing customer services data, you will most likely
want to focus on customers for a specific time period and also for a specific region, and
probably also for a specific level of customer service contract. With Web Intelligence, you
retrieve data that answers several criteria like this by combining filters in the same query.
Example: Analyze sales revenue this year at stores where the floor size is over 4,000
square feet and sales revenue figures are equal to or less than $1.5M
In this example, you are an operations manager for a retail chain. You want to analyze
information about the large retail stores in your chain that are making less than the sales
revenue figure your company has set as the target. To do this you add a predefined filter
on the [Year] dimension to specify that you only want to retrieve values for this year. Then
you create a second filter on the [Sales Floor Size] dimension to specify that you only want
to retrieve data for stores where the floor size is greater than 4,000 square feet. After this,
you create a third filter on the [Sales Revenue] measure to specify that you only want to
retrieve data for stores where the sales revenue figures are equal to or less than $1.5M.
Finally, you combine these three filters with the And operator:
When you run the query, only data for stores that satisfy all three criteria will be returned
to the report.
The section tells you how to:
• combine query filters
• combine simple filters with combined filters
Building Reports Using the Web Intelligence Java Report Panel 95
Page 96

How you combine query filters
You combine filters to retrieve data that corresponds to multiple business criteria. For
example, to retrieve data for customers who live in California and who don’t have a
premium service contract, you combine the following two filters:
Filter 1: [State] Equal to California
And
Filter 2: [Service Contract] Not equal to Premium
Combining query filters
To combine query filters:
1. Create each filter.
For step-by-step information on how to create query filters, see ”Creating a custom
query filter using the Filter Editor” on page 93.
2. Make sure that the Show/Hide Filters pane button on the Query toolbar is pressed in.
You view the filters on the query in the Query Filters pane.
By default Web Intelligence combines the filters with the And operator:
3. You can leave the And operator or change the operator to Or.
This table explains the difference between the And and the Or operators:
You want to retrieve... for example... select...
data true for both
filters,
data true for any one
of the filters,
Filtering data retrieval using query filters96
customers who ordered supplies in
Q1 and who are based in the US
(the data you retrieve will include:
US customers who placed orders
in Q1),
customers who ordered supplies
in: Q1 or who are based in the US
(the data you retrieve will include:
worldwide customers who placed
orders in Q1 and US customers
who placed orders during any
quarter),
And
Or
Page 97

1. If necessary, change the operator to Or, by double-clicking the And operator once:
Or now displays as the operator.
Combining simple filters with combined filters
You can combine filters with other groups of combine filters to retrieve data that
corresponds to one or multiple business criteria. You combine filters with And or Or
operator. You can combine groups of filters with single filters to answer complex criteria.
The following example explains how the And and Or operators affect the data Web
Intelligence retrieves to a document.
Example: Using And or Or to combine query filters
This example illustrates how using And and Or operators in four different ways to combine
the same three query filters affects the values retrieved to a document. The three filters are
on the [State] dimension, the [Quarter] dimension, and the [Sales Revenue] measure.
Using And
Using And to combine all three filters returns data for Texas in Q4, if the Sales Revenue
total is greater than $2M:
In this case, the Sales Revenue for Texas in Q4 is over $2M, so the following values are
returned to the default report when you run the query:
When you use the And operator to combine all the query filters like this, all of the criteria
specified in all of the filters need to be matched by the data on the database for Web
Intelligence to run the query. If any one filter is unmatched Web Intelligence displays a
warning to inform you that there is no data corresponding to the query definition. If you
run the query anyway, the default report displays without any values. Only the table
headers appear.
Building Reports Using the Web Intelligence Java Report Panel 97
Page 98

Using Or
Using Or to combine all three filters returns data that matches any one of the filters:
In this case, Web Intelligence returns values for Texas for all quarters and data for all
states in Q4, and data for all states where sales revenue was greater than $2M.
Using And and Or
You can retrieve data that answers either the criteria specified in one filter or the criteria
specified in the other filter(s). You can combine the first filter with either the second or third
filter by using And and Or as follows:
In this case, Web Intelligence retrieves data that corresponds to:
• the first filter – [State] Equal to Texas
and
• that also corresponds to either
• the second filter – [Quarter] Equal to Q4
or
• the third filter – [Sales Revenue] Greater than $2M
Using Or and And
You can reverse the operators and combine the same three filters as follows:
In this case, Web Intelligence retrieves data that corresponds to:
• the first filter – [State] Equal to Texas
Filtering data retrieval using query filters98
Page 99

or that corresponds to
• both the second filter – [Quarter] Equal to Q4 and the third filter – [Sales Revenue]
Greater than $2M
Applying query filters to business questions
This section provides examples of how you can apply query filters to Web Intelligence
documents to answer typical business questions.
Retrieving a range of values
Using filters to retrieve a range of values is useful if you want to define a date range to
analyze invoices or orders for a particular calendar period, or if you want to define an
alphabetical range; such as for customer names or product lines.
Example: Analyzing the payment status of invoices sent to customers in December
2002
In this example you want to analyze the payment status of all invoices sent to customers
during the month of December, 2002. To do this you need to retrieve data for invoices
dated between December 1, 2002 and December 31, 2002.
To do this:
1. Click the Edit Query button on the Web Intelligence toolbar.
Query View appears.
2. Drag and drop the [Invoice Date] object into the Query Filters pane.
The Filter Editor dialog box appears.
3. Select the operator Between.
NOTE:
To retrieve data that... for example... double-click...
include a range of
values,
omit a range of values, Exclude data for 12/01/02
1. If you know how dates are typed into the database, select Constant. If you are unsure
how dates should be typed or you want to select from new values entered into the
database that you haven’t yet seen, select Value(s) from list.
retrieve data for 12/01/02
through 12/31/2002,
through 12/31/2002,
Building Reports Using the Web Intelligence Java Report Panel 99
Between
Not between
Page 100

2. Enter the start date and end date for the month of December 2002:
If you selected Constant... if you selected Value(s) from list...
• type the date for December 1,
2002 into the From: box,
• type the date for December
31, 2002 in the To: box
3. Click OK to confirm the filter.
The new filter appears in the Query Filters pane.
When you run the query, only invoices for the month of December 2002 will be
returned to the document.
NOTE: To avoid displaying the Year column in the table, which will display the
same value “2002” in each row, remove the [Year] object from the Result Objects
pane when you define the query. The document data will still be filtered for 2002,
but the value “2002” will no longer be displayed in the report(s).
• select the date for December 1,
2002 and click the From>>
button
• select the date for December 31,
2002 and click the To>> button
Using the In list operator to define filters
Using the In list operator for filters is useful, if you want to retrieve data for several values,
such as specific cities, product lines, or named customer accounts, that are not already
grouped together in objects on the universe.
Example: Analyzing sales revenue for the cities in your sales region
In this example, you want to analyze sales revenue for the cities that fall into your sales
region. The [City] object on the universe includes all the cities with which your company
does business. In order to analyze only those cities for which you are responsible, you
need to create a filter that selects the cities you specify.
To do this:
1. Click the Edit Query button on the Web Intelligence toolbar.
Query View displays the query definition of the open document.
2. Drag and drop the [City] object into the Query Filters pane.
Filtering data retrieval using query filters100
 Loading...