

Page 1

HP P6000 Performance Advisor User Guide
Abstract
This document is intended for storage administrators and users involved in performance characterization of an HP P6000
Enterprise Virtual Array (EVA). You must have a basic understanding of storage performance concepts as well as the EVA
architecture and management. You must be familiar with HP P6000 Command View, P6000 Performance Data Collector, and
HP Management Integration Framework.
HP Part Number: T5494-96596
Published: September 2013
Edition: 5
Page 2

© Copyright 2008, 2013 Hewlett-Packard Development Company, L.P.
Confidential computer software. Valid license from HP required for possession, use or copying. Consistent with FAR 12.211 and 12.212, Commercial
Computer Software, Computer Software Documentation, and Technical Data for Commercial Items are licensed to the U.S. Government under
vendor's standard commercial license.
The information contained herein is subject to change without notice. The only warranties for HP products and services are set forth in the express
warranty statements accompanying such products and services. Nothing herein should be construed as constituting an additional warranty. HP shall
not be liable for technical or editorial errors or omissions contained herein.
NOTE: IPv6 is supported on server-based management HP P6000 Command View Suite beginning with Version 8.0.2. IPv6 is supported
on array-based management HP P6000 Command View Suite beginning with Version 9.2.
NOTE: USGv6 is supported on array-based management HP P6000 Command View Suite beginning with Version 10.1. Internet Protocol
Security (IPsec) is not supported with HP P6000 Command View Suite array-based management.
See the HP P6000 Command View User Guide for information on Internal Protocol support.
Page 3

Contents
1 HP P6000 Performance Advisor overview......................................................8
Features..................................................................................................................................8
2 Getting started.........................................................................................10
Deploying and installing HP P6000 Performance Advisor.............................................................10
Configuring HP P6000 Performance Advisor..............................................................................10
3 SPoG interface and common tasks..............................................................13
Understanding the SPoG interface............................................................................................13
HP P6000 Performance Advisor common tasks...........................................................................15
Using the Restore Defaults option.........................................................................................15
Using the Display option.....................................................................................................15
Using the Filter by list.........................................................................................................16
Additional tasks.................................................................................................................16
4 HP P6000 Performance Advisor concepts....................................................18
Object type folders and Storage object nodes............................................................................18
Dashboard............................................................................................................................19
KPIs.................................................................................................................................20
Key Metrics............................................................................................................................20
Charts...................................................................................................................................22
Reports..................................................................................................................................23
Load Distribution....................................................................................................................24
Load distribution across controllers.......................................................................................24
Live Data Metrics...........................................................................................................25
Historical Data Metrics...................................................................................................25
Load distribution across host ports........................................................................................27
Performance and state data.....................................................................................................28
Statistical data.......................................................................................................................30
Database maintenance............................................................................................................31
Host connections....................................................................................................................32
Data replication tunnels...........................................................................................................33
Threshold monitoring...............................................................................................................34
Overview..........................................................................................................................34
Threshold summary value....................................................................................................35
Threshold monitoring methods.............................................................................................37
Factors for setting threshold levels.........................................................................................38
Threshold alarm email notifications.......................................................................................38
5 Quick tour of HP P6000 Performance Advisor pages.....................................42
Settings page.........................................................................................................................42
Settings – Configuration page.............................................................................................42
Settings – Database page...................................................................................................44
Settings – Events page........................................................................................................45
Settings – Storage Systems page..........................................................................................45
Storage Systems – <storage system> page........................................................................46
<Storage system> – <performance object type> page........................................................47
Storage Systems page.............................................................................................................47
Storage Systems – <object type> page.................................................................................49
<Object type> – <performance object> page........................................................................50
6 Working with HP P6000 Performance Advisor..............................................51
Configuring monitoring settings in HP P6000 Performance Advisor................................................51
Using the Quick Setup........................................................................................................51
Contents 3
Page 4

Adding an HP P6000 Performance Data Collector instance.....................................................54
Adding performance objects for monitoring...........................................................................55
Adding storage systems.................................................................................................55
Adding other performance objects..................................................................................58
Parameters in the Select <Performance Object> window.....................................................60
Adding threshold and dashboard profiles.............................................................................60
Adding threshold profiles...............................................................................................60
Adding dashboard profiles.............................................................................................61
Configuring dashboard settings...........................................................................................62
Configuring additional settings............................................................................................63
Report settings..............................................................................................................63
Chart settings...............................................................................................................64
Key Metric settings........................................................................................................65
SMTP and SNMP notification settings..............................................................................66
Configure email and SNMP settings............................................................................66
Configure SNMP settings...........................................................................................67
Exporting MIB file.....................................................................................................69
Sample email notification..........................................................................................69
Sample SNMP notifications........................................................................................69
Managing configured settings in HP P6000 Performance Advisor.................................................71
Managing HP P6000 Performance Data Collector settings......................................................71
Viewing configured HP P6000 Performance Data Collector instances...................................71
Editing the port number of HP P6000 Performance Data Collector instances.........................72
Removing configured HP P6000 Performance Data Collector instances.................................72
Viewing HP P6000 Command View instances.......................................................................73
Managing configured settings for performance objects...........................................................73
Viewing configured monitoring settings for storage systems.................................................73
Viewing configured monitoring settings for other performance objects..................................74
Viewing configured monitoring settings for virtual disks..................................................75
Viewing configured monitoring settings for hosts...........................................................75
Viewing configured monitoring settings for disk groups..................................................75
Viewing configured monitoring settings for data replication groups.................................75
Viewing configured monitoring settings for controllers....................................................75
Viewing configured monitoring settings for host ports....................................................75
Viewing configured monitoring settings for physical disks...............................................76
Editing monitored settings for a storage system or performance object..................................76
Removing storage system or performance object records.....................................................76
Starting or stopping data collection for a storage system....................................................77
Updating the object state for a storage system...................................................................78
Viewing configured dashboard settings............................................................................79
Managing configured threshold profiles................................................................................79
Viewing configured threshold profiles...............................................................................79
Editing a configured threshold profile...............................................................................80
Removing threshold profiles............................................................................................81
Removing custom threshold profiles..................................................................................81
Managing configured dashboard profiles.............................................................................81
Viewing configured dashbaord profiles............................................................................81
Editing a configured dashboard profile............................................................................82
Removing dashboard profiles..........................................................................................82
Managing additional settings..............................................................................................83
Email and SNMP notification settings...............................................................................83
Viewing a summary of configured monitoring settings.............................................................83
Summary of configured monitoring settings for storage systems...........................................84
Summary of configured monitoring settings for virtual disks.................................................84
Summary of configured monitoring settings for hosts..........................................................85
4 Contents
Page 5

Summary of configured monitoring settings for disk groups.................................................85
Summary of configured monitoring settings for data replication groups................................86
Summary of configured monitoring settings for controllers and host ports..............................86
Summary of configured monitoring settings for physical disks..............................................87
Summary of configured monitoring settings for storage systems...........................................87
Viewing the HP P6000 Performance Advisor configuration summary.........................................88
Licensing behavior in HP P6000 Performance Advisor.............................................................88
Viewing performance metrics of storage systems.........................................................................90
Viewing the Dashboard Overview........................................................................................90
Storage System – Live Host Port Throughput and Latency Values...........................................91
Correlation between color blocks and status icons – Live bar chart.......................................93
Understanding a live bar chart........................................................................................94
Storage System level performance charts..........................................................................94
Host Port IOPS Historical chart....................................................................................95
Host Port IO Latencies chart.......................................................................................95
Threshold Summary chart..........................................................................................95
Correlation between color blocks and status icons – Threshold Summary chart.................96
Understanding tool tip - Threshold Summary chart.........................................................96
Understanding the Threshold Summary chart................................................................96
Key Performance Indicators – Dashboard.........................................................................97
Dashboard counters......................................................................................................98
Viewing the Dashboard Host Port Performance.......................................................................98
Live Data......................................................................................................................99
Historical Statistical Data..............................................................................................100
Charts.......................................................................................................................100
Viewing and managing the Dashboard KPIs........................................................................100
Adding KPI records.....................................................................................................100
Viewing KPI records.....................................................................................................101
Removing KPI records..................................................................................................101
Viewing a threshold summary............................................................................................101
Threshold summary for a storage system.........................................................................103
Threshold summary table.........................................................................................103
Understanding tool tip.............................................................................................104
Interpretation of the threshold summary – Storage system.............................................104
Threshold summary for an object type............................................................................104
Viewing records for a state......................................................................................105
Interpretation of the threshold summary – object type..................................................106
Threshold summary for a performance object..................................................................106
Using Edit threshold profile settings link.....................................................................107
Interpretation of the threshold summary – performance object.......................................107
Viewing a summary of key metrics......................................................................................108
Key metric summary for storage systems.........................................................................109
Key metric summary for object types..............................................................................110
Key metric summary for a performance object.................................................................112
Editing key metric chart settings.....................................................................................113
Viewing charts.................................................................................................................114
Chart views................................................................................................................116
Opening a chart in a new window................................................................................117
Printing charts.............................................................................................................118
Saving charts..............................................................................................................118
Zooming in and out on charts.......................................................................................118
Managing charts.............................................................................................................119
Adding charts.............................................................................................................119
Editing chart settings....................................................................................................121
Removing charts..........................................................................................................121
Contents 5
Page 6

Viewing and managing reports..........................................................................................121
Reports history............................................................................................................122
Report templates.........................................................................................................123
Creating a report template.......................................................................................123
Editing a report template.........................................................................................125
Executing a report template.....................................................................................126
Removing a report template.....................................................................................126
Predefined templates...................................................................................................127
7 Managing the event log..........................................................................129
Viewing the event log............................................................................................................129
Event categories...................................................................................................................130
Event severity levels...............................................................................................................131
Exporting events...................................................................................................................131
8 Maintaining database.............................................................................133
HP P6000 Performance Advisor database summary..................................................................133
Exporting storage system data................................................................................................133
Viewing export database records............................................................................................134
Removing export records.......................................................................................................135
Purging data........................................................................................................................135
Viewing purge history...........................................................................................................136
Re-purging data...................................................................................................................137
Cleaning purge history..........................................................................................................137
Data backup and restore.......................................................................................................137
9 Troubleshooting HP P6000 Performance Advisor issues................................140
Troubleshooting scenarios......................................................................................................140
Error messages.....................................................................................................................146
Setup and configuration....................................................................................................146
Database purge...............................................................................................................148
Database export..............................................................................................................150
Key Metrics.....................................................................................................................150
Events............................................................................................................................151
Threshold monitoring........................................................................................................151
Reports...........................................................................................................................153
Management Integration Framework...................................................................................154
Dashboard and charts......................................................................................................154
Contacting HP support......................................................................................................156
10 Support and other resources...................................................................157
Release history.....................................................................................................................157
Contacting HP......................................................................................................................157
HP Insight Remote Support.....................................................................................................157
Related information...............................................................................................................158
A Object types and properties....................................................................159
B Use cases..............................................................................................161
Setting up dashboard............................................................................................................161
Determining threshold monitoring values..................................................................................162
C Counters in HP P6000 Performance Advisor..............................................164
Derived counters definitions...................................................................................................164
Supported counters...............................................................................................................167
6 Contents
Page 7

D Event codes...........................................................................................173
E Viewing CSV report using HP TLViz...........................................................174
F HP P6000 Performance Advisor deployment architecture..............................175
Glossary..................................................................................................180
Index.......................................................................................................183
Contents 7
Page 8

1 HP P6000 Performance Advisor overview
HP P6000 Performance Advisor is server-based software that monitors the performance of HP
P6000 EVA storage systems and provides metrics that help you analyze performance and
troubleshoot performance issues. You can view metrics at the storage system and subsequent levels.
HP P6000 Performance Advisor interacts with HP P6000 Performance Data Collector to gather
performance data and HP P6000 Command View to gather state data of the monitored storage
systems and corresponding performance objects. The performance data is collected for the set of
counters that are also applicable in HP P6000 Performance Data Collector. HP P6000 Performance
Advisor also provides performance data for additional counters that are based on the existing set
of counters. For more information on derived counters, see “Derived counters definitions” (page 164).
HP P6000 Performance Advisor enables you to view performance metrics at the following levels:
• Storage system: View performance metrics of storage systems and high-level performance of
monitored objects across different object types.
• Object type: View performance summary of all corresponding monitored objects. A hyperlink
provided for each performance object allows you to further drill down to view the performance
summary for that object.
• Performance object: View performance metrics for a specific monitored object.
NOTE:
• To deploy and use HP P6000 Performance Advisor, you must have sufficient knowledge of
HP P6000 Command View, HP P6000 Performance Data Collector, Management Groups,
and EVA storage systems.
• When using HP P6000 Performance Advisor, a minimum of Adobe Flash Player 10 is required
• Unless otherwise mentioned, the term storage systems refers to HP P6000 storage systems or
• The term performance object in HP P6000 Performance Advisor refers to the supported object
• The term object type refers to root node or folder node that encompasses performance objects
Features
Following are the feature highlights:
Quick Setup: Quickly setup and start monitoring HP P6000 EVA storage systems and their
performance objects.
Key Metrics: Key Metrics functionality helps you view statistical performance data of storage systems
and objects for the most useful counters. Key Metrics charts can show live data samples or historical
performance data for the duration selected.
Threshold monitoring and notifications: You can set threshold levels (Minor and Major) for counters
and monitor performance against the set threshold levels, and also receive notification when
performance of an object crosses the dispatch at threshold level. You can also view threshold levels
in charts for a performance object.
Dashboard: Dashboard functionality provides an overall view of the storage system and helps you
quickly scan and identify if there are performance issues. It provides the drill down capability to
further analyze performance at controller and host port levels. It also allows quick viewing of
performance data for user-defined key performance indicators.
on the browser you are using.
EVA storage systems throughout the document.
in HP P6000 EVA storage system that can also be viewed in HP P6000 Command View.
in HP P6000 Command View. It does not include user defined folders.
8 HP P6000 Performance Advisor overview
Page 9

Charts: Charts functionality allows you to view historical data or live performance data samples
for a predefined interval or custom duration. You can also add multiple counters in to the same
chart and view performance of the object for those counters. You can also use the zoom-in
functionality.
Reports: Reporting functionality allows you to generate point-in-time performance reports in PDF
and CSV formats for specific performance objects. You can specify durations, such as a day or
month. Reports can be saved for future reference.
Load Balancing: Load distribution enables you to identify if the load across the host ports and
controllers is well balanced.
Database: You can view a summary of the database, export the performance data, and maintain
the database space by purging older data.
Features 9
Page 10

2 Getting started
This chapter describes how to use HP P6000 Performance Advisor to monitor storage systems and
corresponding performance objects.
Deploying and installing HP P6000 Performance Advisor
CAUTION: Ensure that the storage systems have a valid HP P6000 Performance Advisor license
installed in HP P6000 Command View. Storage systems with an expired license or for which a
license is not yet installed cannot be added for monitoring in HP P6000 Performance Advisor.
There are different deployment models for HP P6000 Performance Advisor. For more information
on the preferred deployment model, see “HP P6000 Performance Advisor deployment architecture”
(page 175).
HP P6000 Performance Advisor is available as part of the HP P6000 Command View suite of
products. The HP P6000 Command View installation wizard helps you install HP P6000 Performance
Advisor. For more information, see the HP P6000 Command View Installation Guide.
After installation, HP P6000 Performance Advisor appears in the SPoG interface along with the
HP P6000 Command View instance, if both applications are installed on the same management
server. If they belong to the same Management Group as other installed instances, the corresponding
SPoG displays all installed instances of HP P6000 Performance Advisor and HP P6000 Command
View in a single browser window. In either case, HP P6000 Performance Advisor can automatically
discover the installed instances of HP P6000 Command View.
After you log in to the SPoG using your user name and password, you can view all installed
instances of HP P6000 Command View and HP P6000 Performance Advisor under Settings in the
Navigation pane. All storage systems managed by the discovered HP P6000 Command View
instances are displayed in the SPoG, under Storage Systems in the Navigation pane. Add those
storage systems and performance objects, and configure the monitoring settings. For more
information, see “Configuring HP P6000 Performance Advisor” (page 10). To understand the
different pages in HP P6000 Performance Advisor, see “Quick tour of HP P6000 Performance
Advisor pages” (page 42).
If the installed instances do not belong to the same Management Group, import either of the servers
in to the Management Group so that the instances appear in the same SPoG. For more information
on importing servers into Management Groups, see the HP P6000 Management Integration
Framework Administrator Guide.
Configuring HP P6000 Performance Advisor
This section explains how to quickly configure an HP P6000 Performance Advisor instance to
monitor storage systems and performance objects, and involves:
1. Selecting the HP P6000 Performance Advisor instance.
2. Adding the HP P6000 Performance Data Collector instance through which the storage systems
are accessible. For example, assume that CV1 is managing SS1 and SS2, and CV2 is
managing SS3 and SS4, and the four storage systems are visible to PA1. If the HP P6000
Performance Data Collector instance you add in PA1 is able to access only SS1 and SS2,
you can add only those storage systems in PA1 through the HP P6000 Performance Data
Collector instance. If you also want to add SS3 and SS4 visible through CV2, then add the
corresponding HP P6000 Performance Data Collector in PA1.
3. Adding storage systems and corresponding performance objects, and configuring the
monitoring settings.
10 Getting started
Page 11

The HP P6000 Performance Advisor instance will collect performance data and display relevant
metrics at the storage system, object type, and performance object levels. For more information,
see “Viewing performance metrics of storage systems” (page 90).
NOTE:
• Two different HP P6000 Performance Advisor instances cannot simultaneously monitor a
storage system in a management group.
• The list of metrics displayed under Controller and Storage System object types gets updated
during state data collection cycle based on Storage System’s support for XCOPY and WSAME
metrics.
• To effectively collect the performance data for XCOPY and WSAME metrics and Writes-in-Cache
(Basic Async) and Not-Ack.Writes (Basic Async) metrics of Data Replication Group, all
Performance Data Collector instances added in P6000 Performance Advisor must be upgraded
to Performance Data Collector 10.1 or later.
Procedure
To quickly configure HP P6000 Performance Advisor to monitor and provide relevant metrics on
storage systems and performance objects:
1. Use the Quick Setup wizard to:
a. Add the fully qualified server names or IP addresses (IPv4 or IPv6) of the HP P6000
Performance Data Collector instances, one after the other.
b. Add the storage systems. Only those storage systems visible through the discovered HP
Command View and accessible through the HP P6000 Performance Data Collector
instances (added in the previous step) are displayed. The storage systems with an invalid
license state cannot be added. For more information on managing licenses, refer to the
HP P6000 Command View User Guide.
c. Add all performance objects in an object type. By default, storage systems, controllers
and host ports are mandatorily added.
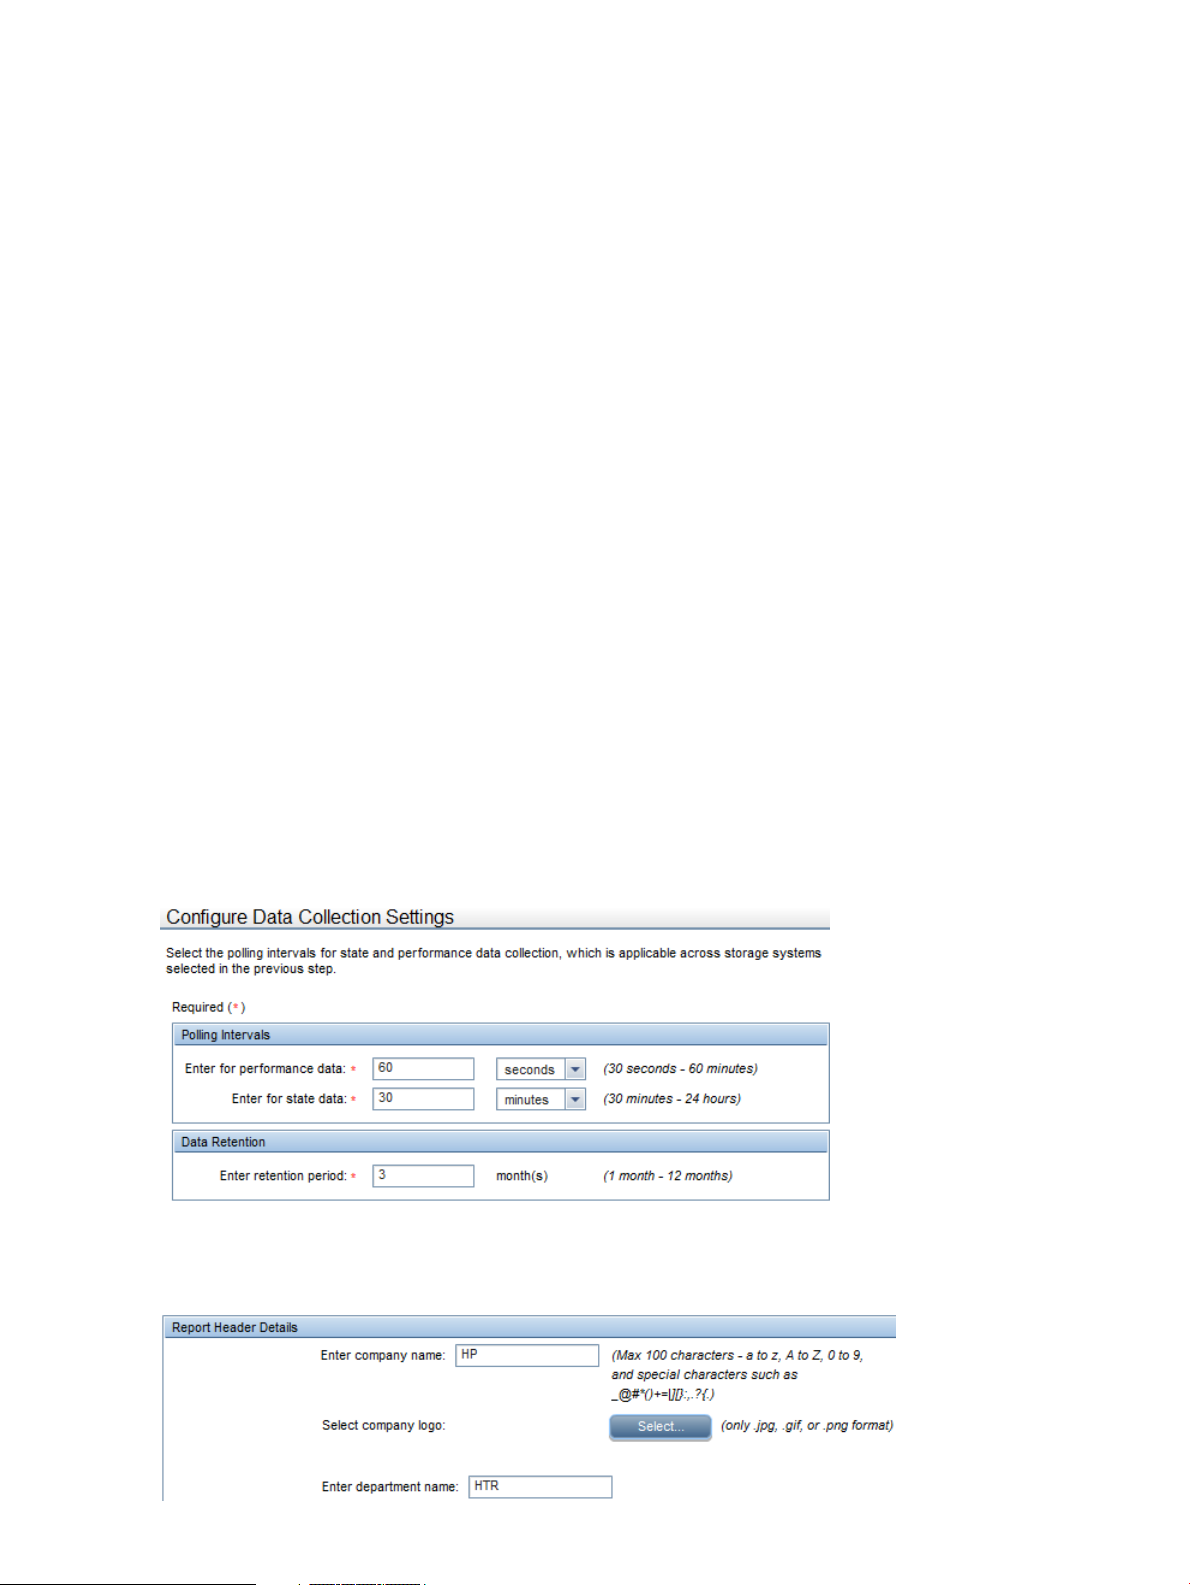
d. Configure the performance and state data collection polling intervals that are applicable
across all the selected storage systems and corresponding objects.
e. Configure the dashboard profile.
For more information, see “Using the Quick Setup” (page 51).
To add storage systems and specific performance objects, see “Adding performance objects
for monitoring” (page 55).
2. View key metric charts and statistical data of monitored storage systems and performance
objects for the set of counters defined by HP P6000 Performance Advisor. For more information,
see “Viewing a summary of key metrics” (page 108).
3. Plot charts to view live or historical performance data samples of storage systems and objects
for a specified duration. For more information, see “Adding charts” (page 119).
To understand HP P6000 Performance Advisor functions, such as key metrics, KPIs, charts, and
reports, see “HP P6000 Performance Advisor concepts” (page 18). See “Quick tour of HP P6000
Performance Advisor pages” (page 42) for a description of the pages in HP P6000 Performance
Advisor.
For monitored storage systems and corresponding performance objects, you can:
• Configure minor and major threshold levels and view the threshold summary. For more
information, see “Adding performance objects for monitoring” (page 55).
• Configure dashboard threshold settings for the storage system and view live performance
data. Drill down to view performance of the corresponding controllers and host ports. For
more information, see “Configuring dashboard settings” (page 62) and “Viewing the
Dashboard Overview” (page 90).
Configuring HP P6000 Performance Advisor 11
Page 12

• Add and monitor performance objects and counters that you consider as KPIs for a storage
system. For more information, see “Adding KPI records” (page 100) and “Key Performance
Indicators – Dashboard” (page 97).
• Add performance objects and counters and generate reports for a storage system. For more
information, see , “Reports history” (page 122) and “Creating a report template” (page 123).
12 Getting started
Page 13
3 SPoG interface and common tasks
This chapter describes the SPoG interface and common tasks you can perform using HP P6000
Performance Advisor.
Understanding the SPoG interface
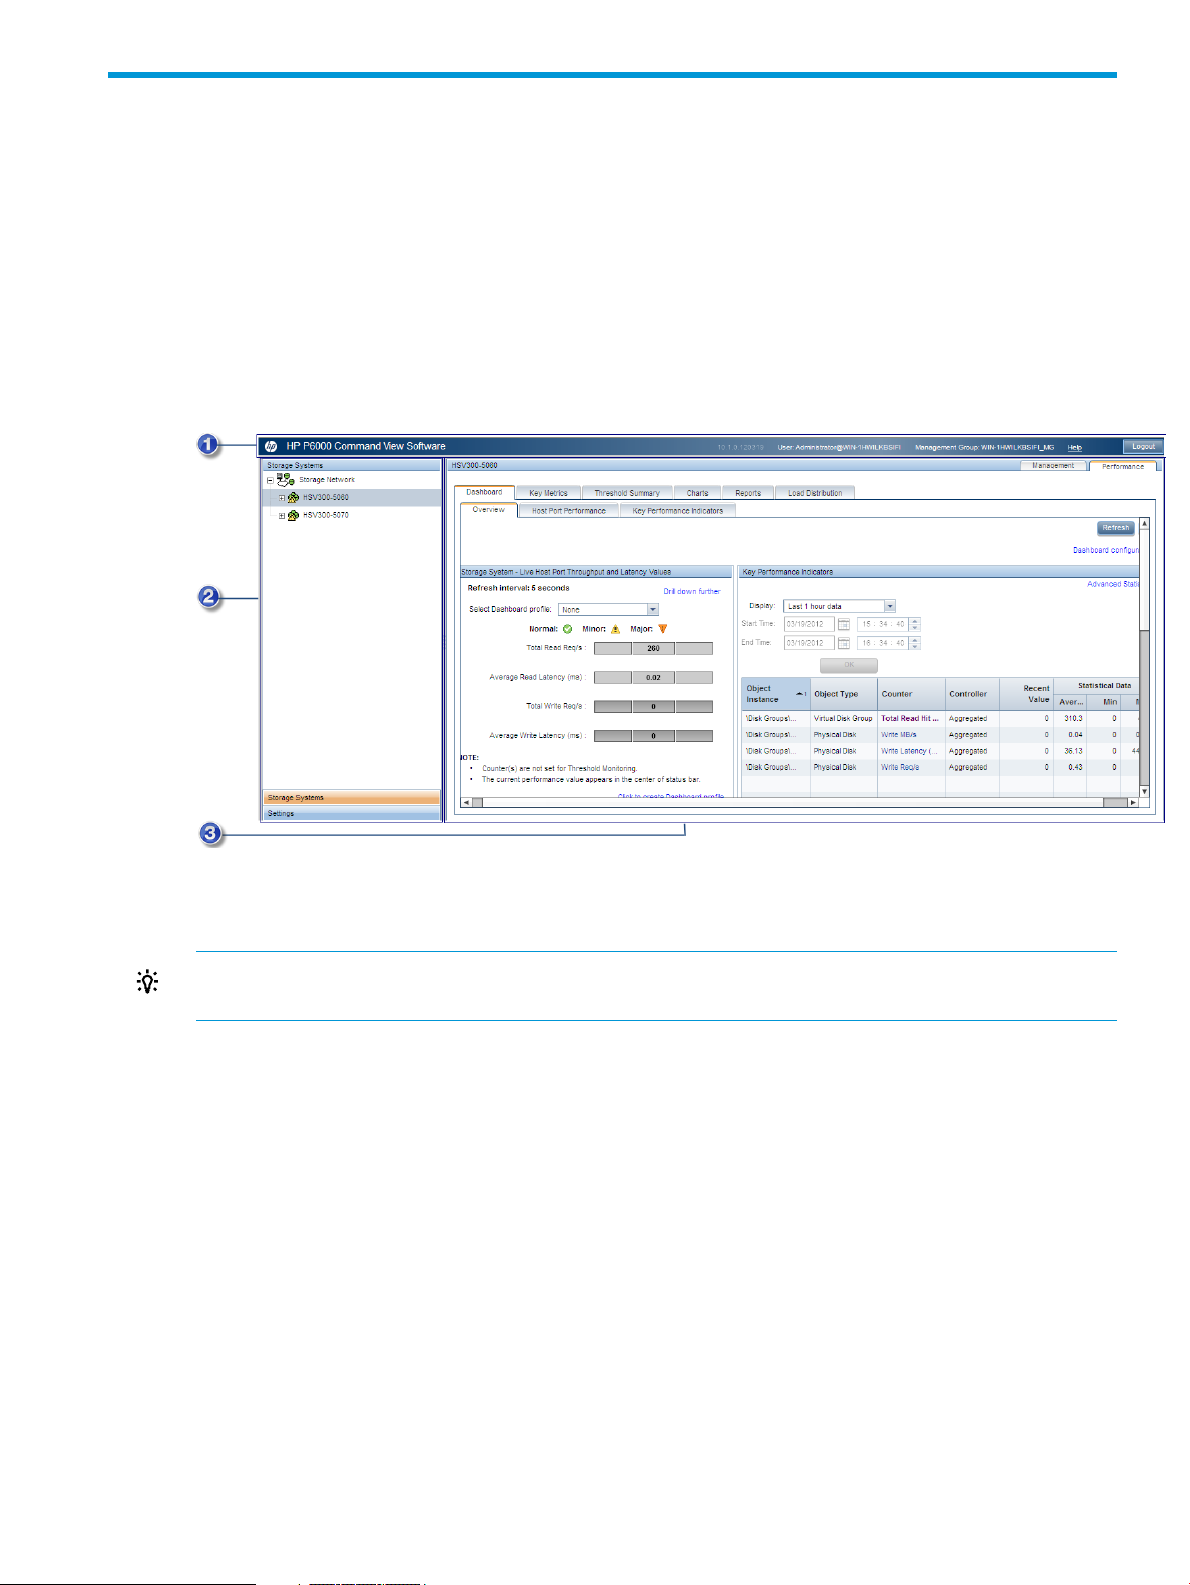
The SPoG interface includes three panes:
• Session pane
• Navigation pane
• Content pane
3. Content pane2. Navigation pane1. Session pane
TIP: For best viewing of the HP P6000 Performance Advisor panes, set your monitor screen
resolution to 1024 X 768 pixels (minimum) or higher.
Session pane
The Session pane displays:
• User (name@hostname). Logged-in user and the HP P6000 Performance Advisor server
(hostname) that is being accessed.
Example: Administrator@serverhost
• Management Group (management group name). Management Group to which the HP P6000
Performance Advisor server belongs.
Example: MG_1
• Help. Displays the HP P6000 Command View online help suite, which includes the online
help for HP P6000 Performance Advisor.
• Refresh. Click to view the latest data.
• Logout. Click to end the current session.
Understanding the SPoG interface 13
Page 14
Navigation pane
The Navigation pane displays:
• Settings point of view. Displays all instances of HP P6000 Command View and HP P6000
Performance Advisor that belong to the same Management Group. You can configure
monitoring, database, and event notification related settings for HP P6000 Performance
Advisor.
• Storage Systems point of view. Displays the storage systems managed by all HP P6000
Command View instances in the Management Group. You can view the performance summary
for storage systems monitored by HP P6000 Performance Advisor instances in the same
Management Group. For each storage system, you can view a performance summary for an
object type, which includes the summary of performance of all corresponding monitored
objects. You can also view the performance summary of each supported object in a storage
system.
Click the plus (+) or minus (–) sign for a storage system to expand or collapse its component
tree. All performance objects in a storage system are displayed in the component tree and
are grouped in folders according to object type.
Content pane
The Content pane displays information and actions that you can perform on the storage system or
performance object selected in the Navigation pane. The displayed aspect tabs depend on your
configuration. They display organized content based on your HP storage applications. For example,
the Management aspect tab includes content from the HP P6000 Command View application and
the Performance tab includes content from the HP P6000 Performance Advisor application. For
more information about the Management tab, see the HP P6000 Command View User Guide.
To access help, click ? on a feature page on the Performance tab to open a corresponding help
page.
HP P6000 Performance Advisor defined default value example
HP P6000 Performance Advisor provides default settings that you can use:
User defined value example
You can specify default configurations to be used by HP P6000 Performance Advisor:
14 SPoG interface and common tasks
Page 15

Interactive assistance example
HP P6000 Performance Advisor provides appropriate assistance:
HP P6000 Performance Advisor common tasks
This section describes common tasks you can perform with HP P6000 Performance Advisor, such
as restoring defaults and using the Display option and Filter by list to view data.
Using the Restore Defaults option
To restore factory-default settings for charts, key metrics, reports, and email and SNMP notifications:
1. Click Restore Defaults.
2. When prompted, click OK.
The default settings are restored.
3. Click Save Changes.
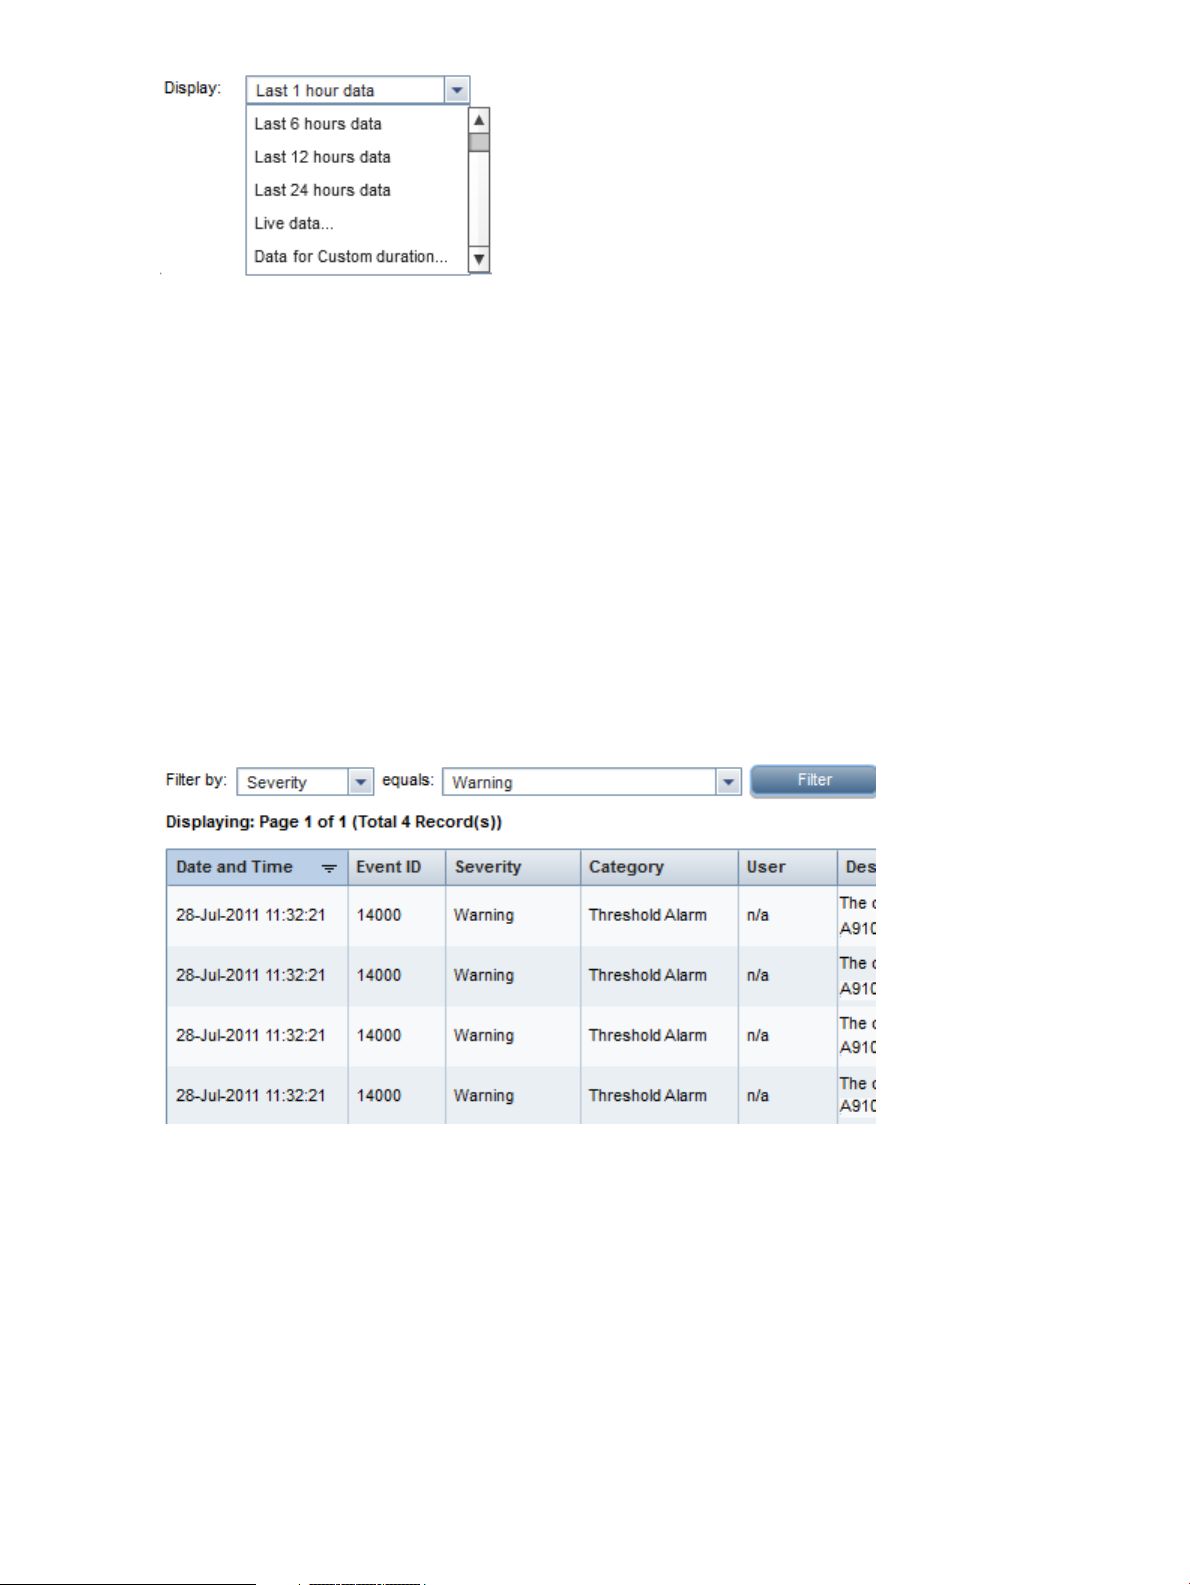
Using the Display option
You can view performance data collected over specified intervals based on the HP P6000
Performance Advisor management server date and time:
• Last 1 hour data (default)
• Last 6 hours data
• Last 12 hours data
• Last 24 hours data
• Data for Custom duration (specified date and time)
The polling interval to fetch data for the predefined or custom duration will be per the specified
performance and state data collection frequency for a storage system.
Additionally, Live data is another option in the Display list when you view live performance data
samples of storage systems and performance objects, such as key metric charts. You can view live
data based on the polling interval and duration that you configure while plotting live data charts.
Predefined interval
Select the duration from the Display list. If you select the Data for Custom duration option, specify
the start and end duration, and click OK. By default, the End Time shows the current server date
and time, and the Start Time shows exactly 1 hour prior to the end time. An error occurs if the
selected End Time is later than the deployment server date and time.
HP P6000 Performance Advisor common tasks 15
Page 16
The Data for Custom duration option displays data for any 24-hour duration when plotting charts,
generating reports, viewing key metrics summary and dashboard data, or exporting data for a
storage system. However, only data for the last 24 hours is displayed when viewing threshold
summary.
Live duration
To view live performance data, select the Live data option from the Display list.
Using the Filter by list
To shorten a long list of records in a table:
1. Select the option in the Filter by list and enter or choose the equals criterion based on your
selection in the Filter by list.
2. Click Filter.
Example
In the following example, event records are filtered based on a Severity of Warning.
Click Reset to restore all the records and clear the filters selected.
Additional tasks
Sorting records
To sort records in a table, click a column title. In the following image, the records are sorted in
descending order based on the State Monitoring Enabled column.
16 SPoG interface and common tasks
Page 17

Records are sorted based on the type of information (alphabetical, numerical, or date). For example,
the Physical Disk Name column sorts alphabetically first, then numerically.
Resizing column width
To resize the width of a column, use your pointing device to drag a column separator to the desired
width.
Selecting all records in a table
To select all records in a table, select the check box adjacent to the first column title in the table.
Using the Refresh option
To manually refresh data, click Refresh in the top right corner of the Content pane.
The browser-level refresh function does not refresh the data. You must use the Refresh button on
the HP P6000 Performance Advisor pages.
HP P6000 Performance Advisor common tasks 17
Page 18

4 HP P6000 Performance Advisor concepts
This chapter explains HP P6000 Performance Advisor concepts, including key metrics, KPIs, charts,
reports, database maintenance, and threshold monitoring.
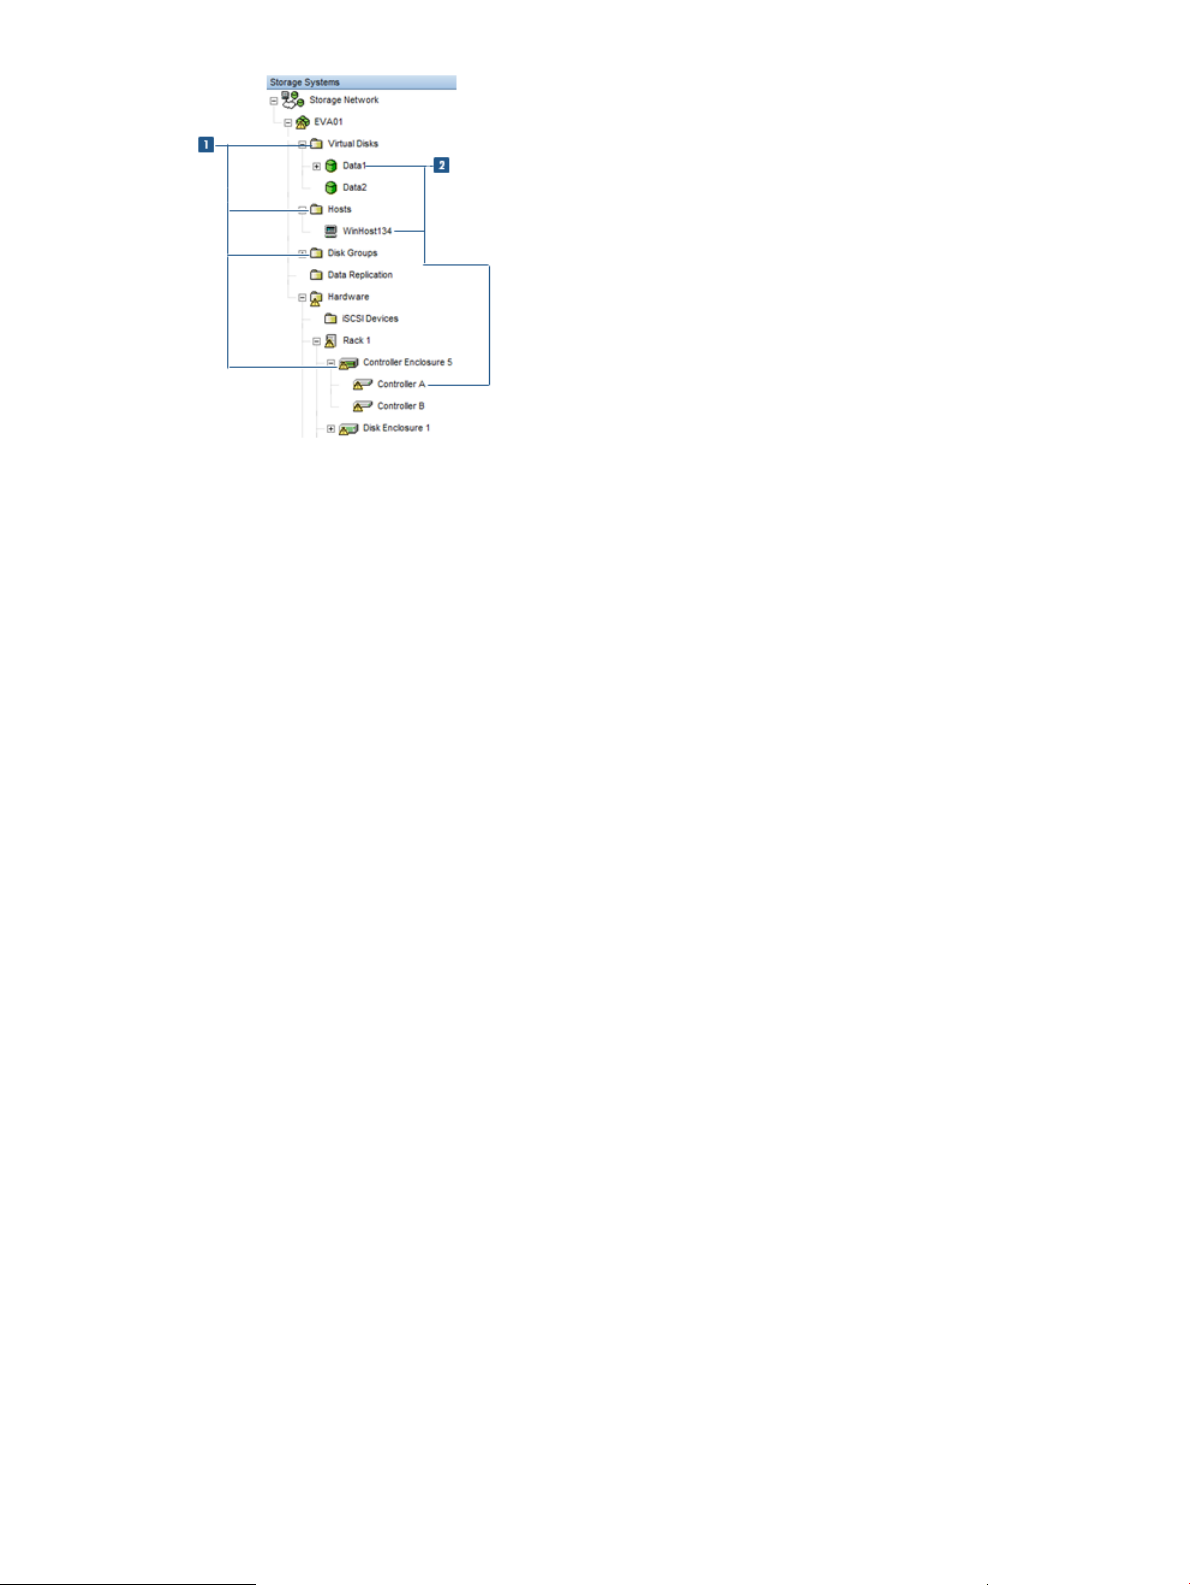
Object type folders and Storage object nodes
HP P6000 Performance Advisor displays data at two levels:
• Object type (parent) folder node. Includes the corresponding storage object type nodes. At
this level, you can view summary of data relevant to the corresponding storage objects. You
can identify the storage object that has the highest or lowest performance data using the
sorting functionality, click the hyperlink to navigate directly to the storage object page and
view the detailed data. Only the monitored objects are listed. Storage System, Controller and
Host Ports are added for monitoring by default.
Object type data is not available for storage systems and physical disks.
The following summaries are available for each object type in HP P6000 Performance Advisor:
◦ Key metrics summary. Provides the historical statistical data of all storage objects for
selected counters predefined by HP P6000 Performance Advisor.
A hyperlink for each storage object helps you navigate to its key metric page.
◦ Threshold summary. Provides the threshold summary of all threshold enabled storage
objects that are monitored. A hyperlink for each storage object helps you navigate to its
threshold summary page.
◦ Charts. Allows you to add charts to view the performance of all the corresponding storage
objects for various counters. For example, at the Data Replication object type, you can
only plot charts for data replication group or data replication tunnel storage objects.
• Storage (child) object node. View performance data for each storage object monitored in HP
P6000 Performance Advisor. Each storage object belongs to a container object.
A storage system is considered an object node, not a container object. You can view dashboard
data and generate reports in HP P6000 Performance Advisor. You can view data corresponding
to all monitored storage objects in the storage system in various ways, such as charts, KPIs.
Storage objects can belong to different object type folder nodes.
◦ Folders created under Virtual Disk and Hosts folder are user created folders and are not
considered as an object type folder or a storage object node.
◦ Data replication tunnel data is available at Data Replication folder node and storage
system level only.
The object type folder node and storage object node are referred as object type and performance
object respectively in HP P6000 Performance Advisor. In the Navigation pane, they are referred
to as object type folders and object folders, respectively. Similarly, the term object type refers to
root node or folder in HP P6000 Command View.
18 HP P6000 Performance Advisor concepts
Page 19
States for storage objects in HP P6000 Performance Advisor
The storage objects in HP P6000 Performance Advisor can belong to one of the following states:
• Monitored. Storage object is actively monitored by HP P6000 Performance Advisor and
performance data for the object is available for you to view.
• Not Monitored. Storage object is not being monitored for performance data. In this case, the
object must be added for monitoring in HP P6000 Performance Advisor.
• Cannot be Monitored. Storage object is not supported for monitoring in HP P6000 Performance
Advisor. This state is valid for ungrouped disks and hardware objects, such as disk enclosures,
disk drives, and racks.
Dashboard
Dashboard provides a quick view of the overall performance of a storage system and includes the
live bar-chart and historical throughput and latency values of the storage system. The Major and
Minor threshold vales are taken from the selected dashboard profile. If no dashboard profile is
selected, the threshold values will not be displayed. These threshold values are the reference points
for the live data samples and help you analyze the total I/Os processed in per unit time and
duration taken to complete each request (latency). New dashboard profiles can be created by
using the Click to create Dashboard profile. Dashboard configuration can also be changed by
clicking the Dashboard configuration link.
In addition, the following data is also included as part of the dashboard data:
2 Storage object nodes1 Object type folder nodes
• Storage system related charts for the selected duration, includes the Threshold Summary chart,
Host Port IOPS Historical chart, and Host Port IO Latencies chart.
The Threshold Summary chart provides the overall threshold summary of threshold monitored
objects. It includes a summary of the current total threshold-monitored objects for every object
type.
• Key Performance Indicators, includes historical performance chart along with statistical data.
The live bar-chart is constantly refreshed at five-second intervals in Dashboard. You can drill down
to each controller and host port performance data to view live bar-chart and historical data for
controllers and host ports associated with the storage system, and determine which component is
under the maximum load. While displaying controller level data, minor and major throughput
values are automatically considered half of what is set for the storage system. For more information,
see “Viewing the Dashboard Overview” (page 90).
Dashboard 19
Page 20

KPIs
The Key Performance Indicators (KPI) functionality helps you view historical data of performance
objects for counters that you consider important. The KPI data is available as charts and statistical
data, and always included in the dashboard summary displayed for a storage system. The statistical
table displays basic statistics (Minimum, Maximum, Average) and the recent performance value.
Also, advanced statistical data is available, which includes the Standard Deviation, 90th, 95th,
and 99th percentile in addition to the basic statistics. It is required that you identify KPIs for your
storage system if you regularly monitor the performance of corresponding sets of objects for specific
counters. You can configure a KPI record for each combination of performance object and counter
that you want to monitor. For example, if you have virtual disks, Data 1 and Data 2, configured
for a critical application and you want to monitor their throughput along both the controllers CPU%
in your storage system, you may like to configure them in Key Performance Indicator.
If a performance object configured as part of a KPI record is deleted in HP P6000 Command View,
the performance data collected until the time of deletion is still displayed. The recent value in the
statistical table still shows the most recent value available before the performance object was
deleted.
On the Dashboard Overview page, click the Advanced link to go to the Key Performance Indicator
tab and view additional statistical data like Standard Deviation, Percentiles values. For more
information, see “Key Performance Indicators – Dashboard” (page 97).
Key Metrics
Key Metrics helps you view performance data for storage systems and objects for the supported
counters (key counters) defined by HP P6000 Performance Advisor. To know the supported key
metric counters, see “Supported counters” (page 167).
HP P6000 Performance Advisor provides key metric data for every monitored storage system and
performance object in the form of:
• Key metric charts
• Key metric statistical table
You can also view key metrics summary of all monitored performance objects for an object type,
where the historical statistical data of those objects is displayed for the key counters. At this level,
you can sort performance objects based on their performance data to identify highest and least
utilized objects. For example, you can sort key metrics summary for the Virtual Disks object type
to view the top ten performing virtual disks. Additionally, you can filter records to view only the
required performance objects. You can drill down from the object type to view key metric data for
the specific performance objects in that object type. The key metric data acts as key indicator and
enables you to take a quick look at performance data of objects, based on which you can plot
charts and generate reports to view specific details of the object's performance.
20 HP P6000 Performance Advisor concepts
Page 21

IMPORTANT: In addition to Key Metrics, the following is also applicable for KPI, charts, and
reports:
• The throughput (Req/s) or data transfer rate (MB/s), queue depth, busies counters are
considered as sum of both the controllers value, if the Aggregated option is selected for objects
that provide performance data specific to a controller, such as the virtual disks, host connections,
virtual disk groups, physical disk groups, data replication groups, and physical disks.
For example: Total Read Req/s at aggregated controller level = Read Hit Req/s of Controller
A + Read Miss Req/s of Controller A + Read Hit Req/s of Controller B + Read Miss Req/s of
Controller B.
• The latency counters are weighted average with number of I/O requests of the same counter.
For example: Average Read Latency at aggregated controller level = (Read Hit Requests of
Controller A) * (Read Hit Latency of Controller A) + (Read Hit Requests of Controller B) * (Read
Hit Latency of Controller B) + (Read Miss Requests of Controller A) * (Read Miss Latency of
Controller A) + (Read Miss Requests of Controller B) * (Read Miss Latency of Controller B) /
(Read Hit Requests of Controller A + Read Hit Requests of Controller B + Read Miss Requests
of Controller A + Read Miss Requests of Controller B)
• Average IO Size is derived from the data rate divided by the number of I/O requests
(considering that 1MB = 1,000,000 bytes).
• Read hit percent of virtual disks is calculated based on the total number of I/O requests
(succeeded and missed).
Key metric charts
A key metric chart can display either:
• Historical performance data samples for a predefined or custom duration
• Live performance data samples for a specified polling interval and duration
By default, a key metric chart displays performance data samples for the duration (default - last
hour data) that you initially configured under the Key Metrics tab (Settings > HP P6000 Performance
Advisor Instance > Configuration). For more information, see “Key Metric settings” (page 65). You
can configure key metric settings in a chart window to specifically view key metric data for another
predefined interval, custom, or live duration. Additionally, you can:
• View data at a specific controller level for a performance object.
For a storage system, data is always considered at an aggregated level. Similarly, if a
performance object is associated with both the controllers, the data aggregated across both
the controllers is considered by default.
• View data for a specific key metric counter (if multiple counters are considered in a category).
• View minor and major threshold lines in both live and historical key metric charts.
• View moving average lines if you plot live data samples.
The threshold lines and moving average lines appear as specific color coded lines identified by
appropriate legends in the chart window. They are supported for only one combination of
performance object, controller, and key metric counter and not displayed by default. Click Edit in
the key metric chart window to modify the key metric settings. For more information, “Editing key
metric chart settings” (page 113).
If a storage system or performance object is deleted in HP P6000 Command View, the performance
data collected until the time of deletion is still displayed in the historical charts and statistical table.
The recent value in the statistical table still shows the most recent value available before the storage
system or performance object was deleted. However, the live data samples are not available.
Key Metrics 21
Page 22

Charts
Key metric statistical table
The key metric statistical table displays basic (default) and advanced performance statistics based
on historical data. To view advanced statistics, select Advanced from the View type list. For more
information about, see “Statistical data” (page 30).
The data is displayed for the predefined interval (default - last hour data) that you initially configured
under the Key Metrics tab (Settings > HP P6000 Performance Advisor Instance > Configuration).
You can choose to view data for a different predefined interval or custom duration by selecting
the appropriate option from the Display list. The duration for viewing statistical data is always
independent of the duration for plotting the key metric charts, and the vice versa is also applicable.
For more information on viewing the key metric chart or statistical data for a different duration,
see “Using the Display option” (page 15).
For more information on viewing key metrics, see “Viewing a summary of key metrics” (page 108).
The Charts functionality provides live and historical data for the performance objects and counters
that you select. The following is a list of performance objects:
• Storage System
• Controller
• Data Replication Tunnel
• Host Connections
• Host Ports
• Data Replication Group
• Physical Disks
• Physical Disk Group
• Virtual Disks
• Virtual Disk Group
The counters can belong to one of the following categories:
• General: Corresponds to counters having value in numbers without units; for example, queue
depth, number of retries, and so on.
• Percentage (%): Corresponds to counters having value in percentage; for example, CPU
percentage and data percentage.
• Throughput (Req/s): Number of jobs (usually I/O requests) completed per unit time (usually
per second).
• Data Transfer Rate (MB/s): Quantity of data being transferred between two systems per unit
time; for example, KB/s, MB/s, and GB/h.
• Latencies (ms): Time required to complete a job (I/O request).
• Data Transfer Size (KB): Size of data being transferred between two systems per unit time;
for example, KB, MB, and GB.
The following table lists the categories supported for the different object types:
22 HP P6000 Performance Advisor concepts
Page 23

Table 1 Charts – Performance objects and categories
Performance
objects
Category
Replication
Tunnel
Connection
Replication
Group
Group
Group
Percentage (%)General
Throughput
(Req/s)
Rate (MB/s)
Latencies (ms)Data Transfer
Data Transfer
Size (KB)
NoYesYesYesNoYesStorage System
NoYesNoYesYesYesController
NoYesYesYesNoYesData
NoNoNoNoNoYesHost
YesYesYesYesYesYesHost Port
NoNoYesYesYesYesData
NoYesYesYesNoYesPhysical Disk
NoYesYesYesNoYesPhysical Disk
YesYesYesYesYesNoVirtual Disk
YesYesYesYesYesNoVirtual Disk
You can view charts for a storage system, object type, and performance object, and for only one
category at a time. The performance data in historical charts is displayed for the duration that you
select (6 hours, 12 hours, 24 hours, or custom date and time). The performance data in live charts
is based on the polling interval and duration that you select. The polling interval indicates the
frequency at which HP P6000 Performance Advisor must retrieve performance data from the storage
system. The duration indicates the time for which the performance data is displayed in a live chart
at any given point of time. For example, if the duration is selected as 10 minutes, the data points
are plotted and the chart is visible for the first 10 minutes of the time line. When a new data point
is plotted beyond 10 minutes, the chart created during the first minute is dropped.
In addition, you can view the moving average lines for data points plotted in live charts. Also, you
can view minor and major threshold levels for one combination of performance object and counter.
An additional legend for granularity that is provided in the panel indicates the type of data points
plotted in the chart.
Polling Interval Indicates that the data points are the actual data collected.
Hourly Average Indicates that the data points are average of that hour's data.
Daily Average Indicates that the data points are average of that day's data.
Live Indicates that the data points are collected in real time.
For more information, see “Adding charts” (page 119) and “Viewing charts” (page 114).
If a performance object is deleted in HP P6000 Command View, the performance data collected
up to the time of the deletion is still displayed in the historical charts. However, the live data samples
are not available.
Reports
Reports provide a high-level performance summary of objects across various object types in a
storage system. P6000 Performance Advisor enables you to create a report template and generate
Reports 23
Page 24

a report using that template. These templates are termed as user-defined report templates. You can
also generate a report using the predefined report templates that come bundled with the P6000
Performance Advisor.
• User-defined Reports. You can generate the report in PDF and CSV formats. The reports contain
historical data for the selected performance objects. In CSV format, raw historical performance
data is captured in the report. In PDF format, historical performance data is plotted as charts.
Performance data in either format is based on the granularity selected (number of data points
considered).
Optionally, you can have statistical data if PDF is chosen as the file format. The statistical
data in a report contains minimum, maximum, average, standard deviation, 90th, 95th, and
99th percentile values. The statistical data is based on performance data collected at the
specified polling interval.
• Predefined Reports. You can create predefined reports from a fixed report template that is
bundled in the P6000 Performance Advisor application. These templates cannot be edited.
Predefined report templates for commonly used reports enable you to create these reports with
less effort and can be used for analyzing EVA Performance Metrics.
The granularity can be one of the following:
Daily Average Displays an aggregate of all data points collected during a day.
Hourly Average Displays an aggregate of all data points collected during an hour.
Polling Interval Displays the collected data points based on the frequency of collection,
which is specified while configuring monitoring settings for the storage
system. All data points plotted after the specified interval are displayed
if polling interval is selected as the granularity type. For example, if you
select a frequency of 30 seconds, data points collected after every 30
seconds are plotted and displayed in the report.
Data points are based on the aggregate of performance data collected across controllers. To
understand how the aggregated values are calculated, refer the first two list items in the important
note provided for Key Metrics (see “Key Metrics” (page 20)). For polling interval granularity, the
duration cannot be more than 24 hours for creating a report.
For more information, see “Viewing and managing reports” (page 121).
Load Distribution
Load distribution enables you to identify if the load across the host ports and controllers is well
balanced.
Load distribution can be classified as follows:
• Load distribution across controllers
• Load distribution across host ports
Load distribution across controllers
Load distribution across controllers provide information about the resource usage of both controllers.
It enables you to identify whether the load across both the controllers is well distributed. The load
data comprises of the following type of metrics:
• “Live Data Metrics” (page 25)
• “Historical Data Metrics” (page 25)
24 HP P6000 Performance Advisor concepts
Page 25

Live Data Metrics
The Live Data Metrics are taken from the latest sample and include the following:
• Online Virtual Disks Distribution
For a particular controller, this calculated metric records the number of virtual disks that satisfy
the following criteria:
◦ The virtual disk is owned by this controller
◦ The virtual disk is presented to at least one host
◦ The virtual disk is not presented to any host but part of a Data Replication Group
Figure 1 Online virtual disks distribution for storage system
Historical Data Metrics
The Historical Data Metrics enable you to select the time duration and view the performance data
collected within that time duration. Apart from the default time duration of 1, 6, 12, or 24 hours,
you can also retrieve information for any custom duration of 24 hours.
The historical data metrics include the following:
• Total Req/s
For each controller, this metric records the total I/O requests received by this controller during
the current sample interval. It includes all read requests regardless of whether they resulted in
a cache hit or a cache miss, and all write requests. It also includes data writes caused by
transfers from a source DRM system to this system for data replication.
• Total MB/s
For each Controller, this calculated counter records the sum of total data rate on each virtual
disk, owned by this controller during the current sample interval. This includes all the read
requests (includes I/O from hosts and data reads caused by a DRM initial copy to a remote
CA system regardless of whether they resulted in a cache-hit or a cache miss) and all the write
Load Distribution 25
Page 26

requests (includes I/O from hosts and transfers from a source DRM system to this system for
data replication).
• Read Req/s through Proxy Controller v/s Owning Controller
For each controller, the calculated metric Proxy Read Req/s records the total number of read
requests it receives for all virtual disks owned by the other controller.
For each controller, the calculated metric Direct Read Req/s records the total number of read
requests it receives for all virtual disks owned by the this controller.
• CPU %
The percentage of time that the central processing unit on the controller is active. A completely
idle controller shows 0%. A controller saturated with activity shows 100%.
NOTE: If you hover the cursor over the pie, line, or bar charts, the corresponding data values
will be displayed.
26 HP P6000 Performance Advisor concepts
Page 27

Load distribution across host ports
Load distribution across host ports provide information about the usage of all the host ports belonging
to both controllers. It enables you to identify whether the I/O load across all the host ports are well
distributed.
You can select either Controller 1, Controller 2, or Controller 1 and Controller 2 and the time
duration for which you want to view the load distribution. Each controller can have a maximum
of four host ports and the load distribution data displayed is based on the selected option. The
default option is Controller 1. Apart from the default time duration of 1, 6, 12, or 24 hours, you
can also retrieve information for any custom duration within 24 hours.
The host port metrics includes the following:
• Total Req/s
For each host port on each controller, this calculated metric records the total number of requests
(Read and Write) received during the selected sample interval.
• Total MB/s
For each host port on each controller, this calculated metric records the total data rate (read
data rate and write data rate) during the selected sample interval.
NOTE: The data displayed for both the metrics is historical.
Based on the number of host ports present in a controller, the line and pie charts are displayed.
• Line Chart: Displays the trend of the data within the selected time interval.
• Pie Chart: Displays a comparative view of the load across all host ports for the same time
interval.
Load Distribution 27
Page 28

NOTE:
• If you hover the cursor over the line or pie charts, the corresponding data values will be
displayed.
• An additional legend for granularity that is provided in the panel indicates the type of data
points plotted in the chart.
Polling Interval Indicates that the data points are the actual data collected.
Hourly Average Indicates that the data points are average of that hour's data.
Daily Average Indicates that the data points are average of that day's data.
Live Indicates that the data points are collected in real time.
Performance and state data
HP P6000 Performance Advisor collects performance and state data for all storage systems and
corresponding performance objects that it monitors. When adding a storage system for monitoring,
you configure the performance and state data collection polling intervals which determine the data
collected for the storage system and corresponding performance objects. The performance data
is provided by the HP P6000 Performance Data Collector instance, and state data is provided by
the HP P6000 Command View instance, which collects performance information and manages
the storage system respectively.
Performance data
The performance data collected for storage systems and objects for various supported counters, is
maintained as historical data in HP P6000 Performance Advisor. You can view this data in chart
and statistical table format. The statistical data comprises the basic and advanced statistics. You
can also generate reports, set threshold levels (minor and major) for storage systems and
performance objects for supported counters, and view their threshold summary. For more information,
see “Statistical data” (page 30).
In addition to historical data, you can view the live performance data samples for all storage
systems and corresponding performance objects that HP P6000 Performance Advisor monitors.
The live data is directly collected and displayed in charts for the selected storage system or
performance object. The live data collection is based on the polling interval and duration that you
configure. The polling interval signifies the duration after which a new data point must be plotted
in the chart. The duration signifies the period for which the live data points should be visible in the
chart.
When a storage system or performance object is deleted in HP P6000 Command View, the live
data sample is not displayed. However, you can still view the corresponding historical performance
data collected up to the date for that storage system or performance object. The historical data is
retained until the configured retention period (default 3 months) is complete, after which the data
is permanently deleted.
Data retention period
Data retention period constitutes the duration for which performance data for a storage system
and its objects is retained in HP P6000 Performance Advisor. You provide the data retention period
when configuring performance and state data collection intervals for a storage system. Once the
data retention period is reached, HP P6000 Performance Advisor triggers an auto purge for that
storage system and data is permanently purged. The retention period is based on the HP P6000
Performance Advisor management station date and time.
IMPORTANT: The performance data purge is scheduled for the 1st, 8th, 15th, and 22nd of each
month at 3:30 am.
28 HP P6000 Performance Advisor concepts
Page 29

For example, if you entered the data retention period as one month on March 31, the data for
March 31 is available only till May 1. On May 1 at 3:30 am, the data for March 31 is
automatically purged. A maximum of 12 months and a minimum of 1 month can be configured.
3 months is the default retention time in HP P6000 Performance Advisor.
State data
State data refers to the management information about an object collected from HP P6000
Command View for the current operational state of the object. For example, virtual disk state data
includes write mode of the virtual disk. Monitoring the state data of an object allows HP P6000
Performance Advisor to track changes to the object state that can impact performance of the object.
By monitoring state data, you can correlate changes in performance of the object with its
corresponding state changes. It will additionally ensure that information about the object state
available in HP P6000 Performance Advisor is synchronized with the actual state in HP P6000
Command View.
If state data monitoring is enabled for an object, HP P6000 Performance Advisor periodically
updates the object state using the latest information from HP P6000 Command View. It is based
on the frequency you configure while adding a storage system for monitoring or editing the
configured settings of an existing storage system. By default, state data collection is enabled for
all performance objects that you add for monitoring. Unlike performance data, state data collection
requires that the HP P6000 Command View instance managing the storage system be part of the
same Management Group where HP P6000 Performance Advisor resides.
You have the option of disabling state data collection for performance objects with the exception
of storage system, controller, and host ports, for which state data collection cannot be disabled.
You can update the state data manually for all performance objects using the Update Object Status
option (Settings→HP P6000 Performance Advisor instance→Configuration). This action updates
the state of all the performance objects for the selected storage system, irrespective of whether they
are enabled for state data collection. During the process, the state of all the performance objects
is synchronized with their current state in HP P6000 Command View. This is particularly useful
when you have made configuration changes to a storage system or enabled a performance object
for state data monitoring, and want those changes to reflect in HP P6000 Performance Advisor
immediately rather than the next polling cycle. For example, if the state data collection polling
interval is configured as 30 minutes and you cannot wait for that duration, manually update the
state data. For more information on the Update Object Status option, see “Updating the object
state for a storage system” (page 78).
Historical state data is not maintained in HP P6000 Performance Advisor. Only the latest state
data is available. State changes to a performance object in HP P6000 Performance Advisor are
not notified through SMTP or SNMP notifications, they are only logged in the Event Log page. The
duration required to complete the synchronization depends on the number of performance objects
monitored in the selected storage system. It also depends on the current host workload. During the
state data synchronization, the existing performance data collection is not paused or impacted.
Polling intervals
HP recommends to choose longer performance data collection polling interval for large configuration
storage systems. It ensures better response from the storage system and also less database growth
rate in HP P6000 Performance Advisor. However, choosing longer polling intervals can result in
loss of granularity of performance data.
Performance and state data 29
Page 30

Following is an approximate database growth rate for different polling intervals and number of
performance objects based on the tests conducted in the HP lab environment:
For more information on configuring performance and state data collection polling intervals, see
“Adding performance objects for monitoring” (page 55).
Statistical data
The statistical data shown in HP P6000 Performance Advisor is based on historical data and
includes the basic and advanced statistics. You can view statistical data for storage systems and
performance objects for a predefined or custom duration. By default, the basic statistical data is
displayed based on data collected in the last hour.
IMPORTANT:
• When performance data is viewed as an aggregate of both controllers, the statistical values
(Standard Deviation, minimum, maximum, average, and percentile) are based on the same
aggregate. It means that both the controllers data is aggregated and then the statistical values
are derived from those aggregated values.
Approx database growth rateNumber of objectsPolling interval
6 GB/month20030 Seconds
40 GB/month200045 Seconds
41 GB /month409690 Seconds
• Average of a counter (example, percentage or transfer size) for a duration is derived from all
the values. For example: Average of Read Percent is calculated based on the (sum of Read
IOPS of all the performance samples) * 100/(sum of read and write of all the performance
samples) for a specified duration.
Basic statistics
Basic statistical data includes the following:
• The minimum value sample collected during the selected duration
• The maximum value sample collected during the selected duration
• The average value sample collected during the selected duration
Advanced statistics
Advanced statistical data includes the basic statistical data and also the following:
• Standard Deviation.
Standard deviation is a statistical measure of variability and considered as the root mean
square deviation of the values from their arithmetic mean. A low standard deviation indicates
that the data points are closer to the mean value. A high standard deviation indicates that the
data points are spread over a large range of values. For example, high standard deviation
for any Throughput (Req/s) counter indicates that the host did not receive uniform I/O requests
for the selected duration.
• 90th, 95th, and 99th percentile value samples for the selected duration.
A percentile is a value on a scale of 100 that indicates the percent of distribution equal to the
percentile value. For each data series, the 90th, 95th, and 99th percentile are computed to
ignore the data points in top 10%, 5% or 1% of the utilization peaks. Then, the value is
rounded off to the nearest data sample, so that infrequent peaks are ignored. Such estimates
can help maximize utilization of your systems to ensure only the required storage performance
capacity.
30 HP P6000 Performance Advisor concepts
Page 31

In addition, the statistical data includes the recent value, which is the most recent data sample
collected. If you choose to no longer monitor a performance or stop data collection, the recent
value continues to show the last data sample collected for that object in HP P6000 Performance
Advisor. When you select aggregated controller, the throughput and data transfers are sum of
both the controllers value and the latency is the weighted average with throughput value of both
the controllers.
Database maintenance
In HP P6000 Performance Advisor, you can perform various database maintenance activities to
free up disk space when required, such as export, purge, and backup and restore data.
Data export
The export activity enables you to copy historical data pertaining to a monitored storage system
into a CSV file. You can specify the duration for which the data should be exported, based on
which data for the current set of monitored performance objects is exported. The export activity
depends on the number of performance objects and the export duration that you select. More the
number of objects and longer the export duration, more time will be needed for the export activity
to complete.
You can initiate the export activity only for a storage system and not for performance objects. Also,
only one export activity can be in progress at a given point in time. Though you can execute
multiple export activities for storage systems, the export tasks are executed one after the other.
Those yet to be processed are in the 'Pending' state and the ones that are executed successfully
are moved to the 'Completed' state. If an export activity fails, the next in the queue is considered.
The duration taken for an export activity to complete depends on the current set of monitored
performance objects and the corresponding data for the specified duration. The exported data
contains both performance and state data for the corresponding monitored performance objects.
If you want the latest state data for a performance object to be exported, click Update Object Status
to manually update the state data or wait for HP P6000 Performance Advisor to automatically
update state of all performance objects based on the state data collection frequency configured
while adding a storage system or editing the configured settings for the storage system.
The format of the exported data in evaperf all output is similar to the output generated by the
following HP P6000 Performance Data Collector command:
evaperf all -sz <node-wwn> -csv ts2 –fo <filename> -cont <polling
interval configured for perf data collection>
The exported data can be formatted using the TLViz Formatter and then viewed using the TLViz
tool. For more information, see the HP Command View EVAPerf TLViz formatter section in the HP
P6000 Command View User Guide.
The exported data will not contain any port statistics data, as the port statistics is not collected by
HP P6000 Performance Advisor. Additionally, while formatting the CSV using the TLViz Formatter,
you may see the following message at the end of formatting of the data: Input data for
following performance objects is missing: Loops. Output files for these
objects may not have valid data.
CAUTION: When the export activity for a storage system is in progress, if you remove the storage
system itself from monitoring, the export activity fails. However, if you remove one of its
corresponding performance objects from monitoring, the export activity completes. Data pertaining
to that performance object up to the time it was removed from monitoring is exported. However,
if the performance object was removed from monitoring before the export started, the data for that
object is not exported.
Database maintenance 31
Page 32

Performance data purge
The purge activity enables you to delete data permanently from HP P6000 Performance Advisor.
You can choose to purge data for a storage system or performance object, or all performance
objects for an object type. The purge can be initiated only on the current set of monitored
performance objects. It can fail if you simultaneously remove a performance object from monitoring
for which you initiated purge. For example, if a performance object is removed from monitoring
for which you want to initiate a purge, the corresponding data for that object would have already
been automatically deleted from HP P6000 Performance Advisor.
The two methods of purging data follow:
• Manual purge. Select the storage system, performance object, or object type for which data
should be deleted. If you choose a storage system, you have the option of purging data for
all the corresponding performance objects. You can purge data stored for a maximum of last
12 months from the current month and year.
• Auto purge. HP P6000 Performance Advisor automatically purges performance data for a
monitored storage system once the retention period is complete. Data pertaining to the current
set of monitored performance objects is deleted. The retention period that you provided when
adding a storage system for monitoring or modifying the configured settings for a monitored
storage system is considered for the auto purge.
IMPORTANT: HP P6000 Performance Advisor schedules the following purge activities:
• Performance data purge on the 1st, 8th, 15th and 22nd of each month at 3:30 am.
• Events purge on the 7th, 14th, 21st and 28th of each month at 3:30 am.
Events for only the last one month are retained.
Although you can execute purges for storage systems or for performance objects, all activities will
be pending with the exception of the purge first initiated. For any purge that is in pending state
after being initiated, you can initiate a re-purge for that purge; however, if a purge is in progress,
you must wait for it to complete before you initiate a re-purge. The duration taken for a purge to
complete depends on the current set of monitored performance objects and the corresponding
data for the specified duration.
In cases where the auto purge has set in and deleted data, there might not be any data left to
delete for that specific performance object when you manually initiate a purge activity.
Data backup and restore
In addition to exporting data, you can back up the HP P6000 Performance Advisor database and
later restore it to the same server or a different server where HP P6000 Performance Advisor is
installed. The following command line utilities enable you to perform the backup and restore
activities:
• Backup utility: dbCreateBackupDump.exe
• Restore utility: dbRestoreBackupDump.exe
For more information, see “Maintaining database” (page 133).
Host connections
A host connection in HP P6000 Performance Advisor is identified as <HostName>(Port WWN).
For example, AppServer(5001-4380-00C5-2218). Addition or removal of host ports in a host
either due to installation or replacement of the HBAs is reflected in HP P6000 Performance Advisor
only after the next state data collection cycle. If the host is not enabled for state data collection,
manually update the object state by clicking Update Object Status in HP P6000 Performance
Advisor. This action synchronizes HP P6000 Performance Advisor with the updated port information
in HP P6000 Command View.
32 HP P6000 Performance Advisor concepts
Page 33

Removal or disconnection of a host port results in the corresponding host connections shown as
'Deleted’ in HP P6000 Performance Advisor. So, non-existent connections appear as
<HostName>(Port WWN)(deleted). In HP P6000 Performance Advisor, you can view historical
performance data along with statistical data for the deleted host connections using the dashboard
KPI, charts, and reports. However, the Key Metrics and threshold summary provide data only for
the host connections that are active.
Following points describe the behavior of HP P6000 Performance Advisor for host connections:
• Key Metrics:
At the Hosts object type level, the data for only the active hosts are displayed.◦
◦ At the host level, data displayed is the sum of performance data of all the corresponding
active host connections.
◦ By default, performance data for only one host connection is shown in the Key Metrics
chart. You can edit the Key Metrics chart settings to add more host connections. However,
Key Metrics statistical data is shown for all the host connections in the host port.
• Threshold monitoring: At both the object type and performance object levels, threshold levels
are applied on sum of performance data of all corresponding active host connections.
• Dashboard KPI, charts, and reports: Both active and unavailable host connections can be
added.
Data replication tunnels
Data replication tunnels are identified as [<Local Controller>, <Local Port>] – [<Remote Array
Name>, <Remote Controller>, <Remote Port>]. For example, [Controller A, Port 1] - [EVA2,
Controller B, Port 2]. If the remote storage system is not managed by any of the HP P6000 Command
View instances in the management group where HP P6000 Performance Advisor belongs, the data
replication tunnel is identified as [Controller A, Port 1] – [FCID : <FCID>], where FCID (Fibre
Channel address) is a constant string followed by a string presenting the hex FCID.
If any of the HP P6000 Command View instances is able to manage the destination storage system,
a new data replication tunnel appears in the Key Metrics charts and dashboard KPI, and also
while adding charts and generating reports for the data replication tunnels.
To identify the data replication tunnels correctly, the FC switches connected to the storage system
must have different domain IDs even though they do not belong to the same fabric. New data
replication tunnels are added in HP P6000 Performance Advisor during the performance data
collection. State data monitoring is not supported for data replication tunnels.
IMPORTANT: HP recommends that you view live charts to determine active data replication
tunnels in a storage system.
• Key Metrics: At performance object level, data for only the active data replication tunnels can
be viewed for durations, such as 1 hour, 6 hours, 12 hours, and 24 hours. However, data
for both the active and obsolete data replication tunnels can be viewed if custom duration is
selected.
• Dashboard KPI, charts, and reports: Data for both the active and obsolete data replication
tunnels can be viewed.
In charts, counters for data replication tunnels are available only at the storage system and
Data Replication object type levels.
• Data purge: Unlike other objects, if data related to data replication tunnels is purged, the
corresponding data replication tunnel entries are also removed from monitoring along with
Data replication tunnels 33
Page 34

the performance data. Hence, those data replication tunnels are not listed for selection while
adding charts, generating reports, or adding dashboard KPI records.
• Data export: Data for both the active and obsolete data replication tunnels can be exported
for a selected duration.
Threshold monitoring
This section describes threshold monitoring in HP P6000 Performance Advisor.
Overview
The threshold monitoring feature enables you to monitor performance and view the threshold
summary of the following performance objects against threshold levels you configure for specific
counters:
• Storage Systems
• Virtual Disk
• Virtual Disk Group
• Physical Disk Group
• Data Replication Group
• Controller
• Host Connection
• Host Port
Threshold monitoring is supported for a specific set of counters for each of the supported objects.
For more information, see “Supported counters” (page 167).
The major and minor threshold levels are the first and second levels of performance indicators. To
configure these settings:
1. For an object type, select the counters for which you want to monitor the performance data,
and specify the minor and major threshold levels for the counter.
2. Select the threshold level at which you want to receive alerts (optional).
The threshold summary is available at the storage system, object type, and performance object
level, and only for objects whose counters are selected for threshold monitoring. The threshold
summary value indicates the percentage of time the performance object remained within, at, or
above the configured threshold levels.
When a storage system or performance object is added for threshold monitoring, the threshold for
throughput (Req/s), data transfer rate (MB/s), or Queue Depth is based on the sum of both the
controllers value. But, the latency is considered as the maximum of controller A and controller B,
except for counters related to host ports. Also, the threshold summary for an object type shows
only the current set of threshold-monitored counters for objects. Similarly, for a threshold monitored
storage system or performance object, its threshold summary shows only the current set of
threshold-monitored counters. If you change the threshold monitoring settings, the new settings take
effect the next collection cycle.
34 HP P6000 Performance Advisor concepts
Page 35

IMPORTANT:
• Threshold monitoring is not supported for physical disks and data replication tunnels.
• If a performance object or storage system is removed from threshold monitoring in HP P6000
Performance Advisor, its threshold summary data until the time of deletion is still available.
• In the dashboard displayed for a storage system, the threshold summary chart values represent
the number of performance objects whose performance is within or exceeded the threshold
levels for any threshold monitored counter.
• Threshold levels are applied on Log Full % reported by only the controller associated with the
data replication groups. Threshold levels are not applied on the controller that is not associated,
as that controller always reports zero (0) value.
The following color icons indicate the state of a storage system or performance object:
DescriptionStateStatus icons
NormalGreen
MinorYellow
MajorRed
Not threshold monitoredGray
Performance is within the minor
threshold level.
Performance is at or above the minor
threshold level.
Performance is at or above the major
threshold level.
Storage system or performance object
is not threshold monitored.
The threshold summary is considered only for the threshold monitored duration. For example, if a
performance object is threshold monitored since the last two hours and the duration selected to
view threshold summary is last six hours, the threshold data across the last two hours is only
displayed for the selected duration. The threshold state of the object is also based on the threshold
data in the last two hours.
If performance data collection stops when threshold monitoring is in progress, the last known
threshold state (Major/Minor/Normal) is shown for the duration that you select. It is valid until the
time the performance data collection resumes. For example, consider the following scenario:
1. A performance object is threshold monitored from 8:00 am.
2. The performance of the object crosses the Major threshold level for that counter at 8:30 am.
3. At the same time, the performance data collection for the object stops.
In such a case, if you view threshold summary for the object from 9:00 am - 12:00 pm, the threshold
data collected till 8:30 am is only displayed. The performance data collection stopped, the threshold
data collected until the time the performance data collection was in progress is only shown. Also,
the state of the performance object is shown as Major and identified by the Orange color code
in the threshold summary.
You can configure email and SNMP notification that are generated when the performance data
of an object reaches or exceeds threshold levels. You can also configure notifications to be sent
if the performance of an object drops below the set threshold levels. Apart from email and SNMP
alerts, events are generated by default.
Threshold summary value
The duration you select to view the threshold summary is depicted on a scale of 0 to 100%. The
duration for which a performance object reaches, exceeds, or drops below a threshold level is
Threshold monitoring 35
Page 36

derived as a percentage of 100%, and is displayed as the threshold summary value. Based on
the threshold summary value, the performance object is associated with one of the following states:
• Normal
• Minor
• Major
Each state is identified by a color code, as shown in the following illustration:
If you set a duration of 1 hour to view the threshold summary of performance object X, the illustration
shows that during the last hour:
• Performance object X has been within the minor threshold level for 50% of the time.
• Performance object X has been at or above the minor threshold level for 30% of the time.
• Performance object X has been at or above the major threshold level for 20% of the time.
The percentage of time shown need not be continuous. For example, 50% of 1 hour may be derived
as follows – first 10 minutes and last 20 minutes of 60 minutes, the object performance was below
minor. So, total 30 minutes of 1 hour equals to 50%.
Threshold events belong to the Threshold Alarm category and can be Informational, Warning, or
Critical. The following example illustrates mapping between the event severity levels and threshold
status icons for a performance object.
The following table describes the threshold levels at which notifications can be generated:
36 HP P6000 Performance Advisor concepts
Notify starting at major threshold levelNotify starting at minor threshold levelThreshold levels
YesNoMajor
YesYesMinor
NoNoNone
Page 37

Threshold monitoring methods
The two methods of adding a performance object to threshold monitoring are by creating and
associating a threshold profile with the object, or creating a Custom threshold profile for the
performance object.
Threshold profile
You can configure threshold settings and associate them with an object type. The configured
threshold profile can then be uniformly selected across performance objects that belong to the
selected object type. A threshold profile acts as a template and is bound to the object type for
which it is created. It is useful when you want to perform threshold monitoring of performance of
multiple objects for the same set of counters and threshold levels. The following illustrates the use
of a threshold profile:
Sample threshold profile: The following table describes the threshold profile, Storage_Profile,
configured for the Storage Systems object type:
Notify starting atMajor threshold levelMinor threshold levelCounter
Minor4030Total Host Req/s
Minor5040Total Host MB/s
If you apply the Storage_Profile settings on Storage_1 and Storage_2, HP P6000 Performance
Advisor monitors the performance of both storage systems for the counters and threshold levels. If
configured, the email and SNMP notifications are also generated when the performance of
Storage_1 and Storage_2 reaches or drops below the minor threshold level.
Custom threshold profile
You can specify threshold settings for every performance object that you want to monitor. When
you add or edit the monitoring settings for an object, you can select the counters and specify the
threshold levels. Once applied, the setting is unique to the performance object and cannot be
associated with other performance objects, even if they belong to the same object type. The
following illustrates this:
Threshold monitoring 37
Page 38

A custom threshold profile is useful when you want to monitor the performance of objects for
different counters, or monitor an object's performance for a specific counter. In contrast to a
threshold profile, a custom threshold profile does not have a name and appears as Custom for the
object for which it is configured. It provides data for the past 24 hours only.
Factors for setting threshold levels
Expected performance of a storage system depends on multiple factors, such as:
• Configuration of the storage system (number and capacity of disk drives in the disk groups,
rotational speed of drives, and so on)
• RAID levels of the virtual disks
• Intensity and pattern of currently running I/O workload (sequential or random, read-write
ratio, and size of I/O transfers)
• Other storage background activities
In addition, view the current performance counter values to determine appropriate threshold values
for your storage system.
Threshold alarm email notifications
The following charts illustrate the threshold alarm email notification behavior when the performance
data exceeds the minor or major threshold level.
Notify starting at minor threshold level
Notify starting at major threshold level
NOTE: If you want to receive notification at a minor threshold level, and the performance data
of the object reaches or exceeds the major threshold level, only one threshold email alarm
notification is dispatched at the major threshold level.
Threshold good information alarm email notification
38 HP P6000 Performance Advisor concepts
Page 39

The threshold good information alarm email notification indicates that the performance data has
dropped below the configured threshold level at which you wanted to be notified. You must manually
configure HP P6000 Performance Advisor to generate notifications. For more information, see
“SMTP and SNMP notification settings” (page 66).
The following examples show the threshold good information alarm email notification behavior
when the performance data drops below the minor or major threshold level.
Case 1: You have specified that you want to receive notification when performance data drops
below the minor threshold level.
Case 2: You have specified that you want to receive notification at the minor threshold level, and
the following occurs:
1. The performance value reaches the major threshold level after crossing the minor threshold
level, and then drops below the major threshold level. The first threshold good information
alarm email notification is generated.
2. The value further drops below the minor threshold level. The second threshold good information
alarm email notification is generated.
Case 3: You have specified that you want to receive notification at the minor threshold level, and
the performance data reaches or exceeds the major threshold level, and then drops below the
minor threshold level.
Threshold monitoring 39
Page 40

Case 4: You have specified that you want to receive notification at the major threshold level, and
the performance data reaches or exceeds, and then drops below the major threshold level.
In this case, an email notification is not generated when the performance data drops below the
minor threshold level.
Case 5: You have specified that you want to receive notification at the major threshold level, and
the performance data reaches or exceeds the major threshold level, and then drops below the
minor threshold level.
Example threshold alarm email and event scenario
In the following chart, the minor threshold level is set to 18, the major threshold level is set to 20,
and the notification is expected at the minor threshold level.
40 HP P6000 Performance Advisor concepts
Page 41

• The first threshold alarm email notification is generated when the performance value reaches
the minor threshold level (18).
• The second threshold alarm email notification is generated only when the performance value
reaches the major threshold level (20).
• When the performance value drops below the minor threshold level, another email notification
is generated. In the chart above, the row Time 2 shows a performance value of 15, which is
below the minor threshold level (18). You receive a threshold good information alarm email
notification.
Threshold monitoring 41
Page 42

5 Quick tour of HP P6000 Performance Advisor pages
This chapter describes each HP P6000 Performance Advisor window and the tasks you can perform
on each window.
Settings page
The installed instances of HP P6000 Command View and HP P6000 Performance Advisor appear
under Settings in the Navigation pane. For every installed instance of HP P6000 Performance
Advisor, you can:
• Configure database and event notifications.
• View summary of configured settings, which includes the storage systems monitored.
• Configure and view summary of monitoring settings for storage systems and performance
objects.
Click the plus (+) or minus (–) sign for the HP P6000 Performance Advisor instance to expand or
collapse its components tree structure.
The sample displays the installed instances for HP P6000 Command View (CV p03win1) and HP
P6000 Performance Advisor (P6000PA - EVAPA-Server-1). The Content pane displays the
configuration summary for P6000PA - EVAPA-Server-1 and the storage systems monitored by
P6000PA - EVAPA-Server-1.
Settings – Configuration page
Under Settings, click Configuration in the components tree for an HP P6000 Performance Advisor
instance to perform the following in the Configure HP P6000 Performance Advisor for Monitoring
window:
• Add and manage monitoring settings for storage systems.
• Establish and manage connections with HP P6000 Performance Data Collector instances.
• View the HP P6000 Command View instances with which the selected HP P6000 Performance
Advisor instance communicates.
• Add and manage threshold and dashboard profiles.
• Configure key metrics, charts, and reports settings.
The following image shows the Configure HP P6000 Performance Advisor for Monitoring window:
42 Quick tour of HP P6000 Performance Advisor pages
Page 43

The following table lists tasks that you can perform under each tab:
Table 2 Settings – Configuration page tasks
TasksTab Name
Perform the following:Monitoring
• Quickly set up HP P6000 Performance Advisor to
monitor storage systems and corresponding performance
objects.
• Add storage systems for monitoring and configure the
monitoring settings.
• View the monitored storage systems.
• Edit the configured monitoring settings for a storage
system.
• Remove existing storage systems from the monitored
list.
• Start or stop data collection for a storage system.
• Update the state of a performance object in HP P6000
Performance Advisor with the state of that object in HP
P6000 Command View.
Perform the following:Performance Data Collector Settings
• Add an HP P6000 Performance Data Collector instance.
• Edit connection settings (port number) for an existing
HP P6000 Performance Data Collector instance.
• Remove existing HP P6000 Performance Data Collector
instances.
• View the connected HP P6000 Performance Data
Collector instances.
Command View Settings
Key Metrics
View the currently accessible HP P6000 Command View
instances.
Configure the key metric charts and statistical data settings.
By default, the configured settings are uniformly applied
across all key metric charts that you plot and statistical
data that you view.
Threshold ProfileThreshold and Dashboard Profiles
Perform the following:
• Add a threshold profile and associate it with an object
type.
• Edit existing threshold profile settings.
• Remove threshold profiles (if not associated with a
performance object type).
When you add or edit a threshold profile, the changes are
uniformly applied across all performance objects that
belong to the associated object type.
Dashboard Profile
Settings page 43
Page 44

Table 2 Settings – Configuration page tasks (continued)
TasksTab Name
Perform the following:
• Add a dashboard profile and associate it with a
controller model.
• Edit existing dashboard profile settings.
• Remove dashboard profiles (if not associated with a
storage system).
• View existing dashboard profile settings.
When you add or edit a dashboard profile, the changes
are uniformly applied across all performance objects that
belong to the associated storage system.
Charts
Reports
For more information, see “Configuring monitoring settings in HP P6000 Performance Advisor”
(page 51).
Settings – Database page
Under Settings, click Database in the components tree for an HP P6000 Performance Advisor
instance to perform the following in the Database Settings window:
• View the database summary for the selected HP P6000 Performance Advisor instance.
• View and manage the purge history.
• Export the HP P6000 Performance Advisor database.
The following example shows the database summary for P6000PA_p03win1:
Configure chart settings, including selecting the duration
for which to plot data. The duration includes predefined
intervals, custom duration, or live data (plotting live data
samples). By default, the configured settings are uniformly
applied across all the charts that you plot.
Configure report settings, including selecting or specifying
the report header details, contact information, report file
format, and granularity (number of data points that must
be considered for creating a report). By default, the
configured settings are uniformly applied across all the
reports that are generated.
The following table lists tasks that you can perform under each tab:
44 Quick tour of HP P6000 Performance Advisor pages
Page 45

Table 3 Settings – Database page tasks
TasksTab Name
Summary
For more information, see “Maintaining database” (page 133).
Settings – Events page
Under Settings, click Events in the components tree for an HP P6000 Performance Advisor instance
to perform the following in the Event Management window:
• View and export event logs.
• Configure event notification settings.
The following image shows the Event Management window:
View the configuration summary of the selected HP P6000
Performance Advisor database.
Perform the following:Purge History
• Purge and re-purge data for the monitored storage
systems.
• Clean up purged records.
• View the purge history.
Perform the following:Export Database
• Export data for a specific storage system to a CSV file.
• View exported database records.
• Remove exported database records.
The following table lists tasks that you can perform under each tab:
Table 4 Settings – Events page tasks
For more information, see “Managing the event log” (page 129).
Settings – Storage Systems page
Under Settings, click Storage Systems in the components tree for an HP P6000 Performance Advisor
instance to view the summary of configured monitoring settings for storage systems and
TasksTab Name
View and export the event log to a CSV file.Event Log
Perform the following:Configure Notification
• Configure and update email settings, which include
SMTP server settings, threshold and data collection
alarm email settings, and report email settings.
• Configure and update SNMP server settings.
• Export the MIB file to your local system.
Settings page 45
Page 46

corresponding performance objects. The summary for an object is displayed under one of the
following performance object type tabs.
• P6000 Monitoring
• Virtual Disks
• Hosts
• Disk Groups
• Data Replication
• Controllers
• Physical Disks
The following example shows the summary of configured monitoring settings for virtual disks under
the Virtual Disks tab:
For more information, see “Viewing a summary of configured monitoring settings” (page 83).
Storage Systems – <storage system> page
Click the plus (+) sign for Storage Systems in the components tree for an HP P6000 Performance
Advisor instance to view the monitored storage systems. Select an storage system to perform the
following in the Summary Data window:
• View the summary of configured monitoring settings.
• Configure dashboard settings for the storage system.
The following example shows the Summary Data window for the HSV300–5060 storage system:
The following table lists tasks that you can perform under each tab:
46 Quick tour of HP P6000 Performance Advisor pages
Page 47

Table 5 Storage Systems – <storage system> page tasks
TasksTab Name
Summary
Dashboard Settings
For more information, see “Viewing the HP P6000 Performance Advisor configuration summary”
(page 88) and “Configuring dashboard settings” (page 62).
<Storage system> – <performance object type> page
Click the plus (+) sign for a storage system under Storage Systems in the components tree for an
HP P6000 Performance Advisor instance to view the object type folders. All performance objects
monitored in the storage system are grouped under the object type folders. Click an object type
folder to perform the following:
• Add performance objects for monitoring and configure the monitoring settings.
• Edit the configured monitoring settings for a performance object.
• Remove performance objects from the monitored list.
The following example shows the object type folders for the LE_6BB0_1 storage system and the
Virtual Disks Monitoring window for the Virtual Disks object type folder that is selected:
View the configured data collection polling intervals,
retention period, data replication tunnel status, and license
information for the selected storage system.
Configure or select a dashboard profile. Configure and
update the dashboard, chart, and KPI settings.
For more information, see “Viewing a summary of configured monitoring settings” (page 83).
Storage Systems page
The storage systems that are managed by the installed instances of HP P6000 Command View
appear under Storage Systems in the Navigation pane. Click the plus (+) sign for Storage Systems
to view the managed storage systems. If the storage systems are also monitored by an instance of
HP P6000 Performance Advisor, the Performance tab appears next to the Management tab in the
Content pane when you select a storage system in the Navigation pane. Under the Performance
tab, you can view the overall performance data for the selected storage system that is represented
as follows:
• A dashboard that shows consolidated high-level performance data for the storage system
• Key metric data, including statistical performance data and charts for key counters
• The threshold summary for the storage system
• Charts that display performance data for combination of objects and counters you select
• A performance report for the objects and counters that you select
The following example shows the dashboard for the HSV300_5060 storage system:
Storage Systems page 47
Page 48

The following table lists tasks that you can perform under each tab:
Table 6 Storage Systems – <storage system> page tasks
TasksTab Name
Dashboard > Overview
View the overall storage system performance. The following
dashboard data appears under the Overview tab:
• Live host port throughput and latency data samples for
the storage system that are based on the performance
of all host ports in the selected storage system.
Select the dashboard profile and click the Drill down
further link to view the live host port throughput and
latency data samples for controllers, host ports and the
storage system of the corresponding dashboard profile
under the Host Port Performance tab.
• Dashboard performance charts, which include the
following:
◦ Threshold Summary chart
Displays a high-level threshold summary for all object
types, including the number of threshold-monitored
performance objects for each object type and the
number of objects within or exceeding a threshold
level (normal, minor, or major) for any threshold
monitored counter. Click the hyperlink provided for
the object type to view the threshold summary of the
corresponding threshold-monitored objects.
◦ Host Port IOPS Historical Chart
Displays the total read and write requests managed
by the storage system.
Dashboard > Host Port Performance
Dashboard > Key Performance Indicators
48 Quick tour of HP P6000 Performance Advisor pages
◦ Host Port IOPS Historical Chart
Displays the average read and write latency data
for the storage system.
• Statistical data and performance charts for configured
KPIs.
View the live host port throughput and latency data samples
for controllers, host ports, and the storage system. View
the historical statistical data and charts for the selected
storage system, controller, or host port.
View statistical data and performance charts for configured
KPIs. Add and manage KPIs.
Page 49

Table 6 Storage Systems – <storage system> page tasks (continued)
TasksTab Name
Key Metrics
Charts
Reports
For more information, see “Viewing performance metrics of storage systems” (page 90).
Storage Systems – <object type> page
Click the plus (+) sign for a storage system to view the object type folders. Select an object type
to view the following summary consolidated for all the performance objects within the object type:
• The key metric data for all monitored performance objects, including statistical performance
data and charts for key counters
• The threshold summary for all monitored performance objects
• The charts that display performance data for the combination of performance objects within
the object type and counters you select
If none of the performance objects within an object type are monitored by HP P6000 Performance
Advisor, the Performance tab in the Content pane does not display any data for that object type.
The following example shows the consolidated performance summary for the Virtual Disks object
type:
View key metric data for the storage system, including
historical statistical data and charts for key counters.
View threshold summary for the storage system.Threshold Summary
Add and view charts for monitored performance objects
in the storage system.
Add and view reports for monitored performance objects
in the storage system.
The following table lists tasks that you can perform under each tab:
Table 7 <Storage system> – <object type> page tasks
TasksTab Name
Key Metrics
Threshold Summary
Charts
View the consolidated key metric summary for all
performance objects within the object type, including
statistical performance data and charts for key counters.
View a consolidated threshold summary, which includes
the percentage of time a performance object remained
within or exceeded the threshold level for a counter.
View and add charts for various monitored performance
objects and counters specific to the object type.
Storage Systems page 49
Page 50

For more information, see “Viewing performance metrics of storage systems” (page 90).
<Object type> – <performance object> page
Click the plus (+) sign for an object type folder to view the monitored performance objects. Select
a performance object to view the following data:
• Key metric data for the performance object, including statistical performance data and charts
for key counters
• The threshold summary for the performance object
• Charts that display performance data of the object for various counters you select
If a performance object is not monitored by HP P6000 Performance Advisor, the Performance tab
in the Content pane does not display any data for the performance object.
The following table lists tasks that you can perform under each tab:
Table 8 <Object type> – <performance object> page tasks
TasksTab Name
Key Metrics
Threshold Summary
View key metric data for the performance object, including
statistical performance data and charts for key counters.
View the threshold summary for the performance object,
which includes the percentage of time the performance
object remained within or exceeded the threshold level for
a counter.
View and add performance object charts.Charts
For more information, see “Viewing performance metrics of storage systems” (page 90).
50 Quick tour of HP P6000 Performance Advisor pages
Page 51

6 Working with HP P6000 Performance Advisor
This chapter describes how to configure, manage, and view monitoring settings for storage systems
and corresponding performance objects in HP P6000 Performance Advisor.
Configuring monitoring settings in HP P6000 Performance Advisor
This section explains how to configure monitoring settings in HP P6000 Performance Advisor. It
includes how to use the Quick Setup wizard, add HP P6000 Performance Data Collector instances,
view discovered HP P6000 Command View instances, and add performance objects for monitoring.
In addition, it also includes how to add threshold profiles, configure dashboard settings, and
additional settings for reports, charts, key metrics, and SMTP and SNMP notifications.
Using the Quick Setup
This section explains how to use Quick Setup wizard to quickly configure an HP P6000 Performance
Advisor instance to monitor storage systems and performance objects. Use the Quick Setup wizard
when you have to add:
1. Multiple HP P6000 Performance Data Collector instances. Ensure that the HP P6000
Performance Data Collector instances you add are accessible and collect data for the storage
systems you want HP P6000 Performance Advisor to monitor.
2. Multiple storage systems. All storage systems accessible through the added HP P6000
Performance Data Collector instances and managed by the discovered HP P6000 Command
View instances can be added.
3. Configure the dashboard settings to view the dashboard live chart.
• Storage System Name: Displays the name of the storage system.
• Storage System WWN: Displays the unique WWN of the storage system.
• Controller Model: Displays the controller model number of the storage system.
• Profile Name: Lists all the profiles associated with the controller model.
• View Profile: Displays the dashboard profile details when you hover the cursor over View.
4. All performance objects in all the selected storage systems.
For better response from HP P6000 Performance Advisor, add only those performance objects
that are used in the production environment.
Also, configure performance and state data collection polling intervals, and retention period that
are uniformly applied across the selected storage systems. The state data monitoring is always
enabled for a performance object added using Quick Setup, which can be disabled by editing
the configured monitoring settings for that object (except for storage system, controllers and host
ports). For more information, see “Editing monitored settings for a storage system or performance
object” (page 76). To know more about performance and state data collection, polling intervals,
and retention period, see “Performance and state data” (page 28).
If you want to add a storage system or specific performance objects separately, see “Adding
performance objects for monitoring” (page 55).
Configuring monitoring settings in HP P6000 Performance Advisor 51
Page 52

IMPORTANT:
• After the quick setup, HP P6000 Performance Advisor does not automatically monitor any
newly created performance objects in the storage systems. You must manually add them for
monitoring. For more information, see “Adding performance objects for monitoring” (page 55).
• HP strongly recommends that you wait for HP P6000 Performance Advisor to finish adding
the selected storage systems and performance objects prior to adding any others. Otherwise,
the storage systems and performance objects you initially added will reappear for selection,
especially if they are the same object type.
• Threshold settings must be configured separately for the storage system or performance object
that you add. For more information on configuring threshold monitoring settings, see “Adding
performance objects for monitoring” (page 55).
Prerequisites
Before you proceed:
• Make note of the IP address (IPv4 or IPv6) or fully qualified domain name of the HP P6000
Performance Data Collector instance that you want to add.
• Ensure that the HP P6000 Performance Advisor license key for the storage system that you
want to add is installed in HP P6000 Command View.
• Ensure that both the controllers in the storage system are accessible from the HP P6000
Command View instance that is managing the storage system.
Procedure
To quickly add storage systems and performance objects to an instance of HP P6000 Performance
Advisor:
1. In the Navigation pane, click Settings.
2. From the list, click the plus (+) sign for an HP P6000 Performance Advisor instance.
3. From the list, select Configuration.
4. In the Configure HP P6000 Performance Advisor for Monitoring window, click Quick Setup
under the Monitoring tab.
5. In the HP P6000 Performance Advisor – Quick Setup Wizard, read the information in the
Welcome Window, address the prerequisites, and then click Next.
The following details are displayed in a table for HP P6000 Command View instances that
are discovered by the HP P6000 Performance Advisor instance and actively managing at
least one storage system:
• Fully qualified server name or IP address.
• Connection Status:
◦ Up: The HP P6000 Command View instance is accessible.
◦ Down: The HP P6000 Command View instance is inaccessible.
6. Click Next.
7. Enter a valid IPv4 or IPv6 address or a fully qualified server name, and the port number (default
860) of the HP P6000 Performance Data Collector instance through which the HP P6000
Performance Advisor instance can access the storage systems managed by the discovered HP
P6000 Command View instances. Ensure that the specified port number is the same as that
52 Working with HP P6000 Performance Advisor
Page 53

used by the HP P6000 Performance Data Collector instance. For more information, see the
HP P6000 Command View User Guide.
HP P6000 Performance Advisor validates the new port number and tries to establish connection
with the selected HP P6000 Performance Data Collector instance. Based on the success or
failure of the connection, the following details are shown:
• Fully qualified server name or IP address.
• Connection Status:
Up: The HP P6000 Performance Data Collector instance is accessible and the storage
◦
systems can be monitored.
◦ Down: The HP P6000 Performance Data Collector instance is inaccessible and the
storage systems cannot be monitored.
• XCOPY & WSAME Supported. Indicates whether P6000 Performance Data Collector
supports collection of XCOPY & WSAME performance metrics.
NOTE: XCOPY & WSAME metric will only be available as part of array and controller
metrics.
If an instance is already added and its connection status is Up, you can choose not to add
more instances and proceed by clicking Next.
The HP P6000 Performance Data Collector instances that you add are also displayed in the
table under the Performance Data Collector Settings tab (Settings > HP P6000 Performance
Advisor Instance > Configuration).
8. Select the check box for storage systems that you want to add and click Next. Only the storage
systems managed by the discovered HP P6000 Command View instances and accessible
through at least one HP Performance Data Collector instance configured in HP P6000
Performance Advisor are displayed with the following details:
• Storage System Name: User-friendly name of the storage system.
• Storage System WWN: Unique WWN of the storage system.
• P6000 Command View IP Address: IP address of the HP P6000 Command View instance
that manages the storage system.
• License Status: Current license status of the selected storage system. You can add only
those storage systems whose License Status shows Valid.
You can also shorten the long list of records to view only those that match the specified criteria.
For more information, see “Using the Filter by list” (page 16).
9. Configure the state and performance data collection polling intervals as specified by the range.
HP P6000 Performance Advisor will use the configured intervals to collect data from the
selected storage systems after they are added to the monitored list. The configured intervals
are applicable across the selected storage systems.
• Performance data: 30 seconds – 60 minutes
• State data: 30 minutes – 24 hours
TIP: For large storage system configuration, it is recommended that you enter longer
frequencies for better response. For more information, see 'Polling intervals' in “Performance
and state data” (page 28).
Enter the number of months that HP P6000 Performance Advisor must retain the performance
data for the selected storage systems. The default data retention period is 3 months.
Configuring monitoring settings in HP P6000 Performance Advisor 53
Page 54

For more information on performance and state data collection, and retention period, see
“Performance and state data” (page 28).
Click Next.
10. Configure the dashboard settings to view the dashboard live chart.
• Storage System Name: Displays the name of the storage system.
• Storage System WWN: Displays the unique WWN of the storage system.
• Controller Model: Displays the controller model number of the storage system.
• Profile Name: Lists all the profiles associated with the controller model. Select the
dashboard profile that you want to assocaite with the storage system.
• View Profile: Displays the dashboard profile details when you hover the cursor over View.
Click Next.
11. The object types for the selected storage systems are displayed and selected by default. Retain
the selection for all the object types or clear the selection for an object type, if you do not
want the corresponding performance objects to be monitored. The storage systems, controllers,
and host ports are mandatorily added for monitoring and the object types always appear
selected.
Click Next.
All the performance objects across the selected storage systems will be added and enabled
for state data monitoring. If you do not want an instance to be monitored for state data, edit
its settings after being added. For more information, see “Editing monitored settings for a
storage system or performance object” (page 76).
NOTE: Performance data collection on data replication groups is not supported for the EVA
4000/6000/8000 storage systems. The Data Replication Group category is available only
for XCS 9.x or later.
12. Review the settings you selected or entered previously, verify whether XCOPY & WSAME is
supported by the storage system, and then click Next.
Click Back if you want to make changes to any of the selected settings.
13. Read the text which indicates that the selected storage systems are being added for monitoring
and data collection will start per the specified frequencies. Click Finish to close the wizard
window.
The time taken to add depends on the number of objects in the selected storage systems. An event
describing the success or failure of addition is logged for every object under the Event Log tab
(Settings > HP P6000 Performance Advisor Instance > Events). You can continue with other activities
in HP P6000 Performance Advisor while the objects are being added. The performance and state
data collection starts per the specified frequencies for the storage systems that are added.
Click Refresh under the P6000 Monitoring tab to view the updated table of monitored storage
systems for the corresponding HP P6000 Performance Advisor instance. Alternatively, the storage
systems and corresponding performance objects that are added also appear under Settings > HP
P6000 Performance Advisor Instance > Storage Systems. For more information, see “Viewing a
summary of configured monitoring settings” (page 83). If a storage system or performance object
is not listed, you will have to manually add it for monitoring. For more information, see “Adding
performance objects for monitoring” (page 55).
Adding an HP P6000 Performance Data Collector instance
Procedure
To add HP P6000 Performance Data Collector for an instance of HP P6000 Performance Advisor:
1. In the Navigation pane, click Settings.
54 Working with HP P6000 Performance Advisor
Page 55

2. From the list, click the plus (+) sign for an HP P6000 Performance Advisor instance.
3. From the list, select Configuration and click the Performance tab in the Content pane.
4. In the Configure HP P6000 Performance Advisor for Monitoring window, click the Performance
Data Collector Settings tab.
5. Click Add.
6. In the Add HP P6000 Performance Data Collector instance window, enter the following data:
• Enter a valid IPv4 or IPv6 address or fully qualified server name.
• Enter a new port number.
Ensure that the port number you specify is the same as that used by the HP P6000
Performance Data Collector instance. For more information, see the HP P6000 Command
View User Guide.
7. Click OK.
HP P6000 Performance Advisor validates the new port number and tries to establish connection
with the selected HP P6000 Performance Data Collector instance. Based on the success or failure
of the connection, the appropriate status is displayed under the Connection Status column for the
selected record. For more information, see “Viewing configured HP P6000 Performance Data
Collector instances” (page 71).
Adding performance objects for monitoring
You can add the following objects to the monitored list by configuring the performance and state
data collection settings, and threshold monitoring settings:
• Storage System
• Virtual disks
• Hosts
• Disk groups
• Data replication groups
• Physical disks
Add a storage system for monitoring first and only then the corresponding performance objects
can be added. When you add a storage system, the controllers and host ports are automatically
added for monitoring.
Adding storage systems
IMPORTANT:
• HP strongly recommends that you wait for HP P6000 Performance Advisor to finish adding
the selected storage systems and performance objects prior to adding any others. Otherwise,
the storage systems and performance objects you initially added will reappear for selection,
especially if they are the same object type.
• When you add a storage system, the storage system, controller, and host port performance
data are collected automatically. You can only edit the monitoring settings for a controller or
host port.
• Ensure that the HP P6000 Performance Advisor license key is installed in the HP P6000
Command View instance, which is managing the storage system you want to add.
To add storage systems to an instance of HP P6000 Performance Advisor:
1. In the Navigation pane, click Settings.
2. From the list, click the plus (+) sign for an HP P6000 Performance Advisor instance.
3. From the list, select Configuration and click the Performance tab in the Content pane.
Configuring monitoring settings in HP P6000 Performance Advisor 55
Page 56

4. In the Configure HP P6000 Performance Advisor for Monitoring window, click Add under the
Monitoring tab.
The HP P6000 Performance Advisor – Add Storage System(s) wizard opens.
5. Read the important information in the Welcome window and click Next.
In the Add Storage Systems for Monitoring window, the storage systems managed by the
discovered HP P6000 Command View instances and accessible through at least one HP
Performance Data Collector instance configured in HP P6000 Performance Advisor are
displayed with the following details:
• Storage System Name: User-friendly name of the storage system.
• Storage System WWN: Unique WWN of the storage system.
• P6000 Command View IP Address: IP address of the HP P6000 Command View instance
that manages the storage system.
• License Status: Current license status of the selected storage system. Only those with a
Valid license state can be added.
6. Select the check box for storage systems that you want to add and click Next. You can add
only those storage systems whose License Status shows Valid.
You can also shorten the long list of records to view only those that match the specified criteria.
For more information, see “Using the Filter by list” (page 16).
7. In the Configure Data Collection Settings window, do the following:
• Under Polling Intervals, configure the state and performance data collection polling
intervals as specified by the range. HP P6000 Performance Advisor will use the configured
intervals to collect data from the selected storage systems after they are added to the
monitored list. The configured intervals are applicable across the selected storage systems.
◦ Performance data: 30 seconds – 60 minutes
◦ State data: 30 minutes – 24 hours
• Under Data Retention, enter the number of months that HP P6000 Performance Advisor
must retain the performance data for the selected storage systems. The default retention
period is 3 months.
For more information on performance and state data collection, polling intervals, and
retention period, see “Performance and state data” (page 28).
• (Optional) Under Data Replication Tunnel Settings, if you want HP P6000 Performance
Advisor to collect performance data for all the data replication tunnels in the selected
storage systems, select the Collect Data Replication Tunnel Performance Data check box.
NOTE: The data replication tunnel performance data can be collected only for XCS 9.x
or later.
8. Configure the dashboard settings to view the dashboard live chart.
• Storage System Name: Displays the name of the storage system.
• Storage System WWN: Displays the unique WWN of the storage system.
• Controller Model: Displays the controller model number of the storage system.
• Profile Name: Lists all the profiles associated with the controller model.
• View Profile: Displays the dashboard profile details when you hover the cursor over View.
9. Click Next.
56 Working with HP P6000 Performance Advisor
Page 57

10. In the Configure Threshold Profile window, configure the threshold settings to monitor
performance of the selected storage systems against minor and major threshold levels that
you specify for the respective counters. To know about threshold monitoring, methods, and
threshold levels, see “Threshold monitoring” (page 34).
To associate a threshold profile or a Custom threshold profile:
a. Select one of the following from the Select threshold profile list. 'None' is the default
selection, which indicates that the selected storage systems are not threshold monitored:
• Name of the threshold profile associated with the Storage System object type. If not
already associated, it is not displayed in the Select threshold profile list. Only 'Custom'
and 'None' options are listed.
To add a threshold profile, see “Adding threshold profiles” (page 60).
• Custom, to manually select the counters and specify threshold levels.
This option is available only if you selected one storage system record.
b. If you select a threshold profile, the following details appear under the column headers
in read-only format:
• Counters selected for threshold monitoring.
• Minor and major threshold values set for the counters.
• The threshold level (Minor or Major) at which you want to receive a threshold alarm
email notification.
If you select Custom, complete the following steps to select the counters and set the
threshold levels:
1. Select the check box for a counter.
2. Enter appropriate values in the Minor Value box and Major Value box.
• The Minor threshold value must be greater than zero but lesser than the 65535
value and the Major threshold value.
• The Major threshold value must be greater than one and the Minor threshold
value, and less than 65535.
3. (Optional) If you want to receive a threshold alarm email notification, select the
threshold level (Minor or Major) from the Notify starting at list. By default, notifications
are not sent when the performance reaches either the minor or major threshold level.
However, an event is logged in the Event Log window regardless of whether you
choose to be notified.
Along with selecting the threshold level, the email and SNMP settings must be
configured in HP P6000 Performance Advisor for notifications to be sent. For more
information, see “SMTP and SNMP notification settings” (page 66).
c. Click Next.
11. In the Confirm Selection window, review the settings you selected or entered previously, verify
whether XCOPY & WSAME is supported by the storage system, and click Next.
Click Back if you want to make changes to any of the selected settings.
Configuring monitoring settings in HP P6000 Performance Advisor 57
Page 58

12. In the Completion window, read the text that indicates that the selected storage systems are
being added for monitoring and data collection will start per the specified collection
frequencies. Click Finish to close the wizard window.
An event describing the success or failure of addition is logged for every object under the
Event Log tab (Settings > HP P6000 Performance Advisor Instance > Events). The performance
and state data collection starts per the specified frequencies for the storage systems that are
added.
Click Refresh under the Monitoring tab to view the updated list of storage systems that appear
in an alphabetical order. For more information, see “Viewing configured monitoring settings
for storage systems” (page 73). Also, for the storage systems that are successfully added, the
performance objects are available to be added to the monitored list. For more information,
see “Adding other performance objects” (page 58).
Adding other performance objects
To add virtual disks, disk groups, physical disks, hosts, data replication groups to an instance of
HP P6000 Performance Advisor:
1. In the Navigation pane, click Settings.
2. From the list, click the plus (+) sign for an HP P6000 Performance Advisor instance.
3. To add:
• Virtual disks:
From the list, click the plus (+) sign for Storage Systems.a.
b. From the list, click the plus (+) sign for a storage system and select the Virtual Disks
object type folder.
c. In the Virtual Disks Monitoring window, click Add.
The HP P6000 Performance Advisor – Add Virtual Disk(s) wizard opens.
d. Proceed to step 4.
• Hosts:
From the list, click the plus (+) sign for Storage Systems.a.
b. From the list, click the plus (+) sign for a storage system and select the Hosts object
type folder.
c. In the Hosts Monitoring window, click Add.
The HP P6000 Performance Advisor – Add Host(s) wizard opens.
d. Proceed to step 4.
• Disk Groups:
From the list, click the plus (+) sign for Storage Systems.a.
b. From the list, click the plus (+) sign for a storage system and select the Disk Groups
object type folder.
c. In the Disk Groups Monitoring window, click Add.
The HP P6000 Performance Advisor – Add Disk Group(s) wizard opens.
d. Proceed to step 4.
• Data Replication Groups:
From the list, click the plus (+) sign for Storage Systems.a.
b. From the list, click the plus (+) sign for a storage system and select the Data Replication
object type folder.
58 Working with HP P6000 Performance Advisor
Page 59

c. In the Data Replication Monitoring window, click Add.
The HP P6000 Performance Advisor – Add Data Replication Group(s) wizard opens.
d. Proceed to step 4.
• Physical Disks:
a. From the list, click the plus (+) sign for Storage Systems.
b. From the list, click the plus (+) sign for a storage system and select the Physical Disks
object type folder.
c. In the Physical Disks Monitoring window, click Add.
The HP P6000 Performance Advisor – Add Physical Disk(s) wizard opens.
d. Proceed to step 4.
4. Read the important information in the respective Welcome windows, click Next to select the
performance objects that you want to monitor.
5. Select the check box for performance objects in the respective Select <Performance Object>
window and click Next. For more information on the parameters displayed, see “Parameters
in the Select <Performance Object> window” (page 60).
You can also shorten the long list of records to view only those that match the specified criteria.
For more information, see “Using the Filter by list” (page 16).
6. In the Configure Data Collection Settings window, the selected performance objects are enabled
for state data monitoring by default and HP P6000 Performance Advisor collects state data
after they are added by default. Disable state data collection, if you do not want their state
in HP P6000 Performance Advisor to be synchronized with the current state in HP P6000
Command View.
When required, you can click Update Object Status under the Monitoring tab to manually
update an object's state in HP P6000 Performance Advisor. For more information, see
“Updating the object state for a storage system” (page 78). For more information on state
data, see “Performance and state data” (page 28).
7. Configure threshold settings to monitor performance of the selected performance objects
against minor and major threshold levels that you specify for the respective counters. For more
information on threshold monitoring and methods, see “Threshold monitoring” (page 34).
To associate a threshold profile or a Custom threshold profile, see Step 8 in “Adding storage
systems” (page 55).
IMPORTANT:
• Physical disks cannot be monitored for threshold data. So, threshold limits are not set on
the physical disks.
• You can configure threshold settings for both virtual and physical disk groups.
8. In the Confirm Selection window, review the settings that you selected or entered previously
and click Next.
Click Back, if you want to make changes to any of the selected settings.
9. In the Completion window, read the text that indicates the selected performance objects are
being added for monitoring and data collection will start per the specified collection frequencies
for the corresponding storage system. Click Finish to close the wizard window.
An event describing the success or failure of addition is logged for every performance object under
the Event Log tab (Settings > HP P6000 Performance Advisor Instance > Events). You can continue
with other activities in HP P6000 Performance Advisor while the objects are being added. Click
Refresh in the respective <Performance Object> Monitoring page to view the updated list of records
that appear in an alphabetical order (Settings > HP P6000 Performance Advisor Instance > Storage
Systems > Individual Storage System > Object type folder). The performance objects appear listed
Configuring monitoring settings in HP P6000 Performance Advisor 59
Page 60

in alphabetical order. For more information, see “Viewing configured monitoring settings for other
performance objects” (page 74).
The performance and state data collection starts for the storage systems as specified by the
configured settings. If you selected performance objects for state data monitoring, their current
status in HP P6000 Performance Advisor also gets synchronized with their state in HP P6000
Command View.
Parameters in the Select <Performance Object> window
The following table describes the parameters displayed for the different performance objects:
Column HeadColumn Head
Virtual Disks
Hosts
Disk Groups
Data Replication Groups
Physical Disks
• Virtual Disk Name: User friendly name of the virtual
disk.
• Folder: Path where the virtual disk object resides.
• Object Type: Object type for the virtual disks.
The user-friendly name of the hosts that belong to the
selected storage system.
• Disk Group Name: User friendly name of the disk group.
• Disk Type: Type of disks in the disk group (Online, Near
online, or Solid state).
• Data Replication Group Name: User friendly name of
the data replication group.
• Role: A dynamic property associated with a data
replication group. Includes two roles, source and
destination, where one data replication group becomes
the source and the other group becomes the destination.
• Physical Disk Name: User friendly name of the physical
disk.
• Disk Group Name: Disk group to which the physical
disk belongs.
Adding threshold and dashboard profiles
Adding threshold profiles
NOTE: To know about a threshold profile, threshold monitoring, and the factors that must be
considered for setting threshold levels, see “Threshold monitoring methods” (page 37). For details
on how to determine minor and major threshold values, see “Determining threshold monitoring
values” (page 162).
Procedure
To create a threshold profile in an instance of HP P6000 Performance Advisor:
1. In the Navigation pane, click Settings.
2. From the list, click the plus (+) sign for an HP P6000 Performance Advisor instance.
3. From the list, select Configuration and click the Performance tab in the Content pane.
4. In the Configure HP P6000 Performance Advisor for Monitoring window, click the Threshold
and Dashboard Profiles tab.
5. Select the profile type as Threshold from the Profile View For: drop-down option.
6. Click Add.
7. In the Add a Threshold Profile window, enter a name for the threshold profile.
60 Working with HP P6000 Performance Advisor
Page 61

8. Select the object type with which you want to associate the threshold profile.
The Select object Type drop down list displays the following options:
• Data Replication Group (default selection)
• Physical Disk Group
• Virtual Disk
• Storage System
• Controller
• Host Port
• Virtual Disk Group
• Host Connection
The table of counters for the selected object type are displayed.
9. Select the check box for the counter for which you want to set the threshold levels.
10. Specify the Minor and Major threshold values.
• The Minor threshold value must be greater than zero but less than the 65535 value and
the Major threshold value.
• The Major threshold value must be greater than the Minor threshold value, and less than
65535.
11. (Optional) If you want to receive a threshold alarm email notification, select the threshold level
(Minor or Major) from the Notify starting at list. By default, notifications are not sent when the
performance reaches either the minor or major threshold level. However, an event is logged
in the Event Log window irrespective of whether you choose to be notified.
Along with selecting the threshold level, the email and SNMP settings must be configured in
HP P6000 Performance Advisor for notifications to be sent. For more information, see “SMTP
and SNMP notification settings” (page 66).
12. Click OK.
The new threshold profile appears in the table under the Threshold Profiles tab. For more information,
see “Viewing configured threshold profiles” (page 79).
You can also associate the threshold profile with performance objects that belong to the object
type for which the profile is created. For more information, see “Adding threshold profiles”
(page 60).
Adding dashboard profiles
Procedure
To create a dashboard profile in an instance of HP P6000 Performance Advisor:
1. In the Navigation pane, click Settings.
2. From the list, click the plus (+) sign for an HP P6000 Performance Advisor instance.
3. From the list, select Configuration and click the Performance tab in the Content pane.
4. In the Configure HP P6000 Performance Advisor for Monitoring window, click the Threshold
and Dashboard Profiles tab.
5. Select the profile type as Dashboard from the Profile View For: drop-down option.
6. Click Add.
7. In the Add a Dashboard Profile window, enter a name for the dashboard profile.
Configuring monitoring settings in HP P6000 Performance Advisor 61
Page 62

8. Select the Storage System type with which you want to associate the dashboard profile.
The Select Controller Model drop down list displays the following options:
• HSV200
• HSV210
• HSV300
• HSV340
• HSV360
• HSV400
• HSV450
The table of counters for the selected object type are displayed.
9. Specify the Minor and Major dashboard values.
• The Minor dashboard value must be greater than zero but less than the 65535 value
and the Major dashboard value.
• The Major dashboard value must be greater than the Minor dashboard value, and less
than 65535.
These threshold values are the reference points for the actual live data samples displayed for
the storage system and help you analyze the total I/Os processed in per unit time and duration
taken to complete each request (latency).
10. Click OK.
Configuring dashboard settings
Configure or select the dashboard profile. In addition, configure the duration (default – Last 1 hour
data) to view the dashboard chart and key performance indicators data. The duration that you
select is uniformly applied across all the charts (shown in the Storage System level performance
charts section) and the key performance indicators under the Dashboard tab. For more information
on the data displayed in dashboard, see “Viewing performance metrics of storage systems”
(page 90).
To know how to determine the appropriate minor and major dashboard threshold values, see
“Setting up dashboard” (page 161). To know the factors that determine the threshold levels you
want to set, see “Factors for setting threshold levels” (page 38).
Procedure
To configure dashboard settings for a storage system monitored by an instance of HP P6000
Performance Advisor:
1. In the Navigation pane, click Settings.
2. From the list, click the plus (+) sign for an HP P6000 Performance Advisor instance.
3. From the list, click the plus (+) sign for Storage Systems.
4. From the monitored list, select a storage system.
5. Click the Dashboard Settings tab in the Summary Data window.
6. Select a dashboard profile from the Select Dashboard Profile drop-down list in the Configure
Dashboard Profile section. The corresponding dashboard settings will be displayed.
7. From the Display list in the Configure Charts and Key Performance Indicators sections, select
the duration for which historical data should appear in charts and statistical table. By default,
performance data collected over the last hour is displayed. Select Include threshold lines in
charts, if a performance object is threshold monitored for a counter.
8. Click Save Changes.
62 Working with HP P6000 Performance Advisor
Page 63

9. In the Save Configured Settings window, when you are prompted to confirm your action, click
OK.
Configuring additional settings
This section describes how to configure settings for SMTP and SNMP notifications, charts, reports,
and key metrics.
Report settings
Configuring report settings is a one-time activity. HP P6000 Performance Advisor applies the
configured settings on all reports that are generated, unless you manually change these settings
while generating a specific report.
Procedure
To configure default report settings in an instance of HP P6000 Performance Advisor:
1. Click Settings in the Navigation pane.
2. From the list, click the plus (+) sign for an HP P6000 Performance Advisor instance.
3. From the list, select Configuration and then click the Performance tab in the Content pane.
4. In the Configure HP P6000 Performance Advisor for Monitoring window, click the Reports
tab.
5. Enter the company name and department name in the Report Header Details section:
A maximum of 100 characters is supported for the company and department names, and can
include characters ranging from a-z, A-Z, 0 to 9, and special characters such as _, @ # * ( )
+ = | ],[ } : ? { and .
6. Select the company logo by clicking Select.
The company logo must be in jpg, gif, or png format.
7. In the Contact Details section, enter your name, email address, and phone number.
A maximum of 100 characters is supported for the contact name and can have characters
ranging from a to z and A to Z.
You can provide only one email address.
8. In the Report Details section, do the following:
• Select the report format as PDF (default) or CSV.
• Select the granularity as Daily Average, Hourly Average or a polling interval as specified
by you while configuring data collection settings for the storage system.
Granularity indicates the number of data points considered for creating a report.
9. (Optional) If you choose to include advanced statistical data, the Advanced (...) statistics
information will appear below the chart on every page of the report. The advanced statistics
includes Minimum, Maximum, Average, Standard Deviation, 90th percentile, 95th percentile,
and 99th percentile.
10. Click Save Changes to update the new default configuration information.
The Save Changes button is not initially enabled. It becomes active only when you modify the
default report settings.
11. In the Save Configured Settings window, when you are prompted to confirm your action, click
OK.
Configuring monitoring settings in HP P6000 Performance Advisor 63
Page 64

The following appear in the reports that you generate under Storage Systems > Storage Network
> Individual Storage System > Reports:
• Report Header Details: Information entered here appears in the header of every page of the
• Contact Details: Information entered here appears in the footer of every page of the report
• Report Details: Information entered here appears defines common aspects that apply to all
• Remarks: Information entered here appears on the first page of the report only.
For more information on generating a report, see “Creating a report template” (page 123).
Chart settings
HP P6000 Performance Advisor displays performance data collected over the last hour in all the
charts. You can retain the default duration or configure the chart settings to view data for a different
predefined interval. You can also configure the chart settings to view live data samples. In addition,
you have the option to modify the chart settings specifically for a chart by clicking the Edit button
in the chart window when you plot the chart. This section describes the procedure to modify chart
settings that reflect across all the charts plotted in HP P6000 Performance Advisor.
Procedure
To configure default chart settings in an instance of HP P6000 Performance Advisor:
1. In the Navigation pane, click Settings.
2. From the list, click the plus (+) sign for an HP P6000 Performance Advisor instance.
3. From the list, select Configuration and click the Performance tab in the Content pane.
4. In the Configure HP P6000 Performance Advisor for Monitoring window, click the Charts tab.
5. In the Configure Chart Settings section – Display list, select the duration for which you want
report created in the system.
created in the system.
reports.
to view data. For more information, see “Using the Display option” (page 15).
• If you selected a predefined interval, proceed to step 7.
• If you selected Live data from the Display list, the Polling Interval and Duration lists are
enabled. Retain the default Polling Interval and Duration, or select the values from the
lists.
◦ Polling Interval: The duration after which a new data point will appear in the chart
(minimum - 5 seconds, maximum - 30 seconds).
◦ Duration: The duration for which a data point will be visible in the chart (minimum
- 5 minutes, maximum - 60 minutes).
◦ (Optional) Select the Include moving averages in chart check box. Moving average
is supported for only one combination of performance object, controller, and counter.
Then, select the value from the Moving Average Subset Size list. Moving average is
calculated as the average of the initial set of data points. The subset size defines the
number of data points used as a subset for average calculation to move average
series in a chart. Moving averages are used to emphasize the direction of a trend
and to smooth out fluctuations or noise.
Proceed to step 7.
64 Working with HP P6000 Performance Advisor
Page 65

6. (Optional) Select the Include threshold lines in chart check box to include the minor and major
threshold lines in the chart.
• The threshold lines are supported for only one combination of performance object,
controller, and counter.
• The threshold lines cannot be plotted for physical disks.
7. Click Save Changes to update the new default configuration. The Save Changes button is
enabled only when you modify the default chart settings.
8. In the Save Configured Settings window, when you are prompted to confirm your action, click
OK .
The configured settings are applied across the charts (other than key metric charts) that you plot
under Storage Systems > Storage Network > Individual Storage System. For more information,
see “Viewing charts” (page 114).
Key Metric settings
HP P6000 Performance Advisor displays performance data collected over a default duration of
last hour in all key metric charts and statistical tables. You can retain the default duration or
configure the key metric settings to view data for a different predefined interval. The duration that
you configure will then be considered as the default duration and will override the 1 hour default
duration provided by HP P6000 Performance Advisor. In addition, you can also configure key
metric charts to display live data samples.
This section describes the procedure to modify the key metric chart and statistical data settings that
will be applied across all the key metric charts and statistical table shown in HP P6000 Performance
Advisor.
Procedure
To configure default key metric settings in an instance of HP P6000 Performance Advisor:
1. In the Navigation pane, click Settings.
2. From the list, click the plus (+) sign for an HP P6000 Performance Advisor instance.
3. From the list, select Configuration and click the Performance tab in the Content pane.
4. In the Configure HP P6000 Performance Advisor for Monitoring window, click the Key Metrics
tab.
5. In the Configure Chart Settings section – Display list, select the duration for which you want
to view data in the key metric charts. For more information, see “Using the Display option”
(page 15).
• If you selected a predefined interval, proceed to step 7.
• If you selected Live data from the Display list, the Polling Interval and Duration lists are
enabled. Retain the default Polling Interval and Duration, or select the values from the
lists.
◦ Polling Interval: The duration after which a new data point will appear in the chart
(minimum - 5 seconds, maximum - 30 seconds).
◦ Duration: The duration for which a data point will be visible in the chart (minimum
- 5 minutes, maximum - 60 minutes).
Proceed to step 7.
6. In the Configure Statistical Data Settings section – Display list, select the appropriate predefined
duration for which you want to view data in the key metric statistical table. For more
information, see “Using the Display option” (page 15).
7. Click Save Changes to update the new default configuration. The Save Changes button is
enabled only when you modify the default key metric settings.
Configuring monitoring settings in HP P6000 Performance Advisor 65
Page 66

8. In the Save Configured Settings window, when you are prompted to confirm your action, click
OK.
The configured settings are applied across the key metric charts and statistical data tables under
Storage Systems > Storage Network > Individual Storage System. For more information, see
“Viewing a summary of key metrics” (page 108).
SMTP and SNMP notification settings
Based on your requirement, you can configure the SMTP and SNMP settings if you want to receive
appropriate notifications whenever performance values exceeds the threshold level at which you
want to be notified. In addition, you can choose to be informed if the performance value drops
below the threshold level at which you want to be notified.
You can configure the SMTP settings if you want to receive appropriate notification whenever data
collection starts or stops.
IMPORTANT: Even though you configure the SMTP or SNMP settings, you will receive email
notifications or SNMP traps only when you selected the threshold at which you want to be notified
while configuring the threshold settings for a storage system or performance object.
Procedure
1. Follow the first three steps in “Viewing the event log” (page 129).
2. Click the Configure Notification tab in the Event Management window.
Based on your requirement, you can choose to configure either SMTP or SNMP settings, or both.
Configure email and SNMP settings
Procedure
Based on your requirement, you can choose to configure either SMTP or SNMP settings, or both.
To configure email settings:
1. In the Email Settings section, select the Enable email settings check box to enable the email
settings fields.
2. Enter the SMTP server fully qualified name or IP address (IPv4 or IPv6), and the port number
(default 25) in the fields under SMTP Server Settings.
3. If authentication is required to access the specified SMTP server, select the Authentication
check box.
HP P6000 Performance Advisor uses the specified credentials every time it has to access the
SMTP server to send email notifications.
4. Enter the user name and password to access the SMTP server, and reconfirm the specified
password.
HP P6000 Performance Advisor uses the specified credentials every time it has to access the
SMTP server to dispatch email notifications.
5. Under Threshold and Data Collection Alarm Email Settings, select Send threshold and data
collection alarm email notifications check box.
6. Enter the following specific details:
• Destination email address where you want to receive the threshold and data collection
alarm notifications (total character count <= 512).
A valid destination email address must transform into one of the following formats:
◦ <alphanumeric_string>@<character_string>.<character_string>.
For example, abc123_abc@xyz.com
◦ <alphanumeric_string>@<character_string>.<character_string>.<character_string>.
For example, abc123_abc.123@xyz.co.in
66 Working with HP P6000 Performance Advisor
Page 67

You can provide multiple email addresses by separating them with a semi colon. For
example, test1@xyz.com;test2@xyz.com;test3@xyz.com
• Source email address from where threshold and data collection alarm notifications should
be dispatched
• (Optional) A descriptive subject for the email notification
• (Optional) Select the Raise alarm when value drops below threshold level check box, if
you want to be notified when the threshold summary value drops below the selected notify
at threshold level.
• Select the Raise alarm when value drops below threshold level check box, if you want to
be notified when the data collection starts or stops.
7. Under Report Email Settings, select Send report email notifications check box.
8. Enter the following specific details:
• Destination email address where you want to receive the report email notifications (total
character count <= 512).
A valid destination email address must transform into one of the following formats:
◦ <alphanumeric_string>@<character_string>.<character_string>.
For example, abc123_abc@xyz.com
◦ <alphanumeric_string>@<character_string>.<character_string>.<character_string>.
For example, abc123_abc.123@xyz.co.in
You can provide multiple email addresses by entering them individually and clicking Add.
• Source email address from where report email notifications should be dispatched
• (Optional) A descriptive subject for the email notification
• Max File Size can be configured between 1 to 5 MB (5 MB is by default). If the file size
exceeds the configured value, the report is emailed as a link.
9. Click Save Changes.
Configure SNMP settings
Procedure
To configure SNMPv1 or SNMPv2 settings:
1. In the SNMP Settings section, select the Enable Threshold SNMP Traps check box to enable
the fields.
2. Specify the SNMP version by selecting SNMPv1 or SNMPv2 from the SNMP Version list.
SNMPv1 is the default selection.
3. Enter the SNMP community name.
Any special character apart from ~ @ # $ % ^ & < > { * ( + ) _ : } is allowed.
4. Enter the SNMP destination IP address and port number to which the traps are to be delivered,
and then click Add.
NOTE: The Add button is enabled only when you start entering the SNMP IP address.
After you enter the SNMP destination IP addresses, the new SNMP server is added to the List
of SNMP Destination [Ports] list.
5. Click Save Changes.
HP P6000 Performance Advisor starts dispatching SNMP traps to the specified SNMP destination
server.
Configuring monitoring settings in HP P6000 Performance Advisor 67
Page 68

Procedure
To configure SNMPv3 settings:
1. In the SNMP Settings section, select the Enable Threshold SNMP Traps check box to enable
the fields.
2. Select SNMPv3 from the SNMP Version list.
A new SNMPv3 Options window is enabled. The default selection for the authentication
protocol is None.
3. Specify the security level by selecting NOAUTH_NOPRIV, or, AUTH_NOPRIV, or AUTH_PRIV
while configuring SNMPv3:
• NOAUTH_NOPRIV
Enter the SNMPv3 username.1.
2. Continue with Step 4 in this procedure.
• AUTH_NOPRIV
Select an authentication protocol (MD5 or SHA) from the Protocol list. This enables
1.
the authentication password and confirm password fields. This also enables the
encryption method. The default selection for the encryption method is None.
2. Enter the SNMPv3 username.
3. Enter a password in the Password field. Confirm the password in the Confirm
Password field.
NOTE: The password must contain minimum eight characters.
4. Continue with Step 4 in this procedure.
• AUTH_PRIV
1. Select an authentication protocol (MD5 or SHA) from the Protocol drop-down list.
This enables the authentication password and confirm password fields.
2. Enter the SNMPv3 username.
3. Enter a password in the Password field. Confirm the password in the Confirm
Password field.
4. Select an encryption method (DES or AES128) from the Method list. This enables the
encryption password and confirm password fields.
5. Enter a password in the Password field. Confirm the password in the Confirm
Password field.
NOTE: The authentication and encryption passwords must contain minimum eight
characters.
6. Continue with Step 4 in this procedure.
4. Enter the SNMP community name.
Any special character apart from ~ @ # $ % ^ & < > { * ( + ) _ : } is allowed.
5. Enter the SNMP destination IP address and port number to which the traps are to be delivered,
and then click Add.
NOTE: The Add button is enabled only when you start entering the SNMP IP address.
After you enter the SNMP destination IP addresses, the new SNMP server is added to the List
of SNMP Destination [Ports] list.
6. Click Save Changes.
HP P6000 Performance Advisor starts dispatching SNMP traps to the specified SNMP destination
server.
68 Working with HP P6000 Performance Advisor
Page 69

NOTE: For SNMPv3, 50005 is the default port for trap reception at HP Systems Insight Manager
(SIM). When discovering the source IP address through HP SIM, use
0x800000e80450363030305041 as the Engine ID. For more options on configuring SNMPv3
user and changing the default port on HP SIM, see the HP SIM User Guide version 7.2 and HP
SIM 7.2.1 Release Notes.
Remove SNMP destination address
If you want to remove an existing SNMP destination address, select the corresponding record in
the List of SNMP Destination [Ports] list, click Remove, and then click OK when you are prompted
to confirm your action.
Exporting MIB file
To export the MIB file to a location of your choice:
1. Click Export MIB File.
The File Download window opens and displays the MIB file attributes, such as the file name,
type, and size.
2. Click OK.
3. The Save As window opens, prompting you to select the location on your system where you
want to save the MIB file.
4. Specify the location and click Save to download the file to the specified location.
Sample email notification
From: <Source email address>
Sent: Wednesday, February 09, 2011 4:59 PM
To: <Destination email address>
Subject: Threshold Alarm
Server : XX.XX.XX.XX
Sequence Number : 750
Event Code : 14001
Category : Threshold Alarm
Detect Time : 2011-02-09 16:59:09.832
Severity : CRITICAL
Description : Object metric met or exceeded the Major threshold value. Array name = LE_6BB0, Array WWN =
5001-4380-013C-6BB0, Object name = LE_6BB0, Id = 08000710B4080560F7D208000030030000000200, Object type = ARRAY,
Counter name = Total Host Req/s, Threshold value = 20, Current value = 1857.0
The following table describes the contents of the email notification.
DescriptionEmail notification fields
Category to which the generated event belongs.Event Code
Always shows Threshold Alarm.Category
Server
Detect Time
HP P6000 Performance Advisor server IP address which
sends the threshold and data collection alarm email
notification. In the sample notification provided,
XX.XX.XX.XX represents the SMTP server IP address.
Sequence in which email notifications are sent.Sequence Number
Severity (Critical, Warning, or Informational).Severity
Date and time when the performance value crossed the
threshold level at which you want to be notified.
For more information on event severity, categories, and event codes, see “Managing the event
log” (page 129).
Sample SNMP notifications
Following is a sample SNMP notification:
Configuring monitoring settings in HP P6000 Performance Advisor 69
Page 70

.1.3.6.1.4.1.232.175
.1.3.6.1.4.1.232.175
15.154.98.8
87 days, 15 hours, 38 minutes, 38 seconds.
Wed Feb 16 11:53:55 GMT+05:30 2011
.1.3.6.1.4.1.232.175.1: 15.154.98.8
.1.3.6.1.4.1.232.175.2: 0 hours, 0 minutes, 21 seconds.
.1.3.6.1.4.1.232.175.3: 14000
.1.3.6.1.4.1.232.175.4: Threshold Alarm
.1.3.6.1.4.1.232.175.5: 87 days, 15 hours, 38 minutes, 38 seconds.
.1.3.6.1.4.1.232.175.6: WARNING
.1.3.6.1.4.1.232.175.7: Object metric met or exceeded the Minor threshold value. Array name = HSV300_2C1D_5060,
Array WWN = 5001-4380-013C-5060, Object name = \Disk Groups\Default Disk Group, Id =
00010710B4080560D1D108000090000000005201, Object type = PDISKGRP, Counter name = Average Drive Queue Depth,
Threshold value = 12, Current value = 13.0
.1.3.6.1.4.1.232.175.8: 5001-4380-013C-5060
.1.3.6.1.4.1.232.175.9: HSV300_2C1D_5060
.1.3.6.1.4.1.232.175.10: 00010710B4080560D1D108000090000000005201
.1.3.6.1.4.1.232.175.12: \Disk Groups\Default Disk Group
.1.3.6.1.4.1.232.175.11: PDISKGRP
.1.3.6.1.4.1.232.175.13: Average Drive Queue Depth
.1.3.6.1.4.1.232.175.14: 13.0
.1.3.6.1.4.1.232.175.15: 12
.1.3.6.1.4.1.232.175.16: 1
The following table describes the contents of the SNMP notification:
ExampleDescriptionSNMP notification field
Server IP address
Event Code
Category
Time it was detected
Severity
Description
Storage System WWN
notification is generated
notification
Performance Advisor for which
the notification is sent
is generated
generated: Critical, Warning,
or Information
The description of the
notification
system for which the
notification is generated
15.154.98.8The server from which the
14000The event ID of the generated
Threshold AlarmThe component in HP P6000
2012/03/30 15:38:38The time when the notification
WARNINGThe severity of the notification
Object metric met or exceeded the Minor threshold value.
Array name = HSV300_2C1D_5060, Array WWN =
5001-4380-013C-5060, Object name = \Disk
Groups\Default Disk Group, Id =
00010710B4080560D1D108000090000000005201,
Object type = PDISKGRP, Counter name = Average Drive
Queue Depth, Threshold value = 12, Current value = 13.0
.1.3.6.1.4.1.232.175.8: 5001-4380-013C-5060
5001-4380-013C-5060The WWN of the storage
Storage System Name
for which the notification is
generated
Object ID
performance object
Object Name
performance object
Object Type
performance object belongs
Counter Name
performance object is
monitored
70 Working with HP P6000 Performance Advisor
HSV300_2C1D_5060The name of the storage system
00010710B4080560D1D108000090000000005201The unique ID of the
\Disk Groups\Default Disk GroupThe user-friendly name of the
PDISKGRPThe object type to which the
Average Drive Queue DepthThe counter for which the
Page 71

ExampleDescriptionSNMP notification field
Actual Value
resulted in the notification
Detect Level
the performance object, can
be 0 - Normal, 1 - Minor, 2 Major
13The performance value that
12The threshold value setThreshold Value
1The threshold level crossed by
Managing configured settings in HP P6000 Performance Advisor
This section helps you view and manage configured settings in HP P6000 Performance Advisor.
In addition, you can also manage dashboard settings for storage systems and additional settings
such as reports, charts, and key metrics.
Managing HP P6000 Performance Data Collector settings
This section describes how to manage the configured connection settings for HP P6000 Performance
Data Collector instances in HP P6000 Performance Advisor.
Viewing configured HP P6000 Performance Data Collector instances
Procedure
To view the HP P6000 Performance Data Collector instances in a specific instance of HP P6000
Performance Advisor:
1. In the Navigation pane, click Settings.
2. From the list, click the plus (+) sign for an HP P6000 Performance Advisor instance.
3. From the list, select Configuration and click the Performance tab in the Content pane.
4. In the Configure HP P6000 Performance Advisor for Monitoring window, click the Performance
Data Collector Settings tab.
A table of configured HP P6000 Performance Data Collector instances is displayed. The following
table describes the data:
HP P6000 Performance Data Collector Server Name/IP
Address
Connection Status
Port Number
XCOPY & WSAME Supported
Managing configured settings in HP P6000 Performance Advisor 71
Displays the server name or IP address (IPv4 or IPv6) of
the HP P6000 Performance Data Collector instance.
Displays the status on whether HP P6000 Performance
Advisor is able to access the HP P6000 Performance Data
Collector instance:
• Up, the HP P6000 Performance Data Collector instance
is accessible.
• Down, the HP P6000 Performance Data Collector is
inaccessible.
Displays the number of the communication port (default:
860) used by HP P6000 Performance Data Collector.
Indicates whether P6000 Performance Data Collector
supports collection of XCOPY & WSAME performance
metrics.
Page 72

Editing the port number of HP P6000 Performance Data Collector instances
IMPORTANT:
• If the specified new port number though valid is not available for communication, the existing
port number is retained for the selected HP P6000 Performance Data Collector instance. Also,
if you want to modify the IP address or server name of an existing HP P6000 Performance
Data Collector instance, you must add another record specifying the new IP address or server
name. You can only modify the port number for an existing instance of HP P6000 Performance
Data Collector instance.
• Multiple HP P6000 Performance Data Collector records cannot be edited at a time.
Procedure
To edit the port number of a HP P6000 Performance Data Collector instance in HP P6000
Performance Advisor:
1. Follow the first four steps in “Viewing configured HP P6000 Performance Data Collector
instances” (page 71) to access the Performance Data Collector Settings tab.
2. In the table, select the check box for the HP P6000 Performance Data Collector record
associated with the port number that you want to modify.
3. Click Edit.
The Edit P6000 Performance Data Collector Settings window displays the server name or IP
address of the selected HP P6000 Performance Data Collector instance as read-only data.
4. Enter a new port number.
Ensure that the port number you specify is the same as that used by the HP P6000 Performance
Data Collector instance. For more information, see the HP P6000 Command View User Guide.
5. Click OK.
HP P6000 Performance Advisor validates the new port number and tries to establish connection
with the selected HP P6000 Performance Data Collector instance. Based on the success or failure
of the connection, the appropriate status is displayed under the Connection Status column. For
more information, see “Viewing configured HP P6000 Performance Data Collector instances”
(page 71).
Removing configured HP P6000 Performance Data Collector instances
CAUTION: If you remove the only HP P6000 Performance Data Collector instance that collects
performance data for storage systems, the data collection will pause unless you configure another
HP P6000 Performance Data Collector instance to start collecting data. If multiple HP P6000
Performance Data Collector instances are connected to a storage system and the HP P6000
Performance Data Collector instance is one among them, there might be a gap in performance
data collection for the duration until HP P6000 Performance Advisor switches to another instance
to collect performance data.
HP recommends removing unused HP P6000 Performance Data Collector instances, to improve
response time of HP P6000 Performance Advisor operations.
Procedure
To remove HP P6000 Performance Data Collector instances:
1. Follow the first four steps in “Viewing configured HP P6000 Performance Data Collector
instances” (page 71) to access the Performance Data Collector Settings tab.
72 Working with HP P6000 Performance Advisor
Page 73

2. In the table, select the check box for a HP P6000 Performance Data Collector record and
click Remove.
The Confirm Removing P6000 PDC instances window displays the IPv4 or IPv6 address or
fully qualified server name of the selected instance in the Performance Data Collection Server
Name/IP Address box.
3. Click OK.
4. You are prompted to re-confirm your action. Click OK.
This action is considered as a final confirmation, the selected HP P6000 Performance Data Collector
instances are removed. If you remove the only HP P6000 Performance Data Collector instance
that collects performance data for storage systems, you might observe a stop in data collection
until another instance takes over the activity.
Viewing HP P6000 Command View instances
After an installed instance of HP P6000 Performance Advisor becomes part of a Management
Group, those HP P6000 Command View instances that are actively managing at least one storage
system in the Management Group are discovered.
Procedure
To view the accessible HP P6000 Command View instances for an instance of HP P6000
Performance Advisor:
1. In the Navigation pane, click Settings.
2. From the list, click the plus (+) sign for an HP P6000 Performance Advisor instance.
3. From the list, select Configuration and click the Performance tab in the Content pane.
4. In the Configure HP P6000 Performance Advisor for Monitoring window, click the Command
View Settings tab.
A table of HP P6000 Command View instances is displayed. The following table describes the
data:
HP P6000 Command View Server Name/IP Address
Port Number
Connection Status
Displays the server name or IP address of the HP P6000
Command View instance.
Displays the number of the communication port (default:
2372) between the HP P6000 Command View and HP
P6000 Performance Advisor instances.
Displays the current connection status between the HP
P6000 Command View and HP P6000 Performance
Advisor instances:
• Up, the HP P6000 Command View instance is
accessible.
• Down, the HP P6000 Command View instance is
in-accessible.
Managing configured settings for performance objects
This section describes how to manage the monitoring settings configured for performance objects
in HP P6000 Performance Advisor.
Viewing configured monitoring settings for storage systems
You can view the monitoring settings configured for the storage systems that you added to the
monitored list. HP P6000 Performance Advisor monitors the performance of storage systems based
on the configured settings.
Managing configured settings in HP P6000 Performance Advisor 73
Page 74

IMPORTANT: If the storage system is re-initialized, remove the storage system from the currently
monitored list and add it back for monitoring again. For more information, see “Adding performance
objects for monitoring” (page 55).
Procedure
To view monitoring settings configured for storage systems in an instance of HP P6000 Performance
Advisor:
1. In the Navigation pane, click Settings.
2. From the list, click the plus (+) sign for an HP P6000 Performance Advisor instance.
3. From the list, select Configuration and click the Performance tab in the Content pane.
The table displays the storage systems added for monitoring under the Monitoring tab. If the table
is blank, click Add. For more information, see “Adding storage systems” (page 55).
The following table describes the data:
The user-friendly name of the storage system.Storage System Name
The unique WWN of the storage system.Storage System WWN
P6000 Command View IP Address
License Status
The IP address or server name of the HP P6000 Command
View instance that manages the storage system monitored
by HP P6000 Performance Advisor. HP P6000 Performance
Advisor receives state data of the storage system through
this specific HP P6000 Command View instance.
The license type and status associated with the storage
system. This information is derived from HP P6000
Command View, see “Licensing behavior in HP P6000
Performance Advisor” (page 88).
Displays one of the following:Data Collection Enabled
• Started, if you started the data collection for the storage
system. The current status on data collection is displayed
in the HP P6000 Performance Advisor Summary window
under the Monitoring Status column.
• Stopped, if you have stopped the data collection for the
storage system.
For more information, see “Viewing the HP P6000
Performance Advisor configuration summary” (page 88).
Displays one of the following:Threshold Profile
• Name of the threshold profile if you associated the
storage system with a threshold profile.
• Custom, if you selected counters and specified threshold
levels when adding the storage systems.
• Blank, if the storage system is not threshold monitored.
Viewing configured monitoring settings for other performance objects
In addition to storage systems, you can view the settings configured for performance objects that
belong to the following object types:
• Virtual Disks
• Hosts
• Disk Groups
• Data Replication Groups
74 Working with HP P6000 Performance Advisor
Page 75

• Controllers and Host Ports
• Physical Disks
HP P6000 Performance Advisor monitors the performance objects based on the configured settings.
Procedure
To view monitoring settings configured for performance objects in an instance of HP P6000
Performance Advisor:
1. In the Navigation pane, click Settings.
2. From the list, click the plus (+) sign for an HP P6000 Performance Advisor instance.
3. From the list, click the plus (+) sign for Storage Systems.
4. From the list, click the plus (+) sign for a storage system.
5. Select the object type folder and click the Performance tab in the Content pane.
Viewing configured monitoring settings for virtual disks
You can view the configured monitoring settings for virtual disks that are added to the monitored
list. HP P6000 Performance Advisor monitors the performance of virtual disks based on the
configured settings.
For description of the configured settings, see “Summary of configured monitoring settings for
virtual disks” (page 84).
Viewing configured monitoring settings for hosts
You can view the configured settings for hosts that are added to the monitored list. HP P6000
Performance Advisor monitors the performance of hosts based on the configured settings.
For description of the configured settings, see “Summary of configured monitoring settings for
hosts” (page 85).
Viewing configured monitoring settings for disk groups
You can view the configured settings for disk groups that are added to the monitored list. HP P6000
Performance Advisor monitors the performance of disk groups based on the configured settings.
For description of the configured settings, see “Summary of configured monitoring settings for disk
groups” (page 85).
Viewing configured monitoring settings for data replication groups
You can view the configured settings for data replication groups that are added to the monitored
list. HP P6000 Performance Advisor monitors the performance of data replication groups based
on the configured settings.
For description of the configured settings, see “Summary of configured monitoring settings for data
replication groups” (page 86).
Viewing configured monitoring settings for controllers
You can view the configured settings for controllers that are added to the monitored list. HP P6000
Performance Advisor monitors the performance of controllers based on the configured settings.
For description of the configured settings, see “Summary of configured monitoring settings for
controllers and host ports” (page 86).
Viewing configured monitoring settings for host ports
You can view the configured settings for host ports that are added to the monitored list. HP P6000
Performance Advisor monitors the performance of host ports based on the configured settings.
For description of the configured settings, see “Summary of configured monitoring settings for
controllers and host ports” (page 86).
Managing configured settings in HP P6000 Performance Advisor 75
Page 76

Viewing configured monitoring settings for physical disks
You can view the configured settings for physical disks that are added to the monitored list. HP
P6000 Performance Advisor monitors the performance of physical disks based on the configured
settings.
For description of the configured settings, see “Summary of configured monitoring settings for
physical disks” (page 87).
Editing monitored settings for a storage system or performance object
Editing the configured settings for a storage system involves modifying the performance and state
data collection and threshold settings. Similarly, for a performance object, it involves enabling or
disabling state data collection and modifying the configured threshold settings.
IMPORTANT:
• For a physical disk record, you can only enable or disable state data collection.
• For a controller and host port, you can only modify the threshold monitoring settings.
Procedure
To edit the configured settings for a storage system or performance object in an instance of HP
P6000 Performance Advisor:
1. Navigate to the window that lists the storage system or performance object. For more
information, see “Adding storage systems” (page 55) or “Adding other performance objects”
(page 58) respectively.
2. In the window that opens, select the check box for the storage system or performance object
record.
3. Click Edit.
The respective HP P6000 Performance Advisor – Edit <Performance Object> wizard guides
you through the editing process. For more information on editing data collection and threshold
settings, see “Adding storage systems” (page 55) and “Adding other performance objects”
(page 58) respectively.
Removing storage system or performance object records
CAUTION: When you remove a storage system or performance object from monitoring, the
corresponding data is permanently deleted from HP P6000 Performance Advisor. The controllers
and host ports cannot be removed separately.
Procedure
To remove storage systems or performance objects from the monitored list:
1. Based on the performance objects that you want to remove from monitoring, select the
appropriate link in the Navigation pane. For more information, see “Adding storage systems”
(page 55) or “Adding other performance objects” (page 58) respectively.
2. In the window that opens, select the check box for a storage system or performance object
record, and click Remove.
The Confirm remove window displays a Warning message. The message indicates that the
performance and state data collection will stop upon removal of the storage system or
performance object, and the existing performance data will be permanently removed from
HP P6000 Performance Advisor.
3. Click OK.
4. The Reconfirm removing <performance object> window displays the Warning message again
and prompts you to reconfirm your action, click OK.
76 Working with HP P6000 Performance Advisor
Page 77

This action is considered as a final confirmation, the storage systems or performance objects are
removed from the monitored list and the data is permanently deleted from HP P6000 Performance
Advisor database.
Starting or stopping data collection for a storage system
You can manually start or stop data collection (performance and state data) for a storage system.
The status on whether HP P6000 Performance Advisor is able to start or stop data collection appears
in the HP P6000 Performance Advisor Summary window, under the Monitoring Status column. For
more information, see “Viewing the HP P6000 Performance Advisor configuration summary”
(page 88).
Procedure
To stop or start data collection for a storage system:
1. In the Navigation pane, click Settings.
2. From the list, click the plus (+) sign for an HP P6000 Performance Advisor instance.
3. From the list, select Configuration and click the Performance tab in the Content pane.
Managing configured settings in HP P6000 Performance Advisor 77
Page 78

4. Under the Monitoring tab, stop or start data collection:
To start data collection:
a. Select the check box for a storage system associated with the status Stopped under the
Data Collection Enabled column.
b. Click Start.
The Confirm start window displays a warning message that indicates that the performance
and state data collection will start for the selected storage system.
c. At the prompt, click OK.
The Re-Confirm start window displays the list of selected storage system records and also
the Warning message again, and prompts you to reconfirm your action.
d. Click OK.
This action is considered as a final confirmation and HP P6000 Performance Advisor initiates
data collection for the storage systems. The Data Collection Enabled state changes to Started
from Stopped under the Monitoring tab, indicating that your attempt to start performance
and state data collection is successful.
Also, the Monitoring Status in the HP P6000 Performance Advisor Summary page shows the
appropriate state based on whether the HP P6000 Performance Advisor instance is able to
collect data for the storage systems. For more information, see “Viewing the HP P6000
Performance Advisor configuration summary” (page 88).
To stop data collection:
a. Select the check box for a storage system associated with the status Started under the
Data Collection Enabled column.
b. Click Stop.
The Confirm stop window displays a warning message that indicates that the performance
and state data collection will stop for the selected storage system.
c. At the prompt, click OK.
The Re-Confirm stop window displays the Warning message again and prompts you to
reconfirm your action.
d. Click OK.
This action is considered as a final confirmation and HP P6000 Performance Advisor stops
collecting data for the storage systems. The Data Collection Enabled state changes to Stopped
from Started under the Monitoring tab. Also, the Monitoring Status in the HP P6000
Performance Advisor Summary page shows the appropriate state based on whether the HP
P6000 Performance Advisor instance is able to stop collecting data for the storage systems.
For more information, see “Viewing the HP P6000 Performance Advisor configuration summary”
(page 88).
NOTE: If the Data Collection email notification is configured, then an email will be sent when
the data collection service is started or stopped.
Updating the object state for a storage system
For understanding state data update, see “Performance and state data” (page 28).
Procedure
To manually update the state data and license status for a storage system:
1. Follow the first four steps in “Viewing configured monitoring settings for storage systems”
(page 73) to access the Monitoring tab.
2. Under the Monitoring tab, select the check box for a storage system to synchronize the state
data with HP P6000 Command View.
78 Working with HP P6000 Performance Advisor
Page 79

3. Click Update Object Status.
The Confirm Update window displays a Warning message. The message indicates that the
completion of the update activity will take time and depends on the number of performance
objects added for monitoring in the selected storage system. You are prompted to confirm if
you want to continue.
4. Click OK.
After the state data synchronization is complete, a message indicating the success of the
synchronization activity is displayed under the Monitoring tab.
Viewing configured dashboard settings
Procedure
To view dashboard settings configured for a storage system in an instance of HP P6000 Performance
Advisor:
1. In the Navigation pane, click Settings.
2. From the list, click the plus (+) sign for an HP P6000 Performance Advisor instance.
3. From the list, click the plus (+) sign for Storage Systems.
4. From the list, select the storage system.
5. In the Summary Data window, click the Dashboard Settings tab. You can also navigate to the
Dashboard Settings page by clicking Dashboard configuration link in the Dashboard Overview
tab.
The configured dashboard settings for the selected storage system opens in the following sections:
Configure dashboard profile
Displays the selected dashboard profile and the Major and Minor threshold values for the profile.
Configure Charts
Displays the selected duration for which the historical data will be plotted and whether threshold
lines will be shown in dashboard charts.
Key Performance Indicators
Displays the selected duration for which the historical data will be plotted in the Key Performance
Indicator charts.
Based on the configured settings, HP P6000 Performance Advisor displays the dashboard data
for the selected storage system. For more information on viewing dashboard data, see “Viewing
the Dashboard Overview” (page 90). If the threshold values are not yet configured, the Configure
throughput and latency thresholds section for the counters appears blank. Also, the dashboard
data for the storage system is not displayed. For more information on configuring dashboard
settings, see “Configuring dashboard settings” (page 62).
Managing configured threshold profiles
This section describes how to manage the configured threshold profiles in HP P6000 Performance
Advisor.
Viewing configured threshold profiles
IMPORTANT: This procedure is not applicable for a Custom threshold profile. To view and edit
Custom threshold profile settings, see “Editing monitored settings for a storage system or performance
object” (page 76).
Procedure
To view threshold profile settings configured in an instance of HP P6000 Performance Advisor:
1. In the Navigation pane, click Settings.
Managing configured settings in HP P6000 Performance Advisor 79
Page 80

2. From the list, click the plus (+) sign for an HP P6000 Performance Advisor instance.
3. From the list, select Configuration and click the Performance tab in the Content pane.
4. In the Configure HP P6000 Performance Advisor for Monitoring window, click the Threshold
and Dashboard Profiles tab.
5. By default, Profile View For is selected as Threshold.
A table of configured threshold profiles is displayed with the records sorted in an alphabetical
order. The following table describes the data:
Displays name of the threshold profile.Profile Name
Object Type
6. If the table is blank, click Add.
Editing a configured threshold profile
IMPORTANT:
• Multiple threshold profiles cannot be edited at a time.
• The following procedure is not for editing custom threshold profiles. For more information, see
“Editing monitored settings for a storage system or performance object” (page 76).
• Renaming a threshold profile is not allowed. In this case, you must create a threshold profile
with a new name.
Procedure
To edit a threshold profile in HP P6000 Performance Advisor:
1. Follow the first four steps in “Viewing configured threshold profiles” (page 79) to access the
Threshold and Dashboard Profiles tab.
2. By default, Profile View For is selected as Threshold.
3. In the table, select the check box for a threshold profile record.
4. Click Edit.
The Edit a threshold profile dialog box displays the selected threshold profile name and
associated object type as read-only data.
Displays the object type associated with the
corresponding threshold profile listed under the Profile
name column.
5. To modify an existing threshold setting, navigate to an enabled counter. To configure a new
threshold setting, select a check box for a counter that appears disabled. Configuring or
modifying threshold settings includes:
• Enter new Minor and Major threshold values.
• From the Notify starting at list, select the new level at which you want to receive
notifications.
6. Click OK.
The modified threshold profile appears in the table under the Threshold Profiles tab (sorted in an
alphabetical order). If you associated the threshold profile with a performance object, the new
configured settings take effect from the next polling cycle. For more information, see “Viewing
configured threshold profiles” (page 79).
You receive notifications based on the Notify starting at level. By default, notifications are not sent
when the performance data reaches either the minor or major threshold level. However, an event
is logged regardless of whether you choose to be notified.
80 Working with HP P6000 Performance Advisor
Page 81

Removing threshold profiles
NOTE: Threshold profiles can be removed only if they are not associated with any storage system
or performance object. To remove a threshold profile, you must first remove its association with
the storage system or performance objec. To remove the association, edit the configured monitoring
settings for that storage system or performance object. Select None, another threshold profile, or
Custom (to create a custom threshold profile) from the Select threshold profile list in the Configure
Threshold Profile section, and save the changes. For more information, see “Adding performance
objects for monitoring” (page 55).
After the association is removed, follow these steps to remove the threshold profiles (see “Removing
custom threshold profiles” (page 81)).
Procedure
To remove threshold profiles:
1. Complete the procedure mentioned under “Viewing configured threshold profiles” (page 79)
to access the Threshold Profiles tab.
2. In the table, select the check box for a threshold profile and click Remove.
3. The Confirm Remove window prompts you to confirm, click OK.
The threshold profile is removed from the list of records.
Removing custom threshold profiles
Procedure
To remove a custom threshold profile, only remove its association with a storage system or
performance object.
1. Select the storage system or performance object record and click Edit. For more information,
see “Editing monitored settings for a storage system or performance object” (page 76).
2. To remove the association, navigate to the Configure Threshold Profile section in the HP P6000
Performance Advisor – Edit wizard.
3. Select None from the Select threshold profile list to remove the Custom threshold profile settings.
4. Click Finish on the last window to save the changes.
Managing configured dashboard profiles
This section describes how to manage the configured dashboard profiles in HP P6000 Performance
Advisor.
Viewing configured dashbaord profiles
Procedure
To view dashboard profile settings configured in an instance of HP P6000 Performance Advisor:
1. In the Navigation pane, click Settings.
2. From the list, click the plus (+) sign for an HP P6000 Performance Advisor instance.
3. From the list, select Configuration and click the Performance tab in the Content pane.
4. In the Configure HP P6000 Performance Advisor for Monitoring window, click the Threshold
and Dashboard Profiles tab.
Managing configured settings in HP P6000 Performance Advisor 81
Page 82

5. Select the Profile View For as Dashboard.
A table of configured dashboard profiles is displayed with the records sorted in an alphabetical
order. The following table describes the data:
Displays name of the dashboard profile.Profile Name
Controller Model
6. If the table is blank, click Add.
Editing a configured dashboard profile
IMPORTANT:
• Multiple dashboard profiles cannot be edited at a time.
• Renaming a dashboard profile is not allowed. In this case, you must create a dashboard
profile with a new name.
Procedure
To edit a dashboard profile in HP P6000 Performance Advisor:
1. Follow the first four steps in “Viewing configured dashbaord profiles” (page 81) to access the
Threshold and Dashboard Profiles tab.
2. Select the Profile View For as Dashboard.
3. In the table, select the check box for a dashboard profile record.
4. Click Edit.
The Edit a dashboard profile dialog box displays the selected dashboard profile name and
associated object type as read-only data.
Displays the controller model number of the storage
system.
Displays the profile type as User Defined.Profile Type
5. Configuring or modifying dashboard settings includes entering new Minor and Major threshold
values.
6. Click OK.
The modified dashboard profile appears in the table under the Threshold and Dashboard Profiles
tab (sorted in an alphabetical order). For more information, see “Viewing configured dashbaord
profiles” (page 81).
Removing dashboard profiles
NOTE: Dashboard profiles can be removed only if they are not associated with any storage
system. To remove a dashboard profile, you must first remove its association with the storage
system and then follow the below steps:
1. Navigate to the dashboard settings for that storage system.
2. Select None or another dashboard profile from the Select Dashboard profile list in the Configure
Dashboard Profile section.
3. Click Save Changes.
Procedure
To remove dashboard profiles:
1. Complete the procedure mentioned under “Viewing configured dashbaord profiles” (page 81)
to access the Threshold and Dashboard Profiles tab.
2. Select the Profile View For as Dashboard.
82 Working with HP P6000 Performance Advisor
Page 83

3. In the table, select the check box for a dashboard profile and click Remove.
4. The Confirm Remove window prompts you to confirm, click OK.
The dashboard profile is removed from the list of records.
Managing additional settings
This section describes how to manage the configured settings for SMTP and SNMP notifications,
reports, charts, and key metrics.
To edit the configured reports, charts, and key metrics settings, see “Report settings” (page 63),
“Chart settings” (page 64), and “Key Metric settings” (page 65) respectively.
Email and SNMP notification settings
Procedure
To view and edit the configured SMTP and SNMP settings:
1. In the Navigation pane, click Settings.
2. From the list, click the plus (+) sign for an HP P6000 Performance Advisor instance.
3. From the list, select Events and click the Performance tab.
4. Under the Performance tab in the Content pane, click the Configure Notification tab.
The configured SMTP and SNMP settings appear in the Email Settings and SNMP Settings sections
respectively and include the following details:
Email Settings
• Source SMTP server IP address or host name, and the communication number of the port
• Source email address to dispatch threshold and data collection alarm email notifications
• Destination email addresses to receive threshold and data collection alarm email notifications
• Subject line for the threshold and data collection alarm email notifications
SNMP notifications
• SNMP Version
• SNMPv3 Options (if the selected SNMP Version is SNMPv3)
• Community name (Public or Private) for the SNMP server
• Destination SNMP IP and port addresses
In addition, the following are also displayed if they are specified:
• Login credentials to access the SMTP server (if authentication is required)
• Option to receive alarms when performance values drop below threshold levels
HP P6000 Performance Advisor dispatches the threshold notifications and SNMP traps based on
the configured settings. If the SMTP and SNMP settings are not yet configured, the fields that display
the details are disabled. To configure SMTP and SNMP settings, see “SMTP and SNMP notification
settings” (page 66).
Viewing a summary of configured monitoring settings
The summary of configured monitoring settings is available for all monitored storage systems and
performance objects, and are displayed at the following levels:
• Storage systems
• Object type
• Performance object
Managing configured settings in HP P6000 Performance Advisor 83
Page 84

Procedure
To view a summary of monitoring settings configured for a storage system or performance object
in an instance of HP P6000 Performance Advisor:
1. In the Navigation pane, click Settings.
2. From the list, click the plus (+) sign for an HP P6000 Performance Advisor instance.
3. From the list, select Storage Systems.
The Storage Systems Summary Data window opens. To view the summary of configured
monitoring settings:
• For all storage systems, see “Summary of configured monitoring settings for storage
systems” (page 84).
• For all virtual disks, see “Summary of configured monitoring settings for virtual disks”
(page 84).
• For all hosts, see “Summary of configured monitoring settings for hosts” (page 85).
• For all disk groups, see “Summary of configured monitoring settings for disk groups”
(page 85).
• For all data replication groups, see “Summary of configured monitoring settings for data
replication groups” (page 86).
• For all controllers and host ports, see “Summary of configured monitoring settings for
controllers and host ports” (page 86).
• For all physical disks, see “Summary of configured monitoring settings for physical disks”
(page 87).
Summary of configured monitoring settings for storage systems
The summary of configured monitoring settings is displayed under the P6000 Monitoring tab for
all monitored storage systems and includes the following data:
The user-friendly name of the storage system.Storage System Name
Data Collection Polling Interval
Retention Period (Month(s))
Total Objects Monitored
Use the Filter by list to view storage system records that match the specified criteria. For more
information, see “Using the Filter by list” (page 16).
The performance and state data collection frequency set
for the storage system.
The number of months the performance and state data
pertaining to the storage system should be retained in the
HP P6000 Performance Advisor database.
The number of performance objects added for monitoring,
including the storage system for which you are viewing the
configured monitoring settings summary.
Total Objects Monitored count does not include the
monitored data replication tunnels.
Summary of configured monitoring settings for virtual disks
The summary of configured monitoring settings is displayed under the Virtual Disks tab for all virtual
disks monitored by a specific instance of HP P6000 Performance Advisor across storage systems,
and includes the following data:
The user-friendly name of the virtual disk.Virtual Disk Name
The path where the virtual disk object resides.Folder
84 Working with HP P6000 Performance Advisor
Page 85

Object Type
The type of virtual disk, such as snapshot, virtual disk,
mirror-clone.
The disk group to which the virtual disk belongs.Disk Group
Displays one of the following:Threshold Profile
• Name of the threshold profile, if you applied one.
• Custom, if you selected counters and specified threshold
levels when adding the performance objects.
• Blank, if you did not apply or specify threshold settings.
State Monitoring Enabled
Storage System Name
Object exists
You can also view the summary segregated for the set of virtual disks that belong to a specific
storage system (Settings > HP P6000 Performance Advisor Instance > Storage Systems > Individual
storage system > Virtual Disks).
Use the Filter by list to view virtual disk records that match the specified criteria. For more
information, see “Using the Filter by list” (page 16).
Summary of configured monitoring settings for hosts
The summary of configured monitoring settings is displayed under the Hosts tab for all hosts
monitored by a specific instance of HP P6000 Performance Advisor across storage systems, and
includes the following data:
You can also view the summary segregated for the set of hosts that belong to a specific storage
system (Settings > HP P6000 Performance Advisor Instance > Storage Systems > Individual storage
system > Hosts).
Use the Filter by list to view host records that match the specified criteria. For more information,
see “Using the Filter by list” (page 16).
Displays Yes or No, depending on whether you enabled
state data collection for the performance object.
Displays the storage system to which the performance
object belongs.
Displays Yes, if the performance object exists in the storage
system.
This data is updated per the specified state data collection
frequency for the corresponding storage system. If a
performance object is removed in a storage system, the
Object Exists column shows No, only when the state data
for that performance object is updated in HP P6000
Performance Advisor.
Summary of configured monitoring settings for disk groups
The summary of configured monitoring settings is displayed under the Disk Groups tab for all disk
groups monitored by a specific instance of HP P6000 Performance Advisor across storage systems,
and includes the following data:
The user-friendly name of the disk group.Disk Group Name
Disk Type
Managing configured settings in HP P6000 Performance Advisor 85
The type of disks in the disk group (Online, Near online,
or Solid state).
Page 86

Virtual Disk Group Threshold Profile, Physical Disk Group
Threshold Profile
If you created threshold profiles for the virtual disk group
and physical disk group, one of the following is displayed
for each:
• Name of the threshold profile if you applied one.
• Custom, if you selected counters and specified threshold
levels when adding the performance objects.
• Blank, if you did not apply or specify threshold settings.
State Monitoring Enabled, Storage System Name, Object
exists
See “Summary of configured monitoring settings for virtual
disks” (page 84).
You can also view the summary segregated for the set of disk groups that belong to a specific
storage system (Settings > HP P6000 Performance Advisor Instance > Storage Systems > Individual
storage system > Disk Groups).
Use the Filter by list to view disk group records that match the specified criteria. For more
information, see “Using the Filter by list” (page 16).
Summary of configured monitoring settings for data replication groups
The summary of configured monitoring settings is displayed under the Data Replication tab for all
data replication groups monitored by a specific instance of HP P6000 Performance Advisor across
storage systems, and includes the following data:
The user-friendly name of the data replication group.Data Replication Group Name
Role
Threshold Profile, State Monitoring Enabled, Storage
System Name, Object exists
A dynamic property associated with a data replication
group. Includes two roles, source and destination, where
one data replication group becomes the source and the
other group becomes the destination.
See “Summary of configured monitoring settings for virtual
disks” (page 84).
You can also view the summary segregated for the set of data replication groups that belong to a
specific storage system (Settings > HP P6000 Performance Advisor Instance > Storage Systems >
Individual storage system > Data Replication).
Use the Filter by list to view data replication group records that match the specified criteria. For
more information, see “Using the Filter by list” (page 16).
Summary of configured monitoring settings for controllers and host ports
The summary of configured monitoring settings is displayed under the Controllers tab for all
controllers and host ports monitored by a specific instance of HP P6000 Performance Advisor
across storage systems, and includes the following data:
Under the Controllers tab:
The user-specified controller name.Controller Name
Under the Host Ports tab:
The controller associated with the host port.Controller Name
The storage system-specific host port name.Host Port Name
The unique WWN for the host port.Port WWN
The following data is applicable for the controllers and host ports, and is displayed under both tabs:
Threshold Profile, State Monitoring Enabled, Storage
System Name
See “Summary of configured monitoring settings for virtual
disks” (page 84).
86 Working with HP P6000 Performance Advisor
Page 87

You can also view the summary segregated for the set of controllers and host ports that belong to
a specific storage system (Settings > HP P6000 Performance Advisor Instance > Storage Systems
> Individual storage system > Controllers).
Use the Filter by list to view controller and host port records that match the specified criteria. For
more information, see “Using the Filter by list” (page 16).
Summary of configured monitoring settings for physical disks
The summary of configured monitoring settings is displayed under the Physical Disks tab for all
physical disks monitored by a specific instance of HP P6000 Performance Advisor across storage
systems, and includes the following data:
The user-friendly name of the physical disk.Physical Disk Name
Disk Type, Disk Group name, State Monitoring Enabled,
Storage System Name, Object exists
See “Summary of configured monitoring settings for virtual
disks” (page 84).
You can also view the summary segregated for the set of physical disks that belong to a specific
storage system (Settings > HP P6000 Performance Advisor Instance > Storage Systems > Individual
storage system > Physical Disks).
Use the Filter by list to view physical disk records that match the specified criteria. For more
information, see “Using the Filter by list” (page 16).
Summary of configured monitoring settings for storage systems
The configured monitoring settings summary constituting the data collection polling intervals and
retention period is displayed under the Summary tab for every monitored storage system. In addition,
the license type of the storage system is also displayed.
Procedure
To view the summary:
1. Follow the first three steps in “Viewing a summary of configured monitoring settings” (page
83) to access the Storage Systems in the Navigation pane.
2. From the list, select a storage system.
The Summary Data window displays the following monitoring settings summary data.
Data Collection Polling Interval for:
Performance and State data retention period
Data Replication Tunnel Selected for Data Collection
XCOPY & WSAME Supported
License Status
Managing configured settings in HP P6000 Performance Advisor 87
• Performance Data. The performance data collection
frequency that you configured for the storage system.
• State Data. The state data collection frequency that you
configured for the storage system.
Displays the number of months that the performance and
state data pertaining to the storage system should be
retained in the HP P6000 Performance Advisor database.
Displays Yes or No depending on whether you chose to
collect data replication tunnels data while configuring the
monitoring settings for a storage system.
Displays Yes or No depending on whether the storage
system supports XCOPY & WSAME feature.
Displays the current license status for the storage system.
For more information, see “Licensing behavior in HP P6000
Performance Advisor” (page 88).
Displays the license type for the storage system.License Type
Page 88

Viewing the HP P6000 Performance Advisor configuration summary
The configuration summary includes:
• The server configuration where the selected instance of HP P6000 Performance Advisor is
installed
• The storage systems monitored by the selected instance of HP P6000 Performance Advisor
and their monitoring status
Procedure
To view the configuration summary for an instance of HP P6000 Performance Advisor:
1. In the Navigation pane, click Settings.
2. From the list, select an HP P6000 Performance Advisor instance.
The HP P6000 Performance Advisor Summary window displays the following configuration summary.
IP Address
Version
Service Status
The server IP address where the selected instance is
installed.
The server name where the selected instance is installed.Host Name
The installed version in the following format: <version
number>:<date installed>_<time installed>.
The port dedicated for the selected instance (default: 2376).Port Number
The current status of the HP P6000 Performance Advisor
Server service followed by the date and time stamp.
The table displays the storage systems added for monitoring in the HP P6000 Performance Advisor
instance. The following information is displayed:
The user-friendly name of the storage system.Storage System Name
The unique WWN of the storage system.Storage System WWN
Monitoring Status
The status of performance data collection for the storage
system, which can be one of the following:
• Green icon (Active): Performance data collection is in
progress and no errors are reported
• Red icon (Failed): Performance data collection has
failed, an error is reported on the Event Log pane
• Grey vertical lines (Disabled): Performance data
collection is manually stopped or because license is
invalid
• (Incomplete): Partial performance data is being collected
because only one controller is accessible; an error is
reported on the Event Log pane
To know more about licensing, see “Licensing behavior in
HP P6000 Performance Advisor” (page 88).
If the storage systems are not yet added, this table appears blank. To add storage systems for
monitoring, see “Adding storage systems” (page 55).
Licensing behavior in HP P6000 Performance Advisor
This section describes the licensing behavior in HP P6000 Performance Advisor.
When the HP P6000 Command View suite is installed for the first time, the 60-days Instant-on
evaluation license is available during which period a storage system and corresponding performance
objects can be added for monitoring in HP P6000 Performance Advisor. HP P6000 Performance
88 Working with HP P6000 Performance Advisor
Page 89

Advisor provides the license details, such as the license type and status for a storage system. The
details are shown on the following pages.
• Under the Summary tab (Settings > HP P6000 Performance Advisor Instance > Storage Systems
> Individual storage system), see “Viewing configured monitoring settings for storage systems”
(page 73).
• Under the Monitoring tab (Settings > HP P6000 Performance Advisor Instance > Configuration),
see “Viewing configured monitoring settings for storage systems” (page 73).
License states
Following are the different license states shown in HP P6000 Performance Advisor for a storage
system:
• Evaluation: If the Instant-on license is active, the license status shows as Evaluation. The
Instant-on period is valid for 60 days, counted from the day of installation.
• Valid: If a permanent or temporary license is installed for the storage system in HP P6000
Command View. The license status shows Valid and the license type shows Permanent or
Temporary depending on the type of license installed. For a Temporary license, the number
of remaining license days is also shown.
• Invalid (not licensed): Following are the two situations:
If a storage system was monitored during the Instant-on period or a temporary license
◦
was installed, and when either of them expired, the data collection stops immediately.
The license status changes to Invalid and the corresponding tool tip shows Not licensed
when you move the pointer over the license status. As the storage system was already
monitored during the Instant-on period, the historical performance data is still available.
◦ If you try to add a storage system for which a license is not installed or invalid, that
storage system record appears disabled in the list of available storage systems.
• Invalid: If the license has expired for a storage system, the following message appears on all
pages in the Storage Systems point of view (Storage Systems > Storage Network > Individual
Storage System) in HP P6000 Performance Advisor, and data collection stops immediately:
The license for the selected storage system has expired. So, you can only view reports and
create historical charts.
Additionally, the following message appears on all pages in the Settings point of view in HP
P6000 Performance Advisor:
The license has expired for the selected storage system. Please verify and update the license.
• Unknown: If HP P6000 Command View is inaccessible.
HP P6000 Performance Advisor updates the license status for all monitored storage systems
during the night by fetching the license data from the HP P6000 Command View instance that
is managing the storage systems. If the instance is inaccessible during this period, an event
is logged in the first attempt and HP P6000 Performance Advisor continues reaching HP P6000
Command View at the same time for the next two consecutive days, after which it stops the
performance data collection for the storage systems. The license status changes to Unknown
for the storage systems.
For Invalid and Unknown license states (except for the one where the storage system cannot be
added), you can only view data in both the Settings and Storage Systems point of view. Additionally,
in the Storage Systems point of view, you can view generated reports and plot charts for historical
data collected for the storage system. However, you will not be able to perform any storage
system-related tasks, such as adding storage systems, configuring monitoring settings for storage
systems, or viewing related performance metrics like threshold summary, key metrics, dashboard
data.
Managing configured settings in HP P6000 Performance Advisor 89
Page 90

For license expiry, install the required license for the storage system in HP P6000 Command View
and click Update Object Status in HP P6000 Performance Advisor for that storage system. This
action updates the license status in HP P6000 Performance Advisor. To install and manage licenses
for a storage system, see the HP P6000 Command View User Guide. To update object status, see
“Updating the object state for a storage system” (page 78).
Viewing performance metrics of storage systems
This section describes various performance metrics, such as the following for a monitored storage
system and performance object:
• “Viewing the Dashboard Overview” (page 90)
• “Viewing a threshold summary” (page 101)
• “Viewing a summary of key metrics” (page 108)
• “Managing charts” (page 119)
• “Viewing and managing reports” (page 121)
You can create charts and generate reports, and view the threshold and key metrics summary of
all performance objects in an object type.
IMPORTANT:
• The performance data displayed is always with respect to the current monitored storage
systems and corresponding performance objects. HP P6000 Performance Advisor does not
display data for unmonitored objects.
• Statistics data is only based on actual data collected at the daily polling interval.
• Sequence of data displayed in charts and reports, and statistics displayed in reports, key
metrics, and KPI may differ if the selected time is within the Daylight Savings Time period.
• If data from a storage system is being collected at 30-second intervals, a total of 400 data
points will be collected in a 3-hour and 20-minute period. So, if you plot a chart for 3 hours
and 20 minutes or less, all data samples collected are plotted, but if you want to view data
for any duration more than 3 hours and 20 minutes, one data sample is displayed for every
hour, which are average of all the data samples collected for every hour. In such cases, if
statistical table is also displayed, it might not match with the chart data samples. To understand
how the aggregated values are calculated, refer to the first two list items in the important note
provided for Key Metrics (see “Key Metrics” (page 20)).
WARNING! Data displayed on the P6000 Performance Advisor windows reflects the time zone
in which the server is located. HP strongly recommends that you do not modify the date and time
on your server, as it can result in irreversible data loss.
Viewing the Dashboard Overview
The dashboard for a storage system shows the overall performance of the storage system through:
• Charts that can display live or historical data samples of the storage system
• Statistical table that provides data based on historical performance of the storage system
Dashboard also constitutes the Key Performance Indicators that you configure to monitor the health
of your storage system. A Key Performance Indicator includes the performance object that you
monitor for a specific counter, which acts as key indicator to help you analyze the performance
of your storage system. Dashboard always pertains to a storage system. It is not available specifically
at the object type or performance object levels. You can choose to view the dashboard on
performance data collected over a duration (1 hour (minimum) and 24 hours (maximum)). By
default, the performance data collected over 1 hour is displayed.
90 Working with HP P6000 Performance Advisor
Page 91

Procedure
To access the Dashboard Overview tab for a monitored storage system:
1. In the Navigation pane under Storage Systems, click the plus (+) sign for Storage Network.
2. From the list, select the storage system and click the Performance tab in the content pane.
The Dashboard Overview page appears.
The Dashboard > Overview tab displays the following sections:
For more information...DescriptionDashboard overview sections
Storage System – Live Host Port Throughput and Latency Values
Key Performance Indicators
Storage System level performance
charts
This frame displays live throughput
and latency values aggregated from
host ports across controllers and
storage system under monitoring.
A statistical table that displays basic
statistics based on historic
performance of the configured KPI
records. The advanced statistics is
displayed under the Key Performance
Indicators tab. In addition, the chart
corresponding to a KPI record appears
in the Key Performance Indicators
Chart section.
Select and view performance charts
relevant to the storage system. They
include the Host Port IOPS Historical
chart, the Host Port IO Latencies
Historical chart, and the Threshold
Summary chart.
Storage System – Live Host Port Throughput and Latency Values
This section of Dashboard Overview tab contains the live bar-chart that indicates the current overall
performance of the storage system. The data is constantly refreshed at five-second intervals and
appears for the following storage-system-specific dashboard counters that are the health indicators
for your storage system:
See “Storage System – Live Host Port
Throughput and Latency Values”
(page 91)
See “Key Performance Indicators –
Dashboard” (page 97)
See “Storage System level performance
charts” (page 94)
• Total Read Req/s
• Average Read Latency (ms)
• Total Write Req/s
• Average Write Latency (ms)
For a description of dashboard counters, see “Dashboard counters” (page 98).
Each live data sample displayed for a dashboard counter constitutes the current throughput or
latency of all the host ports from both the controllers associated with the storage system. The value
signifies the current aggregate or average performance of all host ports across controllers in the
storage system.
For the live data samples to appear for a storage system, you must configure the minor and major
threshold levels for the following counters in the Summary Data window, under the Dashboard
Settings tab:
• Read Req/s
• Read Latency (ms)
• Write Req/s
• Write Latency (ms)
Viewing performance metrics of storage systems 91
Page 92

Select Dashboard profile drop-down lists the dashboard profiles associated with the controller
model. Based on the dashboard profile linked to the selected storage system, Major and Minor
threshold levels are displayed. It is possible to select a different dashboard profile from the Select
Dashboard Profile drop-down list and view the live Host Port Throughput and Latency Values at a
particular instant of time. The selected dashboard profile is not saved.
The threshold values you specify are used to monitor the performance of each host port in the
storage system. The threshold values also appear as reference points in the live bar-chart and help
you analyze if the live data sample shown for a specific dashboard counter is within or exceeded
the specified threshold limit. If minor and major threshold levels are not configured, a grey status
bar with the current performance value in the center is displayed. For more information on
configuring dashboard threshold levels, see “Configuring dashboard settings” (page 62).
The following example shows the dashboard live bar chart for a storage system:
Figure 2 Live bar chart
92 Working with HP P6000 Performance Advisor
3 Minor threshold level2 Status bar showing color blocks1 States and status icons
5 Major threshold level4 Current performance data sample
Page 93

Click to create Dashboard profile navigates to the Threshold and Dashboad Profiles tab. Select
Dashboard from the Profile View For drop-down window.
The Threshold monitoring status bars are displayed in the live bar chart for each of the dashboard
counter. Status icons that indicate different states (Normal, Minor, or Major) appear above the
threshold monitoring status bars. The live data sample appears in the center of a threshold monitoring
status bar. The values displayed below a threshold monitoring status bar indicate the minor and
major threshold levels that are the reference points for the live data sample. Appropriate color
blocks in the threshold monitoring status bars signify a state based on whether the current
performance is within or exceeded the threshold levels. The status icons also appear on the right
hand corner of each threshold monitoring status bar and dynamically change based on the current
performance. The live bar chart data is constantly refreshed at five-second intervals. To interpret
a live bar chart, see “Understanding a live bar chart” (page 94).
The Drill down further link helps you to carry forward the dashboard profile to the Host Port
Performance tab. If the Drill down further link is not selected, then the Host Port Performance tab
has the same dashboard profile as selected in the Dashboard Settings Page.
Correlation between color blocks and status icons – Live bar chart
The following table correlates the color blocks and states to the status icons in the live bar chart:
within the minor threshold level.
Color in the status barDescriptionState and status icons
GreenNormal: The current performance is
has exceeded the minor threshold level
but is still within the major threshold
level.
exceeded the major threshold level
and needs immediate attention.
Viewing performance metrics of storage systems 93
YellowWarning: The current performance
OrangeCritical: The current performance has
Page 94

NOTE: Even if the performance exceeds the Major threshold level, the color in the status bar
shows orange.
Understanding a live bar chart
Interpret the live bar chart in Figure 2 (page 92) as follows:
• Total Read Req/s counter:
The 2000 and 3000 values are the minor and major threshold levels set for the Total
◦
Read Req/s counter.
◦ The 4064 value indicates the total read requests processed by all the host ports so far
have crossed the major threshold level. The storage system is handling high read requests
and needs immediate attention.
◦ The status bar shows an orange color block, which correlates to the state.
• Average Read Latency (ms) counter:
The 2 and 5 values are the minor and major threshold levels set for the Average Read
◦
Latency (ms) counter.
◦ The 0.72 value indicates the average read latency observed on all the host ports so far
are within the minor threshold level.
◦ The status bar shows a green color block, which correlates to the state.
• Total Write Req/s counter:
The 2000 and 5000 values are the minor and major threshold levels set for the Total
◦
Write Req/s counter.
◦ The 2016 value indicates the total write requests processed by all the host ports so far
have crossed the minor threshold level, but is still within the major threshold level.
◦ The status bar shows an yellow color block, which correlates to the .
• Average Write Latency (ms) counter:
The 2 and 5 values are the minor and major threshold levels set for the Average Write
◦
Latency (ms) counter.
◦ The 1.16 value indicates the average write latency observed on all the host ports so far
are within the minor threshold level.
◦ The status bar shows a green color block, which correlates to the state.
Storage System level performance charts
By default, this section of the Dashboard Overview tab displays the following performance charts
for the duration that you selected under the Dashboard Settings tab (see “Configuring dashboard
settings” (page 62)):
• Host Port IOPS Historical chart
• Host Port IO Latencies chart
• Threshold Summary chart (default)
Procedure
To view a storage system level performance chart for a different duration:
1. Select the performance chart that you want to view from the View list and click OK.
94 Working with HP P6000 Performance Advisor
Page 95

2. Select the predefined interval or custom duration from the Display list. For more information
on Display list, “Using the Display option” (page 15).
Host Port IOPS Historical chart
This chart displays the total read request and total write request values.
Host Port IO Latencies chart
This chart displays the average read latency and average write latency values.
Threshold Summary chart
This chart provides a state-wise analysis of the current total threshold-monitored objects for every
object type. A threshold monitoring status bar for each object type displays appropriate color
blocks to indicate the total number of objects in each state for any threshold monitored counter
during the selected duration. The state for each object is based on its performance data compared
against the set threshold levels for the selected counter and duration.
NOTE: The total threshold monitored objects count does not include monitored data replication
tunnels.
For more information on mapping between status icons and color blocks, see “Correlation between
color blocks and status icons – Threshold Summary chart” (page 96). To interpret a Threshold
Summary Chart, see “Understanding the Threshold Summary chart” (page 96).
The following example shows a Threshold Summary chart:
Click the object type links to navigate to the respective object type folders in the Navigation pane.
At the object type folder, you can do either of the following:
• Click the object type folder to view the summary under the Threshold Summary tab in the
Content pane. A list of threshold monitored performance objects and the threshold summary
value of each object for the respective counter is shown. To view threshold summary for a
Viewing performance metrics of storage systems 95
Page 96

performance object, click the performance object link. For more information, see “Threshold
summary for a performance object” (page 106).
• Click the plus (+) sign for the object type folder and then select the performance object for
which you want to view the threshold summary. The data appears under the Threshold Summary
tab.
For more information, see “Threshold summary for a performance object” (page 106).
Correlation between color blocks and status icons – Threshold Summary chart
The following table correlates the color blocks in the threshold monitoring status bars to the status
icons in a Threshold Summary chart:
Color in threshold monitoring status barDescriptionState and status icons
GreenNormal: The performance is within the
minor threshold level.
YellowWarning: The performance has
exceeded the minor threshold level but
is still within the major threshold level.
OrangeCritical: The performance has
exceeded the major threshold level
and needs immediate attention.
GrayNot Threshold Monitored: The
performance is not threshold
monitored.
Understanding tool tip - Threshold Summary chart
Move the pointing device over a color block in the threshold monitoring status bar to view
information about the color block, such as the following:
• Status: The current state of all performance objects
• Object type: The object type to which the performance objects belong
• Value: The total number of performance objects that are in a specific state
If performance objects in an object type are not threshold monitored for the selected duration, the
corresponding tool tip shows the status as Not threshold monitored:
Understanding the Threshold Summary chart
Interpret the “Threshold Summary chart” (page 95) as follows:
The Threshold Summary chart is displayed for performance during the last hour (based on the HP
P6000 Performance Advisor management server date and time). Following is the observation for
the Virtual Disks and Host Connections object types:
96 Working with HP P6000 Performance Advisor
Page 97

• Virtual Disk object type:
A total of 52 virtual disks are threshold monitored.◦
◦ The threshold monitoring status bar is green for the 27 virtual disks that have been in the
state and orange for the remaining 25 virtual disks that have been in the
state.
• Host Connections object type:
A total of four host connections are threshold monitored.◦
◦ The threshold monitoring status bar is green for two host connections that have been in
the state, yellow for the third host connection that has been in the state,
and orange for the fourth host connection that has been in the state.
You can click the Virtual Disks or Host Connections object type link to view the object type threshold
summary which lists performance objects and their threshold monitoring status.
Key Performance Indicators – Dashboard
NOTE: To know what is a KPI, see “KPIs” (page 20).
By default, this section of the Dashboard > Overview tab displays the following details for KPI
records that you configured under the Key Performance Indicators tab and for the duration that
you specified under the Dashboard Settings tab (see “Configuring dashboard settings” (page 62)):
• Performance object that is monitored
• Object type to which the performance object belongs
• Controller through which data is collected. If the data is collected by both Controller A and
Controller B, the aggregate is shown.
• Counter selected for the KPI record. Click the link for a Counter to view the corresponding
performance object chart. By default, the chart for the first KPI record is displayed in this
section (if KPI records are already configured). All the performance data samples collected
during the selected duration are displayed in the chart and the recent value shown in the
statistical table.
• Recent value and basic (Avg, Min, Max) statistical data (displayed by default).
You can also view the advanced statistical data that includes the standard deviation, 90th,
95th, and 99th percentile values in addition to the basic statistics. The statistical data with the
exception of the recent value is derived for the duration that you configured while adding a
KPI. For more information about, see “Statistical data” (page 30).
Additionally, the statistical data can also be displayed for the predefined interval or custom duration
that you select. To select a different predefined interval or custom duration, see “Using the Display
option” (page 15).
Click the Advanced Statistics link to view additional statistical data for all the KPI records under
the Key Performance Indicators tab. For more information about, see “Statistical data” (page 30).
For more information on charts, see “Viewing charts” (page 114).
Viewing performance metrics of storage systems 97
Page 98

Dashboard counters
The following table describes the dashboard counters for the storage system, controller, and host
port:
DescriptionCounters supportedDashboard performance object
Total read throughput (Req/s)Storage system
Average read latency
Total write throughput (Req/s)
Average write latency
Total read throughput (Req/s)Controller
Average read latency
Total write throughput (Req/s)
Average write latency
Average queue depthHost Port
Sum of read throughput of all the host
ports across both the controllers.
Weighted read latency with read
requests of all the host ports across both
the controllers.
Sum of write throughput of all the host
ports across both the controllers.
Weighted write latency with write
requests of all the host ports across both
the controllers.
Sum of read throughput of all the host
ports in the selected controller.
Weighted read latency with read
requests of all the host ports in the
selected controller.
Sum of write throughput of all the host
ports in the selected controller.
Weighted write latency with write
requests of all the host ports in the
selected controller.
Average queue depth of the selected
port.
Read Req/s
Write Req/s
Viewing the Dashboard Host Port Performance
From the Dashboard→Overview tab, you can further drill down to view live and historical data
for controllers and host ports associated with the storage system.
Procedure
To access the Dashboard Host Port Performance tab for a monitored storage system:
1. In the Navigation pane under Storage Systems, click the plus (+) sign for Storage Network.
2. From the list, select the storage system and click the Performance tab in the Content pane.
3. Under the Dashboard tab, click the Host Port Performance tab to perform the desired action.
Read throughput (Req/s) of the selected
port.
Read latency of the selected port.Read Latency (ms)
Write throughput (Req/s) of the selected
port.
Write latency of the selected port.Write Latency (ms)
98 Working with HP P6000 Performance Advisor
Page 99

The Dashboard > Host Port Performance tab displays the following sections:
Dashboard Host Port Performance
sections
More informationDescription
Live Data
Live Data
Historical Statistical Data
Charts
and host ports associated with the
storage system. In addition, you can
view the same live data for the storage
system that already appears under the
Dashboard→Overview tab.
The statistical table of basic and
advanced historical statistical data for
the selected storage system, controller,
or host port. The data displayed is for
the same set of counters for which the
live data is shown. You can view
charts for the respective counters in
the Charts section.
samples for the storage system,
controller, or host port record listed in
the Historical Statistical Data section.
See “Live Data” (page 99)The live data samples for controllers
See “Historical Statistical Data”
(page 100)
See “Charts” (page 100)The historical performance data
This section displays the live bar-chart, where you can view live data samples for a controller or
host port. In addition, you can view live data for the storage system too, which is the same live
data that is already being shown under the Dashboard→Overview tab. The data samples displayed
for a host port indicates the current read and write I/O requests, and average latencies observed
with that specific host port. The data appears for a set of dashboard counters that are health
indicators for the selected storage system, controller, or host port. For a brief description of each
dashboard counter, see “Dashboard counters” (page 98).
By default, this section displays data for a storage system. To view live data for a controller or host
port, choose that performance object in the Select a performance object list. The Live Data and the
Historical Statistical Data sections are refreshed for the selected performance object. For more
information on statistical data shown, see “Historical Statistical Data” (page 100).
The threshold levels displayed for the following are based on:
• Storage System: The configured threshold values for the dashboard counters under the
Dashboard Settings tab are considered (see “Configuring dashboard settings” (page 62)).
• Controller: The same threshold values configured for the dashboard latency counters (Average
Read Latency(ms), Average Write Latency(ms)) for the storage system are considered. However,
for the I/O counters (Total Read Req/s, Total Write Req/s), the threshold values are considered
as half of the corresponding threshold values configured for the dashboard I/O counters.
• Host Port: If a threshold profile is configured and associated with the host port, the
corresponding threshold values are considered.
The interpretation of live data for a controller or host port is similar to that of a storage system. For
more information, see “Storage System – Live Host Port Throughput and Latency Values” (page 91).
For more information on configuring dashboard settings, see “Configuring dashboard settings”
(page 62).
For more information on configuring and associating threshold profiles, see “Adding threshold
profiles” (page 60).
Viewing performance metrics of storage systems 99
Page 100

Historical Statistical Data
This section displays the basic (default) and advanced statistical data for a storage system (default),
controller, or host port for the different dashboard counters. The data is derived from the historical
performance data and shown for the duration that you select (default 1 hour). To view data for a
controller or host port, choose that performance object in the Select a performance object list. This
section is automatically refreshed to show data for the selected performance object. The Live Data
section is also simultaneously updated for the selected object. For more information, see “Live
Data” (page 99).
To view the advanced statistical data, select Advanced Statistics in the View list, and click OK. To
select a different predefined interval or custom duration, see “Using the Display option” (page 15).
Click the link provided for a counter in the statistical table to view the chart for the associated
performance object in the Charts section. All the performance data samples collected during the
selected duration are displayed and includes the recent value in the statistical table. By default,
the chart for the first record is displayed in the Charts section. For more information about, see
“Statistical data” (page 30).
For more information on the dashboard counters, see “Dashboard counters” (page 98).
Charts
This section displays the historical performance data samples of the object for the counter that you
select in the Historical Statistical Data section. In addition, the minor and major threshold levels
are also displayed, if the object has been threshold monitored for the selected duration. By default,
this section displays the chart for the first record in the Historical Statistical Data section.
For more information on charts, see “Viewing charts” (page 114).
Viewing and managing the Dashboard KPIs
You can add, view, and manage KPI records under the Dashboard→Key Performance Indicators
tab. If KPI records are already configured, they are listed in the table under the Key Performance
Indicators tab.
Procedure
To access the Key Performance Indicators tab for a monitored storage system:
1. In the Navigation pane under Storage Systems, click the plus (+) sign for Storage Network.
2. From the list, select the storage system and click the Performance tab in the Content pane.
3. Under the Dashboard tab, click the Key Performance Indicators tab to add, view, or remove
KPI records.
Adding KPI records
To add KPI records:
1. Follow the steps to access the Key Performance Indicators tab. For more information, see
“Procedure” (page 100).
2. Click Add.
3. In the Add Key Performance Indicators window, select the object type and controller from the
respective lists. This action segregates the performance objects that you want to view and
add.
The Select Controller list is disabled for the Data Replication Tunnel, Storage System, Controller,
and Host Port object types.
4. Select the combination of performance object and counter that you want to add as a KPI
record.
Only the counters supported for the chosen object type are listed for selection.
100 Working with HP P6000 Performance Advisor
 Loading...