

Page 1

HP Insight Capacity Advisor 6.2 User Guide
HP Part Number: T8670-90019
Published: November 2010
Edition: 2
Page 2

© Copyright 2006, 2010 Hewlett-Packard Development Company, L.P.
Confidential computersoftware. Valid license from HP required for possession, use or copying. Consistent with FAR 12.211 and 12.212, Commercial
Computer Software, Computer Software Documentation, and Technical Data for Commercial Items are licensed to the U.S. Government under
vendor's standard commercial license.
The informationcontained hereinis subject to change without notice. Theonly warranties for HP productsand servicesare setforth in the express
warranty statements accompanying such products and services. Nothing herein should be construed as constituting an additional warranty. HP
shall not be liable for technical or editorial errors or omissions contained herein.
Acknowledgments
HP-UX Release 10.20 and later and HP-UX Release 11.00 and later (in both 32 and 64-bit configurations) on all HP 9000 computers are Open
Group UNIX 95 branded products.
UNIX is a registered trademark of The Open Group.
Intel and Itanium are trademarks or registered trademarks of Intel Corporation or its subsidiaries in the United States and other countries.
Microsoft and Windows are U.S. registered trademarks of Microsoft Corporation.
Revision history
Number
EditionDocument Part
Publication DateSupported Operating SystemsSoftware
Version
November 2010See the HP Insight Software 6.2 Support Matrix.6.2.02T8670-90019
October 2010See the HP Insight Software 6.2 Support Matrix.6.2.01T8670-90019
Page 3

Table of Contents
1 Introduction...................................................................................................................11
Setup considerations.............................................................................................................................12
Licensing requirements...................................................................................................................12
Installation.......................................................................................................................................12
Collection methods..........................................................................................................................12
Disk space requirements..................................................................................................................12
Credentials.......................................................................................................................................13
Dependencies...................................................................................................................................13
Upgrades and reinstallation.................................................................................................................13
Upgrading agents on HP-UX or OpenVMS managed systems......................................................13
Navigating within HP SIM, Virtualization Manager, and Capacity Advisor......................................13
2 Features.........................................................................................................................15
Data collection.......................................................................................................................................16
Data collection infrastructure..........................................................................................................16
Supported collection configurations...............................................................................................17
Comparison of agentless and UP data collection............................................................................18
HP PMP data differs from Utilization Provider data......................................................................19
Differences in memory data ......................................................................................................19
Differences in network data ......................................................................................................19
Related topics........................................................................................................................19
Experimentation....................................................................................................................................20
Sizing for service level objectives..........................................................................................................21
Modeling considerations......................................................................................................................22
Capacity Advisor commands...............................................................................................................22
3 Key Capacity Advisor concepts..................................................................................23
Capacity planning goals.......................................................................................................................23
Quality of service ............................................................................................................................23
Utilization monitor, calculator, and simulator.....................................................................................23
Data handling for virtual machines.................................................................................................23
Data normalization..........................................................................................................................24
Resources for which Capacity Advisor collects data............................................................................24
Upper bounds..................................................................................................................................24
Measuring and analyzing resource utilization.....................................................................................25
Peaks and sums................................................................................................................................25
Sampling interval.............................................................................................................................25
Headroom........................................................................................................................................25
Headroom star rating.................................................................................................................26
Interpreting the headroom star rating..................................................................................26
Missing or invalid data....................................................................................................................27
The affect of invalid data on HP Smart Solver solution finding................................................27
Utilization limits .............................................................................................................................27
Specifying utilization limits.......................................................................................................28
Sustained time limits.............................................................................................................28
Percentage of time limits.......................................................................................................28
Understanding utilization limit messages.................................................................................29
Percentage of allocation........................................................................................................29
With sustained limits............................................................................................................29
Table of Contents 3
Page 4

With percentage of time limits..............................................................................................29
Scope of utilization limits...........................................................................................................29
Adjusting power...................................................................................................................................30
Power cap data.................................................................................................................................30
Automating solution generation: HP Smart Solver..............................................................................31
HP Smart Solver: Types of solutions...............................................................................................31
Determining trends in Capacity Advisor.............................................................................................31
Aggregation of points in business interval bins..............................................................................32
Choosing an appropriate business interval...............................................................................32
Exclusion of data points..................................................................................................................32
Factors that affect data validity..................................................................................................32
Linear regression.............................................................................................................................33
Error analysis...................................................................................................................................33
Forecasting growth...............................................................................................................................33
The forecast model hierarchy..........................................................................................................33
Forecast model attributes................................................................................................................34
4 Planning with Capacity Advisor.................................................................................35
Getting ready........................................................................................................................................35
Task: Understand current resource usage............................................................................................35
Task: Plan server consolidation.............................................................................................................36
Understanding the consolidation task............................................................................................36
Example consolidation: Stacking applications on an existing server........................................36
Step 1: Determine which systems to consolidate..................................................................37
Step 2: Create a scenario.......................................................................................................37
Step 3: Edit the scenario........................................................................................................38
Automating the consolidation task.................................................................................................46
Example consolidation: Automating stacking on a “what-if” server........................................47
Step 1: Determine which systems to consolidate..................................................................47
Step 2: Create a scenario.......................................................................................................47
Step 3: Edit the scenario........................................................................................................48
Task: Estimating the effect of adding or moving processors................................................................51
Task: Determining where to put a workload using automated solution finding.................................52
Example: Determining where to put a workload............................................................................52
5 Procedures....................................................................................................................55
Accessing Capacity Advisor.................................................................................................................55
Gathering data for Capacity Advisor...................................................................................................55
Impact of data collection on managed system performance...........................................................56
Data collection options....................................................................................................................56
First data collection (or the automated nightly collection).............................................................58
Interpreting task results...................................................................................................................59
Error notification on the standard out tab.................................................................................59
Scheduling a data collection............................................................................................................60
Modifying a collection schedule......................................................................................................61
Removing a collection schedule......................................................................................................61
Updating collected data...................................................................................................................61
Updating collected data on all systems......................................................................................62
Updating collected data on selected systems.............................................................................62
Updating data displayed in a profile viewer.............................................................................62
Collecting data without using an agent..........................................................................................62
Listing systems currently in the configuration file....................................................................62
Setting advanced options in the agentless data collection file...................................................63
4 Table of Contents
Page 5

Data collection and the HP Insight Capacity Advisor Consolidation software..............................63
Using Capacity Advisor with consolidation software server data............................................64
Viewing the licensed servers in HP SIM....................................................................................64
Importing data for use in Capacity Advisor...................................................................................64
From the Optimize menu — Import HP OVPA data.................................................................64
From the Optimize menu — Import HP PMP data...................................................................65
From the command line.............................................................................................................66
Ascertaining the data collection availability for a set of servers................................................66
Possible sources of discrepancies in collected data.........................................................................66
No data collected for a managed node......................................................................................66
Data timestamp appears to be incorrect....................................................................................66
Dynamic memory in HP Integrity virtual machines.................................................................67
Producing graphs and reports..............................................................................................................67
Using the Profile Viewer..................................................................................................................67
Using the report wizard..................................................................................................................71
The report wizard.......................................................................................................................71
Creating an historic utilization report........................................................................................72
Creating a scenario utilization report........................................................................................73
Using the report wizard to create a scenario comparison.........................................................74
An example scenario comparison report..............................................................................74
Calculating a virtualization consolidation ratio...................................................................75
Creating a consolidation candidates report...............................................................................76
Creating a cost allocation report................................................................................................76
Creating a peak summary report...............................................................................................76
Creating a population report.....................................................................................................77
Creating a trend report...............................................................................................................77
Creating a power report.............................................................................................................78
Setting utilization limits........................................................................................................................78
Setting global utilization limits.......................................................................................................79
Adding a utilization limit...........................................................................................................79
Removing a utilization limit......................................................................................................79
Setting workload utilization limits..................................................................................................80
Adding a utilization limit...........................................................................................................80
Enabling or disabling the limit...................................................................................................80
Removing a utilization limit......................................................................................................80
Setting scenario-wide utilization limits...........................................................................................80
Adding a utilization limit...........................................................................................................80
Enabling or disabling the limit...................................................................................................81
Removing a utilization limit......................................................................................................81
Setting scenario workload utilization limits....................................................................................81
Adding a utilization limit...........................................................................................................81
Enabling or disabling the limit...................................................................................................81
Removing a utilization limit......................................................................................................82
Forecasting utilization..........................................................................................................................82
Defining forecast models.................................................................................................................82
Accessing the Global Forecast Model........................................................................................82
Defining the Global Forecast Model.....................................................................................83
Accessing the forecast model for a workload or system............................................................83
Defining the forecast model for a workload or system........................................................84
Accessing the forecast model for a scenario..............................................................................84
Accessing the forecast model for a workload within a scenario................................................85
Defining a forecast model..........................................................................................................85
Disabling a forecast model.........................................................................................................85
Enabling a forecast model..........................................................................................................85
Generating forecasts........................................................................................................................85
Table of Contents 5
Page 6

Viewing forecast data in a profile viewer..................................................................................86
Viewing forecast data in a utilization report.............................................................................86
Working with scenarios........................................................................................................................86
Creating a planning scenario...........................................................................................................86
Editing a scenario............................................................................................................................88
Controlling the data display............................................................................................................88
Change the meter style selection................................................................................................88
Change the data collection period by setting the data range.....................................................88
Change the meter representation...............................................................................................90
Copying a scenario..........................................................................................................................90
Renaming a scenario........................................................................................................................90
Undo/edit/review applied what-if actions in a scenario.................................................................91
To view applied what-if actions.................................................................................................91
To edit applied what-if actions...................................................................................................91
Modifying resource utilization values..................................................................................92
Deleting a scenario..........................................................................................................................92
Working with systems..........................................................................................................................93
Creating a system............................................................................................................................93
Adding an existing system..............................................................................................................94
Editing a system..............................................................................................................................94
Changing VMs to be servers............................................................................................................94
Change VMs to server................................................................................................................95
Changing servers to be VMs (manually).........................................................................................95
Change servers to be VMs..........................................................................................................95
Assigning VM hosts to a VMware DRS cluster in a scenario..........................................................96
Initially converting VM hosts to simulate a VMware DRS cluster............................................96
Adding VM hosts to a converted cluster...................................................................................97
Removing a VM host from a VMware DRS cluster...................................................................97
Removing a VMware DRS cluster from a scenario....................................................................97
Moving a virtual machine...............................................................................................................98
Removing a system..........................................................................................................................99
Editing network and disk I/O capacity...........................................................................................99
Getting there...............................................................................................................................99
Setting the upper bound values.................................................................................................99
Working with workloads....................................................................................................................100
Introduction...................................................................................................................................100
Creating a workload......................................................................................................................100
Editing a workload........................................................................................................................101
Moving a workload........................................................................................................................102
Move considerations.................................................................................................................102
Parking a workload........................................................................................................................104
Deleting a workload......................................................................................................................104
Working with power...........................................................................................................................104
Calibrating power within Virtualization Manager........................................................................105
Calibrating a single system......................................................................................................105
Calibrating multiple systems at once.......................................................................................107
Calibrating power within a scenario.............................................................................................107
Getting there.............................................................................................................................108
Calibrating a single system......................................................................................................108
Calibrating multiple systems at once.......................................................................................109
Automating time-consuming simulations..........................................................................................109
Automated solution finding: System consolidation to VMs.........................................................109
Begin with a scenario................................................................................................................110
Choose the systems to consolidate...........................................................................................110
Step 1 of 3: Define the destination system(s) and attributes....................................................110
6 Table of Contents
Page 7

Step 2 of 3: Set level of effort for Smart Solver calculation.......................................................111
Step 3 of 3: View Smart Solver solutions..................................................................................111
Results: Automated consolidation to VMs.........................................................................112
Automated solution finding: Load balance of servers or VM hosts .............................................113
Begin with a scenario................................................................................................................113
Choose the VM hosts or servers to load-balance.....................................................................113
Step 1 of 3: Define the solution constraints..............................................................................114
Step 2 of 3: Set level of effort for Smart Solver calculation.......................................................114
Step 3 of 3: View Smart Solver solutions..................................................................................114
Results: Automated load balancing of servers or VM hosts...............................................114
Automated solution finding: Workload stacking..........................................................................115
Begin with a scenario................................................................................................................116
Choose the workloads to stack.................................................................................................116
Step 1 of 3: Stack the specified workloads onto servers...........................................................116
Step 2 of 3: Set level of effort for Smart Solver calculation.......................................................117
Step 3 of 3: View Smart Solver solutions..................................................................................117
Results: Automated workload stacking..............................................................................117
Getting more detail........................................................................................................................118
6 Using Capacity Advisor with HP Serviceguard......................................................119
Using Serviceguard to migrate HP Integrity VM guests....................................................................119
Data collection in a Serviceguard environment..................................................................................120
7 Support and other resources....................................................................................121
Contacting HP.....................................................................................................................................121
New and changed information in this edition....................................................................................121
New and changed information in Edition 1..................................................................................121
Related information............................................................................................................................121
Related technical papers................................................................................................................122
A Calculation assistance..............................................................................................123
Cost calculation...................................................................................................................................123
Cost per kilowatt-hour...................................................................................................................123
Cooling calculation.............................................................................................................................123
Cooling multiplier.........................................................................................................................123
Adjusting for platform changes..........................................................................................................123
Memory multiplier........................................................................................................................124
Adjusting for change in a workload...................................................................................................124
CPU workload multiplier..............................................................................................................124
Memory workload multiplier........................................................................................................125
Network I/O workload multiplier.................................................................................................125
Disk I/O workload multiplier........................................................................................................125
Determining estimated utilization assumptions for a workload..................................................125
Adjusting for virtualization changes..................................................................................................127
CPU Virtualization Overhead %....................................................................................................127
CPU Virtualization Overhead %..............................................................................................128
Hypervisor memory overhead......................................................................................................128
Hypervisor memory overhead.................................................................................................128
Doing the math for hypervisor memory overhead..................................................................128
HP Virtual Machine............................................................................................................128
VMware ESX 3.....................................................................................................................128
VMware vSphere (ESX 4)....................................................................................................129
Microsoft Hyper-V..............................................................................................................129
Table of Contents 7
Page 8

Power calibration calculations............................................................................................................129
Determining idle/max values for non-Blade servers ....................................................................129
Determining idle/max values for Blade servers............................................................................130
P-class HP Blades and HP Blade system sizer:........................................................................130
C-class HP Blades and HP Blade system sizer:........................................................................131
B Command reference..................................................................................................133
capagentlesscfg (1M)...........................................................................................................................134
capcollect (1M)....................................................................................................................................136
capcustombenchmark(1M).................................................................................................................139
capcustombenchmark (4)....................................................................................................................141
capovpaextract (1M)............................................................................................................................142
capprofile (1M)....................................................................................................................................144
capprofile (4).......................................................................................................................................148
cappmpextract ....................................................................................................................................151
C Units and terminology...............................................................................................153
D Snapshots of Capacity Advisor reports...................................................................157
Consolidation candidate report..........................................................................................................157
Scenario comparison report................................................................................................................157
E Graphed data in Capacity Advisor reports............................................................161
F Example of the Undo/Edit/View Applied What-If Actions screen.......................163
G Troubleshooting in Capacity Advisor ....................................................................165
When there is no connection...............................................................................................................165
Data is not being collected..................................................................................................................166
Data may appear to be old when it is not...........................................................................................167
Data seems to be incorrect or lost.......................................................................................................168
Data cannot be imported.....................................................................................................................170
Out-of-memory errors in the Java heap..............................................................................................170
When working with reports................................................................................................................171
When working in the scenario editor..................................................................................................171
When working with power.................................................................................................................172
Workload and system relationships may not match when comparing Capacity Advisor and
Virtualization Manager information...................................................................................................173
Miscellaneous user interface issues....................................................................................................173
H Capacity Advisor messages.....................................................................................175
Command error messages..................................................................................................................175
Command warning messages.............................................................................................................176
HP Smart Solver error messages.........................................................................................................180
When available systems lack sufficient capacity...........................................................................180
When the threshold for invalid data is exceeded..........................................................................181
HP Smart Solver informational messages...........................................................................................182
Glossary.........................................................................................................................183
8 Table of Contents
Page 9

Index...............................................................................................................................191
Table of Contents 9
Page 10

10
Page 11

1 Introduction
This document describes how to use Capacity Advisor to plan for changes in resource usage in
a virtualized server environment. Checklists and examples help you with common planning
tasks. This document is for technical professionals working in data center operations,
administration, and planning. Some understanding of system administration is assumed.
HP Insight Capacity Advisor software is a program that allows you to monitor and evaluate
system and workload utilization of CPU cores, memory, network and disk I/O, and power. With
this information, you can load your systems to make best use of the available resources.
You can monitor and evaluate one or more systems that are connected in a cluster configuration
or to a network. A single system can include multi-core or hyper-threaded processors.
Capacity Advisor helps you evaluate system consolidations, load balancing, changing system
attributes, and varying workloads to decide how to move workloads to improve utilization. The
quantitative results from Capacity Advisor can aid the planner in estimating future system
workloads and in planning for changes to system configurations. With Capacity Advisor, you
can perform the following tasks within an easy-to-navigate, clearly notated graphical user
interface:
• Collect utilization data on CPU cores, memory, network and disk I/O, and power.
• View historical resource utilization for whole-OS and monitored workloads on HP-UX and
OpenVMS systems andwhole-OS workload resourceutilization on Microsoft Windows and
Linux systems.
• View historical workload resource utilization and aggregateutilization across the partitioning
continuum (see the HP Insight Software 6.2 Support Matrix for a complete list of supported
platforms).
• Generate resource utilization reports.
• Plan workload or system changes, and assess impact on resource utilization.
• Assess resource utilization impact for proposed changes in workload location or size.
• Evaluate trends for forecasting resource needs.
Capacity Advisor can be used to simulate changes in system configuration, such as the following:
• Consolidating several systems into one system
• Re-sizing a system for an upgrade
• Re-sizing the demands on a system to reflect a forecast
• Replacing older, small to mid-sized systems with virtual machines
Capacity Advisor can use data collected over time to show the results of these configuration
changes in many ways. Graphical views are available so you can see what the effects of the
changes are over time. Tables are available that give the percentage of time and the degree to
which the system is busy; this information is valuable in comparing resource utilization and
quality of service before and after a change. Other tables show how many minutes per month the
system is unacceptably busy–a measure valuable for both quality of service and for estimating
TiCAP bills. Because Capacity Advisor works from data traces collected over time, it is much
more accurate than using only peak data or average data in understanding your systems and the
workloads they support.
The significant advantage in using Capacity Advisor, rather than ad hoc processes or guesswork,
is that it provides a quantitative basis for examining the usage of current resources. Additionally,
it provides the capability to try simulations (what-if scenarios) for moving workloads or other
resources before you actually implement a move.
Capacity Advisor incorporates numerical values of several components in its analysis and
modeling, including:
11
Page 12

• Number of CPU cores
• CPU benchmark data
• Memory size
• Network I/O bandwidth
• Disk I/O bandwidth
• Power usage
• Platform multiplier for memory (see “Adjusting for platform changes” (page 123))
• Virtualization adjustments (see “Adjusting for virtualization changes” (page 127))
Setup considerations
To prepare to use Capacity Advisor, consider the following:
• Licensing requirements
• Installation
• Upgrade and reinstallation
• Credentials
• Dependencies
Licensing requirements
Capacity Advisoris installed when HP Insight Dynamics suite is installed. For specificinformation
about trial and LTU (License To Use) licensing on supported platforms, see the HP Insight Dynamics
6.2 Getting Started Guide at http://www.hp.com/go/insightdynamics/docs. For added information
on using the HP Insight Capacity Advisor Consolidation software license, see “Data collection
and the HP Insight Capacity Advisor Consolidation software” (page 63). Capacity Advisor and
Capacity Advisor Consolidation Software licenses cannot be used on the same system at the
same time.
Installation
Capacity Advisoris installed with other Insight Dynamics components, so no separate installation
is required. (See the Insight Dynamics installation guide at http://www.hp.com/go/
insightdynamics/docs appropriate for your operating system.) To use Capacity Advisor, you
must have a valid license.
Collection methods
On installation of HP Insight Dynamics suite, the Insight managed system setup wizard
automatically configures the mechanism used to collect data from managed servers based on
the type of operating system that the managed system is running. (See “Supported collection
configurations” (page 17).)
Some problems with data collection can be diagnosed with vseassist. See the HP Insight
Dynamics 6.2 Getting Started Guide for additional information.
Disk space requirements
Plan to allot the following amounts of memory for each workload to collect and preserve a
maximum of four years of data for use by Capacity Advisor:
• On a Microsoft Windows CMS: Allot 64.5 MB foreach workload on each Windows or Linux
managed node to support agentless data collection. Allot 34.7 MB for each workload on
each HP-UX managed node.
• On an HP-UX CMS: Allot 93.1 MB for each workload on each Integrity Linux managed
node to support agentless data collection. Allot 34.7 MB for each workload on each Integrity
Windows or HP-UX managed node.
12 Introduction
Page 13

For additional information on disk space requirements, see the Insight Dynamics installation
guide appropriate for your operating system at http://www.hp.com/go/insightdynamics/docs .
Credentials
To use Capacity Advisor, to collect data, and to run reports, you must have credentials (a valid
user name and password) and appropriate toolbox authorization on systems where you plan to
use Capacity Advisor. For specifics about setting up user authorizations, see the HP Insight
Dynamics 6.2 Getting Started Guide at http://www.hp.com/go/insightdynamics/docs.
Dependencies
Data collection requires that credentials for each managed server be configured in HP SIM.
• WBEM/WMI credentials must be configured for all Windows servers, HP-UX servers, and
HP Integrity VMs. For agentless data collection on Windows systems, the WBEM/WMI
credentials must be set to Administrator level. WBEM certificate authentication is supported
for HP-UX servers.
• SSH credentials (user-based, host-based key, or by certificate) must be configured for all
Linux servers. Linux agentless data collection does not require root-level access. HP SIM
Privilege elevation is supported on HP-UX and Linux servers using a single user account
with sudo or powerbroker with no password required.
• The Windows or Linux managed node must be configured for agentless data collection by
running the Insight managed system setup wizard, or by running Collect Capacity Advisor
Data... (capcollect) on the managed server. Administrator or root level permission on
the CMS is required to configure agentless collection on the CMS.
• HP Insight Control virtual machine management (VMM) is required to collect data from
ProLiant/x86-based hypervisors and their VMs. Hyper-V VMs also require that WBEM/WMI
credentials be configured for Windows VMs and SSH for Linux VMs.
Upgrades and reinstallation
When upgrading or reinstalling software used with Capacity Advisor, there are different
considerations and procedures to follow specific to the operating systems underlying the CMS
or running on the managed node. Refer to the appropriate installation guide for instructions.
Install guides can be downloaded from http://www.hp.com/go/insightdynamics/docs.
Upgrading agents on HP-UX or OpenVMS managed systems
NOTE: This section does not apply to Microsoft Windows or to Linux systems, for which data
is collected by leveraging native instrumentation (agentless data collection).
When upgrading the Utilization Provider to the latest version on a managed node, any data
collected since the last capcollect command execution is lost. To minimize data loss, run the
capcollect command on the CMS to collect from the managed node just before upgrading.
Navigating within HP SIM, Virtualization Manager, and Capacity Advisor
Avoid using your browser Back and Forward buttons (except when navigating in the online
help). When you use these buttons, the user interface cannot tell that you have changed to a
different view. This can cause problems, including incorrectly displaying which objects are
selected in the current view, losing information input into screen fields, and cancelling operations.
Instead, use the navigation links, buttons, and tabs provided by the user interfaces within the
browser screen area.
Upgrades and reinstallation 13
Page 14

14
Page 15

2 Features
Capacity Advisor lets you test configuration changes before actually making them in your data
center, and helps you to manage existing resources to improve their utilization. For example,
Capacity Advisor assists you in answering questions such as the following:
• Is there room on this system to support additional work?
• Will this workload fit on this system?
• Can these servers be consolidated as virtual machines on a single server?
• What might my resource demand be in six months or a year?
• What are the estimated power costs for cooling a real or simulated system configuration?
• What doesa comparison of several “what-if” scenarios reveal about the analyzed alternatives?
• What is the historic behavior of a system or workload?
Capacity Advisor can display data about the following system resources:
• CPU cores (number) and speed
• Memory
• Network I/O bandwidth
• Disk I/O bandwidth
• Power usage
Capacity Advisor enables you to collect resource data and create visualization graphs with the
following views:
• Historical utilization and trends
• Data peaks
• Peak durations
• Forecasts
with the following utilization limits:
• amount of acceptable resource usage
• sustained time
• percentage of time
Capacity Advisor enables you to create scenarios for “what-if” planning and forecasting,
performing tasks such as the following:
• For systems in scenarios:
— Create systems based on existing systems or with characteristics that you define
— Remove systems
— Edit system attributes
— Turn systems into virtual machines
— Move virtual machines
• For workloads in scenarios:
— Create workloads based on existing workloads or with characteristics that you define
— Collect utilization data for workloads
— Import existing workload profiles
— Edit workload demands
— Move workloads between systems
— Park workloads
— Delete workloads
• For scenarios themselves:
— View and undo/redo scenario changes
— Use the HP Smart Solver technology to perform:
15
Page 16
Automated server consolidation to virtual machines◦
◦ Automated load balancing of existing VM hosts or existing servers
◦ Automated workload stacking (consolidation)
— Create scenario comparison reports
Data collection
Data collection is at the heart of Capacity Advisor and a task is created during configuration to
automatically collect utilization data from all resources licensed for Insight Dynamics and
discovered by HP Systems Insight Manager software (HP SIM). (See “First data collection (or
the automated nightly collection)” (page 58).)
HP recommends that once you have become familiar with using Capacity Advisor, you should
review this scheduled task to understand what it is doing and make sure that it fits your needs.
This automated data collection task gathers historical data from all your systems so that the data
is available when you need it for analysis.
Data collection infrastructure
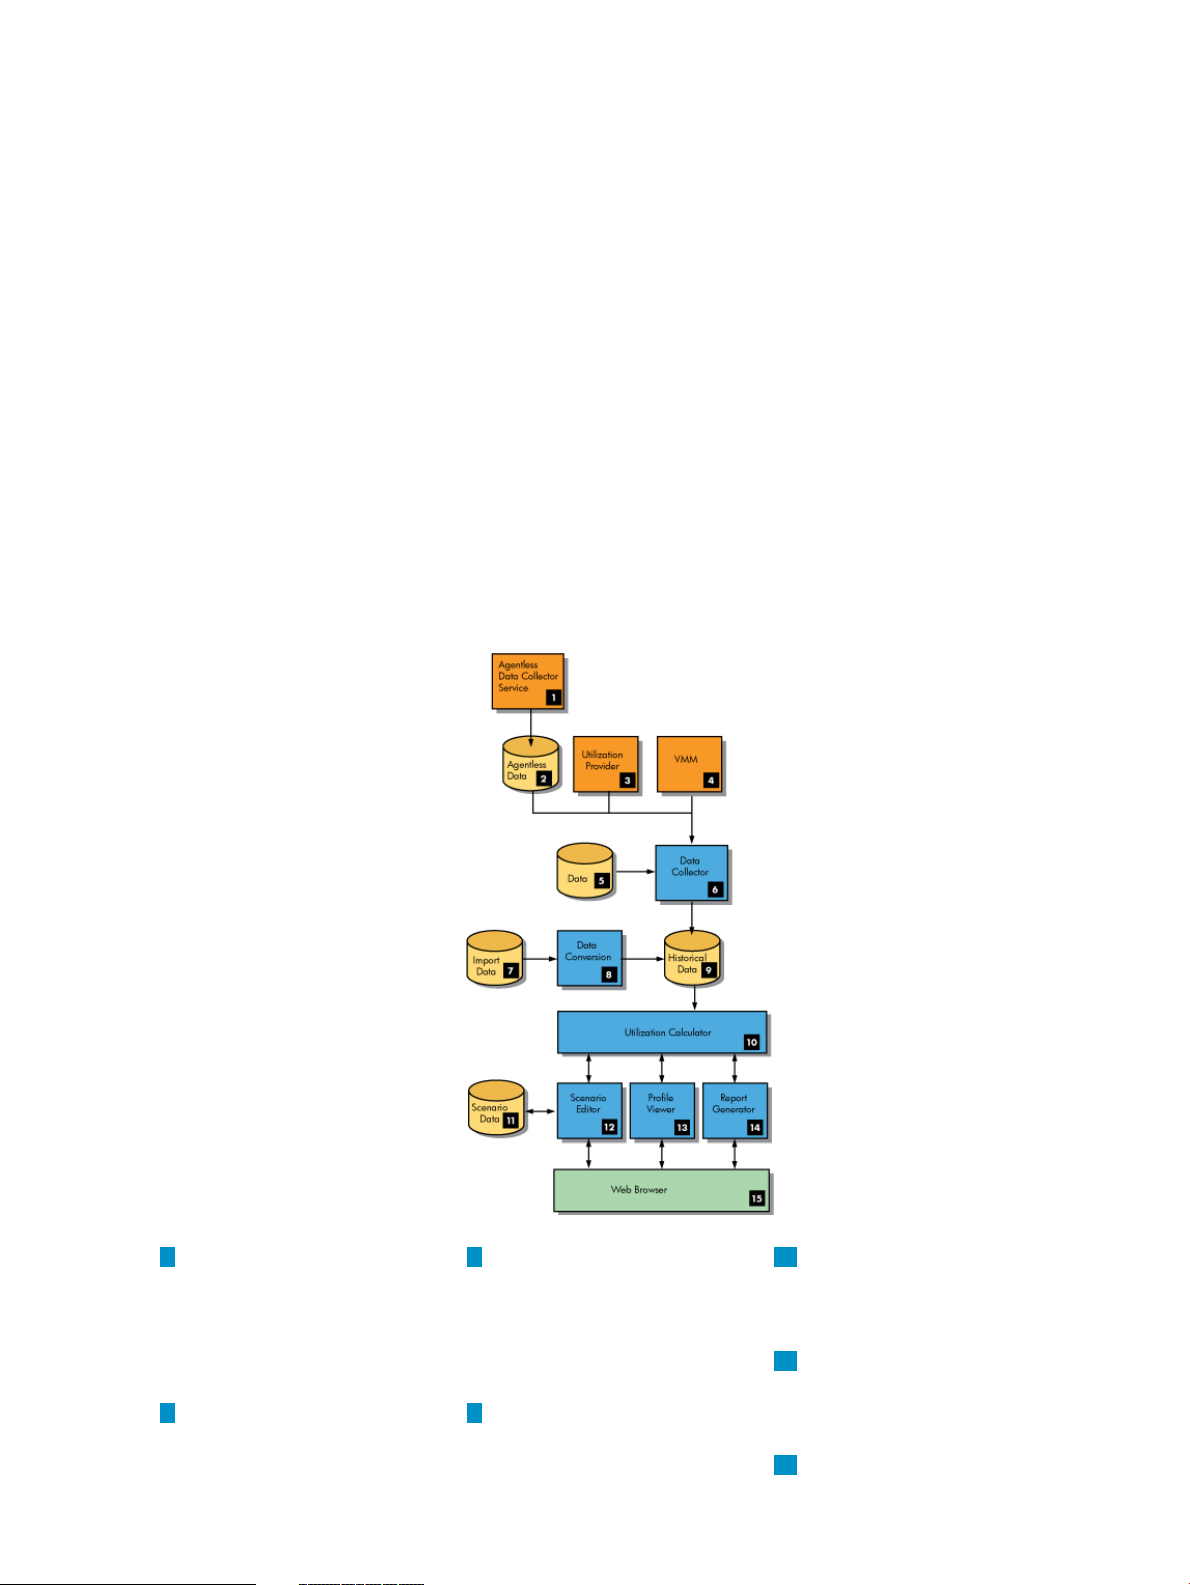
In the data collection infrastructure, each component plays a role, as shown in Figure 2-1 “Capacity
Advisor Data Collection Infrastructure”. It all begins with data collection.
Figure 2-1 Capacity Advisor Data Collection Infrastructure
1
16 Features
6
The Agentless Data
Collector Services run on
the CMS and collect data continued use in the
The Data Collector gathers
data from the agentless
data files, the Utilization
Providers running on thefrom Microsoft Windows
and Linux managed
systems.
Agentless data collected by
the Agentless Data
managed nodes, and
from VMM.
72
You can import data (HP
OVPA and HP PMP) into
Collector Service is made the historical database for
analysis.
11
Scenario data is stored
automatically for
Scenario Editor.
12
Use the Scenario Editor to
manipulate the collected
data associated with
workloads and systems.
13
Use a Profile Viewer to
examine a graphical
Page 17

available to the Capacity
Advisor Data Collector.
3
The Utilization Provider
enables the operation of
the Capacity Advisor
Data Collector.
HP Insight Control
virtual machine
8
Automatic data conversion
occurs when importing
data into the Insight
Dynamics database.
Historical data is stored for
use in Capacity Advisor.
104
The Utilization Calculator
uses historical utilization
display of the utilization
of a specific resource for a
specific workload or
system.
149
Use the Report Generator to
create reports for
understanding utilization.
15
Use the web browser to
work with Capacitydata and scales, sums, ormanagement (virtual
machine management) data
is made available to the
Capacity Advisor Data
Collector.
5
Characteristics of
converts it to
approximate actual or
hypothetical system
utilization.
Advisor and exploit its
features.
managed systems are
stored in the Insight
Dynamics database and
used when collecting
utilization Data.
Collecting data for a workload with a HP Serviceguard package
You can associate a monitored workload with a Serviceguard package. This association
allowsVirtualization Manager to show workloads moving from one system to another within
minutes of a Serviceguard migration. It also allows Capacity Advisor to show an uninterrupted
history of utilization data for a workload across migrations.
Associating monitored workloads and Serviceguard packages requires that Serviceguard and
the corresponding version of the Utilization Provider have been installed on all member systems
of the Serviceguard cluster. For specific version information, see the HP Insight Software 6.2
Support Matrix.
Supported collection configurations
Table 2-1 Collection methods by operating system on CMS and managed node types
Managed node software and/or
OS
Integrity Virtual Machine (HP
VM)
1
Collector for HP-UX CMSCollector for Microsoft Windows CMS
not supportedVMMVMM host or guest
not supportedVMM and agentless methodVMM Hyper-V VM
HP VMProvider and Utilization ProviderHP VM Provider and agentless methodMicrosoft Windows on HP
HP VM Provider and agentless methodHP VM Provider and agentless methodLinux on HP VM
HP VMProvider and Utilization ProviderHP VMProvider and Utilization ProviderHP-UX on HP VM
Utilization ProviderUtilization ProviderOpenVMS on HP VM
Utilization Provider (Integrity only)agentless methodstandalone Windows
agentless methodagentless methodstandalone Linux
Utilization ProviderUtilization Providerstandalone HP-UX
Utilization ProviderUtilization Providerstandalone OpenVMS
Data collection 17
Page 18

1 Data is obtained from some managed system types using more than one collector. This is done where the data from
both collectors provide a broader or more accurate view than can be obtained from using only one collector on that
managed system type. For example, where bothnatively collecteddata (agentless) and data from the IntegrityVirtual
Machines Provider are used, the HP VM agent provides info about the VM that allows Capacity Advisor to obtain
more accurate CPU data for the VM, and the agentless method provides metrics other than CPU utilization.
NOTE: The supported collection configurations for a managed node are normally set up by
the Insight managed system setup wizard. If the capcollect command is run before the wizard
is run on a managed node, and agentless data collection is supported for the managed node, the
node will be configured for agentless collection at that time. Because no agentless data is yet
available, however, the message:
Error: At the time data collection was run, system "system-name" was not
configured for agentless data collection. It has been configured and data
collection will begin shortly. No utilization data is available now.
Try collecting again in 5 minutes.
will appear in the command output. Subsequent collections will retrieve collected data beginning
at the time the capcollect command was run on the managed node.
Comparison of agentless and UP data collection
Table 2-2 (page 18) compares the operational characteristics of agentless data collection and that
of the Utilization Provider (UP) when used to collect data from systems licensed for Capacity
Advisor.
• Agentless Data Collection. This method leverages native data collection already occurring
on the managed server(s).
• WBEM Utilization Provider. This method uses an agent to gather the data and provide it
to the CMS.
Table 2-2 A comparison of agentless data collection and use of Utilization WBEM Provider
Utilization Provider (UP)Agentless data collection
Equally useful in data quality and accuracy.
Available for HP-UX and OpenVMS systemsAvailable for Microsoft Windows, Linux, and non-HP
systems
Provides the basic set of utilization metrics for CPU,
memory, network I/O, and disk I/O, plus additional
metrics for reporting specific activities in the operating
system, disk, and network: CPU queue length, page
faults/second, disk I/Os per second, LAN packets/second,
number of disks, disk space total, disk space used.
hosting or update required
Susceptible to network or CMS downtime as data is
continuously collected by the CMS across the network
from each managed system
Small additional load on the CMS CPU and memory
resources incurred by the ongoing operation of the
agentless data collection service
Provides the basic set of resource utilization metrics for
CPU, memory, network I/O, and disk I/O.
Requires hosting and updating the UP agentLeverages existing data on thesystem; no additional agent
Not susceptible to downtime in the network or the CMS.
Collected data is held for a maximum of 30 days by the
UP for transfer to the database on the CMS
Slight additionalload on CMS CPU or memory resources
incurred once per day
Slight additional load on managed system resources due
to remote queries from the collector every 5 minutes
18 Features
Slight additionalload on managed system resources, due
to local queries from the UP agent every 5 minutes, and
storage/retrieval of historical metrics on the local file
system
Page 19

Table 2-2 A comparison of agentless data collection and use of Utilization WBEM Provider (continued)
Utilization Provider (UP)Agentless data collection
Slight additional load on network incurred once per daySmall additional load on the network incurred by the
ongoing operationof the agentless data collection service
Data collection starts within a few minutes of configuring
the system using Insight managed system setup wizard
Data collection starts within 24 hours of configuring the
system using Insight managed system setup wizard.
However, if the UP is already running on the managed
system, the data collected may cover an interval as long
as 30 days previous to configuration inInsight Dynamics.
HP PMP data differs from Utilization Provider data
Differences in data imported from HP Performance Management Pack (HP PMP) affect how you
should interpret resulting analysis and scenarios as compared to data collected from theUtilization
Provider.
Differences in memory data
Capacity Advisor normally measures memory collected from the Utilization Provider, which
returns the sum of memory allocated to the processes on the system.
HP PMP collection provides the total memory less the zeroed, free, and standby memory.
This means that HP PMP counts memory used by the operating system, whereas the Utilization
Provider does not. The memory use reported by HP PMP is about 20% higher than memory use
reported by the Utilization Provider.
Because Capacity Advisor assumes a different memory amount than HP PMP provides, Capacity
Advisor may overestimate the memory needed when using HP PMP data to analyze stacking
several application instances in a system running a single instance of an operating system.
While either the Utilization Provider data or the HP PMP data can be used to plan memory size
in a new configuration, you should not use a mix of HP PMP and Utilization Provider data when
looking for a trend in memory utilization.
Differences in network data
HP PMP does not report the correct network I/O when network interface cards (NICs) are being
teamed for network fault tolerance (for example, by using HP Network Config utility).
That is, for a system with 2 NICs teamed as one single logical NIC, Utilization Provider reports
the addition of TX and RX Mbps for the teamed NIC.
HP PMP adds the metrics from the 2 NICs, ignoring that they are working as a teamed NIC.
For a teamed configuration, the HP PMP network utilization curve will be always twice that of
the Utilization Provider data.
If you know you have teamed NICs, or if you suspect your imported network data is twice as
high as it should be, you will want to instruct Capacity Advisor to ignore the imported data.
When logged in as a user authorized to use the Capacity Advisor toolbox on the CMS, you will
be able to mark data as invalid. You can do this from a profile viewer, or by using the
capprofile(1M) command.
Related topics
“Data handling for virtual machines” (page 23)
“Using the Profile Viewer” (page 67)
“Command reference” (page 133)
Data collection 19
Page 20

Experimentation
You can better understand Capacity Advisor by experimenting — considering different
configurations and workload placement trying them out in “what-if” scenarios. A scenario
identifies the workload demand profile that creates your experimental simulations.
When you do workload analysis in Capacity Advisor, you view graphs and reports that represent
CPU or memory utilization by time. For example, Figure 2-2 shows a graph of CPU utilization
for a single system over a one-month period.
Figure 2-2 CPU utilization for managed system puny03v8
1
Peak (highest) value.
Similarly, Figure 2-3 shows CPU utilization for a second system over the same period.
Figure 2-3 CPU utilization for managed system puny03v7
1
Peak value.
Comparing these two graphs shows that workload peaks on the two systems do not occur
simultaneously, nor do they require the samepercentage of the allocated CPU cores for processing.
This suggests an opportunity to consider whether you can consolidate both systems together to
satisfy the needs of the workloads, while reducing the number of CPU cores (originally each
system is allocated 2 cores, for a total of 4 cores available to do work).
Figure 2-4 shows the result of using a Capacity Advisor “what-if” scenario to combine the
workloads onto one system.
20 Features
Page 21
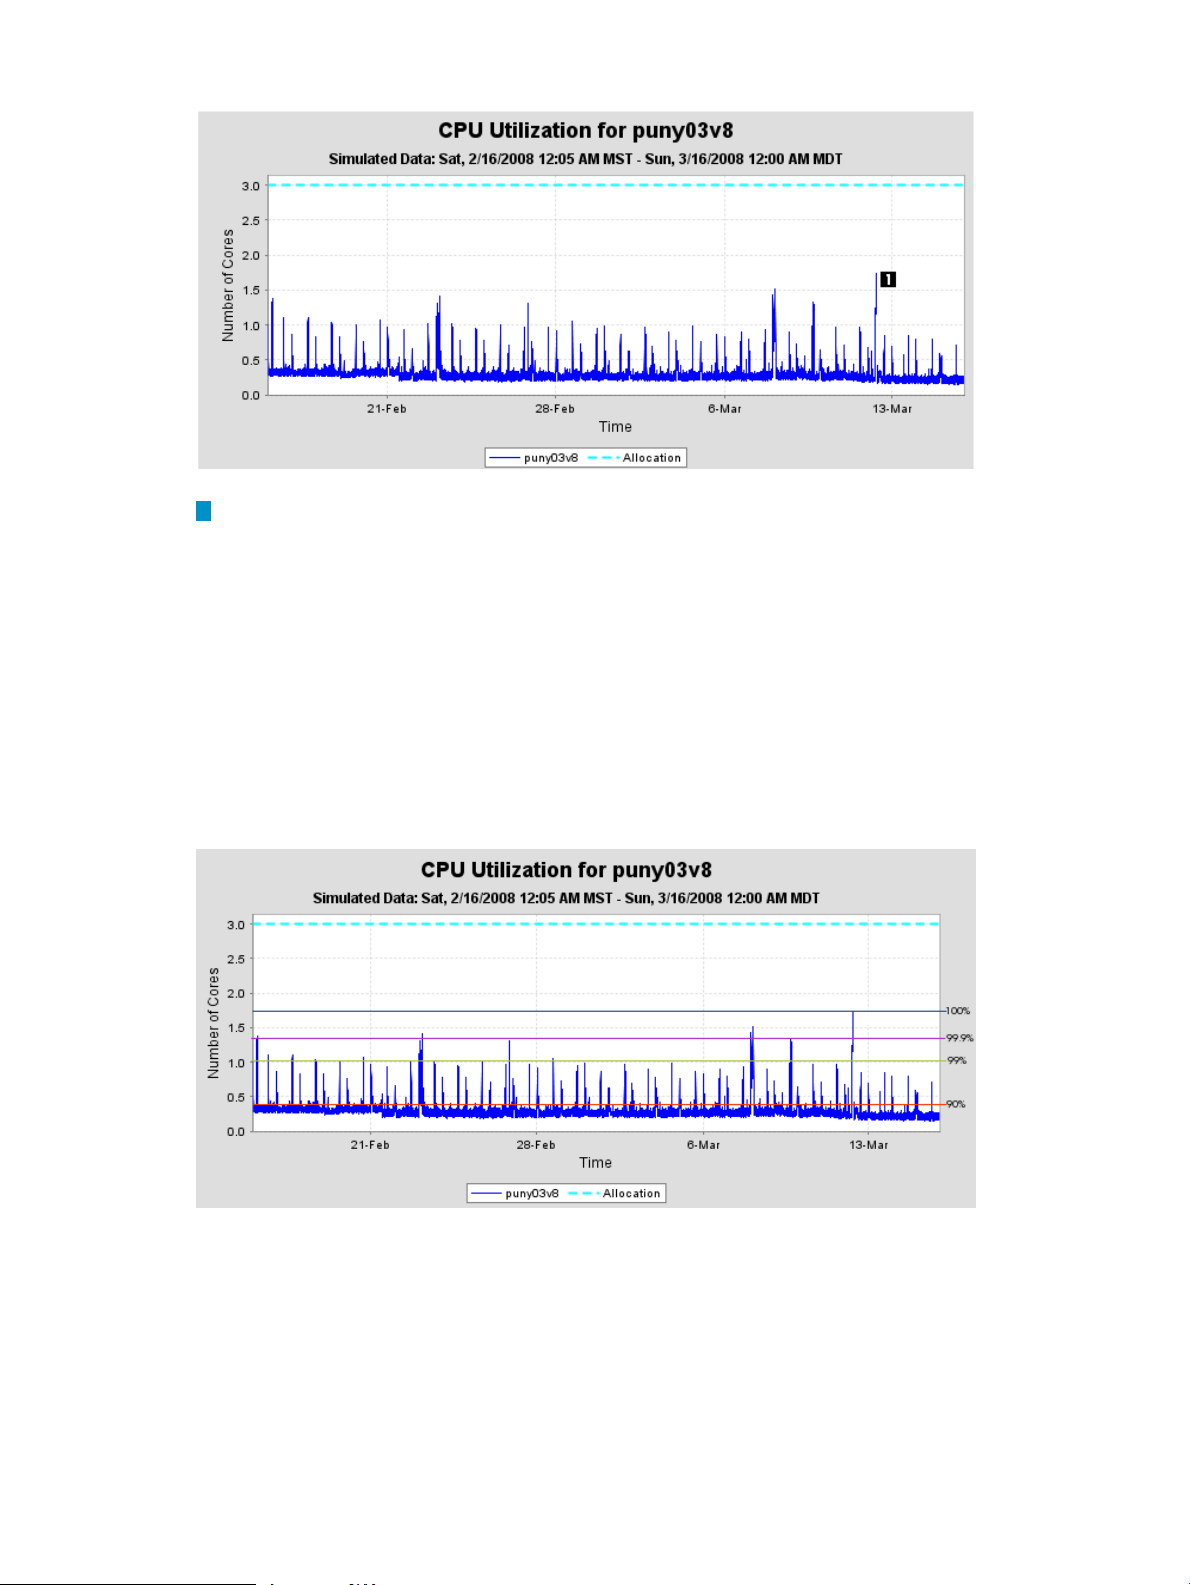
Figure 2-4 Combined “what-if” CPU utilization for puny03v8 and puny03v7
1
Peak value.
From the graph, it is evident that the peak of the combined workloads is under 2 CPU cores.
Even with utilization limits in place, this system is unlikely to need 4 CPU cores to meet this
workload demand.
Sizing for service level objectives
As part of planning configuration changes, you can also consider your service level objectives
or quality of service goals.
The following utilization graph shows only one month of data; longer periods of data provide
an increasingly accurate picture of resource usage.
Figure 2-5 CPU utilization with selected percentiles of utilization
In this example, an allocation of three CPU cores is assumed, rather than the four cores initially
available in this exercise. Even this reduction may not provide the best fit, as the vast majority
of the work (90%) is completed with less than .5 of one core, and 99% of the work is completed
with one core.
For example, as shown in Figure 2-5 (page 21), CPU utilization has one peak at 1.7 CPU cores,
with many lower peaks. If you configure your system to always meet the demand of this single
1.7-CPU peak, and you do not adjust the CPU allocation, a significant fraction of the CPU
allocation in this example would go unused most of the time. Depending on your quality of
service goals, you may decide that a different configuration can better use the resources available.
Sizing for service level objectives 21
Page 22

Further experimentation in Capacity Advisor with resource allocations, consolidations, and
utilization limits will help you arrive at the best fit for these workloads.
With Capacity Advisor's visualization and reporting tools, you can make a considered estimate
of server resource utilization using different scenarios and easily refine allocations by tweaking
values in the scenarios. Such estimates can help you minimize overspending for capacity you
use rarely, and maximize utilization of your systems to ensure that your systems have the capacity
needed at the level you require.
Modeling considerations
Capacity Advisormethodology makes certain assumptions inits data analysis. Theseassumptions
include using an automatically determined CPU performance index, with normalization based
on benchmark data or benchmark data in combination with CPU clock speed in special cases.
Memory is not normalized. Scale factors can be set on the Capacity Advisor Edit Workload and
Move Workload screens. See“Adjusting for platform changes” (page 123) for more information.
On the Edit Scenario screen, you can select either the System or Workload tab to manipulate
the planning scenario and specify which metric representation to view: average, 90th percentile, peak
or max 15-min (maximum 15-minute sustained). The Meter Style can be absolute numbers or in
percentages. By changing the metrics to view, you can explore multiple options for system and
workload deployment. See “ Controlling the data display” (page 88) for more information.
Capacity Advisor commands
In addition to tasks that you can perform from the Capacity Advisor graphical user interface,
Capacity Advisor provides several commands that can be run from the command line on an
HP-UX orMicrosoft WindowsCMS. For specific information, see “Commandreference” (page 133).
22 Features
Page 23

3 Key Capacity Advisor concepts
Capacity planning goals
Capacity planners are driven by multiple, sometimes conflicting, goals:
• Avoiding surprises
• Planning for the future
• Maintaining quality of service (see “Quality of service ” (page 23))
• Optimizing resource utilization
• Meeting internal and external security requirements
• Reducing costs
HP Insight Capacity Advisor software can help lessen the conflicts among goals by buttressing
decisions with better information and more robust models. Effective use of Capacity Advisor
can help you to double resource utilization in many situations.
The most important step in accomplishing capacity planning goals is to clearly understand the
goals and the relationship among them. For example, optimizing response time may preclude
trying to achieve the most efficient resource utilization, while optimizing resource utilization
can compromise certain types of security. It is critical to understand the requirements as well as
their priorities to provide best overall quality of service.
Quality of service
Typical aspects of quality of service include (but are not limited to):
• Availability
• Accessibility
• Integrity
• Performance
• Reliability
• Regulatory requirements
• Security
Quality of service is frequently defined in service level agreements between organizations.
Utilization monitor, calculator, and simulator
At a fundamental level, HP Insight Capacity Advisor software collects data from utilization
monitoring daemons on systems and workloads. Using this data, Capacity Advisor can report
on utilization of memory, core processing units, I/O bandwidth, and power. It can calculate what
resource utilization would look like if the load were increased or decreased. Further, it can
simulate what resource utilization might look like if loads are combined. This goes beyond simple
addition of maximum loads to provide a dynamic addition of components based on the time
sequence of utilization measurements taken from the actual loads running on real systems (see
“Peaks and sums” (page 25)).
Data handling for virtual machines
Data collected by Capacity Advisor for use in a profile viewer and historical utilization reports
can vary from data reported by tools that run inside a virtual machine. These tools include HP-UX
and Linux commands such as top, ps, and sar, and on Microsoft Windows, the task manager
or perfmon.
This data can vary in a couple of ways. For example:
• Capacity Advisor usually reports CPU utilization that is greater than what is reported by
the VM guest. The operating system inside a virtual machine only knows about the CPU
Capacity planning goals 23
Page 24

time used by threads that simulate the virtual processors. However, there are also threads
that simulate the I/O cards and disks in the virtual system. Capacity Advisor collects data
on all of these threads, which can cause the Capacity Advisor data for a specific virtual
machine’s CPU utilization to be greater than the number of virtual CPU cores (vCPUs)
associated with the virtual machine. Under certain load conditions, this can result in CPU
utilization of more than 100% being reported for a virtual machine.
• Capacity Advisor data for VM host CPU utilization can be lower than what the guest
operating system reports, especially during periods of high utilization. Capacity Advisor
records physical CPU utilization, which is the utilization of the actual cores on the VM host;
that is, the total utilization reported by Capacity Advisor is based on the CPU time that the
VM host allotted to each virtual machine. In contrast, the guest OS records virtual CPU
utilization, which includes time when the VM wants to run, but is suspended while another
VM is using the resources on the VM host.
Because Capacity Advisor corrects for these effects, the collected data has much less “noise” in
it, and better reflects the CPU time that was actually used by any one VM.
Data normalization
Capacity Advisor makes certain assumptions in its data analysis. These assumptions include
automatically adjusting for CPU platform differences based on a performance index. (The
performance index is constructed by normalizing collected data to selected benchmarks for the
source and destination systems).
If desired, you can add your own benchmark values to the database for use in calculating the
performance index for workload moves among systems with the same or different architectures.
(See capcustombenchmark in the Appendix B (page 133) for more information.
Memory, network IO, and disk IO usage are not normalized.
NOTE:
Using benchmarks for data normalization was introduced into the 6.0 release. This change affects
workloads defined with static profiles in previous releases because they use clock speed to
determine performance. Such workloads that are still used for planning should be redefined or
edited in Capacity Advisor 6.x to improve the accuracy of the performance measure.
Resources for which Capacity Advisor collects data
HP Insight Capacity Advisor software collects and analyzes data for utilization of the following
resources:
• CPU cores
• Memory
• Network I/O
• Disk I/O
• Power
Upper bounds
Upper bounds represent the maximum capacity of a resource for a given system. The maximum
capacity is used in Capacity Advisor for items such as the network and disk I/O utilization graphs
of systems, the graphs and values shown in a profile viewer, and the Capacity Advisor Smart
Solver calculations.
CPU capacity The maximum CPU capacity of a system is the product of the number of CPU
cores and the clock speed of the system.
Memory The maximum capacity of memory is the amount of memory on the system.
24 Key Capacity Advisor concepts
Page 25

Network I/O The maximum capacity for network I/O defaults to the high-water mark (that is,
the maximum observed or collected value) for network I/O. However, to set the upper bound
to a value you choose, select Configure→Edit Network and Disk I/O Capacity... from the
Visualization tab in Virtualization Manager.
Disk I/O The maximum capacity for disk I/O defaults to the high-water mark (that is, the
maximum observed or collected value) for disk I/O. However, to set the upper bound to a value
you choose, select Configure→Edit Network and Disk I/O Capacity... from the Visualization
tab in Virtualization Manager.
Power Expected maximum and minimum power values for systems and workloads are
computed using the CPU and power utilization data collected from HP Insight Control power
management (IPM). However, these values can also be set manually from the Virtualization
Manager menu bar (select Configure→Calibrate Power (All Selected Systems)...) for specified
systems; or from the Capacity Advisor Edit Scenario: System tab menu bar (select
Edit→Calibrate Power (All Selected Systems)...) for a specific scenario.
Measuring and analyzing resource utilization
In using Capacity Advisor, it is helpful to understand how the tool approaches sampling and
data analysis, and the user-provided information that affects these.
Peaks and sums
Measuring utilization of computing resources is more complex than simply determining the
maximum memory or processor utilization.
Sum of peaks An old standby in capacity planning is to simply take the peak of the two loads
and use that to determine the maximum required capacity; this is the “sum of peaks”. While this
will definitely provide a robust solution, it does not take into account the timing of the peak of
the loads and may end up planning for more capacity than is actually used.
Peak of sums A more efficient planning solution, which is easily accomplishedusing HP Insight
Capacity Advisor software, takes into account the timing of the maximum utilization peaks in
the individual loads. By adding together utilization at each measured interval and then taking
the maximum of the resulting time sequence, a more accurate measure of the required maximum
resource can be determined. This can lead to cost savings when planning the resources required
to consolidate loads onto new or existing servers.
Sampling interval
Where used, the Utilization Provider runs on each monitored system to collect information on
resource utilization. At the CPU-clock cycle level, a processor is either busy or idle. For Capacity
Advisor, the average utilization for each 5-minute (300 seconds) interval is stored. Therefore,
peaks lasting less than 5 minutes are not visible.
Because each data point is the average of the five preceding minutes of values, this averaging
tends to flatten the graphs, particularly when compared with real-time graphs in which each
data point is the average of values from the 15 preceding seconds.
For data collected using an agentless solution, collection intervals can vary depending on values
that you set and the number of machines in the collection.
Headroom
Headroom is the difference between the observed utilization on a system and the maximum
available capacity. That is, the headroom of a system is the amount of additional capacity that
can be used without violating the utilization limits of the applications running on that system.
For example, if you have a system with 4 cores where you never want utilization to exceed 75%,
and peak utilization is 1.75 cores, then headroom is 1.25 cores.
Measuring and analyzing resource utilization 25
Page 26
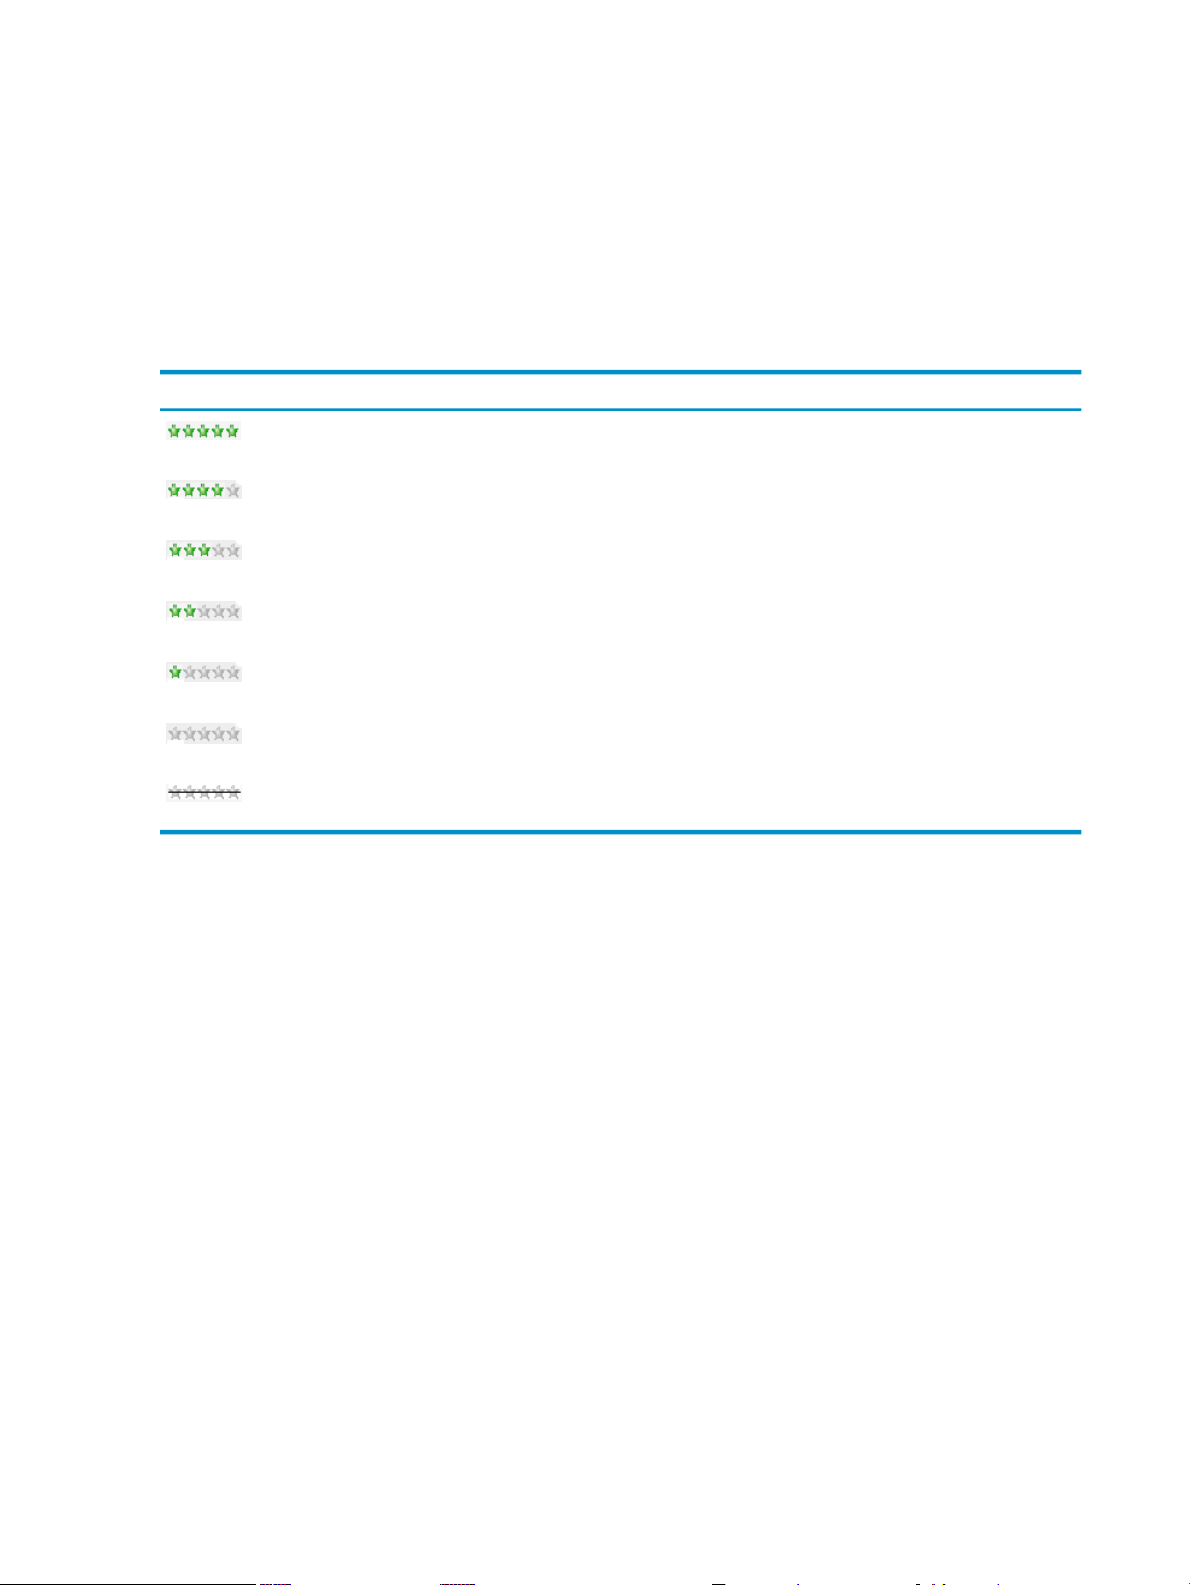
Optimum headroom varies depending on size of system. While a single processor system might
require 50% headroom to preserve reasonable response times, a 16-way system might have
reasonable response times when loaded at 80%.
Adequate headroom can also depend heavily on the characteristics of the loads; highly interactive
systems require much more headroom than those that can tolerate delays in response time; batch
systems may get by with very little headroom at all.
Headroom star rating
Various reports and results show headroom star rating. Use the following chart to understand
the headroom rating system.
MeaningStar image
Not only do all resources fit, but double the resource usage for any single workload could fit.
All resources fit, and at least 75% headroom for any single workload is available.
All resources fit, and at least 50% headroom for any single workload is available.
All resources fit, and at least 25% headroom for any single workload is available.
This star arrangement (1 green star) means that all resources fit in the system, but no or little
headroom is available.
One or more resources do not fit in the system; the utilization limits are violated.
Data is not available for this system.
where
• resources can be CPU cores, memory, network I/O, and disk I/O. In the case of a virtual
machine, the number of CPU cores considered are those assigned to the VM, not the total
number of cores on the VM host. The VM host clock speed, network capacity, and disk
capacity are all inherited by the VM guest when it is moved onto the VM Host.
• fit means the utilization limits (see “Utilization limits ” (page 27)) are met
• headroom means “room for growth”
Interpreting the headroom star rating
Headroom star ratings for a host are a weighted average of all of the star ratings of the workloads
on that host. The weighting tends to give the highest weight to the lowest rating. One low rating
can dramatically lower the rating for the entire host.
In the case of a VM host, the star ratings account for how well the workloads fit into their virtual
machines, as well as how well the virtual machines fit on the VM host. The rating for the VM
host will be low if any of the virtual machines are too small for their workloads.
Interpreting the star rating given by the HP Smart Solver
When using the Smart Solver to find a plan to convert physical systems to virtual machines,
consider the following factors that can adversely affect the Smart Solver results.
• The addition of a virtualization overhead multiplier to a VM will often reduce the number
of stars for that workload by 1 or 2 stars.
• The clock speed of the VM host may be slower than the original physical system. Work that
was done by 1 core at 2.6 GHz, may require 2 cores when placed on 2.1 GHz VM host.
26 Key Capacity Advisor concepts
Page 27

You can avoid having the Smart Solver produce inaccurate or useless results by re-sizing your
systems before running the Smart Solver. If either of the above conditions exist in your situation,
consider increasing the number of cores on your simulated physical systems before running the
Smart Solver. (Select What-if Actions→Edit System... on the System tab on the Edit Scenario
screen.) If you change the number of cores from 1 to 2 before consolidating, for example, the
resulting virtual machines will have enough cores to cover the virtualization overhead or a slower
VM host.
Re-sizing the virtual machines after running the Smart Solver can be less effort, as you only have
to re-size the VMs that have fewer stars than your desired goal. After adding more cores to the
VMs for which CPU resources are too tight, you can rerun Smart Solver to balance the load on
the VM hosts to improve the solution a bit more.
TIP: Use a Scenario comparison report to compare the headroom starsrating for saved scenarios.
Missing or invalid data
Data collected by Capacity Advisor is used in the scenarios you create and manipulate. During
an interval when no data was collected, the data is considered missing (data may not have been
collected, for example, because a system was down during data collection). Invalidated (or
invalid) data is data that you have marked as invalid.
For each metric about a system or workload, if a significant amount of data is missing or invalid,
the metric is followed by asterisks with the following meaning:
• [blank] : 91% to 100% of data is valid.
• * : 51% to 90% of data is valid.
• ** : 11% to 50% of data is valid.
• *** : Less than 10% of data is valid.
• N/A: There is no valid data.
Thus, metrics asterisks are considered useful and reliable for analysis.
NOTE:
In some situations, where time or time zones on a server are incorrect, it may appear that only
old data is available in the data collection. For more information on this topic, see the section
“Handling Old Data” in Appendix H (page 175).
The affect of invalid data on HP Smart Solver solution finding
The HP Smart Solver is set to ignore workloads having >25% invalid data; that is, the Solver will
not consider these workloads within an automated solution. This percentage can be adjusted,
with a corresponding affect on the Solver's ability to include workloads in its solution calculations.
For more information on what to do with workloads that violate this limit, see “When the
threshold for invalid data is exceeded” (page 181).
Utilization limits
The default utilization limits used globally across Capacity Advisorin the absence of user-defined
limits are the following:
• CPU utilization cannot exceed 70% of the capacity for more than 15 minutes at a time.
(Seventy percent is used as adefault for CPU utilization as it providesacceptable performance
with a minimum of queuing in jobs.)
• Memory utilization cannot exceed 100% of the capacity. Typically memory should be set at
a value <100% to allow for memory use by the dynamic buffer cache and operating system
activity.
Measuring and analyzing resource utilization 27
Page 28

(For more information on how utilization is calculated for each resource, see Appendix C (page 153)
.)
Specifying utilization limits
There are three building blocks to specifying a utilization limit:
• The limit The maximum percentage or absolute amount of a resource allowed to be used
by a workload. For example, a CPU utilization limit might be “not above 90%” utilization.
• The resource Utilization limits are applied to specific resources:
— CPU cores
— memory
— network I/O bandwidth
— disk I/O bandwidth
TIP:
You can specify more than one utilization limit for a resource Using the Utilization Limits
Editor, you can add multiple settings for a resource. For example, you can create multiple
different utilization limits for CPU cores by varying percentage and allowed duration for
each limit. Multiple limits for CPU cores could look like this:
— Utilization can exceed 90 percent of assigned cores 0 percent of the time
— Utilization can exceed 85 percent of assigned cores for a maximum of 5 minutes duration
Not specifying a limit allows HP Smart Solver to over-provision systems To achieve best
results with the Smart Solver, it is better to set specific limits, rather than to depend on the
default settings for limits to provide the best fit.
• The time criteria You can specify the time portion of a utilization limit in either of two
ways:
— Sustained (consecutive) time limits
— Percentage of time limits
Sustained time limits
A sustained limit specifies a limit where the resource cannot exceed that utilization limit for X
consecutive minutes. For example, if X is 20, this means that the resource cannot exceed the
utilization limit for 20 consecutive minutes.
Because the Capacity Advisor collects data samples every 5 minutes, the time X for the sustained
limit must be a multiple of 5 minutes; the minimum for X is 0 minutes.
Percentage of time limits
A percentage of time limit specifies that the resource cannot exceed the limit for more than the
designated percent of time, where percent of time is related to the percentile utilization ranges
in the Capacity Advisor data.
Given that there are about 10,000 minutes in a week, 3% of the time is roughly 300 minutes (3%
of 10,000). These 300 minutes total to 5 hours per week. Below is a table relating percentages of
time to hours per week, which may help you in specifying percent of time utilization limits.
Table 3-1 Percent of time conversions
28 Key Capacity Advisor concepts
Hours/ WeekMinutes/ WeekPercent of Time
Hours/Day
(24–hour day)
.241.68100.81
.483.36201.62
Page 29

Table 3-1 Percent of time conversions (continued)
Understanding utilization limit messages
Percentage of allocation
The utilization limit messages are shown as a percentage of allocation, where allocation is subset of
the given hardware for the system the workload is running on. For example, for a 1-core system,
the allocation is 1 CPU. The CPU utilization limit of 50% would mean 50% of 1 core, or .5 cores.
However, this percentage changes when the hardware (allocation) changes. If 2 additional cores
are added (say through dynamic CPU migration with vPars), the CPU utilization limit of 50%
would mean 50% of 3 cores, or 1.5 cores.
Allocation values for network IO and disk IO are derived from either the highest observed value
for that metric over the entire range of data collected, or a user-specified maximum value.
The allocation values fornetwork anddisk may be updated each timeutilization data is collected
from the system using the capcollect command. If a new high observed value occurs during the
time period collected, the network or disk allocation value for the system is increased to reflect
it. This increased value then affects any network or disk utilization limits for workloads on that
system. The current allocation values for a system are displayed on the Profile Viewer page under
Platform Characteristics.
Hours/ WeekMinutes/ WeekPercent of Time
Hours/Day
(24–hour day)
.725.04302.43
1.208.40504.05
2.4016.81008.010
3.6025.21512.015
4.8033.62016.020
6.0042.02520.025
7.2050.43,024.030
24.00168.0010080.0100
With sustained limits
A sustained utilization limit could be set such that CPU utilization cannot exceed 50% of allocation
for 20 consecutive minutes, where the allocation of hardware is based upon a 3–core system. The
utilization limit message would read:
CPU utilization may not exceed 50% of allocation or 1.5 cores for more
than 20 minutes.
With percentage of time limits
A percentage of time utilization limit could be set such that CPU utilization cannot exceed 50%
of allocation for more 10% of the time, where the allocation is based upon a 3-core system. The
utilization limit message would read:
CPU utilization may not exceed 50% of allocation or 1.5 cores for more
than 10% of the time.
Scope of utilization limits
Utilization limits can be set to apply broadly or narrowly within the Capacity Advisor user
interface:
Measuring and analyzing resource utilization 29
Page 30

• Globally. These limits apply to every workload, wherever workloads are analyzed.
• By Workload. These limits apply to one specific workload, wherever that workload is analyzed.
• Scenario-wide. These limits apply to every workload within one specific scenario.
• By Scenario Workload. These limits apply to one specific workload within one specific scenario.
When a workload falls within more than one scope, only the more specific one applies, as shown
in the table below.
You can disable a more specific scope where you do not want a specific scope to apply.
Table 3-2 Scope of utilization limits
OverridesDescriptionLimitsScope
More
global
More
Local
Global Utilization
Limit
Workload
Utilization Limit
Scenario
Utilization Limit
Scenario
Workload
Utilization Limit
Adjusting power
With the cost of power increasing, power has become a resource that you may want to measure
and manage. Within HP Insight Dynamics suite, power metrics, graphs and reports are displayed
for actual systems and for systems within capacity planning scenarios.
NOTE: You can calibrate power for physical systems (including virtual partitions), but not for
virtual machines.
utilization limit is not provided.
• Cannot be disabled
utilization limit is provided.
• Can be enabled or disabled
• Applies to all workloads within a scenario for which a more
specific utilization limit is not provided.
• Can be enabled or disabled
• Applies to a specific workload within a scenario.
• Can be enabled or disabled
• Nothing• Applies to all workloads for which a more specific
• Global• Applies to a specific workload unless a more specific
• Global
• Workload
• Global
• Workload
• Scenario
To make the power data as accurate as possible, you are provided with the opportunity to calibrate
power usage using data collected from actual systems, or you can supply your own values.
Power cap data
The power cap function on some HP hardware allows you to set a limit in watts for a server, and
the server will ensure that its power consumption never exceeds that limit. That, in turn, can
reduce power and cooling costs. It can also help to ensure that a data center does not draw more
energy from the power grid than it is allocated to use, reducing the likelihood of experiencing
unplanned downtime necessary to stay within a power allocation limit.
The potential drawback to not setting the power cap high enough is degraded hardware response
time, which an administrator can rectify by adjusting the cap -- or accept in exchange for the
associated savings. For detailed information on how power caps work in HP hardware, see HP
Insight Power Manager.
Capacity Advisor gives you insight into the current power cap for HP systems that have these
options available and operating. Within Capacity Advisor, you can generate a power report to
see historic power usage data that includes power cap settings and estimated enforcement time.
The following image shows an example of the power cap data included in a Capacity Advisor
power report.
30 Key Capacity Advisor concepts
Page 31

The power caps settings shown are provided by the administrator who is managing power
consumption of servers. Capacity Advisor obtains these settings and the enforcement data for
reporting purposes from HP Insight Power Manager. For information on how to generate a
Capacity Advisor report that includes power usage data, see “Producing graphs and reports”
(page 67).
Automating solution generation: HP Smart Solver
HP Smart Solver: Types of solutions
These planning scenario simulations can be automated:
Consolidation to virtual machines You can simulatethe consolidation of existing physical systems
into virtualized resources, thereby converting the physical systems into VM guests hosted on
VM hosts. To create the simulation, you can use data from existing VM hosts or create
template-generated “what-if ” systems based on characteristics that you specify. This feature
makes it possible for you simulate a replacement or upgrade of existing legacy systems to fewer
systems hosting virtual machines.
Workload stacking You can simulate stacking individual workloads onto existing servers
and/or onto template-generated “what-if” systems based on characteristics that you specify. This
facility allows you to consolidate existing workloads into as few systems as possible.
Load balancing You can simulate balancingsystem loads across several servers, virtual machines,
or virtual machine clusters, such that workloads are distributed evenly across a set of resources,
without overloading the subset of the servers.
TIP: Use a Scenario comparison report to compare the headroom starsrating for saved scenarios.
Determining trends in Capacity Advisor
Determining trends from collected utilization data can be a challenging task. Accurate trend
analysis requires adequate historical data and an understanding of the cyclic nature of the data
being analyzed as well as any special events that might be found in the historical data.
• Trends are frequently small values, on the order of percents or fractions of a percent per
month.
• The cyclic data can easily be orders of magnitude greater than the trend (heavy calculations
the day before payroll distribution, floods of users logging on after work on the East coast,
and so on).
• Special events can also be orders of magnitude greater than the trend (seasonal promotions,
once per year calculations such as taxes).
Any algorithmic analysis must be able to deal with these problems. HP Insight Capacity Advisor
software combines aggregation of points based on known business cycles to deal with cyclic
patterns with exclusion of points to deal with special events, to provide data for a linear regression.
Automating solution generation: HP Smart Solver 31
Page 32

Aggregation of points in business interval bins
To reduce the impact of cyclic changes in the historical data, a user-specified business period is
used to break the data into time-interval based “bins” and each bin is then represented by a
single point. The point can be the average, the peak, or the 90th percentile of the data (90% of
the points are less than the value). A bin will not be used unless the percent of points within the
bin that are valid exceeds the threshold you have specified.
IMPORTANT: A trend will not be calculated unless at least two bins with an adequate percentage
of valid points exist within the range of data being analyzed.
Choosing an appropriate business interval
It is crucial to have a significant amount of data for analysis. Choosing an appropriate business
interval with a data collection period that is long enough helps to ensure that you have enough
data for a useful analysis. For example, a business interval of 1 week and data collection period
of 1 month provides only four aggregate data points. This is insufficient to provide meaningful
results.
To improve results, for this example, use a business interval of 1 day with a data collection of 1
month to provide 30 data points, or use a business interval of 1 week with a data collection of 6
months to provide 26 data points. Modifying the business interval and/or the data collection
period gives you more flexibility in arriving at a significant amount of data for analysis.
Exclusion of data points
You can set the report period to exclude a special event or mark the time period invalid to exclude
points collected during that period from a trend analysis.
Factors that affect data validity
Within any data collection period, events can occur in the polled systems that affect the quality
of data available during that time period. Capacity Advisor identifies data points that could
adversely affect the quality and validity of report results.
The following are examples of events that Capacity Advisor can recognize (and disregard) as
potential sources of invalid points:
• System downtime during the collection period.
• Out of the ordinary activity designated by you. You can manually designate time periods
as invalid when you know resource usage has been outside the norm that you want to
consider in your capacity planning.
• Partial collection from a virtual machine or a VM host. When Capacity Advisor is unable
to apply a correction that accounts for all activity on a VM host, it marks any partial data
collection as invalid.
How this relates to setting a validity threshold
The Validity Threshold that you set should reflect your tolerance for obtaining a sufficient amount
of valid data in the collection period that you designate. If the reports that you run show that
the given threshold is not obtainable for the designated time period, this may indicate that many
of the data points in the designated collection period are invalid.
In this case, you can choose a lower Validity Threshold with the understanding that the report
outcome may be a less reliable indicator of probable resource usage, or you can select a different
or longer data collection period to improve the likelihood of obtaining a sufficient percentage of
valid points for a good report.
32 Key Capacity Advisor concepts
Page 33

Linear regression
The linear regression is based on a least squares fit that minimizes the sum of the squares of the
vertical offsets between each of the aggregate points and the trend line that describes them.
TIP: Regressions performed over small data sets are not always meaningful and can be
misleading. Any trend analysis based on less than a dozen aggregate points should be carefully
compared with the historical data to see if it "makes sense." The maximum number of data points
for the trend analysis is the total time for the report divided by the business interval, because
business intervals can be excluded if they do not meet the validity criteria.
Because the trend is reported as an annual growth rate, it is best to have more than a year of
historical data before trying to analyze trends.
Error analysis
You can choose to include error analysis in the report. The following error value is available:
r-squared: r2is the square of the correlation coefficient (r), and is used in the 'goodness of fit'
analysis of trend estimations. r is a value between 0 and +/- 1. where values approaching +/- 1
indicate increasing validity of the data representation.
Forecasting growth
HP Insight Capacity Advisor software forecasting allows you to combine a range of historical
data (the forecast data range) with a predicted trend (the annual projected growth rate) to produce
a forecast model. The forecast model can be used to provide an estimate of future utilization.
Whenever a Capacity Advisor report or profile is generated with an end date later than the
current date, the historical utilization data must be projected into the future. The projection is
indicated in the utilization graphs by a colored background. This projection is done based on a
forecast model. Forecast models can be defined globally, for individual workloads or systems, for
a scenario, and for individual workloads within a scenario. Because the process for defining a
forecast model is basically the same regardless of where it is in the hierarchy of forecast models,
the procedures below are broken into two parts: accessing the forecast model and defining it.
The forecast model hierarchy
The forecast model can be specified at four different levels within Capacity Advisor, with more
specific forecast models overriding more general models, as indicated in the following table:
Table 3-3 Forecast models
Global Forecast
Workload Forecast
OverridesDescriptionForecast
• NothingApplies to all workloads in Capacity
Advisor for which a more specific
forecast is not provided.
• GlobalApplies to a specific workload in
Capacity Advisor unless a more
specific forecast is provided.
Scenario Forecast
Scenario Workload Forecast
Applies to all workloads within a
Capacity Advisor scenario for which
a more specific forecast is not
provided.
Applies to a specific workload within
a Capacity Advisor scenario.
• Global
• Workload
• Global
• Workload
• Scenario
Forecasting growth 33
Page 34

Forecast model attributes
Table 3-4 Forecast model attributes
DescriptionField
Description
Forecast Data Range Selection
Automatically adjust the specified
range to use existing data
Annual Projected Growth Rate
Descriptive text of this model for your use.
Defines the set of historical data on which the forecast will be based. If the
selected set contains invalid data at the end of the period, the forecast will
consider the last valid data to be the end of the period. The forecast data
range can be specified as:
• A fixed interval ending or beginning on a specific date
• A float interval ending after a specified time period
• An absolute interval between two selected dates
When this feature is checked, automatic adjustmentof the specified range
is enabled. If the box is checked, and the selected scenario does not have
existing data in the specified range, then the range is shifted to use the
existing data. If the existing data range is shorter thanthe specified forecast
range, then the forecast rangeis shortened to fit the available data. Default:
on (checked)
Removing the check mark from the box prevents a forecast from being
generated until a data range is specified that contains an interval of
collected data sufficient to fill the forecast period.
Example: Assume that you want to view activity one week (7 days) into
the future using the most recent week of data. However, in this particular
week, only four days of data were collected. With this featured turned on,
the future will be tiled with repetitions of the four days of data until the
forecast interval is filled.
Specified in percent for each utilization resource measured (CPU,memory,
network I/O, and disk I/O).
Use positive values for increasing utilization, negative values for
decreasing utilization, or zero to indicate no change. Default: zero (0)
Annual project growth rates in force for a workload within a scenario are
displayed in the Scenario Workloads Resource Utilization table on the
Edit Scenario Workload tab.
NOTE:
Combining the data range with the annual growth rate The forecast is applied point-by-point
to the historical data within the range specified by the user. It is applied linearly, so that a point
1 year from the starting point of a forecast is the result of the full growth rate being applied to
the data. The data within the range provided by the user is used to “tile” the future by applying
the portion of the growth rate appropriate to each point to each point in the data range and
repeating the data set until the desired end point is reached.
34 Key Capacity Advisor concepts
Page 35

4 Planning with Capacity Advisor
Getting ready
In order to get maximum value from the Capacity Advisor tools, it is important to:
• Be familiar with the Insight Dynamics framework
• Be familiar with the basic operation of Capacity Advisor
• Be familiar with Virtualization Manager
• Have a clear question you are trying to answer
• Have plenty of utilization data collected for Capacity Advisor
• Have appropriate access roles on the servers about which you are developing the plan
• Understand the equipment well enough to know what is physically possible (such as the
maximum number of CPU cores) and what is practical (such as when to use 1 GB DIMMs
with lots of slots versus when 4 GB DIMMs are more appropriate.) HP software can account
for various power saving associated with specific DIMM.
In addition, it can be very valuable to collect data on a test system to understand the real utilization
characteristics of the applications you are considering.
Task: Understand current resource usage
For specific descriptions of each field shown on the user interface screens, click the on the
software screen.
Table 4-1 Checklist — Obtaining reports on current resource usage
Related procedure(s)Task
Collect datafor a period of time that fully reflects
your business cycle(s).
Run utilization reports for selected resources of
interest.
resources.
• “First data collection (orthe automated nightly collection)”
(page 58)
• “Modifying a collection schedule” (page 61)
• “Ascertaining the data collection availability for a set of
servers” (page 66)
• “The report wizard” (page 71)
• “Creating an historic utilization report” (page 72)
• “Creating a cost allocation report” (page 76)Estimate current cost allocation for selected
Getting ready 35
Page 36

Task: Plan server consolidation
This section starts with a general procedure for consolidating servers (“Understanding the
consolidation task” (page 36)), followed by an example of manual server consolidation (“Example
consolidation: Stacking applications on an existing server” (page 36)). The second half of this
section shows how to automate server consolidation using the HP Smart Solver (“Automating
the consolidation task” (page 46)); also followed by an example (“Example consolidation:
Automating stacking on a “what-if” server” (page 47)).
Understanding the consolidation task
There are three fundamental approaches to consolidating servers:
• Stacking workloads (representing applications) into standalone servers or nPartitions.
• Stacking virtual machines onto a single physical system or nPartitions.
• Stacking nPartitions and virtual partitions into complexes.
The task description below is based on stacking server workloads onto one virtual machine and
VM host. For other consolidations, the changes made when editing the scenario would differ.
Prerequisites
• You must have already collected data on the systems of interest (see “Gathering data for
Capacity Advisor” (page 55)).
• You should be familiar with Capacity Advisor operations (see “Procedures” (page 55)).
• You must be logged in to Insight Dynamics (see “Accessing Capacity Advisor” (page 55)).
For specific descriptions of each field shown on the user interface screens, click the on the
software screen.
Table 4-2 Checklist — Consolidating server loads onto a virtual machine manually
Related Procedure(s)Task
• “Creating a consolidation candidates report” (page 76)Determine which systems to consolidate (both to
and from).
• “Creating a planning scenario” (page 86)Create a planning scenario.
Run reports on the scenario systems.
(Include this step if you want to obtain a baseline
set of reports to compare your scenario changes
against.) See also “Task: Understand current
resource usage” (page 35).
Edit the scenario copy:
• Set up the new VM host system.
• Modify resources on systems as needed.
• Make each system to be consolidated become
a VM.
• Modify utilization limits, if desired.
• “Creating an historic utilization report” (page 72)
• “Creating a cost allocation report” (page 76)
• “Creating a system” (page 93) or “Adding an existing
system” (page 94)
• “Editing a system” (page 94)
• “Changing servers to be VMs (manually)” (page 95)
• “Setting global utilization limits” (page 79)
• “Creating a scenario utilization report” (page 73)Evaluate new quality of service
• “Creating a cost allocation report” (page 76)Estimate new cost allocation on the VM host
Example consolidation: Stacking applications on an existing server
This example demonstrates how Capacity Advisor can be used to simulate converting physical
servers to virtual machines, and to then stack those VMs onto one VM host.
Assume that you have a set of legacy servers that currently support one application each. There
is good data on resource utilization for each of these servers, and it is time to see if converting
these application servers into VMs and then consolidating the VMs onto fewer VM hosts can
36 Planning with Capacity Advisor
Page 37

free up resources for other uses. For purposes of this example, it is assumed that the applications
will each run in their own virtual machine.
This task requires a profound knowledge about the systems.
• What are the licensing requirements for the applications?
• Who owns each of the systems and, if they are owned by different organizations, are they
agreeable to the consolidation?
• What are the security requirements?
• What are the networking requirements (LAN and WAN)?
• Are there Storage Area Network (SAN) requirements?
• How stable are the applications? All of them should be test and development systems or
production systems.
This list is illustrative; other questions may need to be answered for your particular environment.
The steps referenced in the following titles are from the checklist in Table 4-2 (page 36).
Step 1: Determine which systems to consolidate
From the top menu bar, select Reports→Capacity Advisor→Create Consolidation Candidates
Report...
On selecting the systems link, a screen opens listing all discovered servers for which data has
been collected (both physical and virtual machines). For the purposes of this exercise, assume
that 20 physical servers are selected as targets, and that you are most interested in viewing CPU
and memory data for these servers.
Once the report is generated, viewing the columns Average CPU Use and Average Memory
Use for each of the servers reveals that the applications on all but four servers are using
significantly less than the available memory and CPU on each server. (See “Consolidation
candidate report” (page 157) for a snippet of a typical consolidation candidates report.)
This report shows that CPU on this set of legacy servers is significantly under-used when average
usage is considered. Only four of the servers are using 80 percent or more of available memory
on average.
Assume that all of the legacy systems:
• are running applications based on the same database program, which is licensed per CPU
• use the same LAN
• use the same SAN
• have minimal security requirements that are adequately provided by the corporate firewall
Related topic
• “Creating a consolidation candidates report” (page 76)
Step 2: Create a scenario
In this step, you want to build a scenario around the systems that you have identified as
under-used from the consolidation candidates report.
1. Select Tools→Capacity Advisor from the top menu bar.
2. On the Capacity Advisor tab, select Create→Planning Scenario....
3. In the Create Scenario Wizard, name the scenario and describe its purpose.
4. On the Systems screen, click Add to open the list of servers available for use in the scenario.
Select the check boxes for the systems that you want to include in the scenario and click Add
again.
To understand the readiness of a system for use in a scenario, mouse over the status icon
for information. A detailed explanation of the status icons, including pointers to
troubleshooting information, is available in Capacity Advisor Help online (see “Correcting
Task: Plan server consolidation 37
Page 38
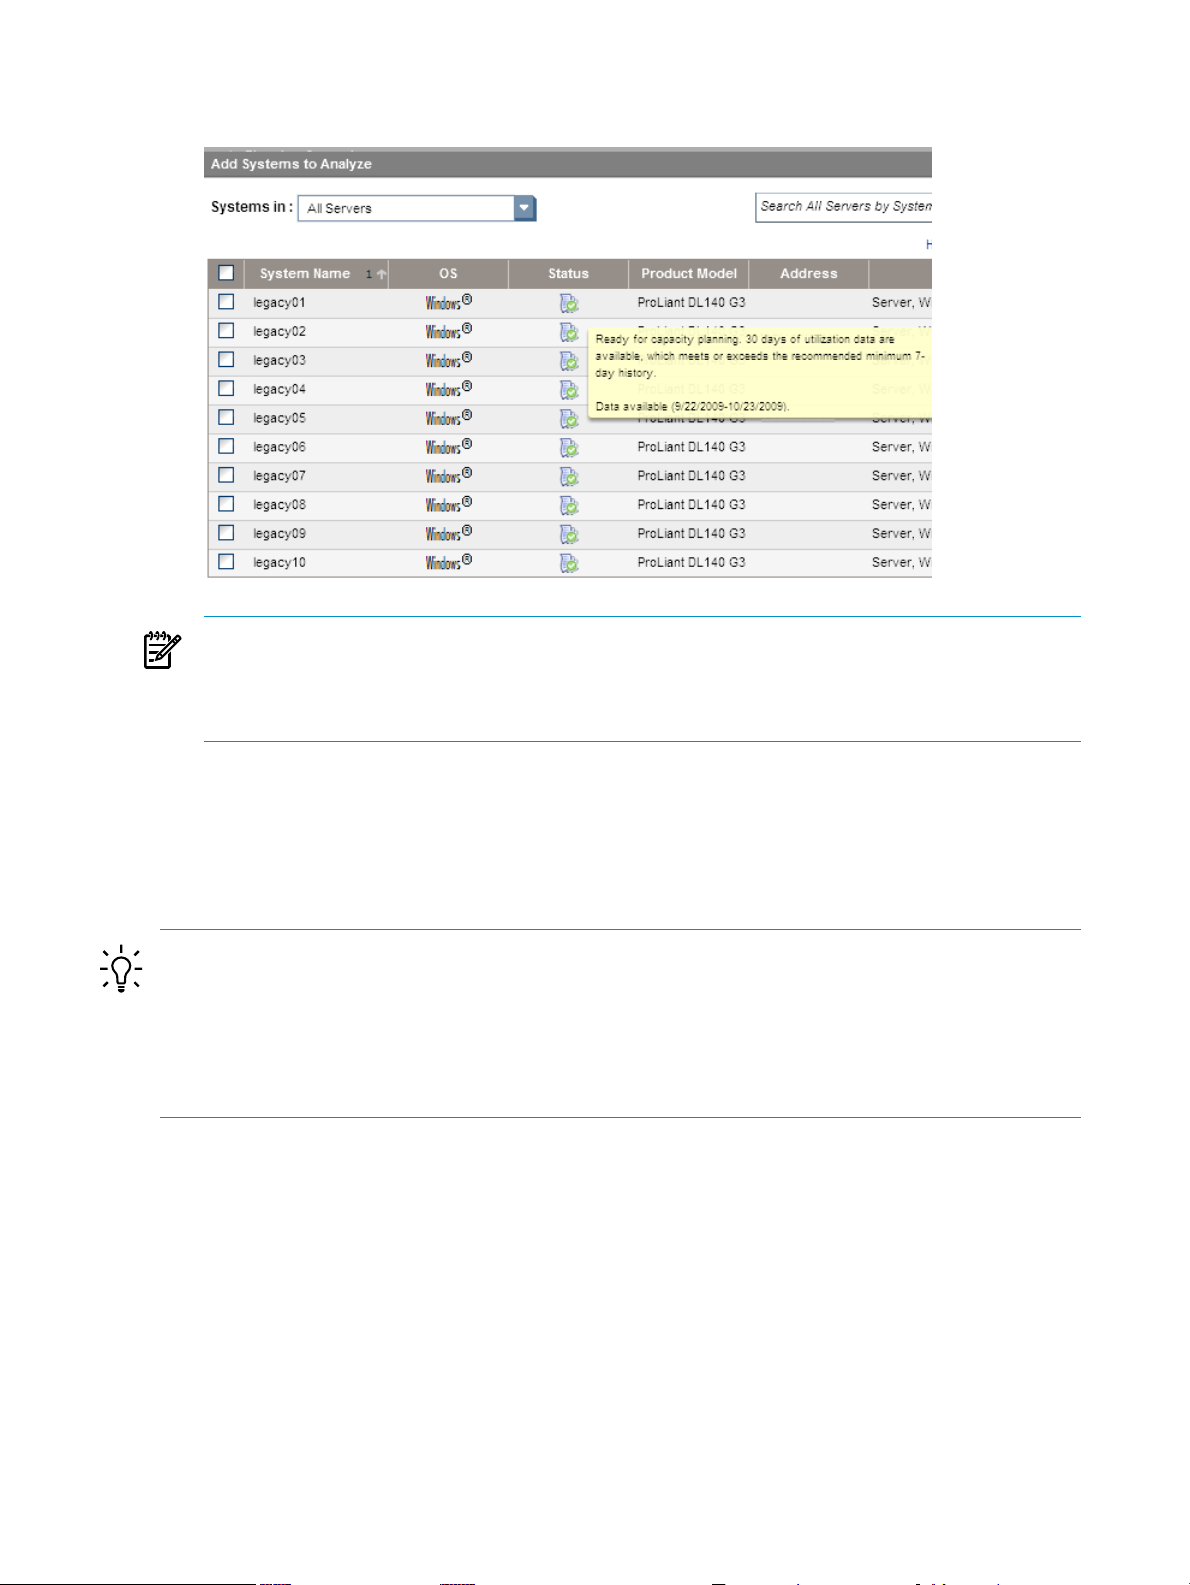
system configuration”). The following image shows the mouseover text for a system that
has sufficient data collected for meaningful analysis.
NOTE: While the default setting for a scenario is to recommend at least seven days of data
to use for analysis, one carefully selected day can be sufficient to simulate your desired
conditions; or you may need 30 days or more to reflect your business cycle. For best results,
obtain a data set that best reflects the business interval that you want to simulate.
5. Check the Summary and verify that the scenario name and selected systems have been
entered correctly.
6. Click Finish.
When finished creating a new scenario, the Edit Scenario screen automatically opens for editing
the new scenario (default behavior).
TIP:
To return to a scenario at a later time... Should you be unable to edit the scenario immediately
(or should you want to first make a copy of the scenario to modify), you can find the scenario
later by locating the name of the scenario in the list presented on the Capacity Advisor tab
screen. Click the scenario name to open the Capacity Advisor - Edit Scenario window for that
scenario.
Related topic
• “Creating a planning scenario” (page 86)
Step 3: Edit the scenario
The systems included in the scenario are listed on the System tab of the scenario editor. The bar
meters in the table show the peak resource utilization from data collected for the current week
(the default setting). The following image shows three systems and their workloads.
38 Planning with Capacity Advisor
Page 39

Figure 4-1 Example of bar meters on a System tab in the scenario editor
The weekly data is representative of recent utilization and can be calculated quickly, but doesn't
always give a comprehensive picture.
For a more comprehensive picture, look at a month of data. Change the data range to a month
by clicking Edit Interval and selecting “Month” from the first drop-down list, and then OK.
Once the screen has refreshed, new information about resource utilization is available. In this
case, you can see that some of the utilization peaks have increased.
Scrolling or paging through the list of servers, you can see that some of the servers have peak
usage that is at 100% of the resource, an insight you were not able to glean from the consolidation
candidates report. The following image shows a server in this situation (legacy08).
The red bars in the CPU utilization column indicate that the utilization limits assumed for this
scenario have been exceeded, though the available resource capacity has not. Mousing over the
Task: Plan server consolidation 39
Page 40
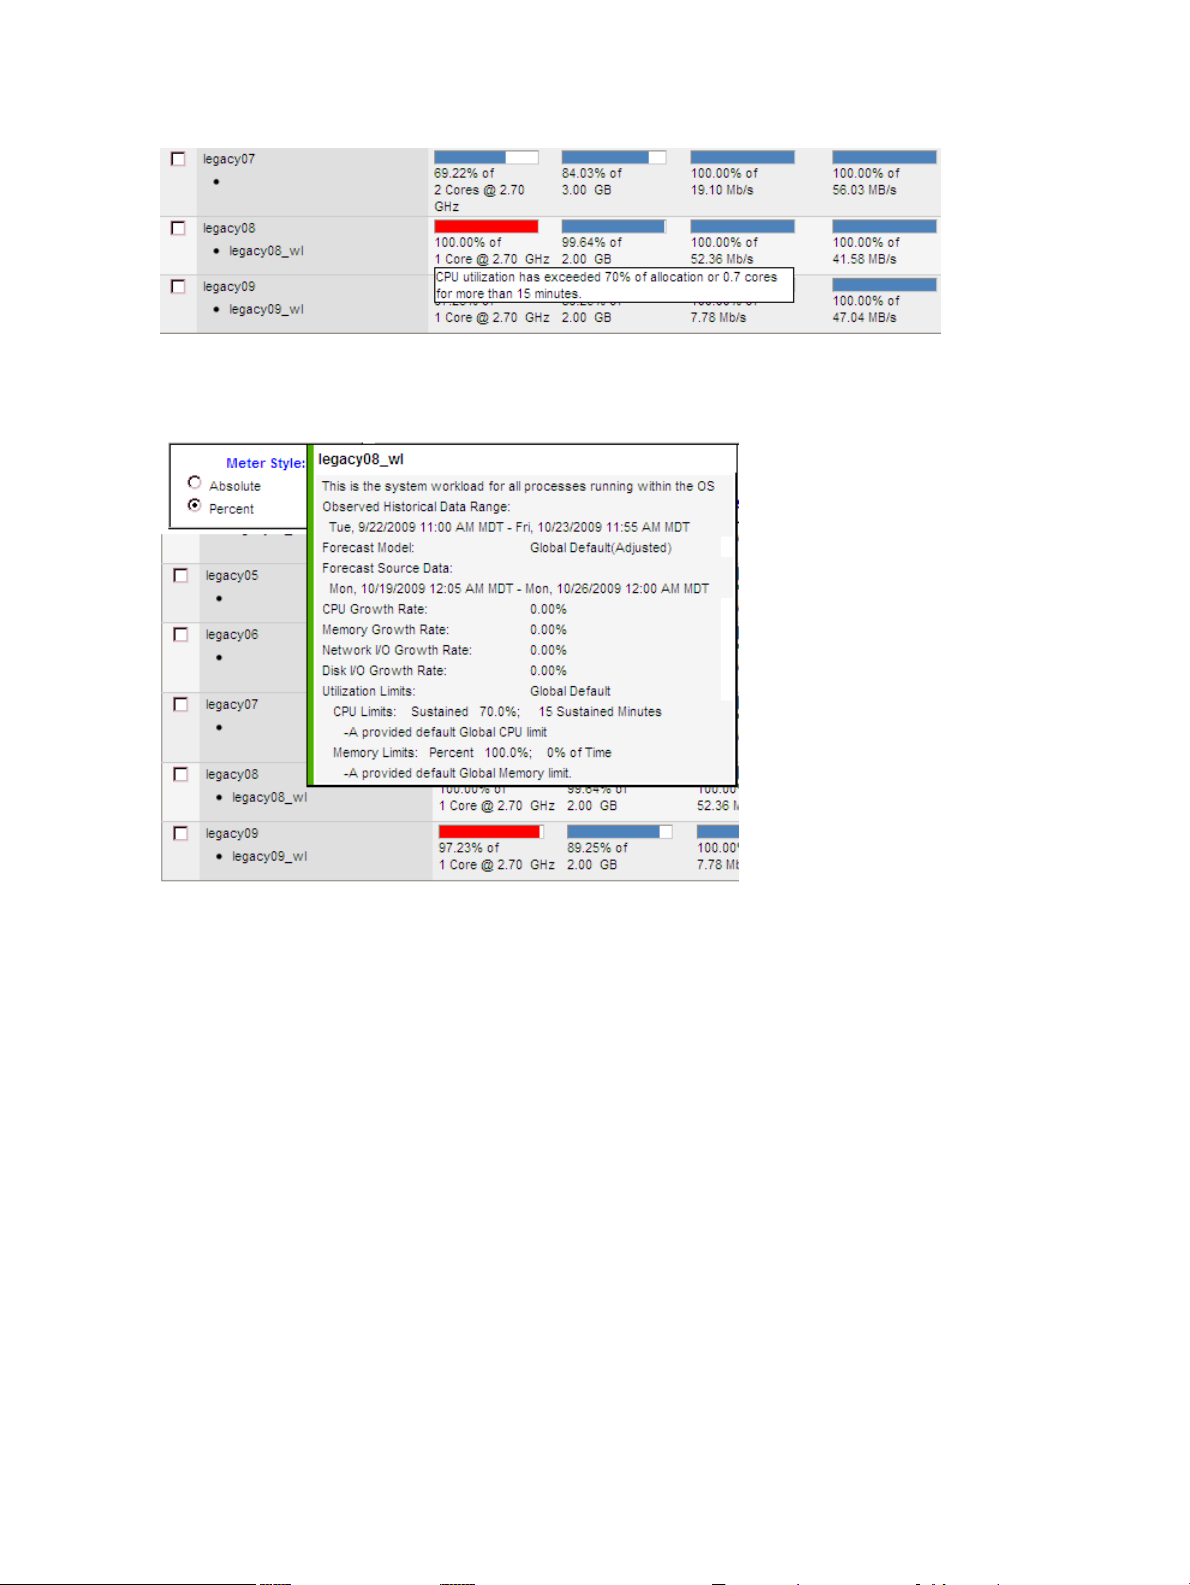
legacy08 CPU utilization bar, you can see a pop-up message indicating the CPU utilization
limit that is exceeded:
More information about the utilization limits can be obtained by mousing over the workload
name (legacy08_wl), as in this image:
Now look at a few profiles for CPU usage. Click the legacy08 CPU utilization bar. A profile
viewer for the selected resource and system opens, showing this information:
40 Planning with Capacity Advisor
Page 41

Looking at the legacy08 graph, you can see that processing frequently requires 100% of available
CPU in a month-long period. Also, it appears that the activity on this system exceeds 70% of the
utilization resource for 15 sustained minutes, the utilization limit found earlier for this system.
By studyingthe Interval Metric Summary table, you can seethat 90% of the application processing
was measured at using .47 core or less. Less that 10% of processing measured on this server
required more than .5 core.
Now open theprofile viewer forCPU utilizationon legacy03. The blue bar meter for this server
(on the System tab) indicates that activity on this server does not exceed utilization limits.
Task: Plan server consolidation 41
Page 42
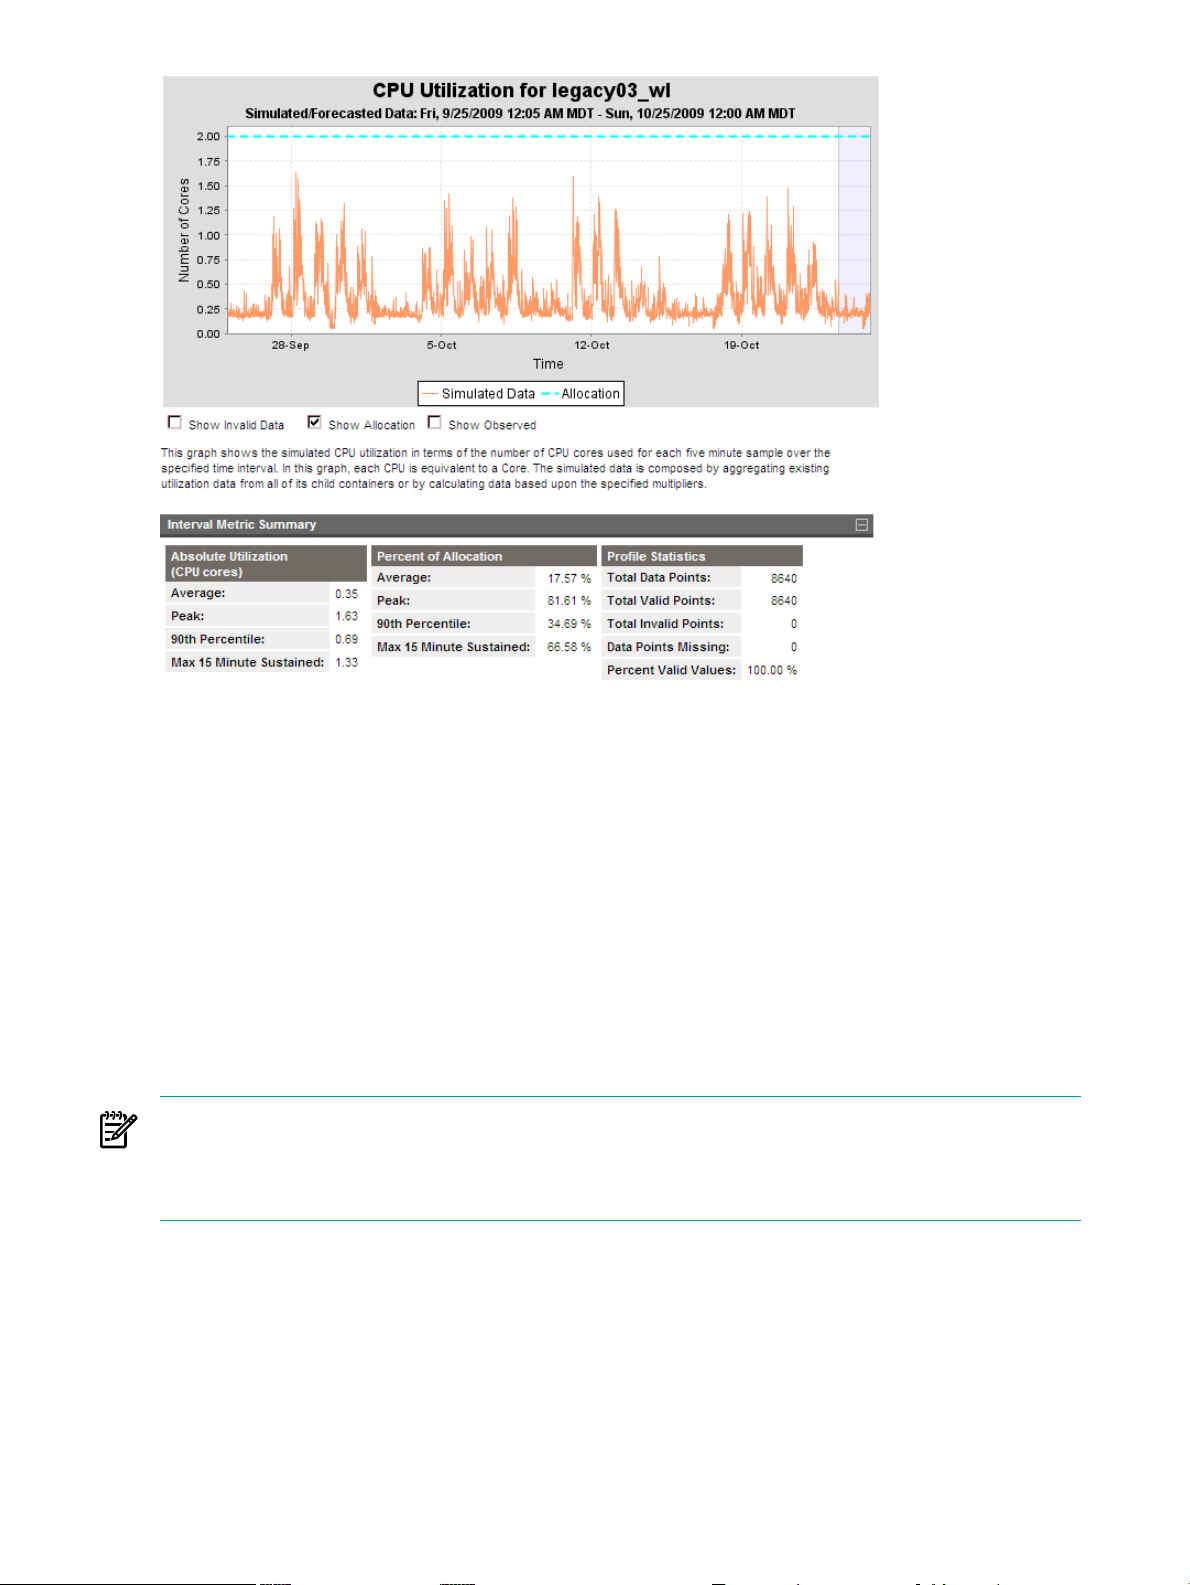
The application on legacy03 has a 2-core processing capacity. A significant gap exists between
Average use (.35 cores) and Peak use (1.63 cores), as can be seen in the Interval Metric Summary.
Comparing CPU core usage at the 90th Percentile (90% of usage measures fall below this value
– 0.69 cores) with the Peak usage (1.63 cores), you can see that almost 1 core is required to support
10 percent of CPU use on this server.
Adding a VM host to the scenario
As of yet, this scenario does not include a VM host on which the virtual machines can be put
once you create them. Click Edit→Add Existing System... on the System tab.
A list of discovered systems displays on the Add Existing Systems screen. Select two or three
VM hosts that seem likely to be able to host the additional VMs. Click OK to include them in the
scenario.
The System tab screen now displays the VM hosts in addition to the initially selected systems:
NOTE: This example has been intentionally constructed to exercise a number of Capacity
Advisor screens. Careful study of the utilization meters on the System tab can help you anticipate
changes that you will need to make in resource provision or allocation before you try to consolidate
systems.
Related topics
• “Adding an existing system” (page 94)
Making servers become virtual machines
Select the check boxes for servers that are to become virtual machines, and then select What-If
Action→Change Servers to be VMs→Manually Change Servers to be VMs...
For this example, 10 legacy servers were selected – 4 of which exceeded utilization limits assumed
by Capacity Advisor.
42 Planning with Capacity Advisor
Page 43

The Manually Change Servers to be VMs... screen opens, and by scrolling down, you can see
an evaluation of the current fitness of the selected VM hosts in relation to the proposed addition
of the legacy servers:
By studying this table and the key, you may have already concluded:
• None of the servers meet an acceptable level of fitness as described by the headroom rating.
• Two servers (tornado and orthus) would require additional CPU and additional memory
to host all ten of the legacy servers.
• One server (vse02) might have enough memory, but would require more CPU. Also, the
demands on network and disk I/O would exceed resource capacity.
• The remaining server (hypv2) could have more memory and CPU added, but would still
be short on network and disk I/O.
• The ten selected legacy servers will not fit on any one of the hosts present in the scenario.
At this point, you could do one of several things:
• Add another existing system having more memory and CPU and small use of network and
disk I/O to the scenario.
• Create a “what-if” system in the scenario that is sized to accommodate the ten legacy servers.
• Put fewer legacy servers on one of the systems already in the scenario.
This example will continue with the third option — putting fewer legacy servers on one of the
systems already in the scenario.
By cancelling the “Manually Change Servers to be VMs” operation, you can return to the scenario
editor System tab to try this operation again; this time selecting 5 of the legacy servers, with this
result:
Task: Plan server consolidation 43
Page 44

This time, vse02 looks like the best VM host candidate in this scenario, as long as additional
CPU are added to it to handle the additional processing load.
Adding processor cores
A look at the peak usage data shows that the usage of the CPU core allocation varies among the
five servers, but usage still appears to be within the bounds of a server having no more than 8
cores. However, Capacity Advisor will expect to calculate CPU processing overhead for running
each of the virtual machines. Eight cores may not be enough when CPU virtualization overhead
is accounted for, but for now add 4 cores to vse02 for a total of 8 cores.
NOTE: You can refine this estimate further by changing utilization limits or by forecasting
future growth. Also, the longer the period of data analyzed, the better the analysis of resource
utilization.
From the System tab, select the vse02 check box, and then What-If Action→Edit System....
Change the number of CPU cores from 4 to 8 and click OK.
Other attributes such as memory size, processor speed, and bandwidth can be adjusted at the
same time on the Edit System screen. Thus, you can tweak the resource allocations on this screen
as you refine the fit through additional changes.
Related topic
• “Editing a system” (page 94)
Continuation: Making servers become VMs
Once again, select the five servers that are to become virtual machines and then select What-If
Action→Change Servers to be VMs→Manually Change Servers to be VMs...
When the screen repaints, you first see the selected legacy servers listed. In the CPU Virtualization
Overhead column, you have the opportunity to designate the percentage of overhead that you
anticipate each virtual machine will require for operation. After referring to “Adjusting for
virtualization changes” (page 127), add a CPU virtualization overhead of 20% for each of the
legacy servers. You must click Refresh (which is down and to the right of the “Systems to be
44 Planning with Capacity Advisor
Page 45
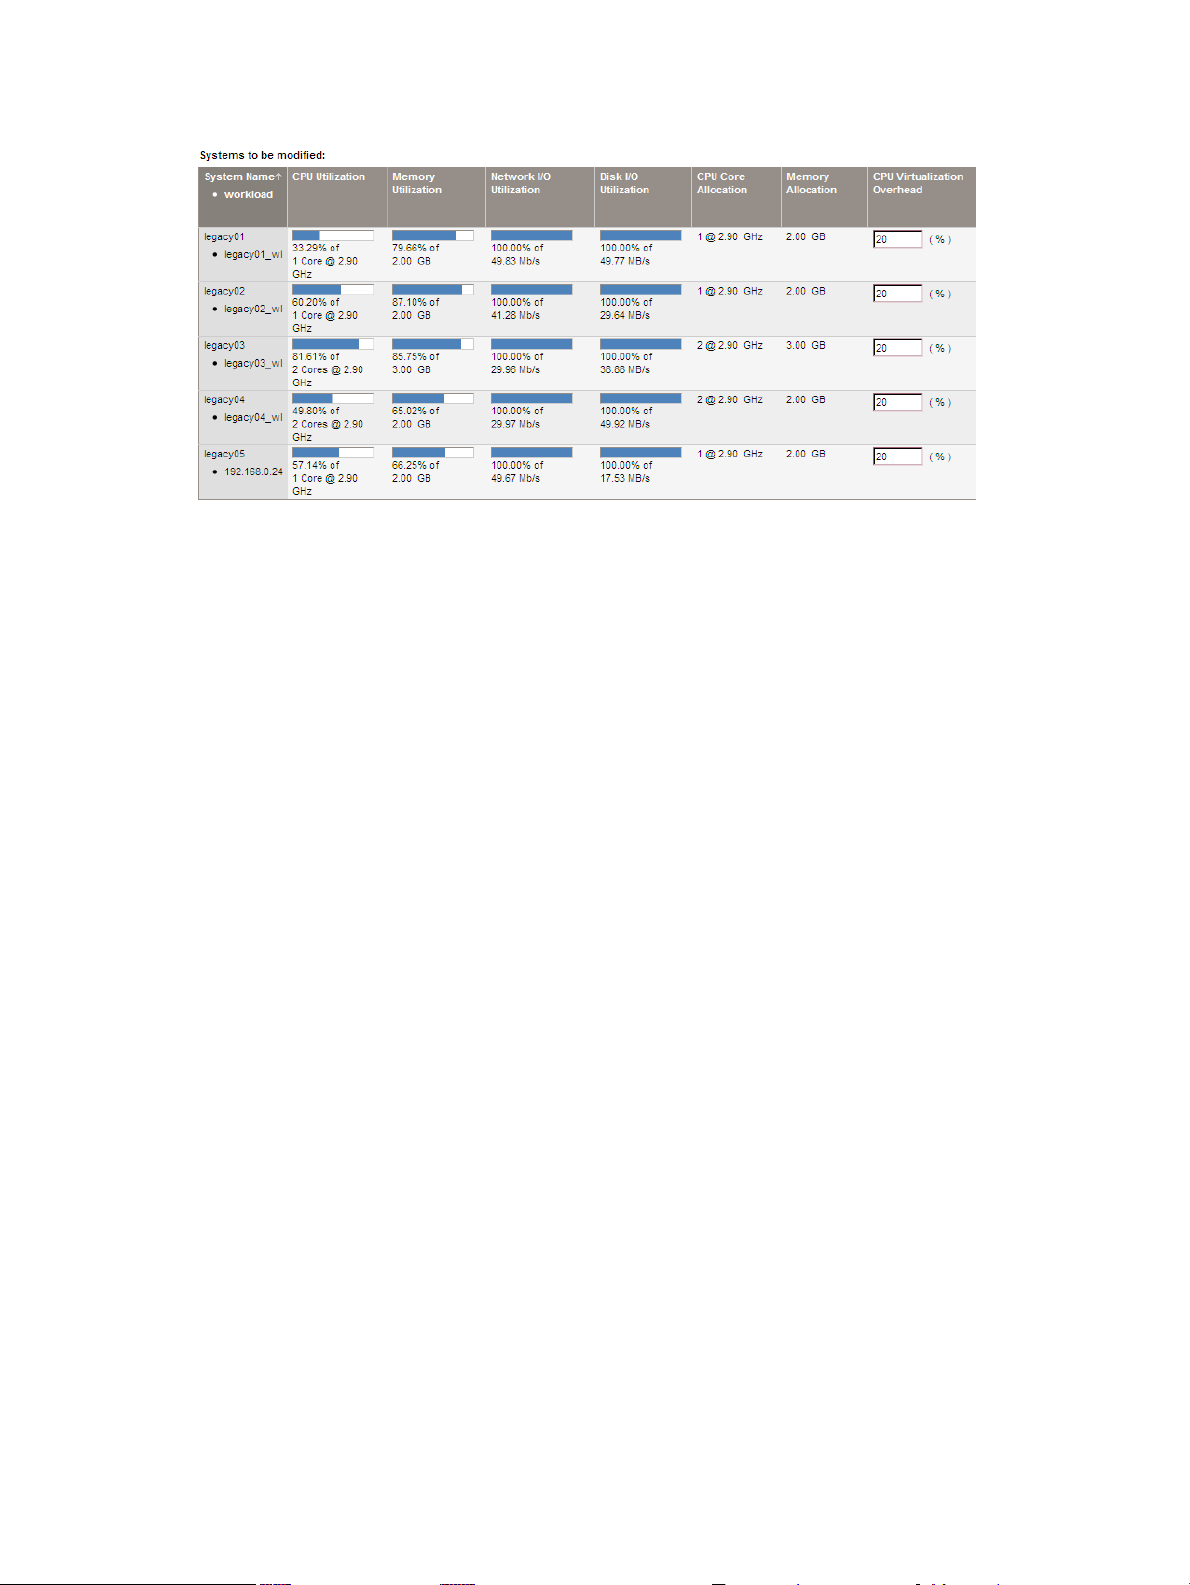
modified table”) in order to update the “To: (Selected VM host)” table to include virtualization
overhead in the utilization calculations.
Leave the default setting for headroom calculations as it is — exclude guest fitness results (no
fitness rating will be considered for individual VMs in the calculation, only for the VM hosts as
a whole).
Study the To: (Selected VM Host) table and make adjustments if needed.
For purposes of this example, the utilization limit will be changed.
Click OK to complete the conversion of servers to virtual machines.
Related topic
• “Changing servers to be VMs (manually)” (page 95)
Changing the utilization limit for the scenario
Assume that it will be sufficient to limit CPU utilization to 80% of capacity and that memory
utilization limits do not need to change.
Select Edit→Scenario-wide Utilization Limits on the scenario editor menu bar.
Add a new CPU utilization limit of 80% for 15 sustained minutes, and remove the previous limit
of 70% for 15 sustained minutes. The screen looks like this when these changes have been made:
Task: Plan server consolidation 45
Page 46
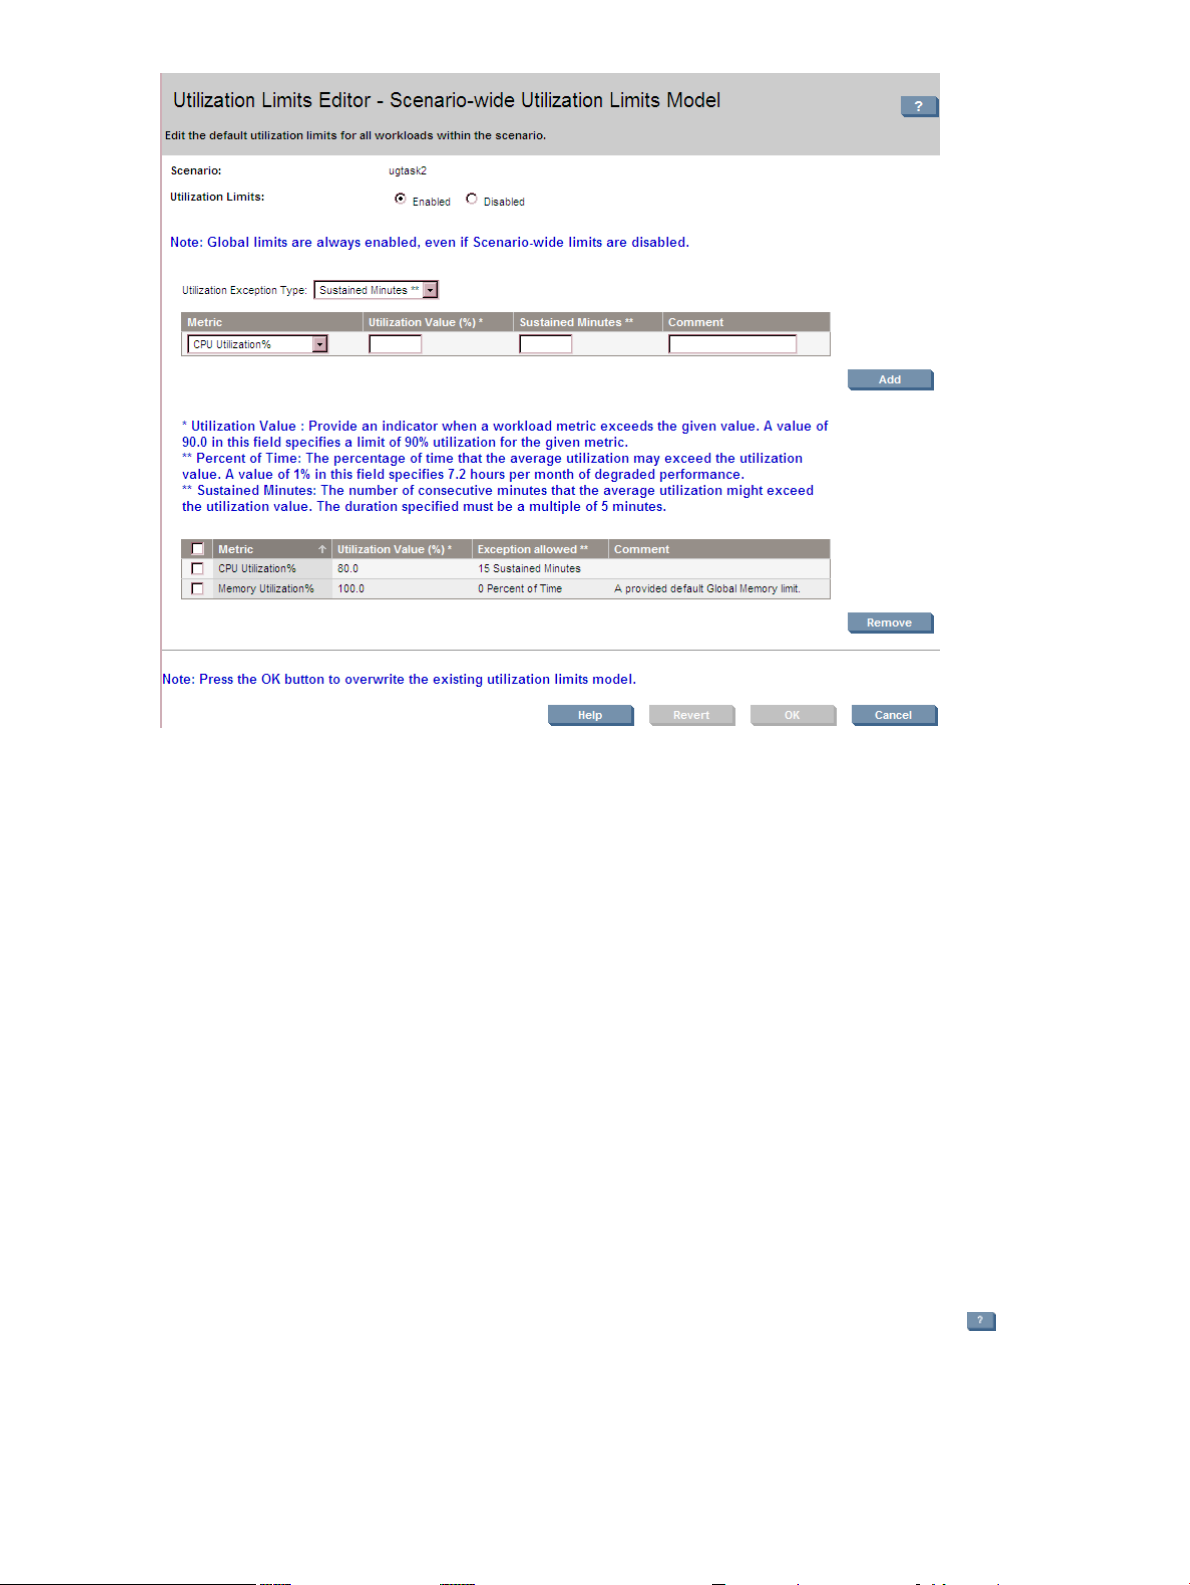
Click OK to save and apply the changes.
Related topics
• “Utilization limits ” (page 27)
• “Setting scenario-wide utilization limits” (page 80)
Automating the consolidation task
The preceding sections demonstrated a basic progression through Capacity Advisor screens
where each step required manual evaluation and adjustment. The time this takes is not too
laborious for a few machines, but you may need to evaluate possibilities among hundreds of
machines. This section shows you how the HP Smart Solver simplifies evaluating a large number
of opportunities for consolidation.
The task description below is based on stacking server workloads onto virtual machines and VM
hosts. For other consolidations, the changes made when editing the scenario would differ.
Prerequisites
• You should be familiar with Capacity Advisor operations (see “Procedures” (page 55)).
• You must be logged in to Insight Dynamics (see “Accessing Capacity Advisor” (page 55)).
• You must have already collected data on the systems of interest (see “Gathering data for
Capacity Advisor” (page 55)).
For specific descriptions of each field shown on the user interface screens, click the on the
software screen.
46 Planning with Capacity Advisor
Page 47

Table 4-3 Checklist — Consolidating server loads onto a virtual machine using automated solution
finding (HP Smart Solver)
Related Procedure(s)Task
• “Creating a consolidation candidates report” (page 76)Determine which systems to consolidate (both to
and from).
• “Creating a planning scenario” (page 86)Create a planning scenario.
Run reports on the scenario systems.
(Include this step if you want to obtain a baseline
set of reports to compare your scenario changes
against.) See also “Task: Understand current
resource usage” (page 35).
Edit the scenario copy:
• Set up the new VM host system(s).
• Make each system to be consolidated become
a VM.
• “Creating an historic utilization report” (page 72)
• “Creating a cost allocation report” (page 76)
• “Automated solution finding: System consolidation to
VMs” (page 109)
• “Creating a scenario utilization report” (page 73)Evaluate new quality of service
• “Creating a cost allocation report” (page 76)Estimate new cost allocation on the VM host
Example consolidation: Automating stacking on a “what-if” server
Assume that you have a collection of legacy servers for which you are uncertain of historic
resource usage. You have collected enough resource utilization data for each of these servers to
provide good insights, and it is time to see if converting these application servers into VMs on
fewer VM hosts is a cost-effective choice that will use your resource pool more efficiently. You
also want to do the simulation with a virtualization technology and server model that you are
thinking of purchasing in the near future.
The steps referenced in the following titles are from the checklist in “Checklist — Consolidating
server loads onto a virtual machine using automated solution finding (HP Smart Solver)”
(page 47).
Step 1: Determine which systems to consolidate
From the top menu bar, select Reports→Capacity Advisor→Create Consolidation Candidates
Report...
This is the same process discussed in “Step 1: Determine which systems to consolidate” (page 37)
of the manual consolidation example.
Related topic
• “Creating a consolidation candidates report” (page 76)
Step 2: Create a scenario
This is the same process discussed in “Step 2: Create a scenario” (page 37) of the manual
consolidation example.
When finished creating a new scenario, the Edit Scenario screen automatically opens for editing
the new scenario.
Task: Plan server consolidation 47
Page 48

Related topic
• “Creating a planning scenario” (page 86)
Step 3: Edit the scenario
The systems included in the scenario are listed on the System tab of the scenario editor. The bar
meters in the table show the peak resource utilization from data collected for the current week
(the default setting).
Making servers become virtual machines using automated solution finding
Select ten legacy servers from the manual consolidation example to become virtual machines,
and then select What-If Action→Change Servers to be VMs→Automated Consolidation of
Servers to VMs...
Screen 1 of 3
Modify the data range, if desired.
Define the destination VM host(s). This example demonstrates the selection “Use both existing
hardware for workload placement and host templates for overflow.”
Here is the template definition for a “what-if” system:
Next, set the constraints for the solver:
CPU virtualization is set to 20%, as in the manual consolidation example. The default settings
for load balancing and maximum allowed invalid data are not changed.
Click Next to proceed to the next step.
48 Planning with Capacity Advisor
Page 49

Screen 2 of 2
This screen gives you the opportunity to review the settings you have made thus far and to select
the level of effort for the Solver to operate within. The default setting is for maximum effort that
the Solver should expend to find the best solution.
Click OK to start the calculation.
Screen 3 of 3
This screen shows the results of this Solver run:
Based on the information given in the solution, you might choose to do the following:
• Run the Solver again, and define the template host to have 5 GB of memory to allow for
more headroom in the systems and to obtain a solution that includes legacy03.
Rather than starting over, click Return to Step 1.
The user interface “remembers” the values that you entered previously, so just change the value
for system memory from 4 GB to 5 GB and proceed throughthe screens again, running the Solver
with the new value.
Task: Plan server consolidation 49
Page 50

Related topics
• “Automating solution generation: HP Smart Solver” (page 31)
• “Automated solution finding: System consolidation to VMs” (page 109)
• “Results: Automated consolidation to VMs” (page 112)
50 Planning with Capacity Advisor
Page 51

Task: Estimating the effect of adding or moving processors
It is frequently desirable to move processors among servers or add processors to balance resources,
adjust headroom, deal with existing problems, or prevent anticipated ones. With HP Insight
Capacity Advisor software, you can make more informed decisions about re-configuring your
servers to improve the quality of service or maintain it with a more efficient configuration.
Capacity Advisor allows you to size your system with more precision. This sizing is not based
on a simple peak utilization value, but on knowing the answers to questions such as whether
your system is more than 70% busy for an unacceptable percentage of the time.
For specific descriptions of each field shown on the user interface screens, click the on the
software screen.
Table 4-4 Checklist — Estimating the effect of adding processors
Related Procedure(s)Task
• “Creating an historic utilization report” (page 72)Determine the current quality of service for a desired
metric for systems under consideration. (See also “Task:
Understand current resource usage” (page 35).)
• “Creating a planning scenario” (page 86)Create a planning scenario that includes the systems to
which you would like to add processors.
• “Editing a system” (page 94)Simulate adding processors on selected systems.
• “Creating a scenario utilization report” (page 73)Evaluate new quality of service
Table 4-5 Checklist — Estimating the effect of moving processors
Related Procedure(s)Task
• “Creating an historic utilization report” (page 72)Determine the current quality of service for a desired
metric for systems under consideration. (See also “Task:
Understand current resource usage” (page 35).)
• “Creating a planning scenario” (page 86)Create a planning scenario that includes thesystems that
could exchange processors.
• “Editing a system” (page 94)Simulate moving processors from donor systems to
receiver systems.
• “Creating a scenario utilization report” (page 73)Evaluate new quality of service
Task: Estimating the effect of adding or moving processors 51
Page 52

Task: Determining where to put a workload using automated solution finding
Adding a new application or set of applications to an existing server environment requires careful
planning. Deciding where to add the new workload can be challenging; can it be placed on an
existing server, or is a new system required? With HP Insight Capacity Advisor software, the
planning can be based on real data and realistic modeling of the results of adding a new workload
to the current environment.
Prerequisites
• You should be familiar with Capacity Advisor operations (see “Procedures” (page 55)).
• You must be logged in to Insight Dynamics. (See “Accessing Capacity Advisor” (page 55).)
• You must have already collected data on the systems of interest (see “Gathering data for
Capacity Advisor” (page 55)).
For specific descriptions of each field shown on the user interface screens, click the on the
software screen.
Table 4-6 Checklist — Determining where to put a workload using automated solution finding (HP
Smart Solver)
Related Procedure(s)Task
• “Creating a consolidation candidates report” (page 76)Determine which workload(s) to move. See also
“Task: Understand current resource usage”
(page 35).
• “Creating a planning scenario” (page 86)Create a planning scenario.
Edit the scenario:
• Modify the workload(s) as desired.
• Modify potential host systems as desired
• Movethe workloadsusing automatedsolution
finding
• “Editing a workload” (page 101)
• “Editing a system” (page 94)
• “Automated solution finding: Workload stacking”
(page 115)
• “Creating a scenario utilization report” (page 73)Evaluate new quality of service
• “Creating a cost allocation report” (page 76)Estimate new cost allocation on the VM host
Example: Determining where to put a workload
1. Obtain data from a test machine
The most accurate models are based on real data, collected over a long enough period of
time to capture the variations in load due to periodic peaks in usage (such as events
happening “late Thursday night” or “the first and 15th of the month”). Collect data for at
least a week, and preferably for long enough to capture any periodic variations. If you cannot
collect data from a test machine and have data from a similar application running on an
existing system, you can create a new workload based on the existing data and scale it to
provide a “best guess” model of the new application's resource utilization.
2. Create a scenario
Follow the procedure in “Creating a planning scenario” (page 86) to create a scenario with
the test system running the new application and all the candidate host systems.
3. Edit the workload
Follow the procedure in “Editing a workload” (page 101) to make any modifications to the
data collected on the workload necessary to reflect estimated future production loads. This
might include increasing the processor load and/or memory usage.
52 Planning with Capacity Advisor
Page 53

4. Move the workload
Follow the procedure in “Automated solution finding: Workload stacking” (page 115)to
move the workload from the test machine it has been running on to one of the potential host
machines. The bar graphs on the screen provide a rough estimate of the effect of moving
the workload to each of the candidate hosts.
5. Estimate the new quality of service
a. Follow the procedure in “Using the Profile Viewer” (page 67) to obtain a quick overview
of the resource utilization of the system with the added workload.
b. Follow the procedure in “Using the report wizard” (page 71) to generate a detailed
report on the new configuration.
In addition to the quantitative measures of the “goodness” of a system, it is important to
use your knowledge of such things as how the system will be used, system ownership, and
future constraints. This is an area where your knowledge of the context the application will
be run in can be as important as the estimated resource utilization.
Task: Determining where to put a workload using automated solution finding 53
Page 54

54
Page 55

5 Procedures
This chapter provides information on procedures you are likely to use with Capacity Advisor.
Note that all procedures are indexed by their names.
Accessing Capacity Advisor
Before you can use HP Insight Capacity Advisor software, you must access it.
IMPORTANT: For specific descriptions of each field or summary table on the user interface
screens, click the help topic link on the software screen for the task.
This procedure assumes the following:
• You are familiar with HP Systems Insight Manager software (HP SIM). For information on
HP SIM, select Help→For HP Systems Insight Manager from the top menu bar to access
the HP Systems Insight Manager 6.2 online help.
• You have appropriate licenses to use Capacity Advisor on the Central Management Server
(CMS) and the systems you wish to monitor with HP Insight Capacity Advisor software
(see HP Insight Dynamics 6.2 Getting Started Guide).
Procedure 5-1 Accessing Capacity Advisor
1. Open a Web browser.
2. Enter the following in the Address field (it is not always labeled in browsers):
http://CMS-Host:280/
where CMS-Host is the server running the CMS for Insight Dynamics.
3. Press Enter.
A login screen is displayed (if security dialogs are presented first, respond appropriately).
4. Fill in the User name and Password fields.
5. Click Sign In or press Enter.
6. If the VSE Management: Capacity Advisor screen is not displayed, select Tools→Capacity
Advisor from the top menu to open the Capacity Advisor home tab. Alternatively, you can
select Optimize→Capacity Advisor→View Scenarios ... from the top menu bar. The
Optimize menu provides several options for accessing Capacity Advisor features.
The VSE Management: Capacity Advisor screen is displayed, with a list of the scenarios
that have already been created.
Gathering data for Capacity Advisor
HP Insight Capacity Advisor software works best when using generous amounts of data to
generate reports and create meaningful simulation scenarios. Though it is most efficient and
effective to collect data on a regular schedule, you can also start an up-to-date data collection for
reports and profile generation at any time. Data collected by the Utilization Provider is kept on
a managed system for 30 days. Data captured through agentless means are transferred at 5-minute
intervals. Any data transferred to the database on the CMS is kept for four years.
Accessing Capacity Advisor 55
Page 56

TIP:
When you want to keep less than four years of data Change the property file vseprefs.props
in one of the following locations:
• Program Files\HP\Virtual Server Environment\vseprefs.props (on Windows
CMS)
• /etc/opt/vse/vseprefs.props (on HP-UX CMS)
Look for this text, and change to the desired number of days:
#
# The default number of days to retain capacity planning profile data.
# This limit is enforced by the capcollect command.
#
PROFILE_RETAIN_DAYS=1460
#
To create a meaningful simulation scenario or to view the historical resource utilization of a
workload, you must collect data from representative systems or the systems for which you want
to monitor resource utilization.
Once you have collected the data,you can create simulation scenarios or experiment with different
configurations and workloads to evaluate your system capacities. You can use Capacity Advisor
to plan for the future.
You can collect data for the following:
• A selected set of licensed systems
• All licensed systems
NOTE: Use only one CMS to manage each node used with Capacity Advisor.
To collect data on any system managed using Insight Dynamics, you must have the following
configured on the CMS:
• Authorization in the Central Management Server (CMS) to run the Capacity Advisor toolbox
on the managed system
• WBEM credentials in the CMS to access WBEM on the managed system
Impact of data collection on managed system performance
The data collection process is purposely designed to consume few resources on the managed
systems from which data is being collected.This means you can feel free to collect data whenever
you want. Note, however, that when there is a large number of managed systems, the data
collector (running capcollect on the CMS) can take a relatively long time to obtain all the
collected data for storage on the CMS .
For a diagram of the Capacity Advisor data collection infrastructure, see Figure 2-1 (page 16) .
Data collection options
When preparing to collect data for use in scenarios or for obtaining historical activity reports,
consider the following:
56 Procedures
Page 57

• the list of servers from which you want to collect data
• the collection agency in operation on the servers (Capacity Advisor can collect data by way
of the Utilization Provider, by way of agentless means, or by import from other HP data
collection methods)
For discussions of various collection agencies, see “Comparison of agentless and UP data
collection” (page 18) and “HP PMP data differs from Utilization Provider data” (page 19).
• whether you need to collect data for the first time, update a data collection, or update a data
collection schedule.
Deciding from which servers to collect Data collection via Capacity Advisor is limited to those
systems recognized as servers within HP SIM. The list of all possible servers can be viewed by
opening the All Systems view or the All Servers view in the Systems and Event Collections
area on the left. The list of all possible servers that are licensed with Insight Dynamics can be
viewed by opening the All VSE Resources view in this same area, or by opening HP Insight
Virtualization Manager software (Tools→Virtualization Manager... from the top menu bar).
You may also have servers in mind where data collection has been accomplished using software
other than the Utilization Provider. This can be done by collecting data from licensed systems
for which Capacity Advisor has agentless data collection capability or by importing data collected
by other agents, such as HP Performance Agent (formerly HP OpenView Performance Agent –
OVPA) or HP Performance Management Pack.
How to collect data using Capacity Advisor Data collection functions are accessible from multiple
locations:
• the Configure, Optimize, and Tasks & Logs menus on the top menu bar
• the Virtualization Manager Visualization tab (Tools menu)
• the Capacity Advisor tab
• using capcollect, capagentlesscfg, capovpaextract, or cappmpextract on the command line.(see
“Command reference” (page 133))
TIP: For lists of all menu options for Capacity Advisor features, see “Menus & tabs” in
Capacity Advisor Help.
NOTE:
Licensing and data collection Typically, servers from which data are collected are licensed for
Capacity Advisor and Insight Dynamics. However, it is possible that not all servers in a data
center or network are licensed to run HP Insight Dynamics suite.
For information on installing the Utilization Provider, see HP VSE Managed Node Software
Update. For general information about licensing systems, see the HP Insight Dynamics 6.2 Getting
Started Guide . For discussion of using the HP Insight Capacity Advisor Consolidation software
to collect data for a systems consolidation effort, see “Data collection and the HP Insight Capacity
Advisor Consolidation software” (page 63).
When to collect data Data collection via Capacity Advisor can be controlled to occur at different
times by doing one or more of the following actions:
• use the automated nightly collection
• schedule a collection to occur periodically or one time only
• launch an immediate collection
Gathering data for Capacity Advisor 57
Page 58

NOTE:
Performance for a virtual machine is usually calculated using the performance index calculated
for its VM host. However, when a virtual machine is moved from one VM host to multiple other
VM hosts within a short period of time (between one capcollect operation and the next capcollect),
as might occur when simulating virtual machines within a cluster, performance is calculated
using the ratio of the clock speeds multiplied by the performance index of the current VM host.
If all the nodes of your cluster (for example) are nearly identical, then this “clock speed scaling”
will not introduce any error. However, if the original and destination hosts are different, you
can reduce any error caused by this clock speed scaling in the following ways:
• Collect data just before moving a VM.
• Schedule capcollect to run more oftenon your VMs, particularly the ones using VMware
DRS.
Once you have determined the method and location for data collection, updating the data stored
in the Capacity Advisor database operates the same regardless of how the data was collected.
IMPORTANT: For specific descriptions of each field or summary table on the user interface
screens, click the help topic link on the software screen for the task.
First data collection (or the automated nightly collection)
In general, the procedures for collecting data are similar: you must select the target system or
systems, schedule the collection task for a later run or to run now, and start the task.
Upon installation of HP Insight Dynamics suite (and Capacity Advisor in particular), Capacity
Advisor is set to automatically collect data from all managed nodes discovered by HP SIM that
are licensed torun Capacity Advisor, beginning at midnight on the CMS time clock. This is called
the nightly data collection. It occurs automatically at this time unless and until it is disabled or
rescheduled to a different time.
Prerequisites
• You must be logged in to Insight Dynamics as a privileged administrator user or root. (see
“Accessing Capacity Advisor” (page 55)).
Procedure 5-2 To alter the automated nightly data collection
1. Select Tasks & Logs→View All Scheduled Tasks... from the top menu bar.
2. From the list of current tasks, select Collect ALL Capacity Advisor Data Nightly....
3. If you would like to modify the timing, click Edit.
The Task Confirmation screen is displayed.
4. Click Schedule.
5. Select Periodically from the list labeled When would you like this task to run?.
6. In the area labeled Refine Schedule:, set the time of your choice.
7. Click Done.
The Task Results screen is displayed. The data collection will start when the system clock
reaches the time that you have set.
8. Or, if you would like to turn off the nightly collection, click the Disable this task check box and
Done. If you now want to schedule a regular data collection for one or more blocks of
machines, see “Scheduling a data collection” (page 60).
58 Procedures
Page 59

To return to a planning checklist:
• Obtaining reports on current resource usage [p. 35]
Interpreting task results
The Task Results screen shows a “Running ” check box with a Start time: until the task
completes. When data collection finishes, you see an End time: displayed, with standard out
(stdout) and standard error (stderr) information on the data collection.
Once the Status field shows Complete, the collection task is complete, and the screen provides
a summary of pertinent information for this task, including the name of the task, completion
status, and the command line options used to run this task.
The results of the task are presented in the Stdout and Stderr tab windows. The messages on
the Stdout tab include indications of any errors that occur. Be sure to click both tabs for a complete
understanding of what happened.
An Exit code of 0 means complete success. Positive values indicate partial or complete failure.
In addition, you will see iconic indicators in the table Status column:
• When a task concludes successfully, you see this symbol: .
• When a task concludes with a global or system-specific error, you see either of these symbols
in the status column, respectively: or .
Error notification on the standard out tab
While error messages are sent to the Stderr tab, the fact that errors have occurred is indicated
on the Stdout tab. The types of messages sent to the Stdout tab are explained below.
All physical CPU utilization data collected for Integrity VM "vm-name" from Integrity VM Host "host-name".
All corrected physical CPU utilization data collected for HyperV VM "vm-name".
All utilization data collected for "system-name"
Data collection succeeded. No need to check the Stderr tab if this is the only type of notification.
Some utilization data collected for "system-name"
Although data collection was not entirely successful, some utilization data was collected. Check
the Stderr tab for details of the problem.
Warning: message text.
A condition was detected while collecting that may affect the “usefulness” of the data collected.
Check the Stderr tab for details of the problem.
NN Warnings issued.
Appears at the end of output on the Stdout tab.
Warnings were issued. Check the Stderr tab for details.
Collection failed on NN systems.
Appears at the end of output on the Stdout tab.
No data was collected from one or more systems. Check the Stderr tab. For each of the failed
systems, there will be one or more messages, including the host name.
See also Appendix G (page 165)and “Capacity Advisor messages” (page 175) for additional
information to help you troubleshoot data collection errors.
As you review and analyze the resulting data collection, you may notice discrepancies. See
“Possible sources of discrepancies in collected data” (page 66)for information.
Gathering data for Capacity Advisor 59
Page 60

Scheduling a data collection
As conditions evolve over time or to manage data collection for large numbers of servers, you
can schedule one or more periodic data collections in addition to, or in place of, the automated
nightly collection. At the scheduled time, Capacity Advisor will pull data collected by the
Utilization Provider or via the agentless configuration file into the database on the CMS for
storage.
Prerequisites
• To create a collection schedule:
— You must be logged in to HP SIM (see “Accessing Capacity Advisor” (page 55)).
Procedure 5-3 To collect data on selected systems
1. Select Optimize→Capacity Advisor→Collect Capacity Advisor Data... from the top menu
bar.
The Collect Capacity Advisor Data wizard starts.
2. Click the word - select - in the drop-down list below the title Add targets by selecting
from:.
A list of filters is presented.
3. Select an appropriate filter from the list. All Systems will list all the available systems, while
other choices will constrain the selection list to subclasses of systems. The choice All VSE
Resources restricts the list to those likely to be licensed for data collection.
4. Click the check boxes beside the systems for which you wish to collect data. If needed,
expand the plus sign controls beside classes of systems to display specific systems. (For
additional help on selecting targets, see the HP Systems Insight Manager 6.2 online help on
“Creating a Task”.)
5. Click Apply.
The Verify Target Systems screen of the wizard displays the resulting list of target systems.
6. If you wish to collect data on more targets, click Add Targets and repeat the preceding two
steps.
7. If you wish to remove any targets from the list:
a. Click the check boxes by the targets you wish to remove.
Check marks appear in the check boxes.
b. Click Remove Targets.
The targets with check marks in the check boxes disappear from the list.
8. Once the list has the correct set of targets, click Next.
The Task Confirmation screen of the wizard is displayed.
9. To start a one-time collection immediately, click Run Now.
The Task Results screen is displayed. See “Interpreting task results” (page 59).
10. To schedule the timing for a periodic collection, click Schedule.
11. The Schedule Task screen is displayed.
12. Select Periodically from the list labeled When would you like this task to run?.
13. In the area labeled Refine Schedule:, set the time of your choice.
14. Click Done.
The Task Results screen is displayed. The data collection will start when the system clock
reaches the time that you have set.
See “Interpreting task results” (page 59) for more information about the Task Results screen.
60 Procedures
Page 61

Modifying a collection schedule
As collection needs change over time, you can modify an existing schedule for better results.
Prerequisites
• You must be logged in to Insight Dynamics. (see “Accessing Capacity Advisor” (page 55)).
• You must be the creator of the collection schedule that you want to modify, or a privileged
administrator user.
Procedure 5-4 To modify a collection schedule
1. Select Tasks & Logs→View All Scheduled Tasks... from the top menu bar.
The All Scheduled Tasks screen displays a list of the tasks that have been associated with
your current user ID.
2. Click the radio button beside the task you wish to reschedule.
3. Click Edit.
The Task Confirmation screen of the Collect Capacity Advisor All wizard displays.
4. Click Schedule.
The Schedule Task screen of the wizard displays.
5. Modify the Schedule Task screen of the Collect Capacity Advisor Data All wizard.
6. Click Done.
The All Scheduled Tasks screen displays.
To return to a planning checklist:
• Obtaining reports on current resource usage [p. 35]
Removing a collection schedule
As your collection needs change over time, you might need to remove a collection schedule.
Prerequisites
• You must be logged in to Insight Dynamics. (see “Accessing Capacity Advisor” (page 55)).
• You must be the creator of the collection schedule that you want to modify, or a privileged
administrator user.
Procedure 5-5 To remove a collection schedule
1. Select Tasks & Logs→View All Scheduled Tasks... from the top menu bar.
The All Scheduled Tasks screen displays a list of the tasks associated with your current
user ID.
2. Click the radio button beside the task that you wish to delete.
3. Click Delete.
A confirmation screen displays.
4. Click OK on the confirmation screen.
The task is removed from the list. If this is the last task in the list, the message “There are
no available tasks to display.” replaces the list of tasks.
Updating collected data
At times, such as when you are generating reports and developing or refining scenarios, you
may want to trigger data collection so that your work is based on the most up-to-date data. You
may want to do one of the following actions:
Gathering data for Capacity Advisor 61
Page 62

• Update the collected data on all available systems ( see “Updating collected data on all
systems” (page 62)).
• Update the collected data from some systems (see “Updating collected data on selected
systems” (page 62)).
• Update the collected data presented in a Profile Viewer report (see “Updating data displayed
in a profile viewer” (page 62)).
Updating collected data on all systems
You may want to update data for all systems at one time.
Prerequisites To update collected data on all systems:
• You must be logged in to Insight Dynamics (see Accessing Capacity Advisor).
Procedure 5-6 To update collected data on all systems
1. Select Optimize→Capacity Advisor→Collect Capacity Advisor Data ALL... from the top
menu bar.
This starts the wizard for collecting data from all systems licensed for Capacity Advisor.
2. Click Run Now.
See “Interpreting task results” (page 59) for more information about the Task Results
screen.
Updating collected data on selected systems
At times, you might want to collect data on selected systems. In this case, follow the same
procedure as for “Scheduling a data collection” (page 60), steps 1–9.
Updating data displayed in a profile viewer
To update the data in a profile viewer:
• You must be in a profile viewer (see “Using the Profile Viewer” (page 67)).
Procedure 5-7 To update data that a profile viewer is displaying
• Click the Collect Capacity Advisor Data... link.
A busy indicator appears over the grayed out screen. When the busy indicator disappears,
you can see the refreshed data display.
NOTE: If the data collection fails, the output from stdout and stderr of the command
are shown at the top of the screen.
Collecting data without using an agent
Agentless data collection is currently available for systems that run supported versions of
Microsoft Windows and Linux operating systems and that are licensed for Capacity Advisor.
These managed systems will be automatically configured for agentless data collection, either
using the Insight managed system setup wizard or the first time capcollect is run for those
systems (whichever comes first).
Listing systems currently in the configuration file
This section describes the procedure for determining the current settings for agentless data
configuration on a CMS, particularly the list of systems from which to collect data using this
method.
62 Procedures
Page 63

Prerequisite
• You must be logged in to HP Systems Insight Manager software with any level of access
permissions.
1. From the Capacity Advisor tab, select Configure→Agentless Data Collection→List
Selected Systems....
2. The Task Confirmation screen opens.
3. Click Run Now.
The Task Results screen opens.
When the command completes successfully, the current contents of the configuration file
are listed on the Stdout tab.
If you suspect an error, check the Stderr tab for more information.
Setting advanced options in the agentless data collection file
This section describes the procedure to use when defining advanced options to be included in
the agentless data collection configuration file. (See “Advanced agentless options screens” in
Capacity Advisor online help for reasons why it can be advantageous to alter the default values
using the Advanced Agentless Options screen.)
Prerequisite
• You must be logged in to Insight Dynamics with “VSE All Tools” or “Capacity Advisor”
tools permissions.
1. From the Capacity Advisor tab, select Configure→Agentless Data Collection→Advanced
Agentless Options....
2. The Specify Parameters screen opens.
3. Optionally, change the polling interval.
4. Optionally, change the number of collector threads to assign to the task of collecting this
data.
5. When satisfied with changes, click Run Now.
6. The Task Results screen opens.
When the command completes successfully, the current contents of the configuration file
are listed on the Stdout tab.
If you suspect an error, check the Stderr tab for more information.
Related topics
• capagentlesscfg in the Appendix B (page 133)
Data collection and the HP Insight Capacity Advisor Consolidation software
HP provides the HP Insight Capacity Advisor Consolidation software specifically to address the
need to understand resource utilization on servers that are targeted for consolidation onto other
systems. Such servers often will not be running Insight Dynamics. Yet, being able to use Capacity
Advisor's planning facilities can greatly reduce the amount of time needed to plan a consolidation
effort.
The HP Insight Capacity Advisor Consolidation software provides you with a limited license to
obtain data for use in Capacity Advisor scenarios. For six months from the time the license is
locked into its assignment to a server, you can collect data to use in your consolidation planning
scenarios within Capacity Advisor.
Gathering data for Capacity Advisor 63
Page 64

Using Capacity Advisor with consolidation software server data
Because servers using the HP Insight Capacity Advisor Consolidation software are not licensed
for Insight Dynamics, you must use HP SIM Optimize menu options for Capacity Advisor to
collect and manipulate this data.
The available Optimize menu options allow you to do the following actions:
• view a utilization profile
• collect data
• import data
• view and create scenarios
• create various reports
Viewing the licensed servers in HP SIM
Another implication of this limited license is that servers with this license are not visible in the
Visualization tab of Virtualization Manager. To see these servers in a list, look for “All Servers”
selections and links within HP SIM task screens and a few Capacity Advisor screens. The “All
Servers” list allows you to view and select servers licensed with the HP Insight Capacity Advisor
Consolidation software for inclusion in scenarios or for creating reports.
Importing data for use in Capacity Advisor
To import system utilization data, the system must be discovered by HP SIM.
For systems that you know are running HP Performance Agent (OVPA), you can verify discovery
by clicking “All Systems” or “All Servers” in the HP SIM left navigation bar.
If the system has not been discovered, you can add it manually. (From the top menu bar, select
Options→Discovery.... You must be a privileged administrator user or root to see this option.)
For help on adding a system manually, see the “Discovery and Identification” topic in the HP
Systems Insight Manager 6.2 online help. After you add a system, verify that the system appears
in “All Systems” view.
For systems running HP Performance Management Pack (PMP), select Optimize→Capacity
Advisor→List PMP Systems to see the list of discovered servers running PMP.
Once you verify that the system of interest has been discovered by HP Systems Insight Manager
software, you can import system utilization data into Capacity Advisor.
IMPORTANT: Avoid importing PMP or OVPA data that overlaps time intervals where agentless
data collection has already occurred. Mixing the two data sets can produce confusing reports,
because the agentless collector obtains more metrics than the PMP or OVPA collectors, and the
imported data will overwrite only the metrics that both collectors obtain. This is primarily an
issue when the imported data has invalid data points and the agentless set does not.
Instead, determine if there are time periods where data was not collected using the agentless
method. Import data only for those time periods. Capacity Advisor will behave as though all
the data collected is one contiguous set, and reports will better reflect the actual resource usage.
See “Ascertaining the data collection availability for a set of servers” (page 66) for instructions.
From the Optimize menu — Import HP OVPA data
Prerequisites
• You must be logged in to Insight Dynamics (see “Accessing Capacity Advisor” (page 55)).
• The system(s) must be discovered by HP SIM.
Procedure 5-10 Import HP OVPA data into Capacity Advisor
1. Click Optimize→Capacity Advisor→Import OVPA System Data....
64 Procedures
Page 65

2. Select the target system(s).
The Verify Targets screen displays.
3. Verify the target system(s).
You have the opportunity to add or remove systems here. When done, click Next.
The Specify Parameters screen displays.
4. Specify the begin and end dates desired to define the extent of the collection to import.
For example:
[-b 20071101 -e 20071231]
If no date range is given, all data up to 30 days is imported.
5. Optionally, specify [-p] if the import is for a non-Insight Dynamics workload.
6. Click Run Now.
After a short time, the Task Results screen displays.
For tasks where you select Run Now, a few moments will pass and then you see the Task Results
screen. For general help on interpreting the information in this screen, see the HP Systems Insight
Manager 6.2 online help on “Viewing Task Results”.
The Task Results screen shows a “Running”check box with aStart time: until the task completes.
When data import finishes, you see an End time: displayed, with standard out (stdout) and
standard error (stderr) information displayed on tabbed panes in this screen. Check both tabs
for relevant information.
From the Optimize menu — Import HP PMP data
Prerequisites
• You must be logged in to Insight Dynamics (see “Accessing Capacity Advisor” (page 55)).
• The system(s) must be discovered by HP SIM.
Procedure 5-11 Import HP PMP data into Capacity Advisor
1. Click Optimize→Capacity Advisor→Import PMP System Data....
2. Select the target system(s).
The Verify Targets screen displays.
3. Verify the target system(s).
You have the opportunity to add or remove systems here. When done, click Next.
The Specify Parameters screen displays.
4. Specify the begin and end dates desired to define the extent of the collection to import.
For example:
[-b 20071101 -e 20071231]
If no date range is given, all available data is imported.
5. Optionally, specify [-p] when the import is for a non-Insight Dynamics workload.
6. Optionally, specify [-o] when you want the new data to overwrite existing data for the
system within the Capacity Advisor database.
7. Click Run Now.
After a short time, the Task Results screen displays.
For tasks where you select Run Now, a few moments will pass and then you see the Task Results
screen. For general help on interpreting the information in this screen, see the HP Systems Insight
Manager 6.2 online help on “Viewing Task Results”.
Gathering data for Capacity Advisor 65
Page 66

The Task Results screen shows a “Running”check box with aStart time: until the task completes.
When data import finishes, you see an End time: displayed, with standard out (stdout) and
standard error (stderr) information displayed on tabbed panes in this screen. Check both tabs
for relevant information.
From the command line
• Add user login information to the SSH settings for your specific system on the System
Protocol Settings screen (Options→Protocol Settings→System Protocol Settings).
• From the command line on the CMS, and logged in as rootor Administrator, execute the
capopvaextract or cappmpextract command, giving the fully qualified host name as
the firstargument. (See the correspondingcommand reference pages in AppendixB (page 133)
for more information.)
For example:
# capovpaextract node12.company.com
Ascertaining the data collection availability for a set of servers
From within a scenario, or from the Visualization tab of Virtualization Manager, you can see
the data collection period for systems included in a scenario or for individual managed systems,
respectively. This procedure describes how to create a list of selected (or all) licensed servers and
their data collection periods, and is for use when you want to quickly see the data collection
periods for a set of servers without creating or accessing a scenario to do so.
Prerequisites
• You must have command-line access to the CMS managing the systems of interest.
• The systems of interest must be licensed for Capacity Advisor.
Procedure 5-12 From the command line
• Type
capprofile -lv
to see a list showing the name of each licensed system managed by this CMS, dates for which
data has been collected, and the percent of data considered valid by Capacity Advisor.
For other options, see capprofile in Appendix B (page 133).
To return to a planning checklist:
• Obtaining reports on current resource usage [p. 35]
Possible sources of discrepancies in collected data
Several possibilities exist to explain discrepancies that may appear in the data or that may affect
data collection. Check these possibilities to understand what actions you can take to correct the
discrepancy.
No data collected for a managed node
If you do not obtain data on systems from which you expect to collect data, it is possible that the
system has not been licensed for use with Capacity Advisor, either through Insight Dynamics
or through HP Insight Capacity Advisor Consolidation software.
Data timestamp appears to be incorrect
For best accuracy in providing simulation solutions and historic reporting of actual system
resource use, it is assumed that the time clocks of managed nodes are synchronized with the
time clock of the central management server. If, on gathering or collecting data, the date stamp
on your data is not current, the time or time zone on a managed node may be set incorrectly in
relation to the CMS.
66 Procedures
Page 67

Dynamic memory in HP Integrity virtual machines
A dynamic memory feature is available in HP Integrity virtual machines. This allows the memory
allocated to each virtual machine to be changed without rebooting the virtual machine. Capacity
Advisor is aware of this feature and records both the memory allocated to each virtual machine,
as well as how much of this memory is in use for each five-minute interval. Both of these values
are correct when the virtual machines are using the dynamic memory feature.
When a virtual machine is running HP-UX 11.23, most built-in commands such as top and sar
will not be aware of the dynamic memory feature and can show memory sizes that are different
from what is recorded by Capacity Advisor. For example, if a virtual machine is initially booted
with 16 GB of memory, and is then re-sized to 4 GB, the built-in commands will not know about
the change and will show 16 GB for physical RAM. Capacity Advisor, however, will show that
the available memory for the VM is 4 GB. Also, when a virtual machine is sized less than its
maximum size, some built-in commands will show the kernel using more memory than it is
actually using.
Producing graphs and reports
HP Insight Capacity Advisor software can generate both graphical and tabular data for
presentation in either a report format or within an adjustable profile viewer.
Using the Profile Viewer
A profile viewer provides a quick summary of historical resource utilization, presenting data
graphically as well as in tabular summaries. See also “Profile Viewer Screen” in Capacity Advisor
Help for specific descriptions of the screen functions.
A profile viewer can be accessed from the system meters on the Visualization tab, the HP SIM
Optimize menu, or from the meters or menu selections on the Edit Scenario tabs in Capacity
Advisor.
A profile viewer opened from the Visualization tab generally displays the actual resource
utilization data collected from the selected node.
However, for non-OS node types such as an enclosure, a complex, or a vpar monitor, which do
not have anoperating system (OS) or hypervisor from which to collect actual resource utilization
data, a profile viewer calculates the utilization profile by aggregating the actual data from all of
the associated child nodes (blades, nPartitions, or vPartitions, respectively).
A profile viewer opened from the scenario editor, onthe other hand, always aggregates data from
all of the workloads on a system or from all of the virtual machines (VM) running on a VM host
when the VMs are included in the scenario. This is true even when there is actual data collected
for the operating system or hypervisor. Aggregation is done to account for the modifications
that can be made to a scenario, such as adding, removing, or moving workloads, changing the
actual profile data, or changing the resource allocations within the modeled hardware. Due to
the malleability of a scenario, it is possible that a scenario profile of a node could differ from
profile viewed from the Visualization tab in Virtualization Managerfor the real node.
This is particularly true of physical nodes that contain virtual nodes, such as a VM host.
Additionally, for ESX VM hosts, Microsoft Virtual Server, and Hyper-V hosts, data for non-guest
workloads is not collected for use in the 4.1 release of Capacity Advisor. Therefore, profile views
accessed from the scenario editor do not account for utilization by workloads that are not VM
guests.
IMPORTANT: For specific descriptions of each field or summary table on the user interface
screens, click the help topic link on the software screen for the task.
The following sections describe how to access a profile viewer from various locations within HP
SIM.
Producing graphs and reports 67
Page 68

Prerequisites
• You must be logged in to Insight Dynamics (see “Accessing Capacity Advisor” (page 55)).
• You must have collected data on the systems of interest (see “Gathering data for Capacity
Advisor” (page 55)).
Some functions of a profile viewer require Capacity Advisor Tools permissions to be seen and
used.
Procedure 5-13 To access a profile viewer from the HP SIM Optimize menu
This procedure gives you access to view historic resource utilization on a real system in your
network.
1. Select Optimize→View Profile...
The target selection wizard opens.
2. Select one system to view and click Apply. (For information on a typical task progression
in HP SIM, see “Creating a Task” in the HP Systems Insight Manager 6.2 online help.
3. Verify the target system and click Run Now.
The profile viewer opens.
NOTE:
When no data has been collected If no data exists in the Capacity Advisor database for
the selected system, and the system is licensed to work with Capacity Advisor, you are
presented the opportunity to collect data immediately, calibrate power settings, and edit
I/O capacity.
At minimum, you will need to collect data prior to continuing this task.
Procedure 5-14 To access a profile viewer from the Virtualization Manager Visualization tab
This procedure gives you access to view historic resource utilization on a real system in your
network.
1. Select Tools→Virtualization Manager...
The Visualization tab displays systems discovered by HP SIM.
2. Find a system to view and click the desired meter icon to open a profile viewer for that
utilization metric on that system. (For information on meters appearing on the Visualization
tab, see “Utilization metrics” in Virtualization Manager Help.)
NOTE:
When no data has been collected If no data exists in the Capacity Advisor database for
the selected system, and the system is licensed to work with Capacity Advisor, you are
presented the opportunity to collect data immediately, calibrate power settings, and edit
I/O capacity.
At minimum, you will need to collect data prior to continuing this task.
Procedure 5-15 To access a profile viewer when editing a scenario
This procedure gives you access to view simulated resource utilization on a simulated system.
This procedure assumes that you are starting from the Capacity Advisor Edit Scenario screen
in the System tab view.
For information on getting to this location, see “Editing a scenario” (page 88).
68 Procedures
Page 69

1. If you want to view the profile of a system:
• Click any of the horizontal utilization meters in the system table that represent current
utilization of a resource. Profile views are available for all of the current resource types
for which data is available (CPU, memory, network and I/O bandwidth, and power
usage).
The Capacity Advisor Profile Viewer opens and displays the data for the selected
resource type and system.
2. If you want to view the profile of a workload:
a. Click the Workload tab.
The Workload tab opens.
b. When bar graphics are displayed in the workload table:
• Click any of the horizontal bar graphics representing current utilization of a
resource. Profile views are available for all of the current resource types for which
data isavailable for workloads (CPU, memory, and network and I/O disk bandwidth
usage).
The Capacity Advisor Profile Viewer screen displays opens and displays the data
for the selected resource type and workload.
c. If no bar graphics are displayed:
i. Click the check box preceding the workload for which you want to see a profile.
The row that is checked is highlighted to indicate selection.
ii. Select View→Workload Profile... from the menu bar.
The Profile Viewer screen displays.
Procedure 5-16 To change the view within the system hierarchy
1. Find the Hierarchy near the top of the screen
2. Click a link or select an item from the drop-down list to view a related profile.
The new profile displays in the viewer screen.
Procedure 5-17 To modify data presentation in a profile viewer
You can change select settings that control modeling limits, and then view the resulting changes
in the data when the new settings are applied.
1. Locate the set of links that appear below and to the right of the profile identification summary
information and above the data range selector.
2. For each setting that you would like to modify, click the appropriate link.
NOTE:
Available settings When editing a scenario, you can edit the forecast model, edit the power
settings, and edit utilization limits.
When viewing profiles from the HP SIM Optimize menu, you can also edit I/O capacity and/or
immediately collect data.
The editor for the setting opens.
Producing graphs and reports 69
Page 70

3. Click OK to save the changes for each setting that you edit, and return to the Profile Viewer.
NOTE:
Viewing a VM guest on a VM host or viewing a complex In certain situations (such as when
you are viewing the profile for a system or complex), navigational controls are presented
to the right of the Hierarchy label near the top of the screen, such as links and drop-down
lists , that allow you to view parents and siblings of the current resource profile. Click a link
or select an item from the drop-down list to view a related profile. For details, access the
help by clicking the ? button.
Procedure 5-18 To change the time and data range displayed in the profile viewer
Optionally, you can adjust the time frame and interval. The default display, a Fixed Interval,
shows the most recent seven days of activity.
1. You can select a different Fixed Interval in the drop down selector, or you can change to
an Absolute Interval by clicking the radio button to the left of this interval selection.
The user interface pauses momentarily to reset the screen fields.
2. Set the beginning and end dates for the interval that you want to view.
3. Click OK to apply the new interval to the graph and table data.
The screen displays the new interval and data.
Procedure 5-19 To manipulate the graphic display of utilization data
1. Optionally, use the pan right (> or >>) and pan left (< or << ) buttons to view earlier historic
data (pan left) or forecast activity (pan right beyond the current date).
The screen repaints with the new date interval resulting from the pan action. A pale blue
background in the graph indicates the area in the graph where activity is forecast based on
historic data and user-selected settings.
2. Optionally, turn off the bandwidth capacity indicator by deselecting the Show Capacity
radio button. (Visible on network and disk I/O utilization metric viewers.)
The screen repaints with the dashed blue capacity indicator line removed.
3. Optionally, turn off the resource allocation indicator by deselecting the Show Allocation
radio button. (Visible on CPU and memory utilization metric viewers.)
The screen repaints with the dashed blue allocation indicator line removed.
4. Optionally, turn on the Show Invalid Data selection to see the points that have been dropped
from the display and analysis (if any).
5. Optionally, turn on the Show Observed Data selection to see actual observed activity
collected from a real system.
6. Optionally, turn on the Show Simulated Data selection to see representational activity
based on data collected from a real system.
7. Optionally, use the Profile Editor to set the data time frame and click Validate or Invalidate
to set the status of the date range.
Changes made here will be reflected in the graphic and Interval Metric Summary table.
8. When finished viewing the graph and table data for a scenario system or workload, click
the Go back to .... link to return to your original starting point in the Edit Scenario screens.
For information on accessing special editors from a profile viewer, see“Accessing the forecast
model for a workload or system” (page 83).
70 Procedures
Page 71

Procedure 5-20 To switch to alternate utilization resource metrics
You can cause a profile viewer to display any of the utilization resource metrics provided by
Capacity Advisor.
• Click the radio button to the left of the metric that you want to view.
The user interface pauses momentarily to reset the screen display to the new metric, updating
both the utilization graphic and the Interval Metric Summary table.
Using the report wizard
Capacity Advisor reports provide valuable summaries and details from data collected from
managed systems. Reports can be generated that describe:
• resource utilization for CPU, memory, network I/O, disk I/O, and power consumption for
real systems (historic usage) and for systems within a scenario (simulated usage), and
including trends in usage over a period of time.
• candidates for system consolidation
• cost allocation by resource
• summary of peak values for CPU and memory (historic or simulated)
• system populations (by OS type, processor type, cores per socket, and total cores per socket)
• comparisons among scenarios
The report wizard
This general description of the report wizard applies to all reports, though options vary within
the wizard depending on the report type and other options selected. For specific descriptions of
each field on the report wizard screens, click the help link on the software screen.
IMPORTANT: For specific descriptions of each field or summary table on the user interface
screens, click the help topic link on the software screen for the task.
Getting there
The report wizard can be accessed from the following locations:
• the HP SIM Optimize and Reports menus
• the Virtualization Manager Report menu on the Visualization tab
• the Report menu on the Capacity Advisor tab
TIP: For lists of all menu options for Capacity Advisor features, see “Menus & tabs” in Capacity
Advisor Help.
Prerequisites
• You must be logged in to Insight Dynamics. (See “Accessing Capacity Advisor” (page 55).)
• You must have collected data for the systems of interest (see “Gathering data for Capacity
Advisor” (page 55)).
• You must be authorized and licensed on all systems to be included in the report (see HP
Insight Dynamics 6.2 Getting Started Guide ).
Procedure 5-21 Select targets and set date range
For specific descriptions of each field on the user interface screens, click the help link on the
software screen for the task.
Producing graphs and reports 71
Page 72

1. Click one of the visible links to select a scenario, one or more collections, one or more
complexes, one or more systems, or one or more workloads to appear in the report. (The
availability of selections depends on the report type selected.)
A new screen opens with an appropriate list of known scenarios, collections, complexes,
systems, or workloads.
2. Click the check box to the left of each object's name that is to appear in the report.
3. Click OK.
The Select Report Targets screen reopens with an updated list of targets and a date range
selector visible.
4. Check that the selected targets are correct.
5. Note the available date range of all collected data, which appears above the date range
selector, and the default date range (at most, 1 month prior to the current day, when that
amount of data is available).
6. If the default date range is acceptable, click Next.
7. If a different data set is desired, change the date and time, then click Next.
The Select Details screen opens.
Select details specific to report type
This step in the report wizard is different for each report. See the specific report procedures and
Capacity Advisor online help for information.
Confirm selections for the report
Some reports give you the opportunity to confirm selections before you actually run the report.
Download or browse the report
For help in interpreting the report, click the help button provided on the browser-viewable and
downloadable reports.
To return to a planning checklist:
• Obtaining reports on current resource usage [p. 35]
Creating an historic utilization report
1. Select Reports→Capacity Advisor→Create Utilization Reports... on the top menu bar.
2. The Report Wizard opens on the Select Report Content screen.
Select the check box(es) for a utilization summary or a summary and details and click Next.
NOTE: You can also select to run a trend report and a power report at the same time that
you run a utilization report.
The Select Report Targets screen opens.
3. Select the collection, complex, or systems for which you want the report, and select the data
range.
See Select targets and set date range for more information.
4. Select details specific to report type.
72 Procedures
1. Select one or more types of resources for which you want to see data from among CPU,
memory, network I/O, disk I/O, and power.
2. Select the type of scale for data presentation: percentage of allocated resource, absolute
numbers, or both.
Page 73

3. Check the default graph size. The default size fits just within a letter-size page for
printing.
If you prefer dimensions smaller or larger, use the drop-down to change width (in
pixels).
If you prefer a different width-to-height proportion, use the Aspect Ratio drop down.
4. Click Finish.
The Report Created screen opens.
5. Click the appropriate link to browse the report in a web browser or to save the report to the
location that you designate.
To return to a planning checklist:
• Obtaining reports on current resource usage [p. 35]
• Consolidating server loads onto a virtual machine manually [p. 36]
• Consolidating server loads onto a virtual machine using automated solution finding [p. 47]
• Estimating the effect of adding processors [p. 51]
• Estimating the effect of moving processors [p. 51]
Creating a scenario utilization report
1. Select Reports→Capacity Advisor→Create Utilization Reports... on the top menu bar.
2. The Report Wizard opens on the Select Report Content screen.
Select the check box(es) for a utilization summary or a summary and details and click Next.
The Select Report Targets screen opens.
3. Select the scenario for which you want the report, and select the data range.
See Select targets and set date range for more information.
4. Select details specific to report type.
1. Select one or more types of resources for which you want to see data from among CPU,
memory, network I/O, disk I/O, and power.
2. Select the type of scale for data presentation: percentage of allocated resource, absolute
numbers, or both.
3. Check the default graph size. The default size fits just within a letter-size page for
printing.
If you prefer dimensions smaller or larger, use the drop-down to change width (in
pixels).
If you prefer a different width-to-height proportion, use the Aspect Ratio drop down.
4. Click Finish.
The Report Created screen opens.
5. Click the appropriate link to browse the report in a web browser or to save the report to the
location that you designate.
To return to a planning checklist:
• Consolidating server loads onto a virtual machine manually [p. 36]
• Consolidating server loads onto a virtual machine using automated solution finding [p. 47]
• Estimating the effect of adding processors [p. 51]
• Estimating the effect of moving processors [p. 51]
• Determining where to put a workload using automated solution finding
Producing graphs and reports 73
Page 74

Using the report wizard to create a scenario comparison
The Scenario Comparison Report allows you to compare two to four scenarios in a tabular and
graphical side-by-side comparison report.
Procedure 5-26 Selecting scenarios and setting the data range
1. From the Capacity Advisor tab, select Report→Create Scenario Comparison Reports...
.
2. If you have pre-selected the scenarios (on the Capacity Advisor tab) that you want to
compare, review the information displayed on this screen. If it is satisfactory, go to step 5
to set the date range. If you need to select scenarios to compare, continue with step 2.
Want to compare more than four scenarios?:
One way to do this is to run and save multiple reports, and then print them out to compare
them side-by-side. For example, to compare six scenarios, run one report with four scenarios
and one report with two scenarios. Lay the printouts side-by-side to compare various aspects
of the scenarios.
3. Select Edit Scenario Selection.
A new screen appears showing the possible scenarios to include in the comparison report.
4. Check the box to the left of the scenarios to include.
5. Choose one of the following actions:
• Press OK to accept the selections and return to the Select Report Targets screen. A
Date Selection area appears in the screen.
• Press Cancel to end the report creation and return to your originating screen.
6. To set the date range, look at the default provided (the full range of data collected). Decide
if you want to modify this value. If so, select the beginning and ending date/time.
7. Click Next to continue to the Select Report Options screen.
Procedure 5-27 Selecting report details in a scenario comparison
All resource metric options are available in a scenario comparison. All selectable fields are
combined into one section called General Report Options.
1. Put a check in the box(es) next to the resource types that you want to compare.
2. If you selected the Power resource type, fill in the Currency, Cost per kWh, and Cooling
Cost Multiplier values. For detailed discussion of the available power options, see Power
Report Options.
3. Choose the scale (absolute utilization numbers, percent of allocated resources used, or both).
4. Select Finish to create and complete the report.
An example scenario comparison report
The following image illustrates one small part of a scenario comparison report.
74 Procedures
Page 75

Figure 5-1 Comparison of three scenarios in a Capacity Advisor report
This report includes two consolidation solutions provided by the Smart Solver
(ServerConsolidationResult-SmallSystem and ServerConsolidationResults-BigSystem)
and the original pre-consolidation set of physical servers (ServerConsolidationScenario). For
more snapshots from this same report, see “Scenario comparison report” (page 157).
Calculating a virtualization consolidation ratio
It can be useful to look at the resulting ratio of virtual machines to physical servers after running
a system or workload consolidation simulation to help in evaluating the return on investment
for a particular configuration of machines. Currently, Capacity Advisor does not supply this
ratio in its reports, but you can easily calculate ratios for a set of scenarios that you wish to
compare.
Prerequisites
• You must be logged in to Insight Dynamics (see “Accessing Capacity Advisor” (page 55)).
• You must have created a planning scenario that represents the system configuration that
you want to consolidate. (See “Creating a planning scenario” (page 86) and “Editing a
scenario” (page 88).)
• You must have consolidated the systems in the initial planning scenario onto the VM host(s)
of your choice. For purposes of comparison, you may want to save two to three different
consolidation simulations. (See “Automated solution finding: System consolidation to VMs”
(page 109).)
• You must have run a scenario comparison report that includes your initial planning scenario
and your consolidated scenario results. (See “Using the report wizard to create a scenario
comparison” (page 74).)
Procedure 5-28 Calculate virtualization consolidation ratios using data from a scenario comparison
report
1. Examine the scenario comparison report. (As an example, see Figure 5-1 (page 75).)
2. For the systems scenario in the report, subtract the Number of VM Hosts in that scenario
from the Number of Physical Servers Including VM Hosts. This value represents the
number of physical servers that are to be consolidated into virtual machines.
3. For each consolidation solution scenario, calculate the virtualization consolidation ratio:
number_of_physical_servers/number_of_VM_hosts
For example, using the data in Figure 5-1 (page 75), you can determine that the number of
physical servers to be consolidated is 20.
The ratio for the small system consolidation is 20/6, and the ratio for the big system consolidation
is 20/3 – meaning that the 20 physical servers can fit on 6 small VM hosts or 3 larger VM hosts.
Producing graphs and reports 75
Page 76

Creating a consolidation candidates report
1. Select Reports→Capacity Advisor→Create Consolidation Candidate Reports...
2. The Report Wizard opens on the Select Report Targets screen.
Select the collection, complex, scenario, or systems for which you want the report, and select
the data range.
See Select targets and set date range for more information.
3. Select details specific to report type.
1. Select one or more types of resources for which you want to see data from among CPU,
memory, network I/O, and disk I/O.
2. Decide whether or not to alter the default settings for the Table Threshold Settings. (See
“Details: Consolidation Candidates Report” in Capacity Advisor Help for more
information.
3. Click Next to view a confirmation page showing the report selections.
4. Click Finish to run the report.
4. Click the appropriate link to browse the report in a web browser or to save the report to the
location that you designate.
To return to a planning checklist:
• Consolidating server loads onto a virtual machine manually [p. 36]
• Consolidating server loads onto a virtual machine using automated solution finding [p. 47]
• Determining where to put a workload using automated solution finding
Creating a cost allocation report
1. Select Reports→Capacity Advisor→Create VM Host Cost Allocation Reports... or
Reports→Capacity Advisor→Create Workload Cost Allocation Reports...
2. The Report Wizard opens on the Select Report Targets screen.
Select the collection, complex, scenario, or systems for which you want the report, and select
the data range.
See Select targets and set date range for more information.
3. Select details specific to report type.
1. Select one or more types of resources for which you want to see data from among CPU,
memory, network I/O, and disk I/O.
2. Supply the weighted average that you want the calculation to use for each selected
resource.
3. Click Next to view a confirmation page showing the report selections.
4. Click Finish to run the report.
4. Click the appropriate link to browse the report in a web browser or to save the report to the
location that you designate.
To return to a planning checklist:
• Obtaining reports on current resource usage [p. 35]
• Consolidating server loads onto a virtual machine manually [p. 36]
• Consolidating server loads onto a virtual machine using automated solution finding [p. 47]
• Determining where to put a workload using automated solution finding
Creating a peak summary report
1. Select Reports→Capacity Advisor→Create Peak Summary Reports....
76 Procedures
Page 77

2. The Report Wizard opens on the Select Report Targets screen.
Select the systems, scenario, or collection for which you want the report, and select the data
range.
See Select targets and set date range for more information.
3. Select details specific to report type.
1. Select one or more types of resources for which you want to see data from among CPU,
memory, network I/O, and disk I/O.
2. Select whether to include a Full Table of all available metrics or a subset (Short Table)
of the available metrics. See “Details: Peak summary report” in Capacity Advisor Help
for more information.
3. Select the graphs that you want to include in the report.
4. Provide the hours during which you expect peak activity to occur in yourtypical business
day.
5. Optional. Select a different graph size.
6. Click Next to view a confirmation page showing the report selections.
7. Click Finish to run the report.
4. Click the appropriate link to browse the report in a web browser or to save the report to the
location that you designate.
Creating a population report
1. Select Reports→Capacity Advisor→Create Population Reports....
2. The Report Wizard opens on the Select Report Targets screen.
Select the systems, scenario, or collection for which you want the report, and select the data
range.
See Select targets and set date range for more information.
3. Select details specific to report type.
1. Optional. Select the operating system detail to be displayed in the report.
2. Optional. Select the processor information to be displayed in the report.
3. Optional. Select the cores per socket information to be displayed in the report.
4. Optional. Select the total cores per server information to be displayed in the report.
5. Optional. Select a different scale or graph size.
6. Click Next to view a confirmation page showing the report selections.
7. Click Finish to run the report.
4. Click the appropriate link to browse the report in a web browser or to save the report to the
location that you designate.
Creating a trend report
1. Select Reports→Capacity Advisor→Create Utilization Reports....
2. The Report Wizard opens on the Select Report Content screen.
Select the check box(es) for a trend report summary or a summary and details and click
Next.
The Select Report Targets screen opens.
3. Select the collection, complex, systems, scenario, or workloads for which you want the report,
and select the data range.
See Select targets and set date range for more information.
Producing graphs and reports 77
Page 78

4. Select details specific to report type.
a. Select one or more types of resources for which you want to see data from among CPU,
memory, network I/O, and disk I/O. (Power is not available when reporting trends
only.)
b. Check the default graph size. The default size fits just within a letter-size page for
printing.
If you prefer dimensions smaller or larger, use the drop-down to change width (in
pixels).
If you prefer a different width-to-height proportion, use the Aspect Ratio drop down.
If you chose trend report details:
i. Select the Business Interval (default: 1 week).
Requiring higher percentages of valid points can make the business intervals
analyzed more meaningful, but can also reduce the number of business intervals
available for the analysis, making the overall analysis less useful.
ii. Select the minimum percentage of valid data points that must be present within
the period (default: 95%), called the Valid Threshold.
iii. Choose the data aggregation type (default: average), called Compute Trending
of.
iv. Optional. Check the box to include error analysis.
c. Click Finish.
5. Click the appropriate link to browse the report in a web browser or to save the report to the
location that you designate.
Related topics
• “Determining trends in Capacity Advisor” (page 31)
Creating a power report
1. Select Reports→Capacity Advisor→Create Utilization Reports....
2. The Report Wizard opens on the Select Report Content screen.
Select the check box(es) for a power summary or a summary and details and click Next.
The Select Report Targets screen opens.
3. Select the scenario, complex(es), or systems for which you want the report, and select the
data range.
See Select targets and set date range for more information.
4. If you chose power report details:
a. Designate the currency label to use in power report tables.
b. Designate a typical cost for power per kilowatt-hour (see “Cost per kilowatt-hour”
(page 123)).
c. Optionally, designate a cooling cost multiplier (see “Cooling multiplier” (page 123)).
d. Designate a time interval for display of results (default: by day).
e. Click Finish.
5. Click the appropriate link to browse the report in a web browser or to save the report to the
location that you designate.
Setting utilization limits
Utilization limits allow you to set service level objectives for workloads based on overall system
utilization. For any given workload, you can specify one or more service level objectives. Global
78 Procedures
Page 79

utilization limits are applied to real workloads recognized by Virtualization Manager and to
workloads within scenarios to enable analysis of collected data (actual utilization) as it relates
to desired resource utilization. Within a scenario, when a service level objective cannot be met
for a workload, a visual indicator along with a warning message will be displayed when moving
a workload in a scenario. When making automated changes, such as the automated system
consolidation, these utilization limits are enforced in determining a solution. For more discussion
about utilization limits, see “Utilization limits ” (page 27).
IMPORTANT: For specific descriptions of each field or summary table on the user interface
screens, click the help topic link on the software screen for the task.
Getting there
Screens for modifying utilization limits can be accessed from the following locations:
• the Virtualization Manager Configure menu on the Visualization tab
• the Modify menu on the Capacity Advisor tab
• the Edit menu on either the System or Workload tab of the Edit Scenario screen
TIP: For lists of all menu options for Capacity Advisor features, see “Menus & tabs” in Capacity
Advisor Help.
Setting global utilization limits
The default global utilization limits, which are applied in the absence of more specific limits, are:
◦ CPU utilization may not exceed 70% of allocation for more than 0
minutes.
◦ Memory utilization may not exceed 100% of allocation more than 0%
of the time.
Adding a utilization limit
1. From the Visualization tab, select Configure →Global Utilization Limits...
2. For each metric for which you wish to add a utilization limit:
a. Select the type of limit you wish to place, the utilization metric the limit applies to and
the utilization value above which the limit applies. For a Percent of Time Limit, enter
the percent of time the utilization value may be exceeded and a comment describing
the limit. For a Sustained Minutes limit, enter the duration in minutes the utilization
may be exceeded, and a comment describing the limit.
b. Click Add.
3. To see the current global utilization settings, click Revert.
To cancel your changes, click Cancel.
To accept your changes, click OK.
To return to a planning checklist:
• Consolidating server loads onto a virtual machine manually [p. 36]
Removing a utilization limit
1. For each utilization limit you wish to delete:
a. Check the box next to the utilization limit.
b. Click Remove.
Setting utilization limits 79
Page 80

2. To see the current global utilization settings, click Revert.
To cancel your changes, click Cancel.
To accept your changes, click OK.
Setting workload utilization limits
Utilization limits allow you to set service level objectives for workloads based on overall system
utilization. For any given workload, you can specify one or more service level objectives. The
limit acts as an indicator for what the desired maximum usage would be. This limit can be applied
to selectedworkloads on existing systems viewable from the Virtualization Manager Visualization
tab.
The workload utilization limits apply only to the selected workload(s).
Adding a utilization limit
1. From the Capacity Advisor tab, select Configure→Workload Utilization Limits...
2. For each metric for which you wish to add a utilization limit:
a. Select the type of limit you wish to place, the utilization metric the limit applies to, and
the utilization value above which the limit applies. For a Percent of Time Limit, enter
the percent of time the utilization value may be exceeded and a comment describing
the limit. For a Sustained Minutes limit, enter the duration in minutes the utilization
may be exceeded, and a comment describing the limit.
b. Click Add.
3. To see the current utilization settings, click Revert.
To cancel your changes, click Cancel.
To accept your changes, click OK.
Enabling or disabling the limit
To enable or disable the application of the current utilization limit:
• Select either Enabled or Disabled.
Removing a utilization limit
1. For each utilization limit you wish to delete:
a. Check the box next to the utilization limit.
b. Click Remove.
2. To see the current global utilization settings, click Revert.
To cancel your changes, click Cancel.
To accept your changes, click OK.
Setting scenario-wide utilization limits
The scenario utilization limits apply to all workloads within the selected scenario.
Adding a utilization limit
1. From the Capacity Advisor tab, select a scenario from the list of scenarios.
2. Select Configure→Scenario-wide Utilization Limits.
80 Procedures
Page 81

3. For each utilization limit you wish to add:
a. Select the type of limit you wish to place, the utilization metric the limit applies to and
the utilization value above which the limit applies. For a Percent of Time Limit, enter
the percent of time the utilization value may be exceeded and a comment describing
the limit. For a Sustained Minutes limit, enter the duration in minutes the utilization
may be exceeded, and a comment describing the limit.
b. Click Add.
4. To see the current utilization settings, click Revert.
To cancel your changes, click Cancel.
To accept your changes, click OK.
Enabling or disabling the limit
To enable or disable the application of the current utilization limit on the scenario:
• Select either Enabled or Disabled.
Removing a utilization limit
1. For each utilization limit you wish to delete:
a. Check the box next to the utilization limit.
b. Click Remove.
2. To see the current global utilization settings, click Revert.
To cancel your changes, click Cancel.
To accept your changes, click OK.
Setting scenario workload utilization limits
The scenario workload utilization limits apply to the selected workload(s) within the selected
scenario.
Adding a utilization limit
1. From the Capacity Advisor tab, open a scenario.
2. Click the Workload tab.
3. Select Edit→Scenario-wide Workload Utilization Limits.
4. For each metric for which you wish to add a utilization limit:
a. Select the type of limit you wish to place, the utilization metric the limit applies to and
the utilization value above which the limit applies. For a Percent of Time Limit, enter
the percent of time the utilization value may be exceeded and a comment describing
the limit. For a Sustained Minutes limit, enter the duration in minutes the utilization
may be exceeded, and a comment describing the limit.
b. Click Add.
5. To see the current utilization settings, click Revert.
To cancel your changes, click Cancel.
To accept your changes, click OK.
Enabling or disabling the limit
To enable or disable the application of the current utilization limit:
• Select either Enabled or Disabled.
Setting utilization limits 81
Page 82

Removing a utilization limit
1. For each utilization limit you wish to delete:
a. Check the box next to the utilization limit.
b. Click Remove.
2. To see the current global utilization settings, click Revert.
To cancel your changes, click Cancel.
To accept your changes, click OK.
To return to a planning checklist:
• Consolidating server loads onto a virtual machine manually [p. 36]
Forecasting utilization
HP Insight Capacity Advisor software provides multiple levels of forecast models to allow precise
control of forecasting future utilization.
IMPORTANT: For specific descriptions of each field or summary table on the user interface
screens, click the help topic link on the software screen for the task.
Defining forecast models
Whenever a Capacity Advisor report or profile is generated with an end date later than the
current date, the historical utilization data is projected into the future. The projection is indicated
in the utilization graphs by a light blue colored background next to the usual white background.
This projection is done based on a forecast model. Forecast models can be defined globally, for
individual workloads or systems, for a scenario, and for individual workloads within a scenario.
Because the process for defining a forecast model is basically the same regardless of where it is
in the hierarchy of forecast models, the procedures below are broken into two parts: accessing
the forecast model and defining it.
NOTE: Although forecast models cannot be deleted, all but the global forecast model can be
disabled and enabled. Follow the appropriate procedure for accessing the forecast model and
then follow the procedure for disabling or enabling it.
Accessing the Global Forecast Model
The annual growth rates for the global forecast model are frequently based on an organization's
planned growth rate. The global forecast model applies to all reports generated on systems and
complexes. Reports on workloads or scenarios without a forecast model also use the global
forecast model.
Prerequisites
• You must be logged in to Insight Dynamics. (See “Accessing Capacity Advisor” (page 55).)
• You must have sufficient authorization to define the global forecast model.
Procedure 5-50 To access the Global Forecast Model
1. If you are not on the Capacity Advisor tab:
• If the Capacity Advisor tab is visible, click the Capacity Advisor tab.
• If the Capacity Advisor tab is not visible, select Optimize→Capacity Advisor→View
Scenarios... from the top menu bar.
The Capacity Advisor tab opens with a list of scenarios.
2. From the Capacity Advisor menu bar, select Configure→Global Forecast...
82 Procedures
The Forecast Editor - Global Forecast Model screen displays.
Page 83

Defining the Global Forecast Model
The settings that you define here are applied globally in the absence of other specifically targeted
forecast models.
This procedure assumes that you have opened the Global Forecast Model screen (see “Accessing
the Global Forecast Model” (page 82).) .
1. Provide a brief description of the forecast model in the Description field.
2. Choose a time frame to use in tiling the data into the future (default: fixed interval).
The time interval (date range) field adjusts according to your time frame selection.
3. Select the date range for defining the period of data collection to use as the basis for the
forecast.
a. For a fixed interval: select the calendar interval, Beginning or Ending, and the date
(MM-DD-YYYY)
b. For a ranged interval: select the beginning and ending dates and times.
c. For a float interval: select the calendar interval, Beginning or Ending, and general date
indicator (default: Last Full Day)
4. Provide Annual Projected Growth Rates for each resource: CPU, Memory, Network I/O,
and Disk I/O. Use positive values for increasing utilization, negative values for decreasing
utilization, and zero for no change). The default is 1% projected annual growth for every
resource.
TIP: You can estimate projected annual growth by including trend calculationsin utilization
reports derived by analyzing historical data. (See “Determining trends in Capacity Advisor”
(page 31) and “The report wizard” (page 71).)
5. Click the OK button to save and apply a new definition for global forecasting.
TIP:
Undoing changes to the global forecast model If you change your mind about values while
editing this screen, use the Revert button to replace newly set values with the values that
were there when you started.
The Revert button does not return default values, so if you have edited the global forecast
values once before, and then decide that you prefer the default values, you will have to set
the values to “0” (zero) for each resource and click OK to have the original default values
in operation.
Accessing the forecast model for a workload or system
When the resource utilization of an individual workload or system is expected to differ from
that predicted by the global forecast model, a workload- or system-specific forecast model can
be created.
Forecasting for workloads or systems is done from within a profile viewer associated with the
workload or system. See “Using the Profile Viewer” (page 67) for information on how to access
the viewer from the HP SIM Optimize menu or from a scenario.
Forecasting utilization 83
Page 84

IMPORTANT: The forecast model for a system is not inherited by any monitored workloads. If
a systemwith monitored workloads is included in a scenario, the forecast model will not be used
within the scenario.
Prerequisites
• You must be logged in to Insight Dynamics. (See “Accessing Capacity Advisor” (page 55).)
• You must have sufficient authorization to define the forecast model for a workload or a
system.
Defining the forecast model for a workload or system
The following procedure assumes that a profile viewer is open (see “Using the Profile Viewer”
(page 67).)
1. If you are not on the Virtualization Manager screen, from the top menu, select
Tools→Virtualization Manager....
The Virtualization Manager Visualization tab screen is displayed.
2. To define the forecast model for a system, start on the Visualization tab.•
• To define the forecast model for a workload, click the Workload tab.
The Workload tab opens, displaying the licensed workloads.
3. Open a profile viewer by clicking a utilization meter for a particular system on the
Visualization tab or by clicking a utilization link for a particular workload on the Workload
tab.
The Profile Viewer screen is displayed for the system or workload.
4. Click the Edit Forecast Model... link on the profile viewer.
The Forecast Editor: Workload Forecast Model screen displays.
5. • To define the forecast model, follow the procedure Defining a forecast model.
• To disable the forecast model, follow the procedure Disabling a forecast model
• To enable the forecast model, follow the procedure Enabling a forecast model.
The default state of the new forecast definition is Enabled.
Accessing the forecast model for a scenario
Defining a separate forecast for a scenario allows you to provide estimates of utilization based
on differing growth projections.
Prerequisites
• You must be logged in to Insight Dynamics (see Accessing Capacity Advisor).
• You must have created the scenario (see “Creating a planning scenario” (page 86)).
Procedure 5-53 To access the forecast model for a scenario
1. If you are not on the Capacity Advisor tab:
• If the Capacity Advisor tab is visible, click the Capacity Advisor tab.
• If the Capacity Advisor tab is not visible, select Optimize→Capacity Advisor→View
Scenarios... from the top menu bar.
2. The names of scenarios for which you have authorization to define a forecast model are
3. From the System tab, select Edit→Scenario-wide Forecast...
84 Procedures
The Capacity Advisor tab opens, with a list of scenarios.
displayed as links. Click the link to open the scenario editor.
The Forecast Editor: Scenario-wide Forecast Model screen is displayed.
Page 85

4. • To define the forecast model, follow the procedure Defining a forecast model.
• To disable the forecast model, follow the procedure Disabling a forecast model
• To enable the forecast model, follow the procedure Enabling a forecast model.
Accessing the forecast model for a workload within a scenario
If the resource utilization of an individual workload within a scenario is expected to change
differently from the scenario forecast model, a different forecast model can be provided for the
workload.
Prerequisites
• You must be editing a scenario (see “Editing a scenario” (page 88)).
1. If you are not viewing the workloads, click the Workload tab.
The Workload tab opens, revealing a list of the workloads in the scenario.
2. Click the check box preceding a single workload.
3. Select Edit→Scenario Workload Forecast... from the menu bar.
The Forecast Editor: Scenario Workload Forecast Model screen is displayed.
4. • To define the forecast model, follow the procedure Defining a forecast model.
• To disable the forecast model, follow the procedure Disabling a forecast model
• To enable the forecast model, follow the procedure Enabling a forecast model.
Defining a forecast model
Once you have accessed a forecast model, use the following procedure to define it.
For descriptions of each of the fields noted in this procedure, see the screen description for the
model with which you are working in the Capacity Advisor online help reference. See “The
forecast model hierarchy” (page 33)for a list of the model screen descriptions.
1. Provide a brief description of the forecast model in the Description field
2. Specify an appropriate range of data to base the forecast on in the Forecast Data Range
Selection fields.
3. Provide Annual Projected Growth Rates for each of the utilization resources (CPU, memory,
network I/O, disk I/O). You may want to use trend data derived from analyzing historical
data to help you estimate future growth (see “Forecasting growth” (page 33)).
4. Click the OK button.
Disabling a forecast model
While it is not possible to delete a forecast model, forecast models at all levels below the global
forecast model can be disabled by accessing the appropriate forecast model and using the
following procedure.
1. Click the Disable radio button.
2. Click the OK button.
Enabling a forecast model
If you have previously disabled a forecast model, you can re-enable it by accessingthe appropriate
forecast model and using the following procedure.
1. Click the Enable radio button.
2. Click the OK button.
Generating forecasts
Once you have defined one or more forecast models, you can view the results of the forecast
models two ways:
Forecasting utilization 85
Page 86
• For a quick view, “Viewing forecast data in a profile viewer”
• For a more thorough report, “Viewing forecast data in a utilization report” (page 86)
Viewing forecast data in a profile viewer
A profile viewer provides a quick view of resource utilization for a system, complex, or workload.
Once the profile viewer is posted, you can view the forecast by extending the date range into the
future.
Prerequisites:
• You must be in a profile viewer. (See “Using the Profile Viewer” (page 67).)
• Change the Time Frame and/or Interval and/or Beginning and/or Ending for the profile
to include future dates and/or times. If necessary, click the Refresh button.
The graph will be updated. Historical utilization data will be plotted on a white background
and forecast data will be plotted on a light blue background.
Viewing forecast data in a utilization report
Use the procedure specified in “Creating an historic utilization report” (page 72) and specify
Ending (and possibly Beginning) times under Date Selection to include future times.
Historical utilization data will be plotted on a white background and forecast data will be plotted
on a light blue background.
Working with scenarios
Scenarios are collections of systems and workloads, both real and “what-if” creations. While
scenarios are based on real data, you can modify parameters to model changes to the environment
and the configuration of systems and workloads without affecting the real systems that the
scenario is based upon.
IMPORTANT: For specific descriptions of each field or summary table on the user interface
screens, click the help topic link on the software screen for the task.
TIP: For lists of all menu options for Capacity Advisor features, see “Menus & tabs” in Capacity
Advisor Help.
Creating a planning scenario
Scenarios are used to model system behavior by performing “what-if” operations based on
collected data. The first step in using scenarios is creating one.
Prerequisites
• You must be logged in to Insight Dynamics. (See “Accessing Capacity Advisor” (page 55).)
• You must have already collected data on the systems of interest (see “Gathering data for
Capacity Advisor” (page 55)).
• The systems you want to include in the scenario must be licensed for Capacity Advisor and
you must be authorized on all of them (see HP Insight Dynamics 6.2 Getting Started Guide).
Procedure 5-59 Starting a scenario
• Select Optimize→Capacity Advisor→Create Scenario... from the top menu bar.
86 Procedures
The Create Scenario wizard opens to an Introduction screen containing explanatory
information on how to interpret the icons that are used to indicate progress through the
wizard and how to navigate the wizard.
Page 87

Procedure 5-60 Identifying the scenario
1. Click Scenario Name in the left navigation column to open the Enter Scenario Name and
Description screen.
2. Required. Type a unique Name.
3. Type a short description in the Description field.
TIP: As the number of scenarios grows, the description field can help you to differentiate
similarly named scenarios.
4. Optional. You can de-select the check box for opening a scenario editing session after
completing scenario creation. When you un-check this box, you will return to the scenario
list page upon completing the scenario creation.
The Edit Scenario window on Mozilla Firefox:
In the case where the Edit Scenario window is already open, but hidden beneath other
windows when you create a new scenario, it is not obvious that the window has refreshed
with your new scenario information. This can occur when using Mozilla Firefox with multiple
windows open on your display. To more easily access the refreshed window, set Firefox to
allow Javascript to raise or lower windows. Then, when you create a new scenario, the
pre-existing Edit Scenario window will rise to the forefront of the display.
5. Click Next to proceed to the Add Systems to Analyze screen, or click Systems in the left
navigation column.
Procedure 5-61 Selecting systems to simulate
1. From the Add Systems to Analyze, click Add.
A new window opens that provides controls for filtering and selecting discovered systems
to include in the scenario.
2. In the new window, select existing systems that you want to include in the scenario and
click Add. (See “Adding systems” in Capacity Advisor online help for information on using
the controls in this window.)
With each addition, the list of systems on the primary Systems screen lengthens.
3. Click Next to view a summary of all actions taken in the wizard.
Procedure 5-62 Reviewing a summary of the scenario settings
1. Verify that the summary information is what you expect.
2. When satisfied, click Finish to save the scenario and exit the Create Scenario wizard.
By default, the scenario editor will open, showing utilization data for your new scenario.
The default data range used to calculate the utilization in the meters is set to one week back
from the current date. (See“ Controlling the data display” (page 88) in the Scenario Editor
to change this value.)
If you have not selected to open a scenario editing session, the main window refreshes with
the list of scenarios (on the Capacity Advisor tab), including your new scenario.
To return to a planning checklist:
• Consolidating server loads onto a virtual machine manually [p. 36]
• Consolidating server loads onto a virtual machine using automated solution finding [p. 47]
• Estimating the effect of adding processors [p. 51]
• Estimating the effect of moving processors [p. 51]
• Determining where to put a workload using automated solution finding
Working with scenarios 87
Page 88

Editing a scenario
Editing a scenario allows you to modify the systems and workloads in a scenario. This can be
done immediately after initial creation or to tune a scenario to represent planned changes.
Edit only one scenario at a time :
Opening a new edit scenario session when another editing session is already open causes the
loss of anyunsaved changesin the previously opened session. If you were running an automated
solution in your previous session, the automated calculations are immediately halted and no
settings or results are saved.
Prerequisites
• You must be logged in to Insight Dynamics. (See “Accessing Capacity Advisor” (page 55).)
• You must have created the scenario. (See “Creating a planning scenario” (page 86).)
1. If you are not on the Capacity Advisor tab:
• If the Capacity Advisor tab is visible, click the Capacity Advisor tab.
• If the Capacity Advisor tab is not visible, select Optimize→Capacity Advisor→View
Scenarios... from the top menu bar.
The Capacity Advisor tab will open, with a list of scenarios.
2. Any scenarios you have authorization to edit will be presented as links. Click the name of
the scenario you want to edit.
The Capacity Advisor - Edit Scenario screen will be displayed.
Controlling the data display
The default values for the data range and the Metric View Selection may not accurately represent
the interval of interest and the preferred metric. These are easily adjusted.
Change the meter style selection
Prerequisites:
• You must be editing a scenario (see “Editing a scenario” (page 88)).
• Click the Absolute or Percent radio button.
The meter bars in the scenario resource utilization table display the data as absolute numbers
or as percentages, according to your selection.
Change the data collection period by setting the data range
Set the interval within a data collection period that you want to use as the foundation for a
simulation or to view a specific historic period.
88 Procedures
Page 89

Prerequisites:
• You must be editing a scenario (see “Editing a scenario” (page 88))
NOTE: Changes to the data collection period persist across sessions.
1. Click Edit Interval within the Set Data Range box.
The fields are enabled as shown in the following image.
2. Click the first drop-down arrow to the left to see the choices for the duration of the data
collection period that you want to use.
Choose one to view in the display. The choices are as follow:
• Day
• Week (default)
• Month
• Quarter
• Half
• Year
3. Click the next drop-down arrow to the right to see the choices for selecting what relationship
the interval shall have to the selected date.
Choose one to view in the display. The choices are as follow:
• Ending (the simulation shall end at the selected date – default)
• Beginning (the simulation shall begin at the selected date)
4. Change the date, if needed, to work well with your other Data Range selections
5. Click OK to refresh the scenario resource utilization table with data collected during the
defined interval.
6. Click Cancel Edit Interval to return to the previous data range for this scenario.
Working with scenarios 89
Page 90

Change the meter representation
Prerequisites:
• You must be editing a scenario (see “Editing a scenario” (page 88)).
NOTE: Changes to the Meters Represent: options are applied to the current scenario editing
session, but options return to the default values at the beginning of any new session.
• Click the drop-down arrow to select a type of calculation to be represented in the meter bars
in the resource utilization table. The choices are as follow:
• average
• 90th percentile
• peak (default)
• max 15 minute sustained
The scenario resource utilization table displays the new values for each resource, including
violations of utilization limits set for each resource.
Copying a scenario
It is frequently desirable to use an existing scenario as the starting point for developing a new
scenario. Copying a scenario provides an easy way to accomplish this.
Prerequisites
• You must be logged in to Insight Dynamics. (See “Accessing Capacity Advisor” (page 55).)
• You must be authorized on all systems in the scenario (see HP Insight Dynamics 6.2 Getting
Started Guide).
Procedure 5-67 To Copy a Scenario
1. If you are not on the Capacity Advisor tab:
• If the Capacity Advisor tab is visible, click the Capacity Advisor tab.
• If the Capacity Advisor tab is not visible, select Optimize→Capacity Advisor→View
Scenarios... from the top menu bar.
The Capacity Advisor tab opens with a list of existing scenarios that you are authorized to
view.
2. Click the check box preceding the scenario that you want to copy.
3. Select Create→Copy Planning Scenario....
The Copy Scenario screen displays.
4. Modify the Name and Description fields as appropriate.
5. Click OK.
You are returned to the Capacity Advisor tab, and the copied scenario appears in the
scenario list.
To return to a planning checklist:
• Consolidating server loads onto a virtual machine manually [p. 36]
Renaming a scenario
Over time, more appropriate names for scenarios may become apparent, and you may want to
change the scenario name.
Prerequisites To rename a scenario:
• You must be logged in to Insight Dynamics (see Accessing Capacity Advisor).
• You must have created the scenario (see “Creating a planning scenario” (page 86)).
90 Procedures
Page 91

Getting there
If you are not on the Capacity Advisor tab:
• If the Capacity Advisor tab is visible, click the Capacity Advisor tab.
• If the Capacity Advisor tab is not visible, select Optimize→Capacity Advisor→View
Scenarios... from the top menu bar.
Procedure 5-68 To rename a scenario
The Capacity Advisor tab opens with a list of existing scenarios that you are authorized to view.
1. Click the check box preceding the scenario that you want to rename.
2. Select Modify→Rename Planning Scenario... from the menu bar.
The Rename Scenario screen displays.
3. Modify the Name and Description fields as desired.
4. Click OK.
You are returned to the Capacity Advisor tab, and the renamed scenario appears in the
scenario list.
Undo/edit/review applied what-if actions in a scenario
As you work on a scenario, you can review, delete, or disable/enable selected system changes.
Select What-If Action→Undo/Edit/View Applied What-If Actions from either the System or
Workload tab. The screen displays a list of changes made to the scenario. Check boxes precede
each action, with the earliest changes at the top of the list.
IMPORTANT: Disabling or enabling “what-if” actions can cause subsequent and dependent
“what-if” actions to fail. If this occurs, return to this screen to evaluate the dependencies and
decide what might be done to eliminate the errors. Remember that deletions permanently remove
the action from the record (and the scenario).
To view applied what-if actions
If you only wanted to review the changes, click Close once you are done reviewing. You will be
returned to the Capacity Advisor - Edit Scenario screen.
To edit applied what-if actions
If you wish to disable changes, click the check boxes preceding the changes you want to disable.
You can check either one step or a range of steps that have been grouped together.
Then, click Disable.
If you want to re-enable changes, click in the check boxes preceding the changes you want to
re-enable. You can check either one step or a range of steps that have been grouped together.
Then, click Enable.
If you want to delete changes, click the check boxes preceding the changes that you want to delete.
You can check either one step or a range of steps that have been grouped together.
Then, click Delete. This will completely remove the selected actions from the scenario record.
Working with scenarios 91
Page 92

IMPORTANT: Keep the change record clear of conflicting instructions and errors because errors
prevent the scenario from evaluating any further change. Note that changes made to this screen
are not applied until you Close the screen. This means that error messages resulting from conflicts
introduced on the Undo/Edit screen are displayed on the Edit Scenario screen.
Modifying resource utilization values
For rows where this feature is available, you can change the scaling factors (multipliers) associated
with a change.
1. Click the check box to the left of the row where you want to change the value.
2. Change the value using the field in the column labeled Modifiable Values.
3. Click Modify.
When you are done, click Close. You can come back to the this screen as many times as needed.
You will be returned to the Capacity Advisor - Edit Scenario screen. The changes you disabled
or deleted will no longer be in effect and those you re-enabled will be in effect again. You should
be able to see the resulting modifications reflected in the data presented on the Edit Scenario
System or Workload tab screens.
Related topic
• Appendix F (page 163)
Deleting a scenario
Over time, as scenarios become irrelevant, removing them will reduce the list you have to search
to find your scenarios.
Prerequisites
• You must be logged in to Insight Dynamics. (See “Accessing Capacity Advisor” (page 55).)
• You must have created the scenario (see “Creating a planning scenario” (page 86).) or be
the HP SIM administrator (see the HP SIM help by selecting Help→For HP Systems Insight
Manager from the top menu bar).
1. If you are not on the Capacity Advisor tab:
• If the Capacity Advisor tab is visible, click the Capacity Advisor tab.
• If the Capacity Advisor tab is not visible, select Optimize→Capacity Advisor→View
Scenarios... from the upper, top menu bar.
The Capacity Advisor tab will open, with a list of scenarios.
2. The names of any scenarios you created, and thus can delete, will be displayed as links. If
you are the administrator, you can delete any scenario. Click the radio button preceding the
scenario you wish to delete.
The row containing the scenario will be highlighted and the radio button will be filled in to
indicate selection.
3. Select Delete→Planning Scenario from the Capacity Advisor tab menu bar.
The Delete Scenario confirmation screen will be displayed, with the name of the scenario
that will be deleted.
4. Confirm that this is the scenario you want to delete, then click the OK button.
92 Procedures
You will be returned to the VSE Management: Capacity Advisor screen.
Page 93

Working with systems
Systems can represent physical hardware, Virtual Machines (VM), or Virtual Machine Hosts. They
can be real systems from your current environment or “What-If” creations to represent new
systems you are planning. You can also modify a system based on an existing system to represent
planned configuration changes.
IMPORTANT: For specific descriptions of each field or summary table on the user interface
screens, click the help topic link on the software screen for the task.
Most of the procedures described in this section are accessed from the System tab menus in the
scenario editor. From the Capacity Advisor tab, double-click the scenario that you want to
modify to open the editor.
TIP: For lists of all menu options for Capacity Advisor features, see “Menus & tabs” in Capacity
Advisor Help.
Creating a system
When developing a scenario to model future configurations, you can create one or more systems
to represent system types that you are considering adding to the configuration.
1. On the System tab of the scenario editor, select What-If Action→Create Systems... from
the menu bar.
The Edit Scenario - Create System screen displays.
2. Fill in the System Name with a unique name.
You cannot change the name once the system is created.
NOTE: You can add one or more system names at a time by separating each name with a
comma (,) within the System Name field.
IMPORTANT: While Capacity Advisor will inform you when the system name that you
have designated is not unique (a system with the same name has been discovered by HP
SIM), it cannot check names of systems that have not yet been discovered or created. Use
names that you believe will not be used in the future (during the useful life of the scenario).
3. Select the appropriate System Model and Hardware Processor Family in the System
Hardware section.
4. Select the appropriate server type.
The screen repaints with the options appropriate to the selected server type.
5. If you selected Standard Server in step 5, now select the appropriate operating system.
6. If you selected VM Guest in step 5, now select a VM host.
7. If you selected VM Host in step 5, now select a VM host platform.
8. Modify the CPU Resources as appropriate.
9. Modify the Memory Size as appropriate.
10. Modify the network and disk I/O Capacity as appropriate.
11. Optional. Modify Power Calibration.
12. Click Apply to save the system definition and stay on the Create System screen to create
more systems, or click OK to save the system definition and return to the Edit Scenario
screen.
Working with systems 93
Page 94

To return to a planning checklist:
• Consolidating server loads onto a virtual machine manually [p. 36]
Adding an existing system
As your environment changes, you may want to add an existing system to a scenario.
1. From the System tab of the scenario editor, select Edit→Add Existing Systems... from the
menu bar.
The Edit Scenario - Add Existing Systems screen will be displayed. The systems with
available data will be displayed in a list with check boxes beside them. Any systems licensed
for Capacity Advisor will be named below the list.
2. If any of the systems you want to add to the scenario are not displayed on this page, you
need to license them for Capacity Advisor (see the section “Adding and applying licenses”
in HP Insight Dynamics 6.2 Getting Started Guide) and collect data on them (see “Gathering
data for Capacity Advisor” (page 55)).
3. If the systems you wish to add to the scenario are in the list of licensed systems without
available Capacity Advisor data, collect data on them (see “Gathering data for Capacity
Advisor” (page 55)) and continue with the next step.
4. Click in the check boxes beside the systems you want to add to the scenario to select them.
5. Click the OK button.
The System tab of the Capacity Advisor - Edit Scenario screen will open.
To return to a planning checklist:
• Consolidating server loads onto a virtual machine manually [p. 36]
Editing a system
When constructing a scenario, it is frequently necessary to modify the characteristics of a system
to reflect future changes to existing hardware or to reflect the characteristics of a planned system.
1. From the System tab of the scenario editor, select What-If Action→Edit System... from the
menu bar.
The Edit Scenario: Edit System screen displays in a new window.
2. Modify the system attributes as desired. These attributes can be changed:
• System Hardware
• CPU Resources
• Memory Size
• I/O Capacity
3. Click the OK button.
The System tab of the Capacity Advisor Edit Scenario screen displays.
To return to a planning checklist:
• Consolidating server loads onto a virtual machine manually [p. 36]
• Estimating the effect of adding processors [p. 51]
• Estimating the effect of moving processors [p. 51]
• Determining where to put a workload using automated solution finding
Changing VMs to be servers
This screen allows you to convert existing virtual machines to individual servers.
94 Procedures
Page 95

Change VMs to server
1. From the System tab of the scenario editor, select one or more VMs.
2. Select What-If Action→Change VMs to be Servers from the menu bar.
The Edit Scenario: Change VMs to be Servers screen displays.
3. Change the Meter Scale, if desired.
4. Change the Data Range if a different size of data collection is desired, and click OK to refresh
the table display.
TIP: A longer data collection period provides a better picture of activity on the system
over time than shorter periods do.
5. Change the Meter Representation if a different calculation is desired .
6. Examine the table titled Systems to be modified:.
If you wish to modify the CPU utilization to account for any change in virtualization
overhead, you can enter a percentage under CPU virtualization overhead %. The default
is 0% to represent no change.
7. Click OK to accept these changes.
After clicking OK, you see an updated Edit Scenario page. The modified virtual machines now
appear as Server under the System Type heading.
Changing servers to be VMs (manually)
This option provides a quick way to change a physical server into a virtual machine so that you
can later simulate the movement of virtual machines among VM hosts.
Change servers to be VMs
For specific descriptions of each field on this screen, click the help topic link on the software
screen for this task.
1. From the System tab of the scenario editor, select one or more servers.
2. Select What-If Action→Change Servers to be VMs from the menu bar.
The Edit Scenario: Change Servers to be VMs screen displays.
3. Change the Meter Scale, if desired.
4. Change the Data Range if a different size of data collection is desired, and click OK to refresh
the table display.
TIP: A longer data collection period provides a better picture of activity on the system
over time than shorter periods do.
5. Change the Meter Representation if a different calculation is desired .
6. Examine the table titled Systems to be modified:.
If you want to modify the CPU utilization to account for any change in virtualization
overhead, you can enter a percentage under CPU virtualization overhead %. The default
is 0% to represent no change. On entering a new value for CPU virtualization overhead, you
must click Refresh to update the table titled To: (Selected VM Host) with the new values.
7. Optional. Change the headroom calculation. You must click Refresh to update the server
destination table with the new values.
Working with systems 95
Page 96

8. Within the table titled To: (Selected VM Host), select a destination VM host for the
previously selected systems.
Server presentation:
The table entries are ordered by headroom fitness as determined by Capacity Advisor, and
Capacity Advisor selects the top selection by default. Examine the headroom rating and the
utilization meters for each prospective host to determine which host best fits your goals for
headroom fitness and optimal utilization. (See “Headroom” (page 25) for a discussion of
this concept.)
9. Click OK to accept these changes.
Unknowingly accepting unseen values:
This can happen if you modify the CPU virtualization overhead % or headroom calculation
after selecting the destination server, but then click OK without refreshing the destination
table with the new values. The resulting change to the utilization values shown in the System
tab view will differ from those seen in the previously shown destination table because the
System tab will reflect the modified values.
When modifying CPU virtualization overhead % or headroom, remember to click Refresh,
and check the updated values shown in the utilization meters in the destination table. Once
you have refreshed this table, select a server based on the new values. If you want the same
server that you selected before changing the values, you must re-select that server to enable
the OK button.
After clicking OK, you see an updated Edit Scenario page. The modified system(s) now appear
with the VM guest type listed under System Type (for example, 'Integrity VM'). Additionally,
the modified system(s) is/are listed under the selected destination server.
To return to a planning checklist:
• Consolidating server loads onto a virtual machine manually [p. 36]
Assigning VM hosts to a VMware DRS cluster in a scenario
You can use Capacity Advisor to simulate the behavior of workloads and VMs that are members
of a VMware Distributed Resource Scheduler (DRS) cluster. This conversion is meant to let you
simulate VM hosts running VMware ESX servers. Once you have created one of these “what-if”
cluster scenarios, you are able to do any of the following actions in this scenario:
• add other VM hosts to the cluster
• consolidate or load balance VMs in a cluster
In addition, you can run reports on clusters defined within a scenario.
Initially converting VM hosts to simulate a VMware DRS cluster
1. From the System tab of the scenario editor, click the check boxes for two or more ESX VM
hosts that you want to convert to a DRS cluster.
IMPORTANT: If you want to see power metrics for the cluster, make sure that all VM hosts
that you select have been calibrated (either automatically or manually) before adding them
to a cluster.
2. Select What-If Action→Convert/Add to VMware DRS Cluster....
96 Procedures
The Convert/Add to VMware DRS Cluster screen opens.
Page 97

3. Type a unique name for identifying the cluster (required).
IMPORTANT: While Capacity Advisor will inform you when the cluster name that you
have designated is not unique (a cluster with the same name has been discovered by HP
SIM), it cannot check names of clusters that have not yet been discovered or created. Use
names that you believe will not be used in the future (during the useful life of the scenario).
4. Optional. Select HA (High Availability) Cluster.
5. Click OK to save the cluster definition.
The System tab screen refreshes. The previously selected VM hosts and their guests are
now identified as members of a VMware DRS cluster in the system list.
Adding VM hosts to a converted cluster
1. From the System tab of the scenario editor, click the check boxes for one or more ESX VM
hosts that you want to add to an existing DRS cluster AND click the existing DRS cluster or
one VM host that is already a member of the desired cluster.
IMPORTANT: If you want to see power metrics for the cluster, make sure that all VM hosts
that you select have been calibrated (either automatically or manually) before adding them
to a cluster.
2. Select What-If Action→Convert/Add to VMware DRS Cluster....
The Convert/Add to VMware DRS Cluster screen opens.
3. Confirm that all of the systems that you wanted to add to the cluster appear in the System
Name(s) list.
TIP: The System Name(s) field cannot be edited when adding systems to a cluster. If an
error is made, Cancel out of the screen, and try again with your system selection.
4. Optional. Select HA (High Availability) Cluster.
5. Click OK to save the modified cluster definition.
The System tab screen refreshes. The newly selected VM hosts and their guests are now
identified as members of a VMware DRS cluster.
Removing a VM host from a VMware DRS cluster
1. Select What-If Action→Undo/Edit/View Applied What-If Actions .
2. Disable or Delete the row(s) containing the record of making the VM host(s) a member of
a cluster. (See “Undo/edit/review applied what-if actions in a scenario” (page 91) for more
information on using this screen.)
3. Close the Undo/Edit/View Applied What-If Actions window to return to the updated
System tab.
Removing a VMware DRS cluster from a scenario
1. Select What-If Action→Undo/Edit/View Applied What-If Actions .
2. Disable or Delete the row(s) containing the record of creating the cluster and any rows that
record making the VM host(s) and the VM guests members of the cluster. (See
“Undo/edit/review applied what-if actions in a scenario” (page 91) for more information
on using this screen.)
3. Close the Undo/Edit/View Applied What-If Actions window to return to the updated
System tab.
Working with systems 97
Page 98

Moving a virtual machine
Moving Virtual Machines (VMs) among VM hosts allows you to redistribute virtual equivalents
of existing systems across physical servers. Capacity Advisor automatically takes into account
use of dynamic memory by a virtual machine.
NOTE: Performance for a virtual machine is usually calculated using the performance index
calculated for its VM host. However, when a virtual machine is moved from one VM host to
another having a different clock speed, performance is calculated using a combination of clock
speed and the performance index of the destination host. To get the best possible measure, collect
the desired amount of data from a VM before moving it to host of a differing CPU clock speed.
1. From the System tab in the scenario editor, clickthe check box preceding the virtual system(s)
that you want to move.
2. Select What-if Action→Move Virtual Machines... from the menu bar.
The Edit Scenario: Move Virtual Machines screen displays.
3. Change the Meter Scale, if desired.
4. Change the Data Range if a different size of data collection is desired, and click OK to refresh
the table display.
TIP: A longer data collection period provides a better picture of activity on the system
over time than shorter periods do.
5. Change the Meter Representation if a different calculation is desired .
6. The first table presents the virtual machines selected for the move.
7. Optional. Change the headroom calculation. You must click Refresh to update the server
destination table with the new values.
8. Within the table titled To: (Selected VM Host), select a destination VM host for the
previously selected systems. The OK button becomes enabled for use.
Server presentation:
The table entries are ordered by headroom fitness as determined by Capacity Advisor, and
Capacity Advisor selects the top selection by default. Examine the headroom rating and the
utilization meters for each prospective host to determine which host best fits your goals for
headroom fitness and optimal utilization.
9. Click OK to accept these changes.
Unknowingly accepting unseen values:
This can happen if you modify the headroom calculation after selecting the destination server,
but then click OK without refreshing the destination table with the new values. The resulting
change to the utilization values shown in the System tab view will differ from those seen
in the previously shown destination table because the System tab will reflect the modified
values.
The System tab of the Edit Scenario screen opens showing the newvirtual machine relationships.
98 Procedures
When modifying headroom, remember to click Refresh, and check the updated values
shown in the utilization meters in the destination table. Once you have refreshed this table,
select a server based on the new values. If you want the same server that you selected before
changing the values, you must re-select that server to enable the OK button.
Page 99

Removing a system
As your scenarios evolve, you might need to remove systems from a scenario to represent planned
or actual changes.
1. From the System tab of the scenario editor, click in the check boxes beside the systems that
you want to remove from the scenario.
2. Select Edit→Remove Systems... from the menu bar.
A confirmation screen listing the systems you are removing will be presented.
3. Click the OK button.
You will be returned to the Capacity Advisor - Edit Scenario screen with the systems you
selected removed.
Editing network and disk I/O capacity
Use the Edit Network and Disk I/O Capacity page to set the upper bound value of network and
disk I/O capacity for the selected set of systems. Setting this upper bound creates the maximum
capacity value for such items as the network and disk I/O utilization graphs shown for the
systems, the graphs and values shown in a profile viewer, and the HP Smart Solver calculations.
Further, when using Capacity Advisor, the currently set upper bound values here are propagated
as the upper bound values for the systems when a scenario containing the systems are created.
Getting there
1. From the Virtualization Manager Visualization view, select a compartment or
sub-compartment for a system for which you want to edit its network I/O and disk I/O
capacity.
2. From the Virtualization Manager Configure menu, select Edit Network and Disk I/O
Capacity....
The Edit Network and Disk I/O Capacity screen displays.
TIP: This feature can also be accessed from profile viewers opened from the Visualization
view.
Setting the upper bound values
1. Select to use the maximum observed network and disk I/O readings
Or
Manually specify the network and disk I/O capacity values
a. Enter a value for network I/O in Mb/s.
b. Enter a value for disk I/O in MB/s.
NOTE: If desired, you can set the manual maximum value to be greater than the
observed maximum.
The designated values are used to populate the Selected Systems table and are applied
elsewhere by Capacity Advisor.
2. Select Apply or OK to apply and preserve your changes, respectively.
Working with systems 99
Page 100

Working with workloads
Introduction
Workloads represent applications running on systems.
IMPORTANT: For specific descriptions of each field or summary table on the user interface
screens, click the help topic link on the software screen for the task.
All of the procedures described in this section can be accessed from the Workload tab menus in
the scenario editor. From the Capacity Advisor tab, double-click the scenario that you want to
modify to open the editor.
TIP: For lists of all menu options for Capacity Advisor features, see “Menus & tabs” in Capacity
Advisor Help.
Creating a workload
When you are modeling future configurations, you can create new workloads to represent
applications that will be added. The workload can be based on either a static baseline or profile
data from an existing workload.
1. To preselect the system on which to run the workload:
• From the System tab in the scenario editor, click the check box preceding the system
on which you want to run the workload(s).
2. Select What-If Action→Create Workloads... from the menu bar.
The Edit Scenario: Create Workloads screen opens.
3. Fill in the Workload Name(s) with a unique name.
IMPORTANT: While Capacity Advisor will inform you when the workload name that you
have designated is not unique (a workload with the same name has been discovered by HP
SIM), it cannot check names of workloads that have not yet been discovered or created. Use
names that you believe will not be used in the future (during the useful life of the scenario).
4. Optionally, add a detailed description of the workload(s) in the Workload Description
field.
5. a. If you intend to park the workload(s), confirm that the check box labeled Park/Unassign
Workload is checked. Skip to step 7.
b. If you previously selected a system, review the associated information given for that system.
Then skip to step 7.
c. If you want to select a system, uncheck the Park/Unassign Workload check box, if needed,
to enable system selection.
100 Procedures
 Loading...