

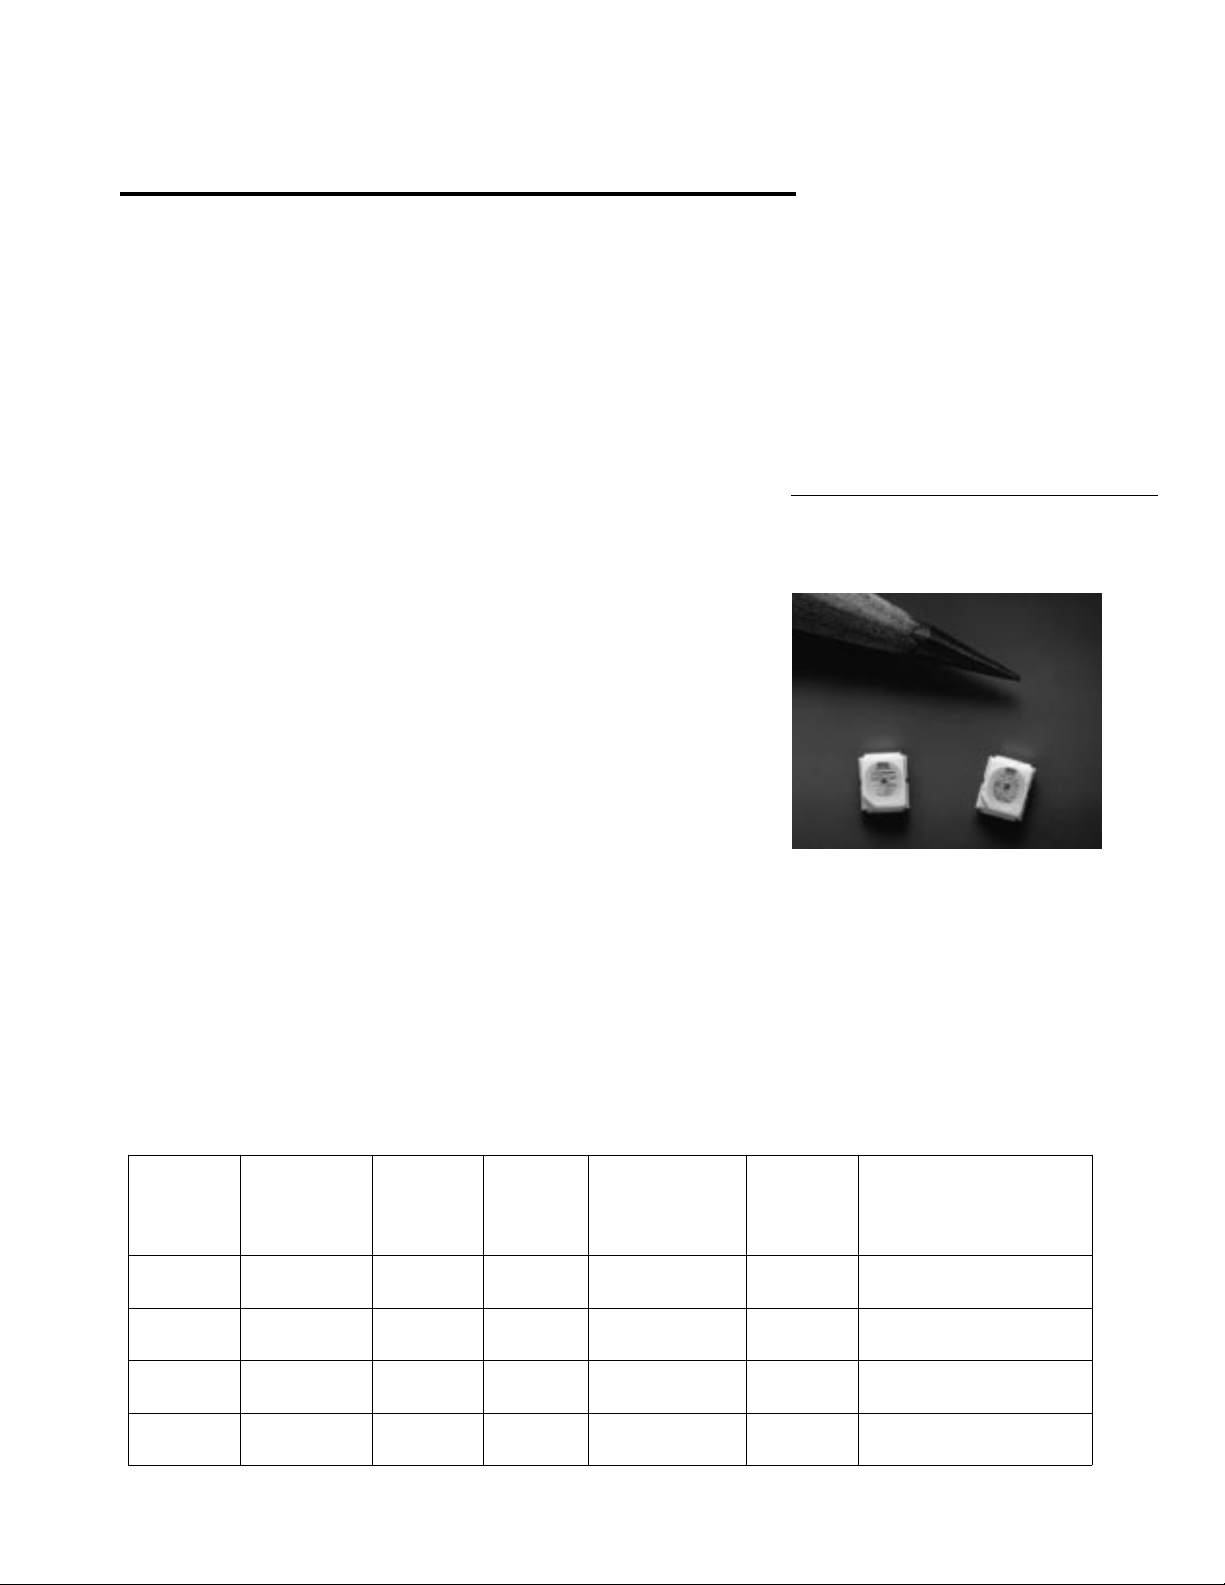
Surface Mount LED Indicator
H
Technical Data
Features
• Compatible with Automatic
Placement Equipment
• Compatible with Infrared
and Vapor Phase Reflow
Solder Processes
• Packaged in 12 mm or 8 mm
tape on 7" or 13" Diameter
Reels
• EIA Standard Package
• Low Package Profile
• Nondiffused Package
Excellent for Backlighting
and Coupling to Light Pipes
Description
These solid state surface mount
indicators are designed with a flat
top and sides to be easily handled
by automatic placement
equipment. A glue pad is provided
for adhesive mounting processes.
They are compatible with
convective IR and vapor phase
reflow soldering and conductive
epoxy attachment processes.
The package size and configuration conform to the EIA-535
BAAC standard specification for
case size 3528 tantalum
capacitors. The folded leads
HSMD-TX00
HSME-TX00
HSMG-TX00
HSMH-TX00
HSMS-TX00
HSMY-TX00
permit dense placement and
provide an external solder joint
for ease of inspection.
These devices are nondiffused,
providing high intensity for
applications such as backlighting,
light pipe illumination, and front
panel indication.
Device Selection Guide
DH AS High High
AlGaAs Efficiency Performance Emerald
Red Red Orange Yellow Green Green
HSMH- HSMS- HSMD- HSMY- HSMG- HSME- Description
T400 T400 T400 T400 T400 T400 12 mm Tape, 7" Reel,
2000 Devices
T500 T500 T500 T500 T500 T500 12 mm Tape, 13" Reel,
8000 Devices
T600 T600 T600 T600 T600 T600 8 mm Tape, 7" Reel,
2000 Devices
T700 T700 T700 T700 T700 T700 8 mm Tape, 13" Reel,
8000 Devices
1-204
5964-9359E
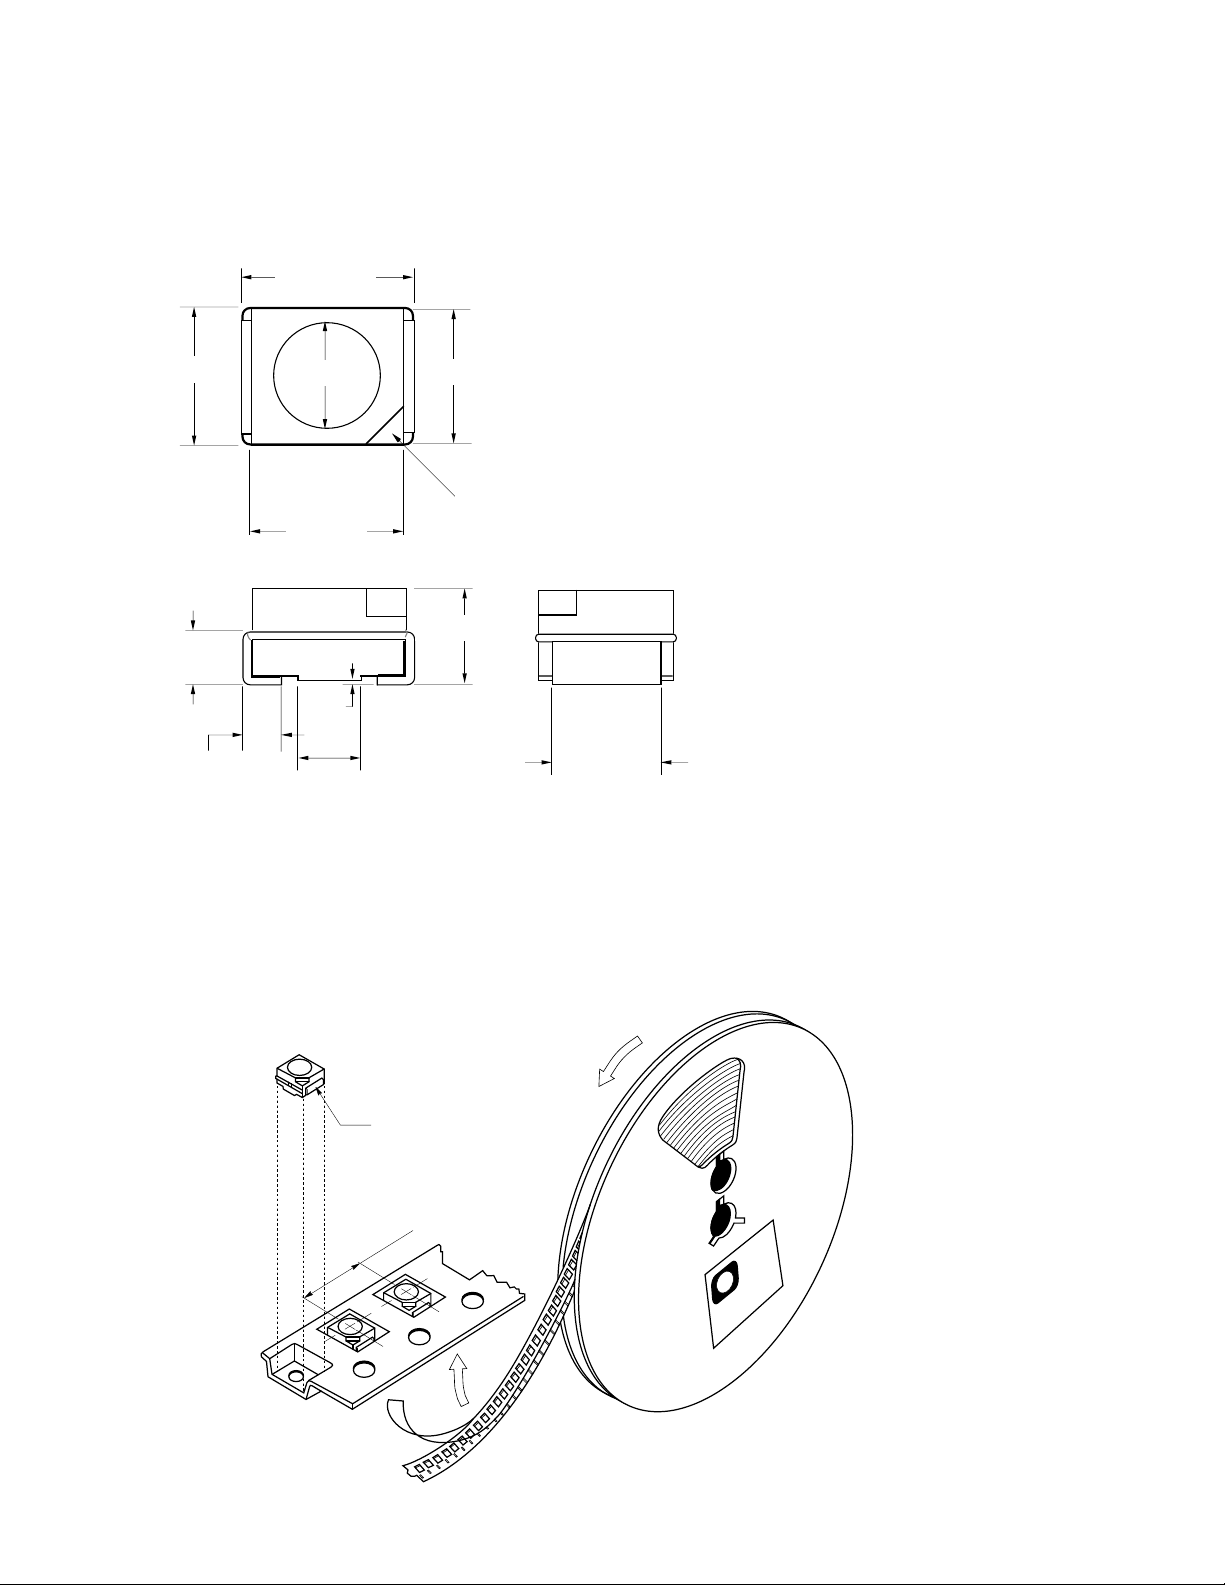
Package Dimensions
3.5 ± 0.2
(0.138 ± 0.008)
2.8 ± 0.2
(0.110 ± 0.008)
0.7
(0.028)
0.8 ± 0.3
(0.031 ± 0.012)
(2 PLACES)
MIN.
(0.087)
3.1
(0.122)
(0.004)
NOM.
2.2
0.1
1.3
(0.050)
MIN.
NOM.
NOM.
Tape and Reel Specifications
Hewlett Packard surface mount
LEDs are packaged tape and reel
in accordance with EIA-481A,
Taping of Surface Mount
2.7
NOM.
(0.106)
NOTES:
1. ALL DIMENSIONS ARE IN MILLIMETERS (INCHES).
2. THE LEADS ARE COPPER ALLOY, 85% Sn/15% Pb PLATING.
CATHODE NOTCH
1.9 ± 0.2
(0.075 ± 0.008)
2.2 ± 0.1
(0.087 ± 0.004)
Components for Automatic
Placement. This packaging
system is compatible with tapefed automatic pick and place
systems. Each reel is sealed in a
vapor barrier bag for added
protection. Bulk packaging in
vapor barrier bags is available
upon special request.
CATHODE
PITCH: 4 mm (0.157 IN.)
CARRIER TAPE WIDTH:
12 mm (0.472 IN.) OR 8 mm (0.315 IN.)
USER FEED
DIRECTION
HEWLETT
hp
PACKARD
REEL DIAMETER:
178 mm (7 IN.) OR 330 mm (13 IN.)
1-205

Absolute Maximum Ratings at T
= 25°C
A
DH AS High High
AlGaAs Efficiency Perf. Emerald
Parameter Red Red Orange Yellow Green Green Units
DC Forward 30 30 30 30 30 30 mA
Current
[1]
Peak Forward 300 90 90 60 90 90 mA
Current
[2]
Average 20 25 25 20 25 25 mA
Forward
Current
[2]
LED Junction 95 °C
Temperature
Transient
Forward
Current
[3]
(10 µs Pulse) 500 mA
Reverse Voltage 5 V
(IR = 100 mA)
Operating -40 to +85 -20 to +85 °C
Temperature
Range
Storage -40 to +85 °C
Temperature
Range
Reflow Soldering
Temperature
Convective IR 235°C Peak, above 185°C for 90 seconds.
Vapor Phase 215°C for 3 minutes.
Notes:
1. Derate dc current linearly from 50°C: For AlGaAs red, high efficiency red, and green devices at 0.67 mA/°C. For yellow devices at
0.44 mA/°C.
2. Refer to Figure 5 showing Maximum Tolerable Peak Current vs. Pulse duration to establish pulsed operating conditions.
3. The transient peak current is the maximum non-recurring peak current the device can withstand without damaging the LED die and
wire bond. The device should not be operated at peak currents above the Absolute Maximum Peak Forward Current.
1-206

Electrical/Optical Characteristics at TA = 25°C
DH AS AlGaAs Red HSMH-TX00
Parameter Symbol Min. Typ. Max. Units Test Conditions
Luminous Intensity I
Forward Voltage V
Reverse Breakdown Voltage V
v
F
R
9.0 17.0 mcd IF = 10 mA
1.8 2.2 V IF = 10 mA
5.0 15.0 V IR = 100 µA
Included Angle Between
Half Intensity Points
Peak Wavelength λ
Dominant Wavelength
Spectral Line Half Width ∆λ
Speed of Response τ
[1]
[2]
2θ
PEAK
1/2
120 deg.
645 nm
λ
d
1/2
s
637 nm
20 nm
30 ns Time Constant, e
Capacitance C 30 pF VF = 0, f = 1 MHz
Thermal Resistance Rθ
Luminous Efficacy
[3]
η
J-pin
v
180 °C/W Junction-to-Cathode
80 lm/W
High Efficiency Red HSMS-TX00
Parameter Symbol Min. Typ. Max. Units Test Conditions
Luminous Intensity I
Forward Voltage V
Reverse Breakdown Voltage V
v
F
R
2.0 6.0 mcd IF = 10 mA
1.9 2.5 V IF = 10 mA
5.0 30.0 V IR = 100 µA
Included Angle Between
Half Intensity Points
Peak Wavelength λ
Dominant Wavelength
Spectral Line Half Width ∆λ
Speed of Response τ
[1]
[2]
2θ
PEAK
λ
1/2
d
1/2
s
120 deg.
635 nm
626 nm
40 nm
90 ns Time Constant, e
Capacitance C 11 pF VF = 0, f = 1 MHz
-t/τ
-t/τ
s
s
Thermal Resistance Rθ
Luminous Efficacy
Notes:
1. θ
is the off-axis angle where the luminous intensity is half the on-axis value.
1/2
2. The dominant wavelength, λd, is derived from the CIE Chromaticity Diagram and represents the color of the device.
3. The radiant intensity, Ie, in watts per steradian, may be found from the equation Ie = Iv/ ηv, where Iv is the luminous intensity in
candelas and ηv is luminous efficacy in lumens/watt.
[3]
J-pin
η
v
160 °C/W Junction-to-Cathode
145 lm/W
1-207

Orange HSMD-TX00
Parameter Symbol Min. Typ. Max. Units Test Conditions
Luminous Intensity I
Forward Voltage V
Reverse Breakdown Voltage V
v
F
R
1.5 5.0 mcd IF = 10 mA
1.9 2.5 V IF = 10 mA
5.0 30.0 V IR = 100 µA
Included Angle Between
Half Intensity Points
Peak Wavelength λ
Dominant Wavelength
Spectral Line Half Width ∆λ
Speed of Response τ
[1]
[2]
2θ1/2 120 deg.
PEAK
λ
d
1/2
s
600 nm
602 nm
40 nm
260 ns Time Constant, e
Capacitance C 4 pF VF = 0, f = 1 MHz
Thermal Resistance Rθ
Luminous Efficacy
[3]
J-pin
η
v
160 °C/W Junction-to-Cathode
380 lm/W
Yellow HSMY-TX00
Parameter Symbol Min. Typ. Max. Units Test Conditions
Luminous Intensity I
Forward Voltage V
Reverse Breakdown Voltage V
v
F
R
2.0 5.0 mcd IF = 10 mA
2.0 2.5 V IF = 10 mA
5.0 50.0 V IR = 100 µA
Included Angle Between
Half Intensity Points
[1]
2θ1/2 120 deg.
-t/τ
s
Peak Wavelength λ
Dominant Wavelength
[2]
Spectral Line Half Width ∆λ
Speed of Response τ
PEAK
λ
d
1/2
s
583 nm
585 nm
36 nm
90 ns Time Constant, e
Capacitance C 15 pF VF = 0, f = 1 MHz
Thermal Resistance Rθ
Luminous Efficacy
Notes:
1. θ1/2 is the off-axis angle where the luminous intensity is half the on-axis value.
2. The dominant wavelength, λd, is derived from the CIE Chromaticity Diagram and represents the color of the device.
3. The radiant intensity, Ie, in watts per steradian, may be found from the equation Ie = Iv/ ηv, where Iv is the luminous intensity in
candelas and ηv is luminous efficacy in lumens/watt.
[3]
J-pin
η
v
1-208
160 °C/W Junction-to-Cathode
500 lm/W
-t/τ
s

High Performance Green HSMG-TX00
Parameter Symbol Min. Typ. Max. Units Test Conditions
Luminous Intensity I
Forward Voltage V
Reverse Breakdown Voltage V
v
F
R
4.0 10.0 mcd IF = 10 mA
2.0 2.5 V IF = 10 mA
5.0 50.0 V IR = 100 µA
Included Angle Between
Half Intensity Points
Peak Wavelength λ
Dominant Wavelength
Spectral Line Half Width ∆λ
Speed of Response τ
[1]
[2]
2θ1/2 120 deg.
PEAK
λ
d
1/2
s
570 nm
572 nm
28 nm
500 ns Time Constant, e
Capacitance C 18 pF VF = 0, f = 1 MHz
Thermal Resistance Rθ
Luminous Efficacy
Notes:
1. θ
is the off-axis angle where the luminous intensity is half the on-axis value.
1/2
2. The dominant wavelength, λd, is derived from the CIE Chromaticity Diagram and represents the color of the device.
3. The radiant intensity, Ie, in watts per steradian, may be found from the equation Ie = Iv/ ηv, where Iv is the luminous intensity in
candelas and ηv is luminous efficacy in lumens/watt.
[3]
J-pin
η
v
160 °C/W Junction-to-Cathode
595 lm/W
Emerald Green HSME-TX00
-t/τ
s
Parameter Symbol Min. Typ. Max. Units Test Conditions
Luminous Intensity I
Forward Voltage V
Reverse Breakdown Voltage V
v
F
R
1.0 1.5 mcd IF = 10 mA
2.2 2.27 V IF = 10 mA
5.0 50.0 V IR = 100 µA
Included Angle Between
Half Intensity Points
Peak Wavelength λ
Dominant Wavelength
Spectral Line Half Width ∆λ
Speed of Response τ
[1]
[2]
2θ1/2 120 deg.
PEAK
λ
d
1/2
s
558 nm
560 nm
28 nm
500 ns Time Constant, e
Capacitance C 52 pF VF = 0, f = 1 MHz
Thermal Resistance Rθ
Luminous Efficacy
Notes:
1. θ1/2 is the off-axis angle where the luminous intensity is half the on-axis value.
2. The dominant wavelength, λd, is derived from the CIE Chromaticity Diagram and represents the color of the device.
3. The radiant intensity, Ie, in watts per steradian, may be found from the equation Ie = Iv/ ηv, where Iv is the luminous intensity in
candelas and ηv is luminous efficacy in lumens/watt.
4. Refer to Application Note 1061 for information comparing high performance green with emerald green light output degradation.
[3]
J-pin
η
v
120 °C/W Junction-to-Cathode
680 lm/W
-t/τ
s
1-209

1.0
EMERALD GREEN
HIGH
PERFORMANCE
GREEN
0.5
YELLOW
RELATIVE INTENSITY
0
500 550 600 650 700 750
ORANGE
WAVELENGTH – nm
DH AlGaAs RED
HIGH EFFICIENCY RED
T = 25° C
A
Figure 1. Relative Intensity vs. Wavelength.
HER, ORANGE, YELLOW,
HIGH PERFORMANCE GREEN
DH AS AlGaAs RED
300
280
260
240
220
200
180
160
140
120
100
80
60
F
I – FORWARD CURRENT – mA
40
20
0
0 0.5 1.0 1.5 2.0 2.5 3.0
V – FORWARD VOLTAGE – V
F
AND EMERALD GREEN
90
80
70
60
50
40
30
20
F
I – FORWARD CURRENT – mA
10
0
EMERALD GREEN
HIGH
EFFICIENCY
RED, ORANGE
1.0
0.5
0
V – FORWARD VOLTAGE – V
F
GREEN
YELLOW
2.0 3.0 4.0
1.5 2.5 3.5
Figure 2. Forward Current vs. Forward Voltage.
DH AS AlGaAs RED
3.0
2.5
2.0
1.5
1.0
(NORMALIZED AT 10 mA)
0.5
RELATIVE LUMINOUS INTENSITY
0.0
0 5 10 15 20 25 30
I – DC FORWARD CURRENT – mA
F
Figure 3. Relative Luminous Intensity vs. Forward Current.
1-210
HER, ORANGE, YELLOW,
HIGH PERFORMANCE GREEN
AND EMERALD GREEN
4.0
3.0
2.0
1.0
(NORMALIZED AT 10mA)
RELATIVE LUMINOUS INTENSITY
0.0
0 5 10 15 20 25 30
I – DC FORWARD CURRENT – mA
EMERALD GREEN
YELLOW
F
GREEN
HIGH
EFFICIENCY
RED, ORANGE

HER, ORANGE, YELLOW,
HIGH PERFORMANCE GREEN
AND EMERALD GREEN
1.5
YELLOW
1.4
1.3
1.2
1.1
1.0
0.9
0.8
0.7
0.6
0.5
0.4
– RELATIVE EFFICIENCY
v
(NORMALIZED AT 10 mA)
0.3
η
0.2
0.1
0
HIGH EFFICIENCY
RED, ORANGE
0
10 50
I
– PEAK FORWARD CURRENT – mA
PEAK
Figure 4. Relative Efficiency (Luminous Intensity per Unit Current) vs. Peak Current.
GREEN
EMERALD GREEN
9020 60
30 70
8040
HER, ORANGE, YELLOW,
HIGH PERFORMANCE GREEN
AND EMERALD GREEN
Figure 5. Maximum Tolerable Peak Current vs. Pulse Duration (IDC MAX per MAX Ratings).
Figure 6. Relative Intensity vs. Angular Displacement.
1-211
 Loading...