

Page 1

HP Code Advisor C.02.20 User Guide
HP-UX 11i on HP Integrity and HP 9000 Systems
HP Part Number: 5900-1864
Published: July 2011
Edition: 2
Page 2

© Copyright 2011 Hewlett-Packard Development Company L.P.
Confidential computer software. Valid license from HP required for possession, use or copying. Consistent with FAR 12.211 and 12.212, Commercial
Computer Software, Computer Software Documentation, and Technical Data for Commercial Items are licensed to the U.S. Government under
vendor's standard commercial license. The information contained herein is subject to change without notice. The only warranties for HP products
and services are set forth in the express warranty statements accompanying such products and services. Nothing herein should be construed as
constituting an additional warranty. HP shall not be liable for technical or editorial errors or omissions contained herein. UNIX is a registered
trademark of The Open Group.
Itanium® is a trademark of Intel Corporation in the U.S. and other countries.
Page 3

Contents
About this document......................................................................................5
Intended audience....................................................................................................................5
Document conventions and symbols............................................................................................5
Related information...................................................................................................................5
HP encourages your comments...................................................................................................6
1 Introduction...............................................................................................7
1.1 Cadvise user interface..........................................................................................................7
1.2 Features.............................................................................................................................7
1.2.1 Advanced static code analysis.......................................................................................8
1.2.2 Defect detection..........................................................................................................8
1.2.3 Security vulnerability checks..........................................................................................8
1.2.4 Porting and migration...................................................................................................8
1.2.5 Detection of pre-defined or user-defined coding guideline violation.....................................8
1.2.6 Easy to integrate and use..............................................................................................8
1.2.7 Supported compilers....................................................................................................9
2 Using Cadvise.........................................................................................10
2.1 Getting started..................................................................................................................10
2.1.1 Supported platforms....................................................................................................10
2.1.2 Installing Cadvise.......................................................................................................10
2.2 Steps in using cadvise.......................................................................................................10
2.3 Invoking Cadvise..............................................................................................................11
2.4 Using Cadvise as a wrapper around Compiler or Linker.........................................................12
2.5 Integrating Cadvise with the makefiles and build process.......................................................12
2.6 Enabling different categories of diagnostic messages.............................................................13
2.7 Generating code complexity metrics....................................................................................13
2.8 Detecting violation of pre-defined or user-defined coding guidelines........................................17
3 Using the Program Database (PDB).............................................................19
3.1 PDB options table..............................................................................................................20
3.2 Specifying the PDB location...............................................................................................20
3.3 Deleting PDB....................................................................................................................20
3.4 Disabling locks in PDB operations.......................................................................................20
3.5 Removing object file information from the PDB......................................................................20
3.6 Creating a PDB snapshot at a specified location...................................................................21
3.7 Displaying PDB version......................................................................................................21
4 Using cross-file analysis.............................................................................22
5 Configuring diagnostic messages...............................................................25
5.1 Diagnostic configuration options table..................................................................................25
5.2 Suppressing warnings selectively.........................................................................................25
5.3 Enabling warnings selectively.............................................................................................25
5.4 Interpreting selective warnings as errors...............................................................................26
5.5 Disabling warnings in a macro...........................................................................................26
5.6 Managing warnings in a source file....................................................................................26
6 Generating reports...................................................................................27
6.1 Report generation options table...........................................................................................27
6.2 Generating summary reports..............................................................................................28
6.3 Generating file summary report..........................................................................................28
6.4 Generating detailed report................................................................................................28
6.5 Generating HTML report....................................................................................................29
Contents 3
Page 4

6.6 Generating XML report......................................................................................................30
6.7 Printing diagnostics with specific diagnostic numbers.............................................................30
6.8 Generating reports based on severity..................................................................................31
6.9 Suppressing diagnostics for specific files..............................................................................31
6.10 Reporting diagnostics from specific files..............................................................................32
6.11 Reporting program complexity metrics................................................................................32
6.12 Generating report for a module.........................................................................................33
6.13 Suppressing report header................................................................................................34
6.14 Modifying the default severity level of a diagnostic...............................................................34
6.15 Generating PDB comparison report....................................................................................34
6.15.1 Generating summary diff report..................................................................................35
6.15.2 Generating detailed diff report..................................................................................35
6.15.2.1 Using -approot option for detailed diff report........................................................37
6.16 Report options file............................................................................................................38
6.17 Generate report for migration related warnings...................................................................39
6.18 Generating consolidated report from multiple PDBs..............................................................39
6.19 Generating PDB diffs with multiple PDBs.............................................................................40
6.20 Recommended process for analyzing the diagnostic messages.............................................40
6.21 Report options interoperability..........................................................................................40
7 Miscellaneous driver options......................................................................42
8 Categories of diagnostics with examples.....................................................45
8.1 Categories of diagnostics table...........................................................................................45
8.2 Detecting generic programming errors.................................................................................45
8.3 Detecting 32-bit to 64-bit migraton issues.............................................................................51
8.4 Detecting endianness migration issues.................................................................................51
8.5 Detecting potential security vulnerabilities.............................................................................52
8.6 Detecting multi-threaded programming issues.......................................................................53
8.7 Detecting potential performance improvement opportunities...................................................54
9 Fixing the warnings by source change.........................................................56
10 Incompatibilities on PA-RISC based systems................................................57
Index.........................................................................................................58
4 Contents
Page 5
About this document
This document discusses the invocation and usage of HP Code Advisor.
Intended audience
This document is intended for programmers who want to detect the potential errors or warnings in
C, C++ applications by using HP Code Advisor.
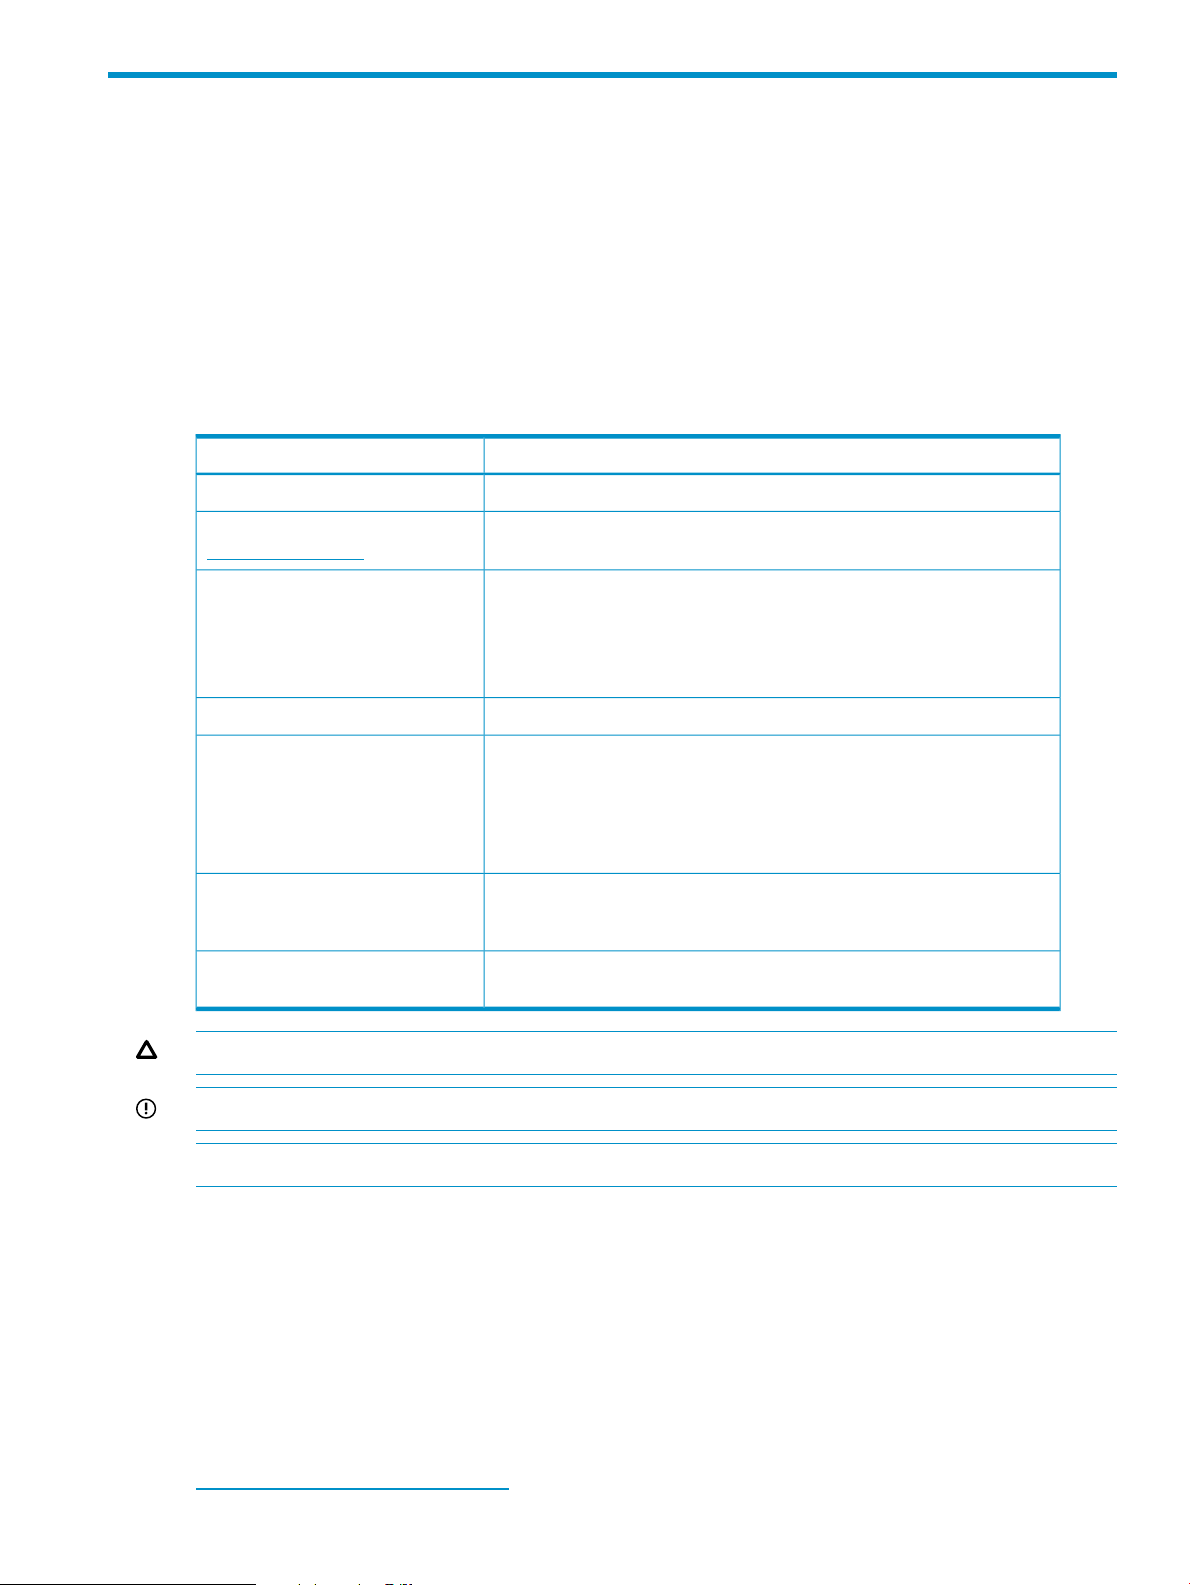
Document conventions and symbols
Table 1 (page 5) lists the conventions and symbols used in this white paper.
Table 1 Document conventions
ElementConvention
Cross-reference links and email addressesMedium blue text:
Website addressesMedium blue, underlined text
(http://www.hp.com)
Bold font
Monospace font
Monospace, italic font
Monospace, bold font
• Key names
• Text typed into a GUI element, such as into a box
• GUI elements that are clicked or selected, such as menu and list items,
buttons, and check boxes
Text emphasisItalic font
• File and directory names
• System output
• Code
• Text typed at the command line
• Code variables
• Command-line variables
Emphasis of file and directory names, system output, code, and text typed
at the command line
CAUTION: Indicates that failure to follow directions can result in damage to equipment or data.
IMPORTANT: Provides clarifying information or specific instructions.
NOTE: Provides additional information.
Related information
The following documents provide additional information about HP Code Advisor:
• HP Code Advisor Release Notes
• HP Code Advisor Diagnostics Reference Guide
• Using HP Code Advisor in Application Builds: [HP Code Advisor] White Paper
• HP C/aC++ Features to Improve Developer Productivity - Whitepaper
For additional information, see the HP Code Advisor web page:
http://www.hp.com/go/cadvise
Intended audience 5
Page 6

HP encourages your comments
HP encourages your comments concerning this document. We are committed to providing
documentation that meets your needs. Send any errors found, suggestions for improvement, or
compliments to:
cadvise-help@lists.hp.com
6
Page 7
1 Introduction
HP Code Advisor (cadvise) is a static analysis tool for C and C++ programs. Cadvise reports
various programming errors in the source code. This tool enables programmers to identify potential
coding errors, porting issues, and security vulnerabilities. Cadvise leverages the advanced analysis
capabilities of HP C and HP aC++ compilers available on the HP Integrity systems.
This chapter addresses the following topics:
• “Cadvise user interface” (page 7)
• “Features” (page 7)
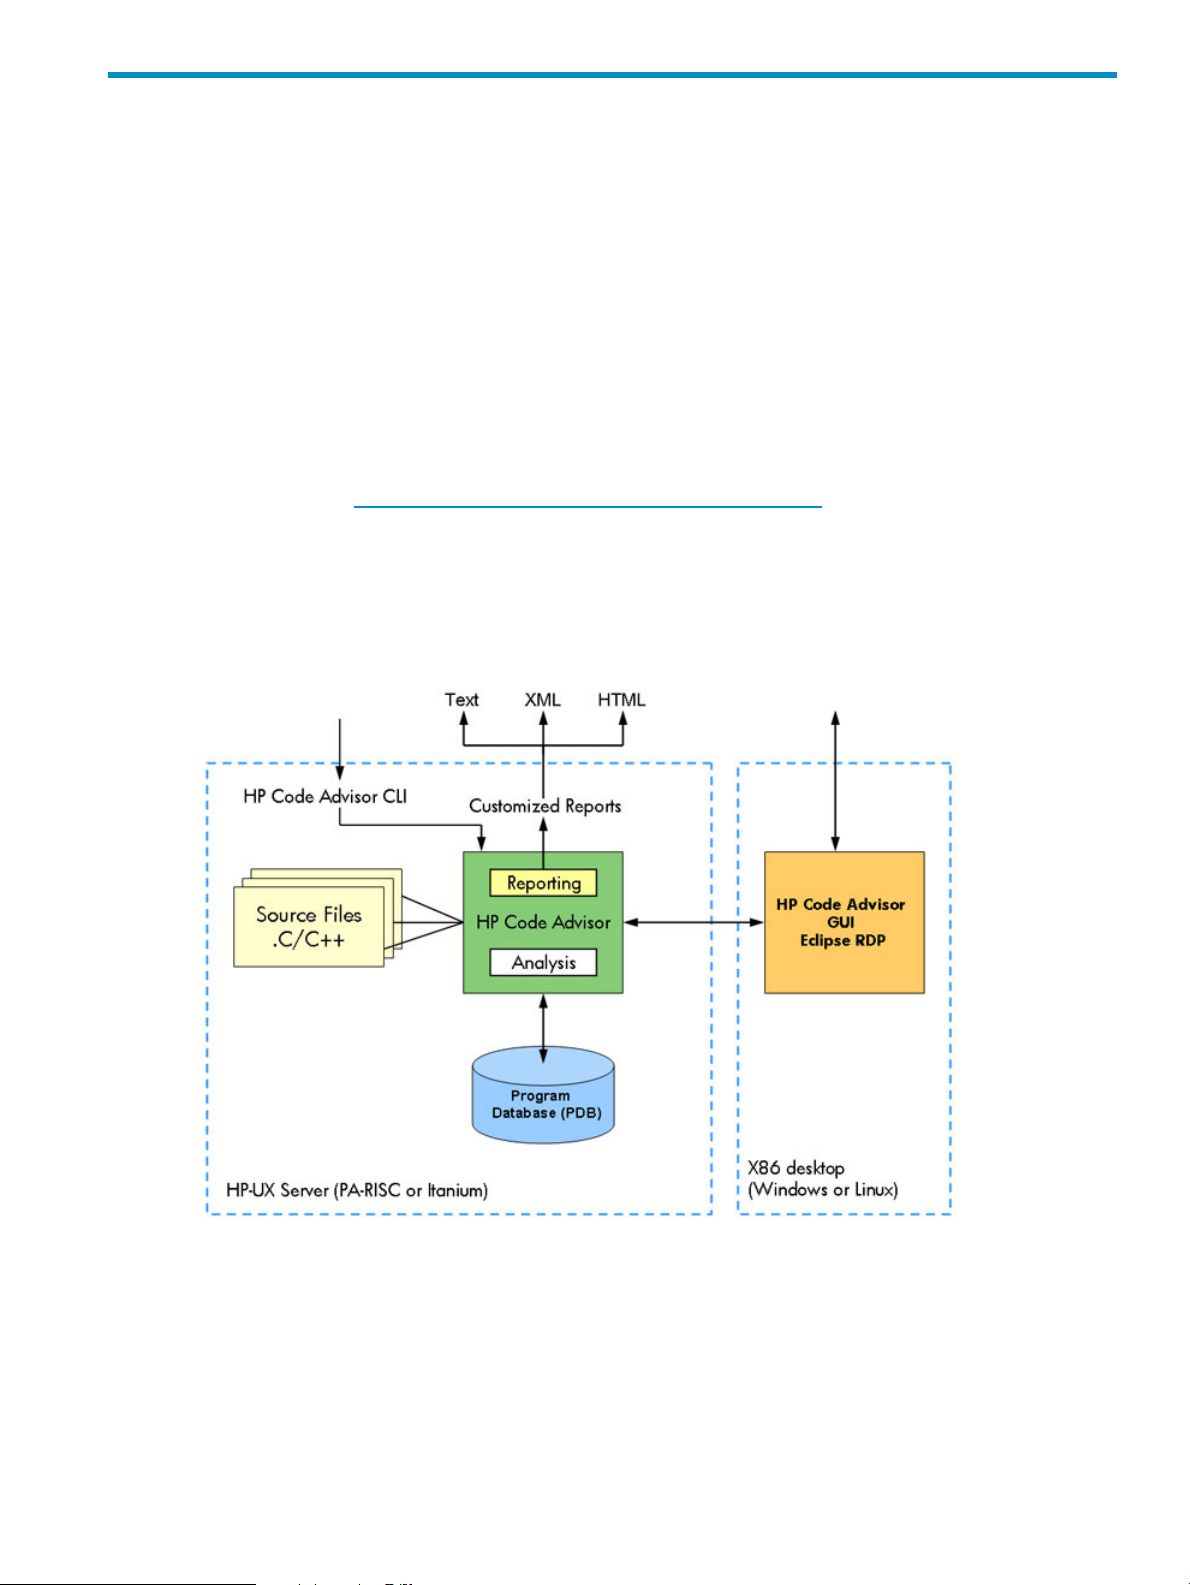
1.1 Cadvise user interface
You can use cadvise through the CLI. Also, you can use the HP Code Advisior GUI, which is part
of the Eclipse Remote Development Plugin run remotely on MS-Windows x86 platforms. For more
information, see http://www.hp.com/go/eclipse-remotedevplugin.
Cadvise takes C or C++source files as inputs for finding potential errors, security violations, and
so on and then stores this information in a Program Database (PDB). The reporting utility helps you
generate reports from the PDB in various formats, such as Text, XML, and HTML.
Figure 1 shows the HP Code Advisor components.
Figure 1 Cadvise Components (User Interfaces)
1.2 Features
This section discusses the following major features and benefits of cadvise:
• “Advanced static code analysis” (page 8)
• “Defect detection” (page 8)
• “Security vulnerability checks” (page 8)
• “Porting and migration” (page 8)
1.1 Cadvise user interface 7
Page 8

• “Detection of pre-defined or user-defined coding guideline violation” (page 8)
• “Easy to integrate and use” (page 8)
1.2.1 Advanced static code analysis
Cadvise is a powerful static code analysis tool that automatically diagnoses various issues in a
source program. It improves developer productivity by finding defects at code development time,
and leads to more robust and secure software because of fewer escaped defects.
Cadvise leverages advanced cross-file analysis technology from HP compilers. It stores the diagnosed
information in a program database. With the built-in knowledge of system APIs, cadvise looks
deep into the code and provides helpful warnings with fewer false positives.
1.2.2 Defect detection
Cadvise detects a wide range of coding errors and potential problems such as memory leaks, used
after free, double free, array/buffer out of bounds access, illegal pointer access, uninitialized
variables, unused variables, format string checks, suspicious conversion and casts, out of range
operations, C++ coding style warnings, and so on.
1.2.3 Security vulnerability checks
Security flaws are not only very costly to fix, they can lead to a bad reputation and potential loss
of customers. Cadvise detects security vulnerabilities in the source code such as buffer overflows,
use of unsafe APIs, use of unsafe file path, unsafe data length argument, unsafe loop exit condition,
unsafe use of tainted data, and so on.
1.2.4 Porting and migration
The cadvise also helps you to identify the potential problems in converting applications from 32-bit
to 64-bit. The porting help is also available in 32-bit mode. This enables you to evaluate the porting
effort before the actual porting begins.
While porting from Linux or Windows? to HP-UX you might encounter problems converting from
little-endian to big-endian. cadvise identifies instances where different endianness might produce
different results. These instances are very difficult to find manually.
Further, migrating your applications from PA-RISC to HP Integrity systems is much easier with the
help of cadvise, which helps you identify the differences between the two compilers and begin
porting the code to HP Integrity systems without leaving the familiar PA-RISC environment.
1.2.5 Detection of pre-defined or user-defined coding guideline violation
Cadvise has a built-in coding guidelines checker which diagnoses violations to the coding guidelines
and emits appropriate diagnostic messages. You can modify the default set of rules or write your
own set of rules to enforce coding guidelines. Cadvise has the appropriate API header files and
a set of sample files along with the corresponding Makefile to rebuild the rules library.
1.2.6 Easy to integrate and use
Cadvise is available for HP-UX developers on both HP Integrity and PA-RISC systems as part of C
and C++ compiler bundles or as a direct download. The default installation location is
/opt/cadvise. Cadvise can be seamlessly integrated with the build process and makefiles. The
reporting tool, cadvise report helps you to filter the important warnings without getting lost in tons
of trivial warnings.
For example, to use cadvise for a single file, you can simply use the following command:
$ cadvise cc -c hello.c
You can also specify the program database and other options at the command line, as in the
following example:
8 Introduction
Page 9

$ cadvise -pdb ./mypdb +wlint aCC hello.cpp
1.2.7 Supported compilers
Cadvise is shipped and supported with the HP aC++ and HP C compilers on the latest HP Integrity
and PA-RISC HP-UX platforms. Cadvise can also be used with GNU gcc and g++ compilers,
however it does not support all gcc/g++ built-ins and extensions. Cadvise will emit a parsing error
if it comes across an unsupported built-in or extension. If you need support for a specific built-in
or extension please send an email to cadvise-help@lists.hp.com.
1.2 Features 9
Page 10

2 Using Cadvise
This chapter addresses the following topics:
• “Getting started” (page 10)
• “Steps in using cadvise” (page 10)
• “Invoking Cadvise” (page 11)
• “Using Cadvise as a wrapper around Compiler or Linker” (page 12)
• “Integrating Cadvise with the makefiles and build process” (page 12)
• “Enabling different categories of diagnostic messages” (page 13)
• “Generating code complexity metrics” (page 13)
• “Detecting violation of pre-defined or user-defined coding guidelines” (page 17)
2.1 Getting started
This section addresses the following topics:
• “Supported platforms” (page 10)
• “Installing Cadvise” (page 10)
2.1.1 Supported platforms
You can install and use cadvise on the following platforms:
• HP-UX 11i v3 (B.11.31) PA-RISC (HP 9000) and HP Integrity systems
• HP-UX 11i v2 (B.11.23) PA-RISC (HP 9000) and HP Integrity systems
• HP-UX 11i v1 (B.11.11) PA-RISC (HP 9000) systems
2.1.2 Installing Cadvise
To install cadvise, complete the following steps:
1. Download cadvise for your platform through the website http://www.hp.com/go/cadvise.
2. Install cadvise using the swinstall command. For more information on using the swinstall
command, see Software Distributor Administration Guide.
Cadvise is installed in the /opt/cadvise/bin/cadvise directory by default.
2.2 Steps in using cadvise
Cadvise is part of an iterative process of building, analyzing, reporting, and removing the potential
coding errors in an application, as shown in Figure 2.
10 Using Cadvise
Page 11
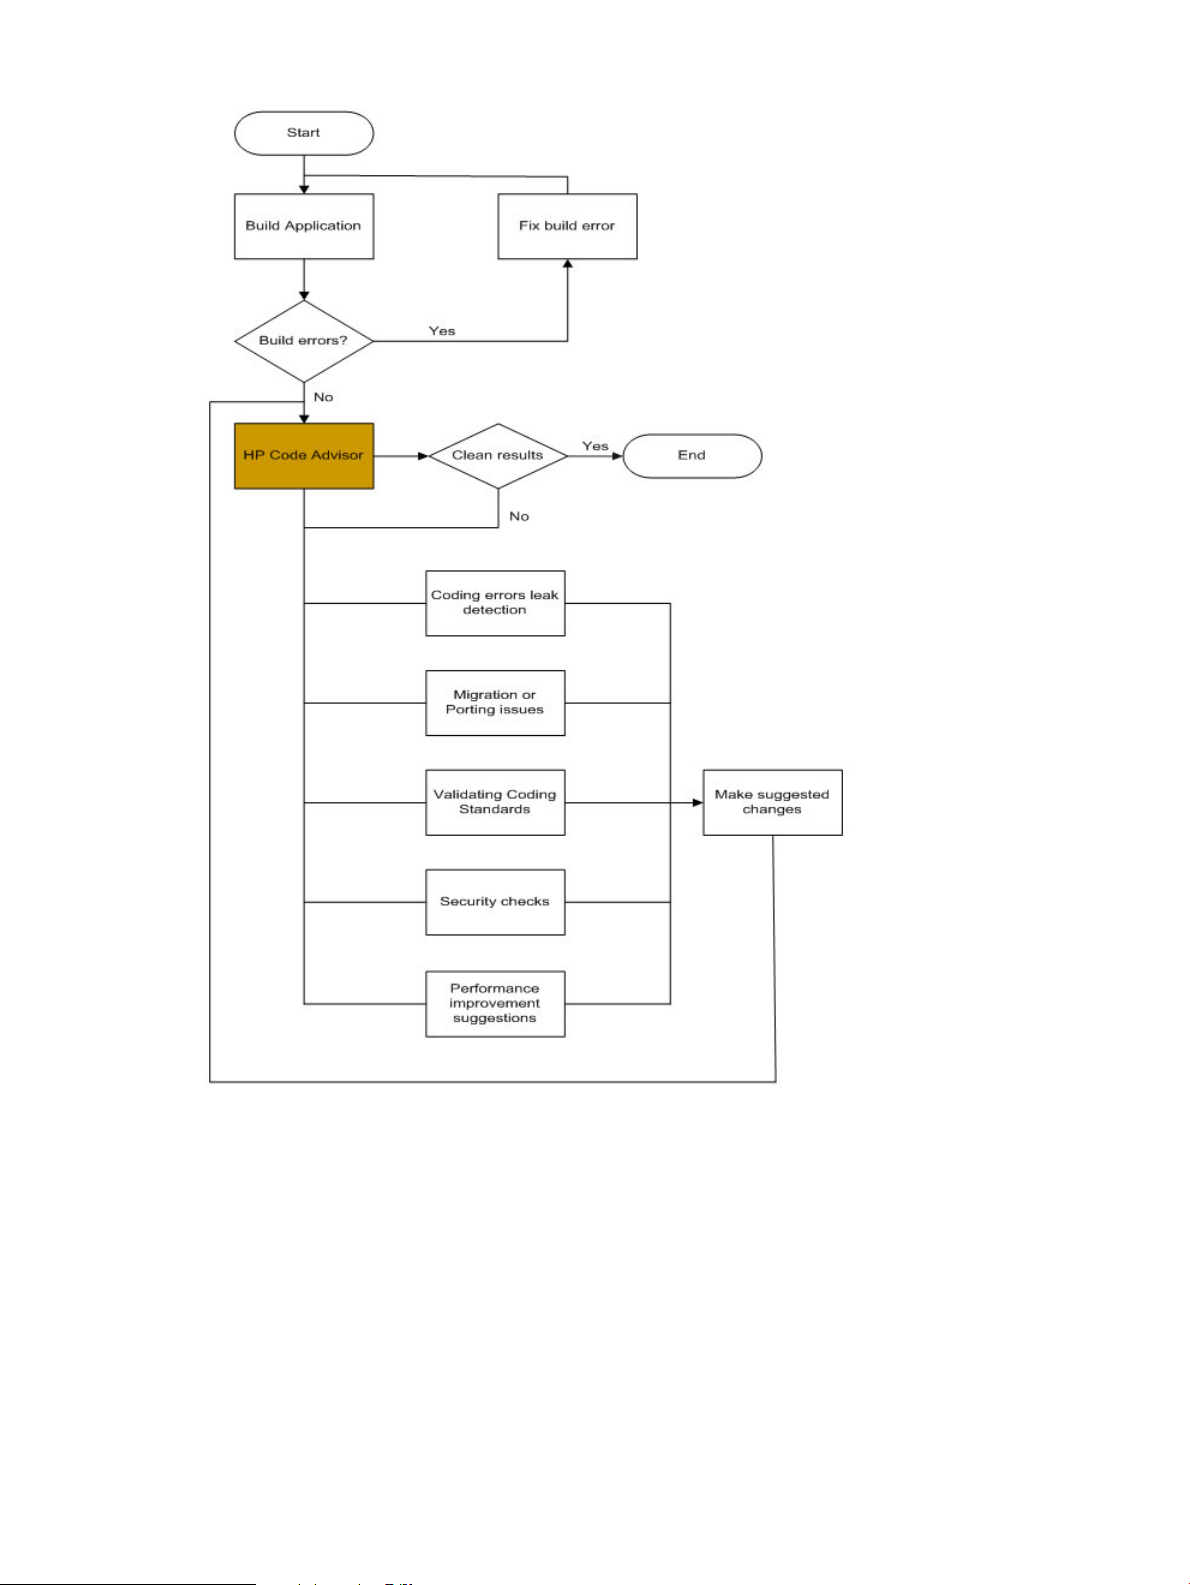
Figure 2 Steps in Using Cadvise
To use cadvise, you perform the following steps:
1. Build the application with the set of compiler or linker options. Ensure that the application
builds successfully.
2. Run cadvise with desired options and create the PDB.
3. Use the reporting utility for generated reports from the PDB in various formats.
4. Make suggested changes based on generated reports. The suggested changes are for defect
prevention, memory leaks, secutity issues, coding guideline violation, and so on.
5. Re-run cadvise on modified sources and generate new reports. Continue making source
changes as long as you receive meaningful data.
2.3 Invoking Cadvise
To invoke cadvise, enter the following command at the HP-UX prompt:
/opt/cadvise/bin/cadvise
2.3 Invoking Cadvise 11
Page 12

The cadvise command has the following modes of operation:
• Analysis mode
Used to analyze and create the Program Database (PDB). To invoke cadvise in this mode,
enter the cadvise command in the following format:
cadvise [cadvise-options] compile-cmd [compile-options]
• Report mode
Used to create reports. To invoke cadvise in this mode, enter the cadvise command in the
following format:
cadvise report [report-options] [-pdb <pdb-name> | logfile]
For information on PDB, see Using the Program Database (PDB) (page 19).
The cadvise command is used as a wrapper around the compiler or linker. The cadvise
report option is used to generate reports.
2.4 Using Cadvise as a wrapper around Compiler or Linker
Cadvise is used with the HP C and HP aC++ compilers; GNU gcc and g++ compilers or HP-UX
linker. The cadvise command is used as a wrapper around the compile and link command-line
options (hereafter referred to as build line). The cadvise command and options are prefixed to
the build line as command line arguments.
For example
The following command lines show how to invoke cadvise:
Regular command line: $ cc -c abc.c def.c
Cadvise command line: $ cadvise -pdb mypdb +wlint cc -c abc.c def.c
$ cadvise -pdb mypdb +wlint cc -c abc.c def.c
$ cadvise -pdb mypdb +wlint ld -r abc.o def.o -o abcdef.o
The cadvise command first executes the user's regular build line, and then analyzes the source
code. Cadvise also analyzes the build line and automatically determines the include paths, defines,
and language dialect needed for the source code analysis. The -nobuild option allows you to
skip the regular build process, and perform only the source code analysis.
The result of the cadvise analysis can be stored in a program database using the -pdb option. In
this case, the PDB also stores the summary information used for cross-file analysis. For more
information on PDB, see Using the Program Database (PDB) (page 19).
2.5 Integrating Cadvise with the makefiles and build process
Cadvise can be easily integrated with the makefiles and the build scripts. If a makefile variable is
used to define the C and C++ compilers, you can redefine it to include the cadvise invocation.
Example 1 Updating the makefile to integrate cadvise
See the following makefile content:
CADVISE_OPTS= -pdb mypdb +wlint
CADVISE= /opt/cadvise/bin/cadvise
CC= $(CADVISE) $(CADVISE_OPTS) /opt/ansic/bin/cc
CXX= $(CADVISE) $(CADVISE_OPTS) /opt/aCC/bin/aCC
You may also define a wrapper script instead of the standard compiler commands. For example,
see the following sample wrapper script:
12 Using Cadvise
Page 13

Example 2 Sample wrapper script
$ cat cadvise_cc
#!/bin/sh
#
# wrapper script to invoke cadvise
#
exec /opt/cadvise/bin/cadvise -pdb mypdb +wlint /opt/ansic/bin/cc "$@"
Now cadvise_cc can be used instead of cc in the build line to invoke cadvise analysis in
addition to the compilation process.
NOTE: You need not create separate dependency rules for cadvise in the makefiles. Cadvise
must be invoked only when the existing dependency rules in the makefile lead to a compile.
The addition of cadvise analysis to the build process increases the total build time. You can either
invoke cadvise automatically whenever compiled, or launch cadvise as a separate build process
by invoking it explicitly. For large projects where a lot of cross-file analysis is required, it is better
to separate the analysis process. You can use the -crossfile option to manage the cross-file
analysis.
2.6 Enabling different categories of diagnostic messages
By default, a limited number of diagnostic messages are enabled in cadvise.
Additionally, the following options can be used to enable various types of diagnostic messages.
+w
“+wlint” (page 45)
“+w64bit ” (page 51)
” (page 54)
Enables all the warnings about potentially questionable constructs in the
compiler.
Enables all the compile time checks.+wall
Detects code fragments which are endian dependent.“+wendian” (page 51)
Provides compile-time diagnostics which detect potential errors in the source
code.
Detects multi-threaded programming issues.“+wlock” (page 53)
Enables compile time diagnostic messages for potential security vulnerabilities.“+wsecurity[=1|2|3|4]” (page 52)
Enables warnings that help detection of potential problems in converting 32-bit
applications to 64-bit.
Generates performance advisory diagnostics.“+wperfadvice[=1|2|3|4]
The best method is to use +wall to enable all possible diagnostic messages. Then, use the cadvise
report -pdb <pdbname> -summary command to see a quick summary of the various
diagnostic messages generated by cadvise, sorted by severity. For more information, see Generating
Reports (page 27).
2.7 Generating code complexity metrics
Cadvise can generate code complexity metrics to gauge the complexity of the code being developed
or migrated. The +metrics option generates program complexity metrics.
Syntax:
$cadvise +metrics[=ict][:out=pdb]
OR
$cadvise +metrics[=ict][:out=[+]<filename>]
Following command shows the examples for generating code complexity metrics.
2.6 Enabling different categories of diagnostic messages 13
Page 14

Example 3 Generating code complexity metrics
To store the code complexity metrics in the PDB with Indirect Call Targets, use the following
command.
$cadvise +metrics=ict -pdb test.pdb aCC -c example.c
To get the metrics in the my.metrics file, use the following command.
$cadvise +metrics :out=my.metrics aCC -c example.c
To store the metrics in the my.metrics file without Indirect Call Targets, use the following command.
$cadvise +metrics :out=pdb -pdb test.pdb aCC -c example.c
The program complexity metrics are stored in a specified output location. The output location can
either be specified as the pdb (out=pdb) or a file <filename>(out=<filename>). Inserting a
+ before the <filename> appends the metrics to the file <filename>. If the output location is
not specified, then these metrics are written either to a PDB, if a PDB is present, or to the file
<objfile>.metrics.
Cadvise emits the following metrics for determining program complexity:
• For a source file
Number of header files included◦
◦ Total number of lines in the source file
◦ Number of comment lines
◦ Number of blank lines
◦ Number of lines of code
◦ Number of mixed lines (lines have both code and comments)
◦ Number of global variables
◦ Number of static variables
◦ Total number of functions defined
◦ Number of externally visible functions defined
◦ Number of global Thread Local Storage (TLS) Variables
◦ Number of static Thread Local Storage (TLS) Variables
◦ Number of global mutexes
◦ Number of static mutexes
◦ Program complexity metrics for each of the functions
• For a function
Function Signature◦
◦ Total number of lines
◦ Number of comment lines
◦ Number of blank lines
◦ Number of lines of code
◦ Number of mixed lines
◦ Number of macros used
◦ Number of local variables defined
◦ Number of static variables defined
14 Using Cadvise
Page 15

◦ Number of if statements
◦ Number of return statements
◦ Number of loop nests
◦ Nesting level of each loop nest
◦ Number of indirect calls
◦ Number of direct calls
◦ Targets of direct calls
◦ Cyclomatic complexity
◦ Cyclomatic complexity without switch
◦ Cyclomatic complexity without exception handling
◦ Cyclomatic complexity without switch and exception handling
◦ Number of Thread Local Storage (TLS) variables
◦ Number of mutexes
◦ Number of lock calls
◦ Number of unlock calls
For each indirect call site, cadvise emits the list of possible call targets.
• Cyclomatic Complexity
Cyclomatic complexity metric, developed by Thomas McCabe in 1976 ,measures the number
of linearly-independent paths through a program module. It is an indicator for understandability
and testability of a module. A lower value indicates more understandable and testable code.
The +metrics option emits cyclomatic complexity by default.
• Indirect Call Targets
This refers to the list of functions that can be called at an indirect call site. Calculation of this
metric leads to an increase in analysis time and so the +metrics option does not emit Indirect
Call Targets by default. You need to specify ict as a suboption to the +metrics option for
emission of indirect call targets. This causes emission of Indirect Call Targets in addition to all
other default metrics.
The following example shows the code complexity metrics.
2.7 Generating code complexity metrics 15
Page 16

Example 4 Code complexity metrics
$ cat /tmp/example.c
#include <stdio.h>
#include <pthread.h>
#define INDEX 500
pthread_mutex_t mutex;
int mata[INDEX][INDEX], matb[INDEX][INDEX], matres[INDEX][INDEX] ;
void print_output();
void matrix_multiply() {
int i, j, k ;
/* Matrix-Matrix multiply */
for (i = 0 ; i < INDEX ; i++) {
for (k = 0 ; k < INDEX ; k++) {
for (j = 0 ; j < INDEX ; j++) {
matres[i][j] =
matres[i][j] +
mata[i][k] * matb[k][j] ;
}
}
}
print_output(); /* print the result of multiplication */
return;
}
$ cadvise +metrics aCC -c /tmp/example.c
$ cat example.metrics
=======================================================================
Begin program complexity data for /tmp/example.c
=======================================================================
File level program complexity data :
------------------------------------
Include Files: 2
Total Lines: 23
Blank Lines: 3
Comment Lines: 1
Lines Of Code: 19
Mixed Lines: 1
No. of Globals: 4
No. of Statics: 0
No. of Functions: 1
No. of ExternFunctions: 1
No. of Global Thread Local Variables: 0
No. of Static Thread Local Variables: 0
No. of Global Mutexes: 1
No. of Static Mutexes: 0
Function level program complexity data :
----------------------------------------
Begin Function: matrix_multiply
Signature: void matrix_multiply()
Total Lines: 15
Blank Lines: 1
Comment Lines: 1
Lines of Code: 13
Mixed Lines: 1
16 Using Cadvise
Page 17

No. of Macros Used: 3
No. of Locals: 3
No. of Statics: 0
No. of Ifs: 0
No. of Returns: 1
No. of Loops: 1
Loop Nesting Levels:
3
No. of Indirect Calls: 0
No. of Direct Calls: 1
Functions called:
print_output()
Cyclomatic Complexity: 4
Cyclomatic complexity without switches: 4
Cyclomatic complexity without eh: 4
Cyclomatic complexity without switches and eh: 4
No. of Thread Local Variables: 0
No. of Mutexes: 0
No. of Lock Calls: 0
No. of Unlock Calls: 0
End Function: matrix_multiply
==================================================================
End program complexity data for /tmp/example.c
==================================================================
NOTE: The +metrics option can be used with the cadvise reporting option for reporting program
complexity metrics from the PDB.
2.8 Detecting violation of pre-defined or user-defined coding guidelines
The coding guidelines checker diagnoses violations to the coding guidelines and emits appropriate
diagnostic messages.
Syntax:
+wcodeguide[=<rules-library>]
Where:
rules-library denotes the library that defines the coding guideline rules.
You can modify the default set of rules or write your own set of rules to enforce coding guidelines.
Cadvise has the appropriate API header files and a set of sample files along with the corresponding
makefile to rebuild the rules library.
Table 2 lists the source structure provided for (re)building the rules library.
2.8 Detecting violation of pre-defined or user-defined coding guidelines 17
Page 18

Table 2 Source structure in the rules library
include/
lib/
src/
• HPCodeGuideConstructs.h
Contains the APIs required for (re)writing the rules to enforce coding guidelines.
• HPCodeGuideDiagnosticTags.h
Contains the various diagnostic tags that you can use to emit the diagnostics
from the rules library.
• libcodeguide.a
This is provided to fill in the implementation stubs for recompilation of the rules'
library, and must be linked in while compiling the rules' library.
• librules.s[lo]
This is the default rules' library that is available with cadvise.
• HPCodeGuideRules.C
The file where all rules are implemented. You can modify this file to incorporate
more rules and/or modify the existing ones.
• HPCodeGuideRulesDriver.C
The driver from where the rules are invoked on the various program constructs.
• Makefile
The default makefile for rebuilding the rules' library from the above sources.
The sample rules towards naming convention that are available with the current release are as
follows:
1. Functions that returns a bool must start with is.
2. Names of abstract classes should begin with Interface.
3. Class names should start with a capital letter.
4. Names of global variables should start with a capital letter.
5. Names of local variables should start with a small letter.
An example of writing a rule to enforce the naming convention of private data members being
suffixed with an '_' is as follows:
Example 5 Writing a rule to enforce naming convention
void Field::checkNamingConventions() {
//Private data members of class should end with "_"
if(name() && isPrivate()) {
char ch = *name() + strlen(name());
if(ch != '_')
warning("Private data member \"%s\" not suffixed with \"_\"", 2000053, name());
}
}
NOTE: Cadvise reports do not currently have support for Coding Guideline diagnostics. Use the
-tee option to view these messages.
18 Using Cadvise
Page 19

3 Using the Program Database (PDB)
The PDB is a repository of errors, warnings, diagnostic messages, and metrics generated while
analyzing the application. The HP Code Advisor uses the PDB also to store the information required
for the analysis. If you want to perform cross-file analysis of the application, you need to use a
PDB. During the compilation phase of your application, the HP Code Advisor stores an intermediate
representation of the application in the PDB and uses it during the application link phase to perform
the cross-file analysis. You can use the reporting tool to see different kinds of reports from the
information stored in the PDB without having to repeat the analysis phase. A single PDB can be
used to store the analysis information of multiple applications. In such cases, the cross-file analysis
for each application is performed when cadvise is invoked with the link command for each
application.
NOTE: This does not work with the -crossfile=pdb option. Instead, the analysis logs are
combined into a single report when cadvise report is used on such a PDB.
The size of the PDB is proportional to the total size of the object files created while building the
application. It also depends on the number of errors and the diagnostic messages found during
the analysis of the application. The size of the PDB can be three to four times more than the total
size of the object files. Therefore, ensure that there is enough space in the volume or the ClearCase
VOB where the PDB resides. You can also locate the PDB within a ClearCase VOB. The ClearMake
dependency checking and wink-in mechanisms work with the PDB in the VOB. If the PDB is created
in a View, then it is winked-in by other Views that have the matching configuration spec and build
rules.
NOTE: Due to limitations in ClearCase, cadvise cannot access a PDB located on a clearcase
VOB via a NFS mounted directory from a non-ClearCase machine. If you access the VOB from a
non-ClearCase machine, ensure that the PDB is located on a local file system or use the
-pdb_no_locking option. For more information, see the Problems with NFS locking section in
Administrator's Guide: Rational Clearcase and Rational Clearcase LT.
The internal format of the PDB has been changed in preparation for creating PDBs in other platforms.
This means that this version of cadvise is not compatible with PDBs generated by older versions of
cadvise. As an example, users cannot use this version of cadvise to generate reports on PDBs
generated by previous versions of cadvise. Ensure you remove the older PDBs with
the-pdb_destroy option (cadvise -pdb <location> -pdb_destroy) before you use this
version of cadvise. Alternately, you can use a different location for the PDBs generated with this
newer version of Cadvise. One of the following errors appear if you use Cadvise with an
incompatible PDB:
cannot open PDB collection "<name>" (Error: Incompatible PDB version)
cannot open PDB element "<name>" (Error: Incompatible PDB version)
found problem while traversing PDB (Error: Incompatible PDB version)
NOTE: We try to make changes to the PDB format in a way that preserves forward compatibility
(ie: a PDB generated by an older version of cadvise can be used by a new version of cadvise).
However, it is not guaranteed that all the format changes will be forward compatible. In some
cases we are forced to break such forward compatibility in order to support new features.
The organization and the internal format of the PDB may change from release to release. Hence,
it is not advisable to directly manipulate the content of the PDB. However, the PDB can be safely
copied to different directory by using a recursive copy command (cp –R).
19
Page 20

3.1 PDB options table
The following options help you manage the PDB:
3.2 Specifying the PDB location
The path specified may be relative or absolute, but you must ensure that the whole application
build creates only one PDB. If the build of your application is done across multiple machines, you
must ensure that the path specified is accessible from all the machines involved in creating the
build.
Following is the syntax for changing the location of the PDB:
$cadvise <location> -pdb <pdbname>
Following is an example to specify the location of the PDB:
Enables you to specify the location (path) of the PDB.“-pdb location” (page 20)
Removes the PDB specified with the –pdb option.“-pdb_destroy” (page 20)
Allows you to not to use locks in PDB operations.“-pdb_no_locking” (page 20)
Removes information related to the specified object files from the PDB.“-remove” (page 20)
Creates a snapshot of the PDB at the specified location (path).“-snapshot location” (page 21)
Prints the PDB version and checks for compatibility.“-pdb_version” (page 21)
Example 6 Specifying the PDB Location
$cadvise -pdb testpdb /opt/aCC/bin/aCC 1.c
Where: testpdb is the location of the PDB.
3.3 Deleting PDB
This option enables you to delete the PDB when it is no longer required.
Following is the syntax for deleting PDB:
$cadvise -pdb_destroy -pdb <pdbname>
Following is an example to delete the PDB:
Example 7 Destroying PDB
$cadvise -pdb_destroy -pdb testpdb
Where: testpdb is the location of the pdb, to be deleted.
3.4 Disabling locks in PDB operations
The -pdb_no_locking option ensures that cadvise does not use locks in PDB operations. Cadvise
uses locks implemented with lockf during some PDB operations, by default. If the user machine
does not use lockd, or if there are any name resolution issues between the PDB host and client
machines, the lockf calls do not execute for an indefinite period of time. Use the
-pdb_no_locking option to workaround lockf related-issues in user systems. Locks are important
if the user has to run cadvise analysis and reports simultaneously. If you do not use locks and run
cadvise analysis in parallel with the reports, then there is a potential for incomplete or truncated
reports. See also : manpages on lockf(2); lockd(1M).
3.5 Removing object file information from the PDB
The -remove option removes from the PDB, any information such as logs, internal representation,
and metrics related to the specified object files.
20 Using the Program Database (PDB)
Page 21

Following is the syntax for removing information from the PDB:
$cadvise -pdb <pdbname> -remove:objs/<objectfile name>
Following is an example to remove object file information from the PDB:
Example 8 Removing object file information from the PDB
$cadvise -pdb testpdb /opt/aCC/bin/aCC foo.c -c -o objs/foo.o
$cadvise -pdb testpdb -remove:objs/foo.o
NOTE: For information on how cadvise searches for object files, see Example 15 “Specifying
the location of object files”.
3.6 Creating a PDB snapshot at a specified location
The PDB created at a specified location is significantly smaller in size than the original PDB. A
snapshot PDB can be used only for reporting purposes and not for cross-file analysis. The -pdb
location option must be used to specify the location of the PDB from where you are taking the
snapshot. When the -snapshot option is used, the other cadvise options are ignored.
Following is the syntax for creating a PDB snapshot at a specified location or path:
$cadvise -pdb <pdbname> -snapshot <location>
Following is an example to create a PDB snapshot:
Example 9 Creating a PDB snapshot
$cadvise -pdb testpdb -snapshot snappdb
Where: testpdb is the location of the PDB and snappdb is the location where the snapshot
needs to be created. This location is relative or absolute.
3.7 Displaying PDB version
This option checks the PDB internal format when cadvise is invoked, and prints the PDB version
along with the compatibility status. If the version is not supported, cadvise prints an error message
and exits.
Following is the syntax for displaying the version of the PDB:
$cadvise -pdb <pdbname> -pdb_version
Following are the examples for displaying the version of the PDB:
Example 10 Displaying PDB version
$ cadvise -pdb 2a.pdb -pdb_version
cadvise: PDB version 04.01 (Compatible)
$ cadvise -pdb 2b.pdb -pdb_version
cadvise: PDB version 03.01 (Incompatible)
3.6 Creating a PDB snapshot at a specified location 21
Page 22

4 Using cross-file analysis
Cadvise provides different operating modes for performing cross-file analysis of the application.
The cross-file analysis can be performed along with the regular build of the application, or separated
from the regular build. You can also initiate it either on all the files or only on a selected group of
files or modules. It can also be disabled completely. The default and recommended mode is to
enable cross-file analysis at link time. Cadvise fetches all the recorded information from the PDB
for all the object files specified at the link command line and performs cross-file analysis.
Usage:
-crossfile = option
Table 3 Cross-file analysis options
DescriptionOption
none
auto
defer
pdb
module:<module_name>
list:<file1:file2:.. ..:fileN>
listfile:<file_name>
Disables cross-file analysis. If a PDB location is specified using the –pdb
option, the logs of errors and the diagnostic messages found during the
compile time of the application are stored in the PDB.
Directs the cross-file analysis to be automatically done at the link time of
the application. This is the default mode.
Does not initiate the cross-file analysis at the link time of the application.
When you use this option, a PDB location must be specified using the –pdb
option. During the compile time of the application, logs and intermediate
representation files are stored in the PDB so that the cross-file analysis can
be initiated later with either of the
–crossfile=[pdb|module|list|listfile] options.
Initiates cross-file analysis on all the intermediate representation files stored
in the PDB. When you use this option, a PDB location must be specified
using the –pdb option.
Enables cross-file analysis of object files in a PDB corresponding to a
particular module(shared library or executable). During the build, cadvise
records the list of files that make up the module. So, for cross-file analysis,you
can use the name of the module instead of specifying the list of object files.
Enables cross-file analysis of object files in a PDB corresponding to the listed
object files. File1, File2,..., FileN are object files. For more information, see
.
Enables cross-file analysis of object files in a PDB corresponding to the
object files listed in the specified file. The list of object files in <file_name>
must be separated by space or newline characters. For more information,
see Example 15 (page 24).
The following examples illustrate the equivalent usage of different cross-file options to perform
cross-file analysis:
22 Using cross-file analysis
Page 23

Example 11 Using cross-file analysis automatically during linking
-crossfile=auto
The default cross-file option is -crossfile=auto. The cross-file analysis occurs automatically
when you invoke cadvise during linking.
$cadvise –pdb testpdb cc a.c b.c –c
$cadvise –pdb testpdb cc a.o b.o –o test.exe
Example 12 Delaying cross-file analysis till the specification of crossfile=pdb option
-crossfile=defer and -crossfile=pdb
If -crossfile=defer and -crossfile=pdb are used, cadvise delays the cross-file analysis
till the specification of -crossfile=pdb option.
$cadvise –pdb testpdb cc a.c b.c –c
$cadvise –pdb testpdb –crossfile=defer cc a.o b.o –o test.exe
$cadvise –pdb testpdb –crossfile=pdb
Example 13 Delaying cross-file analysis till the specification of crossfile=module option
-crossfile=defer and -crossfile=module
If -crossfile=defer and -crossfile=module are used, cadvise delays the cross-file analysis
till the specification of -crossfile=module option.
$cadvise –pdb testpdb cc a.c b.c –c
$cadvise –pdb testpdb –crossfile=defer cc a.o b.o –o test.exe
$cadvise –pdb testpdb –crossfile=module:test.exe
Example 14 Delaying cross-file analysis till the specification of crossfile=list option
-crossfile=defer and -crossfile=list
If -crossfile=defer and -crossfile=list are used, cadvise delays the cross-file analysis
till the specification of -crossfile=list option.
$cadvise –pdb testpdb cc a.c b.c –c
$cadvise –pdb testpdb –crossfile=defer cc a.o b.o –o test.exe
$cadvise –pdb testpdb –crossfile=list:a.o:b.o
23
Page 24

NOTE: The combined use of the –crossfile=defer and
–crossfile=[pdb|module|list|listfile] options are useful in the following situations:
• If you want to perform cross-file analysis on a set of object files that is bigger than the set of
object files linked during the application build process, for example, if the application build
creates multiple shared libraries, the default automatic cross-file analysis is done only across
the files specified for each shared-library link command. In such cases, you can also force the
analysis to be done on all the files by deferring the analysis using the -crossfile=defer
option until the whole application is built and then invoking the analysis on all the files in the
PDB, by using the -crossfile=pdb option. Alternatively, you can use -crossfile=list option
to specify object files from a subset of the shared libraries to perform cross-file analysis.
• If you want to perform cross-file analysis on a set of object files that is smaller than the set of
object files linked during the application build process, for example, if you want to perform
cross-file analysis on a few object files, you can compile only those object files, get a PDB
with the intermediate representation and then use the -crossfile=pdb option to perform
cross-file analysis. Alternately, compile the whole application with the -crossfile=defer
option and then use -crossfile=list option to do the cross-file analysis on a subset of
object files.
However, do not use the -crossfile=pdb option if the PDB contains diagnostic information of
multiple applications because HP Code Advisor can misinterpret multiple definitions for the same
symbols.In this scenario it is better to use the -crossfile=list or -crossfile=module option
to perform cross-file analysis on a subset of object files in the PDB.
For the -crossfile=list or -crossfile=listfile options, the location of each object file
specified must be one of the following:
• Location of an existing object file build during the application compilation.
• Location of the object file as it would have been created during the application compilation.
Therefore, an object file does not need to exist (it may have been removed or you may have used
the “-nobuild” option) as long as cadvise and the PDB are used to monitor the compilation that
creates the object file.
Example 15 Specifying the location of object files
cd /tmp
$cadvise -pdb testpdb -crossfile=defer aCC 1.c 2.c 3.c -o objdir/testexec
For cross-file analysis on all the files used to build testexec, run the following commands:
$cadvise -pdb testpdb -crossfile=module:objdir/testexec
Or
$cadvise -pdb testpdb -crossfile=module:/tmp/objdir/testexec
NOTE: To specify the module name as specified with the-o option you must be in the same
directory where the first command was invoked. To invoke cadvise from any other location you
must specify the absolute path of the module. For cross-file analysis on object files 1.o and 2.o,
run the following command:
$cadvise -pdb testpdb -crossfile=list:1.o:2.o
OR
$cadvise -pdb testpdb -crossfile=list:/tmp/1.o:/tmp/2.o
24 Using cross-file analysis
Page 25

5 Configuring diagnostic messages
You may want to limit the cadvise diagnostic messages depending on the need, such as the
following cases:
• Generate all possible messages to ensure that you get the maximum information about potential
problems detected by cadvise.
• Reduce the number of messages so that you are not overwhelmed by the sheer magnitude of
the warnings.
• Eliminate or reduce the number of benign or misleading messages.
Your requirement may vary depending on the size of the application, resources allotted to eliminate
warnings by changing source code, total number of messages generated, new or ported code,
coding standards, and so on. The recommended way is to use options like, +wlint, +w64bit
and +w to enable only the required warnings, and then use the options to disable specific warnings
that are not of interest or that are too arbitrary. Each distinct type of diagnostic message generated
by cadvise has a number associated with it. You can generate separate reports of diagnostics
messages for each of these numbers. This allows you to ignore warnings that you do not want and
focus on those you want.
5.1 Diagnostic configuration options table
The following options and pragmas help you to manage the diagnostics:
Selectively suppresses warnings.“+Warg1[,arg2,...,argn]” (page 25)
Selectively enables warnings.“+Wwarg1[,arg2,..,argn]” (page 25)
Selectively interprets warnings as errors.“+Wearg1[,arg2,..,argn]” (page 26)
Disables warnings in a macro.“+Wmacro:MACRONAME:d1,d2,d3,..dn” (page 26)
5.2 Suppressing warnings selectively
The +Warg1[,arg2,...,argn] option selectively suppresses any specified warning messages.
NOTE: arg1 through argn must be valid warning message numbers.
Following is the syntax for selectively suppressing warnings.
$cadvise +wall -pdb <pdbname> +Warg1[,arg2,...,argn] compile-cmd <filename>
Following is an example for selectively suppressing warnings.
Example 16 Suppressing warnings selectively
$cadvise +wall -pdb testpdb +W600 cc -c foo.c
5.3 Enabling warnings selectively
The +Wwarg1[,arg2,..,argn] option selectively enables generation of cadvise warning
messages that are not enabled by default.
NOTE: arg1 through argn must be valid warning message numbers.
Following is the syntax for selectively enabling warnings.
$cadvise +wall -pdb <pdbname> +Wwarg1[,arg2,...,argn] compile-cmd <filename>
Following is an example for selectively enabling warnings.
5.1 Diagnostic configuration options table 25
Page 26

Example 17 Enabling warnings selectively
$cadvise +wall -pdb testpdb +Ww600 cc -c foo.c
5.4 Interpreting selective warnings as errors
The +Wearg1[,arg2,..,argn] option selectively interprets specified warning messages as
errors. arg1 through argn must be valid warning message numbers. This option allows you to
enforce a policy to disallow specific warnings by forcing an error at compile time.
+Wearg1[,arg2,..,argn]
Following is the syntax for selectively enabling warnings.
$cadvise +wall -pdb <pdbname> +Wearg1[,arg2,...,argn] compile-cmd <filename>
Following is an example for selectively enabling warnings.
Example 18 Interpreting selective warnings as errors
$cadvise +wall -pdb testpdb +We600 cc -c foo.c
5.5 Disabling warnings in a macro
The +Wmacro:MACRONAME:d1,d2,d3,..dn option disables specified warnings in a macro.
MACRONAME is the name of the macro and d1, d2, d3, ..., dn are warning numbers.
Specifying -1 suppresses all warnings. This option is not applicable to warning numbers greater
than 20000.
NOTE: Conflicts between +W, +Ww and +We options are resolved based on the severity. The +We
option is the highest and +W is the lowest.
Following is the syntax for disabling warnings in a macro.
$cadvise +wall -pdb <pdbname> +Wmacro:INITIAL:d1,d2,d3,..dn compile-cmd <filename>
Following is an example for disabling warnings in a macro.
Example 19 Disabling warnings in a macro
$cadvise +wall -pdb testpdb +Wmacro:INITIAL:600,610 cc -c foo.c
5.6 Managing warnings in a source file
#pragma diag_suppress | diag_warning | diag_error NNNN
#pragma diag_default NNNN
Command line options help you to generate diagnostic messages for the entire build or for a
specific source file. There are several pragmas available to manage warnings for a specific region
within a source file. The use of #pragma diag_suppress within the source code disables
generation of warning N after the pragma in the source file. The pragma diag_default restores
the default handling for the diagnostic message N. Similarly, diag_warning enables generation
of a diagnostic message and diag_error converts a warning to an error. The following example
disables warning #2549-D locally:
Example 20 Disabling a warning locally
int i;
#pragma diag_suppress 2549
printf ("i = %d\n", i);
#pragma diag_default 2549
NOTE: These pragmas are not applicable to warning numbers greater than 20000.
26 Configuring diagnostic messages
Page 27

6 Generating reports
Cadvise either stores the diagnostic messages in the PDB or outputs them into the stderr. To
analyze these diagnostic messages, you can generate a report using the cadvise report command.
Cadvise report provides multiple options for filtering the diagnostic messages stored in the log
files. These reports can also be viewed and saved as HTML files. Using these options, you can
view a selected set of diagnostic messages. The cadvise reports can be generated from the following:
• The PDB
Cadvise builds that use the -pdb option store the diagnostic messages in the program
database. The following command generates report from the PDB:
cadvise report <report-options> -pdb pdbdir
• The log files
Cadvise builds that do not use the -pdb option, output them into stderr. You can redirect
these to a log file for later analysis. The following command generates the report from log
files:
cadvise report <report-options> logfile
6.1 Report generation options table
You can use the following options to generate reports:
N1,N2,N3,...,Nn” (page 30)
“-exclude
<string1:string2:...:stringN>”(page 31)
“-include
<string1:string2:...:stringN>”(page 32)
“-migration” (page 39)
<DN1:SL1,DN2:SL2,...,DNn:SLn>”(page 34)
Prints the summary information of all messages in the log file.“-summary” (page 28)
Prints the summary information for each source file.“-file_summary” (page 28)
Prints all the messages in the log file.“-all” (page 28)
Displays the reports in HTML.“-html[=<dir>]” (page 29)
Generates the specified cadvise reports in XML format.“-xml[=<filename>]” (page 30)
Prints only those diagnostics with specified diagnostic numbers, N1,N2..Nn.“-diag
Prints the messages with severity greater than or equal to (>=) to N.“-severity N” (page 31)
Suppresses diagnostics or metrics from source files that have any of the specified
strings in the filename path.
Generates diagnostics or metrics from source files that contain the any of the specified
string in the file name path. Messages from any other files are suppressed.
Prints program complexity data for all or selected source files.“+metrics” (page 32)
Print only those messages that are related to migration, such as endian and 32-bit
to 64-bit migration related diagnostics.
Generates report only for source files that make up the module <name>.“-module <name>” (page 33)
Suppresses the report header in cadvise reports.“-noheader” (page 34)
Enables you to modify the severity of diagnostic DNn to SLn.“-chseverity
<basepdbname>” (page 34)
Enables you to compare PDB <pdb-name> with the PDB specified using -pdb option.“-basepdb
Reads the report options from the specified file.“+opts <file>” (page 38)
6.1 Report generation options table 27
Page 28

6.2 Generating summary reports
The -summary option prints the summary information about all messages in the log file in the
order of security level. This is the default.
The following example shows the summary report.
Example 21 Generating summary reports
$cadvise report -summary -pdb testpdb -noheader
=============================== SUMMARY REPORT =================================
Unique warnings: 2
Duplicate warnings: 0
Sev. Count Diagnostic Message
------------------------------------------------------------------------------- 5 1 warning #4228-D: 64 bit migration: conversion from %t1 to a more strictly aligned type %t2 may cause
misaligned access
5 1 warning #4230-D: 64 bit migration: conversion from %t1 to %t2 may cause target of pointers to have
a different size
NOTE: When the -all option is used along with -summary option, cadvise report first prints
the summary followed by the -all output.
6.3 Generating file summary report
The -file_summary option prints the summary information for each source file. All the diagnostic
messages generated for a file are considered and the count for each file is reported. The following
example shows the summary for a source file. The following example shows the summary information
for a source file.
Example 22 Generating file summary report
$cadvise report -file_summary -pdb testpdb
---------------------------------------------------------------------Count Duplicate Filename
---------------------------------------------------------------------- 2 0 example.C
-----------------------------------------------------------------------
6.4 Generating detailed report
The -all option prints all messages in the log-file that are above the specified severity level, sorted
by severity. If no severity level is specified then all messages with severity >= 5 are printed. The
following example shows the usage of -all report:
28 Generating reports
Page 29

Example 23 Generating detailed report
$ cadvise report -pdb testpdb -all
============================== SEVERITY LEVEL 8 ===============================
"example.C", line 13: warning #2549-D: variable "i" is used before its value is set
i++;
^
6.5 Generating HTML report
The -html[=<dir>] option generates report in HTML format from specified PDB. This option can
be used in the following ways:
• To only view the HTML reports in the web browser, run the following command:
$ cadvise report -pdb mypdb -html
The HTML report will be displayed on the browser. The browser is invoked as specified in the
BROWSER environment variable. If this environment variable is not specified, it uses the default
web browser (/opt/mozilla/mozilla). You can also save the generated HTML reports.
• To save reports, run the following command:
NOTE: This command saves the html report in a specified directory. The web browser is not
invoked with this option.
$ cadvise report -pdb mypdb -html=dirname
• In addition, the HTML Report in cadvise filters diagnostics on the basis of:
Severity number◦
◦ Diagnostic number
◦ Filename path
To invoke the HTML reports page with filters, use the following command:
$ cadvise <cadvise-options> report <fitering_options> -html -pdb <pdb-name>
• To generate a detailed HTML report, use the following command:
$ cadvise report -pdb mypdb -html=dirname -all
This command creates detailed HTML reports and saves it to the specified directory. To view
these reports, open the index.htm file available inside the directory name specified with
–html option.
The HTML report has the following options when it is viewed from the web browser:
• Tabbed Interface: Summary report and warnings for each severity level are placed in different
tabs, which is named according to severity level.
• Hot Keys to Navigate Tabs:
Ctrl + Alt + 0 : Shows summary tab.◦
◦ Ctrl + Alt + (1-9): Shows severity tab corresponding to pressed numeric key.
• Sorting and Text filtering options are available in the severity tabs.
• Multi Page viewing: If the number of diagnostics messages exceeds 1000, a drop down page
list is shown at top right side on the table. You can select a desired page number from the
list. The selected page is loaded.
6.5 Generating HTML report 29
Page 30

6.6 Generating XML report
The -xml[=<filename>] option generates the specified cadvise report in XML format and stores
it in the specified filename. To generate XML reports, run the following command:
$ cadvise report -pdb <pdb-name> +metrics -xml=<filename>
If you do not specify the filename, cadvise stores the data in the cadvise_metrics.xml file for
metrics reports and cadvise_report.xml for diagnostic reports, in the current directory. The
Hierarchy of the XML elements for metrics report is as follows:
<Metrics>
<FileLevel>
...
</FileLevel>
...
<FunctionLevel>
<FileName>...</FileName>
<Function>
...
</Function>
<Function>
...
</Function>
....
</FunctionLevel>
...
<IndirectCallTarget>
...
</IndirectCallTarget>
</Metrics>
Following example shows the command to generate XML report.
Example 24 Generating an XML report
$ cadvise report -pdb testpdb +metrics -xml=metricsreport.xml
6.7 Printing diagnostics with specific diagnostic numbers
Each distinct type of diagnostic message generated by cadvise has a number associated with it.
The -diag N1,N2,N3,...,Nn option prints only those diagnostics with the specified diagnostic
number(s). This allows you to focus on specific diagnostic messages.
30 Generating reports
Page 31

NOTE: You can use the -diag option along with other filtering options, such as -exclude,
-include, and -severity. For more information, see “Report options interoperability” (page 40).
The following example shows the report for a specific diagnostic number.
Example 25 Printing report for a specific diagnostic number(s)
$ cadvise report -pdb testpdb -diag 2549
Report generated using "HP Code Advisor C.XX.XX [Release Time]" on <machine> at
<Report Time>
Report command line: " cadvise report -pdb testpdb -diag 2549"
"a.c", line 14: warning #2549-D: variable "struct_obj" is used before its value
is set
LocalVar = struct_obj.a ;
^
"b.c", line 6: warning #2549-D: variable "b" is used before its value is set
c = b;
^
"b.c", line 7: warning #2549-D: variable "a" is used before its value is set
b = a;
^
6.8 Generating reports based on severity
The -severity N option is used to emit messages with severity >= N. The valid values for N
are 1 to 9, where 9 indicates the highest severity. If this option is not specified, the default severity
is taken as 5. This option does not affect the output of -summary, which still prints the complete
summary.
NOTE: You can use the -severity option along with other filtering options, such as -exclude,
-diag, and -include. For more information, see “Report options interoperability” (page 40).
The following example shows the command to generate report based on severity.
Example 26 Generating reports based on severity
$ cadvise report -pdb test.pdb –all –severity 2.
This command prints all diagnostics of severity levels greater than or equal to two.
6.9 Suppressing diagnostics for specific files
The -exclude <string1:string2:...:stringN> option helps to eliminate diagnostics for
files that contain any of the strings from 1 to n in the file.
NOTE: You can use the -exclude option along with other filtering options, such as -diag,
-include, and -severity. For more information, see Report options interoperability.
The following example shows the elimination of strings from a file.
6.8 Generating reports based on severity 31
Page 32

Example 27 Suppressing diagnostics for specific file(s)
$ cadvise report -pdb test.pdb -summary -exclude "inflate.c"
Report generated using "HP Code Advisor C.XX.XX [Release Time]" on <machine> at <Report Time>
Report command line: " cadvise report -pdb test.pdb -summary -exclude "inflate.c "
=============================== SUMMARY REPORT =================================
Unique warnings: 257
Duplicate warnings: 0
Sev. Count Diagnostic Message
------------------------------------------------------------------------------- 5 1 warning #20111-D: (SECURITY) Tainted data may be used in data length computation%s
5 4 warning #20200-D: Potential null pointer dereference %s%s is detected %s
5 10 warning #20118-D: Tainted value may be used in pointer arithmetic expression%s
5 12 warning #20112-D: (SECURITY) Tainted data may be copied to the target buffer%s
5 20 warning #20117-D: (SECURITY) Tainted value may be used in array index expression%s
5 23 warning #20114-D: (SECURITY) Tainted value may be used in loop exit condition computation%s
3 1 remark #2193-D: zero used for undefined preprocessing identifier
3 2 remark #4315-D: %s loop without body, did you insert an extra ';'?
...
6.10 Reporting diagnostics from specific files
The -include <string1:string2:...:stringN> option generates diagnostics for files
that contain any of the strings from 1 to n in the file.
NOTE: You can use the -include option along with other filtering options, such as -exclude,
-diag, and -severity. For more information, see “Report options interoperability” (page 40).
The following example shows the diagnostics containing strings from 1 to n for a file.
Example 28 Reporting diagnostics from specific file(s).
$ cadvise report -pdb test.pdb -summary -include "inflate.c"
report: warning: Filtering options do not affect -summary and -file_summary
Report generated using "HP Code Advisor C.XX.XX [Release Time]" on <machine> at <Report Time>
Report command line: " cadvise report -pdb test.pdb -summary -include "inflate.c "
=============================== SUMMARY REPORT =================================
Unique warnings: 257
Duplicate warnings: 0
Sev. Count Diagnostic Message
-------------------------------------------------------------------------------5 1 warning #20111-D: (SECURITY) Tainted data may be used in data length computation%s
5 4 warning #20200-D: Potential null pointer dereference %s%s is detected %s
5 10 warning #20118-D: Tainted value may be used in pointer arithmetic expression%s
5 12 warning #20112-D: (SECURITY) Tainted data may be copied to the target buffer%s
5 20 warning #20117-D: (SECURITY) Tainted value may be used in array index expression%s
5 23 warning #20114-D: (SECURITY) Tainted value may be used in loop exit condition computation%s
3 1 remark #2193-D: zero used for undefined preprocessing identifier
3 2 remark #4315-D: %s loop without body, did you insert an extra ';'?
6.11 Reporting program complexity metrics
The +metrics option reports the metrics in the PDB or metrics log file which is generated when
the +metrics option is used during analysis. If you do not specify the +metrics option during
analysis, cadvise displays the following warning:
report: warning: No metrics files specified
All options other than -include and -exclude are ignored. The following example shows the
report for program complexity data.
32 Generating reports
Page 33

Example 29 Reporting program complexity metrics
$ cadvise report -pdb gzip.pdb +metrics -include "inflate.c"
================================================================================
Begin program complexity data for /vws/cal-bear_2/zhang/gzip-1.2.4a/inflate.c
================================================================================
File level program complexity data :
------------------------------------
Include Files: 4
Total Lines: 954
Blank Lines: 211
Comment Lines: 248
Lines Of Code: 495
Mixed Lines: 155
No. of Globals: 6
No. of Statics: 5
No. of Functions: 8
No. of Extern Functions: 8
Function level program complexity data :
----------------------------------------
Begin Function: huft_build
Signature: int huft_build()
Total Lines: 182
Blank Lines: 40
Comment Lines: 22
Lines of Code: 120
Mixed Lines: 65
No. of Macros Used: 13
No. of Locals: 19
No. of statics: 0
No. of Ifs: 15
No. of Returns: 5
No. of Loops: 7
...
NOTE: A variant of the +metrics option is +metrics[=ict] that prints the number of indirect
call targets. For information on the program complexity metrics emitted with this option, see
“Generating code complexity metrics” (page 13).
6.12 Generating report for a module
The -module <name> option generates analysis report for the source files of the module <name>.
A module is a subdirectory of the application's source files. The following example shows the report
for a source file of a module.
6.12 Generating report for a module 33
Page 34

Example 30 Generating report for a module
$ cadvise report -pdb test.pdb -summary -module test1
=============================== SUMMARY REPORT =================================
Report generated using "HP Code Advisor C.XX.XX [Release Time]" on <machine> at <Report Time>
Report command line: " cadvise report -pdb test.pdb -summary -module test1"
Unique warnings:29
Duplicate warnings: 0
Sev. Count Diagnostic Message
------------------------------------------------------------------------------- 5 1 warning #20111-D: (SECURITY) Tainted data may be used in data length computation%s
5 4 warning #20200-D: Potential null pointer dereference %s%s is detected %s
5 12 warning #20112-D: (SECURITY) Tainted data may be copied to the target buffer%s
5 12 warning #20118-D: Tainted value may be used in pointer arithmetic expression%s
6.13 Suppressing report header
All cadvise reports contain a header with the details of the report generation.
Format of Report header:
Report generated using <cadvise version> on <SYSTEM> at <TIMESTAMP>
Report command line: <command line>
The -noheader option suppresses the report header in cadvise report.
Following example shows the report generation without a header.
Example 31 Suppressing Report Header
Report generated using "HP Code Advisor C.XX.XX [Feb 25 2009]" on shale at Mon Feb 25 01:49:11 2009
Report command line: "/opt/cadvise/bin/cadvise report -pdb /tmp/testpdb"
6.14 Modifying the default severity level of a diagnostic
The -chseverity <DN1:SL1,DN2:SL2,...,DNn:SLn> option enables you to modify the
default severity level of one or more diagnostics in reports. DNx is the diagnostic number whose
severity level is to be modified and SLx is the new severity level. The valid values for DNx and
SLx are 1 to 9.
The following example shows the commands for modifying the default severity level of a diagnostic.
Example 32 Modifying the default severity level of diagnostic
The default severity level of diagnostic 20200 is 5. The following command line changes the
severity to level 3.
$ cadvise -pdb testpdb -severity 1 -summary -chseverity 20200:3
The following command line changes the severity of 20200 to 3 and 20201 to 8.
$ cadvise -pdb testpdb -severity 1 -summary -chseverity 20200:3,20201:8
6.15 Generating PDB comparison report
The -basepdb <basepdbname> option enables you to compare the PDB <basepdbname> with
the PDB specified with -pdb option. You can generate the following reports while comparing the
PDBs:
• “Generating summary diff report” (page 35)
• “Generating detailed diff report” (page 35)
34 Generating reports
Page 35

6.15.1 Generating summary diff report
Using the PDB comparison option along with the -summary option displays the difference between
the summary reports of 2 PDBs. The following example shows the usage of -basepdb
<basepdbname> summary difference report:
Example 33 Generating summary diff report without the header
$ cadvise report -pdb test.pdb -basepdb test0.pdb -summary -noheader
Sev. OldCount Count Diagnostic Message
-------------------------------------------------------------------------------- 6 1 0 warning #20048-D:%s "%s" has incompatible type with previous declaration at line %s in
file "%s"
5 1 1 warning #20111-D: (SECURITY) Tainted data may be used in data length computation%s
5 4 4 warning #20200-D: Potential null pointer dereference %s%s is detected %s
5 12 12 warning #20112-D: (SECURITY) Tainted data may be copied to the target buffer%s
5 12 12 warning #20118-D: Tainted value may be used in pointer arithmetic expression%s
5 30 30 warning #20117-D: (SECURITY) Tainted value may be used in array index expression%s
5 45 45 warning #20114-D: (SECURITY) Tainted value may be used in loop exit condition computation%s
3 1 1 remark #2193-D: zero used for undefined preprocessing identifier
3 2 2 remark #4315-D: %s loop without body, did you insert an extra ';'?
...
6.15.2 Generating detailed diff report
Using the PDB comparison option along with the -all option displays the detailed difference
between the reports of 2 PDBs. The first part of the report shows the header on top and then shows
the difference in warning summary. The second part of the report displays all regressions and
improvements in detail. The following example shows the usage of -basepdb <basepdbname>
detailed diff report with the -all option:
Example 34 Generating detailed diff report with the header
$ cadvise report -pdb tmp.pdb -basepdb tmp1.pdb -all
Report generated using "HP Code Advisor C.XX.XX [Release Date]" on <Machine Name> at <Time>
Report command line: "Report Command Line"
New Pdb: tmp.pdb
Base Pdb: tmp1.pdb
Regressions: 2 =>2549(2)
Improvements: 1 =>20200(1)
=======================[ REGRESSIONS ]===========================
"/home/solankib/TESTING/b.c", line 6: warning #2549-D: variable "a" is used before its value is set
c = a;
^
"/home/solankib/TESTING/b.c", line 9: warning #2549-D: variable "b" is used before its value is set
a = b;
^
=======================[ IMPROVEMENTS ]===========================
"/home/solankib/TESTING/a1.c", line 11, procedure main: warning #20200-D: Potential null pointer dereference
You also have the flexibility of using the filtering options with this feature. If you use any filtering
option in the command line, then the first step report is filtered and then the diff report is generated
as shown in the following examples.
The following example shows the usage of -basepdb <basepdbname> detailed diff report with
the -diag option:
6.15 Generating PDB comparison report 35
Page 36

Example 35 Generating diff report for any particular warning
$ cadvise report -pdb tmp.pdb -basepdb tmp1.pdb -diag 2549
Report generated using "HP Code Advisor C.XX.XX [Release Date]" on <Machine Name> at <Time>
Report command line: "Report Command Line"
New Pdb: tmp.pdb
Base Pdb: tmp1.pdb
Regressions: 2 =>2549(2)
Improvements: 0
=======================[ REGRESSIONS ]===========================
"/home/solankib/TESTING/b.c", line 6: warning #2549-D: variable "a" is used before its value is set
c = a;
^
"/home/solankib/TESTING/b.c", line 9: warning #2549-D: variable "b" is used before its value is set
a = b;
^
The following example shows the usage of -basepdb <basepdbname> detailed diff report with
the -include option:
Example 36 Generating detailed diff report for any particular file or any group of files
$ cadvise report -pdb tmp.pdb -basepdb tmp1.pdb -include a1.c
Report generated using "HP Code Advisor C.XX.XX [Release Date]" on <Machine Name> at <Time>
Report command line: "Report Command Line"
New Pdb: tmp.pdb
Base Pdb: tmp1.pdb
Regressions: 0
Improvements: 1 =>20200(1)
=======================[ IMPROVEMENTS ]===========================
"/home/solankib/TESTING/a1.c", line 11, procedure main: warning #20200-D: Potential null pointer dereference
The following example shows the usage of -basepdb <basepdbname> detailed diff report with
the -exclude option:
Example 37 Generating detailed diff report after excluding any file or any group of files
$ cadvise report -pdb tmp.pdb -basepdb tmp1.pdb -exclude a1.c
Report generated using "HP Code Advisor C.XX.XX [Release Date]" on <Machine Name> at <Time>
Report command line: "Report Command Line"
New Pdb: tmp.pdb
Base Pdb: tmp1.pdb
Regressions: 2 =>2549(2)
Improvements: 0
=======================[ REGRESSIONS ]===========================
"/home/solankib/TESTING/b.c", line 6: warning #2549-D: variable "a" is used before its value is set
c = a;
^
"/home/solankib/TESTING/b.c", line 9: warning #2549-D: variable "b" is used before its value is set
a = b;
^
The following example shows the usage of -basepdb <basepdbname> detailed diff report with
the -severity option:
36 Generating reports
Page 37

Example 38 Generating detailed diff report in the warnings greater than or equal to any particular
severity
$ cadvise report -pdb tmp.pdb -basepdb tmp1.pdb -severity 1
Report generated using "HP Code Advisor C.XX.XX [Release Date]" on <Machine Name> at <Time>
Report command line: "Report Command Line"
New Pdb: tmp.pdb
Base Pdb: tmp1.pdb
Regressions: 2 =>2549
Improvements: 4 =>2938(1), 20119(2), 20200(1)
=======================[ REGRESSIONS ]===========================
"/home/solankib/TESTING/b.c", line 6: warning #2549-D: variable "a" is used before its value is set
c = a;
^
"/home/solankib/TESTING/b.c", line 9: warning #2549-D: variable "b" is used before its value is set
a = b;
^
=======================[ IMPROVEMENTS ]===========================
"/home/solankib/TESTING/a1.c", line 11, procedure main: warning #20119-D: (SECURITY) Unsafe API 'strcpy' ...
"/home/solankib/TESTING/a1.c", line 11, procedure main: warning #20200-D: Potential null pointer dereference
...
"/home/solankib/TESTING/a1.c", line 3: remark #2938-D: return type "int" omitted in declaration of function
"main"
main()
^
"/home/solankib/TESTING/a1.c", line 9, procedure main: warning #20119-D: (SECURITY) Unsafe API 'strcpy' is
used...
6.15.2.1 Using -approot option for detailed diff report
Using the -approot option, you can get the difference of warnings from two PDBs by ignoring
differences in file paths. This option helps you to filter those warnings which are common to both
PDBs, but having different source files paths from which they get emitted.
For example, consider an application with two files one.c and two.c in the path /tmp/path1.
Compile and analyze the code using the command:
$ cadvise -pdb pdb1 cc one.c two.c
When the same application is copied to /tmp/path2 and one of the diagnostics fixed, a PDB
diff with detailed report, between the two PDBs shows multiple improvements and regression
because of the change in basepath.
This problem can be fixed with the -approot option, as follows:
$ cadvise report -pdb pdb2 -basepdb /tmp/path1/pdb1 -approot
/tmp/path1:/tmp/path2 -all
The -approot option ignores the variable part of the path when comparing diagnostics and
allows correct comparison reports to be generated.
The following example demonstrates the usage of -approot option while generating a detailed
diff report.
6.15 Generating PDB comparison report 37
Page 38

Example 39 Generating detailed diff report without using -approot option
$ cadvise report -pdb new.pdb -basepdb old.pdb -all
Report generated using "HP Code Advisor C.XX.XX [Release Date]" on <Machine Name> at <Time>
Report command line: "Report Command Line"
New Pdb: new.pdb
Base Pdb: old.pdb
Regressions: 1 =>2223(1)
Improvements: 2 =>2223(1), 2549(1)
=======================[ REGRESSIONS ]===========================
"/home/rajen/cadvise/testing/approot_cases/new/1.c", line 4: warning #2223-D: function "printf" declared
implicitly
printf("Hi");
^
=======================[ IMPROVEMENTS ]===========================
"/home/rajen/cadvise/testing/approot_cases/old/1.c", line 4: warning #2223-D: function "printf" declared
implicitly
printf("Hi");
^
"/home/rajen/cadvise/testing/approot_cases/old/1.c", line 5: warning #2549-D: variable "y" is used before its
value is set
if (x = y)
^
Example 40 Generating a detailed diff report using -approot option
$ cadvise report -pdb new.pdb -basepdb old.pdb -approot old:new -all
Report generated using "HP Code Advisor C.XX.XX [Release Date]" on <Machine Name> at <Time>
Report command line: "Report Command Line"
New Pdb: new.pdb
Base Pdb: old.pdb
Regressions: 0 Improvements: 1 =>2549(1)
=======================[ IMPROVEMENTS ]===========================
"/home/rajen/cadvise/testing/approot_cases/new/1.c", line 5: warning #2549-D: variable "y" is used before its
value is set
if (x = y)
^
As shown in above examples, warning#2223 is emitted at line 4 and is common in both PDBs. User might want to
ignore such duplicate warnings while comparing two different versions of PDBs, and hence the -approot option
serves the purpose for effective comparison of different PDBs.
6.16 Report options file
All the options that you want to use to generate the report can be consolidated in a single
configuration file using the +opts <file> option. This reduces the clutter on the command line
and provides a single place to specify the customized options. Comment lines can also be inserted
in the +opts configuration file. This option is used for reading reporting options from the specified
<file>. The following example shows the reading of report options from a specific file.
38 Generating reports
Page 39

Example 41 Report options file
$ cat my_opts
-diag 3348
$ cadvise report -pdb test.pdb +opts my_opts
"test.c", line 1320: remark #3348-D: declaration hides variable "ifd" (declared at line 237)
int ifd; /* input file descriptor */
^
"test.c", line 1321: remark #3348-D: declaration hides variable "method" (declared at line 216)
int method; /* compression method */
^
"unlzw.c", line 337: remark #3348-D: declaration hides variable "i" (declared at line 247)
REG1 int i;
^
"unzip.c", line 130: remark #3348-D: declaration hides variable "n" (declared at line 104)
register ulg n = LG(inbuf + LOCLEN);
^
6.17 Generate report for migration related warnings
You can generate a report of the migration related issues in the application using the -migration
option. The report prints only those messages that are related to migration, such as endian and
32-bit to 64-bit migration related diagnostics. You can use the -migration filter along with other
filtering options such as -severity, -diag, -include, and so on, and only diagnostics that
meet all the filtering criteria will be reported.
Example 42 Generating a report using -migration option
$ cadvise report -pdb my.pdb -noheader
=============================== SUMMARY REPORT =================================
Unique warnings: 7
Duplicate warnings: 0
Sev. Count Diagnostic Message
------------------------------------------------------------------------------- 5 3 warning #2223-D: function %sq declared implicitly
5 1 warning #4291-D: endian porting: the read/write of the buffer may be endian dependent
3 3 remark #4242-D: no prototype or definition in scope for call to %sq
$ cadvise report -pdb my.pdb -migration -severity 5 -noheader
=============================== SUMMARY REPORT =================================
Unique warnings: 1
Duplicate warnings: 0
Sev. Count Diagnostic Message
------------------------------------------------------------------------------- 5 1 warning #4291-D: endian porting: the read/write of the buffer may be endian dependent
6.18 Generating consolidated report from multiple PDBs
You can generate a consolidated cadvise report from multiple PDBs. Multiple PDBs can be passed
to report in one of the following ways:
• cadvise report -pdb pdb1:pdb2:...
• cadvise report -pdb pdb1,pdb2,...
• cadvise report -pdb pdb1 -pdb pdb2 ...
The following example demonstrates the usage of this option:
6.17 Generate report for migration related warnings 39
Page 40

Example 43 Generating a consolidated cadvise report from multiple PDBs
$ cadvise report -pdb 1.pdb:2.pdb:3.pdb:4.pdb -all
Report generated using "HP Code Advisor C.XX.XX [Release Date]" on <Machine Name> at <Time>
Report command line: "Report Command Line"
=============================== DETAILED REPORT ================================
------------------------------- SEVERITY LEVEL 8 ------------------------------"/home/rajen/cadvise/testing/1.c", line 5: warning #2549-D: variable "p" is used before its value is set
y = *p = 1;
^
"/home/rajen/cadvise/testing/4.c", line 5: warning #2549-D: variable "c" is used before its value is set
a = b = c;
^
------------------------------- SEVERITY LEVEL 5 ------------------------------"/home/rajen/cadvise/testing/2.c", line 4: warning #2223-D: function "scanf" declared implicitly
scanf("%d",&a);
^
"/home/rajen/cadvise/testing/3.c", line 7: warning #2223-D: function "printf" declared implicitly
printf("%d\n", y);
^
"/home/rajen/cadvise/testing/1.c", line 5, procedure main: warning #20200-D: Potential null pointer dereference
through p is detected (null definition:/home/rajen/cadvise/testing/1.c, line 2)
6.19 Generating PDB diffs with multiple PDBs
Just as using multiple PDBs to get a consolidated report, PDB diff can also support multiple PDBs.
A sample command for PDB diff with multiple PDBs will be as follows:
$ cadvise report -pdb pdb1:pdb2:pdb3:... -basepdb
basepdb1:basepdb2:basepdb3:...
6.20 Recommended process for analyzing the diagnostic messages
The recommended process for analyzing the diagnostic messages is as mentioned below:
1. See a summary report using cadvise report. This gives an overview of the diagnostic
messages that have been generated for the application.
2. Analyze all high severity ( >= 7) diagnostic messages generated by cadvise. These diagnostic
messages have a very low false positive rate and are likely to point out defects in the
application.
3. Each distinct type of diagnostic message generated by the code advisor has a number
associated with it. From the summary, identify particular diagnostic messages that are of
importance to the application, and then generate a detailed report only for those diagnostic
messages. This allows you to focus on a few selected diagnostic messages.
4. Individual developers can analyze the diagnostic messages generated for a particular portion
of the code by filtering the report for a particular set of files. This can be done using
-file_summary and -file options.
6.21 Report options interoperability
Filtering options such as -diag, -exclude, -include, and -severity can be used with one
another to generate a report filtered on the criterion.
NOTE: These filtering options are ignored when used with -all, -summary, and
-file_summary options. However, the -all and -severity options can be used together to
create a detailed report of diagnostics with severity above the specified severity level.
The following examples shows the usage of multiple options simultaneously.
40 Generating reports
Page 41

Example 44 Reporting options interoperability
$ cadvise report -pdb test.pdb -diag 2549 -exclude b.c
Report generated using "HP Code Advisor C.XX.XX [Release Time]" on <machine> at <Report Time>
Report command line: " cadvise report -pdb test.pdb -diag 2549 -exclude b.c"
"a.c", line 14: warning #2549-D: variable "struct_obj" is used before its value is set LocalVar = struct_obj.a
;
$ cadvise report -pdb test.pdb -include "a.c:b.c"
Report generated using "HP Code Advisor C.XX.XX [Release Time]" on <machine> at <Report Time>
Report command line: " cadvise report -pdb test.pdb -summary -include a.c:b.c "
"a.c", line 14: warning #2549-D: variable "struct_obj" is used before its value is set
LocalVar = struct_obj.a ;
^
"b.c", line 6: warning #2549-D: variable "b" is used before its value is set
c = b;
^
"b.c", line 7: warning #2549-D: variable "a" is used before its value is set
b = a;
^
In this example if any option, such as -summary, -file_summary, or -all is given in the same
command line, then the -include filtering option is ignored. The following example shows this
behaviour:
Example 45 Ignoring the -include option
$ cadvise report -pdb test.pdb -summary -include "a.c:b.c"
report: warning: Filtering options do not affect -summary and -file_summary
Report generated using "HP Code Advisor C.XX.XX [Release Time]" on <machine> at <Report Time>
Report command line: " cadvise report -pdb test.pdb -summary -include "a.c:b.c"
=============================== SUMMARY REPORT==================================
Unique warnings: 257
Duplicate warnings: 0
Sev. Count Diagnostic Message
-------------------------------------------------------------------------------5 1 warning #20111-D: (SECURITY) Tainted data may be used in data length computation%s
5 4 warning #20200-D: Potential null pointer dereference %s%s is detected %s
5 10 warning #20118-D: Tainted value may be used in pointer arithmetic expression%s
5 12 warning #20112-D: (SECURITY) Tainted data may be copied to the target buffer%s
5 20 warning #20117-D: (SECURITY) Tainted value may be used in array index expression%s
5 23 warning #20114-D: (SECURITY) Tainted value may be used in loop exit condition computation%s
3 1 remark #2193-D: zero used for undefined preprocessing identifier
3 2 remark #4315-D: %s loop without body, did you insert an extra ';'?
6.21 Report options interoperability 41
Page 42

7 Miscellaneous driver options
You can also use the following cadvise options to manage the static analysis and the compilation
processes:
Specifies the compiler or linker command used in the command line.-compiler
[aCC|cc|c89|c99|gcc|g++|ld]
Displays the complete list of cadvise options with a brief description for each option.-help|-h|-H
-[no]abort
-nobuild
-tee
+opts <filename>
Determines whether to return a non-zero exit value for cadvise errors. The default is
-noabort.
Determines whether to invoke the compile or link command after the cadvise static
analysis.
Reduces the build only to modified elements when used with -nobuild option.-target[=.ext|filename]
Writes the errors and diagnostics found during the analysis of the application to
standard error in addition to storing them in the PDB.
Enables you to consolidate all options which manage HP Code Advisor diagnostic
messages in a single configuration file.
• -compiler [aCC|cc|c89|c99|gcc|g++|ld]
This option helps in mapping the compile command in the build line to the standard commands
recognized by cadvise. The syntax for specifying the compiler or linker command used in the
command line is as mentioned below:
$ cadvise -compiler compile-cmd <compilation path> -w <filename>
The following example shows the usage of -compiler [aCC|cc|c89|c99|gcc|g++|ld]
option.
Example 46 Specifying the compiler command used in the command line
$ cadvise -compiler cc /opt/ansic/bin/cc -w t1.c
• -help|-h|-H
This option displays the complete list of cadvise options with a brief description for each
option. The syntax for displaying the complete list of cadvise options is as mentioned below:
Example 47 Displaying the list of cadvise options
/opt/cadvise/bin/cadvise –h
• -[no]abort
This option determines whether to return a non-zero exit value for cadvise errors. The default
is -noabort. The syntax for determining the exit value for cadvise errors is as mentioned
below:
$ cadvise -abort <compilation path> -w <filename>
The following example shows the usage of -[no]abort option.
Example 48 Using -[no]abort
$ cadvise -abort /opt/ansic/bin/cc -w t1.c
42 Miscellaneous driver options
Page 43

• -nobuild
The cross-file analysis is disabled when you use the -nobuild option. You can use the
-crossfile=defer option to enable cross-file analysis. The default is -build. The syntax
for determining the invocation of the compile or link command after the cadvise static analysis
is as mentioned below:
$ cadvise -nobuild <compilation path> -w <filename>
The following example shows the usage of -[no]build option.
Example 49 Using -nobuild option
$ cadvise -nobuild /opt/ansic/bin/cc -w t1.c
This results in the compile command line /opt/ansic/bin/cc -w t1.c not getting
executed.
• -target[=.ext|filename]
This option creates an empty file called filename or <objectfile>.ext in the current
directory, which is used as an updated makefile target. When cadvise is called with the
-nobuild option from a makefile, the compiler is not invoked and hence a .o file is not
created. When this happens, the makefile target is not updated. In the absence of a target
update, a second call to make invokes cadvise for all the targets again, instead of only the
ones that have been modified.
NOTE: If filename is not specified, cadvise creates objfile.cadv.
The following example shows the usage of -target[=.ext|filename] option.
Example 50 Using -target[=.ext|filename] option
The following command creates the file foo.cadv:
$ cadvise -nobuild -target cc foo.c -o foo.o
The following command creates the file cadv_dir/foo.cad:
$ cadvise -nobuild -target=cadv_dir/foo.cad cc foo.c
• -tee
You also have the choice of looking at the errors and the diagnostic messages immediately
with the -tee option, or generate a report later from the PDB.
The following example shows the usage of -tee option.
Example 51 Using -tee option
$ cadvise -compiler cc -tee +wall -pdb 1.pdb /opt/ansic/bin/cc -w t1.c
• +opts <filename>
This option reduces the clutter at the command line and provides a single place to specify the
customizations. Comment lines can also be inserted in the +opts configuration file. You can
use this option to read reporting options from the specified filename.
The following example shows the usage of +opts <filename> option.
43
Page 44

Example 52 Using +opts <filename> option
$cat warnings_config
# warnings_config
# change warning about use of undefined variable to an error
+We2549
# enable warning about redeclaration of variable
+Ww3348
# disable warning: statement is unreachable
+W2111
$ cadvise +opts warnings_config +wlint cc -c uninit.c at the command
line generates the following messages:
"uninit.c", line 6: warning #3348-D: declaration hides variable "i"
(declared at line 3)
int i;
^
"uninit.c", line 9: error #2549-D: variable "i" is used before its
value is set
if (i) j = 3;
^
1 error detected in the compilation of "uninit.c".
44 Miscellaneous driver options
Page 45

8 Categories of diagnostics with examples
Cadvise detects a wide range of coding errors and potential problems such as memory leaks, used
after free, double free, array/buffer out of bounds access, illegal pointer access, un-initialized
variables, unused variables, format string checks, suspicious conversion and casts, out of range
operations, and C++ coding style warnings.
8.1 Categories of diagnostics table
Following are some examples of the various checks done by the HP Code Advisor:
Enables all the warnings about potentially questionable constructs in the compiler.+w
Enables all the compile time checks.+wall
Provides compile-time diagnostics which detect potential errors in the source code.“+wlint” (page 45)
“+w64bit ” (page 51)
” (page 54)
Enables warnings that help detection of potential problems in converting 32-bit
applications to 64-bit.
Detects code fragments which are endian dependent.“+wendian” (page 51)
Enables compile time diagnostic messages for potential security vulnerabilities.“+wsecurity[=1|2|3|4]” (page 52)
Detects multi-threaded programming issues.“+wlock” (page 53)
Generates performance advisory diagnostics.“+wperfadvice[=1|2|3|4]
• +w
This option enables all the warnings about potentially questionable constructs in the compiler.
This includes the +wlint and +w64bit warnings and many others. The number of warnings
generated by this option may be up to 5-10 times more than those generated by +wlint.
This option enables all the warnings about potentially questionable constructs in the compiler.
This includes the +wlint and +w64bit warnings and many others. The number of warnings
generated by this option may be up to 5-10 times more than those generated by +wlint.
Following are some examples of warnings enabled by the +w option:
- Variable is declared but never referenced
- Comparison of unsigned integer with signed integer
- Padding size of structure to alignment boundary
- Argument is incompatible with corresponding format string conversion
• +wall
The +wall option enables all the compile time checks. The +wall option includes security
checks and requires cross-module analysis. Hence, you must specify the location of the program
database using the -pdb option, whenever you use +wall.
8.2 Detecting generic programming errors
The compile time diagnostic messages generated by the +wlint option can be very useful in
detecting potential problems in the source code. The number of warnings generated by this option
may be up to 5-10 times more than those generated by default by the compiler. For example, the
following warnings are enabled by this option:
- Argument is incompatible with formal parameter
- Function declared implicitly
- Function is re-declared after being called
8.1 Categories of diagnostics table 45
Page 46

- Type conversion may truncate value
- Unsigned value cannot be less than zero
- Missing return statement at end of non-void function
- Nested comment is not allowed
- Signed bitfield of length 1
- Potential memory leak detection
- Potential null pointer dereference detection
- Out of bound access
- Out of scope access
- Use of pointer after free
- Allocator/deallocator mismatch
The following are some detailed examples of warnings generated by +wlint checks:
46 Categories of diagnostics with examples
Page 47

Example 53 Null pointer dereference check
A null pointer may result from null assignment or from a call to the APIs that may return a null value.
If a pointer that is not guarded when it is dereferenced, unexpected runtime results may occur. For
example, see the following program fragment:
#include <stdio.h>
int process (char* filename)
{
FILE* f;
int count = 0;
if (filename)
{
if (f = fopen(filename, "r"))
{
while (fgetc(f) != EOF)
count ++;
}
// f can be null at this point
fclose (f);
return count;
}
return -1;
}
In such cases, cadvise generates the following warning:
"null.c", line 22, procedure process: warning #20200-D:
Potential null pointer dereference through f is detected (null
definition:/home/sandyam/demo/null.c, line 16)
8.2 Detecting generic programming errors 47
Page 48

Example 54 Potential memory leak check
Cadvise detects potential memory leaks in the program where the memory allocated in the program
is not freed. If a dynamically allocated memory becomes unreachable from any other pointers,
then the memory is leaked after that point in the program, assuming that there is no garbage
collection in the allocator. Cadvise flags such situations as shown in the following example code
fragment:
#include <stdlib.h>
#include <stdio.h>
#include <string.h>
int leak1 (int k, int some_condition)
{
char *p = malloc (k);
if (p == 0) return -1;
if (some_condition) return -1;
strcpy (p, "hello");
printf ("%s\n", p);
free (p);
return 0;
}
int* leak2(int k, char* fname)
{
FILE* f;
int *p = (int*) malloc(k);
if (p == 0) return 0;
// after return, memory pointed to by 'p' is leaked
if ((f = fopen(fname,"r")) == 0) return 0;
fread(p, k,1, f);
return p;
}
In such cases, cadvise generates the following warnings:
"memleak.c", line 13, procedure leak1: warning #20202-D:
Allocated memory may potentially be leaked (at line 16)
"memleak.c", line 27, procedure leak2: warning #20202-D:
Allocated memory may potentially be leaked (at line 32)
However, there can be false positives flagged in certain situations because of the conservative
static analysis.
48 Categories of diagnostics with examples
Page 49

Example 55 Out of bound access
When an array is referenced and the index is greater than the declared (or dynamically allocated)
size, unexpected runtime behavior may occur. In such cases, cadvise flags it as potential array
out of bound access violation. Such potential issues are flagged by cadvise, as shown in the
following code:
int a[100];
int foo(int i)
{
if (i < 100)
a[i] = 0;
else
a[i] = 20; // potential out of bound access
return 0;
}
Cadvise detects out of bound accesses on both statically and dynamically allocated arrays.
In such cases, cadvise generates the following warning:
"oob.c", line 7, procedure foo: warning #20206-D: Out of bound access
(In expression "&a[i]", array "a" [oob.c:1] (type: int [100])
has element range [0 .. 99], writing element range [100 .. ?].)
Example 56 Out of scope access
Cadvise flags out of scope access of variables in the application. Unexpected results may occur
in the following cases:
• When the local variable address is returned and dereferenced by the caller.
• When the allocated memory is returned and dereferenced by the caller.
• When an inner block scope variable is accessed indirectly in the enclosing scope.
The Code Advisor flags such potential issues, as shown in the following code:
#include <stdio.h>
int foo()
{
int *p;
{
int q;
scanf("%d", &q);
p = &q;
}
// out of scope reference to q
return *p;
}
In such cases, cadvise generates the following warning:
"oos.c", line 20, procedure foo: warning #20203-D:
Potential out of scope use of local variable q
8.2 Detecting generic programming errors 49
Page 50

Example 57 Use of pointer after free
When there is reference to a memory through a pointer that has been previously freed, cadvise
detects such potential issues as Use After Free cases.
For example, see the following code:
void use_after_free ()
{
char *p = malloc (20);
strcpy (p, "hello");
free (p);
*p = 'c';
}
In such cases, cadvise generates the following error:
free.c", line 5, procedure use_after_free: warning #20205-D: Pointer is used
after free
Example 58 Allocator/deallocator mismatch
Cadvise flags situations where memory has been allocated through a certain type of allocator,
such as malloc, but is being freed with an unmatched deallocator, such as delete. This issue
is particularly important in C++ applications where the memory is allocated using a operator
array new but it is calling simply delete, instead of array delete.
For example, see the following code:
#include <malloc.h>
void free1 ()
{
int i;
char* p = new char(10);
free (p);
}
In such cases, cadvise generates the following warning:
"mismatch1.cpp", line 8, procedure free1: warning #20210-D: Mismatch in
allocation and deallocation
50 Categories of diagnostics with examples
Page 51

Example 59 Signed bit field of length 1
Cadvise warns cases where signed bit field of length 1 is being used and then assigned with a
value, which is excessive of its size.
For example, see the tags in the following code:
$ cat bitfield.c
struct { int bit:1; } s;
void test()
{
s.bit = 1;
}
In such cases, cadvise generates the following warnings:
"bitfield.c", line 1: warning #2108-D: signed bit field of length 1
struct { int bit:1; } s;
^
"bitfield.c", line 5: warning #4251-D: the assignment has an excessive
size for a bit field
s.bit = 1;
^
8.3 Detecting 32-bit to 64-bit migraton issues
The +w64bit option enables warnings that help detection of potential problems in converting
32-bit applications to 64-bit. The +w64bit option applies only to a 64-bit compile (using
+DD64). This option is equivalent to the +M2 option. Following are some of the checks performed
by this option:
• 64–bit value is implicitly converted to a 32 bit value, for example, long to int.
• Pointer to a 4-byte aligned object is implicitly converted to a pointer to a 8-byte aligned object.
For example, see the following code:
Example 60 Detecting 32–bit to 64–bit migraton issues
$ cat convert.c
int *int_to_ptr (int i)
{
return (int *)i;
}
In such cases, cadvise generates the following warning:
"convert.c", line 3: warning #4231-D: 64 bit migration: conversion
between types of different sizes has occurred
(from "int" to "int *" )
return (int *)i;
^
8.4 Detecting endianness migration issues
The +wendian option helps you to detect code fragments which are endian dependent. The
following example shows the detection of endian dependent code fragments.
8.3 Detecting 32-bit to 64-bit migraton issues 51
Page 52

Example 61 Detecting endian dependent code fragments
Consider the following code fragment.
union Endian {
char c[4];
int v;
};
In such cases, cadvise generates the following warning:
"endian1.c", line 2: warning #4289-D: endian porting: the definition of the
union may be endian dependent
union Endian {
^
The +wendian option can catch various potential endian dependent data structures and usage.
It helps you to locate potential problem spots while porting from little-endian to big endian
architecture and vice versa.
8.5 Detecting potential security vulnerabilities
The +wsecurity[=1|2|3|4] option enables compile time diagnostic messages for potential
security vulnerabilities. This option is useful in an environment where you are not trained to detect
security vulnerabilities.
With the +wsecurity option, warnings are generated for cases where untrusted (tainted) data
may reach a critical reference point in the program. This is based on cross-module analysis
performed by the compiler, which is much more powerful compared to simple scanning and parsing
tools. The +wsecurity option implicitly enables a limited form of cross-module analysis even if
-ipo or +O4 options are not specified. This may lead to a significant increase in the compile time
compared to a build without the +wsecurity option. Using this option may result in the compiler
invoking optimizations other than those which are part of the specified optimization level. If
+wsecurity is used in addition to -ipo or +O4, the generated code is not affected and the compile
time does not increase much. The +wsecurity option requires cross module analysis. Hence,
you need to specify the location of the PDB using the -pdb option.
The problems detected include use of unsafe APIs, use of unsafe data length argument, unsafe loop
exit condition, unsafe file path use, and so on.
For example, see the reference to untrusted file path in the following code:
52 Categories of diagnostics with examples
Page 53

Example 62 Enabling compile time diagnostic messages for potential security vulnerabilities
#include <stdio.h>
#include <stdlib.h>
char* get_path()
{
return getenv("BLAHBLAH");
}
int main()
{
char* path = get_path(); // line 11
FILE* my_pipe = popen(path, "r"); // line 13
printf ("%p\n", my_pipe);
}
In this case, cadvise generates the following error:
"popen.c", line 13, procedure main: warning #20116-D: (SECURITY) Tainted
value may be used as path or file name
++ tainted value is returned from 'get_path' called by 'main' at line 11
in file popen.c
For example, see the unsafe loop exit condition in the following code and the warning generated.
int a[100];
int loop(int i)
{
for (int j = 0 ; j < i; j++) // line 5
a[j] = 0;
return a[0];
}
int main()
{
int i;
fread(&i, 1,4,stdin);
loop(i);
}
In this case, cadvise generates the following error:
"loop1.c", line 5, procedure loop: warning #20114-D: (SECURITY) Tainted value
may be used in loop exit condition computation
++ 'loop' is called by 'main' at line 14 in file loop1.c
++++ Tainted value is obtained from 'main'
8.6 Detecting multi-threaded programming issues
The +wlock option detects multi-threaded programming issues and enables diagnostics for potential
errors in using lock/unlock calls in multi-threaded programs that use the pthread library.
The problems detected include acquiring an already acquired lock, releasing an already released
lock and unconditionally releasing a lock which has been conditionally acquired. For example,
cadvise detects a potential locking error in the following code:
8.6 Detecting multi-threaded programming issues 53
Page 54

Example 63 Detecting multi-threaded programming issues
#include<PTHREAD.H>
#include <STDIO.H>
int a;
pthread_mutex_t Mutex;
void perform_operation(pthread_mutex_t* mutex1, int increment, int* global)
{
if (increment > 10)
{
int status = pthread_mutex_lock(mutex1);
}
*global = *global + increment;
int status = pthread_mutex_unlock(&Mutex);
}
int main(void)
{
int i;
scanf("%d", &i);
perform_operation(&Mutex, i, &a);
printf("%d is value\n", a);
}
Running cadvise generates the following error:
"1.c", line 12: warning #20223-D: Trying to unlock a lock held conditionally
With the +wlock option, warnings are generated for potential errors in using lock/unlock calls
from pthread library. This is based on cross-module analysis performed by the compiler, which is
much more powerful compared to simple scanning and parsing tools. The +wlock option implicitly
enables a limited form of cross-module analysis even if -ipo or +O4 options are not specified.
This may lead to a significant increase in the compile time compared to a build without the +wlock
option.
The +wlock option requires cross module analysis. Hence, you need to specify the location of the
PDB using the -pdb option.
8.7 Detecting potential performance improvement opportunities
The +wperfadvice[=1|2|3|4] option generates Performance Advisory diagnostics. The
performance advisory diagnostics are classified within specific levels. You can specify the level of
performance advisory diagnostics to be displayed. The level '1', emits the most important diagnostics
and level '4' emits all diagnostics. The default level is '2'.
54 Categories of diagnostics with examples
Page 55

Example 64 Detecting potential performance improvement opportunities
bash-2.05b$ cat /tmp/example.c
struct X{
int i;
int arr[100];
} x;
int foo( struct X);
int main() {
foo (x); //line 16
}
$ cadvise +wperfadvice aCC -c /example.c
"/example.c", line 16: warning #4319-D: performance advice: passing a
large (404 bytes) parameter by value is inefficient, consider passing
by reference
foo (x);
^
8.7 Detecting potential performance improvement opportunities 55
Page 56

9 Fixing the warnings by source change
The HP Code Advisor Diagnostics Reference Guide document enables you fix the warnings with
a brief description for a partial list of diagnostics emitted by cadvise. In this document, there are
four sections for each description as mentioned below:
• The Cause section
Discusses the possible reasons for the diagnostic to be emitted.
• The Example section
Provides relevant sample code segments that result in the specific diagnostic. The sample code
segments are not complete, compilable programs - you might have to include the necessary
header files, provide the code segment within main() function (if one is not provided in the
code segment) and use necessary compiler options (such as +w, +wlint) to reproduce the
diagnostic.
• The Action section
Suggests possible solutions to avoid the diagnostic.
• The Reference section
Consists of relevant section numbers from the standard document if the diagnostic pertains to
any language standard.
For more information, see HP Code Advisor Diagnostics Reference Guide at the website:
http://www.hp.com/go/cadvise.
56 Fixing the warnings by source change
Page 57

10 Incompatibilities on PA-RISC based systems
On PA-RISC-based systems, a few non-standard source constructs may not be accepted by cadvise.
In such cases, cadvise generates an error and continues processing the next source file. For more
information, see the following page:
aC++ standard conformance and compatibility changes.
In such cases, the best way is to modify the source code so that the code is more standards compliant
and is compilable on platforms based on both Integrity and PA-RISC.
Some of the C99 constructs like variable length arrays, compound literals, and designated initializers
are enabled by default in the HP C compiler on PA-RISC and do not require the -AC99 flag to be
used. However, these constructs result in error when cadvise is used with the HP C compiler. In
such cases, the solution is to pass the -AC99 flag to cc. For example, see the following source
code:
/*vla.c*/
int dep;
int main(){
int arr[dep];
}
The declaration is logically incorrect as the array would have zero size. Initialize the variable dep
with some non-zero positive value as int dep = 128;
Using /opt/cadvise/bin/cadvise cc -c vla.c at the command line generates the
following warning without the -AC99 flag:
"vla.c", line 4: error #2028: expression must have a constant value int arr[dep];
Using /opt/cadvise/bin/cadvise cc -c -AC99 vla.c at the command line suppresses
this warning.
57
Page 58

Index
Symbols
+metrics, 32
+opts <file>, 38
+opts <filename>, 43
+w, 45
+w64bit, 51
+wall, 45
+Warg1[,arg2,...,argn], 25
+Wearg1[,arg2,..,argn], 26
+wendian, 51
+wlint, 45
+wlock, 53
+Wmacro:MACRONAME:d1,d2,d3,..dn, 26
+wperfadvice[=1|2|3|4], 54
+wsecurity[=1|2|3|4], 52
+Wwarg1[,arg2,..,argn], 25
-[no]abort, 42
-all, 28
-approot, 37
-basepdb <basepdbname>, 34
-build, 43
-chseverity <DN1:SL1,DN2:SL2,...,DNn:SLn>, 34
-compiler [aCC|cc|c89|c99|gcc|g++|ld], 42
-diag N1,N2,N3,...,Nn, 30
-exclude <string1:string2:...:stringN>, 31
-file_summary, 28
-help, 42
-html[=<dir>], 29
-include <string1:string2:...:stringN>, 32
-migration, 39
-module <name>, 33
-nobuild, 43
-noheader, 34
-severity N, 31
-summary, 28
-target[=.ext|filename], 43
-tee, 43
-xml[=<filename>], 30
A
Allocator/deallocator mismatch, 50
Analyze diagnostic messages, 40
G
Getting started, 10
I
Incompatibilities on PA-RISC based systems, 57
Indirect call targets, 15
Integrating with Build Process, 12
Integrating with makefiles, 12
M
Multiple PDB reporting, 39
N
Null pointer dereference check, 47
O
Out of bound access, 49
Out of scope access, 49
P
PDB, 19
PDB location, 20
Potential memory leak check, 48
R
Remove object file information from PDB, 20
Report generation, 27
Report options interoperability, 40
S
Signed bit field of length 1, 51
Specify object file location for cross-file analysis, 24
Support for GNU compilers, 9
Supported Compilers, 9
U
Use of pointer after free, 50
W
Wrapper, 12
C
Code complexity metrics, 13
Create PDB Snapshot, 21
Cross-file analysis, 22
Cyclomatic complexity, 15
D
Destroy PDB, 20
Differrent types of diagnostic messages, 13
Disable locks in PDB operations, 20
Display PDB version, 21
58 Index
Page 59

 Loading...