

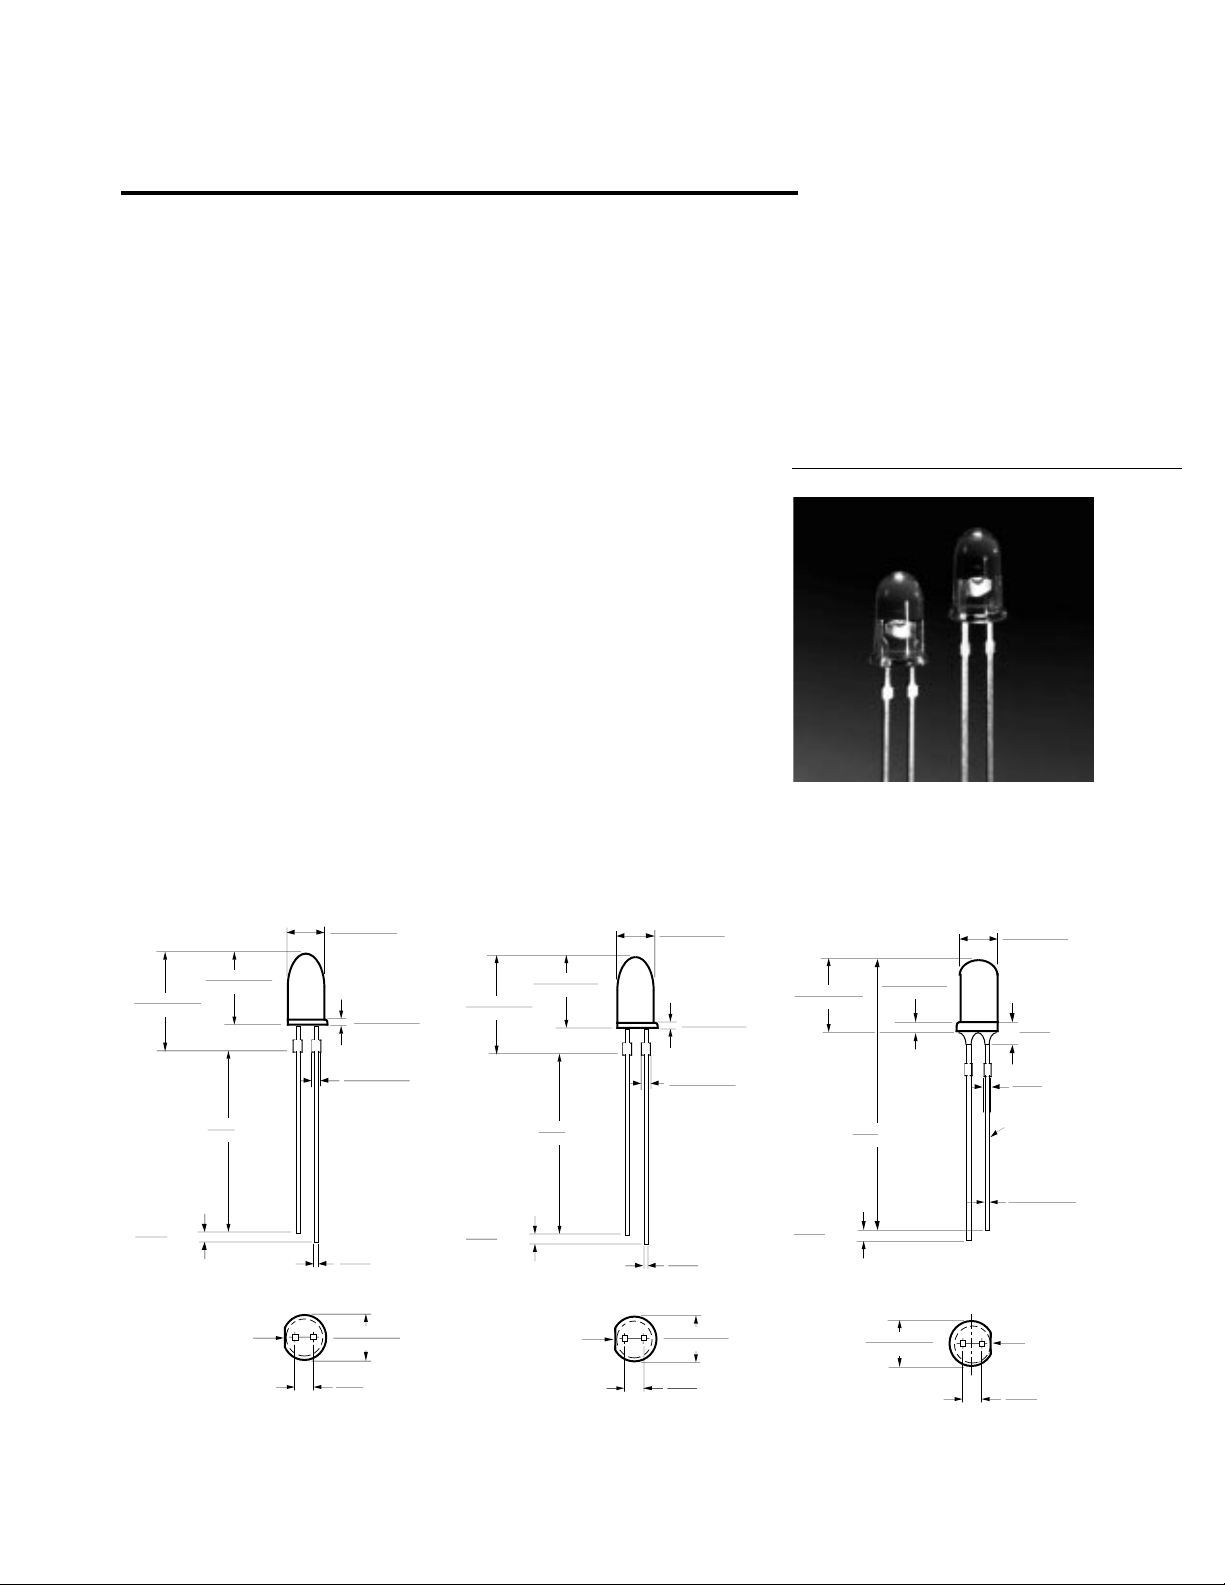
T-13/4 (5 mm) High Performance
TS AlGaAs Red LED Lamps
Technical Data
H
HLMP-810X Series
HLMP-C100
HLMP-C110
Features
• Exceptional Brightness
• Outstanding LED Material
Efficiency
• High Light Output Over a
Wide Range of Drive
Currents
• Viewing Angle: Narrow or
Wide
• Low Forward Voltage
• Low Power Dissipation
• CMOS/MOS Compatible
• Red Color
Package Dimensions
4.82 ± 0.25
(0.190 ± 0.010)
8.80 ± 0.38
(0.347 ± 0.015)
12.3 ± 0.5
(0.485 ± 0.020)
23.0
(0.90)
MIN.
0.76 ± 0.13
(0.030 ± 0.005)
1.17 ± 0.15
(0.046 ± 0.006)
Description
These T-13/4, untinted,
nondiffused lamps utilize a
highly optimized LED material
technology, transparent
substrate aluminum gallium
arsenide (TS AlGaAs). This
LED technology has a very high
luminous efficiency, capable of
producing high light output over
a wide range of drive currents
(500 µA to 50 mA). The color is
deep red at a dominant wavelength of 644 nm. TS AlGaAs is
a flip-chip LED technology, die
attached to the anode lead and
wire bonded to the cathode lead.
4.82 ± 0.25
(0.190 ± 0.010)
8.80 ± 0.38
(0.347 ± 0.015)
11.3 ± 0.5
(0.445 ± 0.020)
23.0
(0.90)
MIN.
0.76 ± 0.13
(0.030 ± 0.005)
1.17 ± 0.15
(0.046 ± 0.006)
8.70 ± 0.20
(0.343 ± 0.008)
31.4
(1.23)
1.14 ± 0.20
(0.045 ± 0.008)
MIN.
5.00 ± 0.20
(0.197 ± 0.008)
2.35
(0.093)
0.70
MAX.
(0.028)
CATHODE
MAX.
1.27
NOM.
(0.050)
CATHODE
0.64
SQUARE
(0.025)
NOMINAL
5.80 ± 0.30
(0.228 ± 0.012)
2.54
NOM.
(0.100)
HLMP-8100
NOTES:
1. ALL DIMENSIONS ARE IN MILLIMETERS/INCHES.
2. THE LEADS ARE MILD STEEL, SOLDER DIPPED.
3. AN EPOXY MENISCUS MAY EXTEND ABOUT 1 mm (0.040") DOWN THE LEADS, UNLESS OTHERWISE NOTED.
1.27
(0.050)
NOM.
CATHODE
HLMP-8102/-8103 HLMP-C100/-C110
1-44
0.64
SQUARE
(0.025)
NOMINAL
5.80 ± 0.30
(0.228 ± 0.012)
2.54
NOM.
(0.100)
1.27
(0.050)
NOM.
5.80 ± 0.20
(0.228 ± 0.008)
0.50 ± 0.10
(0.020 ± 0.004)
2.54
(0.100)
SQUARE
CATHODE
NOM.
5964-9291E
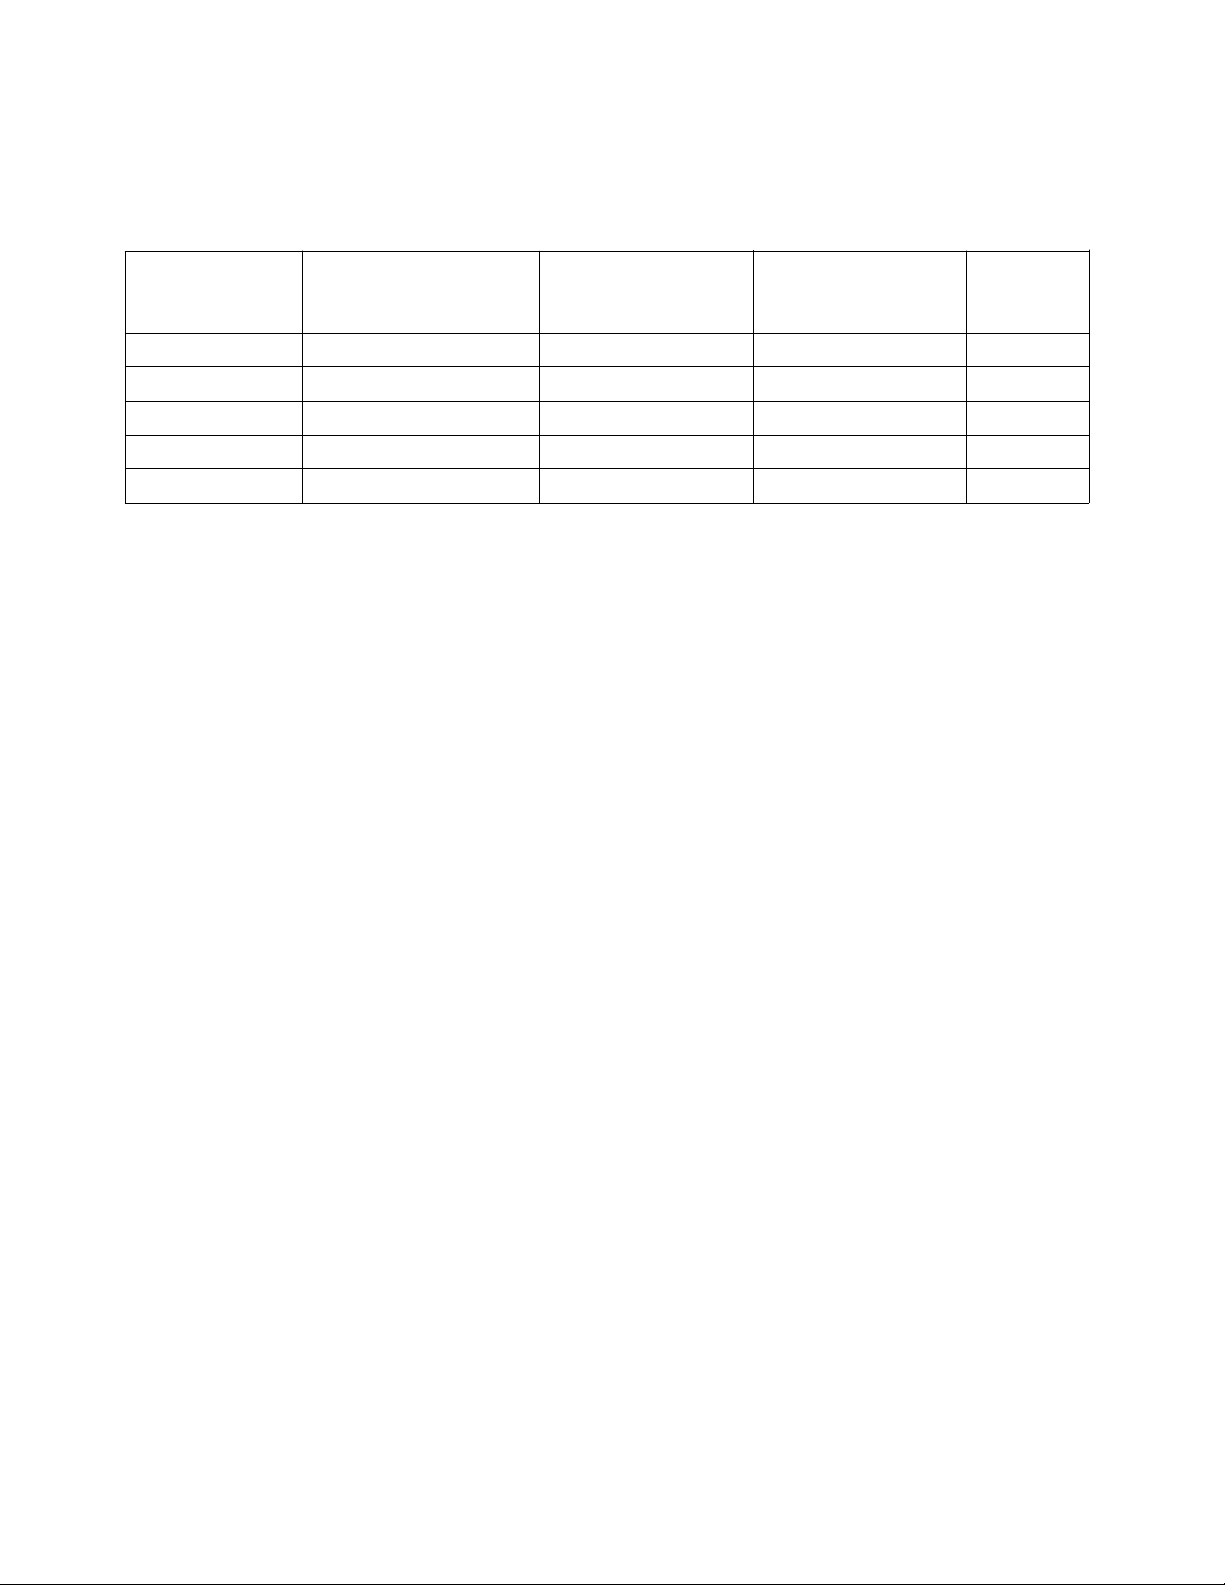
Axial Luminous Intensity and Viewing Angle at T
= 25°C
A
Typical Radiant
Part Number Minimum Intensity Typical Intensity Intensity 2θ1/2
HLMP- (mcd) @ 20 mA (mcd) @ 20 mA (mW/sr) @ 20 mA Degrees
8103 2000 3000 35.3 7
8102 1400 2000 23.5 7
8100 290 1000 11.8 19
C100 290 750 8.8 30
C110 200 400 4.7 40
Note:
1. θ1/2 is the off axis angle from optical centerline where the luminous intensity is 1/2 the on-axis value.
[1]
Absolute Maximum Ratings at T
Peak Forward Current
Average Forward Current (@ I
DC Forward Current
[2]
.......................................................... 300 mA
= 300 mA)
[3]
............................................................... 50 mA
PEAK
= 25°C
A
[1,2]
................... 30 mA
Power Dissipation .................................................................... 100 mW
Reverse Voltage (IR=100 µA) ........................................................... 5 V
Transient Forward Current (10 µs Pulse)
[4]
............................500 mA
Operating Temperature Range ...................................... -55 to +100°C
Storage Temperature Range .......................................... -55 to +100°C
LED Junction Temperature ....................................................... 110°C
Lead Soldering Temperature
[1.6 mm (0.063 in.) from body] .......................... 260°C for 5 seconds
Notes:
1. Maximum I
2. Refer to Figure 6 to establish pulsed operating conditions.
3. Derate linearly as shown in Figure 5.
4. The transient peak current is the maximum non-recurring peak current the device
can withstand without damaging the LED die and wire bonds. It is not
recommended that the device be operated at peak currents above the Absolute
Maximum Peak Forward Current.
at f = 1 kHz, DF = 10%.
AVG
1-45

Electrical/Optical Characteristics at T
= 25°C
A
Description Symbol Min. Typ. Max. Units Test Conditions
Forward Voltage V
Reverse Voltage V
Peak Wavelength λ
Dominant Wavelength
[1]
PEAK
F
R
λ
d
5.0 20.0 V IR = 100 µA
1.85 2.4 V IF = 20 mA
654 nm
644 nm
Spectral Line Halfwidth ∆λ1/2 18 nm
Speed of Response τ
S
45 ns Exponential Time
Constant, e
-t/τ
Capacitance C 20 pF VF = 0, f = 1 MHz
Thermal Resistance
HLMP-810X Rθ
J-PIN
210 °C/W Junction-to-Anode Lead
HLMP-C1X0 237
Luminous Efficacy
Notes:
1. The dominant wavelength, λd, is derived from the CIE chromaticity diagram and represents the color of the device.
2. The radiant intensity, Ie, in watts per steradian, may be found from the equation Ie=IV/ηV, where IV is the luminous intensity in
candelas and ηV is luminous efficacy in lumens/watt
[2]
η
v
85 lm/W
1.0
-1
10
-2
10
RELATIVE INTENSITY
-3
10
500 600 700 1000
WAVELENGTH - nm
Figure 1. Relative Intensity vs. Wavelength.
300
200
100
50
20
10
5
F
I - FORWARD CURRENT - mA
2
1
0 0.5 1.0 1.5 2.0 2.5 3.0
V - FORWARD VOLTAGE - V
F
3.5
Figure 2. Forward Current vs. Forward Voltage.
1-46

2.4
2.0
1.0
0.5
0.2
0.1
(NORMALIZED AT 20 mA)
0.05
RELATIVE LUMINOUS INTENSITY
0.01
0.5
12 51020 50
1.2
1.1
1.0
0.9
0.8
0.7
0.6
0.5
0.4
V
(NORMALIZED AT 20 mA)
0.3
η - RELATIVE EFFICIENCY
0.2
0.1
0.0
1 2 5 10 20 50 100 300
200
I - DC FORWARD CURRENT - mA
F
Figure 3. Relative Luminous Intensity
vs. DC Forward Current.
50
Rθ = 400°C/W
40
30
20
F
I - FORWARD CURRENT - mA
10
0
JA
Rθ = 550°C/W
JA
0 20 40 608010025
T - AMBIENT TEMPERATURE - °C
A
55
Figure 5. Maximum Forward DC
Current vs. Ambient Temperature.
Derating Based on TJMAX = 110°C.
I - PEAK FORWARD CURRENT - mA
PEAK
Figure 4. Relative Efficiency vs. Peak
Forward Current.
50
40
f ≥ 300 Hz
30
20
10
AVG
I = AVERAGE FORWARD CURRENT – mA
0
50 200 250100
I – PEAK FORWARD CURRENT – mA
PEAK
f ≥ 1000 Hz
f ≥ 100 Hz
150
Figure 6. Maximum Average Current
vs. Peak Forward Current.
300
1.0
0.9
0.8
0.7
0.6
0.5
0.4
0.3
0.2
RELATIVE LUMINOUS INTENSITY
0.1
0
100° 90° 80° 70° 60° 50° 40° 30° 20° 10° 0° 10° 20° 30° 40° 50° 60° 70° 80° 90° 100°
θ – ANGLE FROM OPTICAL CENTERLINE – DEGREES (CONE HALF ANGLE)
Figure 7. Relative Luminous Intensity vs. Angular Displacement. HLMP-8103
and HLMP-8102.
1-47

1.0
0.9
0.8
0.7
0.6
0.5
0.4
0.3
0.2
RELATIVE LUMINOUS INTENSITY
0.1
0
100° 90° 80° 70° 60° 50° 40° 30° 20° 10° 0° 10° 20° 30° 40° 50° 60° 70° 80° 90° 100°
θ – ANGLE FROM OPTICAL CENTERLINE – DEGREES (CONE HALF ANGLE)
Figure 8. Relative Luminous Intensity vs. Angular Displacement. HLMP-8100.
1.0
0.9
0.8
0.7
0.6
0.5
0.4
0.3
0.2
RELATIVE LUMINOUS INTENSITY
0.1
0
100° 90° 80° 70° 60° 50° 40° 30° 20° 10° 0° 10° 20° 30° 40° 50° 60° 70° 80° 90° 100°
θ – ANGLE FROM OPTICAL CENTERLINE – DEGREES (CONE HALF ANGLE)
Figure 9. Relative Luminous Intensity vs. Angular Displacement. HLMP-C100.
1.0
0.9
0.8
0.7
0.6
0.5
0.4
0.3
0.2
RELATIVE LUMINOUS INTENSITY
0.1
0
100° 90° 80° 70° 60° 50° 40° 30° 20° 10° 0° 10° 20° 30° 40° 50° 60° 70° 80° 90° 100°
θ – ANGLE FROM OPTICAL CENTERLINE – DEGREES (CONE HALF ANGLE)
Figure 10. Relative Luminous Intensity vs. Angular Displacement. HLMP-C110.
1-48
 Loading...