

Page 1

HPE Integrity Superdome X Service Guide for Users
Abstract
This guide describes the HPE Integrity Superdome X and provides user service information.
Part Number: 794235-009
Published: November 2018
Edition: Ninth
Page 2

Contents
HPE Integrity Superdome X overview................................................... 8
System specifications.......................................................................... 23
Complex components................................................................................................................... 8
Power subsystem..........................................................................................................................8
Powering off the compute enclosure..................................................................................8
Manageability subsystem..............................................................................................................9
Server blades................................................................................................................................9
I/O subsystem............................................................................................................................... 9
Compute enclosure overview......................................................................................................10
Server blade overview................................................................................................................ 20
Dimensions and weights............................................................................................................. 23
Rack specifications..................................................................................................................... 24
Internal and external site door requirements.............................................................................. 24
Electrical specifications...............................................................................................................25
Environmental specifications...................................................................................................... 28
Temperature and humidity specifications......................................................................... 28
Cooling requirements....................................................................................................... 29
Air quality specifications...................................................................................................29
Acoustic noise specifications........................................................................................... 29
Sample site inspection checklist for site preparation.................................................................. 30
Updating firmware.................................................................................34
Prerequisites............................................................................................................................... 34
Installing the latest complex firmware using SUM...................................................................... 34
Manually updating the complex firmware....................................................................................34
Download firmware bundle...............................................................................................35
Update the complex firmware.......................................................................................... 35
I/O firmware and drivers...................................................................................................36
SMH and WBEM providers.............................................................................................. 36
Drivers and firmware for other devices.............................................................................36
Superdome X operating systems........................................................ 37
OSs supported............................................................................................................................ 37
Using Microsoft Windows Server................................................................................................ 38
Using VMware.............................................................................................................................38
Using Red Hat Linux................................................................................................................... 38
Using SuSE Linux....................................................................................................................... 38
Partitioning............................................................................................ 39
Partition Identification..................................................................................................................39
Partition Number......................................................................................................................... 39
Partition Name............................................................................................................................ 39
Partition Power Operations......................................................................................................... 39
PARSTATUS............................................................................................................................... 40
2
Page 3

UUID for nPartitions.................................................................................................................... 40
nPartition states.......................................................................................................................... 40
nPartition runstate.......................................................................................................................41
nPartition and resource health status......................................................................................... 42
Troubleshooting.................................................................................... 44
General troubleshooting methodology........................................................................................ 44
LED status information.....................................................................................................44
OA access........................................................................................................................44
OA CLI..............................................................................................................................44
Gathering power related information................................................................................45
Gathering cooling related information.............................................................................. 47
Gathering failure information............................................................................................49
Recommended troubleshooting methodology............................................................................ 50
Developer log collection................................................................................................... 51
Troubleshooting tables................................................................................................................52
Troubleshooting tools..................................................................................................................57
LEDs and components.....................................................................................................57
OA GUI.............................................................................................................................65
Health Repository viewer............................................................................................................ 65
Indictment Records.......................................................................................................... 65
Acquitting indictments...................................................................................................... 66
Viewing the list of indicted components........................................................................... 67
Viewing deconfigured components.................................................................................. 67
Viewing indictment acquittals........................................................................................... 68
Viewing recent service history..........................................................................................68
Physical Location installation and health history..............................................................68
Subcomponent isolation and deconfiguration displays.................................................... 70
Using event logs......................................................................................................................... 75
Live viewer....................................................................................................................... 75
SEL and FPL viewers.......................................................................................................77
Core Analysis Engine.......................................................................................................80
OA.................................................................................................................................... 82
Troubleshooting processors........................................................................................................84
Troubleshooting memory............................................................................................................ 85
Troubleshooting cards and drivers..............................................................................................87
Troubleshooting compute enclosure events............................................................................... 87
Troubleshooting firmware............................................................................................................88
Identifying and troubleshooting firmware issues.............................................................. 88
Verifying and installing the latest firmware version.......................................................... 89
System firmware...............................................................................................................89
FRU replacement firmware update procedures............................................................... 90
I/O firmware......................................................................................................................92
Interconnect module firmware..........................................................................................93
Troubleshooting partitions...........................................................................................................94
Troubleshooting the network.......................................................................................................94
Troubleshooting fabric issues..................................................................................................... 96
Troubleshooting clock-related issues..........................................................................................97
Troubleshooting MCAs................................................................................................................97
Troubleshooting the blade interface (system console)................................................................98
Websites.............................................................................................. 100
3
Page 4

Support and other resources.............................................................101
Accessing Hewlett Packard Enterprise Support....................................................................... 101
Accessing updates....................................................................................................................101
Customer self repair..................................................................................................................102
Remote support........................................................................................................................ 102
Warranty information.................................................................................................................102
Regulatory information..............................................................................................................103
Documentation feedback.......................................................................................................... 103
Utilities................................................................................................. 104
UEFI..........................................................................................................................................104
UEFI Shell and POSSE commands..........................................................................................104
Boot Maintenance Manager......................................................................................................108
Onboard Administrator.............................................................................................................. 110
Connecting to the OA with a local PC............................................... 111
Connecting a PC to the OA service port....................................................................................111
Connecting a PC to the OA serial port...................................................................................... 112
Modifying the serial connection baud rate.................................................................................113
Insight Display.....................................................................................114
Insight Display overview............................................................................................................114
Navigating the Insight Display...................................................................................................114
Health Summary screen.................................................................................................116
Enclosure Settings screen..............................................................................................117
Enclosure Info screen.....................................................................................................117
Blade and Port Info screen.............................................................................................118
Turn Enclosure UID On/Off screen.................................................................................119
View User Note screen...................................................................................................120
Chat Mode screen..........................................................................................................120
Insight Display errors................................................................................................................ 121
Power errors...................................................................................................................121
Cooling errors.................................................................................................................122
Location errors............................................................................................................... 122
Configuration errors....................................................................................................... 122
Device failure errors....................................................................................................... 122
Warranty and regulatory information................................................124
Warranty information.................................................................................................................124
Regulatory information..............................................................................................................124
Belarus Kazakhstan Russia marking............................................................................. 124
Turkey RoHS material content declaration.....................................................................125
Ukraine RoHS material content declaration................................................................... 125
Standard terms, abbreviations, and acronyms................................ 126
4
Page 5

©
Copyright 2014, 2017 Hewlett Packard Enterprise Development LP
Notices
The information contained herein is subject to change without notice. The only warranties for Hewlett
Packard Enterprise products and services are set forth in the express warranty statements accompanying
such products and services. Nothing herein should be construed as constituting an additional warranty.
Hewlett Packard Enterprise shall not be liable for technical or editorial errors or omissions contained
herein.
Confidential computer software. Valid license from Hewlett Packard Enterprise required for possession,
use, or copying. Consistent with FAR 12.211 and 12.212, Commercial Computer Software, Computer
Software Documentation, and Technical Data for Commercial Items are licensed to the U.S. Government
under vendor's standard commercial license.
Links to third-party websites take you outside the Hewlett Packard Enterprise website. Hewlett Packard
Enterprise has no control over and is not responsible for information outside the Hewlett Packard
Enterprise website.
Acknowledgments
Intel®, Itanium®, Pentium®, Xeon®, Intel Inside®, and the Intel Inside logo are trademarks of Intel
Corporation in the U.S. and other countries.
Microsoft® and Windows® are either registered trademarks or trademarks of Microsoft Corporation in the
United States and/or other countries.
Adobe® and Acrobat® are trademarks of Adobe Systems Incorporated.
Java® and Oracle® are registered trademarks of Oracle and/or its affiliates.
UNIX® is a registered trademark of The Open Group.
Revision History
HPE Part
Number
794235–001 First December 2014
794235–002 Second March 2015
Edition Publication Date Changes
Table Continued
Page 6

HPE Part
Number
Edition Publication Date Changes
794235–003 Third September 2015
794235–004 Fourth January 2016
• Added BL920s Gen9 blade support
• Added SLES 11 SP4 and SLES 12 OS
support
• Added RHEL 6.6, RHEL 6.7, and RHEL
7.1 OS support
• Added Windows 2012 R2 OS support
(Gen8)
• Added ESXi OS support (Gen8)
• Moved firmware update information from
installation chapter to dedicated chapter.
Refer to firmware matrix and release
notes for correct information.
• Removed detailed SLES boot/shutdown
information and add reference to Linux
and Windows white papers.
• Minor text changes and clarifications
throughout
794235–005 Fifth July 2016
• Added details for safely powering off an
enclosure
• Added BL920s Gen9+ blade support
• Added FlexFabric 20 Gb 2P 650FLB and
650M adapter support
• Added note about scrolling the Insight
Display
• Added instructions to save EFI variables
to disk
• Added sections on troubleshooting the
OA battery
• Updated illustrations for new HPE
standards.
• Updated Insight Display screens.
• Added troubleshooting scenario where
PXE fails to find the boot file.
• Updated references to the new XFM2
crossbar modules.
Table Continued
Page 7

HPE Part
Number
Edition Publication Date Changes
794235–006 Sixth September 2016
794235–007 Seventh November 2016
794235–008 Eighth April 2017
• Updated access to OS white papers for
firmware updates
• Updated Insight Display screenshots
• Included component ID for both XFM and
XFM2 modules
• Added notes that both XFM and XFM2
modules are referred to as XFM in this
document and not to mix module types in
the same system
• Updated OS support list
• Added links to current OS and spare
parts information
• Added vSphere 6.0U3 and RHEL 6.9 in
OSs supported
• Added XFM2 firmware version in FRU
replacement firmware update
procedures
794235-009 Ninth November 2018 Updated Health LED in LEDs and
components
Page 8
HPE Integrity Superdome X overview
HPE Integrity Superdome X is a blade-based, high-end server platform supporting the x86 processor
family which incorporates a modular design and uses the sx3000 crossbar fabric to interconnect
resources. The system also includes remote system management functionality through the HPE Onboard
Administrator (OA), which helps monitor and manage complex resources.
Integrity Superdome X supports the SuSE Linux Enterprise Server, Red Hat Enterprise Linux, and
Microsoft Windows OSs, as well as VMware ESXi. For the latest list of supported OSs, see the HPE
Integrity Superdome X Operating System Reference at
(Servers > Integrity Servers > Integrity Superdome X) or Firmware Matrix for HPE Integrity
Superdome X servers.
Complex components
Integrity Superdome X consists of a single compute enclosure containing one to eight BL920s Gen8 or
Gen9 blades. It also includes interconnect modules, manageability modules, fans, power supplies, and an
integrated LCD Insight Display. The Insight Display can be used for basic enclosure maintenance and
displays the overall enclosure health. The compute enclosure supports four XFMs that provide the
crossbar fabric which carries data between blades.
NOTE: HPE Integrity Superdome X systems may contain XFM or XFM2 crossbar modules. Unless
specifically stated otherwise, this document refers to all crossbar modules as XFMs, but the information
will generally apply to either XFM or XMF2 modules.
http://www.hpe.com/info/enterprise/docs
More information
Integrity Superdome X QuickSpecs
Power subsystem
The Integrity Superdome X compute enclosure supports two power input modules, using either single
phase or 3-phase power cords. Connecting two AC sources to each power input module provides 2N
redundancy for AC input and DC output of the power supplies.
There are 12 power supplies per Integrity Superdome X compute enclosure. Six power supplies are
installed in the upper section of the enclosure, and six power supplies are installed in the lower section of
the enclosure.
More information
Integrity Superdome X QuickSpecs
Powering off the compute enclosure
IMPORTANT: To power off the enclosure, disconnect the power cables from the lower power
supplies first, and then disconnect the power cables from the upper power supplies.
To service any internal compute enclosure component, complete the following steps in order:
Procedure
1. Power off the partition.
2. Power off all XFMs.
8 HPE Integrity Superdome X overview
Page 9

3. Disconnect the power cables from the lower power supplies.
4. Disconnect the power cables from the upper power supplies.
Manageability subsystem
The Integrity Superdome X is managed by two OAs that monitor both individual components and complex
health. This information can be accessed in the following ways:
• A GUI using a remote terminal
• A CLI using a remote or local terminal
NOTE: Only one OA is required for operation. The second OA provides redundancy and automatic
failover capabilities.
Two GPSMs in the Integrity Superdome X enclosure manage CAMNET distribution to all server blades
and XFMs in the complex and provide the redundant global clock source for the complex. Fans and
power supplies in the upper section of the enclosure are monitored and controlled by the OA through the
GPSMs.
More information
Integrity Superdome X QuickSpecs
Server blades
Each BL920s server blade contains two x86 processors and up to 48 DIMMs.
Server blades and partitions
Integrity Superdome X supports multiple nPartitions of 2, 4, 6, 8, 12, or 16 sockets (1, 2, 3, 4, 6, or 8
blades). Each nPartition must include blades of the same type but the system can include nPartitions with
different blade types.
More information
Integrity Superdome X QuickSpecs
I/O subsystem
Integrity Superdome X provides I/O through mezzanine cards and FlexLOMs on individual server blades.
Each BL920s blade has two FLB slots and three Mezzanine slots.
FLB slots can contain any of these cards:
• HPE FlexFabric 10 Gb 2–port 534FLB Adapter (BL920s Gen8)
• HPE Ethernet 10 Gb 2–port 560FLB
• HPE FlexFabric 20 Gb 2P 630FLB (BL920s Gen9)
• HPE FlexFabric 20 Gb 2P 650FLB (BL920s Gen9)
Mezzanine slots can contain any of these cards:
• HPE FlexFabric 10 Gb 2–port 534M Adapter (BL920s Gen8)
• HPE Ethernet 10 Gb 2–port 560M
HPE Integrity Superdome X overview 9
Page 10

• HPE FlexFabric 20 Gb 2P 630M (BL920s Gen9)
• HPE FlexFabric 20 Gb 2P 650M (BL920s Gen9)
• HPE QMH2672 16 Gb 2P FC HBA
• Infiniband HPE IB FDR 2P 545M (BL920s Gen9)
Not all types of cards are supported on Gen8 and Gen9 blades. For a complete list of supported I/O cards
and firmware requirements, see the Firmware Matrix for HPE Integrity Superdome X servers at http://
www.hpe.com/info/superdomeX-firmware-matrix.
Fibre channel and LAN connectivity are supported by the interconnect modules in the rear of the compute
enclosure. For more information, see
More information
• Interconnect bay numbering
• Integrity Superdome X QuickSpecs
• Firmware Matrix for HPE Integrity Superdome X servers
• Connecting a PC to the OA service port
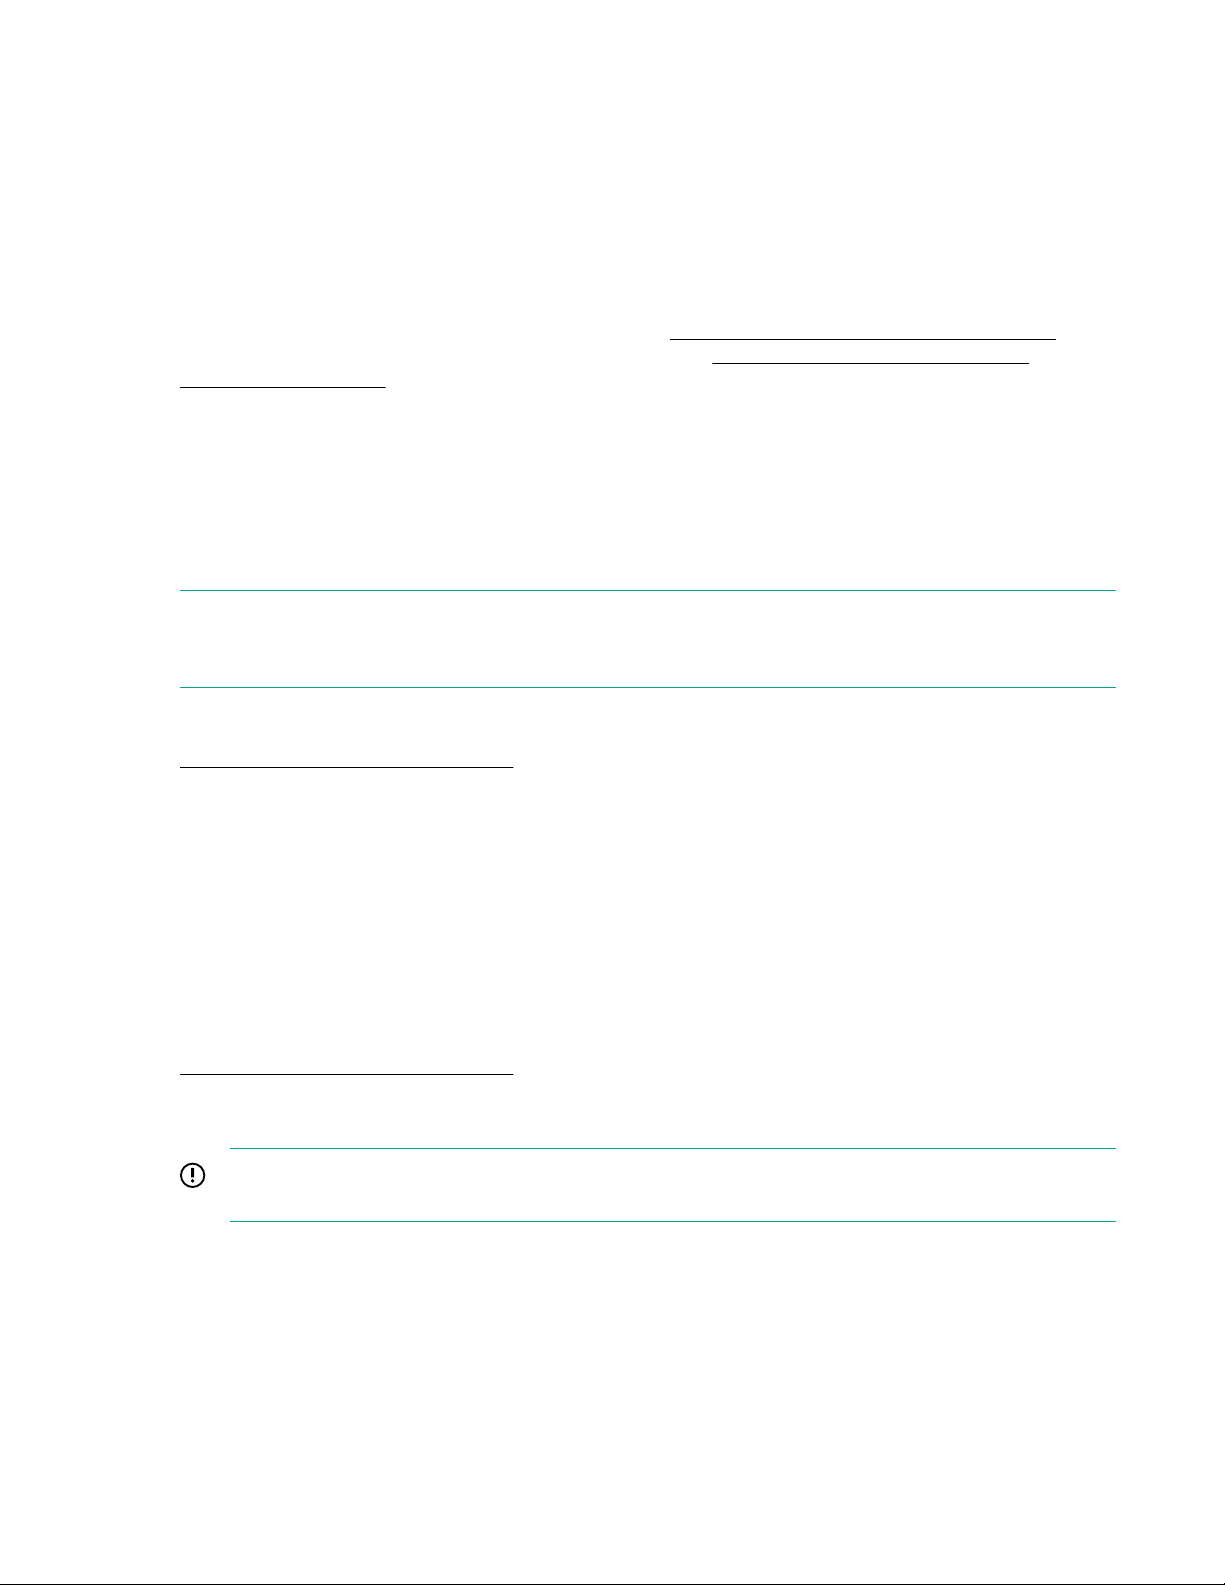
Compute enclosure overview
Compute enclosure front components
NOTE: Images might not represent supported configurations.
10 HPE Integrity Superdome X overview
Page 11
Item Description
1 Power supply bay 7
2 Power supply bay 8
3 Power supply bay 9
4 Power supply bay 10
5 Power supply bay 11
6 Power supply bay 12
HPE Integrity Superdome X overview 11
Table Continued
Page 12

Item Description
7 DVD module
8 Air intake slot (Do not block)
9 Power supply bay 6
10 Power supply bay 5
11 Insight Display
12 Power supply bay 4
13 Power supply bay 3
14 Power supply bay 2
15 Power supply bay 1
16 Blade slots
17 Air intake slot (Do not block)
12 HPE Integrity Superdome X overview
Page 13
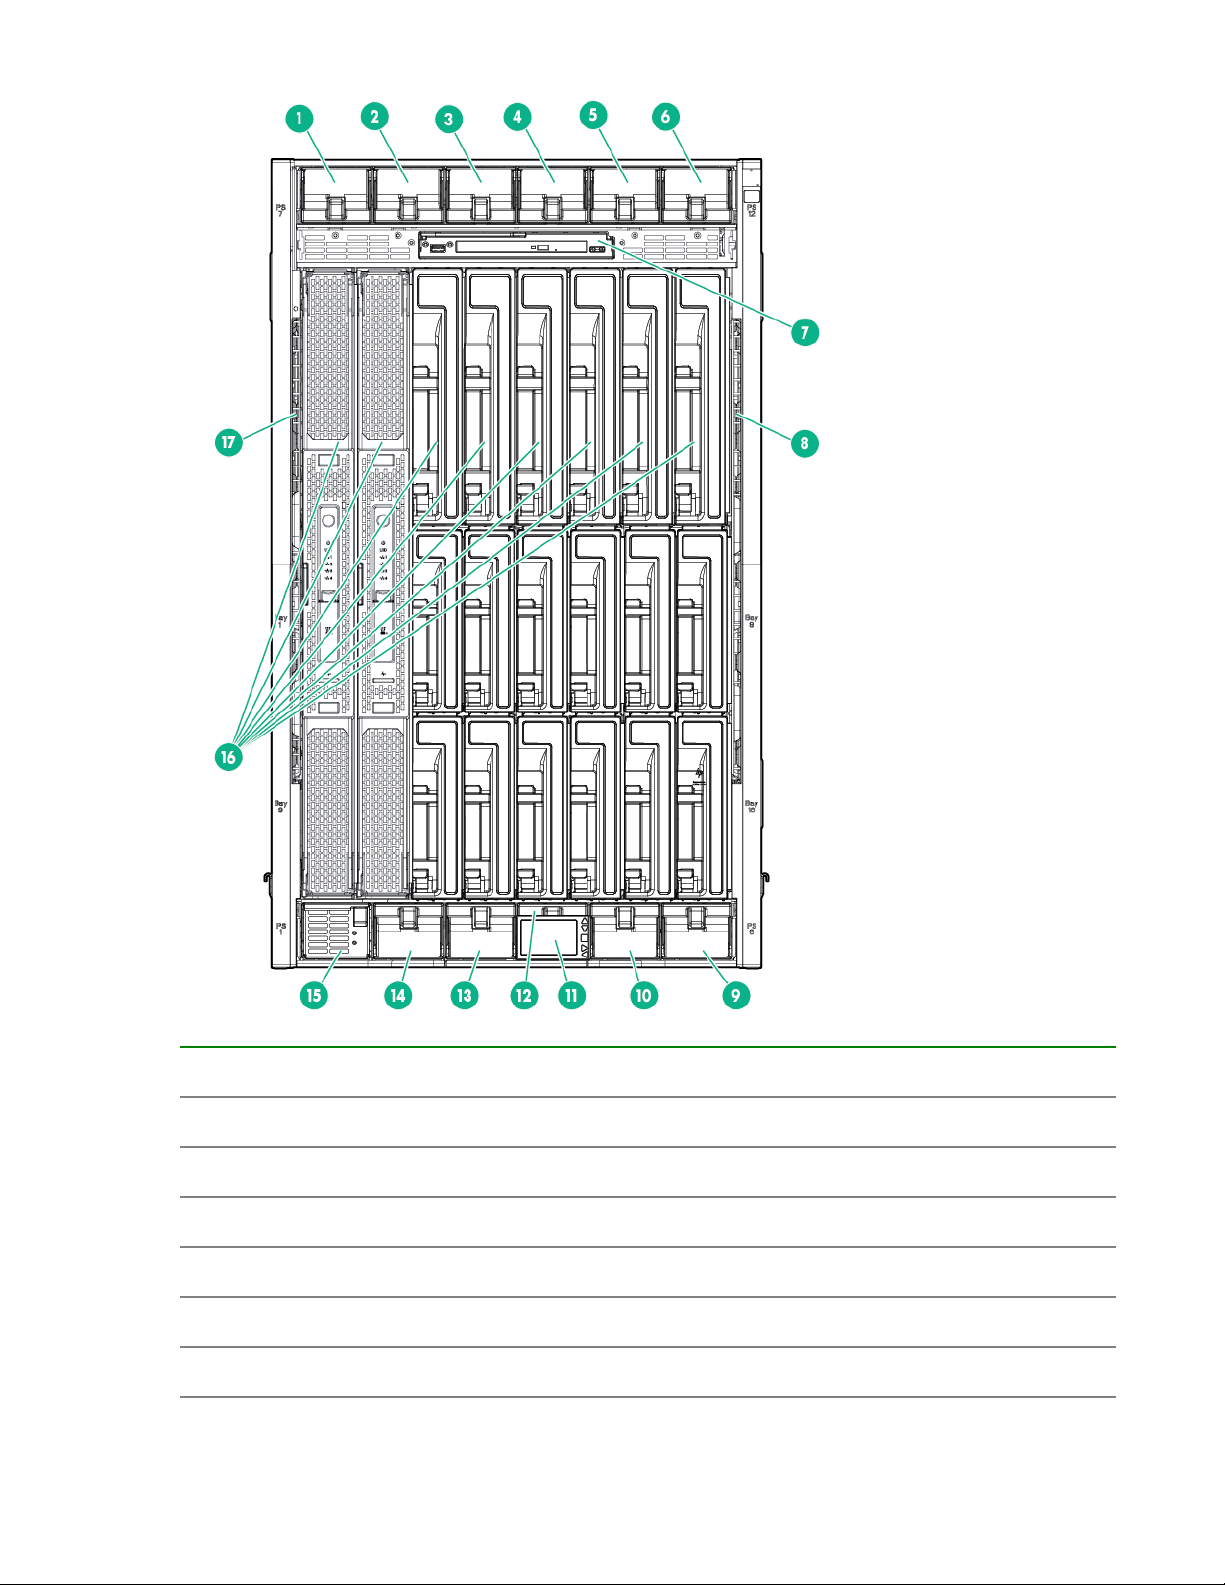
Power supply bay numbering
HPE Integrity Superdome X overview 13
Page 14

Server blade slot numbering
14 HPE Integrity Superdome X overview
Page 15
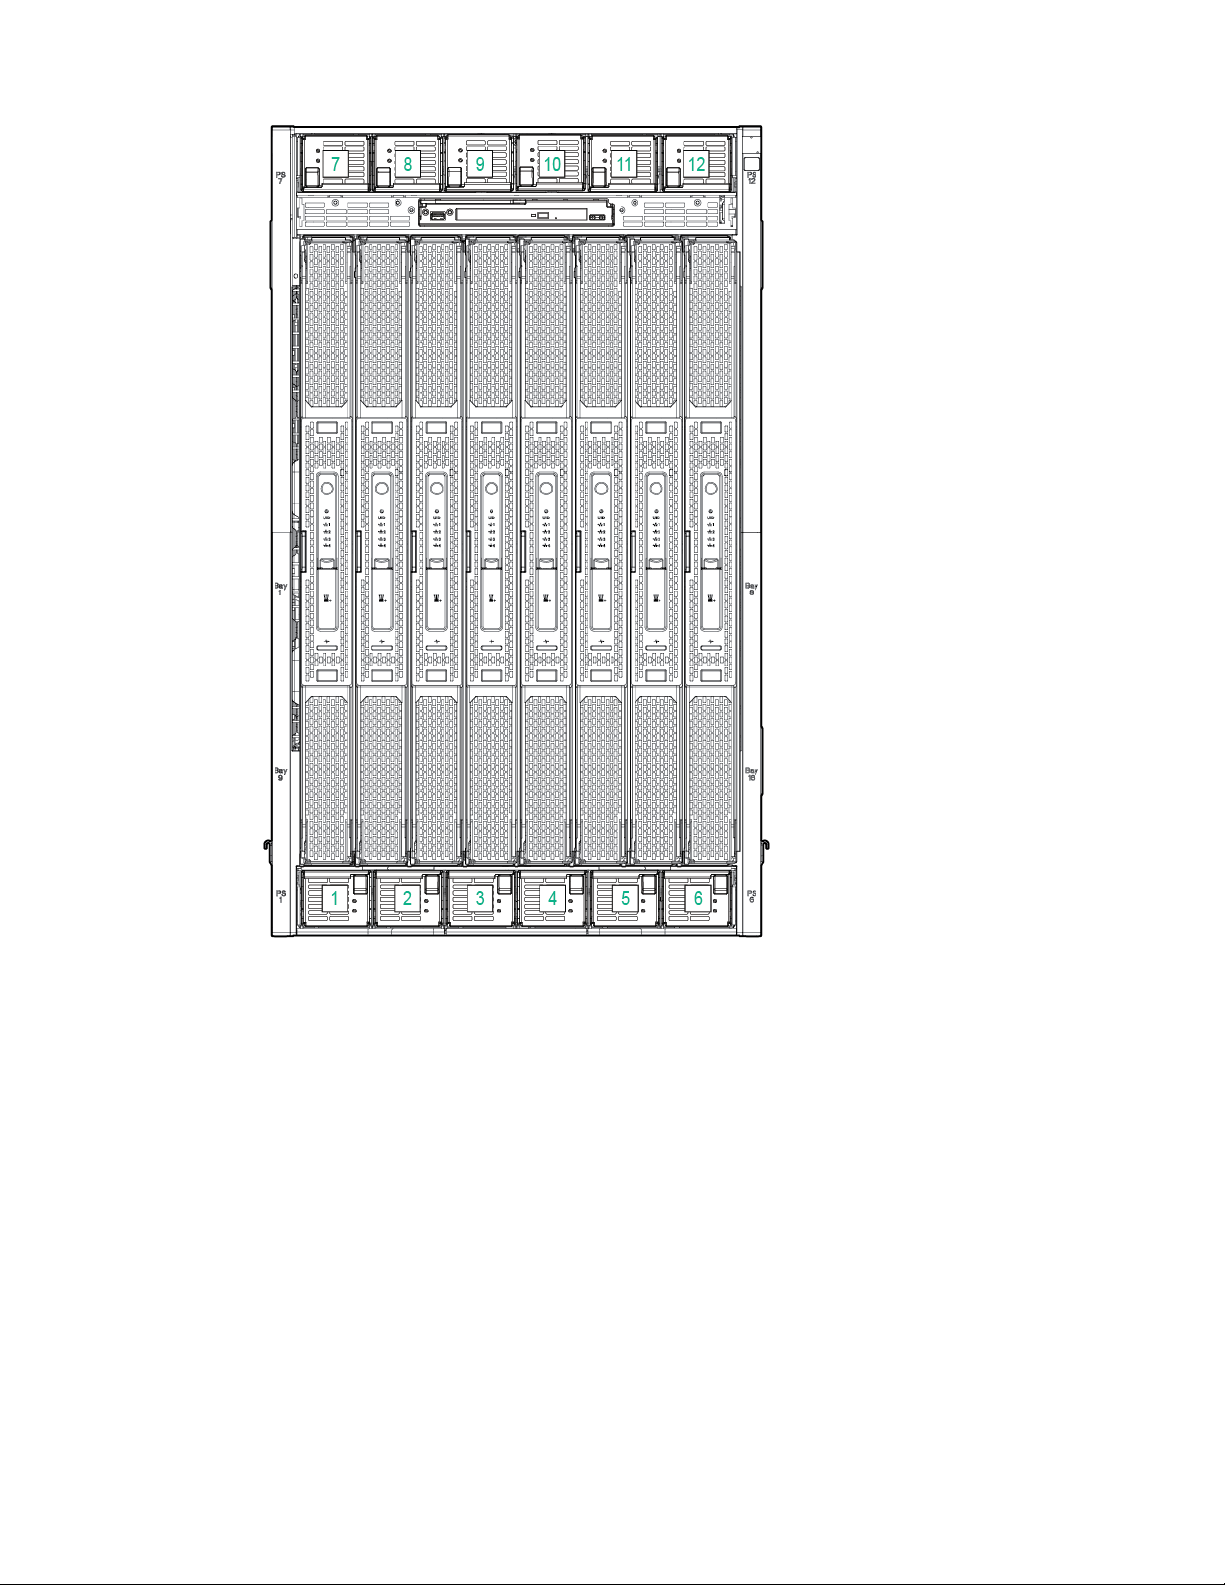
Insight Display components
Item Description Function
1 Insight Display screen Displays Main Menu error
messages and instructions
2 Left arrow button Moves the menu or navigation
bar selection left one position
3 Right arrow button Moves the menu or navigation
bar selection right one position
4 OK button Accepts the highlighted selection
and navigates to the selected
menu
5 Down arrow button Moves the menu selection down
one position
6 Up arrow button Moves up the menu selection one
position
HPE Integrity Superdome X overview 15
Page 16
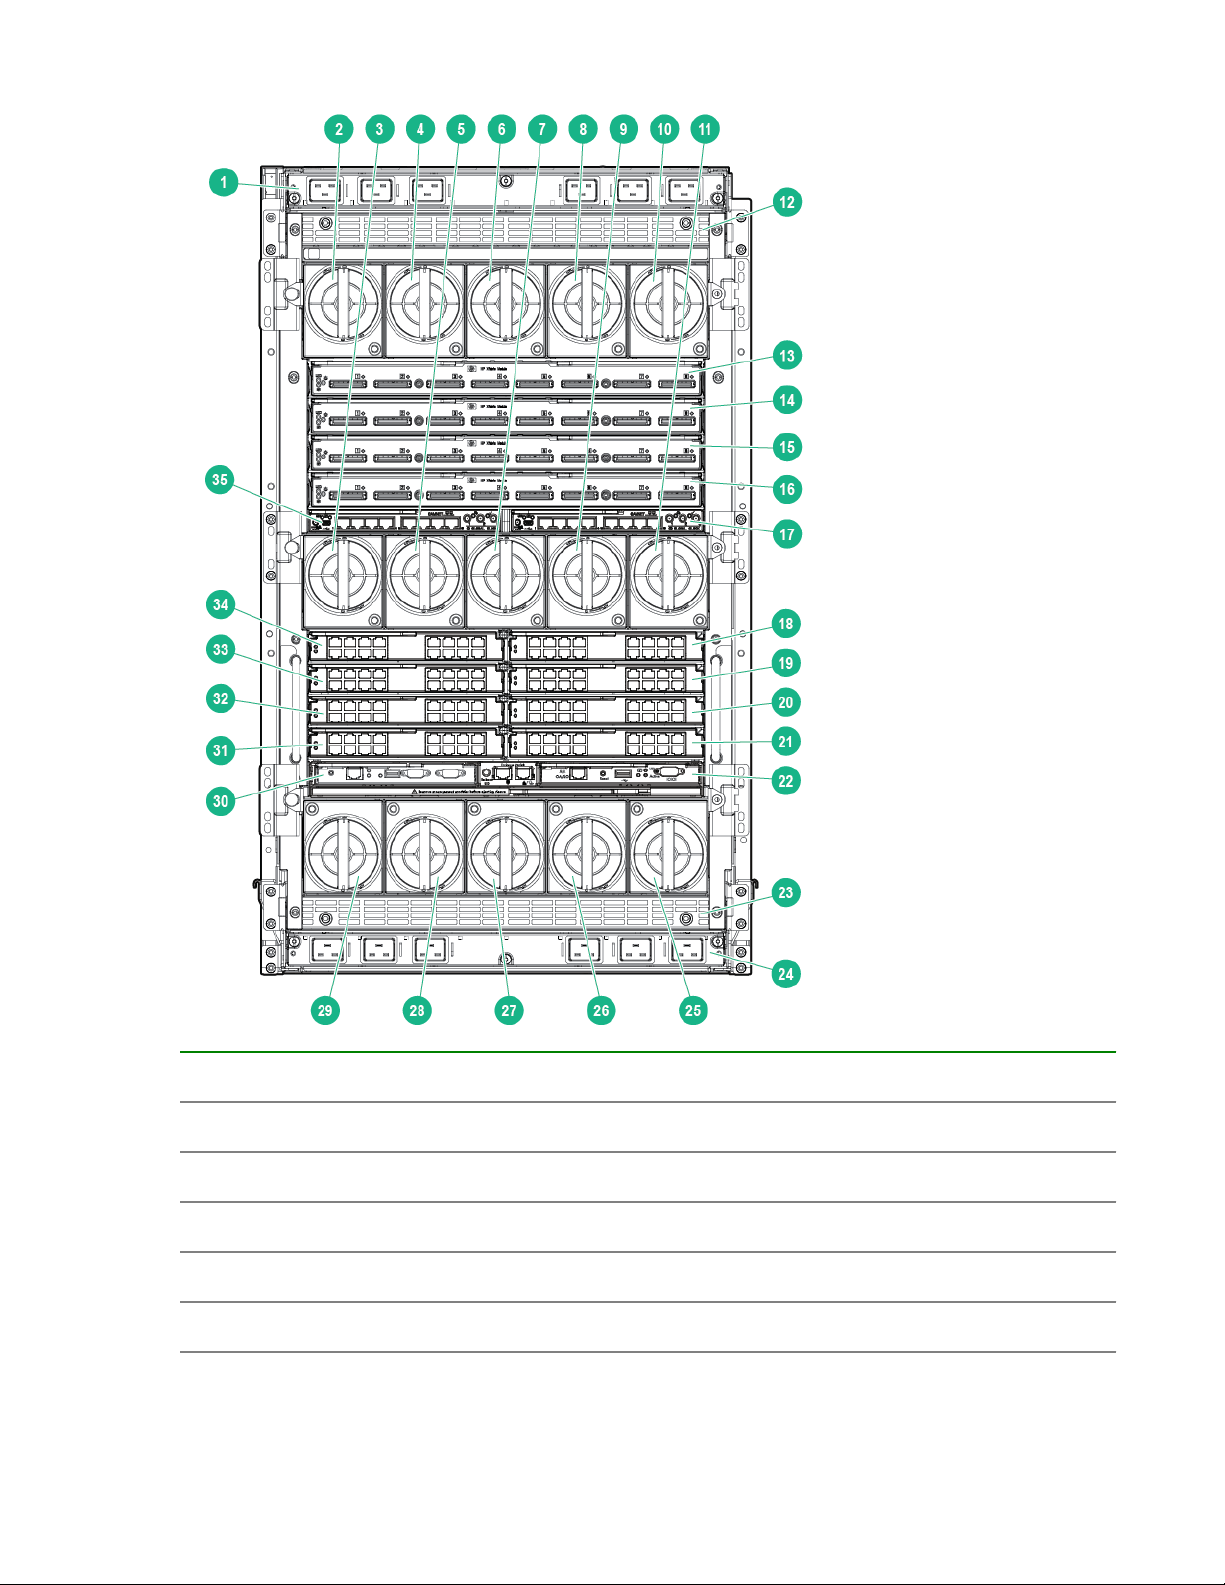
Compute enclosure rear components
Item Description
1 AC power connectors (upper)
2 Fan bay 1
3 Fan bay 6
4 Fan bay 2
5 Fan bay 7
16 HPE Integrity Superdome X overview
Table Continued
Page 17

Item Description
6 Fan bay 3
7 Fan bay 8
8 Fan bay 4
9 Fan bay 9
10 Fan bay 5
11 Fan bay 10
12 Power supply exhaust vent (Do not block)
13 XFM bay 1
14 XFM bay 2
15 XFM bay 3
16 XFM bay 4
17 GPSM bay 2
18 Interconnect bay 2
19 Interconnect bay 4
20 Interconnect bay 6
21 Interconnect bay 8
22 OA bay 2
23 Power supply exhaust vent (Do not block)
24 AC power connectors (lower)
25 Fan bay 15
26 Fan bay 14
27 Fan bay 13
28 Fan bay 12
29 Fan bay 11
30 OA bay 1
Table Continued
HPE Integrity Superdome X overview 17
Page 18
Item Description
31 Interconnect bay 7
32 Interconnect bay 5
33 Interconnect bay 3
34 Interconnect bay 1
35 GPSM bay 1
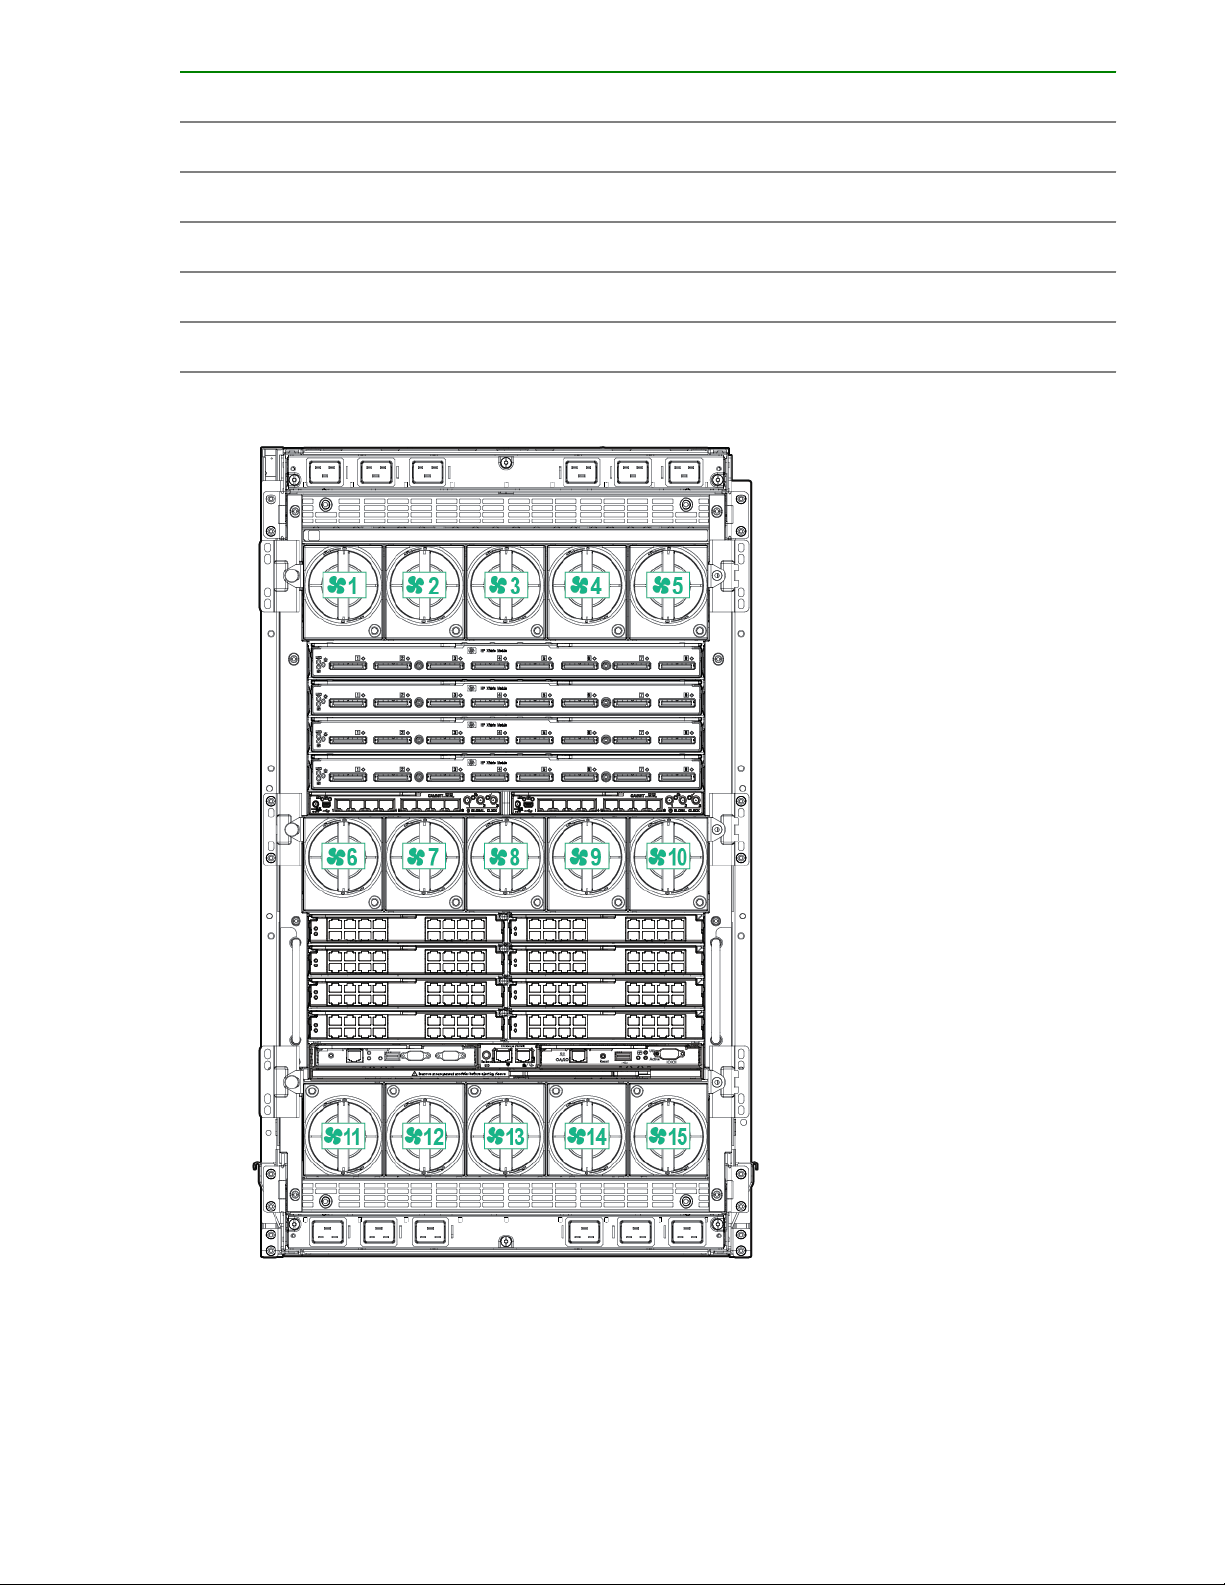
Fan bay numbering
Interconnect bay numbering
Each Integrity Superdome X enclosure requires interconnect modules to provide network access for data
transfer. Interconnect modules reside in bays located in the rear of the enclosure. Review blade slot
numbering to determine which external network connections on the interconnect modules are active.
18 HPE Integrity Superdome X overview
Page 19
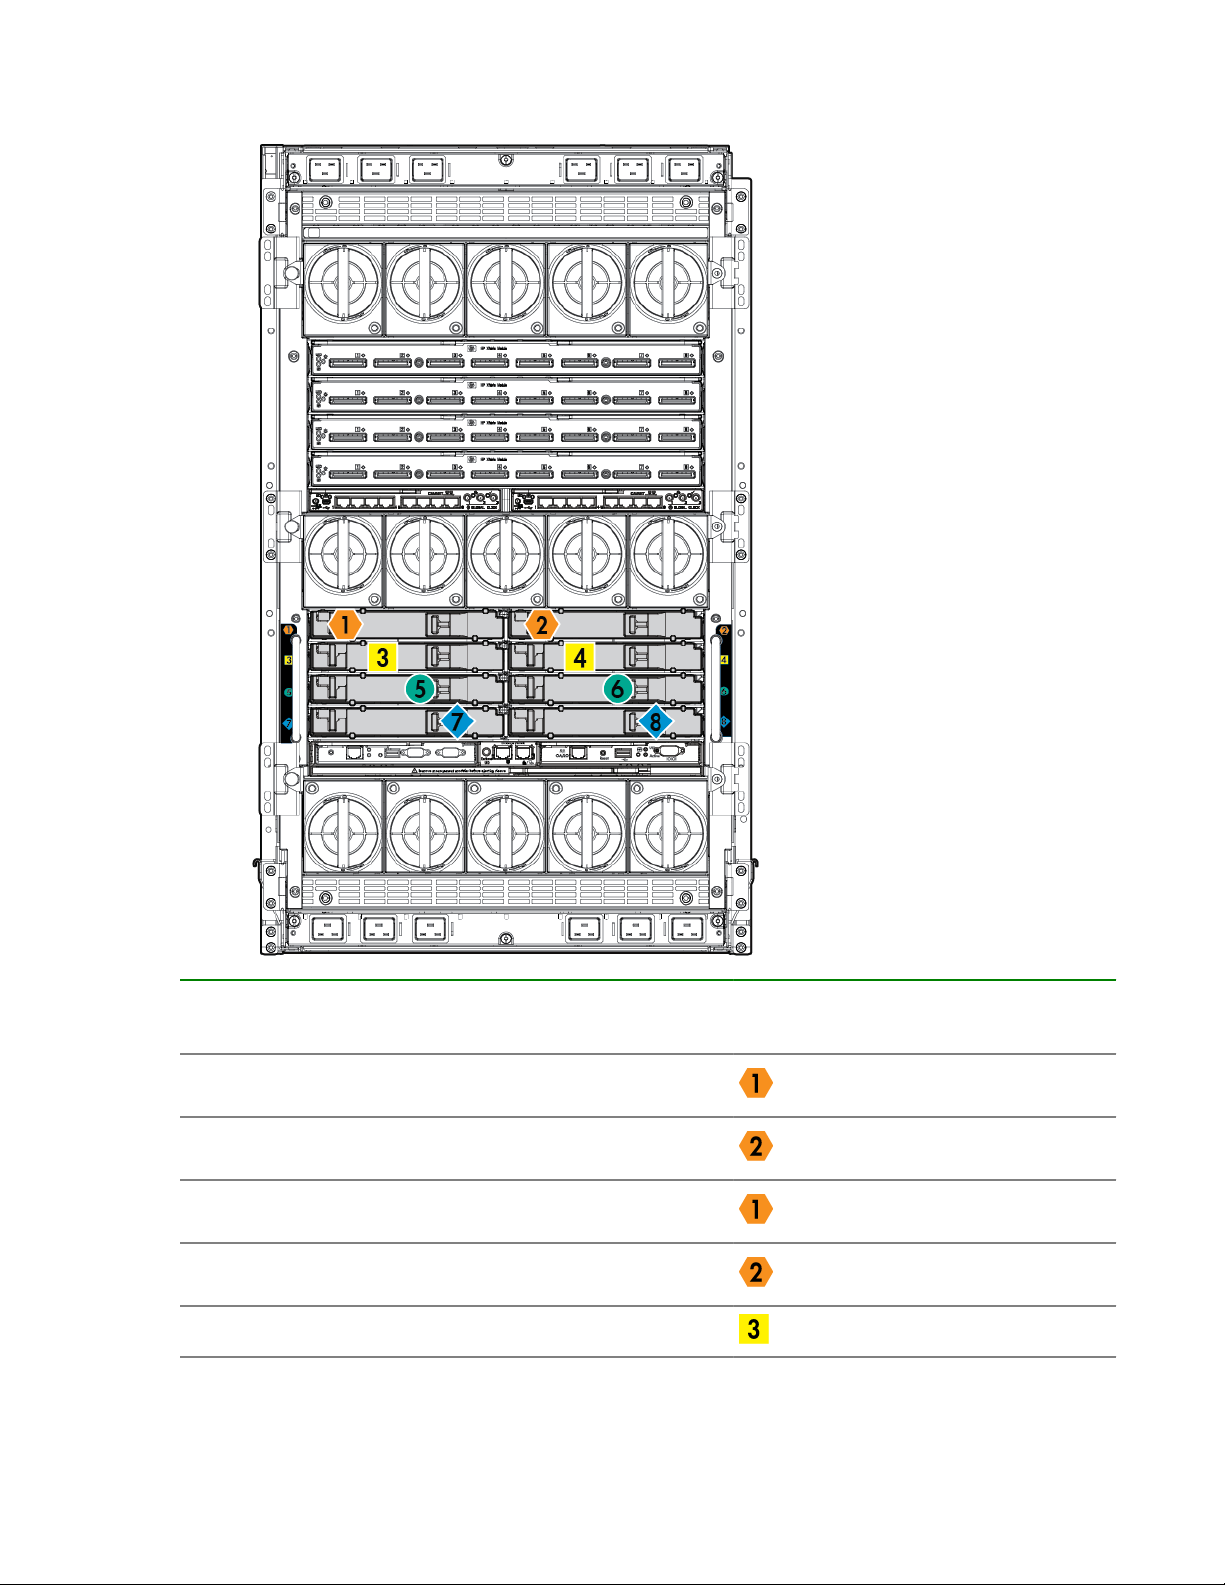
To support server blade LAN and Fibre Channel I/O connections, an appropriate type of interconnect
module is installed according to bay location.
Server blade port Compute enclosure
interconnect bay
FlexLOM 1 port 1 1
FlexLOM 1 port 2 2
FlexLOM 2 port 1 1
FlexLOM 2 port 2 2
Mezzanine 1 port 1 3
Interconnect bay label
Table Continued
HPE Integrity Superdome X overview 19
Page 20
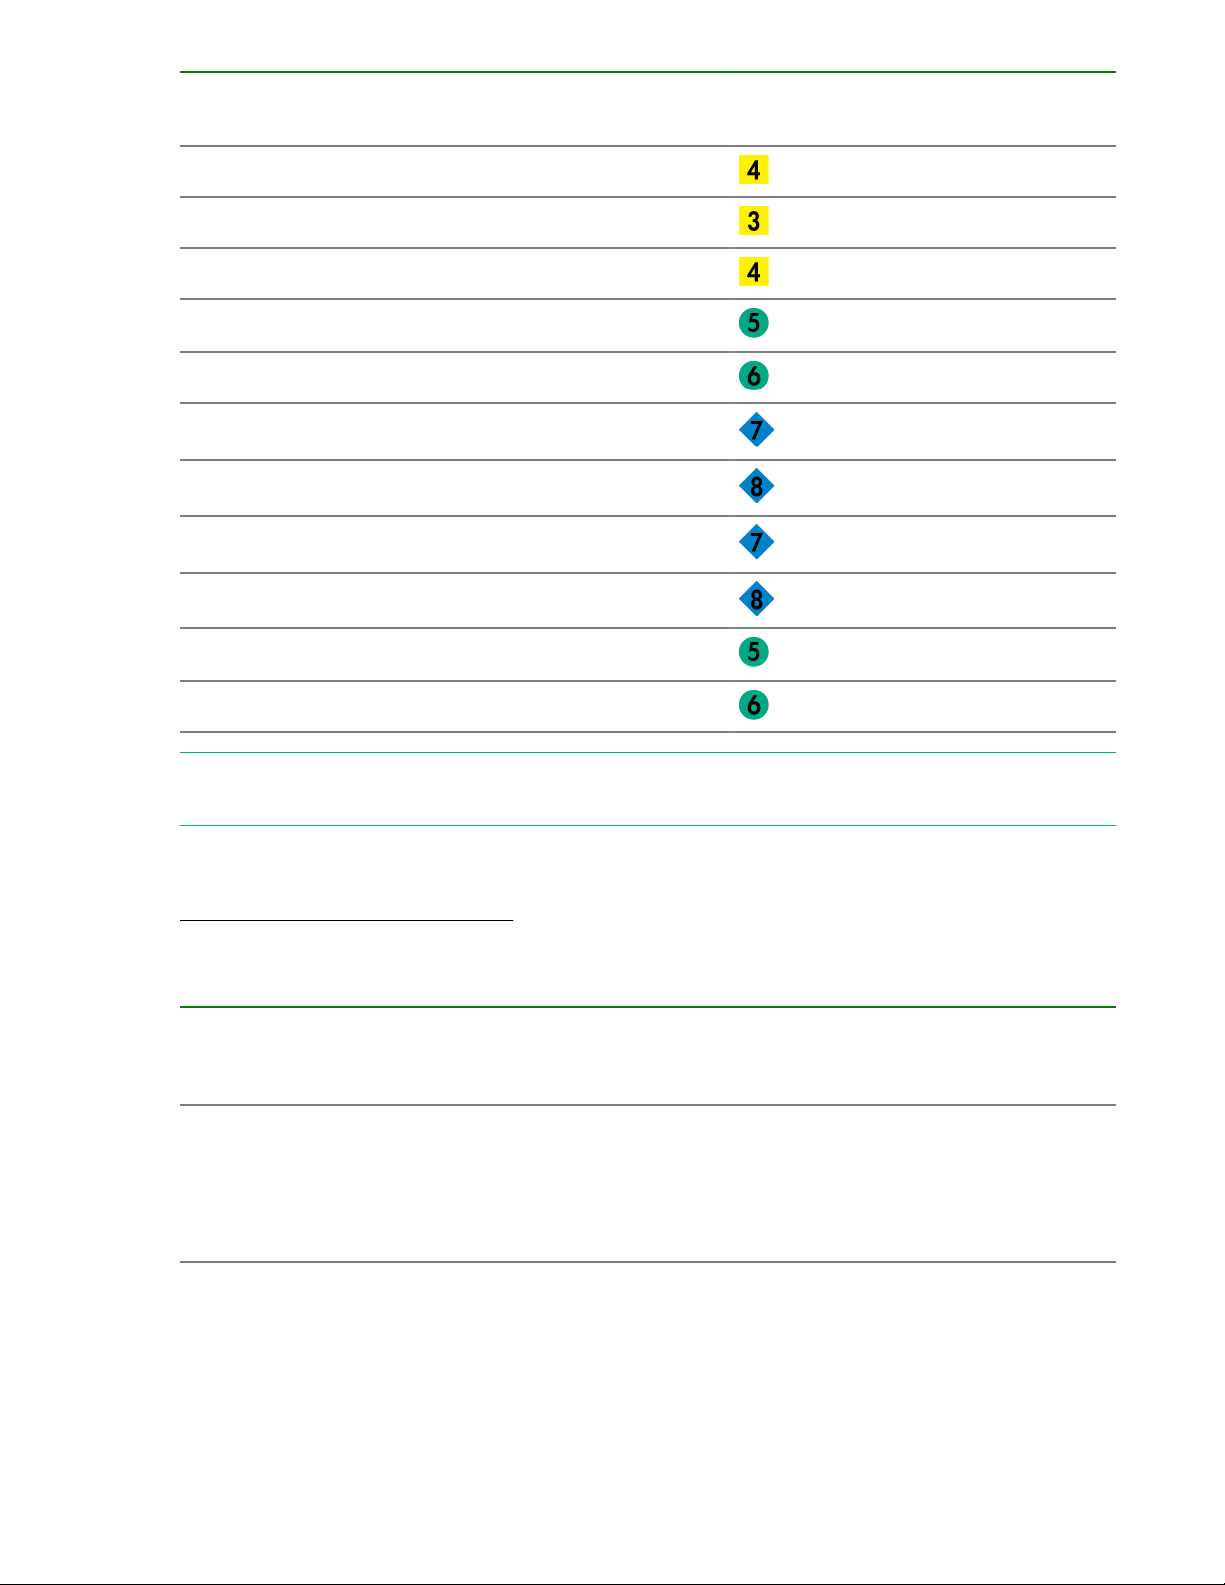
Server blade port Compute enclosure
interconnect bay
Mezzanine 1 port 2 4
Mezzanine 1 port 3 3
Mezzanine 1 port 4 4
Mezzanine 2 port 1 5
Mezzanine 2 port 2 6
Mezzanine 2 port 3 7
Mezzanine 2 port 4 8
Mezzanine 3 port 1 7
Mezzanine 3 port 2 8
Mezzanine 3 port 3 5
Interconnect bay label
Mezzanine 3 port 4 6
NOTE: For information on the location of LEDs and ports on individual interconnect modules, see the
documentation that ships with the interconnect module.
More information
Integrity Superdome X QuickSpecs
Server blade overview
Product Processors DIMM slots Supported
BL920s Gen8
BL920s Gen9
2 48 16 GB and 32
DIMM size
GB (Gen8)
16 GB, 32 GB,
and 64 GB
(Gen9)
PCIe I/O
Mezzanine
card capacity
3 2
PCI I/O
FlexLOM card
capacity
20 HPE Integrity Superdome X overview
Page 21
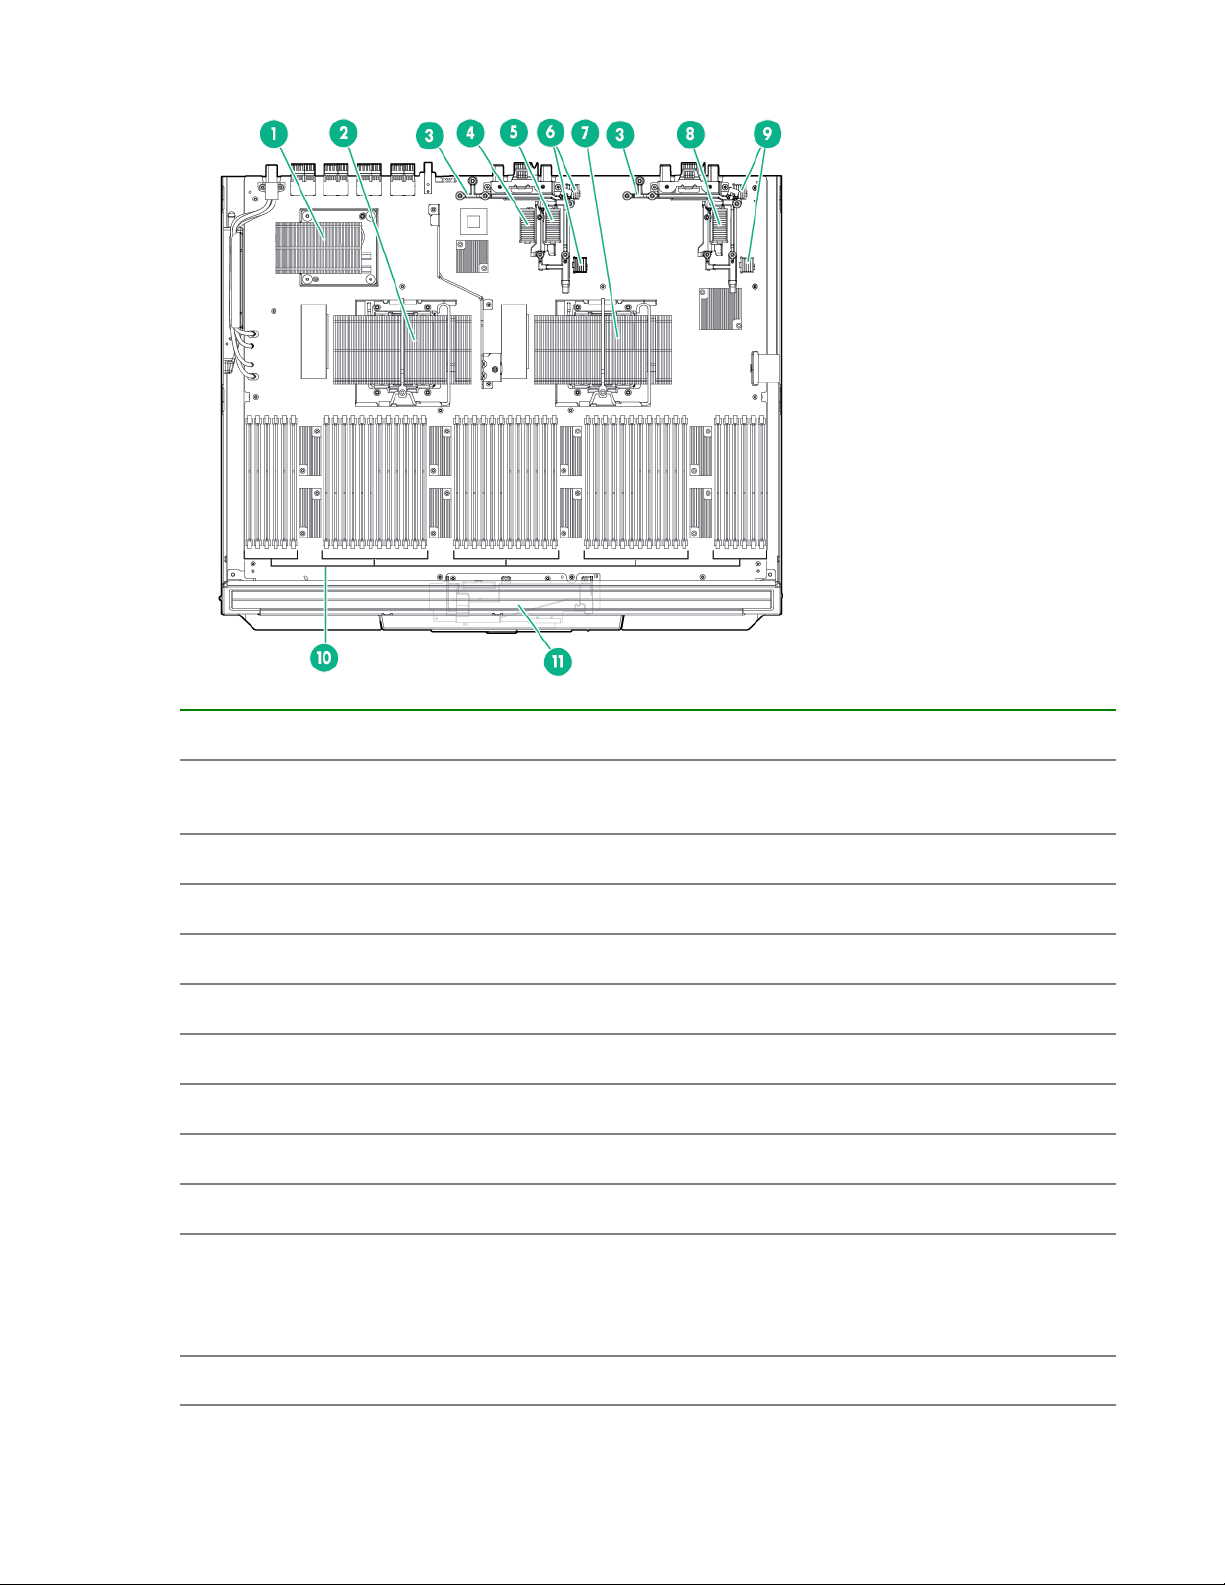
Server blade components
Item Description
1 sx3000 crossbar fabric ASIC (referred to as XNC
by the Health Repository and in event logs)
2 CPU 1
3 Mezzanine bracket
4 Mezzanine connector 1 Type A
5 Mezzanine connector 2 Type A/B
6 FlexLOM slot 2
7 CPU 0
8 Mezzanine connector 3 Type A/B
9 FlexLOM slot 1
10 DDR3 DIMM slots (48) — BL920s Gen8
DDR4 DIMM slots (48) — BL920s Gen9
LR DIMM slots (48) — BL920s Gen9
11 SUV board
HPE Integrity Superdome X overview 21
Page 22
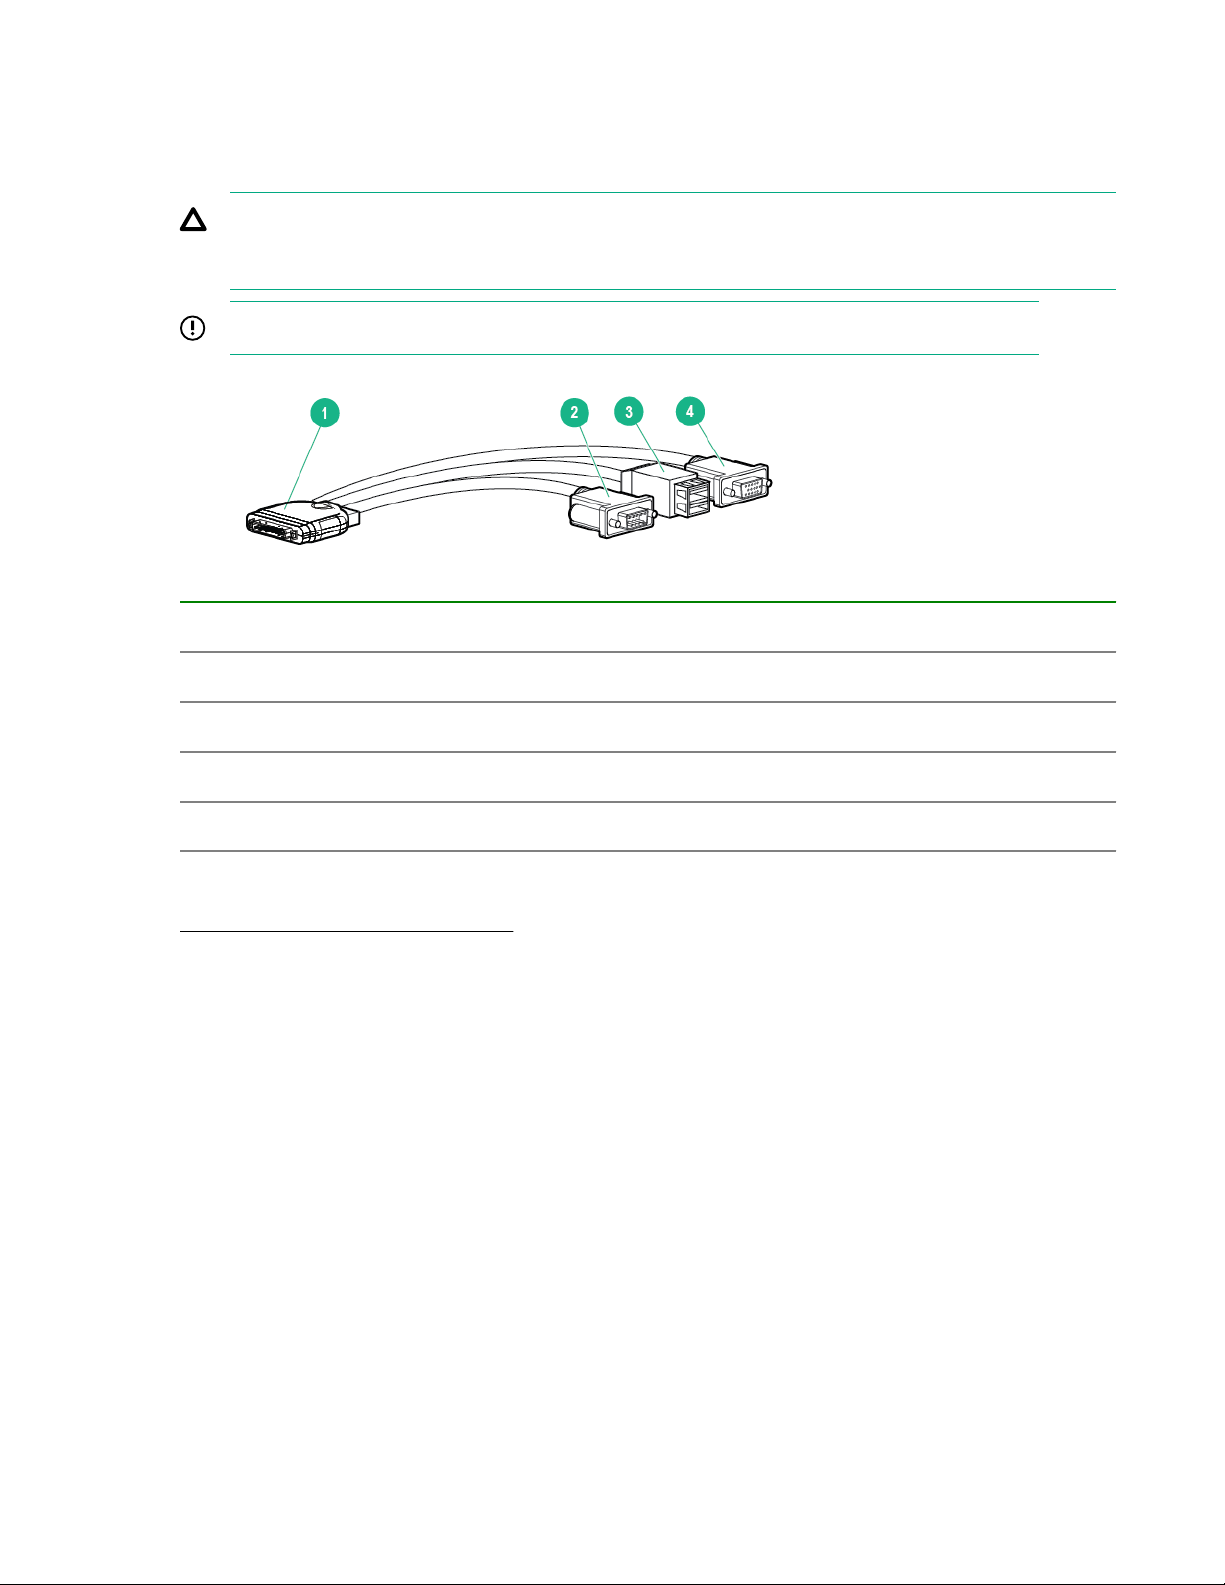
SUV cable and ports
The SUV port on the front of the server blade is used with an SUV cable to connect the blade to external
devices (serial terminal or monitor) or USB devices. The SUV port is located behind a door that stays
closed when an SUV cable is not installed.
CAUTION: The SUV cable is not designed to be used as a permanent connection; therefore be
careful when walking near the server blade. Hitting or bumping the cable might cause the port on
the server blade to break and damage the blade.
IMPORTANT: The SUV port does not provide console access and the serial port is unused.
Item Description
1 Server blade connector
2 Serial
3 USB ports (2)
4 Video
More information
Integrity Superdome X QuickSpecs
22 HPE Integrity Superdome X overview
Page 23

System specifications
Dimensions and weights
Component dimensions
Table 1: Component dimensions
Component Width Depth Height
Compute enclosure 44.7 cm
17.6 in
Server blade 5.13 cm
2.02 in
Component weights
82.8 cm
32.6 in
52.25 cm
20.60 in
79.8 cm
31.4 in
62.18 cm
24.48 in
Table 2: Compute enclosure weights
Component Weight Max. quantity per enclosure
Compute enclosure chassis 64.9 kg
143.0 lb
I/O chassis 22.1 kg
48.7 lb
Midplane Brick 18.8 kg
41.5 lb
1
1
1
OA tray 3.6 kg
8.0 lb
Active Cool Fan 0.9 kg
2.7 lb
Power supply module 2.3 kg
5.0 lb
Enclosure DVD module 2.1 kg
4.7 lb
OA module 0.8 kg
1.8 lb
1
15
12
1
2
Table Continued
System specifications 23
Page 24

Component Weight Max. quantity per enclosure
GPSM 1.2 kg
XFM 3.3 kg
I/O interconnect module 1.3 kg
Server blade 12-16 kg
More information
Generic Site Preparation Guide
Rack specifications
Table 3: Rack specifications
Rack Total
cabinet area
with packing
materials
2
2.6 lb
4
7.3 lb
8
2.9 lb
8
26-35 lb
U height Width Depth Dynamic
load
(gross)
Static load
(H x D x W)
HPE 642
1075 mm
Intelligent
Rack
HPE 642
1200 mm
Shock
Intelligent
Rack
More information
Generic Site Preparation Guide
246.80 x
129.20 x
90 cm
(85.35 x
50.87 x
35.43 in)
218.00 x
147.00 x
90 cm
(85.82 x
57.87 x
35.43 in)
42U 597.8 mm
(23.54 in)
42U 597.8 mm
(23.54 in)
1,085.63 mm
(42.74 in)
1,300.2 mm
(51.19 in)
Internal and external site door requirements
Internal site doorways must obey the following height requirements:
1,134 kg
(2,500 lb)
1,460.11 kg
(3,219 lb)
1,360.8 kg
(3,000 lb)
1,360.78 kg
(3,000 lb)
24 System specifications
Page 25

• For the 642 1075 mm rack — no less than 200.19 cm (78.816 in)
• For the 642 1200 mm rack — no less than 200.66 cm (79.00 in)
To account for the lifted height of the pallet, external doorways must obey the following height
requirements:
• For the 642 1075 mm rack — no less than 216.80 cm (85.35 in)
• For the 642 1200 mm rack — no less than 215.00 cm (84.65 in)
More information
Generic Site Preparation Guide
Electrical specifications
Table 4: Enclosure power options
Source type Source voltage
(nominal)
3–phase 200 VAC to 240
VAC line-to-line
(phase-tophase), 3phase
50/60 Hz
3–phase 220 VAC to 240
VAC line-toneutral 3-phase
50/60 Hz
Single-phase 200 VAC to 240
VAC
50/60 Hz
Plug or
connector type
NEMA L15-30p,
3-Pole, 4-wire,
3 m (10 ft)
power cord
IEC 309, 4pole, 5-wire,
Red, 3 m (10 ft)
power cord
IEC 320
C19-C20
Table 5: Single-phase power cords
Circuit type Power
receptacle
required
30 A 3-phase L15-30R. 3-
pole, 4-wire
16 A IEC 309, 4-
pole, 5-wire, red
16/20 A Singlephase
IEC 320
C19
Number of
power cords
required (per
enclosure)
4
4
12
Part number Description Where used
8120-6895 Stripped end, 240 V International - other
8120-6897 Male IEC309, 240 V International
8121-0070 Male GB-1002, 240 V China
8120-6903 Male NEMA L6-20, 240 V North America/Japan
System specifications 25
Page 26

Table 6: Enclosure single-phase HPE 2400 W power supply specifications
Specification Value
Power cord IEC-320 C19-C20
Output 2450 W per power supply
Input requirements
Rated input voltage 200–240 VAC
Rated input frequency 50-60 Hz
Rated input current per power supply (maximum) 13.8 A at 200 VAC
13.3 A at 208 VAC
12.6 A at 220 VAC
Maximum inrush current 100 A for 10 ms
Ground leakage current 3.5 mA
Power factor correction 0.98
Table 7: Enclosure 3-phase 2400 W power supply specifications (North America/
Japan)
Specification Value
Power cords (4) NEMA L15-30p
3.0 m (10 ft)
Max input current per line cord 24.0 A at 200 VAC
23.1 A at 208 VAC
Output 2450 W per power supply
Input requirements
Rated input voltage 200–240 VAC line-to-line 3-phase
Rated input frequency 50–60 Hz
Maximum inrush current 100 A for 10 ms
Ground leakage current 3.5 mA
Power factor correction 0.98
26 System specifications
Page 27

Table 8: Enclosure 3-phase 2400 W power supply specifications (International)
Specification Value
Power cords (4) IEC-309 220–240 VAC, 5-pin, 16 A
3.0 m (10 ft)
Max input current per line cord 12.1 A at 220 VAC
11.1 A at 240 VAC
Output 2450 W per power supply
Input requirements
Rated input voltage 200–240 VAC line-to-neutral 3-phase
Rated input frequency 50-60 Hz
Maximum inrush current 100 A for 10 ms
Ground leakage current 3.5 mA
Power factor correction 0.98
Table 9: Enclosure power requirements
Power required (50–60 Hz) Watts VA
User expected maximum power 9065 9250
Table 10: Enclosure PDU power options
Source/Circuit
type
3–phase 60 A 200–240 VAC line-
3–phase 32 A 220–240 VAC line-
Source voltage
(nominal)
to-line (phase-tophase), 3–phase
50/60 Hz
to-neutral 3–phase
50/60 Hz
Plug or connector
type
IEC 309 60 A 3Pole, 4 wire, Blue,
3.6 m (11.8 ft)
power cord
IEC 309 32 A 4Pole, 5 wire, Red,
3.6 m (11.8 ft)
power cord
Power receptacle
required
IEC 309 60 A 3Pole, 4 wire, Blue
IEC 309 32 A 4Pole, 5 wire, Red
Number of power
cords required
(per enclosure
leaving the rack)
2
2
Table Continued
System specifications 27
Page 28

Source/Circuit
type
Source voltage
(nominal)
Plug or connector
type
Power receptacle
required
Number of power
cords required
(per enclosure
leaving the rack)
Single-phase 63 A 200–240 VAC
50/60 Hz
IEC 309 63 A
Single Phase Blue,
3.6 m (11.8 ft)
power cord
Single-phase 30 A 200–240 VAC
50/60 Hz
NEMA L6-30P
Single Phase,
3.6 m (11.8 ft)
power cord
More information
Generic Site Preparation Guide
Environmental specifications
Temperature and humidity specifications
The following table contains the allowed and recommended temperature and humidity limits for both
operating and nonoperating Integrity Superdome X systems.
Specification Value
Temperature range
IEC 309 63 A
Single Phase, Blue
NEMA L6-30R
Single Phase
4
6
Allowable Operating Range
Recommended Operating Range
2
2
+5° C to +40° C (41° F to 104° F)
+18° C to +27° C (64° F to 81° F)
Nonoperating (powered off) +5° C to +45° C (41° F to 113° F)
Nonoperating (storage) -40° C to +80° C (-40° F to 176° F)
Humidity Range (noncondensing)
Allowable Operating Range
Recommended Operating Range
2
2
-12° C DP and 8% RH to +24° C DP and 85% RH
+5.5° C DP to +15° C DP and 65% RH
Nonoperating (powered off) 8% RH to 90% RH and 29° C DP
Nonoperating (storage) 8% RH to 90% RH and 32° C DP
1
The Recommended Operating Range is recommended for continuous operation. Operating within the Allowable
Operating Range is supported but might result in a decrease in system performance.
More information
Generic Site Preparation Guide
28 System specifications
Page 29
Cooling requirements
Integrity Superdome X is a rack-mounted system that cools by drawing air in the front and exhausting it
out the rear. General ASHRAE best practices must be followed when installing the system in a data
center.
• Hot/cold aisle layout
• Appropriate blanking panels in any unused space in the rack.
• No gaps exist between adjacent racks, which ensures minimal air recirculation.
• An adequate hot-air return path to the computer room air conditioners (CRAC) or computer room air
handlers (CRAH), which minimizes the flow of hot air over any rack.
Integrity Superdome X utilizes variable speed fans to realize the most efficient use of air. The volume of
air required varies with the temperature of the air supplied to the inlet.
IMPORTANT: The optimal equipment orientation is a parallel layout to the air flow supply and
return. Supply air will flow down cold aisles which are parallel to equipment rows, and return air to
CRAC through parallel air flow. Perpendicular air flow causes too much room mixing, places higher
electrical loads on the room, and can lead to unexpected equipment problems.
More information
Generic Site Preparation Guide
Air quality specifications
Chemical contaminant levels in customer environments for Hewlett Packard Enterprise hardware
products must not exceed G1 (mild) levels of Group A chemicals at any time. These contaminant levels
are described in the current version of ISA–71.04 Environmental Conditions for Process Measurement
and Control Systems: Airborne Contaminants.
More information
• Generic Site Preparation Guide
• ISA–71.04 Environmental Conditions for Process Measurement and Control Systems: Airborne
Contaminants
Acoustic noise specifications
The acoustic noise specifications are 8.6 bel (86 dB) (sound power level).
IMPORTANT: Hewlett Packard Enterprise recommends that anyone in the immediate vicinity of the
product for extended periods of time wear hearing protection or use other means to reduce noise
exposure.
This level of noise is appropriate for dedicated computer room environments, not office environments.
Understand the acoustic noise specifications relative to operator positions within the computer room when
adding Integrity Superdome X systems to computer rooms with existing noise sources.
More information
Generic Site Preparation Guide
System specifications 29
Page 30

Sample site inspection checklist for site preparation
See Customer and Hewlett Packard Enterprise Information and Site inspection checklist. You can
use these tables to measure your progress.
Table 11: Customer and Hewlett Packard Enterprise Information
Customer Information
Name: Phone number:
Street address: City or Town:
State or province: Country
Zip or postal code:
Primary customer contact: Phone number:
Secondary customer contact: Phone number:
Traffic coordinator: Phone number:
Hewlett Packard Enterprise information
Sales representative: Order number:
Representative making survey: Date:
Scheduled delivery date:
Table 12: Site inspection checklist
Check either Yes or No. If No, include comment or date.
Computer Room
Number Area or condition Yes No Comment or
Date
1. Do you have a completed floor plan?
2. Is adequate space available for maintenance needs?
Front 91.4 cm (36 inches) minimum and rear 91.4 cm
(36 inches) minimum are recommended clearances.
3. Is access to the site or computer room restricted?
4. Is the computer room structurally complete? Expected
date of completion?
30 System specifications
Table Continued
Page 31

Check either Yes or No. If No, include comment or date.
Computer Room
Number Area or condition Yes No Comment or
Date
5. Is a raised floor installed and in good condition?
What is the floor to ceiling height? [228 cm (7.5 ft)
minimum]
6. Is the raised floor adequate for equipment loading?
7. Are channels or cutouts available for cable routing?
8. Is a network line available?
9. Is a telephone line available?
10. Are customer-supplied peripheral cables and LAN cables
available and of the proper type?
11. Are floor tiles in good condition and properly braced?
12. Is floor tile underside shiny or painted?
If painted, judge the need for particulate test.
Power and Lighting
13. Are lighting levels adequate for maintenance?
14. Are AC outlets available for servicing needs (for example,
laptop usage)?
15. Does the input voltage correspond to equipment
specifications?
15a. Is dual source power used? If so, identify types and
evaluate grounding.
16. Does the input frequency correspond to equipment
specifications?
17. Are lightning arrestors installed inside the building?
18. Is power conditioning equipment installed?
19. Is a dedicated branch circuit available for equipment?
20. Is the dedicated branch circuit less than 22.86 m (75 ft)?
21. Are the input circuit breakers adequate for equipment
loads?
Safety
22. Is an emergency power shutoff switch available?
23. Is a telephone available for emergency purposes?
24. Does the computer room have a fire protection system?
Table Continued
System specifications 31
Page 32

Check either Yes or No. If No, include comment or date.
Computer Room
Number Area or condition Yes No Comment or
Date
25. Does the computer room have anti-static flooring
installed?
26. Do any equipment servicing hazards exist (loose ground
wires, poor lighting, and so on)?
Cooling
27. Can cooling be maintained between 5° C (41° F) and
40° C (104° F) up to 1,525 m (5,000 ft)? Derate 1° C/
305 m (1.8° F/1,000 ft) above 1,525 m (5,000 ft) and up to
3,048 m (10,000 ft).
28. Can temperature changes be held to 5° C (9° F) per hour
with tape media? Can temperature changes be held to
20° C (36° F) per hour without tape media?
The following are examples of different types of
temperature changes.
• Unidirectional changes
— Storage operating temperature changes in excess of
20° C (36° F) is not within tolerance. Allow one hour
per 20° C (36° F) to acclimate.
• Multidirectional spurious changes
— Operating temperatures that increase 10° C (18° F)
and then decrease 10° C (18° F). This temperature
change Is within tolerance as a 20° C (36° F) change
per hour.
• Repetitive changes
— Every 15 minutes, there is a repetitive, consistent
5° C (9° F) up and down change. This repetitive
temperature change is a 40° C (72° F) change per hour
and not within tolerance.
Also note that rapid changes to temperature over a short
period are more damaging than gradual changes over
time.
29. Can humidity level be maintained at 40% to 55% at 35° C
(95 ° F) noncondensing?
30. Are air-conditioning filters installed and clean?
Storage
31. Are cabinets available for tape and disc media?
32. Is shelving available for documentation?
32 System specifications
Table Continued
Page 33

Check either Yes or No. If No, include comment or date.
Computer Room
Number Area or condition Yes No Comment or
Date
Training
33. Are personnel enrolled in the System Administrator
Course?
34. Is on-site training required?
More information
Generic Site Preparation Guide
System specifications 33
Page 34

Updating firmware
Hewlett Packard Enterprise recommends that all firmware on all devices in your system be updated to the
latest version after hardware installation is complete. Hewlett Packard Enterprise also encourages you to
check back often for any updates that might have been posted.
There are two methods for updating the complex firmware; using SUM or manually.
Prerequisites
Before updating firmware, Hewlett Packard Enterprise strongly recommends implementing these security
best practices:
• Isolate the management network by keeping it separate from the production network and not putting it
on the open internet without additional access authentication.
• Patch and maintain LDAP and web servers.
• Run latest virus and malware scanners in your network environment.
Installing the latest complex firmware using SUM
The SUM utility enables you to deploy firmware components from either an easy-to-use interface or a
command line. It has an integrated hardware discovery engine that discovers the installed hardware and
the current versions of firmware in use on target servers. SUM contains logic to install updates in the
correct order and ensure that all dependencies are met before deployment of a firmware update. It also
contains logic to prevent version-based dependencies from destroying an installation and ensures that
updates are handled in a manner that reduces any downtime required for the update process. SUM does
not require an agent for remote installations.
SUM is included in the downloadable firmware bundles.
For more information about SUM, see the Smart Update Manager User Guide (http://www.hpe.com/
info/sum-docs).
NOTE: You can also update firmware manually. There are different firmware bundles for each method.
See the detailed instructions provided in the release notes for the firmware bundle for more information
about manually updating firmware. Also see Manually updating the complex firmware on page 34.
Manually updating the complex firmware
To update the complex firmware manually, you will:
Procedure
1. Download the firmware bundle.
2. Update the complex and nPartition firmware.
3. Update I/O firmware and SMH and WBEM providers.
4. Be sure to use only the recommended I/O firmware to avoid incompatibility with other system
firmware.
5. Check for driver and firmware updates for other devices.
34 Updating firmware
Page 35

To use SUM to update the complex firmware, see Installing the latest complex firmware using SUM on
page 34.
Download firmware bundle
Hewlett Packard Enterprise recommends running only approved firmware versions. For the latest
approved firmware versions, see the Firmware Matrix for HPE Integrity Superdome X servers at http://
www.hpe.com/info/superdomeX-firmware-matrix. Follow the instructions provided in the bundle
Release Notes.
For special OS requirements, see the Superdome X firmware bundle Release Notes and these OS white
papers:
• Running Linux on HPE Integrity Superdome X white paper at http://www.hpe.com/support/
superdomeXlinux-whitepaper
• Running Microsoft Windows Server on HPE Integrity Superdome X white paper at http://
www.hpe.com/support/superdomeXwindows-whitepaper
• Running VMware vSphere on HPE Integrity Superdome X white paper at http://www.hpe.com/
support/superdomeXvmware-whitepaper
Update the complex firmware
To manually update the complex firmware:
Procedure
1. Refer to the Firmware Matrix for HPE Integrity Superdome X servers document at http://
www.hpe.com/info/superdomeX-firmware-matrix.
2. Select the complex firmware version for your OS to download and extract the latest HPE Integrity
Superdome X firmware bundle. Follow the instructions provided in the bundle Release Notes.
3. Copy the bundle to a media accessible from the OA.
4. Connect a PC to OA over Telnet or SSH and login to the CLI. For more information, see Connecting a
PC to the OA service port.
5. At the CLI prompt, use the connect blade <blade#> command to connect to each blade, and
then use the exit command to return to the OA prompt.
For example:
OA> connect blade 1
</>hpiLO-> exit
IMPORTANT: This will ensure that there is communication between OA and all blades. The
firmware update will fail if communication from OA to any blade is not working.
6. Use the Health Repository to discover currently indicted and deconfigured components.
Launch the Health Repository viewer with the SHOW HR command on the Monarch OA. List indicted
and deconfigured components with the SHOW INDICT and SHOW DECONFIG commands.
Address all indicted and deconfigured components before proceeding. Replace a deconfigured blade
or OA before starting the firmware update.
Updating firmware 35
Page 36

7. To start the firmware update, use the UPDATE FIRMWARE command; for example update firmware
<uri> all , where <uri> is the path to the firmware bundle. The "all" option must be used to update
complex AND partition firmware.
The Firmware update process can take up to 1 hour to complete. During this process, you might notice
no progress for long periods of time and connection to OA will be lost when OA reboots between
updates.
NOTE: For more information about using the UPDATE FIRMWARE command, see the HPE Integrity
Superdome X and Superdome 2 Onboard Administrator Command Line Interface User Guide.
8. After OA is rebooted, reconnect to OA and login to confirm successful updates. Run the UPDATE
SHOW FIRMWARE command to display the complex bundle version and the firmware versions installed.
Example:
Configured complex firmware bundle version: 7.6.0
Firmware on all devices matches the complex configured bundle version
NOTE: The bundle contains firmware for the complex and npartition. The bundle does not contain I/O
card drivers or firmware.
9. Verify that all partitions are ready for use with the parstatus -P command.
I/O firmware and drivers
It is important that you install the recommended I/O adapter firmware and drivers for the appropriate
complex firmware bundle. For information about supported firmware and drivers for supported I/O cards,
see Firmware Matrix for HPE Integrity Superdome X servers at http://www.hpe.com/info/superdomeX-
firmware-matrix. Use the information provided in this document to download the correct firmware bundle
and drivers.
IMPORTANT: Installing incorrect or unsupported firmware can cause unpredictable behavior. The
latest IO device firmware versions might not be supported for your system. Be sure to use only the
firmware versions that are qualified and recommended for your system. Do not use the SPP as a
source of device firmware for Superdome X systems.
SMH and WBEM providers
Hewlett Packard Enterprise recommends that you install the latest versions of the SMH and WBEM
providers for your OS.
NOTE: You must install the SMH package before the WBEM providers or in the same session.
Use the information provided in the Firmware Matrix for HPE Integrity Superdome X servers
document to download the correct WBEM providers.
Reboot is not required for SMH and WBEM providers changes to take effect.
Drivers and firmware for other devices
Interconnect modules also contain firmware which can be updated.
Before installing any firmware or drivers, be sure to see the Firmware Matrix for HPE Integrity Superdome
X servers at http://www.hpe.com/info/superdomeX-firmware-matrix. Use only the specified firmware
and drivers. Use the information provided in this document to download the correct versions. Also see the
Linux and Windows white papers for additional updates that might be needed.
36 Updating firmware
Page 37

Superdome X operating systems
This is the current OS support information for Superdome X systems.
OSs supported
Integrity Superdome X supports these operating systems:
• Microsoft Windows Server
◦ 2012 R2 (BL920s, all versions)
◦ 2016 (BL920s, all versions)
• VMware
◦ vSphere 5.5 U2 (BL920s Gen8 up to 8 sockets)
◦ vSphere 5.5 U3 (BL920s Gen8 and Gen9 v3 up to 8 sockets)
◦ vSphere 6.0 (BL920s Gen8 up to 8 sockets)
◦ vSphere 6.0 U1 (BL920s Gen8 up to 16 sockets and Gen9 v3 up to 8 sockets)
◦ vSphere 6.0 U2 (BL920s Gen8 up to 16 sockets and Gen9 v3 & v4 up to 8 sockets)
◦ vSphere 6.0 U3 (BL920s Gen8 up to 16 sockets and Gen9 v3 & v4 up to 8 sockets)
• Red Hat Linux
◦ RHEL 6.5 (BL920s Gen8)
◦ RHEL 6.6 (BL920s Gen8 and Gen9 v3)
◦ RHEL 6.7 (BL920s, all versions)
◦ RHEL 6.8 (BL920s, all versions)
◦ RHEL 6.9 (BL920s, all versions)
◦ RHEL 7.0 (BL920s Gen8)
◦ RHEL 7.1 (BL920s Gen8 and Gen9 v3)
◦ RHEL 7.2 (BL920s, all versions)
◦ RHEL 7.3 (BL920s, all versions)
• SuSE Linux
◦ SLES 11 SP3 (BL920s Gen8 and Gen9 v3)
◦ SLES 11 SP3 for SAP (BL920s Gen8 and Gen9 v3)
◦ SLES 11 SP4 (BL920s, all versions)
◦ SLES 12 (BL920s Gen8 and Gen9 v3)
◦ SLES 12 SP1 (BL920s, all versions)
◦ SLES 12 SP2 (BL920s, all versions)
Superdome X operating systems 37
Page 38

Support for some OSs requires a minimum firmware version. For the minimum required firmware
versions, see the Firmware Matrix for HPE Integrity Superdome X servers at http://www.hpe.com/info/
superdomeX-firmware-matrix.
For the latest list of supported OSs, see the HPE Integrity Superdome X Operating System Reference at
http://www.hpe.com/info/enterprise/docs (Servers > Integrity Servers > Integrity Superdome X) or
the Firmware Matrix for HPE Integrity Superdome X servers at http://www.hpe.com/info/superdomeX-
firmware-matrix.
Using Microsoft Windows Server
For detailed information about using the Windows OS on Integrity Superdome X systems, see the
Running Microsoft Windows Server on HPE Integrity Superdome X white paper at http://www.hpe.com/
support/superdomeXwindows-whitepaper.
Using VMware
For detailed information about using VMware on Integrity Superdome X systems, see the Running
VMware vSphere on HPE Integrity Superdome X white paper at
superdomeXvmware-whitepaper.
Using Red Hat Linux
For detailed information about using RHEL on Integrity Superdome X systems, see the Running Linux on
HPE Integrity Superdome X white paper at http://www.hpe.com/support/superdomeXlinux-
whitepaper.
http://www.hpe.com/support/
Using SuSE Linux
For detailed information about using SLES on Integrity Superdome X systems, see the Running Linux on
HPE Integrity Superdome X white paper at http://www.hpe.com/support/superdomeXlinux-
whitepaper.
38 Superdome X operating systems
Page 39

Partitioning
This chapter provides information on partition identification and operations.
Partition Identification
Every partition has two identifiers: a partition number (the primary identifier from an internal perspective)
and a partition name (a more meaningful handle for administrators).
Partition Number
• A numeric value that is well suited for programmatic use and required by the hardware for configuring
routing, firewalls, etc. related to nPartitions.
• Once a partition has been created, its partition number cannot be changed. In effect, a different
partition number implies a different partition.
• Only one instance of an nPartition with a given partition number can exist within a complex.
• The range of partition numbers for nPartitions is 1 – 255.
Partition Name
• A partition name is a string value which directly conveys meaning.
• The name of a partition can be changed; this includes after the partition has been created and even if
a partition is active (such is the nature of an alias).
• A partition name should at least have one of the following non-numeric characters:
◦ a-z
◦ A-Z
◦ - (dash)
◦ _ (underscore)
◦ . (period)
Any other non-numeric character is not allowed in a partition name.
• nPartition names are unique within a complex.
Partition Power Operations
To activate an inactive nPartition, use the poweron partition command on the OA CLI.
To make an active partition inactive, use the poweroff partition command on the OA CLI.
To reboot an active nPartition, use the reboot partition command on the OA CLI.
To do a TOC on the nPartition and obtain a core dump, use the toc partition command from the OA
CLI.
To list all the nPartitions and their boot states and runstates (active or inactive states), use the
parstatus -P command on the OA CLI.
Partitioning 39
Page 40

For more information on the usage of these commands, see “Partition commands” in the HPE Integrity
Superdome X and Superdome 2 Onboard Administrator Command Line Interface User Guide.
PARSTATUS
The status of a partition and its assigned resources can be obtained by exercising various options
available with the OA CLI command parstatus. For more information on the parstatus command,
see “Partition commands” in the HPE Integrity Superdome X and Superdome 2 Onboard Administrator
Command Line Interface User Guide.
UUID for nPartitions
The partition firmware subsystem will generate an unique nPar UUID when a user creates an nPartition.
The UUID will be communicated to system firmware, which places the UUID on the SMBIOS for the OS
and the management applications to pick up and use this as “Universally Unique Identifiers” of the
partition. The UUID would also be available for the manageability and the deployment tools and
applications through established SOAP interfaces that can query UUID. Customers can view the UUID of
the nPartition by issuing parstatus –p <npar_id> -V under the field “Partition UUID”.
nPartition states
The nPartition state indicates whether the nPartition has booted and represents the power state of
nPartition. The nPartitions will have one of the following states:
• Active nPartition
• Inactive nPartition
• Unknown
Active nPartition
An nPartition is active when a poweron operation is initiated on the nPartition and the firmware boot
process is started.
Inactive nPartition
An nPartition is considered inactive when it is not powered on. An nPartition is in inactive state after it has
been created or shut down.
Unknown nPartition
An nPartition might report a partition state of “Unknown” and a runstate of “DETACHED” after an OA
restart. This state is possible when the firmware is not able to identify the correct nPartition state due to
internal firmware errors at OA startup. The state is persistent and can only be cleared by force powering
off the nPartition from the OA. A partition in this state will not accept any partition operation for the
nPartition, except parstatus and force poweroff. Any active OS instances continue to run unhindered
even when the nPartition is in an Unknown state.
If any attempts are made to issue partition administration operations, the following error occurs:
Error: Partition state unavailable due to firmware errors. All OS instances
running in this partition will continue unimpacted.
40 Partitioning
Page 41

NOTE: To clear this partition state:
1. Shut down all OS instances in the nPartition.
2. Force power off the nPartition from the OA.
3. Power on the nPartition from the OA.
This is an example of parstatus output for a partition in the DETACHED state:
parstatus -P
[Partition]
Par State/RunState Status* # of # of ILM/(GB)** Partition Name
=== =============== ======= ==== ==== ============= ==============
1 Unknown/DETACHED OK 8 0 0.0/8192.0 nPar0001
* D-Degraded
** Actual allocated for Active and User requested for Inactive partitions
To list all the nPartitions and their boot states and runstates (active or inactive states), use the
parstatus -P command on the OA CLI.
parstatus -P
[Partition]
Par State/RunState Status* # of # of ILM/(GB)** Partition Name
=== =============== ======= ==== ==== ============= ==============
1 Inactive/DOWN OK 4 0 0.0/4096.0 nPar0001
2 Active/EFI OK 4 0 0.0/4096.0 nPar0002
* D-Degraded
** Actual allocated for Active and User requested for Inactive partitions
nPartition runstate
The partition runstates displayed by the status commands show the actual state of the partition varying
from a firmware boot state to a state where an OS has successfully booted in a partition. The following
table lists the runstates for an nPartition.
State Description
DOWN The partition is inactive and powered off.
ACTIVATING A boot operation has been initiated for this partition.
FWBOOT The boot process is in the firmware boot phase for this partition and the
EFI The partition is at the EFI shell.
OSBOOT The boot process has started booting the OS in this partition.
UP The OS in this partition is booted and running.
SHUT A shutdown/reboot/reset operation has been initiated on this partition.
partition has transitioned into the active status.
1
Table Continued
Partitioning 41
Page 42

State Description
DEACTIVATING The partition is being deactivated (powered down) as part of a shutdown
or reboot operation.
RESETTING A partition reset is in progress.
MCA A machine check (MCA) has occurred in the partition and is being
processed.
DETACHED The status is not known. This might reflect an error condition or a
transitional state while partition states are being discovered.
1
OS WBEM drivers must be installed to see this runstate.
nPartition and resource health status
The nPartition and resource status reveals the current health of the hardware. The nPartition resources
can have one of the following usage status:
Resource Usage Description
Empty The slot has no resource.
Inactive Resource is inactive.
Unintegrated Firmware is in the process of discovering or integrating the resource. It cannot
be used for partition operations.
Active The resource is active in the partition.
The partition resources might display one of the following health status:
Resource
health
OK Okay/healthy Resource is present and usable.
D Deconfigured Resource has been deconfigured.
I Indicted Resource has been indicted.
PD Parent Deconfigured A parent resource has been deconfigured. An example is the
PI Parent Indicted Similar to PD except the parent resource has been indicted.
Meaning Comment
status of a memory DIMM which is healthy when the blade in
which it is located is deconfigured. The DIMM status is then PD.
I D Indicted and
PI PD Parent Indicted and
42 Partitioning
A resource has been indicted and deconfigured
Deconfigured
A parent resource has been indicted and deconfigured.
Parent Deconfigured
Page 43

The health of an nPartition depends on the health of its own resources. If there are unhealthy resources,
the health of the partition is marked as Degraded. If all the resources in the partition are healthy, the
health of the partition is reported as OK.
Partitioning 43
Page 44

Troubleshooting
Symptom
The purpose of this chapter is to provide a preferred methodology (strategies and procedures) and tools
for troubleshooting complex error and fault conditions.
This section is not intended to be a comprehensive guide to all of the tools that can be used for
troubleshooting the system. See the HPE Integrity Superdome X and Superdome 2 Onboard
Administrator User Guide and the HPE Integrity Superdome X and Superdome 2 Onboard Administrator
Command Line Interface User Guide for additional information on troubleshooting using the OA.
General troubleshooting methodology
The system provides the following sources of information for troubleshooting:
• LED status information
• Insight Display
• OA CLI, Health Repository (HR) and Core Analysis Engine (CAE)
• OA GUI
NOTE:
Examples in this section might reflect other systems and not the currently supported configuration of the
Integrity Superdome X system.
LED status information
The LEDs provide initial status and health information. LED information should be verified by the other
sources of status information.
See LEDs and components on page 57 for more information.
TIP:
The OA CLI is the most efficient way to verify the information provided from LEDs.
OA access
You can access the OA by entering the 169.254.1.x address using either a Telnet session or a SSH
connection. This can be done by connecting a laptop to the service port on the OA tray using a standard
LAN cable using Telnet or by using a system which has access to the OA-management LAN (customer
LAN connected to the OA RJ45–port). See Connecting a PC to the OA service port for more
information about connecting to the OA service port.
IMPORTANT: The OA service (Link Up) port is not to be confused with the serial port. The OA serial
port is only used for initial system setup. Once the network is configured, the OA should be always
be accessed using Telnet or SSH connection to the Service port.
OA CLI
The central point of communication for gaining system status is the active OA.
44 Troubleshooting
Page 45

Hewlett Packard Enterprise recommends checking the system status information using show complex
status before continuing with troubleshooting:
sd-oa1> show complex status
Status: OK
Enclosure ID: OK
Enclosure: OK
Robust Store: OK
CAMNET: OK
Product ID: OK
Xfabric: OK
Diagnostic Status:
Thermal Danger OK
Cooling OK
Device Failure OK
Device Degraded OK
Firmware Mismatch OK
If no issues are seen in the command output, then more troubleshooting information is required.
Gathering power related information
Gather the power information for all of the system components.
Compute enclosure
Use the show enclosure status and show enclosure powersupply all commands.
sd-oa1> show enclosure status
Enclosure 1:
Status: OK
Enclosure ID: OK
Unit Identification LED: Off
Diagnostic Status:
Internal Data OK
Thermal Danger OK
Cooling OK
Device Failure OK
Device Degraded OK
Redundancy OK
Indicted OK
Onboard Administrator:
Status: OK
Standby Onboard Administrator:
Status: OK
Power Subsystem:
Status: OK
Power Mode: Not Redundant
Power Capacity: 14400 Watts DC
Power Available: 2270 Watts DC
Present Power: 6024 Watts AC
Cooling Subsystem:
Status: OK
Fans Good/Wanted/Needed: 15/15/15
Fan 1: 10760 RPM (60%)
Fan 2: 10758 RPM (60%)
Fan 3: 10760 RPM (60%)
Fan 4: 10760 RPM (60%)
Troubleshooting 45
Page 46

Fan 5: 10759 RPM (60%)
Fan 6: 8600 RPM (48%)
Fan 7: 8600 RPM (48%)
Fan 8: 8600 RPM (48%)
Fan 9: 8599 RPM (48%)
Fan 10: 8599 RPM (48%)
Fan 11: 8602 RPM (48%)
Fan 12: 8601 RPM (48%)
Fan 13: 8600 RPM (48%)
Fan 14: 8597 RPM (48%)
Fan 15: 8600 RPM (48%)
sd-oa1> show enclosure powersupply all
Power Supply #1 Information:
Status: OK
AC Input Status: OK
Capacity: 2450 Watts
Current Power Output: 918 Watts
Serial Number: 5BGXF0AHL4B0S6
Product Name: HPE 2400W 80 PLUS PLATINUM
Part Number: 588603-B21
Spare Part Number: 588733-001
Product Ver: 07
Diagnostic Status:
Internal Data OK
Device Failure OK
Power Cord OK
Indicted OK
Similar information will be displayed for all other power supplies.
Collecting power status information for components at the compute enclosure
Use the show xfm status all, show blade status all, and show interconnect status
all commands to gather information on compute enclosure component power if in use:
NOTE: OA displays XFM2 information as SXFM.
NOTE: Similar information should be displayed for XFMs 1 through 3.
sd-oa1> show xfm status all
Bay 4 SXFM Status:
Health: OK
Power: On
Unit Identification LED: Off
Diagnostic Status:
Internal Data OK
Management Processor OK
Thermal Warning OK
Thermal Danger OK
Power OK <<<<
Firmware Mismatch OK
Indicted OK
Link 1: Dormant
Link 2: Dormant
Link 3: Dormant
Link 4: Dormant
sd-oa1> show blade status all
46 Troubleshooting
Page 47

Blade #1 Status:
Power: On
Current Wattage used: 1325 Watts
Health: OK
Unit Identification LED: Off
Diagnostic Status:
Internal Data OK
Management Processor OK
Thermal Warning OK
Thermal Danger OK
I/O Configuration OK
Power OK <<<
Cooling OK
Device Failure OK
Device Degraded OK
Device Info OK
Firmware Mismatch OK
PDHC OK
Indicted OK
sd-oa1> show interconnect status all
Interconnect Module #1 Status:
Status: OK
Thermal: OK
CPU Fault: OK
Health LED: OK
UID: Off
Powered: On
Diagnostic Status:
Internal Data OK
Management Processor OK
Thermal Warning OK
Thermal Danger OK
I/O Configuration OK
Power OK <<<
Device Failure OK
Device Degraded OK
Gathering cooling related information
Use the following commands to gather all complex cooling information:
• show enclosure fan all
sd-oa1> show enclosure fan all
Fan #1 Information:
Status: OK
Speed: 60 percent of Maximum speed
Maximum speed: 18000 RPM
Minimum speed: 10 RPM
Power consumed: 32 Watts
Product Name: Active Cool 200 Fan
Part Number: 412140-B21
Spare Part Number: 413996-001
Version: 2.9
Diagnostic Status:
Internal Data OK
Location OK
Device Failure OK
Device Degraded OK
Troubleshooting 47
Page 48

Missing Device OK
Indicted OK
• show blade status all
sd-oa1> show blade status all
Blade #1 Status:
Power: On
Current Wattage used: 1100 Watts
Health: OK
Unit Identification LED: Off
Virtual Fan: 36%
Diagnostic Status:
Internal Data OK
Management Processor OK
Thermal Warning OK
Thermal Danger OK
I/O Configuration OK
Power OK
Cooling OK
Location OK
Device Failure OK
Device Degraded OK
iLO Network OK
Device Info OK
Firmware Mismatch OK
Mezzanine Card OK
Deconfigured OK
PDHC OK
Indicted OK
• show xfm status all
sd-oa1> show xfm status all
Bay 4 SXFM Status:
Health: OK
Power: On
Unit Identification LED: Off
Diagnostic Status:
Internal Data OK
Management Processor OK
Thermal Warning OK <<<
Thermal Danger OK <<<
Power OK
Firmware Mismatch OK
Indicted OK
Link 1: Dormant
Link 2: Dormant
Link 3: Dormant
Link 4: Dormant
• show interconnect status all
Interconnect Module #1 Status:
Status: OK
Thermal: OK
CPU Fault: OK
Health LED: OK
UID: Off
Powered: On
Diagnostic Status:
Internal Data OK
Management Processor OK
Thermal Warning OK <<<<
48 Troubleshooting
Page 49

Thermal Danger OK <<<<
I/O Configuration OK
Power OK
Device Failure OK
Device Degraded OK
Gathering failure information
To obtain information about failures recorded by the system, use the following commands:
• Show cae –L
sd-oa1> show cae -L
Sl.No Severity EventId EventCategory PartitionId
EventTime Summary
###########################################################################
#####
71 Critical 3040 System Coo... N/A Fri May 18 06:26:34
2012 SXFM air intake
or exhaust temperature...
70 Critical 3040 System Coo... N/A Fri May 18 04:56:22
2012 SXFM air intake
or exhaust temperature...
• show CAE –E -n <SI.No>
Use show CAE –E -n <SI.No> to obtain more details about specific events.
oa1> show cae -E -n 70
Alert Number : 70
Event Identification :
Event ID : 3040
Server blade appears non-functional
Provider Name : CPTIndicationProvider
Event Time : Fri May 18 04:56:22 2014
Indication Identifier : 8304020120518045622
Managed Entity :
OA Name : sd-oa1
System Type : 59
System Serial No. : USExxxxxS
OA IP Address : aa.bb.cc.dd
Affected Domain :
Enclosure Name : lc-sd2
RackName : sd2
RackUID : 02SGHxxxxAVY
Impacted Domain : Complex
Complex Name : SD2
Partition ID : Not Applicable
Summary :
XFM air intake or exhaust temperature is too hot
Full Description :
The air temperature measured at one of the XFM air intakes or exhausts is too hot to allow
normal operation. Measures are being taken to increase the cooling ability of the box, and
to reduce heat generation. If the temperature continues to increase, however, partitions
might be shut down to prevent hardware damage.
Probable Cause 1 :
Data center air conditioning is not functioning properly
Recommended Action 1 :
Fix the air conditioning problem
Probable Cause 2 :
The system air intake is blocked
Troubleshooting 49
Page 50

Recommended Action 2 :
Check and unblock air intakes
Replaceable Unit(s) :
Part Manufacturer : HPE
Spare Part No. : AH341-67001
Part Serial No. : MYJaaaaaWV
Part Location : 0x0100ff02ff00ff51 enclosure1/xfm2
Additional Info : Not Applicable
Additional Data :
Severity : Critical
Alert Type : Environmental Alert
Event Category : System Cooling
Event Subcategory : Unknown
Probable Cause : Temperature Unacceptable
Event Threshold : 1
Event Time Window (in minutes): 0
Actual Event Threshold : 1
Actual Event Time Window (in minutes): 0
OEM System Model : NA
Original Product Number : AH337A
Current Product Number : AH337A
OEM Serial Number : NA
Version Info :
Complex FW Version : 7.4.2
Provider Version : 8.34
Error Log Data :
Error Log Bundle : 4000000000000e41
Recommended troubleshooting methodology
The recommended methodology for troubleshooting a complex error or fault is as follows:
Procedure
1. Consult the system console for any messages, emails, or other items pertaining to a server blade error
or fault.
2. Use the SHOW PARTITION CONSOLELOG <nPar ID> on the Monarch OA to view information about
a particular partition.
3. Check the Insight Display for any error messages.
4. View the front panel LEDs (power and health), locally or remotely by using the OA CLI SHOW STATUS
commands, such as SHOW ENCLOSURE STATUS, SHOW COMPLEX STATUS, or SHOW BLADE
STATUS.
5. Use the Core Analysis Engine and Health Repository to discover faults, indictments, and
deconfigurations.
Use the SHOW CAE -L, Show CAE -En #### , and SHOW HR (and SHOW INDICT and SHOW
DECONFIG) from HR commands.
6. Perform the actions specified in the Action column.
7. If more details are required, see the Action column of the relevant table provided in this chapter. The
Action you are directed to perform might be to access and read one or more error logs (the event log
and/or the FPL).
You can follow the recommended troubleshooting methodology and use
Advanced troubleshooting, or go directly to the subsection of this chapter which corresponds with your
chosen entry point. The Troubleshooting entry points table below provides the corresponding subsection
50 Troubleshooting
Basic troubleshooting and
Page 51

or location title for the various entry points (for example, to start by examining the logs, go directly to
Using event logs on page 75).
Table 13: Troubleshooting entry points
Entry point Subsection or location
Front panel LEDs See Troubleshooting tables on page 52, Troubleshooting tools
Insight Display See Insight Display on page 114.
Log viewers See Using event logs on page 75.
Offline and Online Diagnostics See Troubleshooting tools on page 57.
Analyze events For information about using HPE Insight Remote Support to analyze
Developer log collection
The OA will automatically save a set of debug logs when it notices daemon failures on the PDHC or OA.
on page 57, and LEDs and components.
system events, see http://www.hpe.com/info/
insightremotesupport.
Retrieving existing developer logs
Existing developer logs can be copied to a USB thumb drive or FTP site.
Procedure
1. Set up an FTP server or insert a USB thumb drive into the enclosure DVD module USB port.
2. SHOW USBKEY
3. SHOW ARCHIVE
NOTE: Archives beginning with CH- are the automatically collected logs.
• For USB — enter COPY archive://CH-<archive name> USB <USB path>
• For FTP — enter COPY archive://CH-<archive name> FTP://<ftp path>
NOTE: The COPY command also supports additional protocols: TFTP, HTTP, HTTPS, SCP, and SFTP.
For more information about the COPY command, see the HPE Integrity Superdome X and Superdome
2 Onboard Administrator Command Line Interface User Guide.
4. CLEAR ARCHIVE
USB example:
zany-oa> SHOW ARCHIVE
Debug Logs Time
_______________________________________________ ____________________
archive://CH-zany-oa-20140529_1555–logs.tar.gz May 29, 2014 15:55
zany-oa> COPY archive://CH-zany-oa-20140529_1555–logs.tar.gz
Troubleshooting 51
Page 52

USB/dec/CH-zany-oa-20140529_1555–logs.tar.gz
The file archive://CH-zany-oa-20140529_1555–logs.tar.gz was successfully copied
to usb://d2/dec/CH-zany-oa-20140529_1555–logs.tar.gz.
Generating a debug archive
Use this procedure to generate a new debug archive, and then copy to a USB thumb drive or FTP site.
1. UPLOAD DEBUG ARCHIVE <customer name>
2. Set up an FTP server or insert a USB thumb drive into the enclosure DVD module USB port.
3. SHOW USBKEY
4. SHOW ARCHIVE
• for USB — enter COPY archive://<archive name> USB <USB path>
• for FTP — enter COPY archive://<archive name> FTP://<ftp path>
5. CLEAR ARCHIVE
FTP example:
zomok-oa? UPLOAD DEBUG ARCHIVE dec
zomok-oa> SHOW ARCHIVE
Debug Logs Time
________________________________________________ ____________________
archive://dec/zomok-oa-20140529_1513–logs.tar.gz May 29, 2014 15:13
archive://CH-zomok-oa-20140527_1605–logs.tar.gz May 27, 2014 16:05
archive://CH-zomok-oa-20140525_0534–logs.tar.gz May 25, 2014 05:34
zomok-oa> COPY archive://dec/zomok-oa-20140529_1513–logs.tar.gz
ftp://user:pass@16.114.160.113/zomok-oa-20140529_1513–logs.tar.gz
The file archive://dec/zomok-oa-20140529_1513–logs.tar.gz was successfully copied to
ftp://16.114.160.113/zomok-oa-20140529_1513–logs.tar.gz.
Troubleshooting tables
Cause
Use these troubleshooting tables to determine the symptoms or condition of a suspect server blade. Be
aware that the state of the front panel LEDs can be viewed locally or remotely using the SHOW BLADE
STATUS command from the OA CLI.
52 Troubleshooting
Page 53

Table 14: Basic troubleshooting
Step Condition Action
1 Server blade appears non-
functional – no front panel
LEDs are on and no fans are
running. OA CLI is running.
2a OA is not running; Health LED
is OFF and power icon is ON
or flashing (Only one OA is
installed).
NOTE: A single OA is not a
supported configuration.
Nothing is logged for this condition.
1. For new blade installations, review the installation
procedures.
2. Check the CAE to see if any issues have been reported.
3. Re-seat the server blade. It may take more than a minute
for the blade to fully power on.
4. As the last option, replace the server blade. The issue is
fixed when the front panel power icon is in one of the
following states:
• Flashing amber = Powered on, not active
• Green = Powered on and active
and the front panel Health icon LED is in one of the
following states:
• Off = Server blade not active; health is good.
• Green = Server blade active; health is good.
NOTE: You cannot access the OA at this time.
1. Verify that at least one upper and one lower power supply
has the following normal LED status:
• The power supply power LED is on.
• The power supply fault LED is off.
2. If the OA tray has a single OA installed, reseat the OA and
the OA tray.
3. If two OAs are installed, locate the OA with the Active LED
illuminated and either reset the active (not responding)
OA, or login to the standby OA CLI issued the FORCE
TAKEOVER command.
4. If the second (non-suspect) OA operates properly, then
replace the suspect OA.
The issue is fixed when OA CLI logs can be read and the
front panel OA Health LED is green.
Table Continued
Troubleshooting 53
Page 54

Step Condition Action
2b Blade Health LED is flashing
amber and OA CLI is running.
3a Cannot see UEFI prompt on
system console. UEFI is
running.
A warning or critical failure has been detected and logged
while booting or running system firmware. Examine the OA
CLI logs for events and perform corrective actions indicated.
The issue is fixed when the front panel Health icon LED is in
one of the following states:
• Off = Server blade not active; health is good.
• Green = Server blade active; health is good.
Nothing can be logged for this condition.
1. If the blade was able to join the partition but didn't reach
the UEFI prompt, then the issue might be I/O related.
Check the CAE for any issues with PCIe card drivers.
2. If the blade was not able to join the partition, then open the
Health Repository from the OA CLI using show hr
followed by the show indict and show deconf
commands to check for entries related to processors,
processor power modules, shared memory, and core I/O
devices.
3. If this is a console issue and no other hardware problems
are indicated, replace the Monarch blade.
3b Cannot find a boot disk. UEFI
is running.
The issue is fixed when the UEFI menu appears on the
system console.
Nothing might be logged for this condition.
1. Search for the boot disk path using the UEFI shell
(reconnect –r and map -r) command.
2. Check the I/O card driver settings in the UEFI Device
Manager Menu.
3. Examine the OA CLI logs for entries related to processors,
processor power modules, shared memory, and core I/O
devices. See Using event logs on page 75.
4. Review the OA SHOW ALL section for the SHOW SERVER
PORT MAP{bay} to verify that the SAN port is connected.
Then check the SAN switch for failures and verify the
correct configuration.
Table Continued
54 Troubleshooting
Page 55

Step Condition Action
3c PXE fails to find the boot file
on the network. UEFI is
running.
4 Cannot see OS prompt on
system console. OA CLI is
running.
Nothing can be logged for this condition.
1. Verify that the network interface is connected (ifconfig
—l). Verify that the Media State: is Media present.
2. If the network interface is connected, configure an IP
address using DHCP (ifconfig —s eth0 dhcp), check
the network interface again (ifconfig —l), and ping the
PXE server (ping <PXE IP> ).
If you are able to ping the PXE server, then the PXE boot
failure is probably a software issue and not related to the
system hardware.
Nothing can be logged for this condition.
Examine the OA CLI logs for entries related to OA modules,
processors, processor power modules, shared memory, and
core I/O devices. See Using event logs on page 75.
IRC or KVM can also be used.
The issue is fixed when the OS prompt appears on the
system console.
Troubleshooting 55
Page 56

Table 15: Advanced troubleshooting
Step Symptom/condition Action
5 Cannot read SEL. SEL logging has stopped (health is steady green and power
is steady green).
1. Examine console messages for any UEFI errors or
warnings about operation or communications.
2. Ensure that the Robust Store is functioning properly. Try to
read the FPL. If all Fans are green and reported as OK in
response to an OA CLI SHOW ENCLOSURE FAN ALL
command, then as a test, re-seat a single fan and verify
that this has generated a FPL and SEL entry.
The issue is fixed when the SEL resumes logging.
6 OS is nonresponsive after
boot
7a MCA occurs during partition
operation; the server blade
reboots the OS.
NOTE: Partition reboots OS
if enabled.
Front panel LEDs indicate that the server blade’s power is
turned on, and it is either booting or running the OS (for
example, health is steady green and power is steady green).
Nothing can be logged for this condition.
1. Examine the OA CLI logs for entries related to processors,
processor power modules, shared memory, and core I/O
devices. Make sure there are no indictments or any
hardware issue or known firmware issue. See Using
event logs on page 75.
2. Use the OA CLI TC command to initiate a TOC to reset the
partition.
3. Reboot the OS and escalate.
4. Obtain the system software status dump for root cause
analysis.
The issue is fixed when the OS becomes responsive and the
root cause is determined and corrected.
Front panel LEDs indicate that the server blade detected a
fatal error that it cannot recover from through OS recovery
routines (for example, health is flashing red and power is
steady green).
1. Capture the MCA dump with the OA CLI command, show
errdump all or show errdump dir mca, and then
show errdump bundle_ID <id> for the bundle of
interest.
56 Troubleshooting
2. Examine the OA CLI logs for entries related to processors,
processor power modules, shared memory, and core I/O
devices (See
details).
The issue is fixed when the root cause is determined and
corrected.
Using event logs on page 75 for more
Table Continued
Page 57

Step Symptom/condition Action
7b MCA occurs during partition
operation; server blade
reboot of OS is prevented.
NOTE: The troubleshooting
actions for this step are
identical to those in Step 7a,
except that the server blade
in this step must be powered
off, reseated and/or powered
back on, then rebooted.
(Server blade reboots OS
automatically if enabled.)
8 The OA CLI and GUI display
this message:
Data stored in the OA
and DVD module do not
match that in the
enclosure.
Front panel LEDs indicate that the server blade detected a
Critical (catastrophic or viral) bus error.
System firmware is running to gather and log all error data for
this MCA event.
1. Capture the MCA dump with the OA CLI command, show
errdump all or show errdump dir mca, and then
show errdump bundle_ID <id> for the bundle of
interest.
2. Examine the OA CLI logs for entries related to processors,
processor power modules, shared memory, and core I/O
devices. See
details.
The issue is fixed when the root cause is determined and
corrected.
Consult the Hewlett Packard Enterprise Support Center to
troubleshoot and fix this Rstore failure.
Using event logs on page 75 for more
The complex is
unusable. To recover,
fix this problem and
reboot the OA.
Troubleshooting tools
Cause
Server blades use LEDs and other tools to help troubleshoot issues that occur in the server blade.
LEDs and components
Server blade front panel components
Front panel icons are not visible unless the blade is powered on and the LEDs are lit.
In the following table, the Power and Health icons refer to an Active state. A blade is considered Active
when the partition containing this blade is booting or booted.
Troubleshooting 57
Page 58

Item Name Description
1 Power icon Indicates if the server blade is powered on and active.
Green = Powered on; active
Flashing amber = Powered on; not active
Off = No power supplied to the server blade
2 UID icon Blue = UID on
3 NIC icon 1 Indicates the status of the NIC.
Solid green = Network linked; no activity
Flashing green = Network linked, activity
4 NIC icon 2 Indicates the status of the NIC.
Solid green = Network linked; no activity
Flashing green = Network linked; activity
5 NIC icon 3 Indicates the status of the NIC.
Solid green = Network linked; no activity
Flashing green = Network linked; activity
6 NIC icon 4 Indicates the status of the NIC.
7 Health icon Off = Server blade not active; health good
58 Troubleshooting
Solid green = Network linked; no activity
Flashing green = Network linked; activity
Green = Server blade active; health good
Flashing amber = Degraded
Flashing red = Critical error
Page 59

Power supply LEDs
NOTE: The power supplies at the top of the enclosure are upside down.
Power LED 1 (green) Fault LED 2 (amber) Condition
Off Off No AC power to the power supply
On Off Normal
Off On Power supply failure
Fan LED
Troubleshooting 59
Page 60

LED color Fan status
Solid green The fan is working.
Solid amber The fan has failed.
Flashing amber See the Insight Display screen.
XFM LEDs and components
Item Name Description
1 UID LED Blue = UID on
2 Power LED Indicates if the module is
powered on.
Green = On
3 XFM crossbar fabric port 1
4 Link Cable Status LED 1 N/A for Integrity Superdome X
5 XFM crossbar fabric port 2
6 Link Cable Status LED 2 N/A for Integrity Superdome X
7 XFM crossbar fabric port 3
8 Link Cable Status LED 3 N/A for Integrity Superdome X
9 XFM crossbar fabric port 4
10 Link Cable Status LED 4 N/A for Integrity Superdome X
11 XFM crossbar fabric port 5
12 Link Cable Status LED 5 N/A for Integrity Superdome X
13 XFM crossbar fabric port 6
14 Link Cable Status LED 6 N/A for Integrity Superdome X
60 Troubleshooting
Table Continued
Page 61

Item Name Description
15 XFM crossbar fabric port 7
16 Link Cable Status LED 7 N/A for Integrity Superdome X
17 XFM crossbar fabric port 8
18 Link Cable Status LED 8 N/A for Integrity Superdome X
19 Health LED Flashing yellow = Degraded;
indicted
Off = The power is not turned on
Green = OK
Flashing red = Deconfigured
XFM2 LEDs and components
Item Name Description
1 UID LED Blue = UID on
2 Power LED Indicates if the module is
powered on.
Green = On
3 XFM crossbar fabric port 1
4 Link Cable Status LED 1 N/A for Integrity Superdome X
5 XFM crossbar fabric port 2
6 Link Cable Status LED 2 N/A for Integrity Superdome X
7 XFM crossbar fabric port 3
8 Link Cable Status LED 3 N/A for Integrity Superdome X
9 XFM crossbar fabric port 4
Table Continued
Troubleshooting 61
Page 62

Item Name Description
10 Link Cable Status LED 4 N/A for Integrity Superdome X
11 Health LED Flashing yellow = Degraded;
indicted
Off = The power is not turned on
Green = OK
Flashing red = Deconfigured
GPSM LEDs and components
Item Name Description
1 Door display power
connector
2 UID LED Blue = UID on
3 Health LED Flashing yellow = Degraded; indicted
4 CAMNet port 1 N/A for Integrity Superdome X
5 CAMNet port 2 N/A for Integrity Superdome X
6 CAMNet port 3 N/A for Integrity Superdome X
7 CAMNet port 4 N/A for Integrity Superdome X
8 CAMNet port 5 N/A for Integrity Superdome X
9 CAMNet port 6 N/A for Integrity Superdome X
Unused for Integrity Superdome X systems
Off = The power is not turned on
Green = OK
Flashing red = Deconfigured
10 CAMNet port 7 N/A for Integrity Superdome X
11 CAMNet port 8 N/A for Integrity Superdome X
62 Troubleshooting
Table Continued
Page 63

Item Name Description
12 Local Clock Distribution
LED
13 External Clock Input LED Indicates the status of the global clock signal distributed to connected
14 Global clock connector 3
15 Global clock connector 2
16 Global clock connector 1
17 Enclosure DVD module
USB port
OA module LEDs and components
Indicates the status of the global clock signal distributed to blades in
the compute enclosure.
Green = OK
Flashing yellow = Critical error
enclosures.
Flashing green = No clock signal expected
Unused for this release of the system.
NOTE: To ensure proper system functionality, you must connect the
USB cable between the OA module and the GPSM.
Troubleshooting 63
Page 64

Item Name Description
1 Reset button For the different uses of this button, see the HPE Integrity
Superdome X and Superdome 2 Onboard Administrator User
Guide.
2 OA management LAN port Standard CAT5e (RJ-45) Ethernet port (100/1000Mb) which
provides access to the management subsystem. Access to the
OA's CLI and GUI interfaces, interconnect modules, and iLO
features, such as Virtual Media, requires connection to this port.
3 UID LED Blue = UID on
4 Active OA LED Indicates which OA is active
5 Health LED Green = OK
Red = Critical error
6 USB USB 2.0 Type A connector used for connecting the enclosure DVD
module. Connects to the USB mini-A port on the GPSM.
NOTE: You must connect the USB cable between the OA module
and the GPSM to ensure proper system functionality.
7 Serial debug port Serial RS232 DB-9 connector with PC standard pinout.
IMPORTANT: This port is for OA debug use only, and
should not be connected during normal system operation.
8 VGA VGA DB-15 connector with PC standard pinout. To access the
KVM menu or OA CLI, connect a VGA monitor or rack KVM
monitor for enclosure KVM.
DVD module LEDs and components
Item Name Description
1 USB connector
2 DVD tray
64 Troubleshooting
Table Continued
Page 65

Item Name Description
3 DVD activity LED
4 Tray open/close button
5 Manual tray release
6 Health LED Green = OK
7 UID LED Blue = UID on
OA GUI
The OA GUI provides partition status and FRU information. For more information on using the OA GUI,
see the HPE Integrity Superdome X and Superdome 2 Onboard Administrator User Guide.
NOTE:
CAE events and errdump information is not available using the GUI. You must use the command line for
this information.
Flashing yellow = Critical error
Health Repository viewer
The Health Repository User Interface displays the information from the HR database. The HR database
contains current state and history covering both service events and the results of error events analysis.
The following information is available in the HR display:
• Description of each failure event on the system that results in a service request, even after a
component is removed or replaced.
• History of component identities.
Information in the HR database is stored as installation and action records. These records are organized
with component physical location as the key.
Indictment Records
Indictment refers to a record specifying that a component requires service. The component or a
subcomponent might or might not be deconfigured as a result. Each indictment record contains the
following information:
• The time of the error.
• The cause of the error.
• The subcomponent location of the error (when analysis allows).
In cases when the failing component cannot be identified with certainty, analysis indicts the most probable
component that will need to be replaced to solve the problem. Other components that might have been
responsible can be identified as suspects by writing a suspicion record. A suspicion record contains the
same fields as an indictment record.
Troubleshooting 65
Page 66

Deconfiguration is the act of disabling a component in the system. This happens when analysis finds that
a component has a serious fault. A components deconfiguration status is composed of the following
parts:
• requested state—What the user or Analysis Engine would like to have the component set to.
• current state—How the component is actually configured in the system.
IMPORTANT:
Deconfiguration requests for components in active nPars cannot be acted on until the nPar
experiences a power-off/power-on cycle.
Acquitting indictments
Acquitting refers to clearing the component indictment and deconfiguration statuses, and is done when
the part is serviced. Acquittals happen automatically in the following situations:
• Component insertion—HR will assume that a component inserted into the system has received any
required service. This applies to any components contained within the inserted unit as well. For
example, DIMMs and CPU sockets on an inserted blade will be acquitted. Any deconfigurations will be
reversed.
• AC power cycle or CLI poweron xfabric command — HR will assume that the required service has
been accomplished for the entire complex. All FRUs and sub-FRUs will be acquitted and reconfigured.
• Cohort acquittal—When analysis of a single fault event results in indictment or suspicion records
against multiple components, the records are linked together. If one is acquitted, the acquittal will be
passed to the cohort FRUs as well.
• HR test commands—The test camnet and test clocks commands will acquit all indictments
specific to the test to be executed. Resources that fail the test will be re-indicted as the test completes.
The test fabric command acquits each type (fabric, CAMNet, Global Clock) of indictment before
initiating the test.
NOTE: Indictments indicating faults in subcomponents not targeted by the tests will not be acquitted.
For example, a blade indictment for CPU fault will not be acquitted by any of these test commands.
• Manual Acquittal—The HR UI includes an acquit command that uses the component physical location
or resource path as a parameter. Like other acquittals, the acquittal will act on all indictments for that
component.
• Component resumes normal function.
In most cases resumption of function will not cause automatic acquittal. Component replacement,
complex AC power cycle or manual acquittal is required. Examples are as follows:
◦ BPS indicted for loss of AC input regains power input.
◦ Environmental temperature returns to within acceptable bounds.
◦ Enclosure regains sufficient power.
◦ Enclosure regains sufficient cooling.
66 Troubleshooting
Page 67

Viewing the list of indicted components
The show indict command will list the currently indicted components for the complex describing the
type, physical location, indication of the cause for indictment, and timestamp.
myhost HR> show indict
System Indictment List - Wed Oct 29 08:06:03 2014
--------------------------------------------------
FRU Type: Blade DIMM
Location: 0x0100FF0101180B74 enclosure1/blade1/cpusocket1/dimm18
Timestamp: Wed Oct 29 09:11:12 2014
Indictment State: Indicted
Requested Deconfig State: Configured
Current Deconfig State: Configured
dimm-1/1/1/18 Location: 18B
Status: OK No Errors Logged.
Viewing deconfigured components
The show deconfig command will list all components in the complex which are deconfigured or have a
pending request to be deconfigured. The output includes the type, physical location, indication of the
cause for indictment, and timestamp.
myhost HR> show deconfig
System Deconfiguration List - Fri Jun 26 16:54:36 2015
--------------------------------------------------
FRU Type: Blade DIMM
Location: 0x0100FF0600010A74 enclosure1/blade6/cpusocket0/dimm1
Timestamp: Fri Jun 26 16:34:59 2015
Indictment State: Indicted
Requested Deconfig State: Deconfigured
Current Deconfig State: Deconfigured
dimm-1/6/0/1 Location: 1A
Status: OK No Errors Logged.
FRU Type: Blade DIMM
Location: 0x0100FF0600060A74 enclosure1/blade6/cpusocket0/dimm6
Timestamp: Fri Jun 26 16:35:24 2015
Indictment State: Indicted
Requested Deconfig State: Deconfigured
Current Deconfig State: Deconfigured
dimm-1/6/0/1 Location: 6A
Status: OK No Errors Logged.
---end report --- 2 records shown
To see details about a specific FRU, use 'show <loc>|<path>'
To see additional deconfiguration details, use 'show deconfig alldata'
Items listed as "Configured" may have deconfigured sub components
myhost HR>
Troubleshooting 67
Page 68

NOTE: The requested and current deconfiguration states shown in the examples above are not the same.
This can happen when requested deconfiguration changes are not be to acted on until the n-Par
containing the component in question is rebooted.
DIMMs might be deconfigured without being indicted or even suspected. Some faults isolated to CPU
sockets or blades might require deconfiguration of whole or portions of memory subsystems by physically
deconfiguring the DIMMs supported by that resource. Only indicted components should be replaced.
Additional DIMMs that are deconfigured without being indicted are not faulty components and should not
be replaced.
Viewing indictment acquittals
The show acquit command will list all components in the complex which have had indictments
acquitted. The output includes the type, physical location, indication of the cause for indictment, and
timestamp.
myhost HR> show acquit
System Acquittal History - Mon May 18 16:11:28 2014
--------------------------------------------------
FRU Type: Blade DIMM
Location: 0x0100FF0200160A74 enclosure1/blade2/socket0/dimm16
Timestamp: Mon May 18 16:11:19 2009
Indictment State: Acquitted
Requested Deconfig State: Configured
Current Deconfig State: Deconfigured
FRU Type: CPU Socket
Location: 0x0100FF01FF00FF11 enclosure1/blade1/socket0
Timestamp: Mon May 18 16:11:19 2009
Indictment State: Acquitted
Requested Deconfig State: Configured
Current Deconfig State: Deconfigured
--- end report --- 2 records shown
NOTE: The requested and current deconfiguration states shown in the examples above are not the same.
This can happen when requested deconfiguration changes are not be acted on until the n-Par containing
the component in question is rebooted.
Viewing recent service history
You can view the recent service history using the show acquit command. To view the installation
history for the acquitted locations, enter show <physical location>|<resource path>.
Physical Location installation and health history
The show <physical location>|<resource path> command returns the entire stored
installation and health history of a physical location. This includes up to two previous components
installed at this location. The history will include previous indictments, with or without acquittals, rather
than just the indictments.
NOTE:
The following example illustrates BL920s Gen8 blades. The history display for BL920s Gen9 blades is
equivalent but will include different hardware.
68 Troubleshooting
Page 69

2014-03-17 14:12 hpsl18-4 HR> show 0x0100FF0100060A74
Location Installation/Health History - Mon Mar 17 14:12:52 2014
--------------------------------------------------
FRU Type: Blade DIMM
Location: 0x0100FF0100060A74 enclosure1/blade1/cpusocket0/
dimm6
Timestamp: Mon Mar 17 07:42:28 2014
Indictment State: Indicted
Requested Deconfig State: Deconfigured
Current Deconfig State: Deconfigured
dimm-1/1/0/6 Location: 6A
Status: OK No Errors Logged.
--- Install History 1 ---
Discovery: Indictment
Timestamp: Mon Mar 17 04:42:18 2014
(Detailed info about the FRU is provided here if it exists. E.g., for CPUs,
max freq will be provided here. If no data, the section is omitted.)
Serial Num: 1X123456
Parent Serial: MYJ245041R
Part Num: XXX12AB3CDE4A-F5
Spare Part Num: XXX12AB3CDE4A-F5
Manufacturer ID: XX (manufacturer_name)
Product Name: DDR3 DIMM
DIMM size: 8192 MB
HPE DIMM: None
--- Action - Deconfigure ---
Event No: 7004
Provider: MemoryIndicationProvider
(Text reason and description of problem from WS-Man alert.)
Reason: Memory Uncorrectable Error.
Description: Memory Uncorrectable Error - An uncorrectable memory
error has
occurred most likely in the server's memory DIMMs, or the blade.
Bundle ID: 0x011000000000AF3D
Alert ID: 2700420140317074056
Serial Num: 1X123456
Product Name: DDR3 DIMM
- Indicted / Acquitted -
Type Timestamp Entity Reason
Ind Mon Mar 17 07:40:52 2014 CAE See reason above.
---
(SubFRUs requiring service are shown here. If none, the section is omitted.)
- SubFru Isolation -
Entire FRU indicted.
---
(Deconfigured SubFRUs are shown here. If none, the section is omitted.)
- SubFru Deconfiguration -
Entire FRU deconfigured.
---
(Cohorts are shown here. If none, the section is omitted.)
- Related Locations -
0x0100FF0100010A74 Path: dimm-1/1/0/1
0x0100FF01FF00FF11 Path: cpusocket-1/1/0
0x0100FF01FFFFFF94 Path: blade-1/1
---
--- Action - Acquit ---
Event No: 7004
Provider: MemoryIndicationProvider
Troubleshooting 69
Page 70

Reason: Memory Uncorrectable Error.
Description: Memory Uncorrectable Error - An uncorrectable memory
error ha
s occurred most likely in the server's memory DIMMs, or the blade.
Bundle ID: 0x011000000000AF3A
Alert ID: 2700420140317044214
Serial Num: 1X123456
Product Name: DDR3 DIMM
- Indicted / Acquitted -
Type Timestamp Entity Reason
Ind Mon Mar 17 04:42:10 2014 CAE See reason above.
Acq Mon Mar 17 07:02:28 2014 User User request.
---
- SubFru Isolation -
Entire FRU indicted.
---
- SubFru Deconfiguration -
Entire FRU deconfigured.
---
- Related Locations -
0x0100FF0100010A74 Path: dimm-1/1/0/1
0x0100FF01FF00FF11 Path: cpusocket-1/1/0
0x0100FF01FFFFFF94 Path: blade-1/1
---
--- end report --- 1 records shown
Subcomponent isolation and deconfiguration displays
Subcomponent isolation refers to the subcomponents of a part that can require service. In these cases,
the component is indicted because the only way the subcomponent can be serviced is by removing and
servicing the entire component.
Subcomponent deconfigurations are also possible. These are indications of subcomponent failures.
The show <location> and show fru command output might contain “SubFru Isolation” and “SubFru
Deconfiguration” sections to communicate subcomponent health information. If a subcomponent
deconfiguration event occurs, the corresponding subcomponent Isolation will also be set, which triggers
an indictment of the parent component.
The sections below show examples of how the subcomponent isolation sections look.
NOTE:
The format of the deconfiguration sections look identical to those for Isolation so are not shown in the
following sections.
Blade subcomponent displays
There are several different types of subcomponent displays which can be provided for blades.
DIMMs
The DIMM subFru Isolation display is different from other subFru Isolation displays in that it
communicates DIMM loading order issues rather than faults in the subFRUs. A “1” in the display below
means the DIMM is present but not used due to a loading order issue and “0” means there is no problem
with that DIMM location. This display along with the OA CLI show blade info command output can be
used to determine which DIMMs are present and which are associated with DIMM loading errors.
- SubFru Isolation -
- Blade -
- DIMM Loading Status -
CPU0: 1A - 6A - 19A - 24A
70 Troubleshooting
Page 71

0 0 0 1 <- Indicates loading error for DIMM 24A
7B - 12B - 13B - 18B (DIMMS 1A, 6A, 19A are OK)
0 0 0 0
2C - 5C - 20C - 23C
0 0 0 0
8D - 11D - 14D - 17D
0 0 0 0
3E - 4E - 21E - 22E
0 0 0 0
9F - 10F - 15F - 16F
0 0 0 0
CPU1: 1A - 6A - 19A - 24A
0 0 0 1
7B - 12B - 13B - 18B
0 0 0 0
2C - 5C - 20C - 23C
0 0 0 0
8D - 11D - 14D - 17D
0 0 0 0
3E - 4E - 21E - 22E
0 0 0 0
9F - 10F - 15F - 16F
0 0 0 0
Manageability HW
- SubFru Isolation -
- Blade -
- Manageability HW –
-0- -1- -2-
CamNet: 0 0 .
LOM: 0 0 0
-----------------------------
COMPONENT: Fault
---
NOTE:
For Integrity Superdome X, there are FlexLOMs instead of LOMs. Each FlexLOM has its own physical
location. Therefore, indictments against FlexLOMs are issued against the FlexLOM physical location,
rather than indicting the blade and setting one of the LOM bits. The blade SubFru isolation display will
continue to show LOM bits, but these should always have a value of 0.
Components supported by this display are as follows:
• PDHC
• OA_LAN
• USB
• NAND_Flash
• NOR_Flash
• SRAM
• PDH_FPGA
• LPM_FPGA
• RTC
Troubleshooting 71
Page 72

• PDH_SRAM
• iLO
Agent fabric
- SubFru Isolation -
- Blade -
- XNC -
-------------------------------
Entity name: Fault [Only the flagged entity is listed.]
---
Where Entity name is one of the following:
XNC
XNC is flagged
WJ Port n
Entire port is flagged
WJ Port n
Link Upper Half (Upper port flagged)
WJ Port n
Link Lower Half (Lower port flagged)
QPI Link n
Entire link is flagged
QPI Link n Reduced Width
Link is running at some reduced width
Where n for WJ links can range from 0 to 7 and for QPI links can range from 0 to 2.
The SubFRU deconfiguration display section has the same layout as the SubFru Isolation display.
Memory subsystem
- SubFru Isolation -
- Blade -
- Memory Subsystem -
Socket: 0 Memory Controller: 0
Memory SMI DDR
Buffer Channel Channel
-0--1- -0--1-
0: 0 0 0 0 0
1: 0 0 0 0 0
The SubFRU deconfiguration display section has the same layout as the SubFru Isolation display.
Connections for I/O components
- SubFru Isolation -
- Blade -
- IO -
-------------------------------
Component: Fault
Possible values of Component are:
72 Troubleshooting
Page 73

• LOM1-DC
• LOM2-DC
• Mezz 1
• Mezz 2
• Mezz 3
• FPGA
• PDHC
• PCH
• iLO
• VRD
NOTE:
LOM#-DC == FlexLOM#.
The OA CLI SHOW CAE command can identify specific VRDs associated with these faults. See Core
Analysis Engine on page 80 for more information.
The SubFRU deconfiguration display section has the same layout as the SubFru Isolation display.
CPU socket subcomponent displays
There are three different sets of CPU subcomponent data, contained in three different displays.
CPU core
- SubFru Isolation -
- Processor Module: Intel Xeon (R) E7-8800 processor -
- Core 0 -
FLD FLI MLD MLI LL
Cache: 0 0 0 0 0
TLB: 0 0 0 0 .
• FL indicates ‘First Level’ and corresponds to the L1 cache.
• ML indicates ‘Mid Level’ and corresponds to the L2 cache.
• LL indicates ‘Last Level’ and corresponds to the L3 cache.
• I indicates ‘Instruction.’ For example, the FLI cache is the First Level Instruction cache.
• D indicates ‘Data.’ For example, the MLD cache is the Mid Level Data cache.
VRMs supported by this display are as follows:
• FP_regs
• GP_regs
• other (an unspecified fault has been identified within the processor core)
CPU memory
Troubleshooting 73
Page 74

- SubFru Isolation -
- Processor Module: Intel Xeon (R) E7-8800 processor -
- Memory –
-0- -1-
Mbox: 0 0
CPU Uncore
- SubFru Isolation -
- Processor Module: Intel Xeon (R) E7-8800 processor -
- Uncore -
-0- -1- -2-
R-QPI: 0 0 0
UBOX/PMU: 0 . .
CPU integrated I/O ports
- SubFru Isolation -
- Processor Module: Intel Xeon (R) E7-8800 processor -
- IIO -
Root Port ID 0x0 (DMI): 0
Root Port ID 0x3 (2A): 0
Root Port ID 0x5 (2C): 0
Root Port ID 0x7 (3A): 0
Root Port ID 0x9 (3C): 0
IIO: Fault
The last line is printed only when an I/O error occurs that is unrelated to any port.
GPSM subcomponent displays
- SubFru Isolation -
- GPSM -
- CAMNet Ports -
1 - 2 - 3 - 4 - 5 - 6 - 7 - 8
SW Port: 0 0 0 0 0 0 0 0
Blade: 0 0 0 0 0 0 0 0
OA: 0 0 . . . . . .
XFM: 0 0 0 0 . . . .
Other GSPM: 0 . . . . . . .
FPGA: 0 . . . . . . .
---
OA subcomponent display
- SubFru Isolation -
- OA -
- CAMNet Ports -
-A- -B-
Port: 0 1
---
XFM subcomponent display
- SubFru Isolation -
- XFM -
- Fabric Ports -
0- 1- 2- 3- 4- 5- 6- 7- 8- 9-10-11-12-13-14-15-16-17-18-19
Upper: 0 0 0 0 0 0 0 0 0 0 0 0 0 0 0 1 0 0 0 0
Lower: 0 0 0 0 0 0 0 0 0 0 0 0 0 0 0 1 0 0 0 0
------------------------------------------------------------------
74 Troubleshooting
Page 75

VRM: Fault
---
VRMs reported by this display are as follows:
• V3P3_STBY
• V2P5_STBY
• V1P2_STBY
• V1P8_0
• V1P8_1
• V1P2
• CAMNET_A
• CAMNET_B
Using event logs
Event logs are generated by software or firmware when an event is detected. Some events that cause
event records to be generated are as follows:
• Hardware-related.
◦ Example: DIMM, CPU, VRM, XNC, or PCI-BUS failures.
• Software-related.
◦ Example: indicating that firmware or software reached a certain point in the code, or that a certain
amount of time has passed, for example when a QPI LINK has a timeout.
The OA can timestamp and filter events, then store and transfer them to event log readers. Log entries
can be read by management applications in the following:
• OSs
• OAs
• SEL viewers
• FPL viewers
• Live Event viewers
• EAE
Log entries can be cleared by OS management applications or by the OA itself.
Events are classified into a number of severity levels, ranging from critical failure to non-error forward
progress notification. The severity level is encoded in the alert level data field on an event record.
Different system actions might result from generation of an event record, depending on alert level.
Live viewer
The live event viewer provides a way for you to see records as they occur. The OA supports multiple
simultaneous live event viewers that are created and destroyed dynamically when requested. The
Troubleshooting 75
Page 76

maximum number of simultaneous live event viewers is limited by the number of connections supported
by the OA.
Each live event viewer works independently from any other event viewer, meaning that each live event
viewer can select its own filter and format options without affecting other live event viewers.
The log can be filtered using the following items:
• blade number
• partition number
• alert level
The following format options are also available:
• Keyword—This is the default format for all viewers. The keyword format supplies the following
information about an event:
◦ log number (not for livelogs)
◦ reporting entity type
◦ reporting entity ID
◦ alert level
◦ hexadecimal dump of event records
◦ event ID keyword
• Raw hex—The raw hex format supplies the following information about an event:
◦ hexadecimal dump of event records
• Text—The text format supplies the following information about an event:
◦ log number (not for livelogs)
◦ timestamp
◦ alert level
◦ event ID keyword
◦ brief text description
◦ reporting entity type
◦ reporting entity ID
◦ hexadecimal dump of event records
• Problem/Cause/Action—The Problem/Cause/Action format displays a problem/cause/action statement
in addition to the summary and other fields displayed by the text formatter.
To connect to the live log viewer, enter the SHOW LIVELOGS command on the Monarch OA.
NOTE:
The option C can be used to display column header information at any point of time while in the Live
viewer. The column header corresponding to the event viewer format currently active will be displayed.
76 Troubleshooting
Page 77

Welcome to the Live Event Viewer
WARNING: Due to connection speed and/or to the number
of events being generated and/or to the format
option selected, the live event viewer might
silently drop events.
The following event format options are available:
K: Keyword
E: Extended Keyword
R: Raw hex
T: Text
S: Cause/Action
The following alert filter options are available:
Alert filter will cause events at the selected alert filter
and below to be shown
0: Minor Forward Progress
1: Major Forward Progress
2: Informational
3: Warning
5: Critical
7: Fatal
The following event filter options are available:
B: Blade
P: Partition
V: Virtual Partition
U: Unfiltered
Current alert threshold: Alert threshold 0
Current filter option: Unfiltered
Current format option: Extended Keyword
Select new filter/format option, or <ctrl-b> to exit or <cr> to
resume display of live events, or H/? for help or 'C' to
display column header information
Location: Enclosure, Device Bay, Socket, Core, Thread AL: Alert Level
Rep Location nPar: AL Encoded Field Data Field Keyword
Ent vPar Timestamp
PDHC 1,1 1 1 36801d1000e10000 0400087c0efa0321 MFW_CONSOLE_VUARTD_START
03/17/2014 14:26:49
PDHC 1,1 1 1 2b001edd00e10000 0140000153274c79 LAUNCHING_PARTITION
03/17/2014 14:26:49
PDHC 1,1 1 0 07801eb800e10000 0000000010000000 FHW_NOTIFY_CFW
03/17/2014 14:26:49
SFW 1,1,0,0,0 1 0 0100232501e10000 000000006f452000 BOOT_LOAD_FW_ADDR
SFW 1,1,0,0,0 1 0 0900232401e10000 652e6c7049657844 BOOT_LOAD_FW_MODULE
PDHC 1,1 1 1 36801df200e10000 0000000000000000 ELS_START_PARTITION
03/17/2014 14:26:50
OA 1,1 None 0 168024b600e10000 0000000000000000 ELS_OA_SAVE_RECOV_FILE
03/17/2014 14:26:50
SEL and FPL viewers
Both the SEL and FPL viewers provide a way for OA users to view stored event records. The OA
supports multiple simultaneous viewers. The maximum number of viewers is limited by the number of
connections supported by the OA. Each viewer works independently from any other viewer, meaning
each viewer can select its own filter options without affecting other viewers.
The logs can be filtered using the following items:
• blade number
• cabinet number (not applicable for this release)
Troubleshooting 77
Page 78

• partition number
• alert level
The following format options are also available:
• Keyword—This is the default format for all viewers. The keyword format supplies the following
information about an event:
◦ log number
◦ reporting entity type
◦ reporting entity ID
◦ alert level
◦ hexadecimal dump of event records
◦ event ID keyword
• Raw hex—The raw hex format supplies the following information about an event:
◦ hexadecimal dump of event records
• Text—The text format supplies the following information about an event:
◦ log number
◦ timestamp
◦ alert level
◦ event ID keyword
◦ brief text description
◦ reporting entity type
◦ reporting entity ID
◦ hexadecimal dump of event records
• Problem/Cause/Action—The Problem/Cause/Action format displays the problem/cause/action
statement in addition to the summary and other fields displayed by the text format.
NOTE:
The display of column headers can be turned on or off using toggle option C. By default, the column
header will be on.
To connect to the FPL viewer, enter the SHOW FPL command on the Monarch OA.
Welcome to the Forward Progress Log (FPL) Viewer
The following FPL navigation commands are available:
D: Dump log starting at current block for capture and analysis
F: Display first (oldest) block
L: Display last (newest) block
J: Jump to specified entry and display previous block
+: Display next (forward in time) block
-: Display previous (backward in time) block
<cr>: Repeat previous +/- command
<sp>: Repeat previous +/- command
/: Search forward for input string
\: Search backwards for input string
78 Troubleshooting
Page 79

I: Changes between case sensitive and insensitive search
N: Perform previous search using last input string
?/H: Display help
C: Toggle display of column header
<Ctrl-b>: Exit viewer
The following event format options are available:
K: Keyword
E: Extended Keyword
R: Raw hex
T: Text
S: Cause/Action
The following alert threshold options are available:
Alert thresholds will cause events at the selected threshold
and below to be shown
0: Minor Forward Progress
1: Major Forward Progress
2: Informational
3: Warning
5: Critical
7: Fatal
The following event filter options are available:
B: Blade
P: Partition
V: Virtual Partition
U: Unfiltered
Current alert threshold: Alert threshold 0
Current filter option: Unfiltered
Current format option: Extended Keyword
MP:VWR (<cr>,<sp>,+,-,?,H,C,F,I,L,J,D,K,E,R,T,B,P,V,U,/,\,N,0,1,2,3,5,7,<Ctrl-b>) >
Location: Enclosure, Device Bay, Socket, Core, Thread AL: Alert Level
Event# Rep Location nPar: AL Encoded Field Data Field Keyword
Ent vPar Timestamp
5512567 SFW 1,1,0,0,0 1 0 160024d301e10000 0000010300000000 IO_PROCESS_OPTION_ROM
5512566 SFW 1,1,0,0,0 1 0 16002af201e10000 000000000005211b IO_UEFI_DRIVER_VERSION
5512565 SFW 1,1,0,0,0 1 0 0100232501e10000 0000000078376000 BOOT_LOAD_FW_ADDR
5512564 SFW 1,1,0,0,0 1 0 16002ad601e10000 0000000010000000 BOOT_LOAD_FW_ADDR_PREF
5512563 SFW 1,1,0,0,0 1 0 160024d301e10000 0000010200000000 IO_PROCESS_OPTION_ROM
5512562 SFW 1,1,0,0,0 1 0 0100232501e10000 00000000783d0000 BOOT_LOAD_FW_ADDR
5512561 SFW 1,1,0,0,0 1 0 16002ad601e10000 0000000010000000 BOOT_LOAD_FW_ADDR_PREF
5512560 SFW 1,1,0,0,0 1 0 160024d301e10000 0000010100000000 IO_PROCESS_OPTION_ROM
5512559 SFW 1,1,0,0,0 1 0 16002af201e10000 00000000004900a9 IO_UEFI_DRIVER_VERSION
5512558 SFW 1,1,0,0,0 1 0 0100232501e10000 0000000078436000 BOOT_LOAD_FW_ADDR
5512557 SFW 1,1,0,0,0 1 0 16002ad601e10000 0000000010000000 BOOT_LOAD_FW_ADDR_PREF
5512556 SFW 1,1,0,0,0 1 0 160024d301e10000 0000010000000000 IO_PROCESS_OPTION_ROM
5512555 SFW 1,1,0,0,0 1 0 160024d901e10000 0000000000000000 IO_STARTING_PCIE_DEVIcES
5512554 OA 1,1 1 1 368022ef00e10000 2143000000000000 PARCON_VPAR_POWERON_COMPLETE
5512554 03/17/2014 14:28:02
5512553 OA 1,1 1 0 1680264000e10000 2143000200010000 PARCON_VPAR_OPERATION
5512553 03/17/2014 14:28:02
5512552 OA 1,1 1 1 34801f4400e10000 0610000000000000 PARCON_NPAR_STATE_CHANGE
5512552 03/17/2014 14:27:57
5512551 OA 1,1 1 0 1680264000e10000 213a000200170000 PARCON_VPAR_OPERATION
5512551 03/17/2014 14:27:57
To connect to the SEL viewer, enter the SHOW SEL command.
Welcome to the System Event Log (SEL) Viewer
The following SEL navigation commands are available:
D: Dump log starting at current block for capture and analysis
F: Display first (oldest) block
L: Display last (newest) block
J: Jump to specified entry and display previous block
+: Display next (forward in time) block
-: Display previous (backward in time) block
<cr>: Repeat previous +/- command
<sp>: Repeat previous +/- command
/: Search forward for input string
\: Search backwards for input string
I: Changes between case sensitive and insensitive search
Troubleshooting 79
Page 80

N: Perform previous search using last input string
?/H: Display help
C: Toggle display of column header
<Ctrl-b>: Exit viewer
The following event format options are available:
K: Keyword
E: Extended Keyword
R: Raw hex
T: Text
S: Cause/Action
The following alert threshold options are available:
Alert thresholds will cause events at the selected threshold
and below to be shown
2: Informational
3: Warning
5: Critical
7: Fatal
The following event filter options are available:
B: Blade
P: Partition
V: Virtual Partition
U: Unfiltered
Current alert threshold: Alert threshold 2
Current filter option: Unfiltered
Current format option: Extended Keyword
MP:VWR (<cr>,<sp>,+,-,?,H,C,F,I,L,J,D,K,E,R,T,B,P,V,U,/,\,N,2,3,5,7,<Ctrl-b>) >
Location: Enclosure, Device Bay, Socket, Core, Thread AL: Alert Level
Event# Rep Location nPar: AL Encoded Field Data Field Keyword
Ent vPar Timestamp
62384 SFW 1,3,0,0,0 3 2 43882ae601e17833 0000000000000044 MEM_ADDRESS_WIDTH
62384 03/17/2014 13:41:20
62383 SFW 1,3,0,0,0 3 2 43882adc01e17831 0000000000000002 MEM_RAS_MODE_ENABLED
62383 03/17/2014 13:41:19
62382 SFW 1,3,0,0,0 3 2 5188297a01e1782f 0000000000000709 CPU_MICROCODE_REVISION
62382 03/17/2014 13:41:18
62381 SFW 1,3,0,0,0 3 2 5188252501e1782d 0000001202450231 BOOT_ROM_REVISION
62381 03/17/2014 13:41:18
62380 SFW 1,3,0,0,0 3 2 43882ae601e1782b 0000000000000044 MEM_ADDRESS_WIDTH
62380 03/17/2014 13:41:13
62379 SFW 1,3,0,0,0 3 2 43882adc01e17829 0000000000000002 MEM_RAS_MODE_ENABLED
62379 03/17/2014 13:41:13
62378 SFW 1,3,0,0,0 3 2 5188297a01e17827 0000000000000709 CPU_MICROCODE_REVISION
62378 03/17/2014 13:41:11
62377 SFW 1,3,0,0,0 3 2 5188252501e17825 0000001202450231 BOOT_ROM_REVISION
62377 03/17/2014 13:41:11
62376 OA 1,1 None 2 438026d700e17823 40000000000266f6 HR_ELS_WRITE_LOG
62376 03/17/2014 13:40:59
62375 PDHC 1,3 3 2 4480223820e17821 0100ff03ffffff94 DIMM_LOADING_ORDER_DONE
62375 03/17/2014 13:40:58
62374 OA 1,1 None 2 43801fa300e1781f 413000000000101f CAE_FRU_INDICTMENT
62374 03/17/2014 13:40:54
Core Analysis Engine
The CAE is a diagnostic tool that analyzes system errors and generates events that provide detailed
descriptions of severity, probable cause, recommended action, replaceable units, and more. It also
initiates self healing corrective actions.
Run the SHOW CAE command with the following options:
SHOW CAE {-L <arguments> | -E <arguments> | -C <arguments>}
To see CAE event viewer options, run the following:
OA-CLI> SHOW CAE -h
80 Troubleshooting
Page 81

SHOW CAE : This command can be used to view/clear the indications using the
following options
(-L) [(-e) ([eq:|ne:|le:|ge:](0|1|2|3|4|5|6|7))] |
(-L) [(-e) ([bw:(0|1|2|3|4|5|6|7),](0|1|2|3|4|5|6|7))] : Search
based on severity values:
Unknown(0),Other(1),Information(2),Degraded/Warning(3),
Minor(4),Major(5),Critical(6),Fatal/NonRecoverable(7)
(-L) [(-i) (<Event ID> [,<Event ID>])] : Search
based on Event Id
(-L) [(-v) (<EventCategory Name>[,<EventCategory Name>] | all)] : Search
based on event category name or view all category names
(-L) [(-p) (<npar[:vpar]>|complex)] : Search
based on partition id or complex
(-L) [(-t) ([eq:|le:|ge:]<mm:dd:yyyy:hh:mi:ss> ] |
(-L) [(-t) ([bw:<mm:dd:yyyy:hh:mi:ss>,]<mm:dd:yyyy:hh:mi:ss>] : Search
based on time of event generation
(-L) [(-r) ([%] <summary> [%])] : Search
based on summary string
(-L) [(-s) [asc:|desc:](id|time|severity|category)] : Sort on
eventid,time,severity or category
(-L) [(-o) <offset>] : Display
from offset <offset>
(-L) [(-c) <count>] : Display
<count> number of events
(-L) [(-f)] : Display
CAE events, filter OS events
(-E) (-n) <Sl.No> : Display
event details with serial number equal to <Sl.No>
(-E) (-a) <alert id> : Display
event details with Indication Identifier/Alert Id equal to
<alert id>
(-C) (-p) (<npar[:vpar]>|complex) : Clear
events based on partition id or complex
(-G) [on|off|alert|device|status] : Enable/
Disable/Enable HPE_AlertIndication/Enable HPE_DeviceIndication/
Display
status for Athena One Stop Fault Management
(-L) [(-b)] : Display
archived events
(-E) [(-b)] (-n) <Sl.No> : Display
archived event details with serial number equal to <Sl.No>
[-h] : Display
usage of this command
To view the list of events generated and analyzed, run the following:
OA-CLI> SHOW CAE -L
Sl.No Severity EventId EventCategory PartitionId EventTime Summary
#####################################################################################################
1 Degraded 12270 Support Fi... 3 Fri Mar 28 15:53:56 2014 SFW test of SMIF over CHIF interface...
(...) indicates truncated text. For complete text see event details
To see the details for each event, run the following:
OA-CLI> SHOW CAE -E -n 1
Alert Number : 1
Event Identification :
Event ID : 12270
Provider Name : FPL_IndicationProvider
Event Time : Fri Mar 28 15:53:56 2014
Indication Identifier : 11227020140328155356
Managed Entity :
OA Name : hawk039oa1
Troubleshooting 81
Page 82

System Type : 59
System Serial No. : SFP1236002
OA IP Address : 15.242.4.234
Affected Domain :
Enclosure Name : hawk039
RackName : hawk039
RackUID : 02SGH5141AE2
Impacted Domain : Partition
Complex Name : hawk039
Partition ID : 3
SystemGUID : 00000000-0000-0000-0000-000000000000
Summary :
SFW test of SMIF over CHIF interface to Gromit iLO fails on the indicated blade.
Full Description :
SFW test of SMIF over CHIF interface to Gromit iLO using SMIF command ILO_STATUS_REQUEST fails, indidicating
the interface is not functional. The logical (nPar) Blade ID is sent as EventData, with 0xFFFF sent if the
blade ID cannot be determined.
Probable Cause 1 :
SMIF over CHIF interface to Gromit iLO fails selftest; resulting SMBIOS records that consume this data are
default values.
Recommended Action 1 :
Reboot the system which attempts to reinitialize the interface.
Probable Cause 2 :
Reboot of the system fails to restore SFW communication to Gromit iLO via the SMIF over CHIF interface
Recommended Action 2 :
Power off the system. Reset the offending Gromit iLO(s) in the system with one of the following:
1) destroy and recreate the partition 2) reset the blade using 'reset blade X' then confirm 'yes'
3) reset iLO and reboot the system.
Replaceable Unit(s) :
Part Manufacturer : Not Applicable
Spare Part No. : Not Applicable
Part Serial No. : Not Applicable
Part Location : Not Applicable
Additional Info : Not Applicable
Additional Data :
Severity : Degraded/Warning
Alert Type : Communications Alert
Event Category : Support Firmware
Event Subcategory : Other
Probable Cause : Communications Protocol Error
Other Event Subcategory : Gromit iLO Configuration Error
Event Threshold : 1
Event Time Window : 0 (minutes)
Actual Event Threshold : 1
Actual Event Time Window : 0 (minutes)
Record ID : 0x0
Record Type : E1
Reporting Entity : 0x0100ff03ff000017 enclosure1/blade3/cpusocket0/cpucore0
Alert Level : 0x3
Data Type : 0x16
Data Payload : 0x1
Extended Reporting Entity ID : 0x2
Reporting Entity ID : 0x1
IPMI Event ID : 0x2b05
OEM System Model : NA
Original Product Number : AH337A
Current Product Number : AT147A
OEM Serial Number : NA
Version Info :
Complex FW Version : 7.6.0
Provider Version : 5.111
Error Log Data :
Error Log Bundle : 400000000001e86c
See the HPE Integrity Superdome X and Superdome 2 Onboard Administrator Command Line Interface
Guide for the correct and detailed command syntax. The HR Viewer can also provide help in visualizing
component issues.
OA
The OA provides diagnostic and configuration capabilities. See the HPE Integrity Superdome X and
Superdome 2 Onboard Administrator Command Line Interface Guide for more information on the OA CLI
commands. You can access the OA CLI through the network.
The status logs consist of the following:
82 Troubleshooting
Page 83

• System Event
• Forward Progress
• Live Events
Remotely accessing the OA
The OA CLI can be accessed remotely through any Telnet or SSH session.
Telnet session
Procedure
1. From a network-connected client, open a command-line window.
2. At the prompt, enter telnet <OA IP address> , and then press Enter.
3. For example, telnet 192.168.100.130.
4. Enter a valid user name, and then press Enter.
5. Enter a valid password, and then press Enter. The CLI command prompt appears.
6. Enter commands for the OA.
7. To end the remote access Telnet session, at the CLI command prompt, enter Exit, Logout, or Quit.
SSH session
1. Start an SSH session to the OA.
2. Enter ssh -l <username> <IP-address> .
Example:
ssh -l Administrator 16.113.xx.yy
The authenticity of host '16.113.xx.yy(16.113.xx.yy)' can't be established.
DSA key fingerprint is ab:5e:55:60:2b:71:8f:0c:55:3e:79:3e:a2:93:ea:13
Are you sure you want to continue connecting (yes/no)? yes
Warning: Permanently added '16.113.xx.yy' (DSA) to the list of known hosts.
---------------------------------------------------------------------------
------------This is a private system. Do not attempt to login unless you are an
authorized user. Any authorized or unauthorized access and use may be
monitored and can result in criminal or civil prosecution under applicable
law.
---------------------------------------------------------------------------
-------------
Firmware Bundle Version: 5.73.0
Enclosure Number: 1
OA Number: 1
OA Role: Active
Administrator@16.113.xx.yy's password: <Administrator password>
Troubleshooting 83
Page 84

3. At the CLI command prompt, enter OA commands.
4. To end the remote access SSH session, at the CLI command prompt, close the communication
software or enter Exit, Logout, or Quit.
Locally accessing the OA
If needed for debugging purposes, the OA can be accessed locally through a serial port connector on the
rear of the OA module. Use a laptop or another computer as a serial console to communicate with the
OA.
NOTE: Use of this interface is only for OA debugging purposes and to reset the OA password. This
connection cannot be maintained under normal server operations
Procedure
1. Connect a serial cable between the computer and the serial port on the OA module. See Connecting
a PC to the OA serial port for detailed information on this connection and launching the OA CLI.
2. When prompted, enter a valid user name, and then press Enter.
3. Enter a valid password, and then press Enter. The CLI command prompt appears.
4. Enter commands for the OA.
5. To end the terminal session, enter Exit at the prompt.
NOTE: If the serial console session for a partition is not closed properly, it will impact the speed of the
associated partition console.
Troubleshooting processors
Cause
There are several type of errors concerning the processor environment.
• EFI—typically occur during boot or runtime.
• Boot errors—typically related to a core failing self test, a QPI link not initializing to full speed, or a core
or socket not coming out of reset.
• Runtime errors—can be due to a hardware or software defect that appears in either a core or uncore.
• I/O and XNC errors—consult the CAE error logs. Most common I/O errors are surprise down and
completion timeouts.
• Uncore errors—result in the entire socket indicted and the blade deconfigured, since these errors
affect all cores. If an uncore error is specific to a core, then the core can be deconfigured on the next
boot and the rest of the cores on the socket are unaffected. The most common uncore errors are
errors in the last level cache, firmware errors, or timeouts.
• Core errors—typically first or mid-level cache errors, core-level time-outs, and hardware defects.
• SMI/SMI2 errors
To troubleshoot processor errors, use the OA SHOW CAE-L command. Use the HR SHOW INDICT
command to check for indications that a component might be failing.
show cae -L
84 Troubleshooting
Page 85

SI.No Severity EventId EventCategory PartitionId EventTime Summary
#############################################################################################
1568 Critical 100900 Processor 5 Tue Aug 26 17:32:07 2014 Uncorrectable cache errors observed...
Troubleshooting memory
Symptom
Memory errors can be separated into two categories depending on where they originate:
• CPU to memory buffer errors — outlined in yellow below
• Memory buffer to DIMM errors — outlined in green below
Solution 1
Cause
CPU to memory buffer errors
The link between the CPU and the memory buffer is the SMI2 or VMSE link. An SMI2 failure can manifest
as reduced memory size, reduced memory throughput, or machine checks. However, other issues can
result in the same symptoms. CAE will analyze the failure to determine whether SMI2 is at fault.
For errors related to SMI2, suspect the CPU, the memory buffer, or the traces between them. The
memory buffer is permanently attached to the blade, so it cannot be indicted independently. Therefore,
the CPU and/or blade are indicted for an SMI2 error.
If an error occurs on SMI2, replacing DIMMs is unlikely to correct the problem. DIMMs reside on a
separate DDR bus and changes to the DDR bus will not affect the SMI2 bus.
IMPORTANT: Do not move or replace DIMMs for an SMI2_TRAINING_FAILURE event.
Troubleshooting 85
Page 86

Solution 2
Cause
Memory buffer to DIMM errors
The channel between the memory buffer and the DIMM is the DDR channel. Because up to three DIMMs
reside on the same DDR channel and two DDR channels might be configured in lockstep (RAS mode
enabled), up to six DIMMs can be affected by a single faulty DIMM. It is important to distinguish faulty or
suspect DIMMs from healthy DIMMs that happen to reside on the same bus.
On a new installation, DDR training failures can result from DIMMs being partially unseated during
shipping. A common symptom of a partially unseated DIMM is a MEM_DIMM_NO_VALID_DELAY event.
If the machine is still in the installation phase and has not been released to the customer, before replacing
a DIMM, try removing and reinstalling all the DIMMs on that DDR channel. A DIMM that has been in use
for some time is unlikely to be spontaneously unseated.
If a DIMM suffers a correctable or uncorrectable error at runtime and must be replaced, a DIMM pair
might be identified and indicted. A DIMM pair will be two DIMMs on the same memory buffer with the
same loading letter, such as 19A and 24A. In this case, replace both DIMMs in the pair.
CAE generates error events for faulty or suspect DIMMs as indicted. Replace these DIMMs.
Health Repository, the EFI info mem command, and IPMI events might also identify additional
deconfigured DIMMs, sometimes called partner-deconfigured DIMMs, lockstep-disabled DIMMs, or
sibling-disabled DIMMs. These DIMMs are healthy and should not be replaced.
To identify a possible faulty DIMM, use the HR SHOW INDICT command. Replace DIMMs that are
indicted. Do not replace DIMMs that are deconfigured unless there are other indications of a faulty DIMM,
such as being identified with DIMMERR.
Solution 3
Cause
Using DIMMERR
If there are memory errors that do not clearly indicate which hardware is at fault, the HR dimmerr
command can be used to look for patterns of memory failures.
You can use DIMMERR as follows:
• To corroborate other errors that correspond to a specific DIMM or blade.
• To indicate memory training faults.
• To look for DIMM errors in newly installed or replaced DIMMs.
• To look for DIMM errors during partition boot as part of a system installation.
IMPORTANT: DIMMERR will show memory events that were correctable. It is important to note
that correctable errors are expected on large memory systems and all systems will show several
correctable errors over time. Correctable errors only result in indictment after reaching a certain
threshold.
Do not replace DIMMS for normal correctable errors.
From the Health Repository viewer, enter dimmerr <location>, where <location> is the DIMM slot or
a blade.
Example: dimmerr blade-1/1 returns information about all DIMMs for a server blade in slot 1 of
cabinet 1.
86 Troubleshooting
Page 87

DIMM INFO for Cabinet: 1 Board Slot: 1
dimm-1/1/0/1 Location: 1A
Status: OK No Errors Logged.
dimm-1/1/0/2 Location: 2C
Status: OK No Errors Logged.
dimm-1/1/0/3 Location: 3B
Row Bank Col Type Errors First Detected Last Detected
---- ---- --- ---- ------ --------------------- -----------------------------
0 256 0 0 1 Fri Feb 11 18:10:51 2011 Fri Feb 11 18:10:51 2011
dimm-1/1/0/4 Location: 4D
Status: OK No Errors Logged.
dimm-1/1/0/5 Location: 5D
Status: OK No Errors Logged.
Troubleshooting cards and drivers
Cause
If driver issues are suspected, use the UEFI driver bypass option to bypass loading the suspected driver.
This could occur if a card is transferred from another system with an old driver and is placed in a new
system and connecting drivers results in failure to boot.
The UEFI driver loading bypass option only appears and is effective during system firmware boot. It does
not appear if the UEFI Front Page is re-entered later.
Normally, system firmware will proceed with automatic boot entry execution (default is seven seconds). To
configure UEFI driver loading bypass, you must press P before the countdown completes to access the
UEFI Driver Loading Bypass Configuration menu.
After pressing the key, a submenu will appear. Select the desired bypass option by pressing a key as the
following indicates:
UEFI Driver Loading Bypass Configuration
Press: 1 — Bypass loading UEFI drivers from I/O slots
2 — Bypass loading UEFI drivers from I/O slots and blade LOMs
N / n - Normal loading of UEFI drivers
Q / q - Quit
Waiting for user input.
The Bypass loading UEFI drivers from I/O slots and blade LOMs option might be useful when a bad
FlexLOM and/or mezzanine card UEFI driver is preventing partition boot. USB drivers can still be used at
the UEFI Shell to help with FlexLOM update.
NOTE: There is no quick reset ability to save time when you are running the bypass option several times
in a row.
After selecting an option, control returns to the UEFI Front Page.
You can then proceed with I/O firmware update (SUM from DVD/Virtual Media .iso).
Troubleshooting compute enclosure events
Cause
Loss of enclosure settings
The OA battery preserves the Integrity Superdome X enclosure settings, such as users and network
settings. When the battery is low, there is a risk of losing these enclosure settings if the OA is removed or
if AC power is interrupted.
Troubleshooting 87
Page 88

When the OA detects a low battery, the battery diagnostic status in SHOW OA STATUS will be marked as
Failed.
sdx-oa> show oa status
Onboard Administrator #1 Status:
Name: sdx-oa
Role: Active
UID: Off
Status: Degraded
Diagnostic Status:
Internal Data OK
Device Failure OK
Missing Device OK
Firmware Mismatch OK
OA Battery Failed
Indicted OK
If the above error occurs, the battery should be replaced. The OA will also log an entry in syslog
advising the battery be replaced.
The OA battery is low or has failed. Configuration settings may be lost if the OA loses power.
Replace the OA Battery with spare part #708907-001.
Troubleshooting firmware
Cause
There are three different firmware systems.
• System firmware bundle
• IO firmware (PCIe and LOM)
• Interconnect module firmware
All firmware systems can be updated.
System firmware recipe can be updated using SUM or manually using OA CLI. There are different
bundles for each method.
For instructions to update firmware and drivers, see Manually updating the complex firmware on page
34 and Installing the latest complex firmware using SUM on page 34.
For more information about installing firmware updates, see the detailed instructions provided in the
firmware download bundle. Always follow the update instructions for each firmware release.
Identifying and troubleshooting firmware issues
NOTE: Firmware issues are relatively rare. Look for other issue causes first.
Probable firmware failure areas are:
• Unsupported firmware installation
• Corrupt firmware installation
To troubleshoot firmware issues:
88 Troubleshooting
Page 89

Procedure
1. Be sure that all server blade firmware components are from the same release (use the OA CLI
update show firmware command, or check the Complex Firmware version through the OA GUI).
2. Reinstall complex firmware.
Verifying and installing the latest firmware version
Hewlett Packard Enterprise recommends that all firmware on all devices be updated to the latest version
after hardware installation is complete. Hewlett Packard Enterprise also encourages you to check back
often for any updates that might have been posted.
The most recent versions of software drivers and firmware are available on the support page.
Procedure
1. Go to http://www.hpe.com/support/hpesc.
2. Enter the product name or browse to the product.
3. Select drivers, software & firmware under the Download options tab.
4. Select the product download type.
5. Select a language and then your OS.
6. Select the appropriate download, and then follow the instructions.
NOTE:
The complex (or management side) firmware can be updated while the partition remains online, and then
the partition (or system side) firmware can be applied to the nPartition.
It is possible that some firmware updates will be released which do not require partition firmware updates.
These firmware bundles can be installed without requiring any nPartition downtime.
See the detailed instructions provided in the firmware download bundle for more information.
System firmware
System firmware bundle includes firmware for complex components including the following:
• Server blade firmware (not including LOMs)
• Partition firmware for each server blade and OA
• OA firmware
• Manageability module firmware, including GPSMs and XFMs
Troubleshooting 89
Page 90

IMPORTANT:
Always use the all option when updating firmware using the OA CLI. For example:
OA1> update firmware usb://d2/BL920sGen<x.x>.xx.xxx-fw.bundle all
OA1> update firmware ftp://user:passwd@Hostname/HPx86/BL920sGen<x-x>.<xx.xxx>fw.bundle all
If the all option is not used, only the complex firmware will be updated, and you will have to update
the partition firmware. This will create additional down time.
NOTE: The update firmware command checks the installed FRUs and will only update FRUs that do
not match the complex firmware version.
FRU replacement firmware update procedures
The following table explains the steps to take, and the overall impact each FRU replacement will have on
system operation:
IMPORTANT: Check for indicts before and after each firmware update.
90 Troubleshooting
Page 91

FRU Process
Blade – Requires a nPar outage
XFM — Requires a Complex outage
1. Power OFF the partition the blade is assigned to. (See
Note following this table)
2. Remove/Replace the suspect blade following the
instructions in the service guide.
3. Use the update firmware <uri> all command,
pointing it to the <uri> of a bundle file that matches what is
installed on the complex. This command checks the
current firmware version of all installed FRUs and will only
update FRUs that do not match the complex firmware
version.
4. Check for indicts.
5. Power on the partition.
1. Power OFF all partitions.
2. Remove and replace the suspect XFM following the
instructions in the service guide.
IMPORTANT: Do not mix XFM and XFM2 crossbar
modules in the same system.
3. Use the update firmware <uri> all command,
pointing it to the <uri> of a bundle file that matches what is
installed on the complex. This command checks the
current firmware version of all installed FRUs and will only
update FRUs that do not match the complex firmware
version.
NOTE: The minimum firmware bundle for XFM2 is
v8.2.106.
4. Check for indicts.
5. Power on all partitions.
Table Continued
Troubleshooting 91
Page 92

FRU Process
OA — No outage required
GPSM — No outage required
1. Ensure that the suspect OA is the standby OA; use the
force takeover command if needed.
2. Remove and replace the suspect OA.
3. Use the update firmware <uri> all command,
pointing it to the <uri> of a bundle file that matches what is
installed on the complex. This command checks the
current firmware version of all installed FRUs and will only
update FRUs that do not match the complex firmware
version.
4. Check for indicts.
1. Ensure that you are replacing the indicted GPSM.
2. Disconnect the cables from the GPSM being replaced.
3. Remove and replace the suspect GPSM.
4. Use the update firmware <uri> all command,
pointing it to the <uri> of a bundle file that matches what is
installed on the complex. This command checks the
current firmware version of all installed FRUs and will only
update FRUs that do not match the complex firmware
version.
NOTE: For blade replacement: If the FRU failed in a way that made it unable to join the partition after
the failure, you might not need to shut down the partition at the time of the replacement. The FRU can be
replaced and the firmware updated. When the partition is rebooted, the replacement FRU will rejoin the
partition.
I/O firmware
Every FlexLOM and mezzanine card supported requires its own UEFI driver and some also require card
specific ROM firmware.
For a complete list of supported I/O cards and related firmware, see the Firmware Matrix for HPE Integrity
Superdome X servers document at http://www.hpe.com/info/superdomeX-firmware-matrix.
The following are minimum required firmware versions for supported I/O cards.
5. Check for indicts.
NOTE: You will see indictments related to the loss of
redundancy of the CAMNet.
6. Acquit the indictments related to the loss of redundancy of
the CAMNet.
92 Troubleshooting
Page 93

Card Gen8 minimum firmware
version
Gen9 minimum firmware
version
HPE Ethernet 10Gb 2-port
560FLB / 560M Adapter
HPE QMH2672 16Gb 2P FC
HBA
Infiniband HPE IB FDR 2P 545M
Adapter
HPE FlexFabric 20Gb 2P
630FLB / 630M Adapter
Boot: 3.0.24
UEFI: 4.5.19
Multiboot: 2.02.47 & 4.0.0.0–1
FW: 7.04.00
BIOS: 3.28
UEFI: 6.21
Boot: 2.3.45
UEFI: 4.9.10
Multiboot: 2.02.47 & 4.0.0.0–1
FW: 7.04.00
BIOS: 3.31
UEFI: 6.37
FW: 10.10.50.52
UEFI: 14.6.27
Flexboot: 3.4.306
MFW: 7.10.72
MBA: 7.10.71
EFI: 7.12.83
UEFI: 7.12.31
iSCSI Boot: 7.10.33
CCM: 7.10.71
HPE FlexFabric 20Gb 2P
650FLB / 650M Adapter
HPE FlexFabric 10 Gb 2–port
534FLB / 534M Adapter
Interconnect module firmware
The system supports the LAN Pass-Thru Module, the HPE ProCurve 6120XG and 6125XLG blade
switches, and the HPE 4X FDR Infiniband Switch.
Symptoms of possible firmware issues include erratic server blade, compute enclosure, or other
component operation, or unsuccessful boot to the UEFI boot manager or UEFI shell.
The following are minimum required firmware versions for supported Interconnect modules.
Interconnect module Firmware version
ProCurve 6125XLG blade switch 6125-CMW520-R2112
Boot: 7.10.37
UEFI: 7.10.54
L2FW: 7.10.31
FW: 10.7.110.34
iSCSI Boot EFI: 10.7.110.15
UEFI: 10.7.110.34
iSCSI BIOS: 107.00a9
Boot: 7.12.83
7.12.31
ProCurve 6120G/XG Ethernet Blade Switch Z.14.52
Table Continued
Troubleshooting 93
Page 94

Interconnect module Firmware version
10 GB Ethernet Pass-Thru 1.0.11.0
Brocade 16Gb SAN switch 7.3.1a or later
4X FDR Infiniband Switch 3.4.0008
Troubleshooting partitions
Cause
Use the following commands to troubleshoot partitions:
• Use the OA parstatus command to determine which resources belong to the failing nPar.
• Use the HR> show indict and show deconfig commands to determine if any of the resources
belonging to the nPar are deconfigured, indicted, or in any failure state.
If any issues are reported, use the show CAE command for more information.
• Use the show syslog OA 1 command to check the syslog file for the active OA. For example:
OA-CLI> show syslog oa 1
Mar 28 17:20:59 mgmt: Blade 8 has been allocated 1100 watts but iLO is reportin
g the blade is powered off.
Mar 28 17:21:24 mgmt: Blade 1 Ambient thermal state is OK.
Mar 28 17:21:24 mgmt: Blade 3 Ambient thermal state is OK.
Mar 28 17:21:24 mgmt: Blade 5 Ambient thermal state is OK.
Mar 28 17:21:44 mgmt: Blade 7 Ambient thermal state is OK.
Mar 28 17:26:31 parcon: Note: Partition Controller has initialized all partition
permissions to the default behavior
Mar 28 17:28:53 parcon: Note: nPartition 2: Power On of nPartition completed
Mar 28 17:29:37 mgmt: Blade 2 Ambient thermal state is OK.
Mar 28 17:29:37 mgmt: Blade 4 Ambient thermal state is OK.
Mar 28 17:29:37 mgmt: Blade 6 Ambient thermal state is OK.
Mar 28 17:29:58 mgmt: Blade 8 Ambient thermal state is OK.
Mar 28 17:33:12 -cli: Administrator logged out of the Onboard Administrator
Mar 28 17:33:14 -cli: Administrator logged out of the Onboard Administrator
Mar 28 17:33:16 -cli: Administrator logged out of the Onboard Administrator
Mar 28 17:33:22 -cli: Administrator logged out of the Onboard Administrator
Mar 28 17:33:24 -cli: Administrator logged out of the Onboard Administrator
NOTE: All partition-related messages in OA syslog contain the string parcon:.
See the HPE Integrity Superdome X and Superdome 2 Onboard Administrator Command Line Interface
User Guide for information on uploading and downloading partition specification files and runtime
configuration files. These actions are not typically needed, but it is recommended to keep a valid copy of
the configuration available for disaster recovery.
Troubleshooting the network
Cause
An incorrect setup for the compute enclosure and complex wide internal network can lead to issues with
the following tasks:
94 Troubleshooting
Page 95

• Powering on/off partitions
• Update firmware
• Gathering status information
Each Monarch iLO and OA in the complex must have a unique IP address set up. The IP addresses will
be obtained by either using a DHCP server or defining the IP addresses using EBIPA. Non-Monarch iLO
addresses default to link local.
Supported IP address ranges for EBIPA
Supported IP address ranges for EBIPA include all IP addresses except those in the ranges of
169.254.x.y and 10.254.x.y, which are reserved for the internal management network. The non-restricted
ranges may be used for iLOs and OAs as long they are not duplicated (generate IP address conflicts). In
addition, all the IP addresses must be within the same subnet defined by netmask and IP address so that
all OAs as well as all iLOs fit into that subnet.
Use the show ebipa and show OA network all commands to check the network settings for iLO
and OA:
SHOW EBIPA
EBIPA Device Server Settings
Bay Enabled EBIPA/Current Netmask Gateway DNS Domain
--- ------- --------------- --------------- --------------- --------------- ------
1 Yes 10.67.52.166 255.255.254.0 10.67.52.1
10.67.52.166
1A No
1B No
2 Yes Link Local 255.255.254.0 10.67.52.1
10.67.52.165
2A No
2B No
SHOW OA NETWORK ALL
Onboard Administrator #1 Network Information:
Name: OA-1
DHCP: Disabled
IP Address: 10.67.52.bbb
Netmask: 255.255.254.0
Gateway Address: 10.67.52.aaa
Primary DNS: 0.0.0.0
Secondary DNS: 0.0.0.0
MAC Address: 9C:8E:99:29:xy:yx
Link Settings: Auto-Negotiation, 1000 Mbit, Full Duplex
Link Status: Active
Enclosure IP Mode: Disabled
Onboard Administrator #2 Network Information:
Name: OA-2
DHCP: Disabled
IP Address: 10.67.52.ccc
Netmask: 255.255.254.0
Gateway Address: 10.67.52.aaa
Primary DNS: 0.0.0.0
Secondary DNS: 0.0.0.0
MAC Address: 9C:8E:99:29:xy:xy
Link Settings: Auto-Negotiation, 1000 Mbit, Full Duplex
Link Status: Active
Enclosure IP Mode: Disabled
Troubleshooting 95
Page 96

Troubleshooting fabric issues
Cause
The Integrity Superdome X has fabric connections between all the blades installed in the compute
enclosure.
Test fabric
To determine the healthy status for all crossbar connections, use the HR> test fabric command. This
is a valuable test during installation when all partitions can be taken down at the same time. During
normal operation when some or all partitions can’t be taken down at the same time, use the procedure
described in Show complex status below.
IMPORTANT: The HR> test fabric requires a complex outage. Before running HR> test
fabric, all indicted and deconfigured parts must be cleared and the partition must be powered off.
NOTE: Test fabric includes both test camnet and test clocks.
OA1 HR> test fabric
Begin test 1: System Fabric Components
Acquitting any current fabric and CAMNet indictments, and deconfigurations.
Beginning fabric test
SUCCESS: System Fabric test complete
System Fabric routed successfully.
Begin test 2: Management Network Components
CAMNet test has executed without finding faults
Management connectivity test complete
Begin test 3: Global Clock Components
Clocks test started...
Blade Sys Clk 0 Sys Clk 1
========== ========== ==========
Blade 1/1 OK OK
Blade 1/2 OK OK
Blade 1/3 OK OK
Blade 1/4 OK OK
Blade 1/5 OK OK
Blade 1/6 OK OK
Blade 1/7 OK OK
Blade 1/8 OK OK
GPSM Int Clk Ext Clk
========== ========== ==========
GPSM 1/1 * OK ---GPSM 1/2 * OK ----
SUCCESS: Clocks test passed.
Clocks test complete.
Success: Fabric, CAMNet, and Global Clock tests completed with no errors
Show complex status
Use this procedure to test for fabric issues when some or all partitions can’t be taken down at the same
time.
96 Troubleshooting
Page 97

Action
1. Run SHOW XFM STATUS all to check the health and power status of the XFM modules.
2. Run SHOW COMPLEX STATUS and check the Xfabric status entry for the status.
3. Check SHOW CAE —L and check for any xfabric routing issues and fabric link failures.
Troubleshooting clock-related issues
Cause
Clocks are provided by the GPSM module and are redundant within a complex. Use the command HR>
test clocks to check for clock-related issues as follows:
NOTE: This command can be run while the partitions are active.
HR> test clocks
Clocks test started...
Blade Sys Clk 0 Sys Clk 1
========== ========== ==========
Blade 1/1 OK OK
Blade 1/2 OK OK
Blade 1/3 OK OK
Blade 1/4 OK OK
Blade 1/5 OK OK
Blade 1/6 OK OK
Blade 1/7 OK OK
Blade 1/8 OK OK
GPSM Int Clk Ext Clk
========== ========== ==========
GPSM 1/1 * OK ----
GPSM 1/2 * OK ----
SUCCESS: Clocks test passed.
Clocks test complete.
Any clock failures will also be detected and reported by CAE. To obtain these failures, run show CAE –L,
and then use the command show CAE –E –n <ID> to obtain more details for the CAE event.
Troubleshooting MCAs
Cause
In general, MCAs are partition-based crashes and are detected and reported by CAE. To obtain a general
overview about an MCA event, run show CAE –L, and then use the command show CAE –E –n <ID>
to obtain more details for the CAE event.
To view problem action statements about the MCA event, use the show cae —L —c 10 command and
note the Sl.No. Then display detailed information about the bad FRU including probable cause and
recommended action by using the show cae -E -n xxxx command, where xxxx is the Sl.No.
show cae -L -c 10
Sl.No Severity EventId EventCategory PartiionId EventTime Summary
##########################################################################################
72294 Fatal 9645 System Fir... 1 Wed Aug 13 07:10:57 2014 The nPartitions
72287 Degraded 100142 System Int... 1 Wed Aug 13 06:35:0^ 2014 PCIe Link
Troubleshooting 97
Page 98

show cae -E -n 72287
Alert Number : 72287
Event Identification :
Event ID : 100142
Provider Name : PCIeIndicationProvider
Event Time : Wed Aug 13 06:35:06 2014
Indication Identifier : 310014220140813063506
Managed Entity :
OA Name :
System Type :
System Serial No. :
OA IP Address :
Affected Domain :
Enclosure Name :
RackName :
RackUID :
Impacted Domain :
Complex Name :
Partition ID :
SystemGUID :
Summary :
PCIE Link Bandwidth Reduction
Full Description :
The system has experienced an error on PCIe link. The data has been successfully retransmitted,
but the link is now operating at a lower bandwidth.
Probable Cause 1 :
The PCIe link hardware is not functioning properly.
Recommended Action 1 :
The PCIe link might be part of a single FRU, or might be technology that connects through multiple
FRU's. The FRU list is included as a reference. Check for physical damage (bent pins, cracked
traces, contamination or corrosion) on the FRU connection points and ensure proper mating/
seating occurs. If the problem persists, replace only one FRU at a time in the order given
below. Test the system between each FRU replacement.
Replaceable Units(s) :
...
...
...
MCA data is also stored at the OA and can be retrieved by running the OA command show errdump
dir mca as follows:
OA-CLI> show errdump dir mca
Logtype: MCA (Machine Check Abort)
Bundle nPar vPar time
0x011000000000aae6 1 Mon Jan 20 10:30:31 CET 2014
0x011000000000aae5 1 Fri Jan 17 12:23:49 CET 2014
0x011000000000aae4 1 Fri Jan 17 10:51:06 CET 2014
0x011000000000aae3 1 Thu Jan 16 21:43:45 CET 2014
0x011000000000aae2 1 Mon Jan 13 11:44:30 CET 2014
0x011000000000aae1 1 Mon Jan 13 11:43:27 CET 2014
0x011000000000aadf 1 Tue Dec 10 01:07:39 CET 2013
0x013000000000aac0 1 Sun Dec 8 01:12:08 CET 2013
0x011000000000aadd 1 Sat Dec 7 01:58:05 CET 2013
0x011000000000aadc 1 Sat Dec 7 01:57:02 CET 2013
If an MCA of interest is found, it can be captured by running the command show errdump mca bundle
<ID>.
Troubleshooting the blade interface (system console)
Cause
All system console connections are made through the OA CLI via the management network.
98 Troubleshooting
Page 99

Linux uses the OA 10/100 BT LAN connection over a private network to control one or more server blade
operations, locally through Telnet or SSH or remotely over a public network through a web GUI.
Troubleshooting 99
Page 100

Websites
General websites
Hewlett Packard Enterprise Information Library
www.hpe.com/info/EIL
Single Point of Connectivity Knowledge (SPOCK) Storage compatibility matrix
www.hpe.com/storage/spock
Storage white papers and analyst reports
www.hpe.com/storage/whitepapers
For additional websites, see Support and other resources.
100 Websites
 Loading...