

Page 1

HPE FlexNetwork NJ5000 5G PoE+ Walljack
Switch
User Guide
Part number: 5998-7332R
Software version: Release 1108
Document version: 6W101-20161012
Page 2

© Copyright 2016 Hewlett Packard Enterprise Development LP
The information contained herein is subject to change without notice. The only warranties for Hewlett Packard
Enterprise products and services are set forth in the express warranty statements acco mpanying such
products and services. Nothing herein should be construe d as constituting an additional warranty. Hewlett
Packard Enterprise shall not be liable for technical or editorial errors or omissions co ntained herein.
Confidential computer software. V alid license from Hewlett Packard Enterprise required for possession, use, or
copying. Consistent with FAR 12.211 and 12.212, Commercial Computer Software, Computer Software
Documentation, and T e chnical Data for Commercial Items are licensed to the U.S. Government under vendor’s
standard commercial license.
Links to third-party websites take you outside the Hewlett Packard Enterprise website. Hewlett Packard
Enterprise has no control over and is not responsible for information outside the Hewlett Packard Enterprise
website.
Acknowledgments
Intel®, Itanium®, Pentium®, Intel Inside®, and the Intel Inside logo are trademarks of Intel Corporation in the
United States and other countries.
Microsoft® and Windows® are trademarks of the Microsoft group of companies.
Adobe® and Acrobat® are trademarks of Adobe Systems In corporated.
Java and Oracle are registered trademarks of Oracle and/or its affiliates.
UNIX® is a registered trademark of The Open Group.
Page 3

Contents
Overview ········································································································· 1
Accessing the Web interface ····························································································································· 1
Restrictions and guidelines for Web-based login ······················································································· 1
Logging in to the Web interface for the first time ························································································ 4
Logging out of the Web interface ··············································································································· 5
Using the Web interface ····································································································································· 6
Icons and buttons ······································································································································· 6
Page display function ································································································································· 7
Search function ·········································································································································· 7
Sort function ··············································································································································· 9
Feature summary ·························································································· 10
Feature menu navigators for the Web interface ······························································································· 10
Wizard menu ············································································································································ 10
Summary menu ········································································································································ 10
Device menu ············································································································································ 11
Network menu ·········································································································································· 13
Authentication menu ································································································································ 16
Security menu ·········································································································································· 17
QoS menu ················································································································································ 17
PoE menu ················································································································································ 19
Features configurable from the CLI ················································································································· 19
manage-mode ·········································································································································· 20
poe force-power ······································································································································· 20
poe legacy enable ···································································································································· 21
Configuration wizard ····················································································· 23
Basic service setup ·································································································································· 23
Entering the configuration wizard homepage ··························································································· 23
Configuring system parameters ··············································································································· 23
Configuring management IP address ······································································································· 24
Finishing configuration wizard ·················································································································· 26
Displaying system and device information ···················································· 28
Displaying system information ························································································································· 28
Displaying basic system information ········································································································ 28
Displaying the system resource state ······································································································ 29
Displaying recent system logs ·················································································································· 29
Setting the refresh period ························································································································· 29
Displaying device information ·························································································································· 29
Configuring basic device settings ································································· 31
Configuring system name ································································································································ 31
Configuring idle timeout period ························································································································ 31
Maintaining devices ······················································································ 32
Software upgrade ············································································································································· 32
Device reboot ··················································································································································· 33
Electronic label ················································································································································· 33
Diagnostic information ····································································································································· 34
Configuring system time ··············································································· 35
Overview ·························································································································································· 35
Displaying the current system time ·················································································································· 35
Manually configuring the system time ·············································································································· 35
Configuring system time by using NTP ············································································································ 36
Configuring the time zone and daylight saving time ························································································ 37
i
Page 4

System time configuration example ················································································································· 38
Network requirements ······························································································································ 38
Configuring the system time ····················································································································· 38
Verifying the configuration ························································································································ 39
Configuration guidelines ·································································································································· 39
Configuring syslog ························································································ 40
Displaying syslogs ··········································································································································· 40
Setting the log host ·········································································································································· 41
Setting buffer capacity and refresh interval ······································································································ 42
Managing the configuration ··········································································· 43
Backing up the configuration ···························································································································· 43
Restoring the configuration ······························································································································ 43
Saving the configuration ·································································································································· 44
Resetting the configuration ······························································································································ 45
Managing files ······························································································· 46
Displaying files ················································································································································· 46
Downloading a file ············································································································································ 46
Uploading a file ················································································································································ 47
Removing a file ················································································································································ 47
Specifying the main boot file ···························································································································· 47
Managing ports ····························································································· 48
Setting operation parameters for a port ··········································································································· 48
Displaying port operation parameters ·············································································································· 51
Displaying a specified operation parameter for all ports ·········································································· 51
Displaying all the operation parameters for a port ··················································································· 51
Port management configuration example ········································································································ 52
Network requirements ······························································································································ 52
Configuring the switch ······························································································································ 53
Configuring port mirroring ············································································· 56
Terminology ····················································································································································· 56
Mirroring source ······································································································································· 56
Mirroring destination ································································································································· 56
Mirroring direction ···································································································································· 56
Mirroring group ········································································································································· 56
Local port mirroring ·········································································································································· 56
Configuration restrictions and guidelines ········································································································· 57
Recommended configuration procedures ········································································································ 57
Configuring a mirroring group ·························································································································· 58
Configuring ports for the mirroring group ········································································································· 58
Local port mirroring configuration example ······································································································ 59
Network requirements ······························································································································ 59
Configuration procedure ··························································································································· 60
Managing users ···························································································· 62
Adding a local user ·········································································································································· 62
Setting the super password ····························································································································· 63
Switching to the management level ················································································································· 64
Configuring a loopback test ·········································································· 65
Configuration guidelines ·································································································································· 65
Configuration procedure ·································································································································· 65
Configuring VCT ··························································································· 67
Overview ·························································································································································· 67
Testing cable status ········································································································································· 67
ii
Page 5

Configuring the flow interval ·········································································· 68
Viewing port traffic statistics ····························································································································· 68
Configuring RMON ························································································ 69
Overview ·························································································································································· 69
Working mechanism ································································································································· 69
RMON groups ·········································································································································· 69
RMON configuration task list ··························································································································· 70
Configuring a statistics entry ···················································································································· 72
Configuring a history entry ······················································································································· 73
Configuring an event entry ······················································································································· 74
Configuring an alarm entry ······················································································································· 75
Displaying RMON statistics ······················································································································ 77
Displaying RMON history sampling information ······················································································· 78
Displaying RMON event logs ··················································································································· 80
RMON configuration example ·························································································································· 80
Configuring energy saving ············································································ 84
Configuring energy saving on a port ················································································································ 84
Configuring SNMP ························································································ 85
Overview ·························································································································································· 85
SNMP mechanism ··································································································································· 85
SNMP protocol versions ··························································································································· 86
Recommended configuration procedure ·········································································································· 86
Enabling SNMP agent ······························································································································ 87
Configuring an SNMP view ······························································································································ 89
Creating an SNMP view ··························································································································· 89
Adding rules to an SNMP view ················································································································· 90
Configuring an SNMP community ···················································································································· 91
Configuring an SNMP group ···························································································································· 92
Configuring an SNMP user ······························································································································ 93
Configuring SNMP trap function ······················································································································ 95
Displaying SNMP packet statistics ··················································································································· 96
SNMPv1/v2c configuration example ················································································································ 97
SNMPv3 configuration example ····················································································································· 100
Displaying interface statistics ······································································ 105
Configuring VLANs ····················································································· 106
Overview ························································································································································ 106
VLAN fundamentals ······························································································································· 106
VLAN types ············································································································································ 107
Port-based VLAN ··································································································································· 107
Restrictions and guidelines ···························································································································· 109
Recommended VLAN configuration procedures ···························································································· 109
Recommended configuration procedure for assigning an access port to a VLAN ································· 109
Recommended configuration procedure for assigning a trunk port to a VLAN ······································ 110
Recommended configuration procedure for assigning a hybrid port to a VLAN ···································· 111
Creating VLANs ············································································································································· 112
Configuring the link type of a port ·················································································································· 112
Setting the PVID for a port ····························································································································· 113
Selecting VLANs ············································································································································ 114
Modifying a VLAN ·········································································································································· 115
Modifying ports ··············································································································································· 116
VLAN configuration example ························································································································· 117
Network requirements ···························································································································· 117
Configuring Switch A ······························································································································ 117
Configuring Switch B ······························································································································ 121
Configuration guidelines ································································································································ 121
iii
Page 6

Configuring VLAN interfaces ······································································· 122
Overview ························································································································································ 122
Creating a VLAN interface ····························································································································· 122
Modifying a VLAN interface ··························································································································· 123
Deleting a VLAN interface ······························································································································ 125
Configuration guidelines ································································································································ 126
Configuring a voice VLAN ··········································································· 127
Overview ························································································································································ 127
OUI addresses ······································································································································· 127
Voice VLAN assignment modes ············································································································· 127
Security mode and normal mode of voice VLANs ·················································································· 129
Recommended voice VLAN configuration procedure ···················································································· 130
Configuring voice VLAN globally ···················································································································· 131
Configuring voice VLAN on ports ··················································································································· 132
Adding OUI addresses to the OUI list ············································································································ 132
Voice VLAN configuration examples ·············································································································· 133
Configuring voice VLAN on a port in automatic voice VLAN assignment mode ···································· 133
Configuring a voice VLAN on a port in manual voice VLAN assignment mode ····································· 137
Configuration guidelines ································································································································ 142
Configuring the MAC address table ···························································· 143
Overview ························································································································································ 143
How a MAC address entry is created ····································································································· 143
Types of MAC address entries ··············································································································· 143
Displaying and configuring MAC address entries ·························································································· 144
Setting the aging time of MAC address entries ······························································································ 145
MAC address table configuration example ···································································································· 145
Network requirements ···························································································································· 145
Creating a static MAC address entry ····································································································· 145
Configuring MSTP ······················································································· 147
Overview ························································································································································ 147
Introduction to STP ········································································································································ 147
STP protocol packets ····························································································································· 147
Basic concepts in STP ··························································································································· 148
Calculation process of the STP algorithm ······························································································ 149
Introduction to RSTP ······································································································································ 154
Introduction to MSTP ····································································································································· 154
MSTP features ······································································································································· 154
MSTP basic concepts ···························································································································· 154
How MSTP works ··································································································································· 158
MSTP implementation on devices ·········································································································· 158
Protocols and standards ························································································································ 159
Configuration guidelines ································································································································ 159
Recommended MSTP configuration procedure ····························································································· 159
Configuring an MST region ···························································································································· 159
Configuring MSTP globally ···························································································································· 160
Configuring MSTP on a port ·························································································································· 163
Displaying MSTP information of a port ·········································································································· 164
MSTP configuration example ························································································································· 166
Network requirements ···························································································································· 166
Configuration procedure ························································································································· 167
Configuring LLDP ························································································ 172
Overview ························································································································································ 172
Basic concepts ······································································································································· 172
LLDP operating modes ·························································································································· 176
Working mechanism ······························································································································· 176
Protocols and standards ································································································································ 176
Recommended LLDP configuration procedure ······························································································ 177
iv
Page 7

Enabling LLDP on ports ································································································································· 177
Setting LLDP parameters on ports ················································································································· 178
Setting LLDP parameters for a single port ····························································································· 178
Setting LLDP parameters for ports in batch ··························································································· 180
Configuring LLDP globally ····························································································································· 181
Displaying LLDP information for a port ·········································································································· 183
Displaying global LLDP information ··············································································································· 187
Displaying LLDP information received from LLDP neighbors ········································································ 188
LLDP configuration example ·························································································································· 189
Network requirements ···························································································································· 189
Configuring Switch A ······························································································································ 189
Configuring Switch B ······························································································································ 191
Verifying the configuration ······················································································································ 192
LLDP configuration guidelines ······················································································································· 193
Configuring ARP ························································································· 194
Overview ························································································································································ 194
ARP message format ····························································································································· 194
ARP operating mechanism ···················································································································· 194
ARP table ··············································································································································· 195
Gratuitous ARP ······································································································································ 196
Configuring ARP entries ································································································································ 196
Displaying ARP entries ·························································································································· 196
Creating a static ARP entry ···················································································································· 196
Removing ARP entries ··································································································································· 197
Configuring gratuitous ARP ··························································································································· 197
Static ARP configuration example ·········································································································· 198
Configuring ARP attack protection ······························································ 202
Overview ························································································································································ 202
User validity check ································································································································· 202
ARP packet validity check ······················································································································ 202
Configuring ARP detection ····························································································································· 202
Configuring IGMP snooping ········································································ 204
Overview ························································································································································ 204
Basic IGMP snooping concepts ············································································································· 204
How IGMP snooping works ···················································································································· 206
Protocols and standards ························································································································ 207
Recommended configuration procedure ········································································································ 207
Enabling IGMP snooping globally ·················································································································· 208
Enabling dropping unknown multicast data globally ······················································································ 208
Configuring IGMP snooping in a VLAN ·········································································································· 209
Configuring IGMP snooping port functions ···································································································· 210
Displaying IGMP snooping multicast forwarding entries ················································································ 211
IGMP snooping configuration example ·········································································································· 212
Network requirements ···························································································································· 212
Configuration procedure ························································································································· 213
Verifying the configuration ······················································································································ 215
Configuring MLD snooping ········································································· 216
Overview ························································································································································ 216
Basic MLD snooping concepts ··············································································································· 216
How MLD snooping works ····················································································································· 218
Protocols and standards ························································································································ 219
Recommended configuration procedure ········································································································ 219
Enabling MLD snooping globally ············································································································ 220
Enabling dropping unknown IPv6 multicast data globally ······································································ 220
Configuring MLD snooping in a VLAN ··································································································· 221
Configuring MLD snooping port functions ······························································································ 222
Displaying MLD snooping multicast forwarding entries ·········································································· 223
MLD snooping configuration example ············································································································ 224
v
Page 8

Network requirements ···························································································································· 224
Configuration procedure ························································································································· 225
Verifying the configuration ······················································································································ 227
Configuring IPv4 or IPv6 static routes ························································· 228
Creating an IPv4 static route ·························································································································· 228
Displaying the IPv4 active route table ············································································································ 229
Creating an IPv6 static route ·························································································································· 229
Displaying the IPv6 active route table ············································································································ 230
DHCP overview ··························································································· 232
DHCP address allocation ······························································································································· 232
Allocation mechanisms ·························································································································· 232
IP address allocation process ················································································································ 233
IP address lease extension ···················································································································· 233
DHCP message format ·································································································································· 234
DHCP options ················································································································································ 234
Common DHCP options ························································································································· 235
Option 82 ················································································································································ 235
Protocols and standards ································································································································ 236
Configuring DHCP snooping ······································································· 237
Overview ························································································································································ 237
Application of trusted ports ····················································································································· 237
DHCP snooping support for Option 82 ··································································································· 238
Recommended configuration procedure ········································································································ 239
Enabling DHCP snooping ······························································································································ 239
Configuring DHCP snooping functions on an interface ·················································································· 240
Displaying clients' IP-to-MAC bindings ·········································································································· 240
DHCP snooping configuration example ········································································································· 241
Managing services ······················································································ 244
Overview ························································································································································ 244
Managing services ········································································································································· 244
Using diagnostic tools ················································································· 247
Ping ································································································································································ 247
Traceroute ······················································································································································ 247
Ping operation ················································································································································ 248
Configuring IPv4 Ping ···························································································································· 248
Configuring IPv6 Ping ···························································································································· 249
Traceroute operation ······································································································································ 249
Configuring IPv4 traceroute ··················································································································· 249
Configuring IPv6 traceroute ··················································································································· 250
Configuring 802.1X ····················································································· 252
802.1X overview ············································································································································ 252
802.1X architecture ································································································································ 252
Access control methods ························································································································· 252
Controlled/uncontrolled port and port authorization status ····································································· 253
Packet formats ······································································································································· 253
EAP over RADIUS ································································································································· 254
Initiating 802.1X authentication ·············································································································· 255
802.1X authentication procedures ········································································································· 255
802.1X timers ········································································································································· 259
Using 802.1X authentication with other features ···················································································· 259
Configuration prerequisites ···························································································································· 261
Recommended configuration procedure ········································································································ 262
Configuring 802.1X globally ··························································································································· 262
Configuring 802.1X on a port ························································································································· 263
Configuring an 802.1X guest VLAN ······································································································· 265
Configuring an Auth-Fail VLAN ·············································································································· 266
vi
Page 9

802.1X configuration examples ······················································································································ 266
MAC-based 802.1X configuration example ···························································································· 266
802.X with ACL assignment configuration example ··············································································· 273
Configuring AAA ························································································· 282
Overview ························································································································································ 282
AAA application ······································································································································ 282
Domain-based user management ·········································································································· 283
Configuration prerequisites ···························································································································· 283
Recommended configuration procedure ································································································ 283
Configuring an ISP domain ···················································································································· 284
Configuring authentication methods for the ISP domain ········································································ 284
Configuring authorization methods for the ISP domain ·········································································· 286
Configuring accounting methods for the ISP domain ············································································· 287
AAA configuration example ···························································································································· 288
Configuring RADIUS ··················································································· 293
Overview ························································································································································ 293
Client/server model ································································································································ 293
Security and authentication mechanisms ······························································································· 293
Basic RADIUS message exchange process ·························································································· 294
RADIUS packet format ··························································································································· 294
Extended RADIUS attributes ·················································································································· 297
Protocols and standards ························································································································ 297
Configuring a RADIUS scheme ····················································································································· 298
Configuring common parameters ··········································································································· 299
Adding RADIUS servers ························································································································· 302
RADIUS configuration example ····················································································································· 303
Configuration guidelines ································································································································ 307
Configuring HWTACACS ············································································ 309
Recommended configuration procedure ········································································································ 309
Creating the HWTACACS scheme system ···································································································· 309
Configuring HWTACACS servers for the scheme ························································································· 310
Configuring HWTACACS communication parameters for the scheme ·························································· 311
HWTACACS configuration example ·············································································································· 314
Network requirements ···························································································································· 314
Configuring the HWTACACS server ······································································································ 314
Configuring the HPE NJ5000 5G PoE+ switch ······················································································ 314
Verifying the configuration ······················································································································ 319
Configuration guidelines ································································································································ 319
Configuring users ························································································ 321
Configuring a local user ································································································································· 321
Configuring a user group ······························································································································· 323
Managing certificates ·················································································· 325
Overview ························································································································································ 325
PKI terms ··············································································································································· 325
PKI architecture ······································································································································ 325
How PKI works ······································································································································· 326
PKI applications ····································································································································· 327
Recommended configuration procedures ······································································································ 327
Recommended configuration procedure for manual request ································································· 327
Recommended configuration procedure for automatic request ····························································· 329
Creating a PKI entity ······································································································································ 329
Creating a PKI domain ··································································································································· 330
Generating an RSA key pair ·························································································································· 333
Destroying the RSA key pair ·························································································································· 334
Retrieving and displaying a certificate ··········································································································· 334
Requesting a local certificate ························································································································· 336
Retrieving and displaying a CRL ···················································································································· 337
vii
Page 10

PKI configuration example ····························································································································· 338
Configuration guidelines ································································································································ 342
Configuring MAC authentication ································································· 343
Overview ························································································································································ 343
User account policies ····························································································································· 343
Authentication methods ·························································································································· 343
MAC authentication timers ····················································································································· 343
Using MAC authentication with other features ······························································································· 344
VLAN assignment ·································································································································· 344
ACL assignment ····································································································································· 344
Auth-Fail VLAN ······································································································································ 344
Configuration prerequisites ···························································································································· 344
Recommended configuration procedure ········································································································ 345
Configuring MAC authentication globally ······································································································· 345
Configuring MAC authentication on a port ····························································································· 346
MAC authentication configuration examples ·································································································· 347
Local MAC authentication configuration example ·················································································· 347
ACL assignment configuration example································································································· 350
Configuring port security ············································································· 358
Overview ························································································································································ 358
Port security features ····························································································································· 358
Port security modes ······························································································································· 358
Configuration guidelines ································································································································ 360
Recommended configuration procedure ········································································································ 360
Configuring global settings for port security ··································································································· 361
Configuring basic port security control ··········································································································· 362
Configuring secure MAC addresses ·············································································································· 363
Configuring advanced port security control ···································································································· 364
Configuring permitted OUIs ··························································································································· 366
Port security configuration examples ············································································································· 366
Basic port security mode configuration example ···················································································· 366
Advanced port security mode configuration example ············································································ 369
Configuring port isolation ············································································ 375
Configuring the isolation group ······················································································································ 375
Port isolation configuration example ·············································································································· 376
Configuring authorized IP ··········································································· 378
Configuration procedure ································································································································ 378
Authorized IP configuration example ············································································································· 379
Network requirements ···························································································································· 379
Configuration procedure ························································································································· 379
Configuring loopback detection ··································································· 381
Recommended configuration procedure ········································································································ 381
Configuring loopback detection globally ········································································································ 381
Configuring loopback detection on a port ······································································································ 382
Configuring ACLs ························································································ 383
Overview ························································································································································ 383
ACL categories ······································································································································· 383
Match order ············································································································································ 383
Implementing time-based ACL rules ······································································································ 384
IPv4 fragments filtering with ACLs ········································································································· 385
Configuration guidelines ································································································································ 385
Recommend ACL configuration procedures ·································································································· 385
Recommended IPv4 ACL configuration procedure ················································································ 385
Recommended IPv6 ACL configuration procedure ················································································ 385
Configuring a time range ························································································································ 386
Adding an IPv4 ACL ······························································································································· 387
viii
Page 11

Configuring a rule for a basic IPv4 ACL ································································································· 387
Configuring a rule for an advanced IPv4 ACL ························································································ 389
Configuring a rule for an Ethernet frame header ACL ············································································ 391
Adding an IPv6 ACL ······························································································································· 393
Configuring a rule for a basic IPv6 ACL ································································································· 394
Configuring a rule for an advanced IPv6 ACL ························································································ 395
Configuring QoS ························································································· 398
Overview ························································································································································ 398
Networks without QoS guarantee ·········································································································· 398
QoS requirements of new applications ·································································································· 398
Congestion: causes, impacts, and countermeasures ············································································ 398
End-to-end QoS ····································································································································· 400
Traffic classification ································································································································ 400
Packet precedences ······························································································································· 401
Queue scheduling ·································································································································· 403
Rate limit ················································································································································ 405
Priority mapping ····································································································································· 406
Introduction to priority mapping tables ··································································································· 407
Configuration guidelines ································································································································ 408
Recommended QoS configuration procedures ······························································································ 408
Adding a class ················································································································································ 409
Configuring classification rules ······················································································································ 410
Adding a traffic behavior ································································································································ 412
Configuring traffic mirroring and traffic redirecting for a traffic behavior ························································ 412
Configuring other actions for a traffic behavior ······························································································ 413
Adding a policy ··············································································································································· 415
Configuring classifier-behavior associations for the policy ············································································ 415
Applying a policy to a port ······························································································································ 416
Configuring queue scheduling on a port ········································································································ 417
Configuring GTS on ports ······························································································································ 418
Configuring rate limit on a port ······················································································································· 418
Configuring priority mapping tables ··············································································································· 419
Configuring priority trust mode on a port ········································································································ 420
ACL and QoS configuration example ·························································· 422
Network requirements ···································································································································· 422
Configuring Switch ········································································································································· 422
Configuring PoE ·························································································· 430
Overview ························································································································································ 430
PoE system ············································································································································ 430
Power supplying modes ························································································································· 430
Protocols and standards ························································································································ 431
Configuring PoE ············································································································································· 431
Configuring PoE ports ···························································································································· 431
Configuring non-standard PD detection ································································································· 432
Displaying information about PSE and PoE ports ·················································································· 432
PoE configuration example ···························································································································· 433
Document conventions and icons ······························································· 435
Conventions ··················································································································································· 435
Network topology icons ·································································································································· 436
Support and other resources ······································································ 437
Accessing Hewlett Packard Enterprise Support ···························································································· 437
Accessing updates ········································································································································· 437
Websites ················································································································································ 438
Customer self repair ······························································································································· 438
Remote support ······································································································································ 438
Documentation feedback ······················································································································· 438
ix
Page 12

Index ··········································································································· 440
x
Page 13

Overview
The HPE FlexNetwork NJ5000 5G PoE+ Walljack Switch provides a Web interface for visual
configuration and management. The device also provides a command line interface (CLI) for device
management when the Web interface is not available.
This book focuses on configuring the switch from the Web interface, and does not provide
information about accessing the CLI. For information about accessing the CLI, see the quick start
guide or getting started guide for the switch.
Accessing the Web interface
This section provides information about logging in to or logging out of the Web interface.
Restrictions and guidelines for Web-based login
To ensure a successful login, verify that your operating system and Web browser meet the
requirements, and follow the guidelines in this section.
Operating system requirements
The device supports the following operating systems:
• Windows XP.
• Windows 2000.
• Windows Server 2003 Enterprise Edition.
• Windows Server 2003 Standard Edition.
• Windows Vista.
• Windows 7.
• Linux.
• MAC OS.
The Windows firewall limits the number of TCP connections. When the limit is reached, you cannot
log in to the Web interface.
Web browser requirements
Use one of the following Web browsers to log in:
• Internet Explorer 6 SP2 or higher.
• Mozilla Firefox 3 or higher.
• Google Chrome 2.0.174.0 or higher.
To access the Web interface, you must use the following browser settings:
• If you are using a Microsoft Internet Explorer browser, you must enable the security settings
(see "Enabling security settings in a Microsoft Internet Explorer browser"), including Run
eX controls and plug-ins, Script ActiveX controls marked safe for scripting, and
Activ
Active scripting.
• If you are using a Mozilla Firefox browser, you must enable JavaScript (see "Enabling
JavaScript in
a Firefox browserEnabling JavaScript in a Firefox browser").
Enabling security settings in a Microsoft Internet Explorer browser
1. Launch the Internet Explorer, and select Tools > Internet Options from the main menu.
1
Page 14
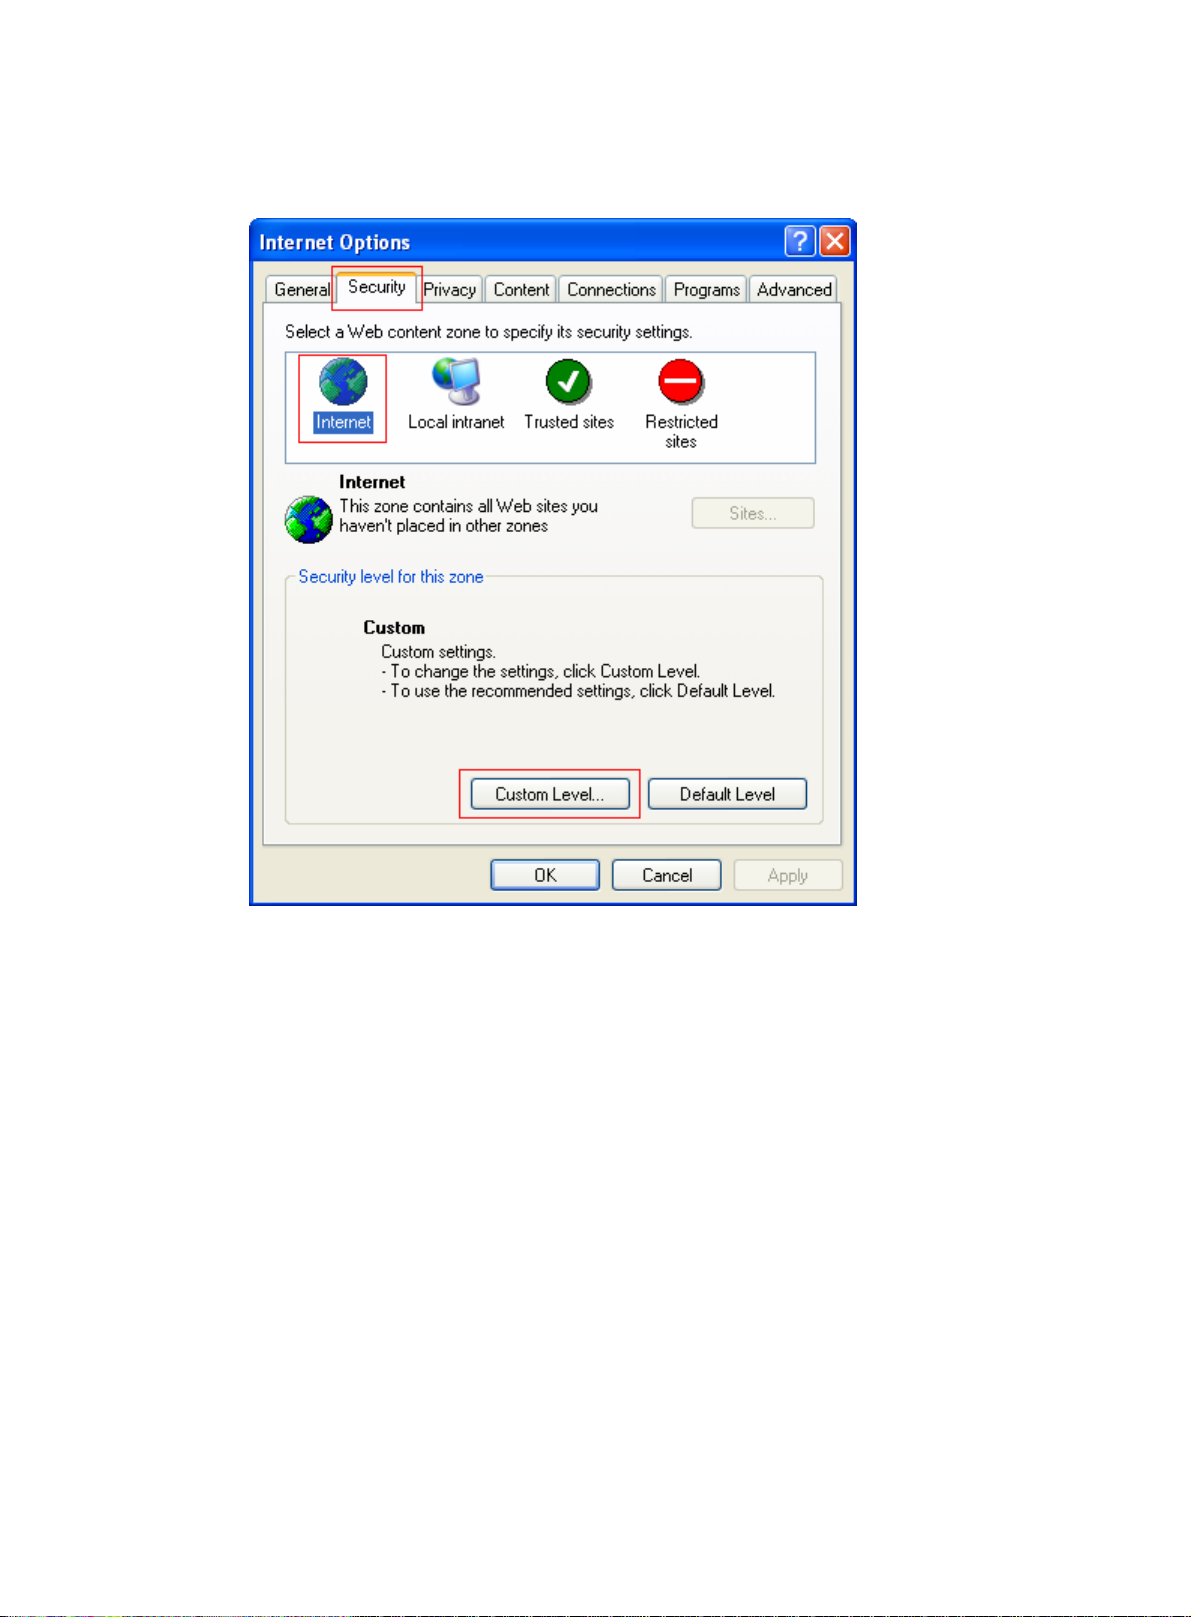
2. Select the Security tab, and select the content zone where the target Website resides, as
shown in Figure 1.
Figure 1
Internet Explorer settings (1)
3. Click Custom Level.
4. In the Security Settings dialog box, enable Run ActiveX controls and plug-ins, Script
ActiveX controls marked safe for scripting, and Active scripting.
2
Page 15
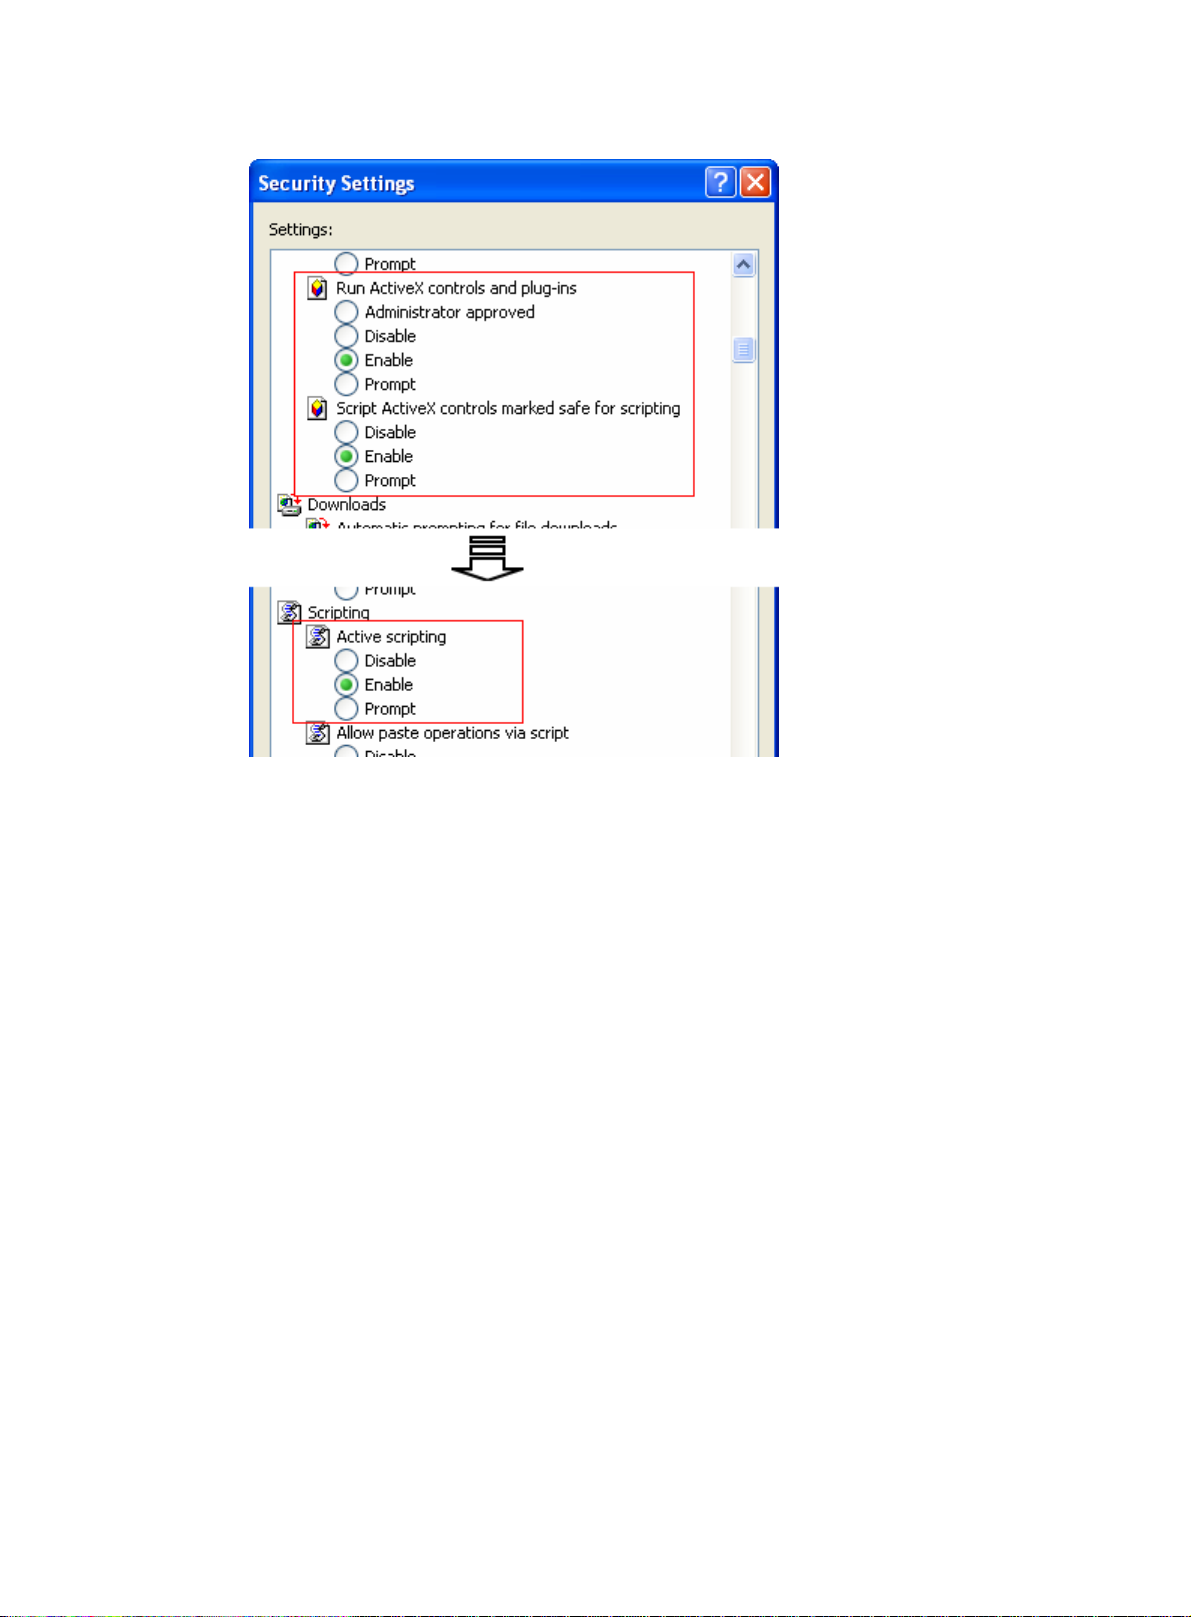
Figure 2 Internet Explorer settings (2)
5. Click OK to save your settings.
Enabling JavaScript in a Firefox browser
1. Launch the Firefox browser, and select Tools > Options.
2. In the Options dialog box, click the Content icon, and select Enable JavaScript.
3
Page 16
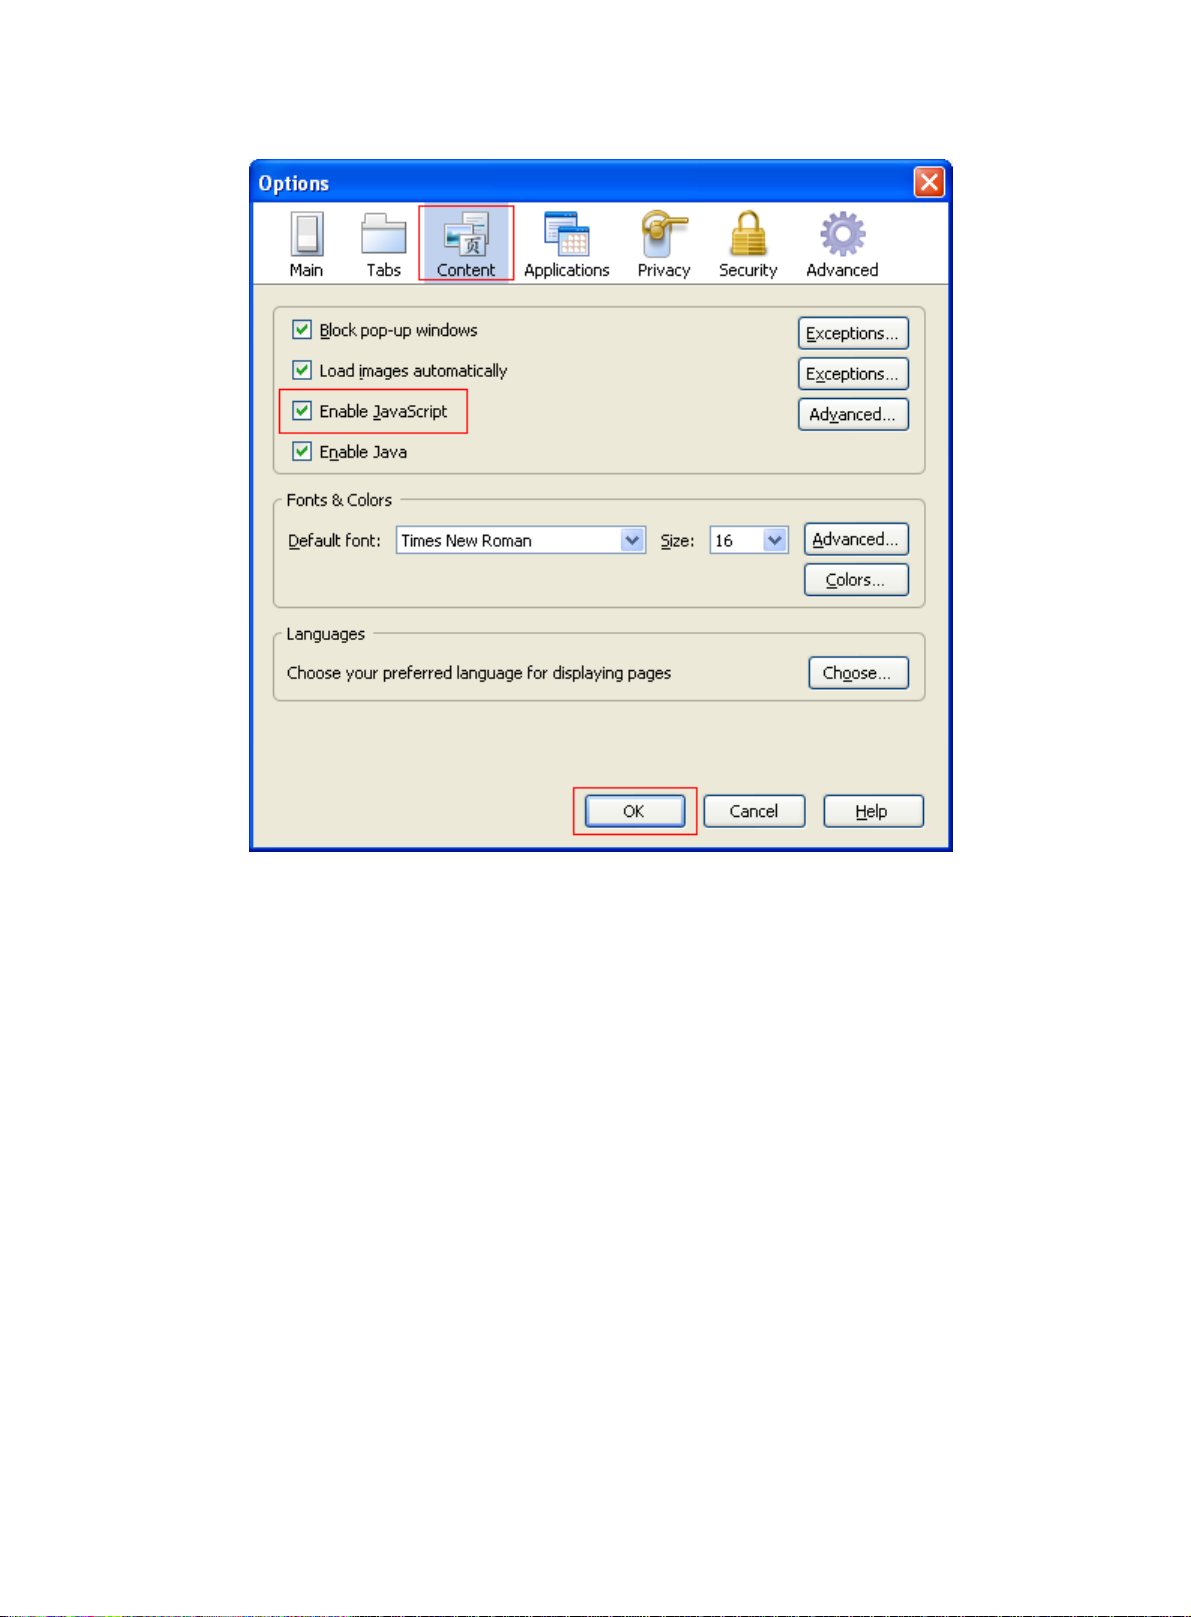
Figure 3 Firefox browser settings
3. Click OK to save your settings.
Miscellaneous
• The Web interface does not support the Back, Next, or Refresh button provided by the browser.
Using these buttons might result in abnormal display of Web pages.
• To ensure correct display of Web page contents after software upgrade or downgrade, clear
data cached by the browser before you log in.
• If you click the verification code displayed on the Web login page, you can obtain a new
verification code.
• The Web interface allows a maximum of 5 concurrent accesses. If this limit is reached, login
attempts will fail.
• A list can contain a maximum of 20000 entries if displayed in pages.
Logging in to the Web interface for the first time
At the first login, you can use the following default settings to access the Web interface through
HTTP:
• Username—admin.
• Password—None.
• User level—Management.
• IP address of VLAN-interface 1 on the device—IP address of the device.
4
Page 17
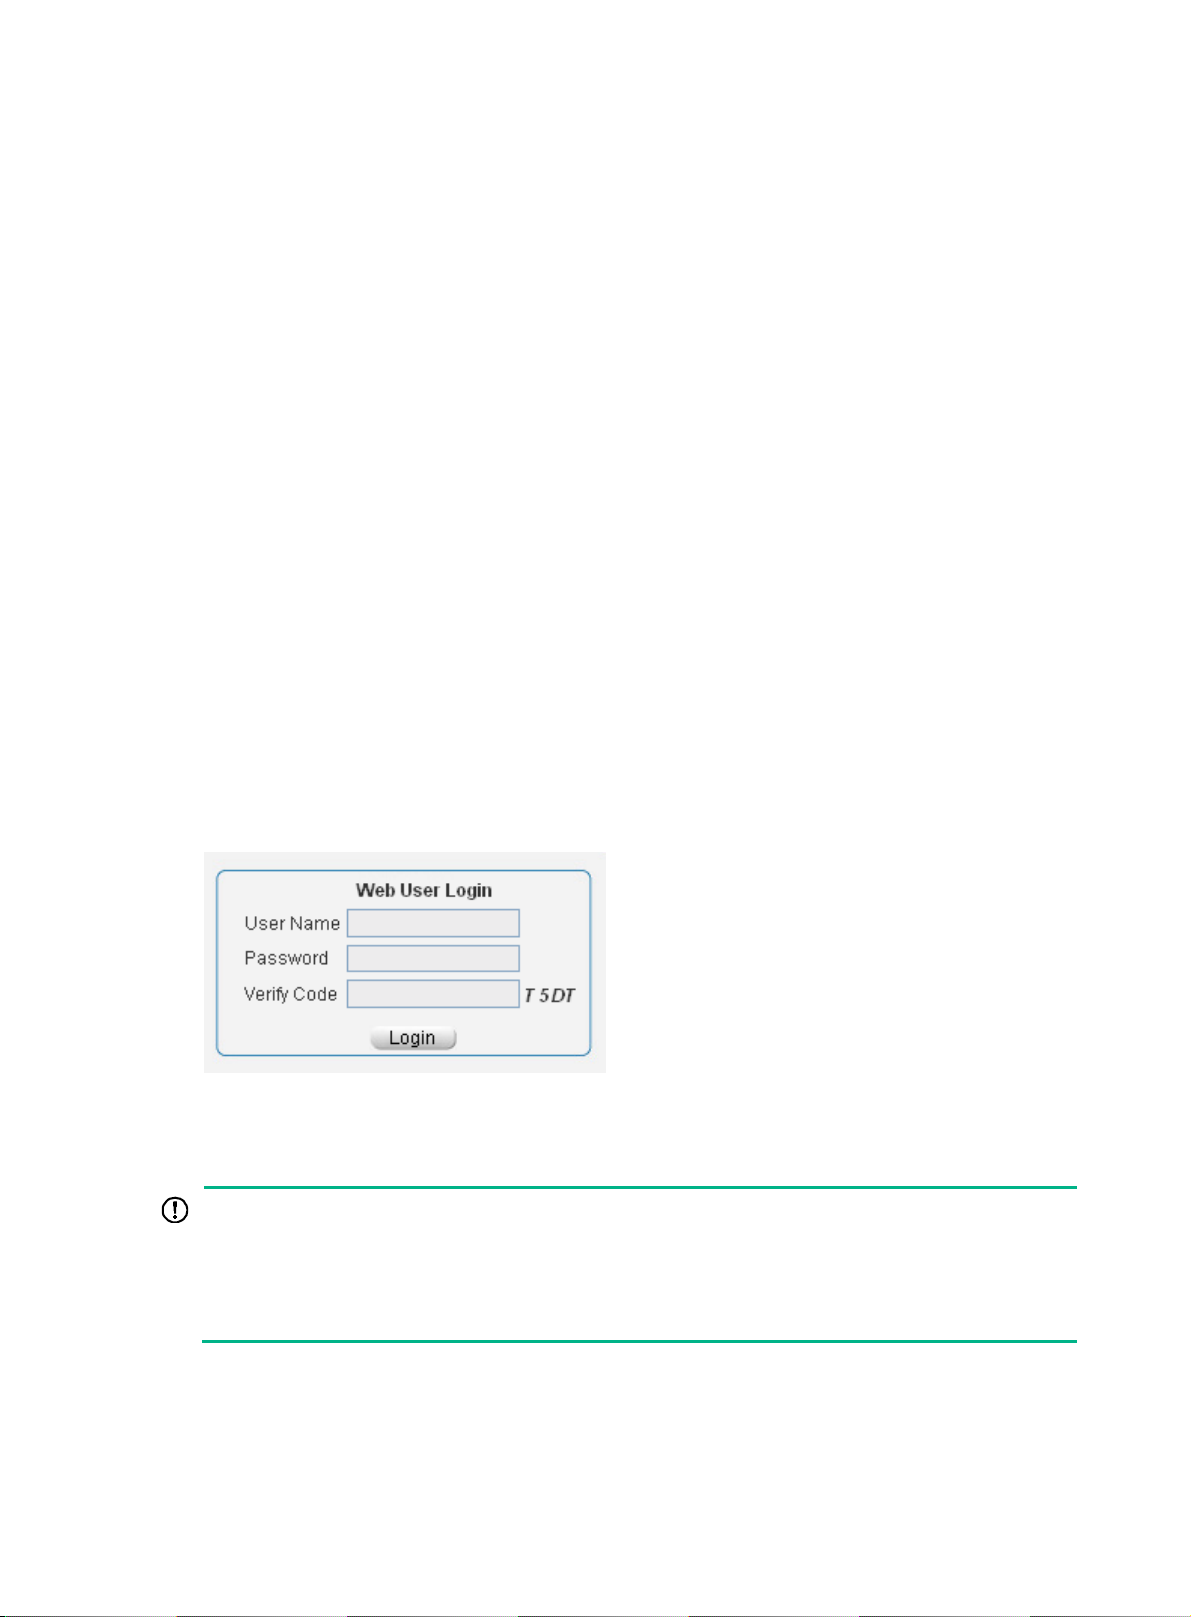
{ If the device is not connected to the network, or no DHCP server exists in the subnet where
the device resides, you can get the IP address of the device on the label on the device. IP
address is 169.254.xxx.xxx. If the MAC address is 08004E000102, the IP address would be
169.254.1.2.
{ If a DHCP server exists in the subnet where the device resides, the device will dynamically
obtain its IP address through the DHCP server.
You can log in to the device through the console port, and execute the display ip interface brief
command to view information about its IP address.
<HPE> display ip interface brief
*down: administratively down
(s): spoofing
Interface Physical Protocol IP Address Description
Vlan1 up up 169.254.1.2 Vlan-interface1
For example, the IP address of the device is 169.254.1.2. To log in to the Web interface of the device
from a PC:
1. Connect the Ethernet interface of the device to a PC by using an Ethernet cable. By default, all
interfaces belong to VLAN 1.
2. Configure an IP address for the PC and make sure that the PC and device can reach each
other.
For example, assign the PC an IP address (for example, 169.254.1.27) within 169.254.0.0/16
(except for the IP address of the device).
3. Open the browser, and input the login information.
a. Type the IP address http:// 169.254.1.2 in the address bar and press Enter.
b. On the login page, enter the username admin and the verification code, leave the
Password field blank, and then click Login.
Figure 4 Login page of the Web interface
Logging out of the Web interface
IMPORTANT:
• For security purposes, log out of the Web interface immediately after you finish your tasks.
• You cannot log out by closing the browser.
• The device does not automatically save the configuration when you log out of the Web interface.
To prevent the loss of configuration when the device reboots, you must save the configuration.
To log out of the Web interface:
1. Save the configuration.
2. Click Logout in the upper-right corner of the Web interface.
5
Page 18
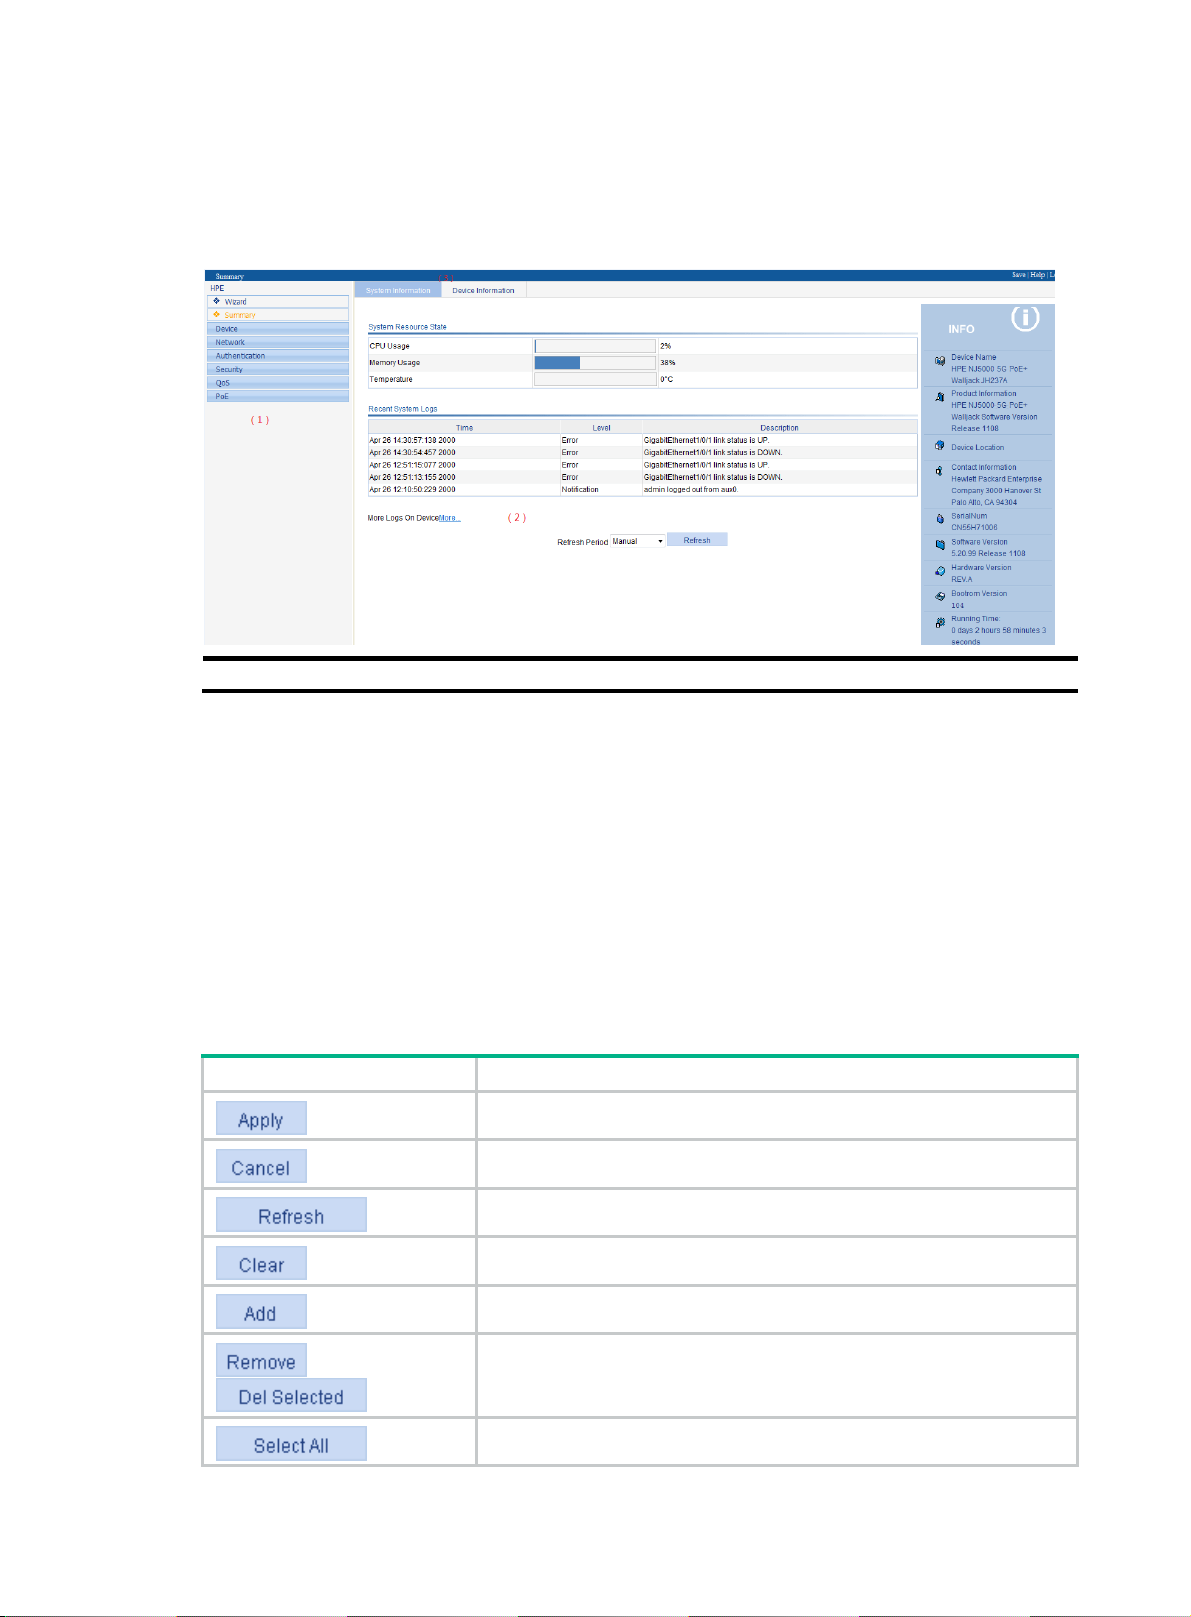
Using the Web interface
The Web interface contains a navigation tree, a title area, and a body area, as shown in Figure 5.
Figure 5 Web interface layout
(1) Navigation tree (2) Body area (3) Title area
• Navigation tree—Organizes the Web-based NM functions as a navigation tree, where you can
select and configure functions as needed. The result is displayed in the body area.
• Body area—Allows you to configure and display features.
• Title area—On the left, displays the path of the current configuration interface in the navigation
area; on the right, provides the Save button to quickly save the current configuration, the Help
button to display the Web-related help information, and the Logout button to log out of the Web
interface.
Icons and buttons
Table 1 describes icons and buttons you can use to configure and manage the device.
Table 1 Icons and buttons
Icon/button Function
Applies the configuration on the current page.
Cancels the configuration on the current page.
Refreshes the current page.
,
Clears all entries in a list or all statistics.
Adds an item.
Removes the selected items.
Selects all the entries in a list.
6
Page 19
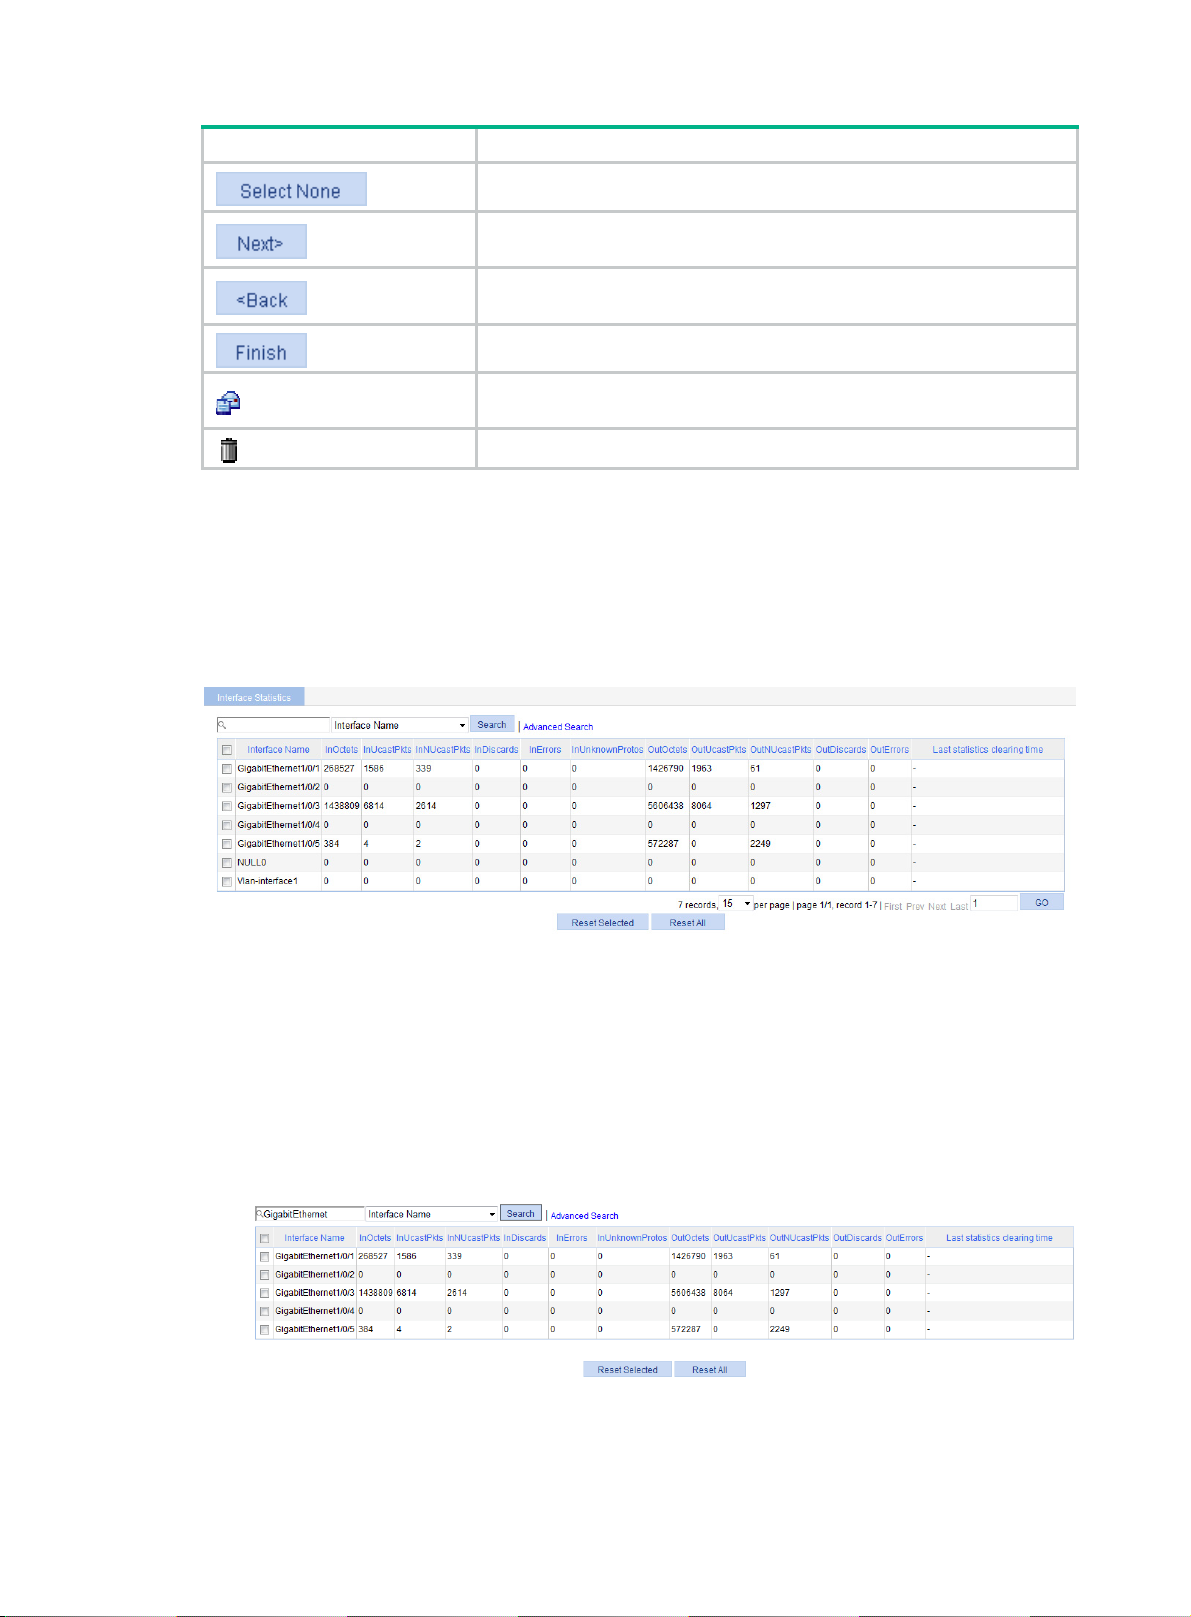
Icon/button Function
Page display function
The Web interface can display contents in pages, as shown in Figure 6. You can set the number of
entries displayed per page, and view the contents on the first, previous, next, and last pages, or go to
any page that you want to check.
Figure 6 Content display in pages
Clears selection of all entries in a list.
Buffers but does not apply the configuration of the current step, and
enters the next configuration step.
Buffers but does not apply the configuration of the current step, and
returns to the previous configuration step.
Applies the configurations of all configuration steps.
Enters the modification page of an item so that you can modify the
configurations of the item.
Deletes the item corresponding to this icon.
Search function
The Web interface provides basic and advanced searching functions to display entries that match
specific searching criteria.
• Basic search—As shown in Figure 6, type the sea
then click Search to display the matching entries.
Figure 7 Basic search function example
• Advanced search—As shown in Figure 8, click the Advanced Search link to open the
advanced search area. Specify the search criteria, and then click Apply to display the matching
entries.
rch keyword, select a search criterion, and
7
Page 20
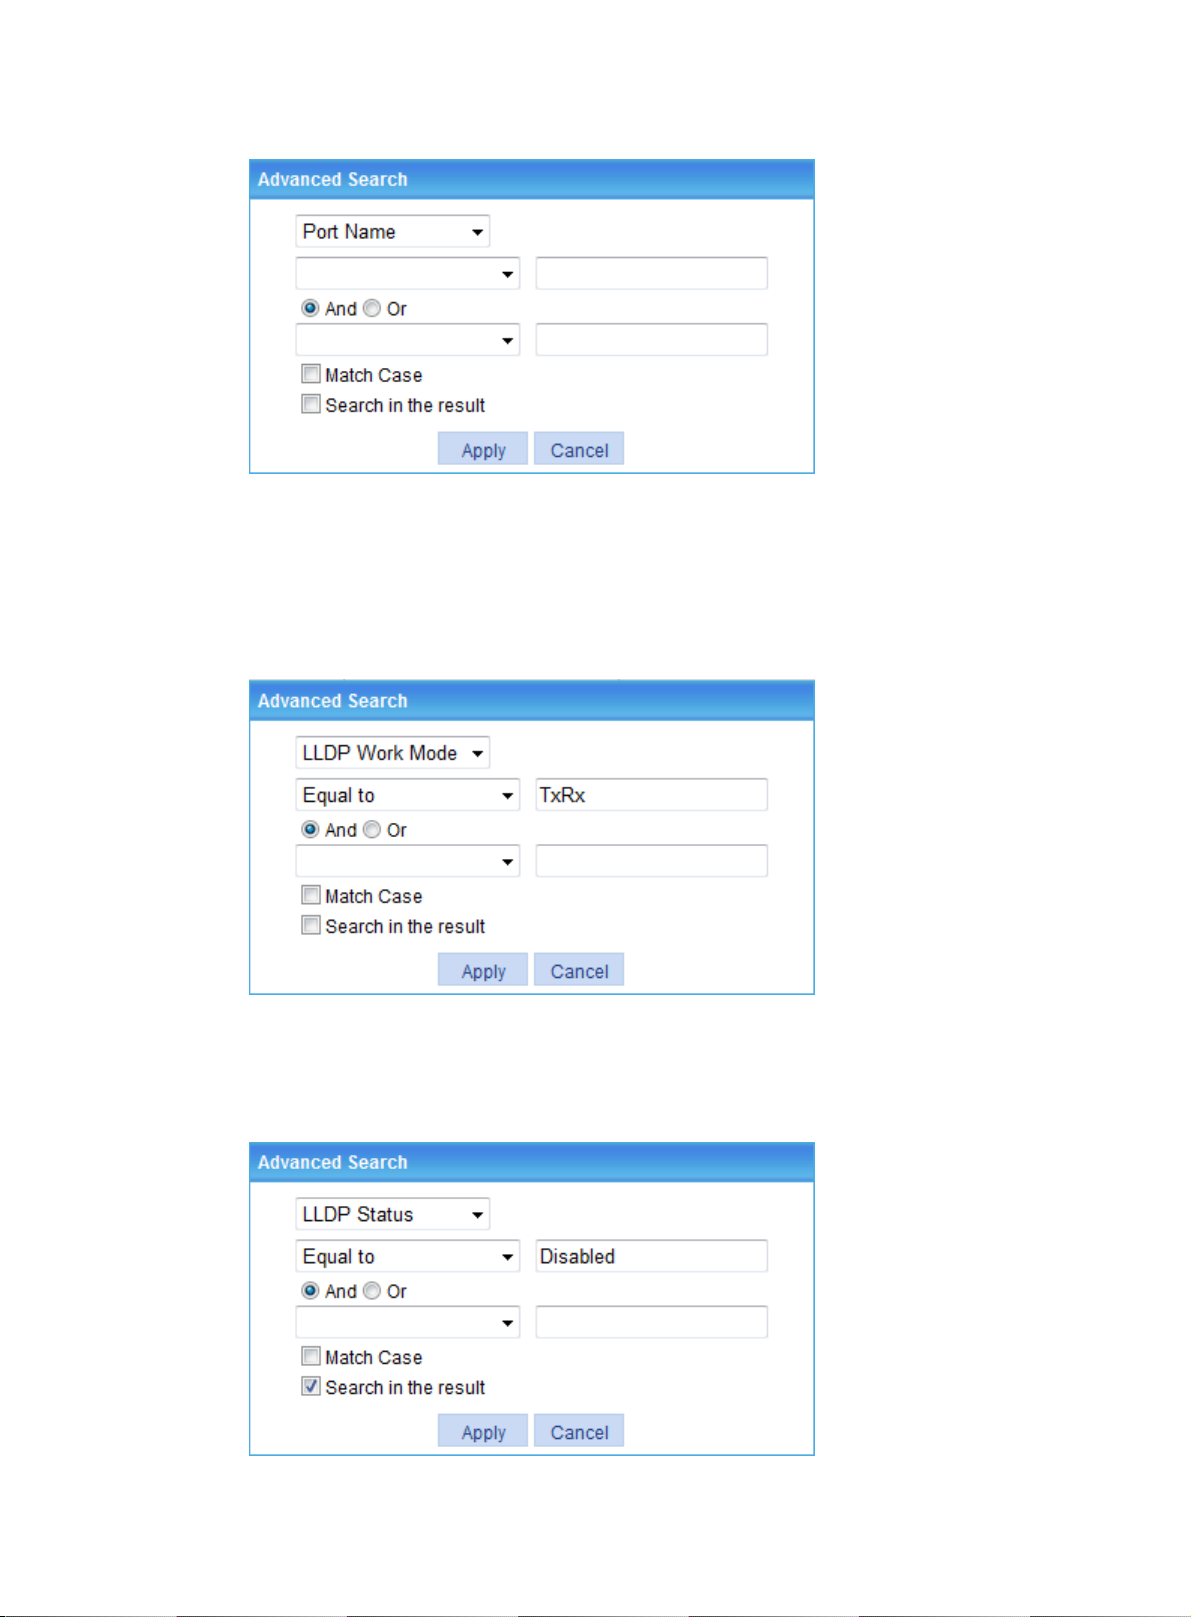
Figure 8 Advanced search
For example, to search the LLDP table for the LLDP entries with LLDP Work Mode TxRx, and LLDP
Status Disabled:
1. Click the Advanced Search link, specify the search criteria on the advanced search page as
shown in Figure 9, and th
en click Apply. The LLDP entries with LLDP Work Mode being TxRx
are displayed.
Figure 9 Advanced search function example (1)
2. Click the Advanced Search link, specify the search criteria on the advanced search page as
shown in Figure 10,
and then click Apply. The LLDP entries with LLDP Work Mode being TxRx
and LLDP Status being Disabled are displayed as shown in Figure 11.
Figure 10
Advanced search function example (2)
8
Page 21
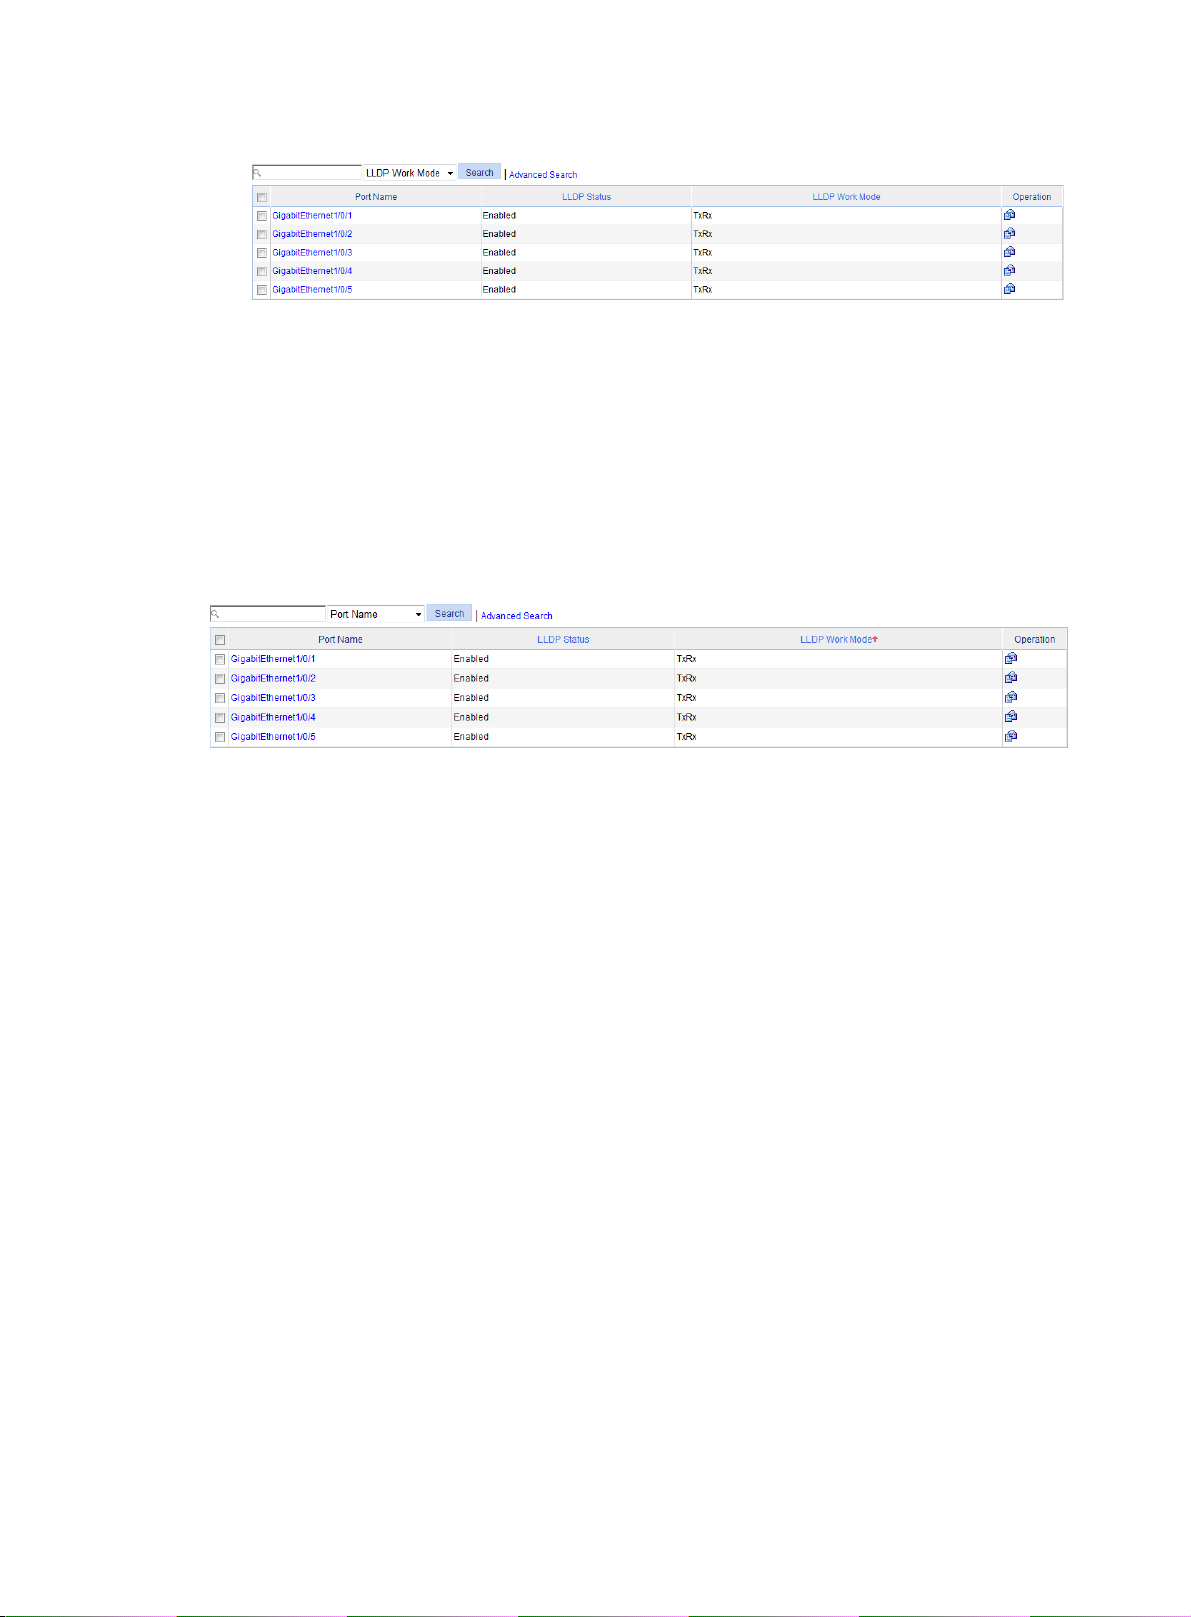
Figure 11 Advanced search function example (3)
Sort function
The Web interface provides the sorting function on some list pages to display the entries in a certain
order.
On a list page, you can click the name of a column header in blue to sort the entries. An arrow will be
displayed next to the column header you clicked, as shown in Figure 12.
the ascending order, and a downward arrow indicates the descending order.
Figure 12 Sort display
An upward arrow indicates
9
Page 22

Feature summary
This chapter provides the following information:
• Feature menu navigators for the Web interface.
• Information about features configurable from the CLI.
Features configurable from the Web interface are also configurable from the CLI.
Feature menu navigators for the Web interface
This section summarizes features available from each menu on the Web interface.
The Web interface controls access to features based on user levels. Tasks you can perform depend
on the user level with which you are logged in with.
Web user levels, from low to high, are visitor, monitor, configure, and management. A user with a
higher level has all the operating rights of a user with a lower level.
• Visitor—Users of this level can only use the network diagnostic tools ping and Trace Route.
They cannot access the device data or configure the device.
• Monitor—Users of this level can access the device data, but they cannot configure the device.
• Configure—Users of this level can access device data and configure the device, but they
cannot perform the following tasks:
{ Upgrade the host software.
{ Add, delete, or modify users.
{ Back up or restore configuration files.
• Management—Users of this level can use all features available on the device.
Wizard menu
Use Table 2 to navigate to the tasks you can perform from the Device menu.
Table 2 Wizard menu navigator
Menus Tasks User level
IP Setup Perform quick configuration of the device. Management
Summary menu
Use Table 3 to navigate to the tasks you can perform from the Summary menu.
Table 3 Summary menu navigator
Menus Tasks User level
System Information
Device Information Display the port information about the device. Monitor
Display the basic system information, system resource
state, and recent system operation logs.
Monitor
10
Page 23

Device menu
Use Table 4 to navigate to the tasks you can perform from the Device menu.
Table 4 Device menu navigator
Menus Tasks User level
Basic
System Name Display and configure the system name. Configure
Web Idle Timeout
Device Maintenance
Software Upgrade
Reboot Reboot the device. Management
Electronic Label Display the electronic label of the device. Monitor
Diagnostic
Information
System Time
System Time Display and configure the system date and time. Configure
Time Zone
Network Time
Protocol
Syslog
Loglist
Loghost Display and configure the loghost. Configure
Display and configure the idle timeout period for logged-in
users.
Upload upgrade file from local host, and upgrade the
system software.
Generate diagnostic information file and view or save the
file to local host.
Display and configure the system time zone and daylight
saving time.
Display the synchronization status of the system clock and
configure the network time.
Display and refresh system logs. Monitor
Clear system logs. Configure
Configure
Management
Management
Configure
Configure
Log Setup
Configuration
Backup
Restore
Save
Initialize Restore the factory default settings. Management
File Management
File Management
Port Management
Summary Display port information by features. Monitor
Detail Display feature information by ports. Monitor
Display and configure the buffer capacity and interval for
refreshing system logs.
Back up the configuration file to be used at the next startup
from the device to the host of the current user.
Upload the configuration file to be used at the next startup
from the host of the current user to the device.
Save the current configuration to the configuration file to
be used at the next startup.
Manage files on the device, such as displaying the file list,
downloading a file, uploading a file, and removing a file.
11
Configure
Management
Management
Configure
Management
Page 24

Menus Tasks User level
Setup
Create, modify, delete, and enable/disable a port, and
clear port statistics.
Configure
Port Mirroring
Summary
Add Create a port mirroring group. Configure
Remove Remove a port mirroring group. Configure
Modify Port Configure ports for a mirroring group. Configure
Users
Summary Display the brief information about FTP and Telnet users. Monitor
Super Password
Create Create an FTP or Telnet user. Management
Modify Modify FTP or Telnet user information. Management
Remove Remove an FTP or a Telnet user. Management
Switch To
Management
Loopback
Loopback Perform loopback tests on Ethernet interfaces. Configure
VCT
Display the configuration information about a port
mirroring group.
Configure a password for a lower-level user to switch from
the current access level to the management level.
Switch the current user level to the management level.
Monitor
Management
Monitor
VCT
Flow Interval
Port Traffic Statistics
RMON
Statistics Display, create, modify, and clear RMON statistics. Configure
History
Alarm Display, create, modify, and clear alarm entries. Configure
Event Display, create, modify, and clear event entries. Configure
Log Display log information about RMON events. Configure
Energy Saving
Energy Saving
SNMP
Setup
Check the status of the cables connected to Ethernet
ports.
Display the average rate at which the interface receives
and sends packets within a specified time interval.
Display, create, modify, and clear RMON history sampling
information.
Display and configure the energy saving settings of an
interface.
Display and refresh SNMP configuration and statistics
information.
Configure SNMP. Management
Configure
Monitor
Configure
Configure
Management
Community Display SNMP community information. Management
12
Page 25

Menus Tasks User level
Create, modify, and delete an SNMP community. Management
Group
User
Trap
View
Interface Statistics
Interface Statistics
Network menu
Use Table 5 to navigate to the tasks you can perform from the Network menu.
Table 5 Network menu navigator
Display SNMP group information. Management
Create, modify, and delete an SNMP group. Management
Display SNMP user information. Management
Create, modify, and delete an SNMP user. Management
Display the status of the SNMP trap function and
information about target hosts.
Enable or disable the SNMP trap function; create, modify,
and delete a target host.
Display SNMP view information. Management
Create, modify, and delete an SNMP view. Management
Display and clear the statistics information about an
interface.
Management
Management
Configure
Menus Tasks User level
VLAN
Select VLAN Select a VLAN range. Monitor
Create Create VLANs. Configure
Port Detail Display the VLAN-related details of a port. Monitor
Detail Display the member port information about a VLAN. Monitor
Modify VLAN Modify the description and member ports of a VLAN. Configure
Modify Port Change the VLAN to which a port belongs. Configure
Remove Remove VLANs. Configure
VLAN Interface
Summary
Create
Modify Modify the IP address and status of the VLAN interface. Configure
Remove Remove the VLAN interface. Configure
Voice VLAN
Display information about VLAN interfaces by address
type.
Create a VLAN interface and assign an IP address to the
interface.
Monitor
Configure
13
Page 26

Menus Tasks User level
Summary Display voice VLAN information globally or on a port. Monitor
Setup Configure the global voice VLAN. Configure
Port Setup Configure a voice VLAN on a port. Configure
OUI Summary
OUI Add
OUI Remove
MAC
MAC
Setup Display and configure MAC address aging time. Configure
MSTP
Region
Global Set global MSTP parameters. Configure
Port Summary Display the MSTP information about ports. Monitor
Port Setup Set MSTP parameters on ports. Configure
LLDP
Port Setup
Display the addresses of the OUIs that can be identified by
voice VLAN.
Add the address of an OUI that can be identified by voice
VLAN.
Remove the address of an OUI that can be identified by
voice VLAN.
Display MAC address information. Monitor
Create and remove MAC addresses. Configure
Display information about MST regions. Monitor
Modify MST regions. Configure
Display the LLDP configuration information, local
information, neighbor information, statistics information,
and status information about a port.
Monitor
Configure
Configure
Monitor
Modify LLDP configuration on a port. Configure
Global Setup
Global Summary Display global LLDP local information and statistics. Monitor
Neighbor Summary Display global LLDP neighbor information. Monitor
ARP Management
ARP Table
Gratuitous ARP
ARP Anti-Attack
ARP Detection
IGMP Snooping
Basic
Display global LLDP configuration information. Monitor
Configure global LLDP parameters. Configure
Display ARP table information. Monitor
Add, modify, and remove ARP entries. Configure
Display the configuration information about gratuitous
ARP.
Configure gratuitous ARP. Configure
Display ARP detection configuration information. Monitor
Configure ARP detection. Configure
Display global IGMP snooping configuration information or
the IGMP snooping configuration information in a VLAN,
Monitor
Monitor
14
Page 27

Menus Tasks User level
and the IGMP snooping multicast entry information.
Configure IGMP snooping globally or in a VLAN. Configure
Display the IGMP snooping configuration information on a
Advanced
MLD Snooping
Basic
Advanced
IPv4 Routing
Summary Display the IPv4 active route table. Monitor
Create
Remove Delete the selected IPv4 static routes. Configure
port.
Configure IGMP snooping on a port. Configure
Display global MLD snooping configuration information or
the MLD snooping configuration information in a VLAN,
and the MLD snooping multicast entry information.
Configure MLD snooping globally or in a VLAN. Configure
Display the MLD snooping configuration information on a
port.
Configure MLD snooping on a port. Configure
Create an IPv4 static route.
NOTE:
The switch does not provide Layer 3 forwarding service.
The IPv4 routing feature only ensures that the switch is
accessible on an IPv4 network. Use this feature only if you
want to manage the switch from a different subnet than the
switch.
Monitor
Monitor
Monitor
Configure
IPv6 Routing
Summary Display the IPv6 active route table. Monitor
Create
Remove Delete the selected IPv6 static routes. Configure
DHCP
DHCP Snooping
Service
Service
Diagnostic Tools
IPv4 Ping Ping an IPv4 address or host name. Visitor
Create an IPv6 static route.
NOTE:
The switch does not provide Layer 3 forwarding service.
The IPv6 routing feature only ensures that the switch is
accessible on an IPv6 network. Use this feature only if you
want to manage the switch from a different subnet than the
switch.
Display the status, trusted and untrusted ports and DHCP
client information about DHCP snooping.
Enable/disable DHCP snooping, and configure DHCP
snooping trusted and untrusted ports.
Display the states of services: enabled or disabled. Configure
Enable/disable services, and set related parameters. Management
Configure
Monitor
Configure
IPv6 Ping Ping an IPv6 address or host name. Visitor
15
Page 28

Menus Tasks User level
IPv4 Trace Route Perform IPv4 trace route operations. Visitor
IPv6 Trace Route Perform IPv6 trace route operations. Visitor
Authentication menu
Use Table 6 to navigate to the tasks you can perform from the Authentication menu.
Table 6 Authentication menu navigator
Menus Tasks User level
MAC Authentication
MAC Authentication
802.1X
802.1X
Port Security
Port Security
AAA
Domain Setup
Authentication
Authorization
Display MAC authentication configuration information. Monitor
Configure MAC authentication. Configure
Display 802.1X configuration information globally or on a
port.
Configure 802.1X globally or on a port. Configure
Display port security configuration information. Monitor
Configure port security. Configure
Display ISP domain configuration information. Monitor
Add and remove ISP domains. Management
Display the authentication configuration information
about an ISP domain.
Specify authentication methods for an ISP domain. Management
Display the authorization method configuration
information about an ISP domain.
Specify authorization methods for an ISP domain. Management
Monitor
Monitor
Monitor
Display the accounting method configuration information
Accounting
RADIUS
RADIUS
HWTACACS
HWTACACS Scheme Create HWTACACS schemes. Management
HWTACACS Server Configure HWTACACS server information. Management
Users
Local User
about an ISP domain.
Specify accounting methods for an ISP domain. Management
Create RADIUS schemes and configure RADIUS server
information.
Display configuration information about local users. Monitor
Create, modify, and remove a local user. Management
16
Monitor
Management
Page 29

Menus Tasks User level
User Group
Display configuration information about user groups. Monitor
Create, modify, and remove a user group. Management
Certificate
Management
Entity
Domain
Certificate
CRL
Security menu
Use Table 7 to navigate to the tasks you can perform from the Security menu.
Table 7 Security menu navigator
Menus Tasks User level
Port Isolate Group
Display information about PKI entities. Monitor
Add, modify, and delete a PKI entity. Configure
Display information about PKI domains. Monitor
Add, modify, and delete a PKI domain. Configure
Display the certificate information about PKI domains
and the contents of a certificate.
Generate a key pair, destroy a key pair, retrieve a
certificate, request a certificate, and delete a certificate.
Display the contents of the CRL. Monitor
Receive the CRL of a domain. Configure
Monitor
Configure
Summary Display port isolation group information. Monitor
Port Setup Configure the ports in an isolation group. Configure
Authorized IP
Summary
Setup Configure authorized IP. Management
Loopback Detection
Loopback Detection
QoS menu
Use Table 8 to navigate to the tasks you can perform from the QoS menu.
Table 8 QoS menu navigator
Menus Tasks User level
Time Range
Display the configurations of authorized IP, the
associated IPv4 ACL list, and the associated IPv6 ACL
list.
Display and configure system loopback detection
parameters and port loopback detection parameters.
Management
Configure
17
Page 30

Menus Tasks User level
Summary Display time range configuration information. Monitor
Add Create a time range. Configure
Remove Delete a time range. Configure
ACL IPv4
Summary Display IPv4 ACL configuration information. Monitor
Add Create an IPv4 ACL. Configure
Basic Setup Configure a rule for a basic IPv4 ACL. Configure
Advanced Setup Configure a rule for an advanced IPv4 ACL. Configure
Link Layer Setup Create a rule for a link layer ACL. Configure
Remove Delete an IPv4 ACL or its rules. Configure
ACL IPv6
Summary Display IPv6 ACL configuration information. Monitor
Add Create an IPv6 ACL. Configure
Basic Setup Configure a rule for a basic IPv6 ACL. Configure
Advanced Setup Configure a rule for an advanced IPv6 ACL. Configure
Remove Delete an IPv6 ACL or its rules. Configure
Queue
Summary Display the queue information about a port. Monitor
Setup Configure a queue on a port. Configure
GTS
Summary Display port GTS information Monitor
Setup Configure port GTS Configure
Line Rate
Summary Display line rate configuration information. Monitor
Setup Configure the line rate. Configure
Classifier
Summary Display classifier configuration information. Monitor
Create Create a class. Configure
Setup Configure the classification rules for a class. Configure
Remove Delete a class or its classification rules. Configure
Behavior
Summary Display traffic behavior configuration information. Monitor
Add Create a traffic behavior. Configure
Setup Configure actions for a traffic behavior. Configure
Port Setup
Remove Delete a traffic behavior. Configure
Configure traffic mirroring and traffic redirecting for a
traffic behavior
Configure
18
Page 31

Menus Tasks User level
QoS Policy
Summary Display QoS policy configuration information. Monitor
Add Create a QoS policy. Configure
Setup
Remove
Port Policy
Summary Display the QoS policy applied to a port. Monitor
Setup Apply a QoS policy to a port. Configure
Remove Remove the QoS policy from the port. Configure
Priority Mapping
Priority Mapping
Port Priority
Port Priority
PoE menu
Use Table 9 to navigate to the tasks you can perform from the PoE menu.
Configure the classifier-behavior associations for a QoS
policy.
Delete a QoS policy or its classifier-behavior
associations.
Display priority mapping table information. Monitor
Modify the priority mapping entries. Configure
Display port priority and trust mode information. Monitor
Modify port priority and trust mode. Configure
Configure
Configure
Table 9 QoS menu navigator
Menus Tasks User level
PoE
Summary Display PSE information and PoE interface information. Monitor
PSE Setup Configure a PoE interface. Configure
Port Setup Configure a port. Configure
Features configurable from the CLI
CLI provides commands for the following features:
• Features configurable from the Web interface (see "Feature menu navigators for the Web
interface").
• Features configurable only from the CLI.
This section describes only the commands that are peculiar to the HPE FlexNetwork NJ5000 5G
PoE+ Walljack Switch. To obtain information about all available commands, enter a question mark (?)
at the CLI of the switch. For more information about using the CLI and the commands, see the
configuration guides and command references for HP 5120 EI switches. These books might contain
features, commands, and descriptions that are inappropriate for the HPE FlexNetwork NJ5000 5G
PoE+ Walljack Switch. If a conflict occurs, the NJ5000 5G PoE+ documentation overrides.
19
Page 32

Table 10 Commands for features peculiar to the HPE FlexNetwork NJ5000 5G PoE+ Walljack
Switch
Command Task
manage-mode on
undo manage-mode on
poe force-power gigabitethernet
interface-number1 power1
interface-number2 power2
gigabitethernet
Set the device operating mode to management or
unmanagement.
Forcibly allocate power to a pair of PoE interfaces (PIs).
poe legacy enable
undo poe legacy enable
manage-mode
Use manage-mode on to enable the device to operate in management mode.
Use undo manage-mode on to set the device operating mode to unmanagement.
Syntax
manage-mode on
undo manage-mode on
Default
The HPE NJ5000 5G PoE+ switch operates in management mode.
Views
System view
Default command level
2: System level
Usage guidelines
Enable or disable PD compatibility check.
In management mode, you can assign an IP address to the device. The device is manageable from
the Web interface or CLI.
In unmanagement mode, you can manage the device only from the console port.
Examples
# Enable the device to operate in management mode.
<Sysname> system-view
System View: return to User View with Ctrl+Z.
[Sysname] manage-mode on
poe force-power
Use poe force-power to forcibly allocate power to a pair of PIs.
Use undo poe force-power to remove power allocation to a pair of PIs.
Syntax
poe force-power gigabitethernet interface-number1 power1 gigabitethernet interface-number2
power2
undo poe force-power
20
Page 33

Views
System view
Default command level
2: System level
Parameters
gigabitethernet interface-number1: Specifies PI 1 by its interface number. Valid interface numbers
are 1/0/3 and 1/0/4.
power1: Specifies the amount of power to be allocated to PI 1. The value range is 1000 mW to 17000
mW.
gigabitethernet interface-number2: Specifies PI 2 by its interface number. Valid interface numbers
are 1/0/3 and 1/0/4. The interface number of PI 2 cannot be the same as that of PI 1.
power2: Specifies the amount of power to be allocated PI 2. The value range is 1000 mW to 17000
mW.
Usage guidelines
The total amount of power allocated to a pair of PIs cannot exceed the maximum allowed power of
the PSE.
Examples
# Forcibly allocate 1000 mW and 2000 mW power to the PIs GigabitEthernet 1/0/3 and
GigabitEthernet 1/0/4, respectively.
<Sysname> system-view
System View: return to User View with Ctrl+Z.
[Sysname] poe force-power GigabitEthernet 1/0/3 1000 GigabitEthernet 1/0/4 2000
Please make sure to remove this configuration before changing your Power source. Continue?
[Y/N]:y
poe legacy enable
Use poe legacy enable to enable the PD compatibility check feature.
Use undo poe legacy enable to disable the PD compatibility check feature.
Syntax
poe legacy enable
undo poe legacy enable
Default
The PD compatibility check feature is disabled.
Views
System view
Default command level
2: System level
Usage guidelines
A PD is standard if it is compliant with IEEE 802.3af or IEEE802.3at. A PD is non-standard if it is not
compliant with either of the standards.
If the PD compatibility check feature is enabled, the device supplies power to both standard and
non-standard PDs. If the feature is disabled, the device supplies power only to standard PDs.
21
Page 34

Examples
# Enable the PD compatibility check feature.
<Sysname> system-view
System View: return to User View with Ctrl+Z.
[Sysname] poe legacy enable
22
Page 35

Configuration wizard
The configuration wizard guides you through configuring the basic service parameters, including the
system name, system location, contact information, and management IP address.
Basic service setup
Entering the configuration wizard homepage
Select Wizard from the navigation tree.
Figure 13 Configuration wizard homepage
Configuring system parameters
1. On the wizard homepage, click Next.
23
Page 36

Figure 14 System parameter configuration page
2. Configure the parameters as described in Table 11.
Table 11 Configuration items
Item Description
Specify the system name.
Sysname
Syslocation
Syscontact
The system name appears at the top of the navigation tree.
You can also set the system name in the
Device
Specify the physical location of the system.
You can also set the physical location in the setup page you enter by selecting
Device
Set the contact information for users to get in touch with the device vendor for help.
You can also set the contact information in the setup page you enter by selecting
Device
>
>
>
Basic
. For more information, see "Configuring basic device settings."
SNMP
. For more information, see "Configuring SNMP."
SNMP
. For more information, see "Configuring SNMP."
Configuring management IP address
CAUTION:
Modifying the management IP address used for the current login terminates the connection to the
device. Use the new management IP address to re-log in to the system.
1. On the system parameter configuration page, click Next.
System Name
page you enter by selecting
24
Page 37

Figure 15 Management IP address configuration page
2. Configure the parameters as described in Table 12.
Table 12 Configuration items
Item Description
Select a VLAN interface.
Available VLAN interfaces are those configured in the page that you enter by selecting
Select VLAN
Interface
Admin status
Network
The IP address of a VLAN interface can be used as the management IP address to
access the device. Configure a VLAN interface and its IP address in the page that you
enter by selecting
VLAN interfac
Enable or disable the VLAN interface.
When errors occurred in the VLAN interface, disable the interface and then enable the
port to bring the port to operate correctly.
By default, the VLAN interface is down if no Ethernet ports in the VLAN is up. The
VLAN is in the up state if one or more ports in the VLAN are up.
IMPORTANT:
Disabling or enabling the VLAN interface does not affect the status of the Ethernet
ports in the VLAN. That is, the port status does not change with the VLAN interface
status.
VLAN Interface
>
Network
es."
and selecting the
VLAN Interface
>
Create
tab.
. For more information, see "Configuring
25
Page 38

Item Description
Configure IPv4
address
DHCP Configure how the VLAN interface obtains an IPv4 address:
BOOTP
Manual
• DHCP—Select the option for the VLAN interface to get an IP
address through DHCP.
• BOOTP—Select the option for the VLAN interface to get an IP
address through BOOTP.
• Manual—Select this option to manually specify an IPv4 address
and the mask length for the VLAN interface.
Configure IPv6
link-local address
IPv4
address
MaskLen
Auto Configure how the VLAN interface obtains an IPv6 link-local address.
Manual
IPv6
address
Specify an IPv4 address and the mask length for the VLAN interface.
Dotted decimal notation is also allowed for the mask length field.
These two fields are configurable if
• Auto—Select this option for the device to automatically generate
a link-local address based on the link-local address prefix
(FE80::/64) and the link layer address of the interface.
• Manual—Select this option to manually assign an IPv6 link-local
address to the interface.
Specify an IPv6 link-local address for the VLAN interface.
This field is configurable if you select
be FE80::/64.
Finishing configuration wizard
After finishing the management IP address configuration, click Next.
The page displays your configurations. Review the configurations and if you want to modify the
settings click Back to go back to the page. Click Finish to confirm your settings and the system
performs the configurations.
Manual
Manual
is selected.
. The address prefix must
26
Page 39

Figure 16 Configuration complete
27
Page 40

Displaying system and device information
Displaying system information
Select Summary from the navigation tree to enter the System Information page to view the basic
system information, system resource state, and recent system logs.
Figure 17 System information
Displaying basic system information
Table 13 Field description
Item Description
Product Information Description for the device.
Device Location
Contact Information
SerialNum Serial number of the device.
Software Version Software version of the device.
Hardware Version Hardware version of the device.
Bootrom Version Boot ROM version of the device.
Running Time System up time.
Device location, which you can configure on the page you enter by
selecting
Contact information, which you can configure on the page you enter
by selecting
Device
Device
>
SNMP
SNMP
>
>
Setup
Setup
>
.
.
28
Page 41

Displaying the system resource state
The System Resource State area displays the most recent CPU usage, memory usage, and
temperature.
Displaying recent system logs
Table 14 Field description
Field Description
Time Time when the system logs were generated.
Level Severity of the system logs.
Description Description for the system logs.
The System Information page displays up to five the most recent system logs.
To display more system logs, click More to enter the Log List page. You can also enter this page by
selecting Device > Syslog. For more information, see "Configuring syslog."
Setting the refresh period
To set the interval for refreshing system information, select one of the following options from the
Refresh Period list:
• If you select a certain period, the system refreshes system information at the specified interval.
• If you select Manual, the system refreshes system information only when you click the Refresh
button.
Displaying device information
Select Summary from the navigation tree, and click the Device Information tab to enter the page
that displays information about the device ports. Hover the cursor over a port and the port details
appear, including the port name, type, speed, utilization, and status, as shown in Figure 18. For the
ption about the port number and its color, see Figure 18.
descri
29
Page 42

Figure 18 Device information
To set the interval for refreshing device information, select one of the following options from the
Refresh Period list:
• If you select a certain period, the system refreshes device information at the specified interval.
• If you select Manual, the system refreshes device information only when you click the Refresh
button.
30
Page 43

Configuring basic device settings
The device basic information feature provides the following functions:
• Set the system name of the device. The configured system name is displayed on the top of the
navigation bar.
• Set the idle timeout period for logged-in users. The system logs an idle user off the Web for
security purpose after the configured period.
Configuring system name
1. Select Device > Basic from the navigation tree.
The system name configuration page appears.
Figure 19 Configuring the system name
2. Enter the system name.
3. Click Apply.
Configuring idle timeout period
1. Select Device > Basic from the navigation tree.
2. Click the Web Idle Timeout tab.
The page for configuring idle timeout period appears.
Figure 20 Configuring the idle timeout period
3. Set the idle timeout period for logged-in users.
4. Click Apply.
31
Page 44

Maintaining devices
Software upgrade
CAUTION:
Software upgrade takes some time. Avoid performing any operation on the Web interface during the
upgrading procedure. Otherwise, the upgrade operation may be interrupted.
A boot file, also known as the system software or device software, is an application file used to boot
the device. Software upgrade allows you to obtain a target application file from the local host and set
the file as the boot file to be used at the next reboot. In addition, you can select whether to reboot the
device to bring the upgrade software into effect.
1. Select Device > Device Maintenance from the navigation tree to enter the Software Upgrade
tab.
Figure 21 Software upgrade configuration page
2. Configure software upgrade parameters as described in Table 15.
3. Click Apply.
Table 15 Configuration items
Item Description
File
File Type
If a file with the same
name already exists,
overwrite it without any
prompt
To upgrade the files of
Specify the path and filename of the local application file, which must be suffixed
with the .app or .bin extension.
Specify the type of the boot file for the next boot:
• Main—Boots the device.
• Backup—Boots the device when the main boot file is unavailable.
Specify whether to overwrite the file with the same name.
If you do not select the option, when a file with the same name exists, a dialog
box appears, telling you that the file already exists and you cannot continue the
upgrade.
Specify whether to set the boot file for the standby MPU during software upgrade.
This option applies only to devices that have active and standby MPUs. The HPE
32
Page 45

Item Description
slave boards at one time NJ5000 5G PoE+ switch does not support this option.
Reboot after the
upgrade finished
Device reboot
CAUTION:
• Before rebooting the device, save the configuration. Otherwise, all unsaved configuration will be
lost after device reboot.
• When the device reboots, re-log in to the device.
1. Select Device > Device Maintenance from the navigation tree.
2. Click the Reboot tab.
Figure 22 Device reboot page
Specify whether to reboot the device to make the upgraded software take effect
after the application file is uploaded.
3. Enable or disable the "Check whether the current configuration is saved in the next
startup configuration file" option.
4. Click Reboot. A confirmation dialog box appears.
5. Click OK.
{ If you select Check whether the current configuration is saved in the next startup
configuration file, the system will check the configuration before rebooting the device. If
the check succeeds, the system reboots the device. If the check fails, a dialog box appears,
telling you that the current configuration and the saved configuration are inconsistent, and
the device is not rebooted. In this case, save the current configuration manually before you
can reboot the device.
{ If you do not select the box, the system reboots the device directly.
Electronic label
Electronic label allows you to view information about the device electronic label, which is also known
as the permanent configuration data or archive information. The information is written into the
storage medium of a device or a card during the debugging and testing processes, and includes card
name, product bar code, MAC address, debugging and testing dates, and manufacture name.
1. Select Device > Device Maintenance from the navigation tree.
2. Click the Electronic Label tab to view the electronic label information.
33
Page 46

Figure 23 Electronic label
Diagnostic information
Each functional module has its own running information. Generally, you view the output for each
module one by one. To receive as much information as possible in one operation during daily
maintenance or when system failure occurs, the diagnostic information module allows you to save
the running statistics of multiple functional modules to a file named default.diag, and then you can
locate problems faster by checking this file.
1. Select Device > Device Maintenance from the navigation tree.
2. Click the Diagnostic Information tab.
Figure 24 Diagnostic information
3. Click Create Diagnostic Information File.
The system begins to generate a diagnostic information file.
4. Click Click to Download.
The File Download dialog box appears.
5. Select to open this file or save this file to the local host.
Figure 25 The diagnostic information file is created
The generation of the diagnostic file takes a period of time. During this process, do not perform any
operation on the Web page.
After the diagnostic file is generated successfully, you can view this file on the page you enter by
selecting Device > File Management, or downloading this file to the local host. For more information,
see "Managing files."
34
Page 47

Configuring system time
Overview
You must configure a correct system time so that the device can operate correctly with other devices.
The system time module allows you to display and set the device system time on the Web interface.
You can set the system time through manual configuration or network time protocol (NTP) automatic
synchronization.
Defined in RFC 1305, the NTP synchronizes timekeeping among distributed time servers and clients.
NTP can keep consistent timekeeping among all clock-dependent devices within the network, and
ensure a high clock precision so that the devices can provide diverse applications based on
consistent time.
Displaying the current system time
To view the current system date and time, select Device > System Time from the navigation tree to
enter the System Time page.
Figure 26 System time configuration page
Manually configuring the system time
1. Select Device > System Time from the navigation tree.
The page for configuration the system time appears.
2. Click the System Time Configuration text to open a calendar.
Figure 27 Calendar page
35
Page 48

3. Enter the system date and time in the Time field, or select the date and time in the calendar. To
set the time on the calendar page, select one of the following methods:
{ Click Today. The date setting in the calendar is synchronized to the current local date
configuration, and the time setting does not change.
{ Select the year, month, date, and time, and then click OK.
4. Click Apply on the system time configuration page to save your configuration.
Configuring system time by using NTP
1. Select Device > System Time from the navigation tree.
2. Click the Network Time Protocol tab.
The page for configuring the system time through NTP appears.
Figure 28 NTP configuration page
3. Configure the system time as described in Table 16.
4. Click Apply.
Table 16 Configuration items
Item Description
Clock status Display the synchronization status of the system clock.
Set the source interface for an NTP message.
This configuration makes the source IP address in the NTP
messages the primary IP address of this interface. If the specified
source interface is down, the source IP address is the primary IP
Source Interface
Key 1
Key 2
address of the egress interface.
TIP:
If you do not want the IP address of an interface on the local device
to become the destination address of response messages, specify
the source interface for NTP messages.
Set NTP authentication key.
Enable the NTP authentication feature for a system running NTP in a
network that requires high security. This feature improves the
network security by means of client-server key authentication, and
prohibits a client from synchronizing with a device that has failed
authentication.
You can set two authentication keys, each of which has a key ID and
a key string.
• ID—ID of a key.
• Key string—Character string of the MD5 authentication key.
36
Page 49

Item Description
External
Reference
Source
NTP Server
1/Reference Key
ID.
NTP Server
2/Reference Key
ID.
Specify the IP address of an NTP server, and configure the
authentication key ID used for the association with the NTP server.
The device synchronizes its time to the NTP server only if the key
provided by the server is the same as the specified key.
You can configure two NTP servers. The clients choose the optimal
reference source.
IMPORTANT:
The IP address of an NTP server is a unicast address, and cannot be
a broadcast or a multicast address, or the IP address of the local
clock source.
Configuring the time zone and daylight saving time
1. Select Device > System Time from the navigation tree.
2. Click the Time Zone tab.
The time zone configuration page appears.
Figure 29 Setting the time zone
3. Configure the time zone and daylight saving time as described in Table 17.
4. Click Apply.
Table 17 Configuration items
Item Description
Time Zone Set the time zone for the system.
Adjust the system clock for daylight saving time changes, which means adding
one hour to the current system time.
Adjust clock for daylight saving time changes
Adjust clock for
daylight saving time
changes
Click
shown in Figure 30. You can configure the daylight saving time changes in the
following ways:
• Specify that the daylight saving time starts on a specific date and ends on
a specific date. The time range must be greater than one day and smaller
than one year. For example, configure the daylight saving time to start on
August 1st, 2006 at 06:00:00 a.m., and end on September 1st, 2006 at
06:00:00 a.m.
• Specify that the daylight saving time starts and ends on the corresponding
specified days every year. The time range must be greater than one day
and smaller than one year. For example, configure the daylight saving time
to start on the first Monday in August at 06:00:00 a.m., and end on the last
Sunday in September at 06:00:00 a.m.
to expand the option, as
37
Page 50

Figure 30 Setting the daylight saving time
System time configuration example
Network requirements
As shown in Figure 31:
• The local clock of Device A is set as the reference clock.
• Switch B operates in client mode, and uses Device A as the NTP server.
Configure NTP authentication on Device A and Switch B so that Switch B is to be synchronized to
Device A.
Figure 31 Network diagram
Configuring the system time
1. Configure the local clock as the reference clock, with the stratum of 2. Enable NTP
authentication, set the key ID to 24, and specify the created authentication key aNiceKey as a
trusted key. (Details not shown.)
2. On Switch B, configure Device A as the NTP server:
a. Select Device > System Time from the navigation tree.
b. Click the Network Time Protocol tab.
c. Enter 24 in the ID field, enter aNiceKey in the Key String field for key 1, enter 1.0.1.11 in
the NTP Server 1 field, and enter 24 in the Reference Key ID field.
d. Click Apply.
38
Page 51

Figure 32 Configuring Device A as the NTP server of Switch B
Verifying the configuration
After the configuration, verify that Device A and Switch B have the same system time.
Configuration guidelines
When you configure the system time, follow these guidelines:
• A device can act as a server to synchronize the clock of other devices only after its clock has
been synchronized. If the clock of a server has a stratum level higher than or equal to the level
of a client's clock, the client will not synchronize its clock to the server's.
• The synchronization process takes some time. The clock status might be displayed as
unsynchronized after your configuration. In this case, refresh the page to view the clock status
and system time later on.
• If the system time of the NTP server is ahead of the system time of the device, and the time gap
exceeds the Web idle time specified on the device, all online Web users are logged out because
of timeout after the synchronization finishes.
39
Page 52

Configuring syslog
System logs record network and device information, including running status and configuration
changes. With system logs, administrators can take corresponding actions against network
problems and security problems.
The system sends system logs to the following destinations:
• Console
• Monitor terminal, a terminal that has logged in to the device through the AUX or VTY user
interface
• Log buffer
• Log host
• Web interface
• Log file
Displaying syslogs
1. Select Device > Syslog from the navigation tree.
The page for displaying syslogs appears. You can click Reset to clear all system logs saved in
the log buffer on the Web interface. You can click Refresh to manually refresh the page, or you
can set the refresh interval on the Log Setup page to enable the system to automatically
refresh the page periodically. For more information, see "Setting buffer capacity and refresh
interval."
Figure 33
2. View system logs.
Table 18 Field description
Displaying syslogs
Field Description
Time/Date
Displays the time/date when the system log was generated.
40
Page 53

Field Description
Source
Level
Digest Displays the brief description of the system log.
Displays the module that generated the system log.
Displays the severity level of the system log. The information is classified into
eight levels by severity:
• Emergency—The system is unusable.
• Alert—Action must be taken immediately.
• Critical—Critical condition.
• Error—Error condition.
• Warning—Warning condition.
• Notification—Normal but significant condition.
• Information—Informational message.
• Debug—Debug-level message.
Description
Displays the content of the system log.
Setting the log host
1. Select Device > Syslog from the navigation tree.
2. Click the Loghost tab.
The log host configuration page appears.
Figure 34 Setting the log host
3. Configure the log host as described in Table 19.
4. Click Apply.
41
Page 54

Table 19 Configuration items
Item Description
IPv4/Domain
Loghost IP/Domain
IPv6
Loghost IP
Specify the IPv4 address or domain
name of the log host.
Set the IPv6 address of the log host.
IMPORTANT:
You can specify up to four log hosts.
Setting buffer capacity and refresh interval
1. Select Device > Syslog from the navigation tree.
2. Click the Log Setup tab.
The syslog configuration page appears.
Figure 35 Syslog configuration page
3. Configure buffer capacity and refresh interval as described in Table 20.
4. Click Apply.
Table 20 Configuration items
Item Description
Buffer Capacity
Refresh Interval
Set the number of logs that can be stored in the log buffer.
Set the log refresh interval.
You can select manual refresh or automatic refresh:
• Manual—Click Refresh to view the latest log information.
• Automatic—Select to refresh the Web interface every 1 minute, 5 minutes,
or 10 minutes.
42
Page 55

Managing the configuration
You can back up, restore, save, or reset the device configuration.
Backing up the configuration
Configuration backup allows you to do the following:
• Open and view the configuration files for the next startup, including the .cfg file and .xml file.
• Back up the configuration files for the next startup to your local host.
IMPORTANT:
Hewlett Packard Enterprise recommends backing up both the .cfg and .xml files. If you back up
only the .cfg file, some configuration information might not be restored when, for example, the
configuration is mistakenly removed.
To back up the configuration:
1. Select Device > Configuration from the navigation tree.
The Backup page appears.
Figure 36 Backing up the configuration
2. Click the upper Backup button.
The file download dialog box appears.
3. Choose to view the .cfg file or to save the file to your local host.
4. Click the lower Backup button.
The file download dialog box appears.
5. Choose to view the .xml file or to save the file to the local host.
Restoring the configuration
Configuration restoration allows you to do the following:
• Upload a .cfg file from your local host to the device.
• Upload an .xml file from your local host to the device, and delete the .xml configuration file that
was used for the next startup.
The restored configuration takes effect at the next device startup.
To restore the configuration:
1. Select Device > Configuration from the navigation tree.
2. Click the Restore tab.
43
Page 56

Figure 37 Restoring the configuration
3. Click the upper Browse button.
The file upload dialog box appears.
4. Select the .cfg file to be uploaded, and click OK.
5. Click the lower Browse button.
The file upload dialog box appears.
6. Select the .xml file to be uploaded, and click OK.
Saving the configuration
You save the running configuration to both the .cfg configuration file and .xml configuration file that
will be used at the next startup.
Saving the configuration takes some time.
Only one administrator can save the configuration at a moment. If you save the configuration while
the system is saving the configuration as required by another administrator, the system prompts you
to try again later.
You can save the configuration in either of the following modes:
• Fast mode.
To save the configuration in fast mode, click the Save button at the upper right of the auxiliary
area.
Figure 38 Saving the configuration
• Common mode.
To save the configuration in common mode:
44
Page 57

a. Select Device > Configuration from the navigation tree.
b. Click the Save tab.
c. Click Save Current Settings.
Resetting the configuration
Resetting the configuration restores the device's factory defaults, deletes the current configuration
files, and reboots the device.
To reset the configuration:
1. Select Device > Configuration from the navigation tree.
2. Click the Initialize tab.
3. Click Restore Factory-Default Settings.
Figure 39 Resetting the configuration
45
Page 58

Managing files
The device requires a series of files for correct operation, including boot files and configuration files.
These files are saved on the storage media. You can display files on the storage media, download,
upload, or remove a file, or specify the main boot file.
Displaying files
1. Select Device > File Management from the navigation tree.
Figure 40 File management page
2. Select a medium from the Please select disk list.
Two categories of information are displayed:
{ Medium information, including the used space, the free space, and the capacity of the
medium.
{ File information, including all files on the medium, the file sizes, and the boot file types (Main
or Backup). The boot file type is only displayed for an application file (.bin or .app file) that
will be used as the main or backup boot file.
Downloading a file
1. Select Device > File Management from the navigation tree to enter the file management page
(see Figure 40).
2. From the Ple
3. Select the file from the list.
Only one file can be downloaded at a time.
4. Click Download File.
The File Download dialog box appears.
5. Open the file or save the file to a path.
ase select disk list, select the medium where the file to be downloaded resides.
46
Page 59

Uploading a file
IMPORTANT:
Uploading a file takes some time. Hewlett Packard Enterprise recommends not performing any
operation on the Web interface during the upload.
1. Select Device > File Management from the navigation tree to enter the file management page
(see Figure 40).
2. In the Upload File area, select the med
3. Click Browse to navigate to the file to be uploaded.
4. Click Apply.
Removing a file
1. Select Device > File Management from the navigation tree to enter the file management page
(see Figure 40).
2. Do on
e of the following:
{ Click the icon of a file to remove the file.
{ Select a file from the file list and click Remove File.
ium for saving the file from the Please select disk list.
To remove multiple files, repeat step 2, or select the files from the file list and click Remove File.
Specifying the main boot file
1. Select Device > File Manage from the navigation tree to enter the file management page
(see Figure 40).
2. From the Please s
the main boot file.
3. Select the application file (.bin or .app file) from the file list.
4. Click Set as Main Boot File.
elect disk list, select the medium that holds the application file to be used as
47
Page 60

Managing ports
You can use the port management feature to set and view the operation parameters of a Layer 2
Ethernet port and an aggregate interface.
• For a Layer 2 Ethernet port, these operation parameters include its state, speed, duplex mode,
link type, PVID, description, MDI mode, flow control settings, MAC learning limit, and storm
suppression ratios.
• For an aggregate interface, these operation parameters include its state, link type, PVID,
description, and MAC learning limit.
Setting operation parameters for a port
1. Select Device > Port Management from the navigation tree.
2. Click the Setup tab.
Figure 41 The Setup tab
3. Set the operation parameters for the port as described in Table 21.
4. Click Apply.
48
Page 61

Table 21 Configuration items
Item Description
Enable or disable the port.
Port State
Speed
Duplex
Sometimes, after you modify the operation parameters of a port, you must disable and
then enable the port to have the modifications take effect.
Set the transmission speed of the port:
• 10—10 Mbps.
• 100—100 Mbps.
• 1000—1000 Mbps.
• Auto—Autonegotiation.
• Auto 10—Autonegotiated to 10 Mbps.
• Auto 100—Autonegotiated to 100 Mbps.
• Auto 1000—Autonegotiated to 1000 Mbps.
• Auto 10 100—Autonegotiated to 10 or 100 Mbps.
• Auto 10 1000—Autonegotiated to 10 or 1000 Mbps.
• Auto 100 1000—Autonegotiated to 100 or 1000 Mbps.
• Auto 10 100 1000—Autonegotiated to 10, 100, or 1000 Mbps.
Set the duplex mode of the port:
• Auto—Autonegotiation.
• Full—Full duplex.
• Half—Half duplex.
Set the link type of the current port, which can be access, hybrid, or trunk. For more
Link Type
PVID
Description Set the description of the port.
MDI
information, see "Configuring VLANs."
o change the link type of a port from trunk to hybrid, or vice versa, you must first set its
T
link type to access.
Set the port VLAN ID (PVID) of the interface. For more information about setting the
PVID, see "Configuring VLANs."
T
o make sure a link correctly transmits packets, the trunk or hybrid ports at the two ends
of the link must have the same PVID.
Set the MDI mode of the port.
You can use two types of Ethernet cables to connect Ethernet devices: crossover cable
and straight-through cable. To accommodate these two types of cables, an Ethernet
port can operate in one of the following three MDI modes: across, normal, and auto.
An Ethernet port is composed of eight pins. By default, each pin has its particular role.
For example, pin 1 and pin 2 are used for transmitting signals, and pin 3 and pin 6 are
used for receiving signals. You can change the pin roles by setting the MDI mode.
• For an Ethernet port in across mode, pin 1 and pin 2 are used for transmitting
signals, and pin 3 and pin 6 are used for receiving signals. The pin roles are not
changed.
• For an Ethernet port in auto mode, the pin roles are decided through
autonegotiation.
• For an Ethernet port in normal mode, the pin roles are changed. Pin 1 and pin 2
are used for receiving signals, and pin 3 and pin 6 are used for transmitting
signals.
To enable normal communication, you must connect the local transmit pins to the
remote receive pins. Configure the MDI mode depending on the cable types.
When you configure the MID mode, follow these guidelines:
• Typically, use the auto mode. The other two modes are used only when the device
cannot determine the cable type.
• When straight-through cables are used, the local MDI mode must be different from
49
Page 62

Item Description
the remote MDI mode.
• When crossover cables are used, the local MDI mode must be the same as the
remote MDI mode, or the MDI mode of at least one end must be set to auto.
Enable or disable flow control on the port.
With flow control enabled at both sides, when traffic congestion occurs on the ingress
Flow Control
Power Save
Max MAC Count
port, the ingress port sends a Pause frame notifying the egress port to temporarily
suspend the sending of packets. The egress port is expected to stop sending any new
packet when it receives the Pause frame. In this way, flow control helps to avoid
dropping of packets.
Flow control works only after it is enabled on both the ingress and egress ports.
Enable or disable auto power-down on a port that is down.
By default, auto power-down is disabled on an Ethernet port that is down.
With auto power-down enabled on an Ethernet port that stays in the down state for a
certain period, the following events occur:
• The device automatically stops supplying power to the port.
• The port enters the power save mode.
When the Ethernet port comes up, the following events occur:
• The device automatically restores power supply to the port.
• The port resumes its normal state.
Set the MAC learning limit on the port:
• User Defined—Select this option to set the limit manually.
• No Limited—Select this option to set no limit.
EEE
Broadcast
Suppression
Multicast
Suppression
Enable or disable Energy Efficient Ethernet (EEE) on a link-up port.
With EEE enabled, when a link-up Ethernet port does not receive any packet for a
certain period, it automatically enters low power mode. When a packet arrives later, the
device restores power supply to the port and the port resumes its normal state.
Set broadcast suppression on the port:
• ratio—Sets the maximum percentage of broadcast traffic to the total bandwidth of
an Ethernet port. When you select this option, you must enter a percentage in the
box below.
• pps—Sets the maximum number of broadcast packets that can be forwarded on
an Ethernet port per second. When you select this option, you must enter a
number in the box below.
• kbps—Sets the maximum number of kilobits of broadcast traffic that can be
forwarded on an Ethernet port per second. When you select this option, you must
enter a number in the box below.
Set multicast suppression on the port:
• ratio—Sets the maximum percentage of multicast traffic to the total bandwidth of
an Ethernet port. When you select this option, you must enter a percentage in the
box below.
• pps—Sets the maximum number of multicast packets that can be forwarded on an
Ethernet port per second. When you select this option, you must enter a number in
the box below.
• kbps—Sets the maximum number of kilobits of multicast traffic that can be
forwarded on an Ethernet port per second. When you select this option, you must
enter a number in the box below.
Unicast
Suppression
Set unicast suppression on the port:
• ratio—Sets the maximum percentage of unicast traffic to the total bandwidth of an
Ethernet port. When you select this option, you must enter a percentage in the box
below.
• pps—Sets the maximum number of unicast packets that can be forwarded on an
Ethernet port per second. When you select this option, you must enter a number in
50
Page 63

Item Description
the box below.
• kbps—Sets the maximum number of kilobits of unicast traffic that can be
forwarded on an Ethernet port per second. When you select this option, you must
enter a number in the box below.
Interface or interfaces that you have selected from the chassis front panel and the
Selected Ports
If you set operation parameters that a port does not support, you are notified of invalid settings and
might fail to set the supported operation parameters for the port or other ports.
aggregate interface list below, for which you have set operation parameters.
You can set only the state and MAC learning limit for an aggregate interface.
Displaying port operation parameters
Displaying a specified operation parameter for all ports
1. Select Device > Port Management from the navigation tree.
The Summary page appears by default.
2. Select the option for a parameter you want to view.
The parameter information for all the ports is displayed in the lower part of the page.
Figure 42 The Summary tab
Displaying all the operation parameters for a port
1. Select Device > Port Management from the navigation tree
2. Click the Detail tab.
3. Select a port whose operation parameters you want to view in the chassis front panel.
The operation parameter settings of the selected port are displayed on the lower part of the
page. Whether the parameter takes effect is displayed in the square brackets.
51
Page 64

Figure 43 The Detail tab
Port management configuration example
Network requirements
As shown in Figure 44:
• Server A, Server B, and Server C are connected to GigabitEthernet 1/0/1, GigabitEthernet 1/0/2,
and GigabitEthernet 1/0/3 of the switch, respectively. The rates of the network adapters of these
servers are all 1000 Mbps.
• The switch connects to the external network through GigabitEthernet 1/0/4 whose speed is
1000 Mbps.
To avoid congestion at the egress port GigabitEthernet 1/0/4, configure the autonegotiation speed
range on GigabitEthernet 1/0/1, GigabitEthernet 1/0/2, and GigabitEthernet 1/0/3 as 100 Mbps.
Figure 44 Network diagram
52
Page 65

Configuring the switch
1. As shown in Figure 45, set the speed of GigabitEthernet 1/0/4 to 1000 Mbps:
Figure 45 Configuring the speed of GigabitEthernet 1/0/4
2. Batch configure the autonegotiation speed range on GigabitEthernet 1/0/1, GigabitEthernet
1/0/2, and GigabitEthernet 1/0/3 as 100 Mbps:
a. On the Setup tab, select Auto 100 from the Speed list.
b. Select 1, 2, and 3 on the chassis front panel.
1, 2, and 3 represent ports GigabitEthernet 1/0/1, GigabitEthernet 1/0/2, and
GigabitEthernet 1/0/3.
c. Click Apply.
53
Page 66

Figure 46 Batch configuring the port speed
3. Display the speed settings of ports:
a. Click the Summary tab.
b. Click the Speed button to display the speed information of all ports on the lower part of the
page, as shown in Figure 47.
54
Page 67

Figure 47 Displaying the speed settings of ports
55
Page 68

Configuring port mirroring
Port mirroring refers to the process of copying the packets passing through a port/VLAN/CPU to the
monitor port connecting to a monitoring device for packet analysis.
Terminology
Mirroring source
The mirroring source can be one or more monitored ports, called source ports. The device where the
ports reside is called a "source device." Packets (called "mirrored packets") passing through them
are copied to a port connecting to a monitoring device for packet analysis.
Mirroring destination
The mirroring destination is the destination port (also known as the monitor port) of mirrored packets
and connects to the data monitoring device. The device where the monitor port resides is called the
"destination device." The monitor port forwards the mirrored packets to its connecting monitoring
device.
A monitor port might receive multiple duplicates of a packet in some cases because it can monitor
multiple mirroring sources. For example, assume that Port 1 is monitoring bidirectional traffic on Port
2 and Port 3 on the same device. If a packet travels from Port 2 to Port 3, two duplicates of the packet
will be received on Port 1.
Mirroring direction
The mirroring direction indicates that the inbound, outbound, or bidirectional traffic can be copied on
a mirroring source:
• Inbound—Copies packets received on a mirroring source.
• Outbound—Copies packets sent out of a mirroring source.
• Bidirectional—Copies packets both received and sent on a mirroring source.
Mirroring group
Port mirroring is implemented through mirroring groups, which include local and remote mirroring
groups. Only local mirroring groups are supported.
Local port mirroring
In local port mirroring, the mirroring source and the mirroring destination are on the same device. A
mirroring group that contains the mirroring source and the mirroring destination on the device is
called a "local mirroring group."
56
Page 69

Figure 48 Local port mirroring implementation
As shown in Figure 48, the source port GigabitEthernet 1/0/1 and monitor port GigabitEthernet 1/0/2
reside on the same device. Packets of GigabitEthernet 1/0/1 are copied to GigabitEthernet 1/0/2,
which then forwards the packets to the data monitoring device for analysis.
Configuration restrictions and guidelines
When you configure port mirroring, follow these restrictions and guidelines:
• A local mirroring group can contain multiple source ports, but only one monitor port.
• Do not enable the spanning tree feature on the monitor port.
• Use a monitor port only for port mirroring to make sure the data monitoring device receives and
analyzes only the mirrored traffic rather than a mix of mirrored traffic and other forwarded traffic.
Recommended configuration procedures
Step Remarks
1. Configure a local mirroring
group.
2. Configure source ports for
the mirroring group.
3. Configure the monitor port
for the mirroring group.
Required.
For more information, see "Configuring a mirroring group."
Select the mirr
Required.
For more information, see "Configuring ports for the mirroring group."
Se
lect the port type
Required.
For more information, see "Configuring ports for the mirroring group."
Se
lect the port type
oring group type
Mirror Port
Monitor Port
local
.
.
in the
Type
list.
57
Page 70

Configuring a mirroring group
1. From the navigation tree, select Device > Port Mirroring.
2. Click Add to enter the page for adding a mirroring group.
Figure 49 Adding a mirroring group
3. Configure the mirroring group as described in Table 22.
4. Click Apply.
Table 22 Configuration items
Item Description
Mirroring Group ID
Type
ID of the mirroring group to be added.
Specify the type of the mirroring group to be added as
adding a local mirroring group.
Local
Configuring ports for the mirroring group
1. From the navigation tree, select Device > Port Mirroring.
2. Click Modify Port to enter the page for configuring ports for a mirroring group.
, which indicates
58
Page 71

Figure 50 Modifying ports
3. Configure ports for the mirroring group as described in Table 23.
4. Click Apply.
A progress dialog box appears.
5. After the success notification appears, click Close.
Table 23 Configuration items
Item Description
Mirroring Group
ID
Port Type
Stream
Orientation
Select port(s)
ID of the mirroring group to be configured.
The available groups were added previously.
Select a
Configure ports for a local mirroring group:
• Monitor Port—Configures the monitor ports for the local mirroring group.
• Mirror Port—Configures mirroring ports for the local mirroring group.
Set the direction of the traffic monitored by the monitor port of the mirroring group:
• both—Mirrors both received and sent packets on mirroring ports.
• inbound—Mirrors only packets received by mirroring port.
• outbound—Mirrors only packets sent by mirroring ports.
Click the ports to be configured on the chassis front panel. If aggregate interfaces are
configured on the device, the page displays a list of aggregate interfaces below the
chassis front panel. You can select aggregate interfaces from this list and configure them
as mirroring ports of a port mirroring group.
Local
mirroring group ID to configure ports for the local mirroring group.
Local port mirroring configuration example
Network requirements
As shown in Figure 51, configure local port mirroring on Switch A so the server can monitor the
packets received and sent by the Marketing department and Technical department.
59
Page 72

Figure 51 Network diagram
Configuration procedure
Adding a local mirroring group
1. From the navigation tree, select Device > Port Mirroring.
2. Click Add to enter the page for adding mirroring groups as shown in Figure 52.
Figure 52
Adding a local mirroring group
3. Enter 1 for Mirroring Group ID, and select Local from the Type list.
4. Click Apply.
Configuring GigabitEthernet 1/0/1 and GigabitEthernet 1/0/2 as the source ports
1. Click Modify Port.
2. Select 1 – Local from the Mirroring Group ID list.
3. Select Mirror Port from the Port Type list.
4. Select both from the Stream Orientation list.
60
Page 73

5. Select 1 (GigabitEthernet 1/0/1) and 2 (GigabitEthernet 1/0/2) on the chassis front panel.
Figure 53 Configuring the source ports
6. Click Apply.
A configuration progress dialog box appears.
7. After the success notification appears, click Close.
Configuring GigabitEthernet 1/0/3 as the monitor port
1. Click Modify Port.
2. Select 1 – Local from the Mirroring Group ID list.
3. Select Monitor Port from the Port Type list.
4. Select 3 (GigabitEthernet 1/0/3) on the chassis front panel.
Figure 54 Configuring the monitor port
5. Click Apply.
A configuration progress dialog box appears.
6. After the success notification appears, click Close.
61
Page 74

Managing users
The user management function allows you to do the following:
• Adding a local user, and specifying the password, access level, and service types for the user.
• Setting the super password for non-management level users to switch to the management
level.
• Switching to the management level from a lower level.
Adding a local user
1. Select Device > Users from the navigation tree.
2. Click the Create tab.
Figure 55 Adding a local user
3. Configure a local user as described in Table 24.
4. Click Apply.
Table 24 Configuration items
Item Description
Username Enter a username for the user.
Select an access level for the user.
Users of different levels can perform different operations. User levels, in order from low
to high, are as follows:
• Visitor—A visitor level user can perform only ping and traceroute operations.
They cannot access the data on the device or configure the device.
Access Level
Password
• Monitor—A monitor level user can perform ping and traceroute operations and
access the data on the device, but they cannot configure the device.
• Configure—A configure level user can perform ping and traceroute operations,
access data on the device, and configure the device, but they cannot upgrade the
software, add/delete/modify users, or back up or restore the configuration file.
• Management—A management level user can perform any operations on the
device.
Set the password for the user.
62
Page 75

Item Description
Confirm Password Enter the same password again.
Select the password encryption type:
Password
Encryption
• Reversible—Uses a reversible encryption algorithm. The ciphertext password
can be decrypted to get the plaintext password.
• Irreversible—Uses an irreversible encryption algorithm. The ciphertext
password cannot be decrypted to get the plaintext password.
Service Type
Select the service types for the user to use, including Web, FTP, and Telnet. You must
select at least one service type.
Setting the super password
A management level user can set the password for non-management level users to switch to the
management level. If the password is not set, non-management level users cannot switch to the
management level from a lower level.
To set the super password:
1. Select Device > Users from the navigation tree.
2. Click the Super Password tab.
Figure 56 Setting the super password
3. Configure a super password as described in Table 25.
4. Click Apply.
Table 25 Configuration items
Item Description
Select the operation type:
Create/Remove
Password
Confirm Password Enter the same password again.
Password
Encryption
• Create—Configure or change the super password.
• Remove—Remove the current super password.
Set the password for non-management level users to switch to the management level.
Select the password encryption type:
• Reversible—Uses a reversible encryption algorithm. The ciphertext password
can be decrypted to get the plaintext password.
• Irreversible—Uses an irreversible encryption algorithm. The ciphertext
63
Page 76

Item Description
password cannot be decrypted to get the plaintext password.
Switching to the management level
A non-management level user can switch to the management level after providing the correct super
password.
The level switching operation does not change the access level setting for the user. When the user
logs in to the Web interface again, the access level of the user is still the level set for the user.
To switch to the management level:
1. Select Device > Users from the navigation tree.
2. Click the Switch To Management tab.
3. Enter the correct super password.
4. Click Login.
Figure 57 Switching to the management level
64
Page 77

Configuring a loopback test
You can check whether an Ethernet port operates correctly by performing Ethernet port loopback test.
During the test time, the port cannot forward data packets correctly.
Ethernet port loopback test has the following types:
• Internal loopback test—Establishes self loop in the switching chip and checks whether there
is a chip failure related to the functions of the port.
• External loopback test—Uses a loopback plug on the port. Packets forwarded by the port will
be received by itself through the loopback plug. The external loopback test can be used to
check whether there is a hardware failure on the port.
Configuration guidelines
When you configure a loopback test, follow these restrictions and guidelines:
• When a port is physically down, you cannot perform an external loopback test on the port.
• After a port is shut down manually, you can perform neither internal nor external test on the port.
• When a port is under loopback test, you cannot apply Rate, Duplex, Cable Type, and Port
Status configuration to the port.
• An Ethernet port operates in full duplex mode when a loopback test is performed. It restores its
original duplex mode after the loopback test is finished.
Configuration procedure
1. From the navigation tree, select Device > Loopback.
Figure 58 Loopback test page
2. Select External or Internal for loopback test type.
3. Select an Ethernet interface from the chassis front panel.
4. Click Test.
After the test is complete, the system displays the loopback test result.
65
Page 78

Figure 59 Loopback test result
66
Page 79

Configuring VCT
Overview
You can use the Virtual Cable Test (VCT) function to check the status of the cable connected to an
Ethernet port on the device. The result is returned in less than 5 seconds. The test covers whether
short circuit or open circuit occurs on the cable and the length of the faulty cable.
Testing cable status
1. Select Device > VCT from the navigation tree to enter the page for testing cable status.
2. Select the port you want to test on the chassis front panel.
3. Click Test.
The test result is returned within 5 seconds and displayed in the Result field.
Figure 60 Testing the status of the cable connected to an Ethernet port
The result displays the cable status and length. The cable status can be normal, abnormal,
abnormal (open), abnormal (short), or failure.
{ When a cable is normal, the cable length displayed is the total length of the cable.
{ When a cable is abnormal, the cable length displayed is the length between the current port
and the location where fault occurs.
{ The cable length detected can have an error of up to 5 meters.
67
Page 80

Configuring the flow interval
With the flow interval module, you can view the number of packets and bytes sent and received by a
port, and the bandwidth use of the port over the specified interval.
Viewing port traffic statistics
1. Select Device > Flow interval from the navigation tree.
By default, the Port Traffic Statistics tab is displayed.
2. View the number of packets and bytes sent and received by each port, and the bandwidth use
of each port over the last interval.
Figure 61 Port traffic statistics
When the bandwidth utilization is lower than 1%, 1% is displayed.
68
Page 81

Configuring RMON
Overview
Remote Network Monitoring (RMON) is an enhancement to SNMP. It enables proactive remote
monitoring and management of network devices and subnets. An RMON monitor periodically or
continuously collects traffic statistics for the network attached to a port on the managed device. The
managed device can automatically send a notification when a statistic crosses an alarm threshold,
so the NMS does not need to constantly poll MIB variables and compare the results.
RMON uses SNMP notifications to notify NMSs of various alarm conditions such as broadcast traffic
threshold exceeded. In contrast, SNMP reports function and interface operating status changes such
as link up, link down, and module failure.
HPE devices provide an embedded RMON agent as the RMON monitor. An NMS can perform basic
SNMP operations to access the RMON MIB.
Working mechanism
RMON monitors typically take one of the following forms:
• Dedicated RMON probes—NMSs can obtain management information from RMON probes
directly and control network resources. NMSs can obtain all RMON MIB information by using
this method.
• RMON agents embedded in network devices—NMSs exchange data with RMON agents by
using basic SNMP operations to gather network management information. Because this
method is resource intensive, most RMON agent implementations provide only four groups of
MIB information: alarm, event, history, and statistics.
You can configure your device to collect and report traffic statistics, error statistics, and performance
statistics.
RMON groups
Among the RFC 2819 defined RMON groups, HPE devices implement the statistics group, history
group, event group, and alarm group supported by the public MIB. HPE devices also implement a
private alarm group, which enhances the standard alarm group.
Ethernet statistics group
The statistics group defines that the system collects various traffic statistics on an interface (only
Ethernet interfaces are supported), and saves the statistics in the Ethernet statistics table
(ethernetStatsTable) for future retrieval. The interface traffic statistics include network collisions,
CRC alignment errors, undersize/oversize packets, broadcasts, multicasts, bytes received, and
packets received.
After you create a statistics entry for an interface, the statistics group starts to collect traffic statistics
on the interface. The statistics in the Ethernet statistics table are cumulative sums.
History group
The history group defines that the system periodically collects traffic statistics on interfaces and
saves the statistics in the history record table (ethernetHistoryTable). The statistics include
bandwidth utilization, number of error packets, and total number of packets.
The history statistics table record traffic statistics collected for each sampling interval. The sampling
interval is user-configurable.
69
Page 82

Event group
The event group defines event indexes and controls the generation and notifications of the events
triggered by the alarms defined in the alarm group and the private alarm group. The events can be
handled in one of the following ways:
• Log—Logs event information (including event time and description) in the event log table so the
• Trap—Sends an SNMP notification when the event occurs.
• Log-Trap—Logs event information in the event log table and sends an SNMP notification when
• None—No action.
Alarm group
The RMON alarm group monitors alarm variables, such as the count of incoming packets
(etherStatsPkts) on an interface. After you define an alarm entry, the system gets the value of the
monitored alarm variable at the specified interval. If the value of the monitored variable is greater
than or equal to the rising threshold, a rising event is triggered. If the value of the monitored variable
is smaller than or equal to the falling threshold, a falling event is triggered. The event is then handled
as defined in the event group.
If an alarm entry crosses a threshold multiple times in succession, the RMON agent generates an
alarm event only for the first crossing. For example, if the value of a sampled alarm variable crosses
the rising threshold multiple times before it crosses the falling threshold, only the first crossing
triggers a rising alarm event, as shown in Figure 62.
management device can get the logs through SNMP.
the event occurs.
Figure 62
Rising and falling alarm events
RMON configuration task list
Configuring the RMON statistics function
The RMON statistics function can be implemented by either the Ethernet statistics group or the
history group, but the objects of the statistics are different, as follows:
• A statistics object of the Ethernet statistics group is a variable defined in the Ethernet statistics
table, and the recorded content is a cumulative sum of the variable from the time the statistics
entry is created to the current time. Perform the tasks in Table 26 to config
statistics function.
ure RMON Ethernet
70
Page 83

• A statistics object of the history group is the variable defined in the history record table, and the
recorded content is a cumulative sum of the variable in each period. Perform the tasks in Table
27 to config
ure RMON history statistics function.
Table 26 RMON statistics group configuration task list
Task Remarks
Required.
You can create up to 100 statistics entries in a statistics table.
After you create a statistics entry on an interface, the system collects
various traffic statistics on the interface, including network collisions,
Configuring a statistics entry
CRC alignment errors, undersize/oversize packets, broadcasts,
multicasts, bytes received, and packets received. The statistics are
cleared at a reboot.
IMPORTANT:
You can create only one statistics entry on one interface.
Table 27 RMON history group configuration task list
Task Remarks
Required.
You can create up to 100 history entries in a history table.
After an entry is created, the system periodically samples the number of
packets received/sent on the current interface. It saves the statistics as an
Configuring a history entry
instance under the leaf node of the etherHistoryEntry table.
When you create an entry, if the value of the specified sampling interval is
identical to that of the existing history entry, the system considers their
configurations are the same and the creation fails.
Configuring the RMON alarm function
To send traps to the NMS when an alarm is triggered, configure the SNMP agent as described in
"Configuring SNMP" before config
Perform the tasks in Table 28 to config
Table 28 RMON alarm configuration task list
Task Remarks
Required.
You can create up to 100 statistics entries in a statistics table.
As the alarm variables that can be configured through the Web interface are MIB
variables that defined in the history group or the statistics group, configure the
RMON Ethernet statistics function or the RMON history statistics function on the
Configuring a statistics
entry
Configuring an event
entry
monitored Ethernet interface.
After you create a statistics entry on an interface, the system collects various
traffic statistics on the interface, including network collisions, CRC alignment
errors, undersize/oversize packets, broadcasts, multicasts, bytes received, and
packets received. The statistics are cleared at a reboot.
IMPORTANT:
You can create only one statistics entry for one interface.
Required.
You can create up to 60 event entries for an event table.
An event entry defines event indexes and the actions the system takes, including
IMPORTANT:
uring the RMON alarm function.
ure RMON alarm function.
71
Page 84

Task Remarks
log the event, send a trap to the NMS, take no action, and log the event and send
a trap to the NMS.
You cannot create an entry if the values of the specified alarm variable, sampling
interval, sampling type, rising threshold and falling threshold are identical to
those of an existing entry in the system.
Required.
You can create up to 60 alarm entries for an alarm table.
Configuring an alarm
entry
With an alarm entry created, the specified alarm event is triggered when an
abnormity occurs. The alarm event defines how to deal with the abnormity.
You cannot create an entry if the values of the specified event description,
owners, and actions are identical to those of an existing entry in the system.
Displaying RMON running status
After you configure the RMON statistics function or the alarm function, you can view RMON running
status and verify the configuration by performing tasks in Table 29.
IMPORTANT:
IMPORTANT:
Table 29
Displaying RMON running status
Task Remarks
Display the interface statistics during the period from the time the
Displaying RMON statistics
Displaying RMON history
sampling information
Displaying RMON event logs
statistics entry is created to the time the page is displayed. The
statistics are cleared after the device reboots.
After you create a history control entry on an interface, the system
calculates the information of the interface periodically and saves the
information to the etherHistoryEntry table. You can perform this task to
display the entries in this table. When you configure the history group,
the system specifies the number of history sampling records that can
be displayed and the history sampling interval.
If you configure the system to log an event after the event is triggered
when you configure the event group, the event is recorded in the
RMON log. Perform this task to display the details of the log table.
Configuring a statistics entry
1. Select Device > RMON from the navigation tree.
The Statistics tab page appears.
Figure 63 Statistics entry
2. Click Add.
72
Page 85

Figure 64 Adding a statistics entry
3. Configure a statistic entry as described in Table 30.
4. Click Apply.
Table 30 Configuration items
Item Description
Interface Name
Select the name of the interface on which the statistics entry is created.
Only one statistics entry can be created on one interface.
Owner Set the owner of the statistics entry.
Configuring a history entry
1. Select Device > RMON from the navigation tree.
2. Click the History tab.
Figure 65 History entry
3. Click Add.
73
Page 86

Figure 66 Adding a history entry
4. Configure a history entry as described in Table 31.
5. Click Apply.
Table 31 Configuration items
Item Description
Interface Name Select the name of the interface on which the history entry is created.
Set the capacity of the history record list corresponding to this history entry
(the maximum number of records that can be saved in the history record list).
Buckets Granted
Interval Set the sampling period.
Owner Set the owner of the entry.
If the current number of the entries in the table has reached the maximum
number, the system deletes the earliest entry to save the latest one. The
statistics include total number of received packets on the current interface,
total number of broadcast packets, and total number of multicast packets in a
sampling period.
Configuring an event entry
1. Select Device > RMON from the navigation tree.
2. Click the Event tab.
Figure 67 Event entry
74
Page 87

3. Click Add.
Figure 68 Adding an event entry
4. Configure an event entry as described in Table 32.
5. Click Apply.
Table 32 Configuration items
Item Description
Description Set the description for the event.
Owner Set the entry owner.
Set the actions that the system takes when the event is triggered:
• Log—The system logs the event.
Event Type
• Trap—The system sends a trap in the community name of null.
If you select both
If neither is selected, the system takes no action.
Configuring an alarm entry
1. Select Device > RMON from the navigation tree.
2. Click the Alarm tab.
Figure 69 Alarm entry
3. Click Add.
Log
and
Trap
, the system logs the event and sends a trap.
75
Page 88

Figure 70 Adding an alarm entry
4. Configure an alarm entry as described in Table 33.
5. Click Apply.
Table 33 Configuration items
Item Description
Alarm variable:
Static Item
Interface Name
Sample Item:
Interval Set the sampling interval.
Sample Type
Owner:
Alarm:
Create Default Event
Set the traffic statistics that are collected and monitored. For
more information, see Table 34.
Set the name of the interface whose traffic statistics are
collected and monitored.
Set the sampling type:
• Absolute—Absolute sampling to obtain the value of the
variable when the sampling time is reached.
• Delta—Delta sampling to obtain the variation value of
the variable during the sampling interval when the
sampling time is reached.
Set the owner of the alarm entry.
Select whether to create a default event.
The description of the default event is
action is
If there is no event, you can create the default event. And
when the value of the alarm variable is higher than the alarm
rising threshold or lower than the alarm falling threshold, the
system adopts the default action
log-and-trap
, and the owner is
default event
default owner
log-and-trap
, the
.
.
Rising Threshold Set the alarm rising threshold.
Rising Event
Set the action that the system takes when the value of the
alarm variable is higher than the alarm rising threshold.
76
Page 89

Item Description
Falling Threshold Set the alarm falling threshold.
Falling Event
Displaying RMON statistics
1. Select Device > RMON from the navigation tree.
The page in Figure 63 ap
2. Click the icon for the statistics entry of an interface.
Figure 71 RMON statistics
pears.
If you select the
configurable.
Set the action that the system takes when the value of the
alarm variable is lower than the alarm falling threshold.
If you select the
configurable.
Create Default Event
Create Default Event
box, this option is not
box, this option is not
Table 34 Field description
Field Description
Number of Received Bytes
Number of Received Packets
Number of Received Broadcasting Packets
Number of Received Multicast Packets
Number of Received Packets With CRC
Check Failed
Total number of octets received by the interface,
corresponding to the MIB node etherStatsOctets.
Total number of packets received by the interface,
corresponding to the MIB node etherStatsPkts.
Total number of broadcast packets received by the
interface, corresponding to the MIB node
etherStatsBroadcastPkts.
Total number of multicast packets received by the
interface, corresponding to the MIB node
etherStatsMulticastPkts.
Total number of packets with CRC errors received on
the interface, corresponding to the MIB node
77
Page 90

Field Description
etherStatsCRCAlignErrors.
Number of Received Packets Smaller Than
64 Bytes
Number of Received Packets Larger Than
1518 Bytes
Number of Received Packets Smaller Than
64 Bytes And FCS Check Failed
Number of Received Packets Larger Than
1518 Bytes And FCS Check Failed
Number of Network Conflicts
Number of Packet Discarding Events
Number of Received 64 Bytes Packets
Number of Received 65 to 127 Bytes
Packets
Number of Received 128 to 255 Bytes
Packets
Total number of undersize packets (shorter than 64
octets) received by the interface, corresponding to the
MIB node etherStatsUndersizePkts.
Total number of oversize packets (longer than 1518
octets) received by the interface, corresponding to the
MIB node etherStatsOversizePkts.
Total number of undersize packets (shorter than 64
octets) with CRC errors received by the interface,
corresponding to the MIB node etherStatsFragments.
Number of oversize packets (longer than 1518 octets)
with CRC errors received by the interface,
corresponding to the MIB node etherStatsJabbers.
Total number of collisions received on the interface,
corresponding to the MIB node etherStatsCollisions.
Total number of drop events received on the interface,
corresponding to the MIB node etherStatsDropEvents.
Total number of received packets with 64 octets on the
interface, corresponding to the MIB node
etherStatsPkts64Octets.
Total number of received packets with 65 to 127 octets
on the interface, corresponding to the MIB node
etherStatsPkts65to127Octets.
Total number of received packets with 128 to 255
octets on the interface, corresponding to the MIB node
etherStatsPkts128to255Octets.
Number of Received 256 to 511 Bytes
Packets
Number of Received 512 to 1023 Bytes
Packets
Number of Received 1024 to 1518 Bytes
Packets
Total number of received packets with 256 to 511
octets on the interface, corresponding to the MIB node
etherStatsPkts256to511Octets.
Total number of received packets with 512 to 1023
octets on the interface, corresponding to the MIB node
etherStatsPkts512to1023Octets.
Total number of received packets with 1024 to 1518
octets on the interface, corresponding to the MIB node
etherStatsPkts1024to1518Octets.
Displaying RMON history sampling information
1. Select Device > RMON from the navigation tree.
2. Click the History tab.
3. Click the icon for a history entry.
78
Page 91

Figure 72 RMON history sampling information
Table 35 Field description
Field Description
Number of the entry in the system buffer.
NO
Statistics are numbered chronologically when they are saved to the system
buffer.
Time Time at which the information is saved.
DropEvents
Octets
Pkts
BroadcastPkts
MulticastPkts
Dropped packets during the sampling period, corresponding to the MIB
node etherHistoryDropEvents.
Number of octets received during the sampling period, corresponding to
the MIB node etherHistoryOctets.
Number of packets received during the sampling period, corresponding to
the MIB node etherHistoryPkts.
Number of broadcasts received during the sampling period, corresponding
to the MIB node etherHistoryBroadcastPkts.
Number of multicasts received during the sampling period, corresponding
to the MIB node etherHistoryMulticastPkts.
Number of packets received with CRC alignment errors during the
CRCAlignErrors
sampling period, corresponding to the MIB node
etherHistoryCRCAlignErrors.
UndersizePkts
OversizePkts
Fragments
Number of undersize packets received during the sampling period,
corresponding to the MIB node etherHistoryUndersizePkts.
Number of oversize packets received during the sampling period,
corresponding to the MIB node etherHistoryOversizePkts.
Number of fragments received during the sampling period, corresponding
to the MIB node etherHistoryFragments.
Number of jabbers received during the sampling period, corresponding to
Jabbers
the MIB node etherHistoryJabbers.
Support for the field depends on the device model.
Collisions
Utilization
Number of collision packets received during the sampling period,
corresponding to the MIB node etherHistoryCollisions.
Bandwidth utilization during the sampling period, corresponding to the MIB
node etherHistoryUtilization.
79
Page 92

Displaying RMON event logs
1. Select Device > RMON from the navigation tree.
2. Click the Log tab.
Figure 73 Log tab
In this example, event 1 has generated one log, which is triggered because the alarm value
(11779194) exceeds the rising threshold (10000000). The sampling type is absolute.
RMON configuration example
Network requirements
As shown in Figure 74, create an entry in the RMON Ethernet statistics table to gather statistics on
GigabitEthernet 1/0/1 with the sampling interval being 10 seconds. Perform corresponding
configurations so that the system logs the event when the number of bytes received on the interface
more than 1000 or less than 100.
Figure 74 Network diagram
Configuration procedure
1. Configure RMON to gather statistics for GigabitEthernet 1/0/1:
a. Select Device > RMON from the navigation tree.
The Statistics tab page appears.
b. Click Add.
The page in Figure 75 ap
c. Select GigabitEthernet1/0/1 from the Interface Name list, type user1 in the Owner field,
and click Apply.
pears.
80
Page 93

Figure 75 Adding a statistics entry
2. Display RMON statistics for GigabitEthernet 1/0/1:
a. Click the icon corresponding to GigabitEthernet 1/0/1.
b. Display this information as shown in Figure 76.
Figure 76
Displaying RMON statistics
3. Create an event to start logging after the event is triggered:
a. Click the Event tab.
b. Click Add.
The page in Figure 77 ap
pears.
c. Type user1-rmon in the Owner field, select the box before Log, and click Apply.
d. The page displays the event entry, and you can see that the entry index of the new event is
1, as shown in Figure 78.
81
Page 94

Figure 77 Configuring an event group
Figure 78 Displaying the index of an event entry
4. Configure an alarm group to sample received bytes on GigabitEthernet 1/0/1. When the
received bytes exceed the rising or falling threshold, logging is enabled:
a. Click the Alarm tab.
b. Click Add.
The page in Figure 79 ap
pears.
c. Select Number of Received Bytes from the Static Item list, select GigabitEthernet1/0/1
from the Interface Name list, enter 10 in the Interval field, select Delta from the Simple
Type list, enter user1 in the Owner field, enter 1000 in the Rising Threshold field, select 1
from the Rising Event list, enter 100 in the Falling Threshold field, select 1 from the
Falling Event list, and click Apply.
82
Page 95

Figure 79 Configuring an alarm group
Verifying the configuration
After the above configuration, when the alarm event is triggered, you can display log information for
event 1 on the Web interface.
1. Select Device > RMON from the navigation tree.
2. Click the Log tab.
The log page appears. The log in this example indicates that event 1 generated one log, which
was triggered because the alarm value (22050) exceeded the rising threshold (1000). The
sampling type is absolute.
Figure 80 Log information for event 1
83
Page 96

Configuring energy saving
Energy saving enables a port to operate at the lowest transmission speed, disable PoE, or go down
during a specific time range on certain days of a week. The port resumes when the effective time
period ends.
Configuring energy saving on a port
1. Select Device > Energy Saving from the navigation tree to enter the energy saving
configuration page.
2. Click a port.
Figure 81 Energy saving configuration page
3. Configure an energy saving policy for the port as described in Table 36.
4. Click Apply.
Table 36 Configuration items
Item Description
Time Range Set the time period when the port is in the state of energy saving.
IMPORTANT:
• Up to five energy saving policies with different time ranges can be configured
Sun through Sat
PoE Disabled Disable PoE on the port.
Lowest Speed
Shutdown
on a port.
• Specify the start time and end time in units of 5 minutes, such as 08:05 to
10:15. Otherwise, the start time is postponed and the end time is brought
forward so that they meet the requirements. For example, if you set the time
range to 08:08 to 10:12, the effective time range is 08:10 to 10:10.
Set the port to transmit data at the lowest speed.
If you configure the lowest speed limit on a port that does not support 10 Mbps, the
configuration cannot take effect.
Shut down the port.
An energy saving policy can have all the three energy saving schemes configured,
of which the shutdown scheme takes the highest priority.
84
Page 97

Configuring SNMP
This chapter provides an overview of the Simple Network Management Protocol (SNMP) and guides
you through the configuration procedure.
Overview
SNMP is an Internet standard protocol widely used for a management station to access and operate
the devices on a network, regardless of their vendors, physical characteristics and interconnect
technologies.
SNMP enables network administrators to read and set the variables on managed devices for state
monitoring, troubleshooting, statistics collection, and other management purposes.
SNMP mechanism
The SNMP framework comprises the following elements:
• SNMP manager—Works on an NMS to monitor and manage the SNMP-capable devices in the
network.
• SNMP agent—Works on a managed device to receive and handle requests from the NMS, and
send traps to the NMS when some events, such as interface state change, occur.
• Management Information Base (MIB)—Specifies the variables (for example, interface status
and CPU usage) maintained by the SNMP agent for the SNMP manager to read and set.
Figure 82 Relationship between an NMS, agent and MIB
A MIB stores variables called "nodes" or "objects" in a tree hierarchy and identifies each node with a
unique OID. An OID is a string of numbers that describes the path from the root node to a leaf node.
For example, the object B in Figure 83 is uniquely ide
Figure 83 MIB tree
SNMP provides the following basic operations:
• Get—The NMS retrieves SNMP object nodes in an agent MIB.
• Set—The NMS modifies the value of an object node in an agent MIB.
ntified by the OID {1.2.1.1}.
85
Page 98

• Notifications—Includes traps and informs. SNMP agent sends traps or informs to report
events to the NMS. The difference between these two types of notification is that informs
require acknowledgement but traps do not. The device supports only traps.
SNMP protocol versions
HPE devices support SNMPv1, SNMPv2c, and SNMPv3. An NMS and an SNMP agent must use the
same SNMP version to communicate with each other.
• SNMPv1—Uses community names for authentication. To access an SNMP agent, an NMS
must use the same community name as set on the SNMP agent. If the community name used
by the NMS is different from the community name set on the agent, the NMS cannot establish
an SNMP session to access the agent or receive traps and notifications from the agent.
• SNMPv2c—Uses community names for authentication. SNMPv2c is compatible with SNMPv1,
but supports more operation modes, data types, and error codes.
• SNMPv3—Uses a user-based security model (USM) to secure SNMP communication. You can
configure authentication and privacy mechanisms to authenticate and encrypt SNMP packets
for integrity, authenticity, and confidentiality.
Recommended configuration procedure
SNMPv3 differs from SNMPv1 and SNMPv2c in many ways. Their configuration procedures are
described in separate sections.
Table 37 SNMPv1 or SNMPv2c configuration task list
Task Remarks
Required.
The SNMP agent function is disabled by default.
1. Enabling SNMP agent
2. Configuring an SNMP view
3. Configuring an SNMP
community
4. Configuring SNMP trap function
5. Displaying SNMP packet
statistics
IMPORTANT:
If SNMP agent is disabled, all SNMP agent-related configurations
are removed.
Optional.
After creating SNMP views, you can specify an SNMP view for an
SNMP community to limit the MIB objects that can be accessed by
the SNMP community.
Required.
Optional.
Allo
NMS, and configure information about the target host (usually the
NMS) of the SNMP traps.
The SNMP agent sends traps to inform the NMS of important
events, such as a reboot.
By default, an agent is allowed to send SNMP traps to the NMS.
Optional.
ws you to configure that the agent can send SNMP traps to the
Table 38 SNMPv3 configuration task list
Task Remarks
1. Enabling SNMP agent
Required.
86
Page 99

Task Remarks
The SNMP agent function is disabled by default.
IMPORTANT:
If SNMP agent is disabled, all SNMP agent-related configurations are
removed.
Optional.
2. Configuring an SNMP view
3. Configuring an SNMP group
4. Configuring an SNMP user
5. Configuring SNMP trap
function
6. Displaying SNMP packet
statistics
After creating
SNMP group to limit the MIB objects that can be accessed by the
SNMP group.
Required.
After creating an SNMP group, you can add SNMP users to the group
when creating the users. Therefore, you can realize centralized
management of users in the group through the management of the
group.
Required.
Before creating an SNMP user, you need to create the SNMP group to
which the user belongs.
IMPORTANT:
After you change the local engine ID, the existing SNMPv3 users
become invalid, and you must re-create the SNMPv3 users. For more
information about engine ID, see "Enabling SNMP agent."
Optional.
Allows you to configure that the agent can send SNMP traps to the
NMS, and configure information about the target host (usually the NMS)
of the SNMP traps.
The SNMP agent sends traps to inform the NMS of important events,
such as a reboot.
By default, an agent is allowed to send SNMP traps to the NMS.
Optional.
SNMP views, you can specify an SNMP view for an
Enabling SNMP agent
1. Select Device > SNMP from the navigation tree.
The SNMP configuration page appears.
87
Page 100

Figure 84 Setup tab
2. Configure SNMP settings on the upper part of the page as described in Table 39.
3. Click Apply.
Table 39 Configuration items
Item Description
SNMP Specify to enable or disable SNMP agent.
Configure the local engine ID.
Local Engine ID
Maximum Packet Size
Contact
Location Set a character string to describe the physical location of the device.
SNMP Version Set the SNMP version run by the system.
The validity of a user after it is created depends on the engine ID of the
SNMP agent. If the engine ID when the user is created is not identical to
the current engine ID, the user is invalid.
Configure the maximum size of an SNMP packet that the agent can
receive or send.
Set a character string to describe contact information for system
maintenance.
If the device is faulty, the maintainer can contact the manufacture factory
according to the contact information of the device.
88
 Loading...