

Page 1

HPE FlexNetwork 5130 EI Switch Series
Troubleshooting Guide
Part number: 5200-1218
Document version: 6W102-20160429
The information in this document is subject to change without notice.
© Copyright 2016 Hewlett Packard Enterprise Development LP
Page 2

i
Contents
Introduction ····································································································· 1
General guidelines ············································································································································· 1
Collecting log and operating information ············································································································ 1
Collecting common log messages ············································································································· 2
Collecting diagnostic log messages ··········································································································· 2
Collecting operating statistics ····················································································································· 3
Contacting technical support ······························································································································ 4
Troubleshooting hardware ·············································································· 4
Unexpected switch reboot ·································································································································· 4
Symptom ···················································································································································· 4
Troubleshooting flowchart ·························································································································· 5
Solution ······················································································································································ 5
Operating power supply failure on the HPE FlexNetwork 5130 24G SFP 4SFP+ EI Switch (JG933A) ············· 6
Symptom ···················································································································································· 6
Solution ······················································································································································ 6
Newly-installed power supply failure on the HPE FlexNetwork 5130 24G SFP 4SFP+ EI Switch (JG933A) ···· 6
Symptom ···················································································································································· 6
Solution ······················································································································································ 7
Fixed fan failure ················································································································································· 7
Symptom ···················································································································································· 7
Solution ······················································································································································ 7
Related commands ············································································································································ 8
Troubleshooting ACL ······················································································ 9
ACL application failure with an error message ·································································································· 9
Symptom ···················································································································································· 9
Solution ······················································································································································ 9
ACL application failure without an error message ····························································································· 9
Symptom ···················································································································································· 9
Troubleshooting flowchart ·························································································································· 9
Solution ···················································································································································· 10
Related commands ·········································································································································· 10
Troubleshooting IRF ····················································································· 12
IRF fabric establishment failure ······················································································································· 12
Symptom ·················································································································································· 12
Troubleshooting flowchart ························································································································ 12
Solution ···················································································································································· 13
Related commands ·········································································································································· 14
Troubleshooting Ethernet link aggregation ··················································· 15
Link aggregation failure ···································································································································· 15
Symptom ·················································································································································· 15
Troubleshooting flowchart ························································································································ 16
Solution ···················································································································································· 16
Related commands ·········································································································································· 17
Troubleshooting ports ··················································································· 18
A 10-GE SFP+ fiber port or GE SFP fiber port fails to come up ······································································ 18
Symptom ·················································································································································· 18
Troubleshooting flowchart ························································································································ 18
Solution ···················································································································································· 19
A 10/100/1000Base-T GE copper port fails to come up ·················································································· 20
Symptom ·················································································································································· 20
Troubleshooting flowchart ························································································································ 20
Solution ···················································································································································· 20
Page 3

ii
Related commands ·········································································································································· 21
Troubleshooting other problems ··································································· 22
Layer 2 forwarding failure ································································································································ 22
Symptom ·················································································································································· 22
Troubleshooting flowchart ························································································································ 22
Solution ···················································································································································· 22
Related commands ·································································································································· 26
Layer 3 forwarding failure ································································································································ 27
Symptom ·················································································································································· 27
Troubleshooting flowchart ························································································································ 27
Solution ···················································································································································· 27
Related commands ·································································································································· 28
Protocol flapping ·············································································································································· 28
Symptom ·················································································································································· 28
Troubleshooting flowchart ························································································································ 29
Solution ···················································································································································· 29
Page 4

1
Introduction
This document provides information about troubleshooting common software and hardware
problems with HPE FlexNetwork 5130 EI switches.
This document is not restricted to specific software or hardware versions.
General guidelines
IMPORTANT:
To prevent a problem from causing loss of configuration, save the configuration each time you finish
configuring a feature. For configuration recovery, regularly back up the configuration to a remote
server.
When you troubleshoot HPE FlexNetwork 5130 EI switches, follow these general guidelines:
• To help identify the cause of the problem, collect system and configuration information,
including:
{ Symptom, time of failure, and configuration.
{ Network topology information, including the network diagram, port connections, and points
of failure.
{ Log messages and diagnostic information. For more information about collecting this
information, see "Collecting log and operating information."
{ Photos of the hardware.
{ Steps you have taken, such as reconfiguration, cable swapping, and reboot.
{ Output from the commands executed during the troubleshooting process.
• To ensure safety , wear an ESD-preventiv e wrist strap when you replace or maintain a hardware
component.
Collecting log and operating information
IMPORTANT:
By default, the information center is enabled. If the feature is disabled, you must use th e info-cente
r
enable command to enable the feature for collecting log messages.
Table 1 shows the types of files that the system uses to store operating log and status information.
You can export these files by using FTP or TFTP.
In an IRF system, these files are stored on the master device. Multiple devices will have log files if
master/subordinate switchovers have occurred. You must collect log files from all these devices. To
more easily locate log information, use a consistent rule to categorize and name files. For example,
save log files to a separate folder for each member device, and include their slot numbers in the
folder names.
Table 1 Log and operating information
Category File name format Content
Common log
logfile.log
Command execution and operational log messages.
Page 5

2
Category File name format Content
Diagnostic log
diagfile.log
Diagnostic log messages about device operation, including the
following items:
• Parameter settings used when an error occurs.
• Information about a card startup error.
• Handshaking information between member devices when
a communication error occurs.
Operating
statistics
file-basename
.gz
Current operation statistics for feature modules, including the
following items:
• Device status.
• CPU status.
• Memory status.
• Configuration status.
• Software entries.
• Hardware entries.
Collecting common log messages
1. Save the common log messages from the log buffer to a log file.
By default, the log file is saved in the logfile directory of the Flash memory on each member
device.
<Sysname> logfile save
The contents in the log file buffer have been saved to the file
flash:/logfile/logfile.log
2. Identify the log file on each member device:
# Display the log file on the master device.
<Sysname> dir flash:/logfile/
Directory of flash:/logfile
0 -rw- 21863 Jul 11 2013 16:00:37 logfile.log
524288 KB total (36944 KB free)
# Display the log file on each subordinate device:
<Sysname> dir slot2#flash:/logfile/
Directory of slot2#flash:/logfile
0 -rw- 21863 Jul 11 2013 16:00:37 logfile.log
524288 KB total (36944 KB free)
3. Transfer the files to the desired destination by using FTP or TFTP. (Details not shown.)
Collecting diagnostic log messages
1. Save the diagnostic log messages from the diagnostic log file buffer to a diagnostic log file.
By default, the diagnostic log file is saved in the diagfile directory of the Flash memory on each
member device.
<Sysname> diagnostic-logfile save
The contents in the diagnostic log file buffer have been saved to the file
flash:/diagfile/diagfile.log
2. Identify the diagnostic log file on each member device:
Page 6

3
# Display the diagnostic log file on the master device.
<Sysname> dir flash:/diagfile/
Directory of flash:/diagfile
0 -rw- 161321 Jul 11 2013 16:16:00 diagfile.log
524288 KB total (36944 KB free)
# Display the diagnostic log file on each subordinate device:
<Sysname> dir slot2#flash:/diagfile/
Directory of slot2#flash:/diagfile
0 -rw- 161321 Jul 11 2013 16:16:00 diagfile.log
524288 KB total (36944 KB free)
3. Transfer the files to the desired destination by using FTP or TFTP. (Details not shown.)
Collecting operating statistics
You can collect operating statistics by saving the statistics to a file or displaying the statistics on the
screen.
When you collect operating statistics, follow these guidelines:
• Log in to the device through a network port instead of the console port if any network ports are
available. Network ports are faster than the console port.
• Do not execute commands during operating statistics collection.
• As a best practice, save operating statistics to a file to ensure that the information is retained.
NOTE:
The amount of time to collect statistics increases along with the number of IRF member devices.
To collect operating statistics:
1. Disable pausing between screens of output if you want to display operating statistics on the
screen. Skip this step if you are saving statistics to a file.
<Sysname> screen-length disable
2. Collect operating statistics for multiple feature modules.
<Sysname> display diagnostic-information
Save or display diagnostic information (Y=save, N=display)? [Y/N] :
3. At the prompt, choose to save or display operating statistics:
# To save operating statistics, enter y at the prompt and then specify the destination file path.
Save or display diagnostic information (Y=save, N=display)? [Y/N] :y
Please input the file name(*.tar.gz)[flash:/diag.tar.gz] :flash:/diag.tar.gz
Diagnostic information is outputting to flash:/diag.tar.gz.
Please wait...
Save successfully.
<Sysname> dir flash:/
Directory of flash:
…
6 -rw- 898180 Jun 26 2013 09:23:51 diag.tar.gz
524288 KB total (36944 KB free)
# To display operating statistics on the monitor terminal, enter n at the prompt.
Page 7

4
Save or display diagnostic information (Y=save, N=display)? [Y/N] :n
===============================================
===============display clock===============
05:48:00 UTC Tue 01/01/2014
=================================================
……
Contacting technical support
If you cannot resolve a problem after using the troubleshooting procedures in this document, contact
Hewlett Packard Enterprise Support. When you contact an authorized Hewlett Packard Enterprise
support representative, be prepared to provide the following information:
• Information described in "General guidelines."
• Produ
ct serial numbers.
• Technical support registration numbers (if applicable).
This information will help the support engineer assist you as quickly as possible.
The following is the contact of Hewlett Packard Enterprise Support for networking products:
www.hpe.com/supp ort/hpesc
Troubleshooting hardware
This section provides troubleshooting information for common hardware problems.
NOTE:
This section describes how to troubleshoot unexpected switch reboot, power supply failure, and
fixed fan failure. To troubleshoot ports, see "Troubleshooting ports."
Unexpected switch reboot
Symptom
The switch reboots unexpectedly when it is operating.
Page 8
5
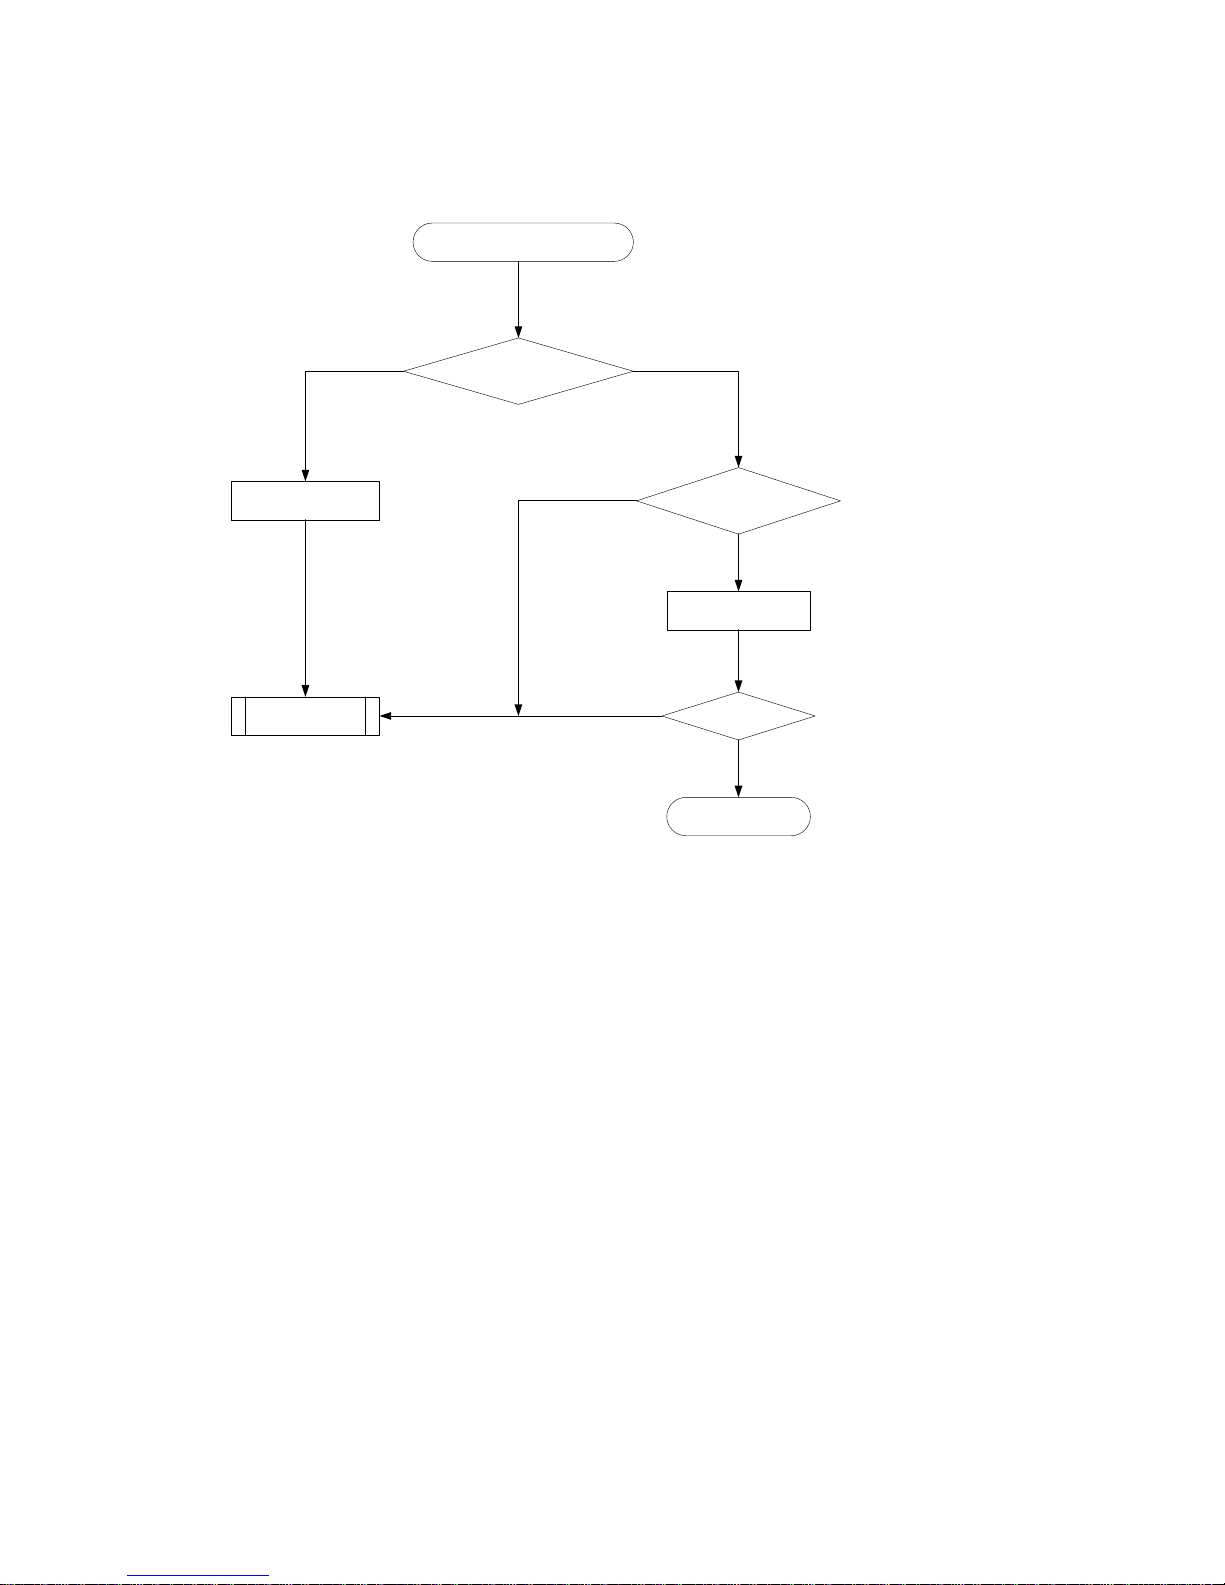
Troubleshooting flowchart
Figure 1 Troubleshooting an unexpected switch reboot
Solution
To resolve the problem:
1. Verify that you can access the CLI after the switch reboots.
{ If you can access the CLI, execute the display diagnostic-information command to
collect diagnostic messages.
{ If you cannot access the CLI, go to step 2.
2. Verify that the system software image on the switch is correct.
Log in to the switch through the console port and restart the switch. If the system reports tha t a
CRC error has occurred or that no system software image is available, reload the system
software image. The system software image is automatically set to the current system software
image during the Boot ROM image running process.
3. If the problem persists, contact Hewlett Packard Enterprise Support.
The switch reboots unexpectedly
Can the CLI be
accessed?
Collect diagnostic
messages
Reload the system
software image
Yes
No
Problem resolved?
End
Yes No
Yes
No
Is the system software
image correct?
Contact the
support
Page 9

6
Operating power supply failure on the HPE
FlexNetwork 5130 24G SFP 4SFP+ EI Switch
(JG933A)
Symptom
A trap or log is generate d indicating that an operating power supply is faulty.
Solution
To resolve the problem:
1. Execute the display power command to display power supply information.
<Sysname> display power
Slot 1:
PowerID State Mode Current(A) Voltage(V) Power(W)
1 Normal DC -- -- 0
2 Fault AC -- -- 0
If the power supply is in Absent state, go to step 2. If the power supply is in Fault state, go to
step 3.
2. Remove a
nd reinstall the power supply to make sure the power supply is installed correctly.
Then, execute the display power command to verify that the power supply has changed to
Normal state. If the power supply remains in Absent state, replace the power supply.
3. When the power supply is in Fault state, perform the following steps:
a. Verify that the power supply has not been disconnected from the power source. If it has
been disconnected from the power source, connect the power source to it.
b. Verify that the power supply surface is clean. If there is dust accumulated on the power
supply, remove the dust. Then remove and reinstall the power supply. Execute the display
power command to verify that the power supply has changed to Normal state. If the power
supply remains in Fault state, go to step c.
c. Install the po
wer supply into an empty power supply slot. Then execute the display power
command to verify that the power supply has changed to Normal state in the new slot. If the
power supply remains in Fault state, replace the power supply.
4. If the problem persists, contact Hewlett Packard Enterprise Support.
Newly-installed power supply failure on the HPE
FlexNetwork 5130 24G SFP 4SFP+ EI Switch
(JG933A)
Symptom
A trap or log is generate d indicating that a newly-installed power supply is faulty.
Page 10

7
Solution
To resolve the problem:
1. Execute the display power command to display power supply information.
<Sysname> display power
Slot 1:
PowerID State Mode Current(A) Voltage(V) Power(W)
1 Normal DC -- -- 0
2 Fault AC -- -- 0
If the power supply is in Absent state, go to step 2. If the power supply is in Fault state, go to
step 3.
2. When the power
supply is in Absent state, perform the following tasks:
a. Remove and reinstall the power supply to make sure the power supply is installed securely.
Then execute the display power command to verify that the power supply has changed to
Normal state. If the power supply remains in Absent state, go to step b.
b. Remove a
nd install the power supply into an empty power supply slot. Then execute the
display power command to verify that the power supply has changed to Normal state in
the new slot. If the power supply remains in Absent state, go to step 4.
3. Remove a
nd install the power supply into an idle power supply slot. Then execute the display
power command to verify that the power supply has changed to Normal state in the new slot. If
the power supply remains in Fault state, go to step 4.
4. If the problem
persists, contact Hewlett Packard Enterprise Support.
Fixed fan failure
Symptom
A trap or log is generate d indicating that an operating fixed fan is faulty.
Solution
To resolve the problem:
1. Execute the display fan command to display the operating states of the fixed fan.
<Sysname> display fan
Slot 1:
Fan 1:
State : Normal
Fan 2:
State : Normal
Fan 3:
State : Normal
Fan 4:
State : Fault
2. Execute the display environment command to display temperature information. If the
temperature continues to rise, put your hand over the air outlet vents to verify that air is being
exhausted from the air outlet vents. If there is no air being exhausted from the air outlet vents,
contact Hewlett Packard Enterprise Support.
Page 11

8
Related commands
This section lists the commands that you might use for troubleshooting the hardware.
Command Description
dir
Displays information about files and directories.
display boot-loader
Displays current configuration files and system software
images.
display environment
Displays temperature information.
display fan
Displays the operating states of the fixed fan.
display logbuffer
Displays the state of the log buffer and the log information in
the log buffer.
display power
Displays power supply information.
Page 12

9
Troubleshooting ACL
This section provides troubleshooting information for common problems with ACLs.
ACL application failure with an error message
Symptom
The system fails to apply a packet filter or an ACL-based QoS policy to the hardware. It also displays
the "Reason: Not enough hardware resource" message.
Solution
To resolve the problem:
1. Execute the display qos-acl resource command, and then check the Remaining field for ACL
resources insufficiency.
If this field displays 0, the ACL hardware resources are exhausted.
2. To free hardware resources for packet filtering or QoS classification, remove unused ACLs.
3. If the problem persists, contact Hewlett Packard Enterprise Support.
ACL application failure without an error message
Symptom
The system applies a packet filter or an ACL-based QoS policy to the hardware. However, the ACL
does not take effect.
Troubleshooting flowchart
Figure 2 Troubleshooting an ACL application failure
Page 13

10
Solution
Choose a solution depending on the module that uses the ACL.
ACL used in a QoS policy
To resolve the problem when the ACL is used in a QoS policy:
1. Verify that the QoS policy is configured correctly:
a. Use one of the following commands to check the QoS policy for configuration errors,
depending on the policy application destination:
Destination Command
Interface
display qos policy interface
VLAN
display qos vlan-policy
Global
display qos policy global
Control plane
display qos policy control-plane slot
slot-number
b. If the QoS policy does not contain a class-beh avior association, associate the traffic
behavior with the traffic class.
c. If the QoS policy contains a class-behavior association, execute the display traffic
classifier user-defined command and the display traffic behavior user-defined
command to check for traffic class and behavior configuration errors, respectively.
− If they are configured incorrectly, reconfigure them.
− If they are configured correctly, go to step 2.
2. Verify that th
e ACL is configured correctly.
Execute the display acl command to check whether the ACL is configured correctly.
{ If the ACL is configured incorrectly, reconfigure it.
{ If the ACL is configured correctly, go to step 3.
3. If the problem persists, contact Hewlett Packard Enterprise Support.
ACL used in a packet filter
To resolve the problem when the ACL is used in a packet filter:
1. Verify that the packet filter is configured correctly.
Execute the display packet-filter command to check whether the packet filter is configured
correctly.
{ If there are any configuration errors, reconfigure the packet filter.
{ If there is no configuration error , go to step 2.
2. Verify that the ACL is configured correctly.
Execute the display acl command to check whether the ACL is configured correctly.
{ If the ACL is configured incorrectly, reconfigure it.
{ If the ACL is configured correctly, go to step 3.
3. If the problem persists, contact Hewlett Packard Enterprise Support.
Related commands
This section lists the commands that you might use for troubleshooting ACLs.
Page 14

11
Command Description
display packet-filter
Displays whether an ACL has been successfully applied to
an interface for packet filtering.
display qos-acl resource
Displays QoS and ACL resource usage.
display qos policy control-plane
Displays information about the QoS policies applied to the
specified control plane.
display qos policy global
Displays information about global QoS policies.
display qos policy interface
Displays information about the QoS policies applied to an
interface or to all interfaces.
display qos vlan-policy
Displays information about QoS policies applied to VLANs.
display traffic classifier user-defined
Displays traffic class configuration.
display traffic behavior user-defined
Displays traffic behavior configuration.
Page 15

12
Troubleshooting IRF
This section provides troubleshooting information for common problems with IRF.
IRF fabric establishment failure
Symptom
An IRF fabric cannot be established.
Troubleshooting flowchart
Figure 3 Troubleshooting an IRF fabric establishment failure
Page 16

13
Solution
To resolve the problem:
1. Verify that the number of member devices does not exceed the upper limit (varies by software
version).
If you are adding a new member device to an existing IRF fabric or merging IRF fabrics, use the
display irf command to identify the number of member devices in the IRF fabrics. If the total
number of member devices exceeds the upper limit, the IRF setup will fail.
2. Verify that the member ID of each member device is unique:
a. Execute the display irf command to view the member ID of each member device.
b. Assign a unique member ID to each member.
− If you are adding a new member device to an existing IRF fabric, assign the member
device a member ID that is not being used in the IRF fabric.
− If you are merging IRF fabrics, make sure each member device in these IRF fabrics has
a unique member ID.
3. Verify that the IRF port bindings and physical IRF link connections are correct:
IMPORTANT:
When you connect two neighboring IRF members, you must connect the physical ports of
IRF-port 1 on one member to the physical ports of IRF-port 2 on the other.
a. Execute the display irf configuration command on each member device, and check the
IRF-Port1 and IRF-Port2 fields for IRF port bindings.
b. Verify that the physical IRF connections are con si stent with the IRF po rt bindings.
c. If there are binding errors or connection inconsistencies, reconfigure the IRF port binding s
or reconnect the physical IRF ports.
4. Verify that the IRF links are 10 Gbps.
a. Verify that the transceiver modules or cables for IRF connection are labeled with 10Gbps or
SFP+.
b. Replace a transceiver module or cable if it is not for 10-Gbps connection.
5. (Optional.) Verify that transceiver modules at the two ends of an IRF link are the same type.
If the transceiver modules are not the same type, replace them to be the same type.
Skip this step if you are using SFP+ cables to connect IRF member devices.
6. Verify that all IRF links are up:
a. Execute the display irf topology command, and then check the Link field.
− If the Link field for each IRF port does not display DOWN, go to step 7.
− If
the Link field for an IRF port displays DOWN, go to step b.
b. Execute the displa
y irf link command, and then check the Status field of the physical ports
bound to the IRF port.
− If the field displays DOWN or ADM (administratively down) for all the physical ports,
remove the link failures or use the undo shutdown command to bring up the
administratively down ports.
− If the field displays UP for a minimum of one of the physical ports, go to step c.
c. Save the conf
iguration, and then execute the irf-port-configuration active command in
system view to activate the IRF port configuration.
IMPORTANT:
Activating IRF port configuration requires a reboot. To prevent configuration loss, you must
Page 17

14
save the configuration before you execute the irf-port-configuration active command.
7. Verify that all member devices use the same software version:
a. Execute the display version command to identify the software version of each member
device.
b. Upgrade the softwa re of all member devices to the same version.
NOTE:
Typically, the irf auto-update enable command can automatically synchronize a member
device with the software version of the master device. However, the synchronization might fail
when the gap between the software versions is too large. For more information, see the release
notes.
8. If the problem persists, contact Hewlett Packard Enterprise Support.
Related commands
This section lists the commands that you might use for troubleshooting IRF.
Command Description
display interface
Displays interface information.
Use this command to verify that each IRF port has a minimum of one
physical port in up state.
display irf
Displays IRF fabric information, including the member ID, role, priority,
bridge MAC address, and description of each IRF member.
display irf configuration
Displays basic IRF settings, including the current member ID, new
member ID, and physical ports bound to the IRF ports on each IRF
member device. The new member IDs take effect at reboot.
display irf topology
Displays the IRF fabric topology, including the member IDs, IRF port
state, and adjacencies of IRF ports.
display version
Displays system version information.
irf-port-configuration active
Activates IRF configuration on IRF ports.
undo shutdown
Brings up an Ethernet interface or subinterface.
Page 18

15
Troubleshooting Ethernet link
aggregation
This section provides troubleshooting information for common problems with Ethernet link
aggregation.
Link aggregation failure
Symptom
Some member ports fail to be placed in Selected state, and link aggregation does not operate
correctly.
Page 19

16
Troubleshooting flowchart
Figure 4 Troubleshooting a link aggregation failure
Solution
To resolve the problem:
1. Verify that all physical connections are correct.
You can verify the physical connections against your network plan.
2. Verify that all member ports are up:
a. Execute the display interface command to display the status of the member ports.
b. If the member ports are down, follow the solution in "Troubleshooting ports" to trouble
shoot
the problem.
3. Verify that the member ports have the same operational key and attribute configurations as the
reference port:
Are all physical connections correct?
Are all member ports up?
Connect physical links correctly
Bring all member ports up
No
Yes
No
Yes
Operational key/attributes same as the
reference port?
Set operational key/attributes
same as the reference port
No
Yes
Set the number of member ports
less than or equal to upper limit on
Selected ports
Yes
No
More member ports than upper limit on
Selected ports?
Operational key/attributes of the peers same as
the peer of the reference port?
Set operational key/attributes of
the peers same as the peer of
the reference port
No
Yes
End
Aggregation
failed
Link aggregation in dynamic mode?
Yes
No
Resolved?
Resolved?
Resolved?
Resolved?
Resolved?
No
No
No
No
No
Yes
Yes
Yes
Yes
Yes
Contact the support
Page 20

17
a. Execute the display link-aggregation verbose command to display the Selected state of
the member ports.
b. Execute the display current-configuration interface command to display the
configurations of the aggregate interface and the Unselected ports.
c. Configure the Unselected ports to make sure they have the same operational key and
attribute configurations as the reference port.
4. Identify the aggregation mode of the aggregation group.
{ If the aggregation mode is static, proceed to step 6.
{ If the aggregation mode is dynamic, proceed to step 5.
5. Verify that the peer member ports have the same operational key and attribute configurations
as the peer port of the reference port:
a. Execute the display current-configuration interface command on the peer device to
display the configurations of the peer member ports.
b. Configure the peer member ports to make sure the peer ports have the same operational
key and attribute configurations as the peer port of the reference port.
6. Verify that the number of member ports in the aggregation group does not exceed the
configured maximum number of Selected ports.
a. Execute the link-aggregation selected-port maximum command to set the maximum
number of Selected ports allowed in the aggregation group. The value range is 1 to 16.
b. Execute the display link-aggregation verbose command to verify that the number of
member ports does not exceed the configured maximum number of Selected ports.
If the number of member ports exceeds the maximum number of Selected ports, the ports
with higher port numbers are in Unselected state.
c. Use the undo port link-aggregation group command to remove undesired member ports
from the aggregation group.
This makes sure all member ports you assign to the aggregation group can become
Selected ports.
7. If the problem persists, contact Hewlett Packard Enterprise Support.
Related commands
This section lists the commands that you might use for troubleshooting Ethernet link aggregation.
Commands Description
display current-configuration interface
Displays interface configuration.
display interface
Displays Ethernet interface information.
display link-aggregation verbose
Display detailed information about the
aggregation groups that correspond to the
existing aggregate interfaces.
link-aggregation selected-port maximum
Configure the maximum number of Selected
ports allowed in an aggregation group.
Page 21

18
Troubleshooting ports
This section provides troubleshooting information for common port problems.
A 10-GE SFP+ fiber port or GE SFP fiber port fails
to come up
Symptom
A 10-GE SFP+ fiber port or GE SFP fiber port fails to come up.
Troubleshooting flowchart
Figure 5 Troubleshooting a link up failure on a fiber port
No
Yes
No
Yes
No
Yes
Yes
No
No
Yes
Yes
No
No
Yes
Yes
No
No
Yes
Yes
No
A fiber port failed to come up
Contact the support
Resolved?
Speed/duplex match
on local and peer port?
Speed/duplex
match on transceiver module and
port?
Local/peer port
operating correctly?
Transceiver
module/cable correct?
Fiber correct?
Configure matching
speed/duplex
Configure matching
speed/duplex
Replace local/peer port
Replace transceiver
module/cable
Replace fiber
Resolved?
Resolved?
Resolved?
Resolved?
End
Page 22

19
Solution
To resolve the problem:
1. Verify that the speed and duplex mode of the local port match the speed and duplex mode of
the peer port:
a. Execute the display interface brief command to examine whether the speed and duplex
mode of the port match the speed and duplex mode of the peer port.
b. If they do not match, use the speed command an d the duplex command to set the rate and
duplex mode for the port.
2. Verify that the speed and duplex mode of the local port match the speed and duplex mode of
the transceiver module:
a. Execute the display interface brief command to examine whether the speed and duplex
mode of the port match the speed and duplex mode of the transceiver module.
b. If they do not match, use the speed command an d the duplex command to set the rate and
duplex mode for the port.
3. Verify that the ports at both ends are operating correctly:
a. For a 10-GE SFP+ fiber port, use an SFP+ cable (used for connection over a short distance)
to directly connect it to another 10-GE SFP+ fiber port on the local end. For a GE SFP port,
use a GE SFP cable (used for connection over a short distance) to directly connect it to
another GE SFP port on the local end.
b. Identify whether the port can come up:
− If the port can come up, you can determine that the peer port fails. Replace the peer port
with a new port that operates correctly.
− If the port cannot come up, you can determine that the local port fails. Replace the local
port with a new port that operates correctly.
4. Verify that the transceiver module and cable are operating correctly:
a. Use the display transceiver alarm interface command to display the alarms present on
the transceiver module:
− The device displays None if no error occurs.
− The device displays alarms if the transceiver module fails or the type of the transceiver
module does not match the port type.
b. Use an optical power meter to verify that the Tx power and Rx power of the transceiver
module are stable and are within the correct range.
c. Execute the display transceiver interface command to verify that the wavelength and
transmission distance of the local transceiver module are consistent with the wavelength
and transmission distance of the peer transceiver module.
d. If the transceiver modul e is not operating correctly, replace it with an HPE transceiver
module that matches the fiber port.
For more information about transceiver modules and cables, see the installation guide.
5. Verify that the fiber matches the transceiver module. If they do not match, replace the fiber with
a new one that matches the transceiver module.
For more information about fibers, see the installation guide.
6. If the problem persists, contact Hewlett Packard Enterprise Support, and provide the following
information:
<Sysname> display diagnostic-information
Save or display diagnostic information (Y=save, N=display)? [Y/N]:Y
Page 23

20
A 10/100/1000Base-T GE copper port fails to
come up
Symptom
A 10/100/1000Base -T GE copper port fails to come up.
Troubleshooting flowchart
Figure 6 Troubleshooting a link up failure on a copper port
Solution
To resolve the problem:
1. Verify that the speed and duplex mode of the local port match the speed and duplex mode of
the peer port:
a. Execute the display interface brief command to examine whether the speed and duplex
mode of the port match the speed and duplex mode of the peer port.
b. If they do not match, use the speed command an d the duplex command to set the rate and
duplex mode for the port.
2. Replace the network cable with a new one to verify that the netwo rk cabl e is i n good conditio n.
3. Replace the local port with a new one to verify that the local port is operating correctly.
4. Replace the peer port with a new one to verify that the peer port is operating correctly.
5. If the problem persists, contact Hewlett Packard Enterprise Support.
Speed/duplex match
on local and peer port?
No
Yes
No
Yes
No
Yes
Yes
No
No
Yes
Yes
No
No Yes
Yes
No
Contact the support
A copper port failed to come up
End
Replace peer port Resolved?
Network cable correct?
Local port
operating correctly?
Replace local port
Replace network
cable
Configure matching
speed/duplex
Resolved?
Resolved?
Resolved?
Peer port
operating correctly?
Page 24

21
Related commands
This section lists the commands that you might use for troubleshooting ports.
Command Remarks
display diagnostic-information
Displays or saves running status data for
multiple feature modules.
display interface brief
Displays brief interface information.
display transceiver alarm interface
Displays alarms present on transceiver
modules.
display transceiver interface
Displays key parameters of the transceiver
module installed in an interface.
Page 25

22
Troubleshooting other problems
Layer 2 forwarding failure
Symptom
Layer 2 packet loss occurs when the switch forwards packets to a peer on the same network
segment and in the same VLAN.
Troubleshooting flowchart
Figure 7 Troubleshooting a Layer 2 packet loss failure
Solution
To resolve the problem:
Incoming error packets?
No
Yes
Yes
Troubleshoot the
problem
End
No
Yes
Layer 2 packet loss
Packets filtered by
ACLs or QoS policies?
Troubleshoot the
problem
Port blocked?
No
Yes
Port misconfigurations?
No
Locate and modify
misconfigurations
Yes
Port congestion?
No
Troubleshoot the
problem
Yes
Resolved?
No
No
No
No
No
Yes
Yes
Yes
Yes
Resolved?
Resolved?
Resolved?
Resolved?
Contact the support
Troubleshoot the
problem
Page 26

23
1. Verify that no error packets have been received on the local port:
a. Execute the display interface command and check for error packets.
<Sysname> display interface Ten-GigabitEthernet1/0/36
GigabitEthernet1/0/25
Current state: UP
Line protocol state: UP
IP Packet Frame Type: PKTFMT_ETHNT_2, Hardware Address: 5cdd-70b1-81a8
……
Last 300 seconds input: 2 packets/sec 427 bytes/sec 0%
Last 300 seconds output: 0 packets/sec 64 bytes/sec 0%
Input (total): 140552 packets, 20207903 bytes
4351 unicasts, 72938 broadcasts, 63263 multicasts, 0 pauses
Input (normal): 140552 packets, - bytes
4351 unicasts, 72938 broadcasts, 63263 multicasts, 0 pauses
Input: 0 input errors, 0 runts, 0 giants, 0 throttles
0 CRC, 0 frame, - overruns, 0 aborts
- ignored, - parity errors
Output (total): 5238 packets, 703647 bytes
3871 unicasts, 2 broadcasts, 1365 multicasts, 0 pauses
Output (normal): 5238 packets, - bytes
3871 unicasts, 2 broadcasts, 1365 multicasts, 0 pauses
Output: 0 output errors, - underruns, - buffer failures
0 aborts, 0 deferred, 0 collisions, 0 late collisions
0 lost carrier, - no carrier
b. If the statistics are not zero, the following failures might occur:
− Interface hardware failure—To test the failure, connect the cable that is connected to
the local port to a correctly operating port (for example, Port A) with the same
configurations as the local port. If Port A forwards traffic correctly, you can determine
that the hardware of the local port fails. In this event, you must replace the local port with
a port that operates correctly.
− Transceiver module, fiber, or twisted pair failure—To test and resolve the failure,
replace the transceiver module, fiber, or twisted pair.
− Inconsistent configurations—Verify that the configuration s (in clu ding speed and
duplex mode) of the peer are consistent with the local port. If they are inconsistent,
modify the configurations of the local port.
c. If the problem persists, contact Hewlett Packard Enterprise Support.
When you contact Hewlett Packard Enterprise Support, provide the following diagnostic
information if packet loss occurs on the chip port with which the interface is associated:
# Execute the debug port map slot 1 command in probe view to identify the chip port with
which the interface is associated.
[Sysname-probe]debug port map slot 1
[Interface] [Unit] [Port] [Name] [Combo?] [Active?] [IfIndex] [MID] [Link]
==============================================================================
=
GE1/0/1 0 18 ge16 no no 0x1 1 up
GE1/0/2 0 19 ge17 no no 0x2 1 down
GE1/0/3 0 20 ge18 no no 0x3 1 down
GE1/0/4 0 21 ge19 no no 0x4 1 down
Page 27

24
GE1/0/5 0 22 ge20 no no 0x5 1 down
GE1/0/6 0 23 ge21 no no 0x6 1 down
GE1/0/7 0 24 ge22 no no 0x7 1 down
GE1/0/8 0 25 ge23 no no 0x8 1 down
GE1/0/9 0 2 ge0 no no 0x9 1 down
GE1/0/10 0 3 ge1 no no 0xa 1 down
GE1/0/11 0 4 ge2 no no 0xb 1 down
GE1/0/12 0 5 ge3 no no 0xc 1 down
GE1/0/13 0 6 ge4 no no 0xd 1 down
GE1/0/14 0 7 ge5 no no 0xe 1 down
GE1/0/15 0 8 ge6 no no 0xf 1 down
GE1/0/16 0 9 ge7 no no 0x10 1 down
GE1/0/17 0 10 ge8 no no 0x11 1 down
GE1/0/18 0 11 ge9 no no 0x12 1 down
GE1/0/19 0 12 ge10 no no 0x13 1 down
The output shows that GigabitEthernet 1/0/1 is associated with chip port ge16.
# Execute the bcm slot 1 0 chip show/c/ge16 command to check the RDBGC and TDBGC
fields for Rx and Tx dropped packet statistics, respectively. The statistics displayed were
generated between the most recent and the current execution of the command. To view the
change in dropped packet statistics, execute the command at least two times.
[Sysname-probe]bcm slot 1 chip 0 show/c/ge16
RDBGC3.ge16 : 2 +2 3/s
GRMCA.ge16 : 1 +1 1/s
GRBCA.ge16 : 5 +5 3/s
GR64.ge16 : 5 +5 3/s
GR127.ge16 : 1 +1 1/s
GRPKT.ge16 : 6 +6 5/s
GRBYT.ge16 : 434 +434 465/s
GRPOK.ge16 : 6 +6 5/s
GTBCA.ge16 : 2 +2
GT64.ge16 : 2 +2
GTPKT.ge16 : 2 +2
GTBYT.ge16 : 128 +128
GTPOK.ge16 : 2 +2
PERQ_PKT(0).ge16 : 2 +2
PERQ_BYTE(0).ge16 : 128 +128
2. Verify that packets are not mistakenly filtered out by ACLs:
a. Examine the ACL and QoS policy configurations for packet filtering on the port, on the VLAN
of the port, or globally. If packets are mistakenly filtered out, modify the ACL or QoS policy
configuration.
− To display the ACL configuration on the port for packet filtering, execute the display
packet-filter command.
− To display the QoS policy configuration on the port, execute the display qos policy
command.
− To display the QoS policy configuration on the VLAN of the port, execute the display
qos vlan-policy command.
− To display the global QoS policy configuration, execute the display qos policy global
command.
b. Verify that packets are not filtered out by automatically created ACLs.
Page 28

25
− The IP source guard feature creates ACLs automatically.
Execute the display this command in Ethernet interface view to verify that the ip
source binding or ip verify source command is configured on the port. To display
source guard binding entries, execute the display ip source binding or display ipv6
source binding command. If the ip source binding command or ip verify source
command is configured but the packets match no entry, further troubleshoot the problem
based on the way the binding entries are created.
− The portal authentication creates ACLs automatically.
If a user does not pass portal authentication, packets are discarded.
Execute the display portal interface command to display portal configuration on a
VLAN interface. Determine whether to disable portal authentication as required. To
disable portal authentication, execute the undo portal enable command in VLAN
interface view.
− The EAD assistant feature creates ACLs automatically.
The EAD assistant feature discards packets for a user who fails authenticatio n when the
user accesses an IP address not in the free IP segment.
Execute the display dot1x command to verify that the EAD assistant feature is enabled.
If the EAD assistant feature is enabled, identify whether the user fails the authentication
and accesses an IP address not in the free IP segment.
− MFF creates ACLs automatically.
Execute the display mac-forced-forwarding vlan command to display MFF
information for a VLAN. If no gateway information is displayed, verify that the ARP
snooping or DHCP snooping is configured correctly based on the MFF mode.
3. Verify that the port is not blocked:
{ Execute the display stp brief command to verify that STP does not set the state of the port
to discarding. When the port is in discarding state, it cannot forward traffic. As a best
practice, disable STP on the port, or configure the port as an edge port if the port is
connected to a terminal device.
{ If the port belongs to an aggregation group, execute the display link-aggregati on verbose
command to identify the port status. When the port is an Unselected port, it cannot forward
traffic. Locate the reasons why the port is in Unselected state. For example, the attribute
configurations of the port are different from the configurations of the reference port.
{ If the port belongs to a smart link group, execute the display smart-link group command to
verify the port status. The port cannot forward packets if its state is standby or down. If the
port is standby , configure the port as a primary port. If the port is down, verify the causes and
resolve the problem as required. A port might go down if the uplink device is configured with
the monitor link function, the port is shut down, or the link fails.
4. Examine the following configurations that might cause packet loss:
{ VLAN configuration—Execute the display this command in Ethernet interface view to
verify that the port is in the VLAN of the packets. If it is not, add the port to the VLAN.
{ Blackhole MAC address entries—Execute the display mac-address blackhole
command to display blackhole MAC address entries. If the packets are discarded because
they match a blackhole MAC address entry, delete the entry. To delete the blackhole MAC
address entry, execute the undo mac-address blackhole mac-address vlan vlan-id
command.
{ Rate limit—Execute the display qos lr interface command to display the rate limit
configuration on the port. If rate limit is configured on the port, make sure the committed
information rate (CIR) and the committed burst size (CBS) are appropriate. To adjust the
CIR and CBS values, execute the qos lr { inbound | outbound } cir
committed-information-rate [ cbs committed-burst-size ] command.
{ Storm suppression—Execute the display this command in Ethernet interface view to
display the configuration of storm suppression. Storm suppression includes broadcast
Page 29

26
suppression, multicast suppression, and unknown unicast suppression. To adjust the
suppression thresholds, execute the broadcast-suppression, multicast-suppression,
and unicast-suppression commands.
5. Verify that no congestion occurs by using the display qos queue interface command.
If congestion occurs, locate and resolve the problem by referencing related congestion
management documents.
6. If the problem persists, contact Hewlett Packard Enterprise Support.
Related commands
This section lists the commands that you might use for troubleshooting Layer 2 forwarding failure.
Command Description
display dot1x
Displays session information, statistics, and
configurations about 802.1X.
display interface
Displays Ethernet interface information.
display ip source binding
Displays IPv4 source guard binding entries.
display ipv6 source binding
Displays IPv6 source guard binding entries.
display link-aggregation verbose
Displays detailed information about the
aggregation groups that correspond to the
aggregate interfaces.
display mac-address blackhole
Displays blackhole MAC address entries.
display mac-forced-forwarding vlan
Displays MFF information for a VLAN.
display packet-filter
Displays whether an ACL has been successfully
applied to an interface for packet filtering.
display portal interface
Displays the portal configuration information.
display qos lr interface
Displays the rate limit configuration and statistics
on a specified interface or all the interfaces.
display qos policy
Displays user-defined QoS policy configuration
information.
display qos policy global
Displays information about global QoS policies.
display qos policy interface
Displays information about the QoS policies
applied to an interface or all interfaces.
display qos queue interface
Displays traffic statistics collected for an interface
on a per-queue basis.
display qos vlan-policy
Displays information about QoS policies applied to
VLANs.
display smart-link group
Displays smart link group information.
display this
Displays the running configuration in the current
view.
Page 30

27
Layer 3 forwarding failure
Symptom
Packet loss occurs when the switch forwards packets to a different network.
Troubleshooting flowchart
Figure 8 Troubleshooting a Layer 3 forwarding failure
Solution
To resolve the problem:
1. Verify that the port is not faulty (due to hardware or configuration problems).
If the port is faulty, follow the solution in "Layer 2 forwarding failure" to troubl
eshoot the problem.
2. Verify that ARP entries are correct:
a. Execute the display arp command to verify that ARP entries are correct.
− If incorrect ARP entries exist, execute the debugging arp packet command to locate
the problem.
− If the switch learns no ARP entries, you can execute the arp static command to
configure static ARP entrie s.
b. Execute the display mac-address com mand to verify that the output interfaces in the MAC
address entries and ARP entries are the same by using the display mac-address
command.
If the output interfaces are not the same, execute the reset command to clear the ARP
entries. Then the switch can learn ARP entries again.
3. Verify that route entries are correct:
The port is faulty?
No
Yes
Yes
Troubleshoot the
port
End
No
Yes
Layer 3 packet loss
ARP entries are correct?
Troubleshoot ARP
entries
Route entries are correct?
No
Yes
Resolved?
No
No
No
Yes
Yes
Resolved?
Resolved?
Contact the support
Troubleshoot
route entries
Page 31

28
a. Execute the display ip routing-table command to verify that route entries are correct.
If incorrect route entries exist, troubleshoot the protocol that learns the route entries.
b. Execute the display fib command to verify that the output interfaces in the FIB entries and
route entries are the same.
If the output interfaces are not the same, execute the reset command to clear the route
entries. Then the switch can learn route entries again.
4. If the problem persists, contact Hewlett Packard Enterprise Support.
Related commands
This section lists the commands that you might use for troubleshooting Layer 3 forwarding failure.
Command Description
debugging arp packet
Enables ARP packet debugging.
display arp
Displays ARP entries.
display ip routing-table
Displays brief information about active routes in the routing
table.
Protocol flapping
Symptom
The switch cannot send or receive protocol packets.
Page 32

29
Troubleshooting flowchart
Figure 9 Troubleshooting protocol flapping
Solution
To resolve the problem:
1. Verify that Layer 2 is operating correctly, as described in "Layer 2 forwarding failure."
2. Verify that Layer 3 is ope
rating correctly, as described in "Layer 3 forwarding failure."
3. Execute the debug rx
tx softcar show 1 command in probe view to check for software-related
packet loss.
[Sysname-probe] debug rxtx softcar slot 1
ID Type RcvPps Rcv_All DisPkt_All Pps Dyn Swi Hash ACLmax
0 ROOT 0 0 0 300 S On SMAC 0
1 ISIS 0 0 0 200 D On SMAC 8
2 ESIS 0 0 0 100 S On SMAC 8
3 CLNP 0 0 0 100 S On SMAC 8
4 VRRP 0 0 0 1024 S On SMAC 8
5 UNKNOWN_IPV4MC 0 0 0 100 S On SMAC 8
6 UNKNOWN_IPV6MC 0 0 0 100 S On SMAC 8
7 IPV4_MC_RIP 0 0 0 150 D On SMAC 8
8 IPV4_BC_RIP 0 0 0 150 D On SMAC 8
9 MCAST_NTP 0 0 0 100 S On SMAC 8
10 BCAST_NTP 0 0 0 100 S On SMAC 8
4. If the problem persists, contact Hewlett Packard Enterprise Support.
Layer 2 packet loss occurs?
No
Yes
Yes
Troubleshoot the
problem
End
No
Yes
Layer 3 protocol flapping
Layer 3 packet loss occurs?
Troubleshoot the
problem
Software-related
packet loss occurs?
No
Yes
Resolved?
No
No
Yes
Resolved?
Contact the support
Collect diagnostic
information
Page 33

30
When you contact Hewlett Packard Enterprise Support, provide diagnostic information if
software-related packet loss occurred.
 Loading...