

Page 1

HP 8935 CDMA Cellular/PCS Bas e St ati o n
Main Menu
Test Set
Reference Guide
Firmware Version: A.01.00 and above
HP Part N u mber E6380- 90019
Revision A
Printed in U.S.A.
November 1997
© Copyright 1997 Hewlett-Packard Company
Page 2

Notice
Main Menu
Information contained in this document is subject to change without
notice.
All Rights Reserved. Reproduction, adaptation, or translation without
prior written permission is prohibited, except as allowed under the
copyright laws.
This material may be reproduced by or for the U.S. Government
pursuant to the Copyright License under the clause at DFARS
52.227-7013 (APR 1988).
2
Page 3

Contents
Main Menu
Product Description. . . . . . . . . . . . . . . . . . . . . . . . . . . . . . . . . . . . . . . . 19
In This Book. . . . . . . . . . . . . . . . . . . . . . . . . . . . . . . . . . . . . . . . . . . . . . 20
Conventions Used in this Book. . . . . . . . . . . . . . . . . . . . . . . . . . . . . . . 21
1. Getting Started
Before Connecting a Radio . . . . . . . . . . . . . . . . . . . . . . . . . . . . . . . . . . 24
Changing the Test Set’s Display. . . . . . . . . . . . . . . . . . . . . . . . . . . . . . 25
Changing the Measurement Screen . . . . . . . . . . . . . . . . . . . . . . . . . 25
Changing the Control Fields . . . . . . . . . . . . . . . . . . . . . . . . . . . . . . . 26
How do I Verify that the Test Set is Operating Properly? . . . . . . . . . 31
Instrument Quick Check . . . . . . . . . . . . . . . . . . . . . . . . . . . . . . . . . . 31
2. Operating Overview
Displaying CDMA Measurements . . . . . . . . . . . . . . . . . . . . . . . . . . . . 34
Channel Power, Rho, EVM, Average Power. . . . . . . . . . . . . . . . . . . 34
Code Domain Measurements (Power, Timing, Phase). . . . . . . . . . . 35
Displaying Analog Measurements . . . . . . . . . . . . . . . . . . . . . . . . . . . . 36
RF Measurements . . . . . . . . . . . . . . . . . . . . . . . . . . . . . . . . . . . . . . . 36
Displaying AF Measurements . . . . . . . . . . . . . . . . . . . . . . . . . . . . . . 37
Displaying Analog Measurement Results on a Meter Scale . . . . . . 39
Using Channel Numbers to Set Analyzer and Generator Frequencies40
Calibrating the Channel Power Measurement . . . . . . . . . . . . . . . . . . 41
Changing the Increment or Decrement Setting. . . . . . . . . . . . . . . . . . 42
Specifying An Increment Value for the Arrow Keys or Knob . . . . . 42
Using the Factor of 10 Increment/Decrement Keys . . . . . . . . . . . . . 42
Using Measurement Limit Indicators . . . . . . . . . . . . . . . . . . . . . . . . . 43
Setting A Measurement Reference. . . . . . . . . . . . . . . . . . . . . . . . . . . . 45
Averaging Measurements . . . . . . . . . . . . . . . . . . . . . . . . . . . . . . . . . . . 46
How the Test Set Averages Measurements . . . . . . . . . . . . . . . . . . . 46
Setting an RF Generator/Analyzer Offset . . . . . . . . . . . . . . . . . . . . . . 47
Saving and Recalling Instrument Se tups. . . . . . . . . . . . . . . . . . . . . . . 48
Register Names. . . . . . . . . . . . . . . . . . . . . . . . . . . . . . . . . . . . . . . . . . 49
Memory Considerations. . . . . . . . . . . . . . . . . . . . . . . . . . . . . . . . . . . 50
Instrument Hardware Changes. . . . . . . . . . . . . . . . . . . . . . . . . . . . . 50
Using USER Keys . . . . . . . . . . . . . . . . . . . . . . . . . . . . . . . . . . . . . . . . . 51
Using Pre-Defined USER Keys . . . . . . . . . . . . . . . . . . . . . . . . . . . . . 51
Assigning and Releasing USER Keys . . . . . . . . . . . . . . . . . . . . . . . . 52
Replacing Batteries . . . . . . . . . . . . . . . . . . . . . . . . . . . . . . . . . . . . . . . . 53
3. Overview of the Test Set’s
Built-In Tools
Using RF Tools Program. . . . . . . . . . . . . . . . . . . . . . . . . . . . . . . . . . . . 56
Swept Gain . . . . . . . . . . . . . . . . . . . . . . . . . . . . . . . . . . . . . . . . . . . . . 58
Discrete Freq Insertion Loss . . . . . . . . . . . . . . . . . . . . . . . . . . . . . . . 59
Swept Insertion Loss . . . . . . . . . . . . . . . . . . . . . . . . . . . . . . . . . . . . . 59
Swept Return Loss . . . . . . . . . . . . . . . . . . . . . . . . . . . . . . . . . . . . . . . 60
Cable Fault . . . . . . . . . . . . . . . . . . . . . . . . . . . . . . . . . . . . . . . . . . . . . 62
Replot Data Files . . . . . . . . . . . . . . . . . . . . . . . . . . . . . . . . . . . . . . . . 65
3
Page 4

Contents
Main Menu
Transfer Stored Data . . . . . . . . . . . . . . . . . . . . . . . . . . . . . . . . . . . . . 65
SA (spectrum analyzer) Self Calibration ON/OFF. . . . . . . . . . . . . . 65
Catalog PC (Memory) Card . . . . . . . . . . . . . . . . . . . . . . . . . . . . . . . . 66
Set Up Printer/Data Collection . . . . . . . . . . . . . . . . . . . . . . . . . . . . . 66
Using the Code Domain Analyzer. . . . . . . . . . . . . . . . . . . . . . . . . . . . . 67
Selecting the Code Domain Analyzer’s Controls Menus . . . . . . . . . 67
Using the Spectrum Analyzer. . . . . . . . . . . . . . . . . . . . . . . . . . . . . . . . 68
Automatic Calibration . . . . . . . . . . . . . . . . . . . . . . . . . . . . . . . . . . . . 68
Setting Resolution Bandwidth and Sweep Rate. . . . . . . . . . . . . . . . 68
Selecting the Spectrum Analyzer’s Controls Menus. . . . . . . . . . . . . 69
Using the Voltmeter and Audio Frequency Counter. . . . . . . . . . . . . . 70
Using the Oscilloscope (Scope) . . . . . . . . . . . . . . . . . . . . . . . . . . . . . . . 71
Selecting the Oscillo sc op e’s Inp u t . . . . . . . . . . . . . . . . . . . . . . . . . . . 72
Selecting the Oscillo sc op e’s F ilte rs . . . . . . . . . . . . . . . . . . . . . . . . . . 72
Triggering the Osc illo sc ope . . . . . . . . . . . . . . . . . . . . . . . . . . . . . . . . 73
Using the Oscilloscop e ’ s Mark er . . . . . . . . . . . . . . . . . . . . . . . . . . . . 73
Using IB_UTIL Programs. . . . . . . . . . . . . . . . . . . . . . . . . . . . . . . . . . . 74
COPY_PL . . . . . . . . . . . . . . . . . . . . . . . . . . . . . . . . . . . . . . . . . . . . . . 74
FILE_XFER . . . . . . . . . . . . . . . . . . . . . . . . . . . . . . . . . . . . . . . . . . . . 74
RAM_USAGE . . . . . . . . . . . . . . . . . . . . . . . . . . . . . . . . . . . . . . . . . . . 74
Securing a Test Procedure. . . . . . . . . . . . . . . . . . . . . . . . . . . . . . . . . . . 75
Clearing RAM . . . . . . . . . . . . . . . . . . . . . . . . . . . . . . . . . . . . . . . . . . . . 76
Using the LISTOPTS (list options) Program. . . . . . . . . . . . . . . . . . . . 77
Using the DEMO Program . . . . . . . . . . . . . . . . . . . . . . . . . . . . . . . . . . 78
Using the ST_PLT (store or plot) Program . . . . . . . . . . . . . . . . . . . . . 79
4. CDMA Measurements - Screens
and Contr ol Fields
CDMA Measurements. . . . . . . . . . . . . . . . . . . . . . . . . . . . . . . . . . . . . . 82
Average Power Measurements . . . . . . . . . . . . . . . . . . . . . . . . . . . . . 82
Channel Power Measurements . . . . . . . . . . . . . . . . . . . . . . . . . . . . . 83
Rho Measurements. . . . . . . . . . . . . . . . . . . . . . . . . . . . . . . . . . . . . . . 84
Error Vector Magnitude (EVM) Measurements . . . . . . . . . . . . . . . . 88
Code Domain Measurements. . . . . . . . . . . . . . . . . . . . . . . . . . . . . . . 89
Control Fields for CDMA Measurements. . . . . . . . . . . . . . . . . . . . . . . 93
ADCfs or ADC FS. . . . . . . . . . . . . . . . . . . . . . . . . . . . . . . . . . . . . . . . 93
Amplitude . . . . . . . . . . . . . . . . . . . . . . . . . . . . . . . . . . . . . . . . . . . . . . 93
Analyzer (CDMA analyzer) . . . . . . . . . . . . . . . . . . . . . . . . . . . . . . . . 94
Analyzer (code domain analyzer). . . . . . . . . . . . . . . . . . . . . . . . . . . . 94
Anl Dir. . . . . . . . . . . . . . . . . . . . . . . . . . . . . . . . . . . . . . . . . . . . . . . . . 95
Anl Special . . . . . . . . . . . . . . . . . . . . . . . . . . . . . . . . . . . . . . . . . . . . . 95
Auto Zero . . . . . . . . . . . . . . . . . . . . . . . . . . . . . . . . . . . . . . . . . . . . . . . 95
Car FT. . . . . . . . . . . . . . . . . . . . . . . . . . . . . . . . . . . . . . . . . . . . . . . . . 96
Chn Pwr Cal . . . . . . . . . . . . . . . . . . . . . . . . . . . . . . . . . . . . . . . . . . . . 96
Controls. . . . . . . . . . . . . . . . . . . . . . . . . . . . . . . . . . . . . . . . . . . . . . . . 97
CW RF Path . . . . . . . . . . . . . . . . . . . . . . . . . . . . . . . . . . . . . . . . . . . . 98
Data Rate . . . . . . . . . . . . . . . . . . . . . . . . . . . . . . . . . . . . . . . . . . . . . . 98
Data Source. . . . . . . . . . . . . . . . . . . . . . . . . . . . . . . . . . . . . . . . . . . . . 99
Even Sec In. . . . . . . . . . . . . . . . . . . . . . . . . . . . . . . . . . . . . . . . . . . . 100
4
Page 5

Contents
Main Menu
Freq Err. . . . . . . . . . . . . . . . . . . . . . . . . . . . . . . . . . . . . . . . . . . . . . . 100
Gain. . . . . . . . . . . . . . . . . . . . . . . . . . . . . . . . . . . . . . . . . . . . . . . . . . 100
Gen Dir . . . . . . . . . . . . . . . . . . . . . . . . . . . . . . . . . . . . . . . . . . . . . . . 101
Gen Mode . . . . . . . . . . . . . . . . . . . . . . . . . . . . . . . . . . . . . . . . . . . . . 101
Gen Special . . . . . . . . . . . . . . . . . . . . . . . . . . . . . . . . . . . . . . . . . . . . 102
Input Atten . . . . . . . . . . . . . . . . . . . . . . . . . . . . . . . . . . . . . . . . . . . . 102
Input Port . . . . . . . . . . . . . . . . . . . . . . . . . . . . . . . . . . . . . . . . . . . . . 103
Lvl . . . . . . . . . . . . . . . . . . . . . . . . . . . . . . . . . . . . . . . . . . . . . . . . . . . 103
Meas Intvl. . . . . . . . . . . . . . . . . . . . . . . . . . . . . . . . . . . . . . . . . . . . . 103
Measurement . . . . . . . . . . . . . . . . . . . . . . . . . . . . . . . . . . . . . . . . . . 104
Num Avgs . . . . . . . . . . . . . . . . . . . . . . . . . . . . . . . . . . . . . . . . . . . . . 104
Ofs Trnsfer . . . . . . . . . . . . . . . . . . . . . . . . . . . . . . . . . . . . . . . . . . . . 105
Output Port. . . . . . . . . . . . . . . . . . . . . . . . . . . . . . . . . . . . . . . . . . . . 105
PN Offset. . . . . . . . . . . . . . . . . . . . . . . . . . . . . . . . . . . . . . . . . . . . . . 106
Pwr Gain. . . . . . . . . . . . . . . . . . . . . . . . . . . . . . . . . . . . . . . . . . . . . . 106
Pwr Intvl. . . . . . . . . . . . . . . . . . . . . . . . . . . . . . . . . . . . . . . . . . . . . . 107
Pwr Scale. . . . . . . . . . . . . . . . . . . . . . . . . . . . . . . . . . . . . . . . . . . . . . 107
Pwr Zero . . . . . . . . . . . . . . . . . . . . . . . . . . . . . . . . . . . . . . . . . . . . . . 107
Qual Event . . . . . . . . . . . . . . . . . . . . . . . . . . . . . . . . . . . . . . . . . . . . 108
RF Channel . . . . . . . . . . . . . . . . . . . . . . . . . . . . . . . . . . . . . . . . . . . . 109
RF Gen Freq . . . . . . . . . . . . . . . . . . . . . . . . . . . . . . . . . . . . . . . . . . . 109
RF In/Ant . . . . . . . . . . . . . . . . . . . . . . . . . . . . . . . . . . . . . . . . . . . . . 110
Threshold . . . . . . . . . . . . . . . . . . . . . . . . . . . . . . . . . . . . . . . . . . . . . 110
Time Offset . . . . . . . . . . . . . . . . . . . . . . . . . . . . . . . . . . . . . . . . . . . . 111
TmOfs . . . . . . . . . . . . . . . . . . . . . . . . . . . . . . . . . . . . . . . . . . . . . . . . 111
Trig Event. . . . . . . . . . . . . . . . . . . . . . . . . . . . . . . . . . . . . . . . . . . . . 112
Tune Freq . . . . . . . . . . . . . . . . . . . . . . . . . . . . . . . . . . . . . . . . . . . . . 112
Walsh Chan. . . . . . . . . . . . . . . . . . . . . . . . . . . . . . . . . . . . . . . . . . . . 113
5. Analog Measurements - Screens
and Contr ol Fields
Analog Measurements. . . . . . . . . . . . . . . . . . . . . . . . . . . . . . . . . . . . . 116
AC Level Measurement . . . . . . . . . . . . . . . . . . . . . . . . . . . . . . . . . . 116
AM Depth Measurement . . . . . . . . . . . . . . . . . . . . . . . . . . . . . . . . . 116
AF Freq Measurement. . . . . . . . . . . . . . . . . . . . . . . . . . . . . . . . . . . 117
DC Level Measurement . . . . . . . . . . . . . . . . . . . . . . . . . . . . . . . . . . 117
Distn (Distortion) Measurement . . . . . . . . . . . . . . . . . . . . . . . . . . . 118
FM Deviation Measurement . . . . . . . . . . . . . . . . . . . . . . . . . . . . . . 118
Frequency Measurement . . . . . . . . . . . . . . . . . . . . . . . . . . . . . . . . . 119
Frequency Error Measurement . . . . . . . . . . . . . . . . . . . . . . . . . . . . 119
TX Power Measurement. . . . . . . . . . . . . . . . . . . . . . . . . . . . . . . . . . 120
FM Deviation Measurement . . . . . . . . . . . . . . . . . . . . . . . . . . . . . . 121
AF Freq (Audio Frequency) Measurement . . . . . . . . . . . . . . . . . . . 121
SINAD Measurement. . . . . . . . . . . . . . . . . . . . . . . . . . . . . . . . . . . . 122
SNR Measurement. . . . . . . . . . . . . . . . . . . . . . . . . . . . . . . . . . . . . . 122
Control Fields for Analog Measurements. . . . . . . . . . . . . . . . . . . . . . 123
AF Anl In. . . . . . . . . . . . . . . . . . . . . . . . . . . . . . . . . . . . . . . . . . . . . . 123
AF Cnt Gate . . . . . . . . . . . . . . . . . . . . . . . . . . . . . . . . . . . . . . . . . . . 123
AFGen1 Freq. . . . . . . . . . . . . . . . . . . . . . . . . . . . . . . . . . . . . . . . . . . 124
5
Page 6

Contents
Main Menu
AFGen1 To . . . . . . . . . . . . . . . . . . . . . . . . . . . . . . . . . . . . . . . . . . . . 124
AFGen2 Freq. . . . . . . . . . . . . . . . . . . . . . . . . . . . . . . . . . . . . . . . . . . 125
AFGen2 To . . . . . . . . . . . . . . . . . . . . . . . . . . . . . . . . . . . . . . . . . . . . 125
Amplitude . . . . . . . . . . . . . . . . . . . . . . . . . . . . . . . . . . . . . . . . . . . . . 126
Atten Hold. . . . . . . . . . . . . . . . . . . . . . . . . . . . . . . . . . . . . . . . . . . . . 126
Audio In Lo . . . . . . . . . . . . . . . . . . . . . . . . . . . . . . . . . . . . . . . . . . . . 127
Audio Out . . . . . . . . . . . . . . . . . . . . . . . . . . . . . . . . . . . . . . . . . . . . . 127
Auto/Norm. . . . . . . . . . . . . . . . . . . . . . . . . . . . . . . . . . . . . . . . . . . . . 127
Auto Zero . . . . . . . . . . . . . . . . . . . . . . . . . . . . . . . . . . . . . . . . . . . . . . 128
Center Freq. . . . . . . . . . . . . . . . . . . . . . . . . . . . . . . . . . . . . . . . . . . . 128
Controls. . . . . . . . . . . . . . . . . . . . . . . . . . . . . . . . . . . . . . . . . . . . . . . 128
Cont/Single . . . . . . . . . . . . . . . . . . . . . . . . . . . . . . . . . . . . . . . . . . . . 128
De-Emp Gain . . . . . . . . . . . . . . . . . . . . . . . . . . . . . . . . . . . . . . . . . . 129
De-Emphasis. . . . . . . . . . . . . . . . . . . . . . . . . . . . . . . . . . . . . . . . . . . 129
Detector. . . . . . . . . . . . . . . . . . . . . . . . . . . . . . . . . . . . . . . . . . . . . . . 130
Ext Load R . . . . . . . . . . . . . . . . . . . . . . . . . . . . . . . . . . . . . . . . . . . . 131
Filter 1. . . . . . . . . . . . . . . . . . . . . . . . . . . . . . . . . . . . . . . . . . . . . . . . 131
Filter 2. . . . . . . . . . . . . . . . . . . . . . . . . . . . . . . . . . . . . . . . . . . . . . . . 132
FM Coupling . . . . . . . . . . . . . . . . . . . . . . . . . . . . . . . . . . . . . . . . . . . 133
Freq (marker) . . . . . . . . . . . . . . . . . . . . . . . . . . . . . . . . . . . . . . . . . . 133
Gain Cntl. . . . . . . . . . . . . . . . . . . . . . . . . . . . . . . . . . . . . . . . . . . . . . 134
IF Filter. . . . . . . . . . . . . . . . . . . . . . . . . . . . . . . . . . . . . . . . . . . . . . . 135
Input Atten . . . . . . . . . . . . . . . . . . . . . . . . . . . . . . . . . . . . . . . . . . . . 135
Input Gain. . . . . . . . . . . . . . . . . . . . . . . . . . . . . . . . . . . . . . . . . . . . . 136
Input Port . . . . . . . . . . . . . . . . . . . . . . . . . . . . . . . . . . . . . . . . . . . . . 136
Internal. . . . . . . . . . . . . . . . . . . . . . . . . . . . . . . . . . . . . . . . . . . . . . . 137
Level (div) . . . . . . . . . . . . . . . . . . . . . . . . . . . . . . . . . . . . . . . . . . . . . 137
Lvl (marker) . . . . . . . . . . . . . . . . . . . . . . . . . . . . . . . . . . . . . . . . . . . 138
Marker To Peak+ . . . . . . . . . . . . . . . . . . . . . . . . . . . . . . . . . . . . . . . 139
Marker To Peak- . . . . . . . . . . . . . . . . . . . . . . . . . . . . . . . . . . . . . . . . 139
Marker To (spectrum analyzer). . . . . . . . . . . . . . . . . . . . . . . . . . . . 139
Mod In To . . . . . . . . . . . . . . . . . . . . . . . . . . . . . . . . . . . . . . . . . . . . . 140
No Pk/Avg. . . . . . . . . . . . . . . . . . . . . . . . . . . . . . . . . . . . . . . . . . . . . 140
Normalize . . . . . . . . . . . . . . . . . . . . . . . . . . . . . . . . . . . . . . . . . . . . . 141
Notch Freq . . . . . . . . . . . . . . . . . . . . . . . . . . . . . . . . . . . . . . . . . . . . 141
Notch Gain . . . . . . . . . . . . . . . . . . . . . . . . . . . . . . . . . . . . . . . . . . . . 142
Offset Freq . . . . . . . . . . . . . . . . . . . . . . . . . . . . . . . . . . . . . . . . . . . . 142
Output Port. . . . . . . . . . . . . . . . . . . . . . . . . . . . . . . . . . . . . . . . . . . . 143
Pk Det To . . . . . . . . . . . . . . . . . . . . . . . . . . . . . . . . . . . . . . . . . . . . . 143
Port/Sweep . . . . . . . . . . . . . . . . . . . . . . . . . . . . . . . . . . . . . . . . . . . . 144
Position . . . . . . . . . . . . . . . . . . . . . . . . . . . . . . . . . . . . . . . . . . . . . . . 145
Ref Level. . . . . . . . . . . . . . . . . . . . . . . . . . . . . . . . . . . . . . . . . . . . . . 146
Reset . . . . . . . . . . . . . . . . . . . . . . . . . . . . . . . . . . . . . . . . . . . . . . . . . 146
RF Channel . . . . . . . . . . . . . . . . . . . . . . . . . . . . . . . . . . . . . . . . . . . . 147
RF Cnt Gate . . . . . . . . . . . . . . . . . . . . . . . . . . . . . . . . . . . . . . . . . . . 147
RF Gen Freq . . . . . . . . . . . . . . . . . . . . . . . . . . . . . . . . . . . . . . . . . . . 148
RF In/Ant . . . . . . . . . . . . . . . . . . . . . . . . . . . . . . . . . . . . . . . . . . . . . 148
Scope To . . . . . . . . . . . . . . . . . . . . . . . . . . . . . . . . . . . . . . . . . . . . . . 149
Sensitivity (RF analyzer). . . . . . . . . . . . . . . . . . . . . . . . . . . . . . . . . 150
6
Page 7

Contents
Main Menu
Sensitivity (spectrum analyzer). . . . . . . . . . . . . . . . . . . . . . . . . . . . 150
Settling . . . . . . . . . . . . . . . . . . . . . . . . . . . . . . . . . . . . . . . . . . . . . . . 151
Span. . . . . . . . . . . . . . . . . . . . . . . . . . . . . . . . . . . . . . . . . . . . . . . . . . 151
Speaker ALC. . . . . . . . . . . . . . . . . . . . . . . . . . . . . . . . . . . . . . . . . . . 152
Speaker Vol. . . . . . . . . . . . . . . . . . . . . . . . . . . . . . . . . . . . . . . . . . . . 152
Squelch . . . . . . . . . . . . . . . . . . . . . . . . . . . . . . . . . . . . . . . . . . . . . . . 153
Time. . . . . . . . . . . . . . . . . . . . . . . . . . . . . . . . . . . . . . . . . . . . . . . . . . 154
Time/div . . . . . . . . . . . . . . . . . . . . . . . . . . . . . . . . . . . . . . . . . . . . . . 154
Track/Fixed. . . . . . . . . . . . . . . . . . . . . . . . . . . . . . . . . . . . . . . . . . . . 154
Trig-Delay. . . . . . . . . . . . . . . . . . . . . . . . . . . . . . . . . . . . . . . . . . . . . 155
Tune Freq . . . . . . . . . . . . . . . . . . . . . . . . . . . . . . . . . . . . . . . . . . . . . 156
TX Pwr Meas. . . . . . . . . . . . . . . . . . . . . . . . . . . . . . . . . . . . . . . . . . . 156
TX Pwr Zero . . . . . . . . . . . . . . . . . . . . . . . . . . . . . . . . . . . . . . . . . . . 157
Vert/div . . . . . . . . . . . . . . . . . . . . . . . . . . . . . . . . . . . . . . . . . . . . . . . 158
Vert Offset. . . . . . . . . . . . . . . . . . . . . . . . . . . . . . . . . . . . . . . . . . . . . 158
6. Configuration - Screens and Control Fields
Configuring the Instrument . . . . . . . . . . . . . . . . . . . . . . . . . . . . . . . . 160
Setting the Date and Time. . . . . . . . . . . . . . . . . . . . . . . . . . . . . . . . 160
Changing the Beeper’s Volume . . . . . . . . . . . . . . . . . . . . . . . . . . . . 160
Turning Off User Messages. . . . . . . . . . . . . . . . . . . . . . . . . . . . . . . 160
Configuring for Printing A Screen . . . . . . . . . . . . . . . . . . . . . . . . . . . 161
Printing a Screen . . . . . . . . . . . . . . . . . . . . . . . . . . . . . . . . . . . . . . . 161
Control Fields on the Configuration Screens. . . . . . . . . . . . . . . . . . . 162
Abort Print . . . . . . . . . . . . . . . . . . . . . . . . . . . . . . . . . . . . . . . . . . . . 162
Antenna In . . . . . . . . . . . . . . . . . . . . . . . . . . . . . . . . . . . . . . . . . . . . 162
Base Freq (User Defined) . . . . . . . . . . . . . . . . . . . . . . . . . . . . . . . . . 163
Beeper . . . . . . . . . . . . . . . . . . . . . . . . . . . . . . . . . . . . . . . . . . . . . . . . 164
Chan Space (User Defined) . . . . . . . . . . . . . . . . . . . . . . . . . . . . . . . 164
Data Length . . . . . . . . . . . . . . . . . . . . . . . . . . . . . . . . . . . . . . . . . . . 165
Date. . . . . . . . . . . . . . . . . . . . . . . . . . . . . . . . . . . . . . . . . . . . . . . . . . 165
Display User Messages . . . . . . . . . . . . . . . . . . . . . . . . . . . . . . . . . . 165
Duplex Out . . . . . . . . . . . . . . . . . . . . . . . . . . . . . . . . . . . . . . . . . . . . 166
Ext Ref In . . . . . . . . . . . . . . . . . . . . . . . . . . . . . . . . . . . . . . . . . . . . . 166
FF at End:. . . . . . . . . . . . . . . . . . . . . . . . . . . . . . . . . . . . . . . . . . . . . 167
FF at Start:. . . . . . . . . . . . . . . . . . . . . . . . . . . . . . . . . . . . . . . . . . . . 167
Firmware. . . . . . . . . . . . . . . . . . . . . . . . . . . . . . . . . . . . . . . . . . . . . . 167
Flow Control . . . . . . . . . . . . . . . . . . . . . . . . . . . . . . . . . . . . . . . . . . . 168
Frame Clock Output. . . . . . . . . . . . . . . . . . . . . . . . . . . . . . . . . . . . . 169
(Gen)-(Anl) . . . . . . . . . . . . . . . . . . . . . . . . . . . . . . . . . . . . . . . . . . . . 169
(Gen)-(Anl) (User Defined). . . . . . . . . . . . . . . . . . . . . . . . . . . . . . . . 169
HP-IB Adrs . . . . . . . . . . . . . . . . . . . . . . . . . . . . . . . . . . . . . . . . . . . . 170
IBASIC Echo. . . . . . . . . . . . . . . . . . . . . . . . . . . . . . . . . . . . . . . . . . . 170
Inst Echo. . . . . . . . . . . . . . . . . . . . . . . . . . . . . . . . . . . . . . . . . . . . . . 170
Lines/Page: . . . . . . . . . . . . . . . . . . . . . . . . . . . . . . . . . . . . . . . . . . . . 171
Mode . . . . . . . . . . . . . . . . . . . . . . . . . . . . . . . . . . . . . . . . . . . . . . . . . 171
Model: . . . . . . . . . . . . . . . . . . . . . . . . . . . . . . . . . . . . . . . . . . . . . . . . 171
Notch Coupl . . . . . . . . . . . . . . . . . . . . . . . . . . . . . . . . . . . . . . . . . . . 171
Opt CDMA TB . . . . . . . . . . . . . . . . . . . . . . . . . . . . . . . . . . . . . . . . . 172
7
Page 8

Contents
Main Menu
Parity. . . . . . . . . . . . . . . . . . . . . . . . . . . . . . . . . . . . . . . . . . . . . . . . . 172
Printer Port: . . . . . . . . . . . . . . . . . . . . . . . . . . . . . . . . . . . . . . . . . . . 172
Print Title:. . . . . . . . . . . . . . . . . . . . . . . . . . . . . . . . . . . . . . . . . . . . . 172
Range Hold . . . . . . . . . . . . . . . . . . . . . . . . . . . . . . . . . . . . . . . . . . . . 173
Ref Select. . . . . . . . . . . . . . . . . . . . . . . . . . . . . . . . . . . . . . . . . . . . . . 174
RF Chan Std. . . . . . . . . . . . . . . . . . . . . . . . . . . . . . . . . . . . . . . . . . . 175
RF Display . . . . . . . . . . . . . . . . . . . . . . . . . . . . . . . . . . . . . . . . . . . . 176
RF Gen Volts. . . . . . . . . . . . . . . . . . . . . . . . . . . . . . . . . . . . . . . . . . . 176
RF In/Out . . . . . . . . . . . . . . . . . . . . . . . . . . . . . . . . . . . . . . . . . . . . . 177
RF Level Offset. . . . . . . . . . . . . . . . . . . . . . . . . . . . . . . . . . . . . . . . . 178
RF Offset. . . . . . . . . . . . . . . . . . . . . . . . . . . . . . . . . . . . . . . . . . . . . . 178
Save/Recall . . . . . . . . . . . . . . . . . . . . . . . . . . . . . . . . . . . . . . . . . . . . 179
Serial Baud . . . . . . . . . . . . . . . . . . . . . . . . . . . . . . . . . . . . . . . . . . . . 180
Serial_9 In. . . . . . . . . . . . . . . . . . . . . . . . . . . . . . . . . . . . . . . . . . . . . 180
Serial No. . . . . . . . . . . . . . . . . . . . . . . . . . . . . . . . . . . . . . . . . . . . . . 180
Stop Length. . . . . . . . . . . . . . . . . . . . . . . . . . . . . . . . . . . . . . . . . . . . 181
Time. . . . . . . . . . . . . . . . . . . . . . . . . . . . . . . . . . . . . . . . . . . . . . . . . . 181
Total RAM. . . . . . . . . . . . . . . . . . . . . . . . . . . . . . . . . . . . . . . . . . . . . 181
7. Connectors
Connectors . . . . . . . . . . . . . . . . . . . . . . . . . . . . . . . . . . . . . . . . . . . . . . 184
10 MHz REF OUT . . . . . . . . . . . . . . . . . . . . . . . . . . . . . . . . . . . . . . 184
16 × CHIP CLOCK 19.6608 MHz OUT. . . . . . . . . . . . . . . . . . . . . . 184
ANALOG MODULATION IN . . . . . . . . . . . . . . . . . . . . . . . . . . . . . 184
ANT IN . . . . . . . . . . . . . . . . . . . . . . . . . . . . . . . . . . . . . . . . . . . . . . . 185
AUDIO IN. . . . . . . . . . . . . . . . . . . . . . . . . . . . . . . . . . . . . . . . . . . . . 186
AUDIO OUT. . . . . . . . . . . . . . . . . . . . . . . . . . . . . . . . . . . . . . . . . . . 187
BASEBAND OUT (I and Q). . . . . . . . . . . . . . . . . . . . . . . . . . . . . . . 187
Chassis Ground. . . . . . . . . . . . . . . . . . . . . . . . . . . . . . . . . . . . . . . . . 188
CHIP CLOCK 1.2288 MHz OUT . . . . . . . . . . . . . . . . . . . . . . . . . . . 188
DATA IN. . . . . . . . . . . . . . . . . . . . . . . . . . . . . . . . . . . . . . . . . . . . . . 188
DUPLEX OUT . . . . . . . . . . . . . . . . . . . . . . . . . . . . . . . . . . . . . . . . . 188
EVEN SECOND SYNC IN. . . . . . . . . . . . . . . . . . . . . . . . . . . . . . . . 189
EXT REF IN . . . . . . . . . . . . . . . . . . . . . . . . . . . . . . . . . . . . . . . . . . . 189
EXT SCOPE TRIG IN . . . . . . . . . . . . . . . . . . . . . . . . . . . . . . . . . . . 189
FRAME CLOCK OUT . . . . . . . . . . . . . . . . . . . . . . . . . . . . . . . . . . . 190
HP-IB . . . . . . . . . . . . . . . . . . . . . . . . . . . . . . . . . . . . . . . . . . . . . . . . 190
MEMORY CARD Slot. . . . . . . . . . . . . . . . . . . . . . . . . . . . . . . . . . . . 191
PARALLEL PORT 15. . . . . . . . . . . . . . . . . . . . . . . . . . . . . . . . . . . . 191
PARALLEL PORT 16. . . . . . . . . . . . . . . . . . . . . . . . . . . . . . . . . . . . 191
RF IN/OUT . . . . . . . . . . . . . . . . . . . . . . . . . . . . . . . . . . . . . . . . . . . . 192
SCOPE MONITOR OUTPUT . . . . . . . . . . . . . . . . . . . . . . . . . . . . . 192
SERIAL PORTs 9, 10, and 11 . . . . . . . . . . . . . . . . . . . . . . . . . . . . . 193
TRIGGER QUALIFIER IN . . . . . . . . . . . . . . . . . . . . . . . . . . . . . . . 194
VIDEO OUT . . . . . . . . . . . . . . . . . . . . . . . . . . . . . . . . . . . . . . . . . . . 194
8. Accessories, Manuals, Support
Modifications . . . . . . . . . . . . . . . . . . . . . . . . . . . . . . . . . . . . . . . . . . . . 196
8
Page 9

Contents
Main Menu
Accessories. . . . . . . . . . . . . . . . . . . . . . . . . . . . . . . . . . . . . . . . . . . . . . 197
External Monitor . . . . . . . . . . . . . . . . . . . . . . . . . . . . . . . . . . . . . . . 197
Manuals (English and non-English) . . . . . . . . . . . . . . . . . . . . . . . . 197
Test Software . . . . . . . . . . . . . . . . . . . . . . . . . . . . . . . . . . . . . . . . . . 198
Options . . . . . . . . . . . . . . . . . . . . . . . . . . . . . . . . . . . . . . . . . . . . . . . 198
HP Support for Your Instrument . . . . . . . . . . . . . . . . . . . . . . . . . . . . 199
Getting Help . . . . . . . . . . . . . . . . . . . . . . . . . . . . . . . . . . . . . . . . . . . 199
Customer Training. . . . . . . . . . . . . . . . . . . . . . . . . . . . . . . . . . . . . . 200
9. Error Me ss a ges
General Information About Error Messages . . . . . . . . . . . . . . . . . . . 204
Positive Numbered Error Messages . . . . . . . . . . . . . . . . . . . . . . . . 204
Negative Numbered Error Messages. . . . . . . . . . . . . . . . . . . . . . . . 205
IBASIC Error Messages. . . . . . . . . . . . . . . . . . . . . . . . . . . . . . . . . . 205
HP-IB Error Messages . . . . . . . . . . . . . . . . . . . . . . . . . . . . . . . . . . . 206
Text Only Error Messages . . . . . . . . . . . . . . . . . . . . . . . . . . . . . . . . 206
The Message Display . . . . . . . . . . . . . . . . . . . . . . . . . . . . . . . . . . . . 207
Non-Recoverable Firmware Error. . . . . . . . . . . . . . . . . . . . . . . . . . 207
Text Only Error Messages . . . . . . . . . . . . . . . . . . . . . . . . . . . . . . . . 208
9
Page 10

Contents
Main Menu
10
Page 11

Product In formation
Main Menu
11
Page 12

Manufacturer’s
Main Menu
Declaration
This statement is provided to comply with the requirements of the
German Sound Emission Directive, from 18 January 1991.
This product has a sound pressure emission (at the operator position)
< 70 dB( A).
• Sound Pressure Lp < 70 dB(A).
• At Operator Position.
• Normal Operation.
• According to ISO 7779:1988/EN 27779:1991 (Type Test).
Herstellerbescheinigung
Diese Information steht im Zusammenhang mit den Anf orderungen der
Maschinenlärminformationsverordnung vom 18 Januar 1991.
• Schalldruckpegel Lp < 70 dB(A).
• Am Arbeitsplatz.
• Normaler Betrieb.
• N ach I SO 7779:198 8/ E N 27779:19 91 (Typprüfu n g) .
12
Page 13

Safety
!
Main Menu
Considerations
GENERAL
This product and related documentation must be reviewed for
familiarization with safety markings and instructions before operation.
This product has been designed and tested in accordance with IEC
Publication 1010, "Safety Requirements for Electronic Measuring
Apparatus," and has been supplied in a safe condition. This instruction
documentation contains information and warnings which must be
followed by the user to ensure safe operation and to maintain the
product in a safe condition.
SAFETY EARTH GROUND
A uninterruptible safety earth ground must be provided from the main
power source to the product input wiring terminals, power cord, or
supplied power cord set.
CHASSIS GROUND TERMINAL
To prevent a potential shock hazard, always connect the chassis ground
terminal to earth ground when operating this instrument from a dc
power source.
SAFETY S Y M BOLS
Indicates instrument damage c an occur if indica ted operating l imits are
exceeded. Refer to the instructions in this guide.
Indicates hazardous voltages.
Indicates earth (ground) terminal
WARNING A WARNING note denotes a hazard. It calls attention to a
procedure, practice, or the like, which, if not correctly
performed or adhered to, could result in personal injury. Do n ot
proceed beyond a WARNING sign until the indicated conditions
are fully understood and met.
CAUTION A CAUTION note denotes a hazard. It calls attention to an operation
procedure, practice, or the like, which, if not correctly performed or
adhered to, could result in damage to or destruction of part or all of the
product. Do not proceed beyond an CAUTION note until the indicated
conditions are fully understood and met.
13
Page 14

Safety Considerations for this Instrument
Main Menu
WARNING This product is a Safety Class I instrument (provided with a
!
protective earthing ground incorporated in the power cord).
The mains plug shall only be inserted in a socket outlet
provided with a protective earth contact. Any interruption of
the protective conductor inside or outside of the product is
likely to make the product dang erous. Intentional interruption
is prohibited.
Do not expose to or operate this instrument in outdoor
!
atmospheric conditions such a s direct rain, hail, sleet, snow,
icing, sunshine or wind. Op erate th is i nstrument onl y within its
specified temperature humidity conditions.
This instrument is equipped with internal gr ound fault circuit
!
interrupter class A.
• This device does not protect against electrical shock due to
contact with both circuit conductors or a fault in supply
wiring to product.
• Do not use extension cord to connect this product to power
receptacle. At tention-ne pas utiliser de ra llonge pour
raccorder le detecteur-disjoncteur a la prise de courant.
• Replace cordset only with HP 8120 series. Attention Remplacer uniquement par un cordon amovible numero
8120.
• Do not use in wet location. Ne pas utilise r dans un
emplacement mouille.
WARNING Whenever it is likely tha t the protection has been im paired, the
instrument must be made inoperative and be secured against
any unintended operation.
If this instrument is to be energized via an autotransformer (for
voltage reduction), make sure the common terminal is
connected to the earth termina l of the power source.
If this product is not used as specified, the protection provided
by t he equipm en t c o ul d b e i mpa i re d. Th is pr o d uc t m u s t b e u se d
in a normal condition (in which all means for protection are
intact) only.
No operator servi ceable parts in t his product. Refer servicing to
qualified personnel. To prevent electrical shock, do not remove
covers.
14
Page 15

Servicing inst ructions are for use by qualified personnel only.
Main Menu
To avoid electrical shock, do not perform any servicing unless
you are qualified to do so.
The opening of covers or removal of parts is likely to expose
dangerous voltages. Disconnect the product from all voltage
sources while it is being opened.
Adjustments described in the manual are performed with
power supplied to the instrument while protective covers are
removed. Energy available at many points may, if contacted,
result in personal injury.
The power cord is connected to internal capacitors that my
remain live for 5 seconds after disconnecting the plug from its
power supply.
For Continued protection against fire hazard, replace the line
fuse(s) only with 250 V fuse(s) or the same current rating and
type (for example, normal blow or time delay). Do not use
repaired fuses or short circuited fuseholders. FUSE: T 5.0A
CAUTION Always use the three-prong ac power cord supplied with this product.
Failure to ensure adequate earth grounding by not using this cord may
cause personal injury and/or product damage.
This product is designed for use in Installation Category II and
Pollution Degree 2 per IEC 1010 and IEC 664 respectively. For indoor
use only.
This product has autoranging line voltage input, be sure the supply
voltage is within the specified range.
Ventilation Requirements: When installing the product in a cabinet,
the convection into and out of the product must not be restricted. The
ambient temperature (outside the cabinet) must be less than the
maximum operating temperature of the product by 4° C for every 100
watts dissipated in the cabinet. If the total power dissipated in the
cabinet is greater than 800 watts, then forced convection must be used.
To prevent electrical shock, disconnect instrument from mains (line)
before cleaning. Use a dry cloth or one sl ightly d ampened with water to
clean the external case parts. Do not attempt to clean internally.
Product Markings CE - the CE mark is a registered trademark of the European
Community. A CE mark accompanied by a year indicated the year the
desi gn was pro ven.
CSA - the CSA mark is a registered trademark of the Canadian
Standards Associatio n .
15
Page 16

CERTIFICATION Hewlett-Packard Company certifi es that this p r oduct met its published
Main Menu
specifications at the time of shipment from the factory.
Hewlett-Packard further certifies that its calibration measurements
are traceable to the United States National Institute of Standards and
Technology, to the extent allowed by the Institute’s calibration facility,
and to the calibration facilities of other International Standards
Organization members.
WARRANTY This Hewlett-Packard instrume nt produc t i s warr anted a gainst d ef ec ts
in material and workmanship for a period of one year from date of
shipment. During the warranty period, Hewlett- Packard Company will
at its option, either repair or replace products which prove to be
defective.
For warranty service or repair, this product must be returned to a
service facility designated by HP. Buyer shall prepay shipping charges
to HP and HP shall pay s hipping cha rges, duti es, and taxes for product s
returned to HP from another country.
HP warrants that its software and firmware designated by HP for use
with an instrument will execute its programming instructions when
properly installed on that instrument. HP does not warrant that the
operation of the instrument, or software, or firmware will be
uninterrupted or error free.
LIMITATION OF
WARRANTY
EXCLUSIVE
REMEDIES
ASSISTANCE Product maintenance agreements and other customer assistance
The foreg o in g warranty shall not apply t o de fe ct s re su lting from
improper or inadequate maintenance by Buyer, Buyer-supplied
software or inte rfa cing, una uthor ized modification or misuse, operation
outside of the enviro nmental sp ec ifications for the pro duct, or im proper
site preparation or maintenance.
NO OTHER WARRANTY IS EXPRESSED OR IMPLIED. HP
SPECIFICALLY DISCLAIMS THE IMPLIED WARRANTIES OF
MERCHANTABILITY AND FITNESS FOR A PARTICULAR
PURPOSE.
THE REMEDIES PROVIDED HEREIN ARE BUYER’S SOLE AND
EXCLUSIVE REMEDIES. HP SHALL NOT BE LIABLE FOR ANY
DIRECT, INDIRECT, SPECIAL, INCIDENTAL, OR
CONSEQUENTIAL DAMAGES, WHETHER BASE ON CONTRACT,
TORT, OR ANY OTHER LEGAL THEORY.
agreements are available for Hewlett-Packard products. For any
assistance, contact your nearest Hewlett-Packard Sales and Service
Office.
16
Page 17

Table 1 Regional Sales and Service Offices
Main Menu
Eastern USA
Sales Office
Hewlett-Packard Company
2101 Gather Rd.
Rockville, MD 20850
Tel: (301) 258-2000
Southern USA
Sales an d S ervice
Hewlett-Packard Company
1995 North Park Place
Atlanta, GA 30339
Sales
Tel: (404) 955-1500
Fax: (404) 980-7292
Service
Tel: (404) 850-2544
Fax: (404) 980-7292
Western USA
Sales an d S ervice
Hewlett-Packard Company
24 Inverness Place East
Englewood, CO 80112
Sales
Tel: (303) 649-5000
Fax: (303) 649-5787
Service
Tel: (303) 649-5512
Fax: (303) 649-5787
Eastern USA
Sales Office
Hewlett-Packard Company
2101 Gather Rd.
Rockville, MD 20850
Tel: (301) 258-2000
Southern USA
Service Center
Hewlett-Packard Company
930 E. Campbell Road
Richardson, TX 75081
Tel: (214) 699-4331
Western USA
Sales and Service
Hewlett-Packard Company
1421 South Manhattan Avenue
Fullerton, CA 92631
Sales
Tel: (714) 999-6700
Fax: (714) 778-3033
Service
Tel: (714) 758-5490
Fax: (714) 778-3033
Midwestern USA
Sales and Service
Hewlett-Packard Company
5201 Tollview Drive
Rolling Meadows, IL 60008
Tel: (708) 342-2000
Western USA
Service Center
Hewlett-Packard Company
301 E. Evelyn Avenue
Mountain View, CA 94041
Tel: (415) 694-2000
Fax: (415) 694-0601
United States of America
Customer Information Center
Hewlett-Packard Company
Tel: (800) 752-0900
6:00 am to 5:00 pm Pacific Time
Parts Direct: 1-800-227-8164
South Eastern Europe
Sales an d S ervice
Hewlett-Packard Ges. m.b.h.
Liebigasse 1
P.O. Box 72
A-1222 Vienna, Austria
Telephone: 43 222 2500 0
Telex: 13 4425
European Multicountry Region
Sales and Service
Hewlett-Packard S.A.
P.O. Box 95
150, Route dv Nant_dl_AVRIL
CH-1217 Meyrin 2
Geneva , Switzerland
Telephone: (41/ 22) 780-8111
Fax: (41/22) 780-8542
Northern Euro pe
Sales and Service
Hewlet t-Packard Nederland B.V .
Startbaan 16
1187 XR
Amstelveen, The Ne therlands
P.O. Box 667
Telephone: 31/20 5476911 X 6631
Fax: 31-20-6471825NL
17
Page 18

Asia
Main Menu
Sales and Service
Hewlett-Packard Asia Ltd.
22-30/F Peregrine Tower
Lippo Center
89 Queensway, Central
Hong Kong
G.P.O. Box 863 Hong Kong
Telephone: 852-848-7777
Fax: 852-868-4997
Japan
Sales an d S ervice
Yokogawa-Hewlett-Packard Ltd.
3-29-21, Takaido-Higashi
Suginami-Ku, Tokyo 168
Telephone: 81 3 3331-6111
Fax: 81 3 3331-6631
International Sale s Bra nch
Headquarters
Sales and Service
Hewlett-Packard S.A.
39 Rue Veyrot
P.O. Box 365
1217 Meyrin 1
Geneva , Sw i t z e rl a n d
Telephone: 41-22-780-4111
Fax: 41-22-780-4770
Australia, New Zealand
Sales and Service
Hewlett-Packard Ltd.
P.O. Box 221
31-41 Joseph Street
Blackburn, Victoria 3130
Telephone: (61/ 3) 895-2895
Fax: (61/3) 898-9257
Canada
Service Center
Hewlett-Packard Ltd.
11120 178 Street
Edmonton, Alberta T5S 1P2
Canada
Telephone: (403) 486-6666
Fax: (403) 489-8764
Canada
Sales an d S ervice
Hewlett-Packard (Canada) Ltd.
5150 Spectrum Way
Missi ssaug a , Ontari o L4W 5G1
Canada
Telephone: (416) 206-4725
Fax: (416) 206-4739
Latin America
Hewlett-Packard Company
LAHQ Mexico City
Col. Lomas de Virreyes
11000 Mexico D.F.
Mexico
Telephone: (52/5 ) 326-4000
Fax: (52/5) 202 7718
Canada
Service Center
Hewlett-Packard Company
17500 Transcanada Highway
S. Serv Road
Kirkland, Quebec H9J 2X8
Canada
Telephone: (416) 206-3295
United Kingdom
Sales and Service
Hewlett-Packard Ltd.
Cain Road
Amen Corner
Bracknell, Berkshire
RG12 1HN
United Kingdom
Telephone: 44 344 360000
18
Page 19

Product Description
Main Menu
The HP 8935 CDMA Cellular/PCS Base Station Test Set offers full
signal gene ration and an alysis capab il ity and support for c el lular
frequency bands and international PCS frequency bands.
You can perform the following CDMA measurements using the
Test Set:
• Signal Quality Measurements
• Rho (ρ)
• Time Offset
• Frequency Error
• Carrier Feedthrough
• Code Domain Measurements
• Code Domain Power
• Code Domain Timing
• Code Domain Phase
• Average Power
• Channel Power
• Error Vector Magnitude
The Test Set’s CDMA generator also has the following capabilities:
• Reverse Channel Source with Data Buffer
• AWGN (built-in calibrated E
The Test Set also supports CDMA reference clocks and triggers.
In addition to its CDMA measurements and capabilities, the Test Set
also provides the following analog measurements:
• AC Level
• A M De pth
• AF Frequency
•DC Level
• Distortion
• Frequency and Frequency Error
• Transmitter Power
• F M Deviatio n
• Audio Frequency
•SINAD
•SNR
b/No
levels)
19
Page 20

In This Book
Main Menu
• Chapter 1, “Getting Started,” on page 23 familiarizes you with the
front panel controls. It introduces the differ ent types of control fields
that are used to make measurements
• Chapter 2, “Operating Overview,” on page 33 provides general
information about how to change measurement screens and change
control field settings. This chapter also provides some utility
procedures: calibrating channel power, setting a reference, setting
measurement limits, setting a generator/analyzer offset, averaging
measurements, saving and recalling setups, and using USER keys.
• Chapter 3, “Overview of the Test Set’s Built-In Tools,” on page 55
introduces the RFTOOLS program. This program automates some
measurements: cable fault location, swept return loss, swept and
discrete insertion loss, spectrum analyzer self-calibration. The
program also includes utilities for printing and data collection.
Basic operation of the built-in signal strength meter, spectrum
analyzer, oscilloscope, and code domain analyzer is also included in
this chapter.
• Chapter 4, “CDMA Measurements - Screens and Control Fields,” on
page 81 explains the measurements that can be made from these
screens and the fields that control the measurement’s parameters.
CDMA measurements include average power measurements,
channel power measurements, rho measurements (including
frequency error, time offset, and carrier feedthrough), EVM
measurements (including phase error and magnitude error), and
code domain measurements (including timing, phase, and power).
• Chapter 5, “Analog Measurements - Screens and Control Fields,” on
page 115 explains the measurements that can be made from these
screens and the fields that control the measurement’s parameters.
Analog measurements include ac/dc level, AM depth, AF frequency,
distortion, frequency and frequency error, transmitter power, FM
deviation, SINAD, and SNR.
• Chapter 6, “Configuration - Screens and Control Fields,” on page
159 explains the configuration controls for the Test Set.
• Chapter 7, “Connectors,” on page 183 describes the function and
physical attributes of each connector on the Test Set.
• Chapter 8, “Accessories, Manuals, Support,” on page 195 describes
any available upgrades, accessories, training and support for the
Test Set.
• Chapter 9, “Error Messages,” on page 203 provides any available
information about error recovery when messages are displayed.
20
Page 21

Conventions Used in this Book
Main Menu
Screen names are shown as follows: CODE DOM.
Keys are shown in the following typeface:
CDMA Gen. Shifted functions
(labeled in blue above the keys) are accessed by pressing and releasing
the blue Shift key, and then the key below the blue label.
Fields and messages displayed on the CRT are shown in the following
typeface: Input Atten.
The term “Test Set” is used to refer to the HP 8935.
The screens shown in this manual may not exactly match the screens
displayed on the Test Set’ s CRT. Some di fferences may b e due to cont rol
field settings, while other differences may be due to instrument
revisions.
Which Document is
Required?
Table 2 Document Navigation
Document Part Number Usage
CDMA Application Guide E6380-90016 Use this manual for basic CDMA measure ments and
AMPS Application Guide E6380-90017 Use this manual for making AMPS base station
The following documents are part of the HP 8935 document set. Use the
table to help you decide which document you need.
for get ti n g sta rted with th e Te s t Se t.
measurements.
Reference Guide E6380-90019 Use this manual for screen and field descriptions and
general operation information about the Test Set.
Programmer’ s Guide E6380-90018 Use this manual to learn HP-IB syntax and for learning
how to program the Test Set.
Assembly Level Repair
Guide
E6380-90015 Use this manual to perform calibration on the Test Set
and for general service information.
21
Page 22

22
Main Menu
Page 23

1 Getting St arted
Main Menu
• “Before Connecting a Radio” on page 24
• “Changing the Measurement Screen” on page 25
• “Changing the Control Fields” on page 26
• “Instrument Quick Check” on page 31
23
Page 24

Getting Started
Main Menu
Before Connecting a Radio
Before Connecting a Radio
NOTE The RF IN/OUT port should be used for all transmitter
tests when the radio is connected directly to the Test Set.
(All UUT transmitter power measurements are made
through this port). Off - the- air measur ement s can be made
using the ANT IN port.
CAUTION Overpower Damage — Refer to the Test Set’s side panel
for maximum input power level at the RF IN/OUT,
DUPLEX OUT, and ANT IN connectors. Exceeding these
levels can cause permanent instrument damage.
24 Chapter 1
Page 25
Changing the Test Set’s Display
Main Menu
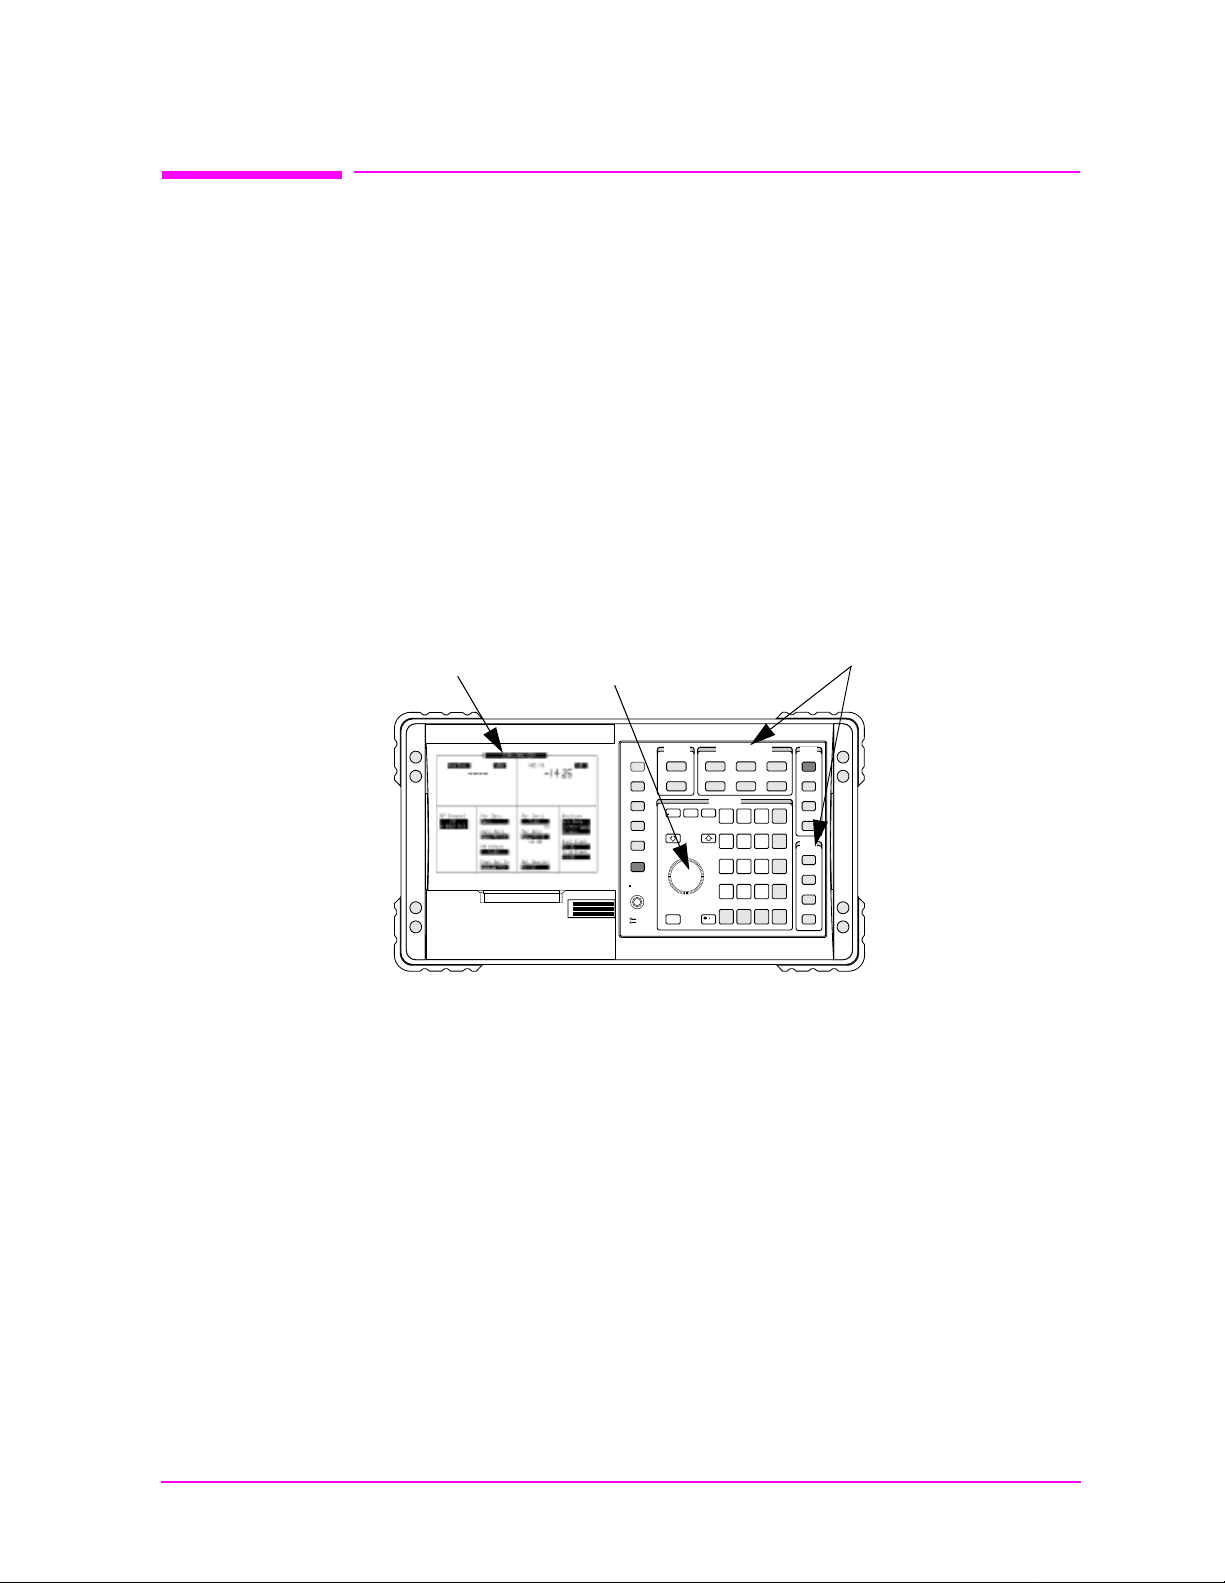
Changing the Measurement Sc reen
The measurement screen is changed using the titlebar at the top of the
screen and the cursor-control knob, using the
GENERATOR/ANALYZER keys, or by using the UTILS keys. Rotate
the knob to move the cursor from field to field or to change settings.
Press the knob to make selecti ons (s ee “Changing the Control F ields” on
page 26 for more information about fields).
Figure 1-1 Using the cursor-control Knob or Screen Keys
Getting Started
Changing the Test Set’s Display
Titlebar
Push the knob to
make a selection.
Rota te the k n ob
to move the
cursor , or change
settings.
USER
k1’
Menu
k1
k2’
Pause/
k2
Continue
k3’
k3
Ref Set
Incr
10
k4’
k4
Lo Limit
Release
k5
Push to Select
Shift
Out of Lock
Cancel
Volume
Squelch
Meter
Incr
Set
Press one of the
GENERATOR/ANALYZER or
UTILS keys for a shortcut to
the measurement or
configuration screens.
CDMA
Gen
RF
Gen
Avg
Incr
x 10
Hi limit
GENERATOR/ ANALYZERSOFTWARE
DATA ENTRY
7
E
4
B
1
A EEX
0
Yes
On/Off
CDMA
Anl
AF Anl ScopeReset
RF
Anl
8
F
5
C
2
.
No
ppm
W
STATE
Code
Preset
Dom
Meas
Reset
Spec
Hold
Anl
Save
Recall
Enter
9
ADRS
Local
dB
GHz
dBm
6
UTILS
D
%
Prev
MHz
V
3
Printer
Config
Print
s
kHz
mV
I/O
+/-
Config
Inst
Config
mW
ms
Error
Hz
%D
Message
V
dBV
Help
To change the measurement screen
Step 1. Select the titlebar at the top of the screen (placement of the
titlebar may vary slightly on some screens).
Chapter 1 25
Step 2. Select the measurement screen from the list of choices.
OR
Step 1. Press a screen key:
Spec Anl, AF Anl, Scope, Prev, Inst Config, Help, Pr i nter Config, I/O Config,
Error Message.
CDMA Gen, CDMA Anl, Code Dom, RF Gen, RF Anl,
AF Anl, Scope, Printer Config, I/O Config, and Error Message
are shifted functions (labeled in blue above a key). You must
press and release the blue
Shift key then the key below the blue
label to access the screen (or other function) labeled in blue.
Pressing the
Prev key displays the previous screen.
Page 26
Getting Started
Main Menu
Changing the Test Set’s Display
Changing the Control Fie lds
There are several types of control fields in the Test Set. This section
describes some of the different types of fields.
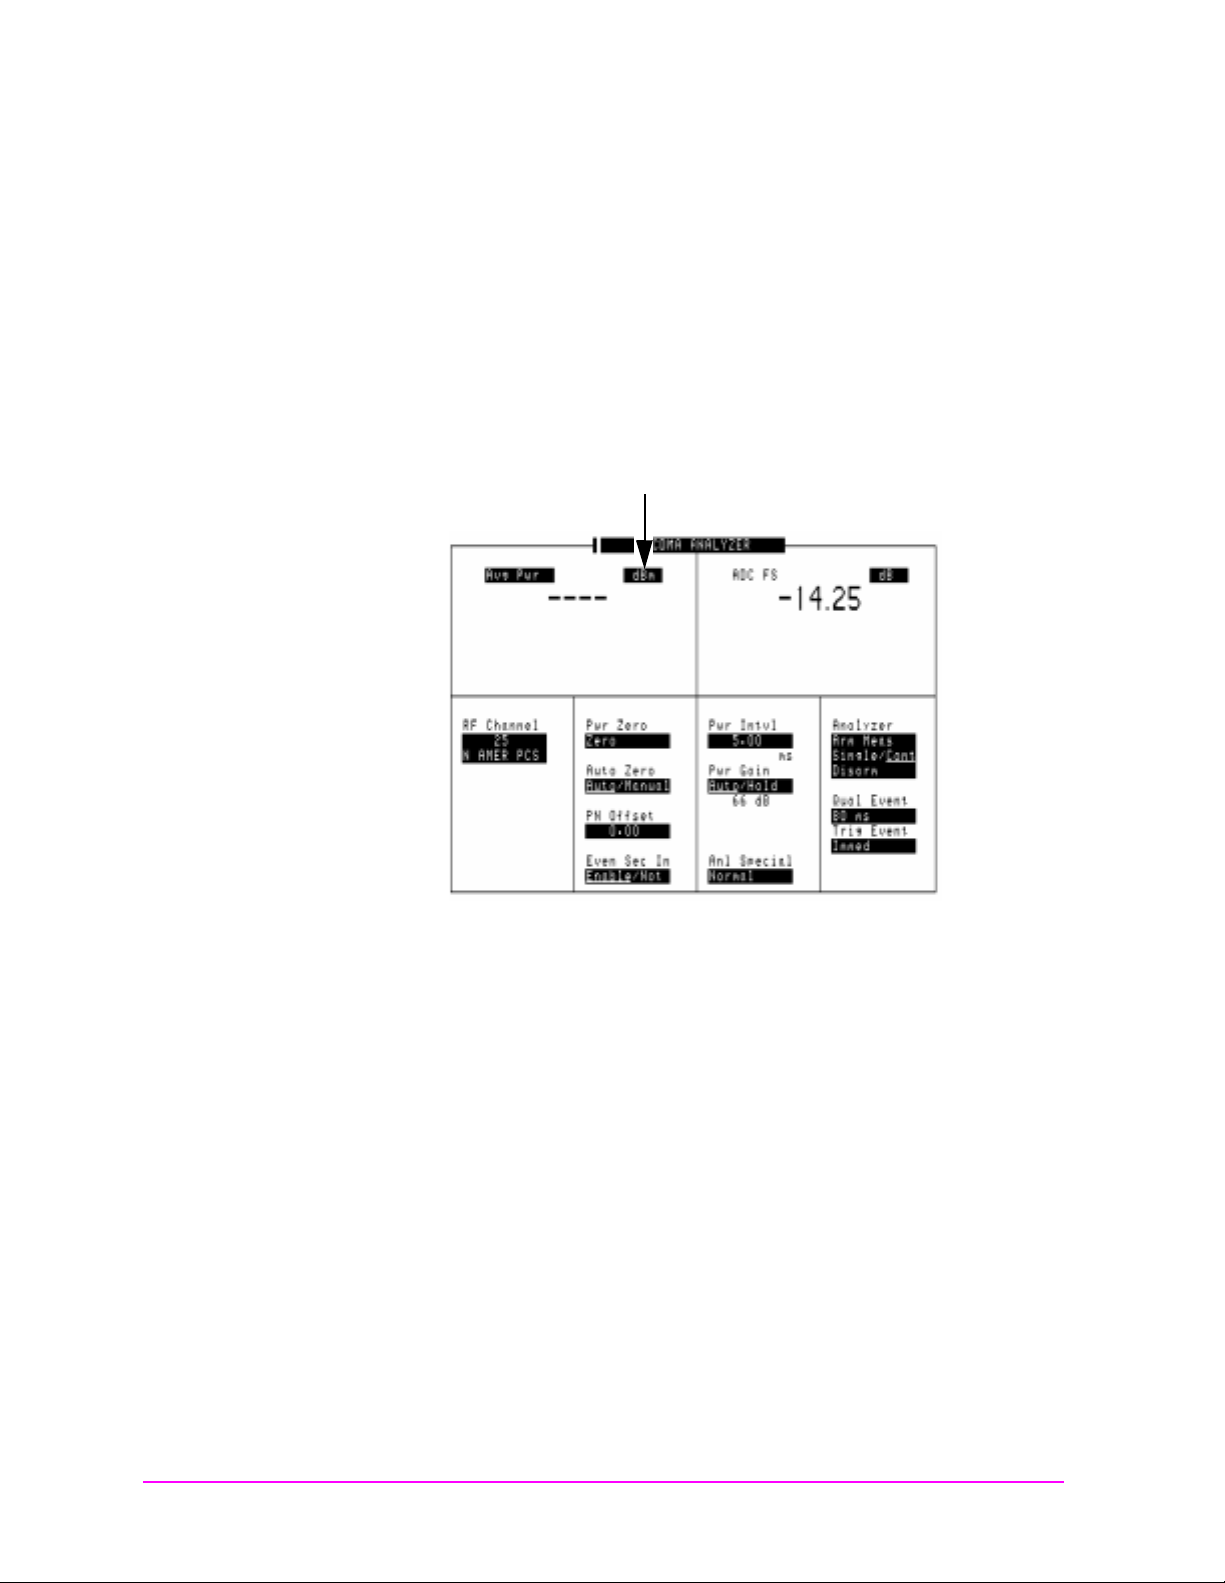
Unit-of -M easure Fi eld
Unit-of-measure can be changed to display measurements in different
values or magnitudes. The unit-of-measure field can also be used to
turn a measurement on or off (use the On/Off Yes key).
Figure 1-2 Unit-of-Measure Field
Unit-of-Measure
26 Chapter 1
To change a unit-of-measure field
Step 1. Position the cursor at the unit field on the display.
Step 2. Press a key labeled with a different unit-of-measure
(such as W) .
If the new units are valid, the measurement value is d isplayed
in the unit.
If the new units are not valid, the message Invalid
keystroke. is displayed and the units are not changed.
Page 27

Getting Started
Main Menu
Changing the Test Set’s Display
Underlined Entry Field
Underlined entry fields provide a choice of two settings (toggle).
Figur e 1- 3 Und erline d E n tr y F i el d
Underlined
Entry Field
To Change an underlined entry
Step 1. Position the cursor at the field.
Step 2. Push the cursor-control knob or the
underline under the desired choice.
The underlined setting is immediately activated when
selected.
Enter key to move the
Chapter 1 27
Page 28
Getting Started
Main Menu
Changing the Test Set’s Display
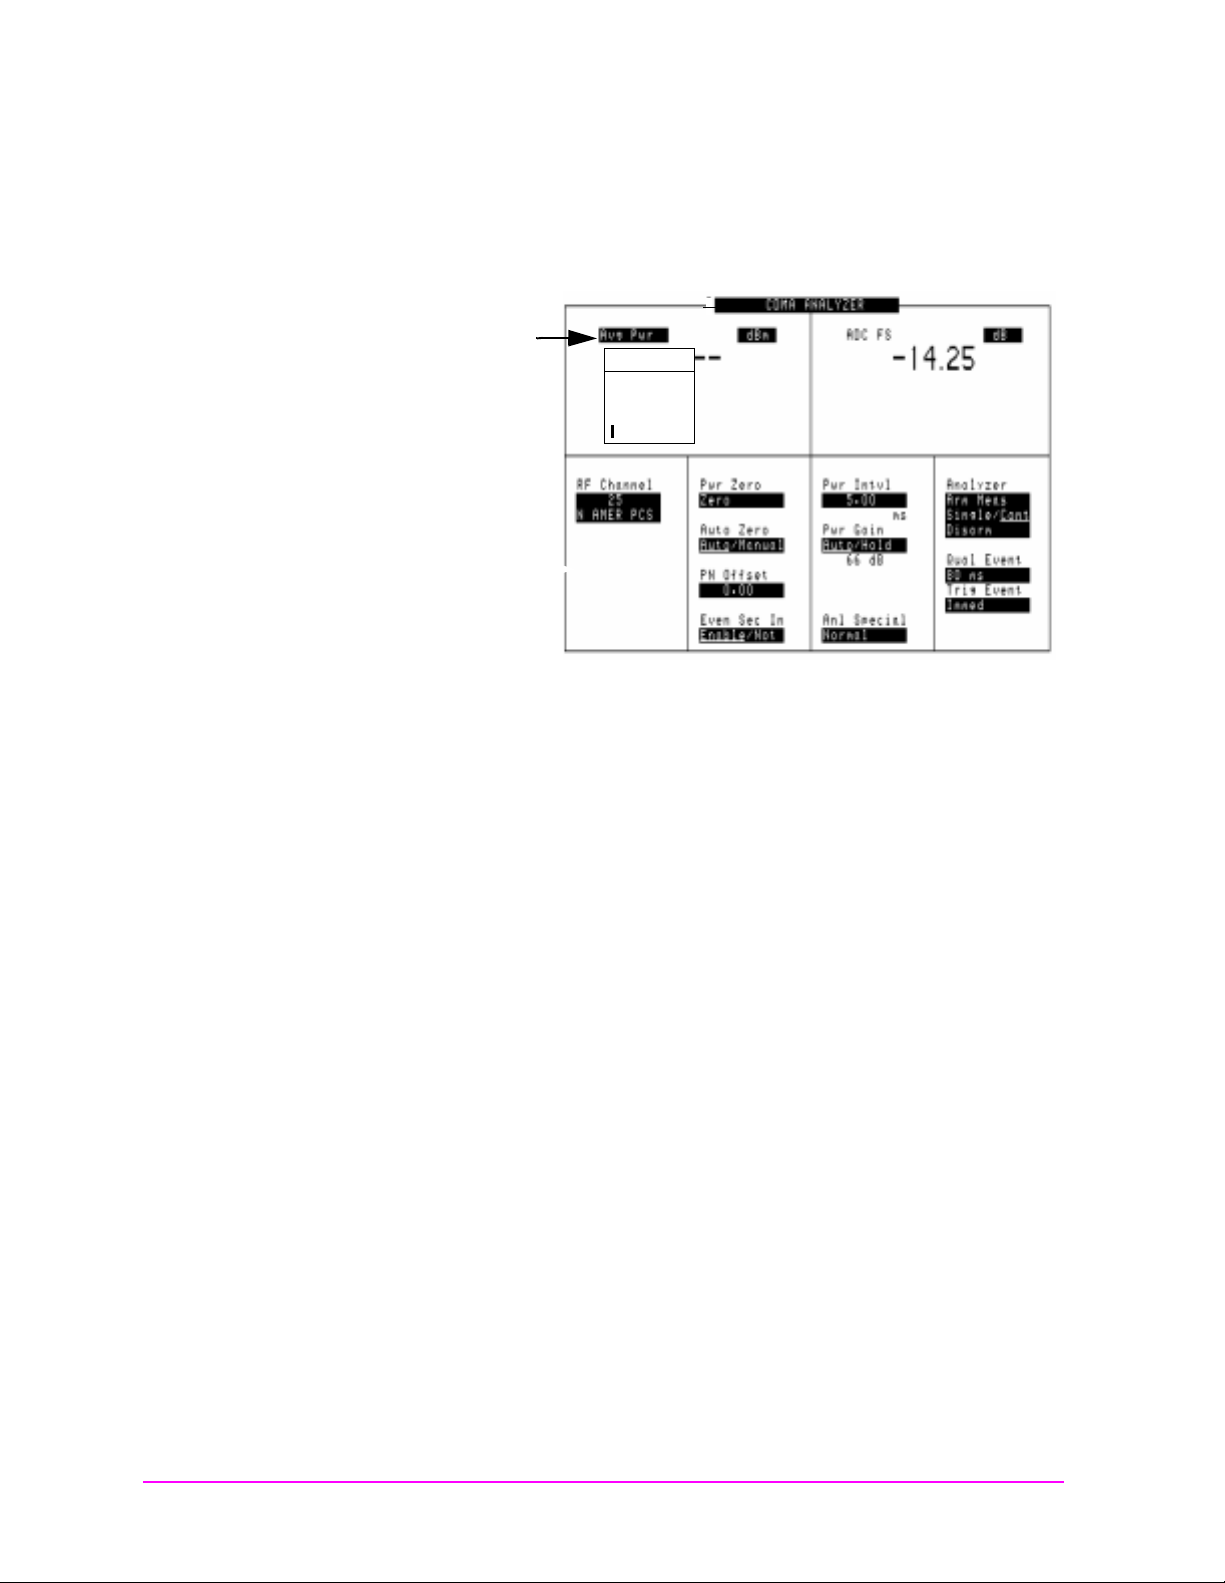
One-of-Many Field
One-of-many fields display a list of choices when selected.
Figure 1-4 One-of-Many Field
One-of-Many
Field
Choices:
Chan Pwr
Rho
EVM
Avg Pwr
To make a one-of-many choice
Step 1. Position the cursor at the field.
Step 2. Push the cursor-control knob or the
Enter key to display the
choices.
Step 3. Move the cursor through the choices by turning the knob.
Step 4. Push the cursor-control knob or the
Enter key to make the
choice.
The choice is immediately activated when selected.
28 Chapter 1
Page 29
Getting Started
Main Menu
Changing the Test Set’s Display
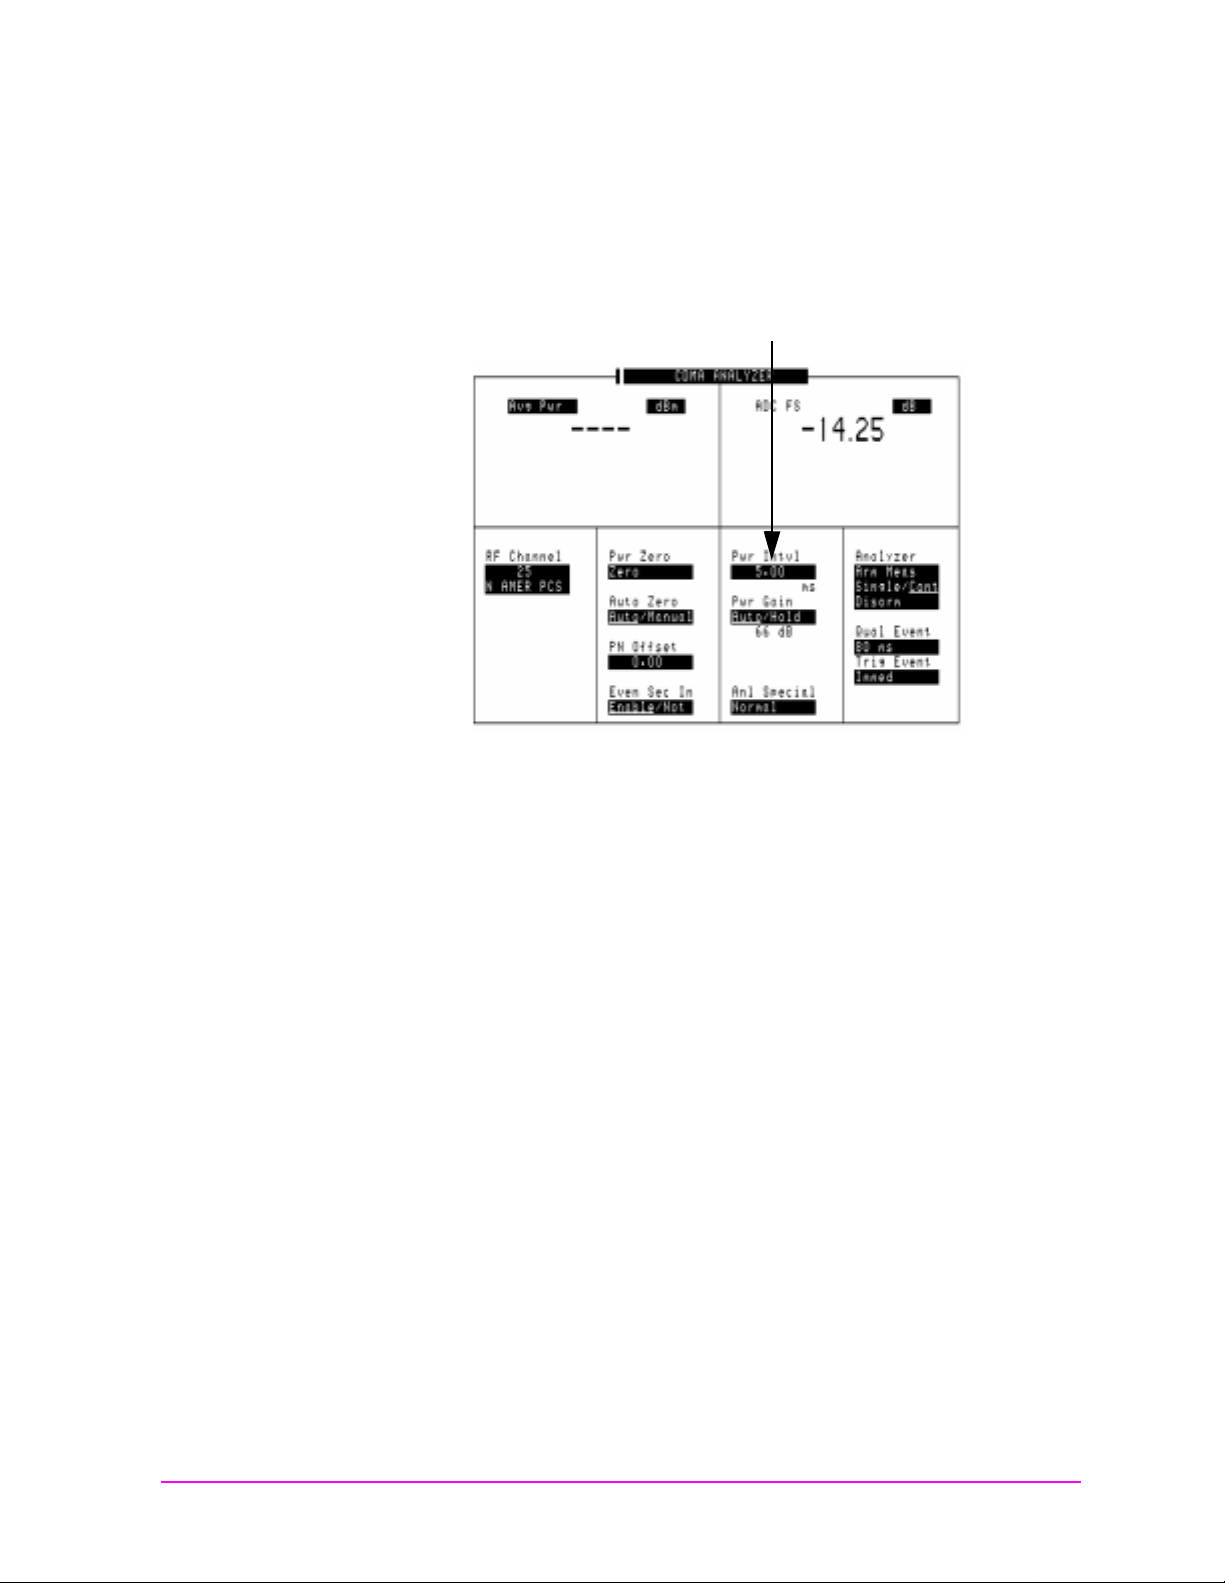
Numeric-Entry Fields
Values for numeric entry fields can be entered and changed using
various methods, depending on your testing needs.
Figure 1-5 Nume ri c -Entr y Fi e l d
Numer ic E ntry Field
To change a value
Step 1. Position the cursor at the field.
Step 2. Key in the desired number using the DATA ENTRY keys.
Step 3. Press
Enter to select the choice.
OR
Step 1. Position the cursor at the field.
Step 2. Push the cursor-control knob (the flashing >> cursor appears) .
Step 3. Turn the knob to increment or decrement the value. (The
current increment value may not be appropriate for your
operation. See See “Changing the Increment or Decrement
Setting” on page 42.)
Step 4. Push the cursor-control knob or the
Enter key to select the
choice.
OR
Step 1. Position the cursor at the field.
Step 2. Push the cursor-control knob to highlight the desired choice.
Chapter 1 29
Step 3. Use the up-arrow or down-arrow keys to increment or
decrement the value.
Page 30

Getting Started
Main Menu
Changing the Test Set’s Display
Decimal Valu e s
Decimal values are used for most numeric entry fields. The acceptable
entries for decimal values are 0 through 9,, +/-, and EEX.
The
+/- key is used for entering negative numbers.
EEX key is used to enter values in exponential notation. For
The
example to enter 10-9 you would enter 1, 0, EEX (Shift, +/-), +/-, 9.
Hexadecimal Values
Hexadecimal (Hex) values are used for entering some signaling
parameters. The acceptable entries values are 0 through 9 and A
through F. No unit-of-measure is associated with these values.
Hexadecimal values are either entered from the keypad (A through F
are shifted functions) or for some fields, values are selected from a list
of choices.
30 Chapter 1
Page 31

How do I Verify that the Test Set is Operating Properly?
Main Menu
How do I Verify that the Test Set is Operating
Properly?
If your Test Set powers-up and dis pla ys the CDMA ANALYZER screen,
but you suspect an instrument problem, use the Instrument Quick
Check to verify operation of the basic instrument functions.
If no failure is indicated by this test, but you still suspect a problem,
refer to the “Performance Tests” information in the Assembl y L ev el
Repair Manual.
Instrument Quick Check
Step 1. Set up the quick check:
a. Remove any connected cables ( excep t for AC or DC power).
b. Turn instrument power on (if it is not already on).
Getting Started
c. Press
d. Press
e. Press
Preset.
Inst Config and set the RF Display field to Freq.
CDMA Anl and select the Avg Pwr field, then select Rho
from the Choices: menu.
f. Set the Tune Freq field to 800 MHz.
g. Set the Anl Dir field to Rev
h. Press
CDMA Gen and set the Output Port field to RF Out.
i. Set the RF Gen Freq field to 800 MHz.
j. Set the Amplitude field to −40 dBm
k. Set the Gen Dir. field to Fwd
displayed.)
Step 2. Check the following reading:
a. Rho should be greater than 0.96.
Step 3. Press
Spec Anl to access the SPEC ANL screen.
You should see the characteristic CDMA spectrum.
.
. (The EQ In/Out field is
Chapter 1 31
Page 32

Getting Started
Main Menu
How do I Verify that the Test Set is Operating Properly?
Figure 1-6 CDMA Spectrum
32 Chapter 1
Page 33

2Operating Overview
Main Menu
• "Displaying CDMA Measurements" on page 34
• "Displaying Analog Measurements" on page 36
• "Using Channel Numbers to Set Analyzer and Generator
Frequencies" on page 40
• "Calibrating the Channel Power Measurement" on page 41
• "Changing the Increment or Decrement Setting" on page 42
• "Using Measurement Limit Indicators" on page 43
• "Setting A Measurement Reference" on page 45
• "Averaging Measurements" on page 46
• "Setting an RF Generator/Analyzer Offset" on page 47
• "Saving and Recalling Instrument Setups" on page 48
• "Using USER Keys" on page 51
• "Replacing Batteries" on page 53
33
Page 34

Ope rati ng Overvi ew
Main Menu
Displaying CDMA Measurements
Displayi ng CDMA Measure me nts
Channel Power, Rho, EVM, Average Power
You can select channel power, rho, EVM, or average power on the
CDMA ANALYZER or CDMA GENERATOR screen as shown in
Figure 2-1.
For more information about these measurements see "CDMA
Measurements" on page 82.
Figure 2-1 Displaying Channel Po wer, Rho, EVM, or Average
Power
Choices:
Chan Pwr
Rho
EVM
Avg Pwr
Time Offset, Frequen cy Erro r, Ca rrier Feedthrough
When you select Rho, the Time Offset, Frequency Error, and
Carrier Feedthru measurements are displayed. Time offset and
carrier feedthrough are also displayed on the CODE DOM screen along
with frequency offset.
Frequency Offset
Frequency offset is displayed on the CODE DOM screen.
Magnitude Error, Phase Error
When you select EVM, the Magnit ud e Err or and Ph as e Er ro r
measurements are displayed.
34 Chapter 2
Page 35

Operating Ov erview
Main Menu
Displaying CDMA Measurements
Code Domain Measurements (Power, Timing, Phase)
Code domain measurements are displayed on the CODE DOM screen.
To select a code domain measurement, go to the CODE DOM screen
and select a measurement from the Measurement field in the Main
controls menu.
For more information about code domain measurements see "Code
Domain Measurements" on page 89.
Figure 2-2 Selecting Code Domain Measurements
Choices:
Power
Fast Pwr
Timing
Phase
Chapter 2 35
Page 36

Ope rati ng Overvi ew
Main Menu
Displaying Analog Measurements
Displayi ng An al og Meas ur e ments
RF Measurements
Frequency Error, Frequency
RF Frequency Error and RF Frequency are displayed on the RF
ANALYZER, RF GENERATOR, and AF ANALYZER screens.
Figure 2-3 Displaying RF Frequency Error or RF Frequency,
and TX Power
Choices:
Freq Error
Frequency
TX
Power
Transmitter (TX)Power
TX Power is only measured and displayed here when the Input Po rt
on the RF ANALYZER screen is set to RF In. If Ant (antenna) is
selected, the measurement is replaced by four dashes (- - - -).
You can measure low power levels on the ANT IN port using the
spectrum an a lyzer.
Refer to the "TX Power Measurement" field on page 120 and the "TX
Pwr Zero" field on page 157 for more information on measuring
transmitter po wer.
CAUTION Connecting a signal of >60 mW to the ANT IN (antenna)
port can cause instrument damage (although internal
protection circuits can typically withstand a
short-duration signal of 1 or 2 Watts). If the overpower
circuit is triggered, remove the signal from the ANT IN
port and turn the Test Set off and on to reset it.
36 Chapter 2
Page 37

Displaying AF Measurements
Main Menu
FM Deviation, AM Depth, AC Level
The AF Anl In setting determines the AF analyzer’s input and the
measurement displayed in the top-right corner of the measurement
area (see figure 2-4). These measurements are displayed on the RF
GENERATOR, RF ANALYZER, and AF ANALYZER screens.
Table 2-1 lists the measurement displayed for each AF Anl In setting.
Figure 2-4 Displaying FM Deviation, AM Depth, or AC Level
Choices:
FM Demod
AM Demod
SSB Demod
Audio In
Ext Mod
FM Mod
AM Mod
Operating Ov erview
Displaying Analog Measurements
Table 2-1 Measurements Selected with the AF Anl In field
Measurement AF Anl In Setting
FM Deviation FM Demod, FM Mod
AM Depth AM Demod, AM Mod
AC Level SSB Demod, Audio In, Ext Mod, Audio Out
Chapter 2 37
Page 38

Ope rati ng Overvi ew
Main Menu
Displaying Analog Measurements
SINAD, Distortion, SNR, AF Frequency, DC Level,
These measurements are available on the RF GENERATOR,
RF ANAL YZER, and AF ANALYZER screens. See figure 2 -5 .
Figure 2-5 Displaying SINAD, Distortion, SNR, DC Level, or
AF Frequency
Choices:
SINAD
Distn
SNR
AF Freq
DC Level
The Distortion measurement is only for a 1 kHz tone.
Selecting SNR (Signal/Noise Ratio) turns off any other audio
measurement. For more information on making this measurement, see
the RF Gen Freq field description, on page 148.
38 Chapter 2
Page 39

Operating Ov erview
Main Menu
Displaying Analog Measurements
Displaying Analog Measurement Results on a Meter Scale
Figure 2-6 Displaying the Meter Scale
Unit-o f -Measure
Fields
Meters:
On/Off
Lo End
Hi End
Intervals
Measurement results can be displayed on a meter scale. The digital
numeric value is still displayed (but smaller) under the meter scale.
To display the meter scale
Step 1. Move the cursor to the unit-of-measure field for the
measurement you want displayed on the meter.
Step 2. Press and release the blue Shift key, then the Incr Set key to
access the meter function.
Step 3. Select On/Off from the Meters: menu (or press the
On/Off key ).
To set the meter’s end points and scale intervals
Step 1. Use the knob to select the unit-of-measure field for the
measurement you want displayed on the meter.
Step 2. Press and release the blue
Shift key, then the Incr Set key to
access the meter function.
Step 3. Select Hi End, Lo End, or Interval from the Meters: menu
and enter the value for your selection, then press the
Enter key.
Step 4. Repeat steps 2 and 3 until you have set the desired
parameters for the meter’s scale.
Chapter 2 39
Page 40

Ope rati ng Overvi ew
Main Menu
Using Cha nn el Num bers to Set Analyzer and Generat o r Frequencies
Using Chann el Numbers t o Set Analyz er and Gene rator
Frequencies
RF analyzer and RF generator frequencies can be entered by channel
number (the default setting) or by discrete frequencies (in MHz). The
RF Disp la y fie ld on the INSTRUMENT CONFIGURE screen controls
which way frequencies are entered. This screen is accessed by pressing
the
Inst Config key.
If the RF Disp lay field is set to Chan
to set the RF Chan Std field to indicate the standard for your base
station (such as North American PCS). This automatically sets the
correct frequency of f set needed to ge nerate r ev erse c ha nnel si gna ls a nd
analyze forward channel signals for base stations.
If you do not know the channel number of your base station, but know
the transmit and r eceive frequenc ies, s et the RF Display field to Freq
You can then enter these frequencies directly for the RF generator and
RF analyzer during tests.
Figure 2-7 Con figuration to Use Channel Numbers for RF
Set the RF Display field to Chan
to turn on channel tuning.
Select the RF Chan Std field to
display a list of system types.....
for channel tuning, you also need
.
Generator and Analyzer Settings
..and then sel ec t the channel standard
for testing your base stations.
40 Chapter 2
Page 41

Operating Ov erview
Main Menu
Calibrating the Channel Power Measuremen t
Calibrati ng th e Cha nne l Power Meas ure me nt
To calibrate a channel power measurement at the RF IN/OUT port
using the internal CDMA generator
Step 1. Go to the CDMA ANALYZER s creen and choos e the Chan Pwr
measurement.
Step 2. Set the Tune Freq field (or RF Channel field) to the center
frequency of your CDMA signal.
Step 3. Select the C hn Pw r Ca l field and wait until the calibration is
complete.
Chapter 2 41
Page 42

Ope rati ng Overvi ew
Main Menu
Changing the Increment or Decrement Setting
Changing the Increment or D ecrement Setting
Specifying An Increment Value for the Arrow Keys or Knob
The Incr Set key is used to assign a specific increment value. The
increment value may use different units than the field you are
incrementing/decrementing. For instance; if the RF generator’s
Amplitude setti n g is disp layed in dB µV, you could increment in units
of dB or mV.
To change the increm en t/decrem ent value
Step 1. Move the cursor to the numeric entry field to be changed.
Step 2. Press
unit-of-measure using the DATA ENTRY keys.
Step 3. Use the down-ar ro w an d up-arrow ke ys or cursor
control knob to increment the field’s value. The field’s value
changes by the value you set for each key press or knob click.
Incr Set, and enter the desired incremental value and
Using the Factor of 1 0 Inc rement/Decrement Keys
The Incr × 10 and Incr ÷ 10 keys change the increment/decrement value by a
factor of 10.
For example, if you set the increment for Tune Freq to 10 MHz for
every click of the knob or push of the down-arrow or up-arrow keys,
pushing
Incr ×10 changes the increment value to 100 MHz.
42 Chapter 2
Page 43

Using Measurement Li m it In di c at or s
Main Menu
Using Measurement Limit Indicators
The Lo Limi t and Hi Limit functions are used to define a measurement
“window.” You can set a high limit, a low limit, or both. When limits are
assigned, Lo, Hi or both are indicated on the screen.
A measurement that goes above or below the defined limits causes
three things to happen:
1. A message appears at the top of the screen indicating a limit was
exceeded.
2. The Lo or Hi indicator flashes.
3. The beeper beeps (if it is has been enabled in the INSTRUMENT
CONFIGURE screen).
Limits are helpful when you can’t watch the Test Set’s display while
you are making an adjustment on the equipment you are testing or
repairing. They are also a convenient way of alerting you to long-term
measurement drift.
Operating Ov erview
To set high and low limits
Step 1. Position the cursor in front of the unit-of-measure for the
measurement for which you are setting limits.
Step 2. Press and release the
Shift key, then the down-arrow key to
access the Lo Limit function, and enter the measurement’s
low-limit value and its unit-of-measure.
1
Step 3. Press and release the Shift key, then the up-arrow key to access
the
Hi Limit function, and enter the measurement’s high-limit
value and its unit-of-measure.
2
Chapter 2 43
1. The fundamental unit for the limits does not have to be the same as the mea-
surement’s units. For instance; when measuring AC Level in Volts, you can set
high and low limits in units of dBm.
Page 44

Ope rati ng Overvi ew
Main Menu
Using Measurement Limit Indicators
To reset or remove limits
To reset a limit that has been exceeded
Step 1. Position the cursor in front of the measurement’s
unit-of-measure.
Step 2. Press and release the
Shift key, then the down-arrow (or
up-arrow key) to access the Lo Limit (or Hi Limit) function.
Step 3. Press
Enter or Shift then Hold to access the Meas Reset function.
To remove a limit
Step 1. Position the cursor in front of the unit-of-measure for the
assigned limit.
Step 2. Press and release the
Shift key, then the down-arrow (or
up-arrow key) to access the Lo Limit (or Hi Limit) function, then
press the On/Off key.
44 Chapter 2
Page 45

Setting A Measurement Reference
Main Menu
The reference set (Ref Set) function establishes a measurement
reference point. This allows you to make a direct comparison between
two measurement results, or between a measurement standard and the
actual measurement results.
Depending on the type of measurement, referenced measurements are
displayed in one of two ways:
1. Displayed val u e = Measurement − Reference. The difference between
the measured value and the reference value is displayed.
or
2. Displayed value = Measurement ÷ Reference. A ratio of the measured
value to the reference value is displayed. This ratio is expressed in
dB.
To set a reference
Operating Ov erview
Setting A Measurement Reference
Step 1. Position the cursor in front of the unit-of-measure for the
measurement you want to set the reference for.
Step 2. Press and release the
Shift key, then the Incr ÷10 key to access
the Ref Set function.
Step 3. Enter a reference value, then press
Enter. (To use the currently
measured value as a reference, just press Enter.)
Step 4. The Reference indicator shows that an internal reference has
been set.
Step 5. To turn the reference off press and release the
Shift key, then
the Incr ÷10 key to access the Re f Set functi on, and then press the
On/Off key .
Chapter 2 45
Page 46

Ope rati ng Overvi ew
Main Menu
Averaging Measuremen ts
Averaging Measurements
The Avg (average) function allows you to display the average value of a
number of measurements. You enter the number of measurement
samples used to calculate and display the measurement average. This
dampens the effects of rapidly changing measurements, providing a
more usable measurement display.
To use measurement averaging
Step 1. Position the cursor in front of the measurement’s
unit-of-measure.
Step 2. Press and release the
Shift key, then the Incr ×10 key to access
the Avg function.
Step 3. Enter the d esir ed number of meas ure ment samples to be used
for calculating the average, then press the knob or the
key.
or
Press
On/Off to use the currently-displayed number of samples.
Step 4. To turn averaging off, position the cursor in front of the
unit-of-measure and press and release the
Incr ×10 key to access the Avg function, then press the On/Off key.
How the Test Set Averages Measurements
When the averaging function is first enabled, a numeric average is
calculated and displayed each time a measurement is made. This
continues until the specified number of samples is reached. From that
point on, the averaging function performs an exponential filtering
operation that mimics an RC filter.
Because of the exponential response, any large measurement changes
result in a displayed value that ramps up or down to the actual
measured value.
Enter
Shift key, then the
46 Chapter 2
A measurement reset clears the measurement history for all
measurements and starts the averaging process over. (Press and
release the
Shift key then the Hold key (Meas Reset) to reset the
measurement.)
Page 47

Setting an RF Generator/Analyzer Offset
Main Menu
Setting an R F Gener at or/ An aly ze r Offs et
You can set a fixed frequency offset between the RF generator and the
RF analyzer. This feature is convenient for testing radios with a fixed
transmit/receive frequency offset.
To set an R F Offset
Step 1. Go to the INSTRUMENT CONFIGURE screen.
Operating Ov erview
Step 2. Set the RF Display field to Freq
Step 3. Set the RF Offset field to On.
Step 4. Select the (Gen)-(Anl) field and enter the frequency offset
value.
Step 5. Go to the RF GENERATOR screen.
Step 6. Select the RF Gen Freq field, and rotate the cursor control
knob to vary the RF generator’s frequency.
Step 7. Go to the RF ANALYZER screen. Notice that the Tune Freq
value changes to maintain the offset between the generator
and the analyzer. (You can use the
the generator and analyzer screens.)
.
Prev key to switch between
Chapter 2 47
Page 48

Ope rati ng Overvi ew
Main Menu
Saving and Recalling Instrument Setups
Saving and Re cal li ng In st ru ment Se t up s
The save and recall functions allow you to store different instrument
setups and retrieve them later, eliminating the task of re-configuring
the Test Set.
The number of available save registers depends on how many changes
were made to the base instrument setup for each save. (See "BASE
Settings" on page 50.) The smaller the number of changes, the greater
the number of save registers that can be used (typically over 200).
Save/Recall register settings can be saved to internal RAM or to a PC
card. Saving registers to a PC card allows you to “back up” the settings
in case you need to clear them from memory for running large
programs, or when a firmware upgrade is performed (see "Memory
Considerations" on page 50).
To save an instrument setup
Step 1. Go to the I/O CONFIGURE screen.
Step 2. Select the storage media using the Save/Recall field. (The
default is internal memory.)
Step 3. Make any changes to the instrument that you want to save in
a register.
Step 4. Press and release the
Save function.
Shift key then the Recall key to access the
Step 5. Use the DATA ENTRY keys or the Save: m enu to enter the
register’s name.
To recall an instrument setup
Step 1. Select the I/O CONFIGURE screen.
Step 2. Select the media to recall settings from using the
Save/Recall field. The default is internal memory.
Step 3. Press Recall.
Step 4. Use the knob to select the d esired setup to b e recalled f rom the
Recall menu.
48 Chapter 2
Page 49

Operating Ov erview
Main Menu
Saving and Recalling Instrument Setups
To remove (clear) an individual save register
Step 1. Specify where the register is stored using the Save/Recall
field on the I/O CONFIGURE screen.
Step 2. Press
Step 3. Use the knob to position the cursor in front of the register to
Step 4. Press
Step 5. Press
To clear all save registers
Step 1. Press
Step 2. Use the knob to position the cursor in front of the *Clr All*
Step 3. Press the knob or press
Step 4. Press
Register Name s
Recall.
be removed from the Recall menu at the bottom-right of the
screen. The reg ister name and percentage of memory occupied
by that register are indicated at the top of the screen.
Yes On/Off. A prompt appears, asking i f you want to delete
the save register.
Yes On/Off.
Recall.
entry in the Recall menu at the bottom-right of the screen.
Enter. A prompt appears at the top of
the screen to verify that you want to clear all registers.
Yes On/Off.
You can use any number, letter, or combination of numbers and letters
as a name for storing instrument settings. For instance; if you want to
save a setup for testing a “Vulcan7” radio, you can save the setting as
“VULCAN7”.
Two register names are reserved for special purposes: POWERON and
BASE.
POWERON S ettings
When the Test Set is turned on, it uses a set of instrument setup
parameters specified at the time of manufacture. You can have the
instrument power up in a different state by making the desired changes
to the original settings, and then saving them using the name
POWERON.
The next time the instrument is turned on, the instrument returns to
the state present wh en y ou s a ved the POWERON setting. For ins ta nce;
if the SCOPE screen was displayed when POWERON was saved, it is
the screen that is displayed when you turn the instrument on.
Chapter 2 49
Page 50

Ope rati ng Overvi ew
Main Menu
Saving and Recalling Instrument Setups
BASE Settings
The BASE register contains any field settings the user has saved that
are different from the instrument preset state. It establishes a
reference point for all future saves. If a base is not saved, the preset
state is used as the reference.
When you save an instrument setup, the new setup is compared to the
base settings, and any differences are stored under the register name
you supply. Because only differences are stored, a much larger number
of instrument setups can be saved than if the contents of every field was
saved.
When you recall an instrument setting, every field is reset to the base
settings. The saved settings are then used to re-establish the desired
instrument setup.
You can define your own base setting. If your desired settings are very
different from the preset values, you may want to change the BASE
register. This will decrease the amount of memory used to save each
setup, and allow you to save many more setups.
CAUTION Since each save/recall register only contains the
differences between the setup being saved a nd the present
base register settings, changing the base settings causes
all other saved setups to be erased from memory
(including the POWERON setting if one has been saved).
Unless you consistently change the same fields to the
same value each time you use the instrument, you should
avoid creating your own BASE settings.
Memory Conside r atio ns
When the Save/Recall field of the I/O CONFIGURE screen is set to
Internal, programs are saved to the same non-volatile RAM used to
create RAM disk(s) and run IBASIC programs. By saving a large
number of instrument setups, you red uce t he amount of RAM availa ble
to run programs. If you get a “memory overflow” message while trying
to load a program, you must clear one or more save/recall registers to
free RAM space.
Instrument Hardware Changes
Recalling a saved register that uses a hardware option that has been
removed results in unspecified operation. Re-install the needed option
before atte mpting to recall the asso ciated regi st e r(s).
50 Chapter 2
Page 51

Using USER Keys
Main Menu
You can use user keys to move quickly between fields on the same
screen, and to access fields that are not normally available on the
screen you are using.
Local user keys are used to move between settings on the sc re en tha t is
displayed. Five local user keys are avai lable for eac h screen:
and k5 . When the user key is pressed, the cursor instantly moves to, a nd
selects, the assigned field; eliminating the need to turn and push the
knob. Using these keys removes any other local user keys you may have
set up.
Global user keys are used to access settings that are not available on
the current screen. Three global user keys are available:
(Use the Shift key to access the global user keys)
Using Pre-Defined USER Keys
Operating Ov erview
Using USER Keys
k1, k2, k3, k4,
k1’, k2’, an d k3’.
To Use the Pre-Assigned Local USER Keys
Step 1. Press and release the
Shift key, the k4 key; then the Enter key.
The numbers 1 through 5 appear in front of various fields.
(See figure 2-8.)
Step 2. Press the USER keys (
k1 to k5) and notice how the cursor
immediately moves to the corresponding field.
Step 3. To stop using the default user keys, press and release the
key, then the k5 key to access the Release function; then press
the Enter key.
Figure 2-8 An Example of Pre-Assigned Local User Keys
USER
k1’
k1
k2’
k2
k3’
k3
Assign
k4
Release
k5
Shift
Chapter 2 51
Page 52

Ope rati ng Overvi ew
Main Menu
Using USER Keys
Assigning and Releasing USER Keys
When defining user keys, the Assign function is used to create key
definitions; the
user key to a different field automatically releases it from its previous
setting.
To assign local user keys
Step 1. Move the cursor to the field that you want to assign to a local
user key.
Release function removes the definitions. Re-assigning a
Step 2. Press and release the
Assign function. Then press a USER key (k1-k5). The user key
Shift key, then the k4 key to access the
number appears in front of the field you assigned it to. (Since
the cursor is at the newly assigned field, the USER key
number is hidden until the cursor is moved.)
To release local user keys
Step 1. Display the screen containing the user key assignment to be
removed.
Step 2. Press and release the
Release function; then press the USER key (k1-k5).
Shift key, then the k5 key to access the
To assign global user keys
Step 1. Move the cursor to the field you want to assign a g lobal USER
key to.
Step 2. Press and release the
Assign function. Then press Shift and a USER key (k1’- k3’).
Shift key, then the k4 key to access the
Unlike a local user key, the user key number does not appear
at this field; instead, a prompt appears at the top of the screen
confirming the key assignment.
52 Chapter 2
To release global user keys
Step 1. Move the cursor to the field with the global user key assigned
to it.
Step 2. Press and release the
Release function. Then press Shift and the user key to be
Shift key, then the k5 key to access the
released.
Page 53

Replacing Batteries
Main Menu
There are two methods by which the Test Set backs up its RAM. One is
a set of two AA batteries mounted behind the rear panel of the Test Set.
You must periodically change these batteries. The second method of
RAM backup is an internal battery. It is not user serviceable.
CAUTION Failure to take prompt action may result in loss of RAM
NOTE Do not use rechargeable batteries.
To change the AA batteries, use the following procedure:
1. Turn off power and unplug the Test Set.
2. Remove the six screws in the rear panel using a TX-15 TORX (R)
screwdriver.
Operating Ov erview
Replacing Batteries
data including IBASIC programs and SAVE / RECALL
states stored in the RAM.
3. Remove the rear cover.
4. Replace the AA batteries.
5. Replace and reconnect the rear panel. Dispose of used batteries
properly.
Chapter 2 53
Page 54

Ope rati ng Overvi ew
Main Menu
Replacing Batteries
54 Chapter 2
Page 55

3 Overview of the Test Set’ s
Main Menu
Built-In Tools
• "Using RF Tools Program" on page 56
• "Using the Code Domain Analyzer" on page 67
• "Using the Spectrum Analyzer" on page 68
• "Using the Voltmeter and Audio Frequency Counter" on page 70
• "Using the Oscilloscope (Scope)" on page 71
• "Securing a Test Procedure" on page 75
• "Clearing RAM" on page 76
• "Using the LISTOPTS (list options) Program" on page 77
• "Using the DEMO Program" on page 78
• "Using the ST_PLT (store or plot) Program" on page 79
55
Page 56

Overview of the Test Set’s Built-In Tools
Main Menu
Using RF T ool s Pr ogram
Using RF Tools Program
The RF Tools Program resides in the Test Set’s ROM. The following
tests and utility programs are available in this program.
See Figure 3-1 on page 57 for instructions on loading the RFTOOLS
program.
To run the tests or utilities in the RFTOOLS program:
1. Choose the test or utility you want to run from the list of choices.
2. Fill in the parameters that are displayed for each test.
The following tests and utility programs are available in this program.
• "Swept Gain" on page 58
• "Discrete Freq Insertion Loss" on page 59
• "Swept Insertion Loss" on page 59
• "Swept Return Loss" on page 60
• "Cable Fault" on page 62
• "Replot Data Files" on page 65
• "Transfer Stored Data" on page 65
• "SA (spectrum analyzer) Self Calibration ON/OFF" on page 65
• "Catalog PC (Memory) Card" on page 66
• "Set Up Printer/Data Collection" on page 66
56 Chapter 3
Page 57

Figure 3-1 Loading and Running RF Tools
Main Menu
Overview of the Test Set’s Built-In Tools
Using RF Tools Program
Press Menu to display the Software Menu
1
screen.
Position the c ursor at ROM and select it .
3 4
Posi ti on th e cursor at Select Procedure
2
Location: and select it.
Posi ti on th e cursor at Select Procedure
Filename: and select it.
ROM
Position the c ursor at Choices: and
5
select RFTOOLS.
RFTOOLS
XXXXXX
YYYYYY
Position the cursor at Run Test and
6
select it. The Software is now loading.
Loading Time:
Firs t ti m e :
approximately
three m i nutes.
After first time:
approximately
15 seconds.
Chapter 3 57
Page 58

Overview of the Test Set’s Built-In Tools
Main Menu
Using RF T ool s Pr ogram
Swept Gain
This test measures the gain of a device by sweeping it over the specified
frequency range. In the menu for this test, you can enter the frequency
range over which the devi ce is to be swept, the level into the device from
the DUPLEX OUT port, and the maximum expected gain.
This test requires tw o 6-dB pads (a ttenua tor s ). The pads a re put on t he
Test Set’s ANT IN and DUPLEX OUT ports to reduce impedance
mismatch error at these ports. A reference level is obtained by
connecting a short calibration cable between the pads on the DUPLEX
OUT and ANT IN ports. Next, the test device is added between the
calibration cable and one of the pads, and a measurement is made of the
additional gain from the reference level. The trace of the device gain
over the frequency range swept is d i s played . The maximum gain is also
displayed on the screen.
58 Chapter 3
Page 59

Overview of the Test Set’s Built-In Tools
Main Menu
Using RF Tools Program
Discrete Freq Insertion Loss
This test measures the loss of a ca bl e or device a t a specif i ed freq uenc y.
This test is the most accurate method for measuring insertion loss. In
the menu for this test, you can enter the discrete frequency and signal
level at which the measurement will be made.
This test requires two 6-dB pads. The pads are put on the ANT IN and
DUPLEX OUT ports on the Test Set to reduce impedance mismatch
error at these ports. A reference level is obtained by connecting a short
calibration cable between the pads on the DUPLEX OUT and ANT IN
ports. Next, the test cable or device is added between the calibration
cable and one of the pads, and a measurement is made of the addition
loss from the reference level. The insertion loss at the specified
frequency is displayed on the screen.
NOTE The insertion loss at the specified frequency is displayed twice. The
second disp la y is en la rged for easier reading.
Swept Insertion Loss
This test measures the loss of a cable or device by sweeping it over the
specified frequency range. In the menu for this test, you can enter the
frequency range over which the cable is to be swept.
This test requires two 6-dB pads. The pads are put on the ANT IN and
DUPLEX OUT ports on the Test Set to reduce impedance mismatch
error at these ports. A reference level is obtained by connecting a short
calibration cable between the pads on the DUPLEX OUT an ANT IN
ports. Next, the test cable or device is added between the calibration
cable and one of the pads, and a measurement is made of the addition
loss from the reference level. The trace of the cable loss over the
frequency range swept is displayed. The average loss is also displayed
on the screen.
Chapter 3 59
Page 60

Overview of the Test Set’s Built-In Tools
Main Menu
Using RF T ool s Pr ogram
Swept Return Loss
This test radiates a test signal when testing antennas or cables with
antennas attached to them. Verify that the level and frequency span
used for the test cannot result in interferenc e to other nearby antenna s.
To minimize interference when running the program, set the power
level at the DUPLEX OUT port to the minimum value needed for good
measurement resolution. Set the frequency range carefully.
This test measures the return loss of a cable or device in the swept
mode. A SWR bridge and two 6 dB pads are connected to the Test Set.
The pads are used to reduce impedance mismatch errors between the
SWR bridge and the DUPLEX OUT and ANT IN ports on the Test Set.
You will be prompted at the start of the test to enter the start and stop
frequencies. A reference level is measured first with a short or open on
the DUT port of the SWR bridge. Then the return loss is measured with
the cable or ante nna-und er-test. The trace showing r etur n loss over the
frequency band selected is d isplayed on the screen. Measur ed values for
best and worst case return loss are printed at the top of the screen.
VSWR can be calculated from the return loss.
The following formula can be used to determine the VSWR from the
return loss:
VSWR
RL–
---------20
+
RL–
---------20
–
VSWR
110
-----------------------=
110
VSWR is sometimes stated as a ratio. For example: 1.2:1 or “one point
two to one” VSWR. The first number in the ratio is calculated from the
formula above. The second number in the rati o i s always one. Table 3 -1
and Table 3-2 contain some of the values from this calculation.
Table 3-1 Return Loss (0 to 20 dB) to VSWR
Return Loss (dB)0 2 4 6 8 101214161820
VSWR 8.7 4.4 3.0 2.3 1.92 1.67 1.50 1.38 1.29 1.22
Table 3-2 Return Loss (20 to 40 dB) to VSWR
Return Loss (dB) 20 22 24 26 28 30 32 34 36 38 40
∞
VSWR 1.22 1.17 1.13 1.11 1.08 1.07 1.05 1.04 1.03 1.03 1.02
60 Chapter 3
Page 61

Overview of the Test Set’s Built-In Tools
Main Menu
Using RF Tools Program
Estimating Antenna Return Loss
If you are measuring the return loss of an antenna connected to the end
of a known good feed line, you can determine the approximate return
loss of the antenna by subtracting twice the line loss. For example, if
you measure a return loss of 24 dB and the line is known to have 2 dB
loss, the estimated return loss of the antenna is 20 dB (since there is a
total of 4 dB of loss as the signal is sent to the SWR bridge and reflected
back to the Test Set). This estimate is in error if the coaxial line and
connectors do not have a return loss somewhat greater than 24 dB.
Chapter 3 61
Page 62

Overview of the Test Set’s Built-In Tools
Main Menu
Using RF T ool s Pr ogram
Cable Fault
NOTE Test Signal Can Cause Interference
When testing cables attac hed to a ntenna s, test s i gna ls w ill b e r adi ate d.
Verify that the signal used for the test cannot result in interference to
another antenna.
This test operates over a wide frequency band. The test will always
operate with a center frequency of 505 MHz. The frequency span
however will be d etermined b y the length of the ca ble measured. L onger
cables will use a narrower frequency span. The frequency span equals
990 MHz for cables less than 50 feet long and gets narrower as the
cable length increases. It is always safe to assume that the frequency
span is less than or equal to 990 MHz.
This test displays the return loss of a transmission line as a function of
the distance down the line. A frequency-swept s ignal fr om the DUPLEX
OUT port is applied through a resistive power divider to the
cable-under-test. Signals r eflect ed from f aults in the ca ble are c ombined
with the DUPLEX OUT signal in the power divider and applied to the
ANT IN port. The changing interference of the forward and reflected
signals, over the swept frequency band, contains information about the
distance to one or more faults. The software uses a Fast Fourier
Transform (FFT) to convert the frequency domain into the distance
domain. The distance displayed on the Test Set’s CRT is the physical
distance to the fault with correction for the velocity factor of the cable.
Cable Fault Performance
Measurements of the cable fault location can typically be made up to
500 feet on low-loss cables and 300 feet on higher-loss cables.
Resolution of the fault location is approximately 0.4 feet for cable
lengths up to 50 feet and then linearly increases to 4 feet for a 500 foot
cable.
62 Chapter 3
Page 63

Overview of the Test Set’s Built-In Tools
Main Menu
Using RF Tools Program
Selec ting Cable Type
In the menu for this test, you can enter the following information:
• Cable length
• Cable length units
• Pressing the knob toggles the selection between feet and meters.
• C able class
• Pressing the knob allows selection of Heliax, RG, and custom
options.
• The next menu varies depending on the selection for cable class:
•If Custom is selected, you can enter the cable’s velocity of
propagation constant and attenuation per 100 feet (or meters).
The propagation velocity must be a value between 0 and 1.
•If RG is selected, you can enter the cable type with the example
[RG 58/U = 58]. You must enter a value between 0 and 1000.
•If Heliax is selected, you can enter the cable type. A list of
choices (foam, air, and flex of varying thickness) is displayed. Use
the knob to select the desired cable type.
•Press
k1 (or select Be gi n Te st) when all the appropriate entries
have been made.
• Connect the cables as instructed, and press
k1 (Proceed).
Velocity factors and attenuation. Cables that use polyethylene
dielectric typ ically have a propagati on v el oci ty of 0.66, cables tha t use a
teflon dielectric typically have a propagation velocity of 0.70. If the
cable attenuation is unknown, enter 0 dB per 100 feet (or meters).
Entering 0 dB/100 will produce return loss values lower than actual,
but fault distance can be accurately detected.
Chapter 3 63
Page 64

Overview of the Test Set’s Built-In Tools
Main Menu
Using RF T ool s Pr ogram
Typical cable fault return loss measurements. Return loss is a
ratio of input power to reflected power. For example, if 100 Watts was
applied to a cable and 10 Watts was returned, the return loss is 10 dB
(10 log (100/10)). In the same example, if 1 Watt was returned, the
return loss is 20 dB (10 log (100/1)). Typical return loss measurements
for the cable loss test are listed below:
• Open-Circuit Cable = 0 dB
• Short-Circuit Cable = 0 dB
• 50-Ohm Terminated Cable = 20 to 30 dB
• Antenna = 10 to 20 dB
Return loss measurements below 25 dB should be considered
excellent. For best results, the cable output should be terminated in
50 ohms.
Entering Cable Leng th
The greatest accuracy is obtained when you enter a cable length
slightly greater than the actual cable length, considering length
uncertainty. If you are not sure of the cable length, enter a value 1.5
times the estimated length. Depending on the return loss of the
antenna or device at the end of the cable, you may see a high relative
mismatch displayed at the actual length of the cable.
64 Chapter 3
Page 65

Overview of the Test Set’s Built-In Tools
Main Menu
Using RF Tools Program
Replot Data Files
This utility allows you to easily retrieve and display plots which were
previously stored on an SRAM PC card. One or two plots may be
displayed at one time.
No measurements are performed.
Transfer Stored Data
This utility may be used to easily transfer data collection files (test
results) from an SRAM PC card over the serial or HP-IB port. You do
not need to write an IBASIC program. No measurements are
performed.
SA (spectrum analyzer) Self Calibration ON/OFF
This test allows you to check the status of the Test Set’s spectrum
analyzer, and change the status if you desire.
The RFTOOLS program uses the Test Set’s i nter nal s pectr um analyzer
for making network analyzer measurements. The internal spectrum
analyzer performs an automatic self calibration every 5 minutes. This
automatic self calibration insures that the spectrum analyzer operates
within specified limits regardless of the operating temperature.
However, this self calibration can introduce instability in spectrum
analyzer output after the Test Set is operating at a constant
temperature (after approximately 30 minutes).
Each RFTOOLS test includes two parts; calibration and measurement.
If the spectrum analyzer performs a self calibration between the
calibration and measurement of the RFTOOLS test, the spectrum
analyzer automatic self calibration instability will increase RFTOOLS
test measurement error. To avoid this problem, you may use this test to
turn off the spectrum analyzer self calibration. This self calibration
should only be turned off after the unit has reached a constant
powered-on operating temperature (approximately 30 minutes after
power-on). By turning the self calibration off, the measurement
accuracy and stability of RFTOOLS tests will improve.
Chapter 3 65
Page 66

Overview of the Test Set’s Built-In Tools
Main Menu
Using RF T ool s Pr ogram
Catalog P C (Me m or y) C ar d
This utility lis ts all the files c ontained on the PC car d. The PC card that
you want to catalog must be inserted prior to selecting this test.
• LIF file types are denoted by the following prefixes and suffixes:
• c prefix denotes a program code file
• l prefix denotes a library file
• p prefix denotes a procedure file
• _d suffix denotes a data file
• _p suffix denotes a plot file
• DOS file types are denoted by the following suffixes:
• .PGM suffix denotes a program code file
• .LIB suffix denotes a library file
• .PRC suffix denotes a procedure file
• .DAT suffix denotes a data file
• .PLT suffix denotes a plot file
Set Up Printer/Data Co ll ection
This utility allows you to c oll ec t measurement d ata using a printer or a
PCMCIA card. The following table shows the parameters that can be
set using this utility. These parameters can also be found on the
PRINTER CONFIGURE screen and the I/O CONFIGURE screen.
Table 3-3 Parameters for Set Up Printer and Data Collection
• Data Collection
•Off
• Serial 9
• Serial Baud
• Parity
• Data Length
• Stop Length
• Flow Control
• None
• Xon/Xoff
• Hardware
• PCMCIA
• Printer
• Off
•Serial 9
• Serial Baud
• Parity
• Dat a Length
• Stop Length
• Flow Control
• None
• Xon/Xoff
• Hardware
• P arallel 15
• H PIB 701
• Printer
Configuration
• Lines/Page
• Form feed at
start of page
• Form feed at
end of page
• HPIB Address
• Output
Heading 1
• Output
Heading 2
66 Chapter 3
Page 67

Overview of the Test Set’s Built-In Tools
Main Menu
Using the Code Domain Analyzer
Using the Code Domain An al yzer
The code domain analyzer graphically displays the power, phase, and
timing of the CDMA signal’s 64 Walsh channels. It is a correlated
measurement, requiring an external timing signal, such as the even
second clock or the 16 × chi p (19.6608 MHz) clock , to in it iate a vali d
measurement.
Selecting the Code Domain Anal yz er’s Co ntr ol s Menus
Several levels of menus are used to access the various controls
associated with the code domain analyzer. "Cont rol Fields for CDMA
Measurements" on page 93 provides a description for each field on the
code domain analyzer’s menus. See "CDMA Measurements" on page 82
and the HP 8935 CDMA Base Station Tests Applications Guide for more
information about code domain measurements.
Figure 3-2 Code Domain Analyzer Menus
Chapter 3 67
Page 68

Overview of the Test Set’s Built-In Tools
Main Menu
Using the Spectrum Analyzer
Using the Spectrum Analyzer
Automatic Cali br ati on
During operation, the spectrum analyzer pauses for approximately
2 seconds every 5 minutes to recalibrate itself. This does not affect the
accuracy of displayed measurements, but does cause a brief
interruption of the displayed information during the process.
Setting Resolutio n Ba ndwidt h and Sweep R ate
The resolution bandwidth and sweep rate are determined by the span
setting, and cannot be set independently.
These settings are listed in the following table.
Table 3-4 Relationship Between Span, Resolution Bandwidth, and Sweep Rate
Span
<50 kHz 0.3 28.6 kHz/second
<200 kHz 1.0 329.0 kHz/second
<1.5 MHz 3.0 3.0 MHz/second
<3 MHz 30.0 21.4 MHz/second
<18 MHz 30.0 36.3 MHz/second
<200 MHz 300.0 257.0 MHz/second
1 GHz 300.0 1.0 GHz/second
Resolution BW
(kHz)
Sweep Rate
68 Chapter 3
Page 69

Overview of the Test Set’s Built-In Tools
Main Menu
Using the Spectrum Analyzer
Selecting the Spectrum Analyzer’s Controls Menus
Several levels of menus are used to access the various controls
associated with the spectrum analyzer (see "Spectrum Analyzer
Controls Menus" on page 69).
"Control Fields for Analog Measurements" on page 123 provides a
description for each field on the spectrum analyzer’s menus.
Figure 3-3 Spectrum Analyzer Controls Menus
Chapter 3 69
Page 70

Overview of the Test Set’s Built-In Tools
Main Menu
Using the Vol t m et er a nd Au di o Frequency Counter
Using the Voltme te r and Aud io Frequency Count er
The voltmeter can be used to measure ac and dc voltages. The input to
the voltmeter is determined by the AF Anl In field on the AF
ANALYZER screen.
To measure external voltages:
1. Select the AF ANALYZER screen.
2. Set the AF Anl In field to Audio In.
3. Set the Audio In Lo field to match the source you are measuring
(600 ohm impedance, floating output amplifier, ground referenced
voltage). See the "Audio In Lo" field on page 127 for mor e
information.
4. Connect the signal to be measured to the AUDIO IN connector(s).
The AUDIO IN HI connector can be used alone as long as the Audio
In Lo field is set to Gnd. The AUDIO IN LO connector must also be
used if the Audio In Lo field is set to 600 to Hi or Float.
The ac level is displayed. See Figure 3-4 .
5. Select the lower-right measurement display field. See Figure 3-4 .
• Select DC Level to display the dc level.
• Select AF Freq to display the audio frequency.
Figure 3-4 Measuring AC and DC Voltages
Set to
Audio In.
AC Level
Set to
DC Level or
AF Freq.
Set to match
source.
70 Chapter 3
Page 71
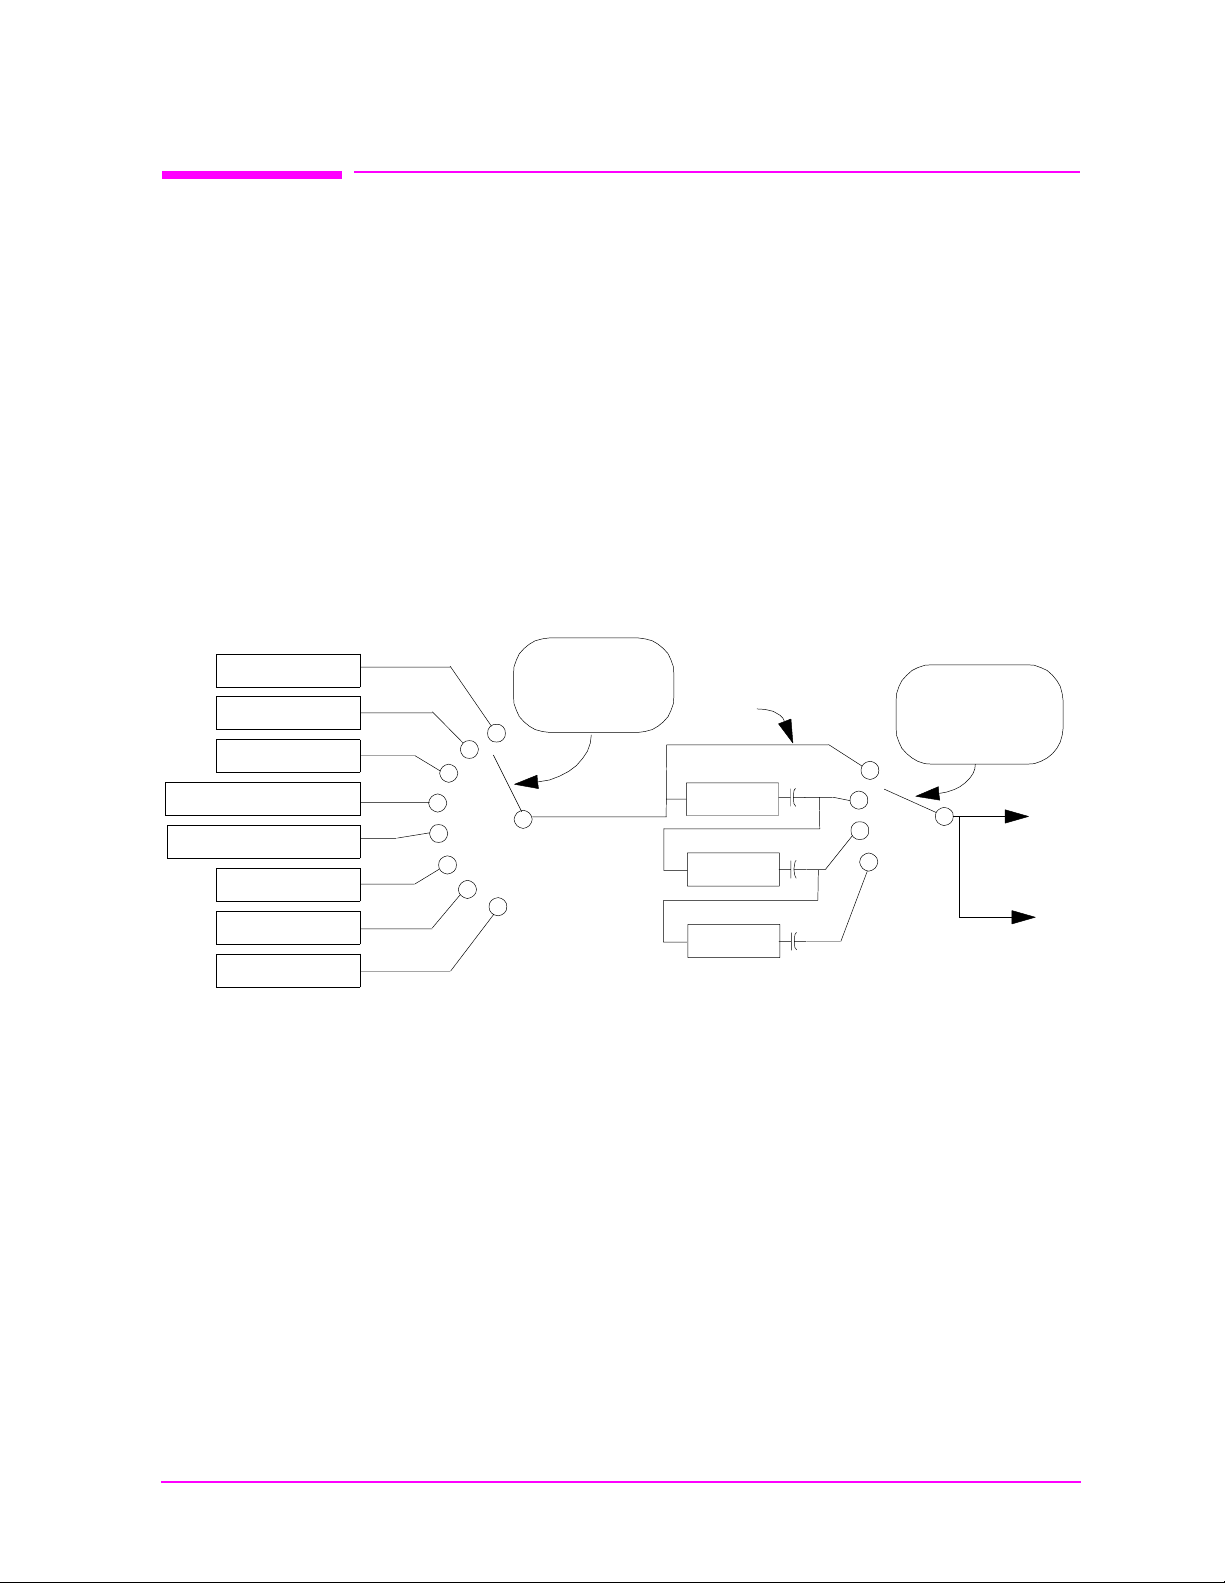
Overview of the Test Set’s Built-In Tools
Main Menu
Using the Oscilloscope (Scope)
The built-in 50 kHz oscilloscope provides
• multiple triggering formats (internal and external)
• single-shot and pre-trigger viewing for single events
• full marker capability with automatic level and time readout
Time/division, volts/division and vertical offset are displayed and can be
changed using the front-panel knob.
Input to the oscilloscope is provided from various sources including
direct inputs to the AUDIO IN (HI and LO) an d A NA LOG
MODULATION IN connectors. Oscilloscope functions are accessed from
the AF ANALYZER and SCOPE screens.
Figure 3-5 Inputs and Filters for the Oscilloscope
Using the Oscilloscope (Scope)
FM Demod
AM Demod
SSB Demo d
Audio In connector
Ext Mod connector
FM Mod
AM Mod
Audio Out
Controlled by
AF Anl In
field
Input
Filters
De-emp
Notch
Controlled by
Scope To
field
To
Scope
To
Scope Monitor
Output connector
Chapter 3 71
Page 72

Overview of the Test Set’s Built-In Tools
Main Menu
Using the Oscilloscope (Scope)
Selecting the Oscil loscope ’s Input
Step 1. Press Shift, then RF Anl (AF Anl) to select the AF ANALYZER
screen.
Step 2. Select the AF Anl In field. A list of choices appears.
Step 3. Select the desired input to the scope:
• FM De mod for FM demodulated audio from input signals connected
to the RF IN/OUT or ANT IN connectors.
• AM De mod for AM demodulated audio from input signals connected
to the RF IN/OUT or ANT IN connectors.
• SSB Demod for SSB demodulated audio from input signals
connected to the RF IN/OUT or ANT IN connectors.
• Audio In for a signal connected to the AUDIO IN connector.
• Ext Mod for a signal connected to the ANALOG MODULATION IN
connector.
• FM Mod for the FM modulated audio from the RF generator section.
• AM Mod for the AM modulated audio from the RF generator section.
• Audio Out for the signal present at the SCOPE MONITOR
OUTPUT connector.
The input to the oscilloscope is displayed on the SCOPE screen.
Selecting the Oscilloscope’s Filters
Step 1. Press Shift, then RF Anl (AF Anl) to select the AF ANALYZER
screen.
Step 2. Select the Scope To field. A list of choices should appear.
Step 3. Select the desired filtering for the signal:
• Input if you want no filtering (dc coupled)
• Filters to rout e the audi o to the oscilloscope after passing through
Filters 1 an d 2 (ac coupled).
• De-emp to route the audio to the oscilloscope after passing through
Filters 1 and 2, and the de-emphasis circuitry (ac coupled).
72 Chapter 3
• Notch to route the audio to the oscilloscope after passing through
Filters #1 and #2, the de-emphasis circuitry, and notch circuitry (ac
coupled).
Page 73

Triggering the Oscilloscope
Main Menu
You can control following triggering features of the oscilloscope:
• Trigger external or internal
• Automated or normal triggering
• Continuous or single shot triggering
• Trigger level
• Trigger delay
The oscilloscope is triggered using the Trigger menu. Select this menu
with the following procedure:
Overview of the Test Set’s Built-In Tools
Using the Oscilloscope (Scope)
Step 1. Press
Step 2. Select the Controls field, then choose Trigger from the list
of choices.
Shift, then Spec Anl (Scope) to go to the SCOPE screen.
Using the O scillosco pe’ s M ar ker
The marker is used to help you make measurements with the
oscilloscope. By repositioning the marker, you can measure the level
and time.
The marker is controlled usi ng the marker menu. Select this m enu with
the following procedure:
Step 1. Press
Step 2. Select the Controls field, the choose Marker from the list of
choices.
Shift, then Spec Anl (Scope)to go to the SCOPE screen.
Chapter 3 73
Page 74

Overview of the Test Set’s Built-In Tools
Main Menu
Using IB_U TI L P rograms
Using IB_UTIL Programs
See "Securing a Test Procedure" on page 75 for information about the
SECURE_IT program. See "Clearing RAM" on page 76 for informat io n
about the RAM_MANAGER program.
COPY_PL
The COPY_PL program allows you to copy procedures and libraries
from one PC card to another. See the HP 8935 Programmer’s Guide for
more information about procedures and libraries.
FILE_XFER
The FILE_XFER (file transfer) program transfers files on a PC card to a
device attached to either the HP-IB or to SERIAL PORT 9.
RAM_USAGE
The RAM_USAGE program lists the following information about the
Test Set’s RAM:
• Total RAM installed
• RAM disk allocations
• Save register allocations
• Approximate RAM available for IBASIC programs
74 Chapter 3
Page 75

Securing a Test Procedure
Main Menu
The password option for securing a test procedure is accessed by
loading and running the SECURE_IT ROM program. This program is
accessed by running the IB_UTIL program .
Step 1. Select the SOFTWARE MENU screen.
Step 2. Select the Select Procedure Location: field and choose
ROM.
Step 3. Select the Select Procedure Filename: fie ld.
a. Select IB_UTIL from the list of programs. Press Run Test to
display a list of procedures; select SECURE_IT and follow
directions to secure the desired information.
Overview of the Test Set’s Built-In Tools
Securing a Test Procedure
Chapter 3 75
Page 76

Overview of the Test Set’s Built-In Tools
Main Menu
Clearing RAM
Clearing R AM
RAM can be cleared using the RAM_MANAGER program in the Test Set’s
ROM. This program clears all RAM, including any SAVE/RECALL
registers saved to Internal RAM.
This program is accessed by running the IB_UTIL program.
Step 1. Select the SOFTWARE MENU screen.
Step 2. Select the Select Procedure Location: field and choose
ROM.
Step 3. Select the Select Procedure Filename: field.
•Select IB_UTIL from the list of programs. Pres s Run T est to
display a list of procedures; select RAM_MANAGER and fo llow
directions to clear RAM.
To preserve the SAVE/RECAL L registers, do not use the RAM_MANAGER
program. Instead, load any o ther test program from a c ard or f rom RAM
to clear the previous test program, and then reload the desired test.
See the "Save/Recall" field on page 179, and "Savi ng and Rec alling
Instrument Setups" field on page 48 for more info rmation ab o u t
save/recall registers.
76 Chapter 3
Page 77

Overview of the Test Set’s Built-In Tools
Main Menu
Using the LISTOPTS (list options) Program
Using the LISTOPTS (lis t opti ons ) Pr ogra m
You can list the options that a r e installed in your Test Set ( i f a ny) using
the LISTOPTS program. LISTOPTS a lso d i s plays the f i rmware v er sion
of your Test Set.
To run the LISTOPTS program
Step 1. Select the SOFTWARE MENU screen.
Step 2. Select the Select Procedure Location: field and choose
ROM.
Step 3. Select the Select Procedure Filename: fie ld.
Step 4. Select LISTOPTS from the list of programs.
Step 5. Press Run Test to run the program and follow the directions
on the screen.
Chapter 3 77
Page 78

Overview of the Test Set’s Built-In Tools
Main Menu
Using the DE MO Program
Using the DEMO Progra m
You can use the DEMO program to learn about the capabilities of the
Test Set. This program demonstrates some of the most useful features
of the Test Set.
To run the DEMO program
Step 1. Select the SOFTWARE MENU screen.
Step 2. Select the Select Procedure Location: field and choose
ROM.
Step 3. Select the Select Procedure Filename: field.
Step 4. Select DEMO from the list of programs.
Step 5. Press Run Test to run the program and follow the directions
on the screen.
78 Chapter 3
Page 79

Overview of the Test Set’s Built-In Tools
Main Menu
Using the ST _P LT (store or plot) Pr ogram
Using the ST_PLT (store or pl ot) Pro gra m
This program allows you to store a spectrum analyzer, or oscilloscope
trace on PC card or to plot a stored trace from a PC card.
To run the ST_PLT program
Step 1. Select the SOFTWARE MENU screen.
Step 2. Select the Select Procedure Location: field and choose
ROM.
Step 3. Select the Select Procedure Filename: fie ld.
Step 4. Select ST_PLT from the list of programs.
Step 5. Press
directions on the screen.
Step 6. Press
as frequency, level, span, and so forth).
k1 (Run Test) to run the program and follow the
k2 (Show Info) to display the trace’s parameters (such
Chapter 3 79
Page 80

Overview of the Test Set’s Built-In Tools
Main Menu
Using the ST_PLT (store or plot) Program
80 Chapter 3
Page 81

4 CDMA Measurements - Screens
Main Menu
and Control Fields
• “Average Power Measurements” on page 82
• “Channel Power Measurements” on page 83
• “Rho Measurements” on page 84
• “Error Vector Magnitude (EVM) Measurements” on page 88
• “Code Domain Measurements” on page 89
• “Control Fields for CDMA Measurements” on page 93
81
Page 82

CDMA Measurements - Screens and Control Fields
Main Menu
Average Power Measurements Average Power Measurements
CDMA Measurements
Average Power Measurements
Avg Pwr
Avg Pwr displays the average power level of all signals at the RF
IN/OUT port. The units (watts, volts, or dBm) can be changed by
positioning the cursor in front of the units field and then pressing the
desired units key. (See "Input Port" field on page 136.) Refer to the
HP 8935 CDMA Base Station Tests Application s Guide for more
information about average power measurements.
Screens on which this measurement is displayed.
• CDMA ANALYZER
• CDMA GENERAT OR
ADC FS
ADC FS is displayed when average power is measured. ADC FS
indicates how close the measured power level is to the maximum
allowed input level at the RF IN/OUT port for a particular Pwr Gain
setting (on the CDMA ANALYZER screen). Changes to ADC FS can be
made by altering the Pwr Gain field setting and by altering the sig nal
level into the RF IN/OUT port. ADC FS should be between −1.0 and −10
dB when the Pwr Gain field is set to Auto
to −0.5 dB when set to Hold
FS goes above −0.5 dB. Measurement accuracy may be degraded if ADC
FS goes below −10 dB.
Screens on which this measurement is displayed.
• CDMA ANALYZER
• CDMA GENERAT OR
. The measurement will be aborted if ADC
, and can be manually set up
82 Chapter 4
Page 83

CDMA Measurements - Screens and Control Fields
Main Menu
Channel Power Measurements Channel Power Measuremen t s
Channel Power Measurement s
Chan Pwr
Channel power is the absolute power level of the RF signal in a
1.23 MHz b andwidth centered around the RF channel or tune
frequency setting. This measurement must be calibrated using the
Chan Pwr Cal field each time the tune frequency is changed. Refer to
the HP 8935 CDM A Base Station Tests Application s Guide for more
information about channel power measurements.
ADC FS
ADC FS is displayed when channel power is measured. ADC FS
indicates how close the measured power level is to the maximum
allowed input level at the RF IN/OUT port for a particular Gain sett ing
(on the CDMA ANALYZER screen). Changes to ADC FS can be made
by altering the Gain field setting and by altering the signal level into
the RF IN/OUT port. ADC FS should be between −1.0 and −10 dB when
the Gain field is set to Auto
when set to Hold. The measurement will be aborted if ADC FS goes
above −0.5 dB. Measurement accuracy may be degraded if ADC FS goes
below −10 dB.
, and can be manually set up to −0.5 dB
Screens on which this measurement is displayed.
• CDMA ANALYZER
• CDMA GENERATOR
Chapter 4 83
Page 84

CDMA Measurements - Screens and Control Fields
Main Menu
Rho Measurements Rho Measurements
Rho Measurements
Rho
Rho is a measure of CDMA waveform quality which indicates how well
the measured signal (the pilot signal transmitted by the base station
under test) corr ela tes w ith the ideal reference waveform (the ideal pi lot
generated by the Test Set which is mathematically perfect). This
measurement is done through a complex DSP algorithm. Perfect
correlation is when rho is equal to 1. The CDMA standard specifies
0.912 as the minimum accepted performance for CDMA base stations.
To make rho measurements, the base station needs to be configured to
transmit only a pilot signal. The test equipment is then triggered by
any of the selectable CDMA clocks.
Many different things can contribute to rho failure; this is a short list of
them:
• compression in the linear power amplifier
• phase non-linearities (group delay)
• carrier feedthrough (see "Carrier Feedthrough" on page 87)
• I/Q magnitude and phase errors (see "Magnitude Error" on page 88
and "Phase Error" on page 88)
Figure 4-1 Rho
Power that correlates with ide al
0OWERTHATCORRELATESWITHIDEAL
ρ
Total Power
4OTAL 0OWER
Signal Power
ρ
ρ
Screens on which this measurement is displayed.
• CDMA ANALYZER
• CDMA GENERAT OR
3IGNAL0OWER
Signal Power + Error Power
3IGNAL0OWER%RROR0OWER
0.912
84 Chapter 4
Page 85

CDMA Measurements - Screens and Control Fields
Main Menu
Rho Measurements R ho Measu rements
Frequen c y E r ror
Frequency error is displayed when the Rho m easurement is selected.
Frequency error is the differ ence betwe en the base s tation’s transmitter
frequency and the frequency you enter in the Tune Freq field.
Screens on which this measurement is displayed.
• CDMA ANALYZER
• CDMA GENERATOR
Time Offset
Time offset is displayed when the Rho m easurement is selected. Time
offset is the time difference between the base station’s even second and
the start of the short sequence. It indicates how well your transmitter’s
signal is time-aligned to system time. Time offset is measured at the
base station’s antenna. The displayed value is based on the value
entered in the PN Offset field. (See the PN O ffset field description, on
page 106.)
In Figure 4-2 on page 86 the first example is a measurement with a
time offset of zero. The beginning of the received data block aligns with
the first pilot PN chip of the reference signal. Zero time offset indicates
that the trigger event to t he CDMA Analyze r coi ncid ed with the a rri val
of the base station signal’s first pilot PN chip.
When the base station’s signal is delayed relative to the trigger event,
time offset will be a positive value. The second example is a
measurement with a positive time offset. The beginning of the data
block will align with a portion of the reference signal toward the end of
a pilot PN sequence. This indicates that the trigger event to the CDMA
Analyzer occurred when the base station was still transmitting a pilot
PN sequence prior to the first pilot PN chip of the expected sequence.
When the base station’s signal is early relative to the trigger event,
time offset will be a negative value. The third example is a
measurement with a negative time offset. The beginning of the data
block will ali gn with a portion of the r ef er enc e signal after the first p i lot
PN chip. This indicates that the trigger event to the CDMA Analyzer
occurred after arrival of the base station signal’s first pilot PN chip.
Screens on which this measurement is displayed.
• CDMA ANALYZER
Chapter 4 85
• CDMA GENERATOR
• CODE DOM (Code Domain Analyzer)
Page 86

CDMA Measurements - Screens and Control Fields
Main Menu
Rho Measurements Rho Measurements
Figure 4-2 Time Offset
86 Chapter 4
Page 87

CDMA Measurements - Screens and Control Fields
Main Menu
Rho Measurements R ho Measu rements
Carrier Feedthrough
Carrier feedthrough is displayed when the Rho measurement is
selected. Carrier feedthrough is a common cause of bad rho
measurements. Carrier feedthrough is a result of RF carrier signal
feeding through the I/Q modulator and getting on the output circuitry
without getting modulated. A good carrier feedthrough level is lower
than −25 dB (such as −29 dB).
As shown in the diagram, a perfect constellation is offset by the
magnitude of the carrier feedthrough. In the frequency domain, carrier
feedthrough can show up as an uncorrelated energy spike that can be
seen on the spectrum analyzer by closely scanning the top of the trace.
The effects of carrier feedthrough can also show up as higher noise
levels on the CODE DOM screen. The inactive Walsh codes will be
pushing the −27 dB specification for noise. Carrier feedthrough can be
caused by the lack of isolation across the mixer and cavity of the
transmitter’s I/Q modulator. Shielding can help reduce carrier
feedthrough.
Figure 4-3 Carrier Feedthrough
Amplitude
!MPLITUDE
Frequency Domain
&REQUENCY$OMAIN
Screens on which this measurement is displayed.
• CDMA ANALYZER
• CDMA GENERATOR
• CODE DOM (Code Domain Analyzer)
#ARRIE R&EEDTHROUGH
Carrier Feedthrough
Frequency
&REQUENCY
1
I
d
e
a
l
R
e
a
l
Signal Power + Error Power
3IGNAL0OWER%RROR0OWER
ORIGIN
origin
I/Q Domain
)1$OMAIN
)
Chapter 4 87
Page 88

CDMA Measurements - Screens and Control Fields
Main Menu
Error Vector Magnitude (EVM) Measurements Error Vector Magnitude (EVM) Measurements
Error Vector Magnitude (EVM) Measurements
EVM
EVM is a measurement of the accuracy of the phase a nd amplitude of t he
QPSK (Quadrature Phase Shift Keying) or Offset QPSK (OQPSK)
modulation. Expressed as a percentage, it is the RMS magnitude value
of the error vector which connec ts the ideal si gnal phasor to a measured
signal phasor at the detection decision points.
Figure 4-4 Components of Error Vector Magnitude
Magnitude Error
al
n
g
i
S
ed
ur
g
i
S
l
a
e
d
I
E
r
r
o
r
V
e
c
t
o
r
o
r
r
E
e
s
a
h
P
l
a
n
r
I
evm1.ds4
Q
s
a
e
M
The magnitude of this error vector represents the “error” between the
ideal signal and the measured signal.
As part of the measurement, the signal is corrected for clock delay,
carrier frequency, carrier phase, and amplitude scaling.
Screens on which this measurement is displayed.
88 Chapter 4
• CDMA ANALYZER
• CDMA GENERAT OR
Magnitude Error
Magnitude Error is the difference in the RMS magnitude value (in
percent) between the ideal signal phasor and the compensated,
measured signal phasor at the detected decision points.
Phase Error
Phase Err or is the RMS value of the difference in phase (degrees)
between the ideal signal phasor and the c ompensa ted , measured s ignal
phasor at the detection decision points.
Page 89

CDMA Measurements - Screens and Control Fields
Main Menu
Code Domain Measurements Code Domain Measuremen ts
Code Domain Measurements
The following measurements are displayed on the CODE DOM (code
domain analyzer) screen: power, fast power, timing and phase.
Measurements are selected from the Measurement field on the Main
controls menu.
Time offset (Tm Ofs) and frequency offset (FreqOfs) are always
displayed when any code domain measurement is made. Carrier
feedthrough (CarFT) is also displayed except when fast power is
measured.
Code Domain Power
Other users & noise
Synch
1.2288 MHz
Paging
Pilot
User #2
User #1
freq
&REQUENCY$OMAIN
Frequency Domain
0123456789 32 63
Paging
Pilot
User
User
1
Synch
2
User
3
Code Domain
#ODE$OMAIN
Walsh Code
Chapter 4 89
Page 90

CDMA Measurements - Screens and Control Fields
Main Menu
Code Domain Measurements Code Domain Measurements
Code Domain Power (Power)
Code domain power displays the power in each of the 64 Walsh
channels, relative to the total power inside 1.23 MHz bandwidth
centered at the tune frequency. The 64 Walsh codes (0 through 63) are
represented by a verti cal b ar on the a nalyzer’s display. Because this i s a
relative measurement, the unit-of-measure is always dB. This allows a
comparison of signal levels between the pilot, sync, paging and traffic
channels. (Pilot is about two-thirds of the total energy.)
Figure 4-5 Reading Code Domain Power
Walsh 0
(Pilot)
Marker
Set to
Marker.
Screens on which this measurement is displayed.
• CODE DOM (Code Domain Analyzer)
Select the Walsh
channel.
Read code
domain po wer.
90 Chapter 4
Page 91

CDMA Measurements - Screens and Control Fields
Main Menu
Code Domain Measurements Code Domain Measuremen ts
Fast Power
Fast power is a faster method of measuring c ode domain power. A value
for Time Offset must be transferred from a non-fast power
measurement before fast measurements begin, or when changes to any
of the following fields occur: Data Rate, PN Offset, CDMA TB, Synth
Ref.
See the "Ofs Trnsfer" field on page 105 for more information.
The number of measurement averages can be entered in the Num Avgs
field on the FP Setup menu. This number is used to calculate and
display succe ssive code domain power mea s ure ments.
Screens on which this measurement is displayed.
• CODE DOM (Code Domain Analyzer)
Code Domain Timing (Timing)
Code domain timing is the difference in time between pilot (Walsh 0)
and other Walsh codes with the same forward CDMA channel. In the
CODE DOM screen, this measurement is indicated as positive or
negative bar with the size of the bar indicating how far ahead or behind
the other Walsh channels are relative to the pilot. Signals above the
reference are leading in time; signals below the reference are lagging.
(See figure 4-6.)
Screens on which this measurement is displayed.
• CODE DOM (Code Domain Analyzer)
Chapter 4 91
Page 92

CDMA Measurements - Screens and Control Fields
Main Menu
Code Domain Measurements Code Domain Measurements
Code Domain Phase (Phase)
Code domain phase is the difference in phase between the pilot and
other code channels (Walsh codes) within the same forward CDMA
channel. It displays the phase error for each of the 64 Walsh channels
relative to the pilot channel (Walsh 0). This measurement is indicated
as positive or negative bars on the Test Set’s CODE DOM screen. The
size of the bar indicates how much the phase of other Walsh codes lead
or lag the pilot. Signals above the reference are leading in phase;
signals be lo w the refer e n ce are lagging.
Figure 4-6 Code Domain Timing and Phase
4IME
7ALSH#ODE
0HASE
Screens on which this measurement is displayed.
• CODE DOM (Code Domain Analyzer)
7ALSH#ODE
92 Chapter 4
Page 93

CDMA Measurements - Screens and Control Fields
Main Menu
ADCfs or ADC FS Amplitude
Control Field s for CDMA Meas ur ement s
ADCfs or ADC FS
ADCfs indicates how close the measured power l evel is to t he maximum
allowed input level for the analyzer’s Analog-to-Digital Converter
(ADC). Th is level is affected by the Gain setting on the CODE DOM
screen, the Input Atten, Gain, and, Pwr Gain settings on the CDMA
ANALYZER screen, and the RF level of the signal connected to the Test
Set.
Amplitude
For best measurement performance, ADCfs should be between
−10 dB. The measurement will be aborted if ADCfs goes above 0 dB.
Measurement accuracy may be degraded if ADCfs goes below −10 dB.
−1.0 and
Screens o n which th is field is present
CODE DOM (Code Domain Analyzer) screen: gain controls menu
CDMA ANALYZER (ADC FS)
CDMA GENERATOR (ADC FS)
This field sets the output level of the RF generator to the RF IN/OUT or
DUPLEX OUT port. Use the DUPLEX OUT port for signal levels
greater than −26 dBm .
Screens o n which th is field is present
CDMA GENERATOR
Chapter 4 93
Page 94

CDMA Measurements - Screens and Control Fields
Main Menu
Analyzer (CDMA analyzer) Analyzer (code domain analyzer)
Analyzer (CDMA analyz er)
The Analyzer field controls three functions:
• Arm Meas arms the CDMA analyzer. The CDMA analyzer needs to
be armed only when Single
• Single/Cont selects between “single” measurements and
“continuous” measurements.
• When Single is chosen, you must arm each measurement by
selecting the Arm Meas field (see above).
(see below) is selected.
• When Cont
automatically armed.
The default selection is Cont
• Disarm disarms the CDMA analyzer during single operation. To
stop continuous measurements, select Single
does not prevent the analyzer from being re-armed during
continuous measurements
(continuous) is chosen, measurements are
Screens on which this field is present
CDMA ANALYZER
Analyze r (c ode domain analyze r)
This field is used to arm or disarm measurements when making a
single measurement (does not affect continuous measurements).
Selecting Disarm stops the analyzer during a single measurement.
See the "Measurement" field on page 104 for more information.
Screens on which this field is present
COD DOM (Code Domain Analyzer): main controls menu
.
. Selec ti ng Disarm
94 Chapter 4
Page 95

CDMA Measurements - Screens and Control Fields
Main Menu
Anl Dir Auto Zero
Anl Dir
This field is used to select the type of signal (forward or reverse link) to
analyze.
Anl Special
• Fwd
• Rev
Default selection: Fwd
sets the analyzer to look for base station transmitter data
(forward link).
sets the analyzer to look for mobile transmitter data (reverse
link).
Screens o n which th is field is present
CDMA ANALYZER
Analyz e r special mod e s change h o w I Q modul at e d sign als are analyze d.
• Normal sets the CDMA generator and CD MA a nalyzer to create and
analyze signals with standard rotation.
• Inverted sets reverse rotation for I and Q signals; opposite to the
direction specified in the IS-95 standards. In this mode, the CDMA
generator creates reverse-rotation IQ signals and the CDMA
analyzer expects reverse-rotation IQ signals.
Auto Zero
Screens o n which th is field is present
CDMA ANALYZER
This field is displayed for average power measurements.
is used to automatically zero the average power measurement
Auto
periodically during operation.
Manual
you must manually zero the average power measurement by selecting
the Pwr Zero field.
is used to override the Auto feature. When Manual is sele cted,
Screens o n which th is field is present
CDMA ANALYZER
Chapter 4 95
Page 96

CDMA Measurements - Screens and Control Fields
Main Menu
Car FT Chn Pwr Cal
Car FT
This field is a measurement display field. See "Ca rrier Feedthrough" on
page 87 for more information about this measurement.
Screens on which this field is present
COD DOM (Code Domain Analyzer)
Chn Pwr Cal
This field is displayed when the channel power measurement is
selected. It is used to calibrate the channel power measurement. When
this field is selected, an internally generated calibration signal is
measured using the average power technique. Channel power is also
measured and a correction factor is generated. This correction factor is
applied to subsequent channel power measurements. Calibration
should be performed whenever a new set of measurements is made and
whenever the frequency of the measured signal is changed. See
"Calibrating the Channel Power Measurement" on page 41 for more
information.
Screens on which this field is present
CDMA ANALYZER
96 Chapter 4
Page 97

CDMA Measurements - Screens and Control Fields
Main Menu
Controls Controls
Controls
Code domain analyzer settings are arranged into several menus that
are accessed using the Controls field. The control groups are:
• Main accesses the RF In/Ant, Tune Freq (or RF Channel),
Measurement, and Analyzer fields.
• Marker controls the marker to look at the level of individual Walsh
channels.
• Trigger accesses the trigger controls: Qual Event and Trig
Event.
• Aux accesses the PN Offset, measurement Threshold, and
measurement Interval fields.
• Gain lets you alter the gain into the CDMA analyzer while reading
the ADCfs value.
• FP Setup accesses the offset transfer and num ber of a vera ges f ields
used to make fast power measurements.
Many of these controls are duplicates from the CDMA ANALYZER and
CDMA GENERATOR screens.
Screens o n which th is field is present
COD DOM (Code Domain Analyzer): all menus
Chapter 4 97
Page 98

CDMA Measurements - Screens and Control Fields
Main Menu
CW RF Path Data Rate
CW RF Path
This field selects the path for the RF generator’s signal.
• Bypass disables the IQ modulator. This mode is used when
generating standard AM, FM, or CW signals in the Test Set.
• IQ
enables the IQ modulator.
See the "Data Source" field on page 99 for more informat ion.
Screens on which this field is present
CDMA GENERATOR
Data Rate
This field allows receiver testing at data rates of 9.6 or 14.4 Kbps.
If the data buffer is the selected data source, and the data rate is
changed, the transmission state will change to Idle. Sele ct Send to
resume data output at the new rate.
Choices
• 14. 4 Kbps
• 9.6 Kbps
Default selection: 9.6 Kbps
Screens on which this field is present
CDMA GENERATOR
98 Chapter 4
Page 99

CDMA Measurements - Screens and Control Fields
Main Menu
Data Source Data Source
Data Source
This field selects where the baseband quadrature spreader gets its
data. This field is removed when the Gen Mode field is set to Noise.
• Zeroes uses a data stream of all 0’s that is not encoded before being
applied to the baseband quadrature spreader and output.
• Ext uses external data from the DATA IN conne ctor. This d ata is no t
encoded before being applied to the baseband quadrature spreader.
• Random uses 300 frames of random, error-free data. (See Data Buff
(below) for Single/Cont, Idle/Send operation.)
• Data Buff uses data previ ously loaded into the data buffer . You can
load your own data into the buffer over HP-IB. This data is encoded
before baseband quadrature spreading. Choosing this selection
displays these additional fields:
• Single/Cont
• Single
is select ed.
• Cont
Send is selected. Changing to single operation while sending
causes the data to be interrupted after the current 20 ms
frame.
• Send/Idle
• Send
edges of the internal 80 ms clock are detected.
• Idle
transmitted. Selec tin g Idle
data at the completion of the current 20 ms frame. A data
stream of all zeroes (encoded) continues to be transmitted after
the initial data stream is interrupted. This is different from
the Zeroes selection above where the data is not encoded.
• Start Frame specifies the first frame of data to send.
• # of Frames specifies how many frames of data to send.
causes the data stream to be output once when Send
causes the d ata stream to be repeated conti nuously w hen
causes the data stream to be output after two rising
indicates that data from the buffer is not being
while sending data i nter r upts the
Screens o n which th is field is present
CDMA GENERATOR
Chapter 4 99
Page 100

CDMA Measurements - Screens and Control Fields
Main Menu
Even Sec In Gain
Even Sec In
This field controls the internal connection of the EVEN SECOND
SYNC IN connector to the CDMA analyzer.
Freq Err
• When Enable
SYNC IN connector synchronize the timing circuits.
• When Not
SYNC IN are ignored. This mode may be useful when signals other
than an even-second clock are used for synchronization. For
example, when using a one-second clock, you would select Not after
synchronization to prevent the internal even- second clock from being
retriggered half-way through its cycle.
is selected, signals applied to the EVEN SECOND
is selected, input signals applied to the EVEN SECOND
Screens on which this field is present
CDMA ANALYZER
CDMA GENERATOR
This measurement display field displays the frequenc y offset (frequency
error). See "Frequency Error" on page 85 for more information about
this measurement.
Screens on which this field is present
COD DOM (Code Domain Analyzer)
Gain
This field sets the IF gain of the CDMA analyzer for rho, EVM, and
channel power measurements. (Range: 0 dB to 36 dB in 6 dB steps.)
Gain is adjusted two ways:
• Auto measures the signal level and automatically adjusts the gain.
• Hold disables automatic operation to allow you to manually enter
the desired gain by selecting the current gain setting and entering a
new value using the keypad or cursor control knob.
This field is replaced by the Pwr Gain field when measuring average
power. See the "Input Atten" field on page 102 for more in fo rmation.
Screens on which this field is present
CDMA Analyzer
COD DOM (Code Domain Analyzer): gain controls menu
100 Chapter 4
 Loading...