

Page 1

H
Broadband Service Analyzer
User’s Guide
Page 2

Copyright
Notice
Warranty
Trademarks/
Acknowledgments
Printing history
© Hewlett Packard Australia1996
All rights reserved.
The information contained in this document is subject to change without notice.
HEWLETT-PACKARD MAKES NO WARRANTY OF ANY KIND WITH REGARD TO THIS MATERIAL,
INCLUDING, BUT NOT LIMITED TO, THE IMPLIED WARRANTIES OF MERCHANTABILITY AND FITNESS
FOR A PARTICULAR PURPOSE.
Hewlett-Packard shall not be liable for errors contained herein or for incidental or consequential damages
in connection with the furnishing, performance, or use of this material.
A copy of the specific warranty terms applicable to your product and replacement parts can be obtained
from your local Sales and Service Office.
UNIX is a registered trademark in the United States and other countries licensed exclusively through
X/Open Company Limited.
Microsoft Windows is a U.S. registered trademark of Microsoft Corporation.
MS-DOS is a U.S. registered trademark of Microsoft Corporation.
Intel486 is a U.S. registered trademark of Intel Corporation.
New editions of this guide are issued to reflect extensive changes made to the software. Revisions may
be issued between application releases to correct errors in the manual. There may not be a new edition
issued in conjunction with every application release. The application release, at the date of printing, is
noted in the following table.
Manual Name: HP Broadband Service Analyzer User’s Guide
Manual Part Number: E5200-90001
Product Model Number: HP E5200A
Edition Printing Date Application Version
1 February 1996 A.01.00
1a March 1996 A.01.00
2 September 1996 A.01.30
3 November 1996 A.01.50
3.1 March 1997 A.01.70
Product support
Hewlett Packard Australia Ltd.
Australian Telecom Operation
PO Box 221
Blackburn, 3130
Victoria, Australia
Printed in Australia
We want to hear from you. If you have any
comments, questions, or suggestions about our
documentation or support, send them to:
E-mail: ato_support@aus.hp.com
Fax: +61-3-9210-5570
Phone: +61-3-9272-8633
Page 3

Certification
Hewlett Packard Australia Limited certifies
that this product met its published specifications at the time of shipment from the
factory. Hewlett-Packard (HP) further certifies that its calibration measurements are
traceable to the extent allowed by the calibration facilities of International Standards
Organization members.
Warranty
The HP Broadband Service Analyzer is warranted against defects in materials and
workmanship. If HP receives notice of such
defects during the warranty period, HP
shall, at its option, either repair or replace
hardware products which prove to be
defective.
HP software and firmware products that
are designated by HP for use with a hardware product, when properly installed on
that hardware product are warranted not
to fail to execute their programming
instructions due to defects in materials and
workmanship. If HP receives notice of such
defects during the warranty period, HP
shall repair or replace software media and
firmware which do not execute their programming instructions due to such defects.
HP does not warrant that the operation of
the software, firmware, or hardware shall
be uninterrupted or error free.
If HP is unable, within a reasonable time,
to repair or replace any product to a condition as warranted, Buyer shall be entitled
to a refund of the purchase price upon
return of the product to HP.
For product warranties requiring return to
HP, this product must be returned to a
service facility designated by HP. Buyer
shall prepay shipping charges to HP (and
shall pay all duties and taxes) for products
returned to HP for warranty service. Except
for products returned to Buyer from
another country, HP shall pay for return of
products to Buyer.
Duration and Commencement of the
Warranty
The HP Broadband Service Analyzer hardware has a three year return to HP Service
Centre warranty, commencing at delivery
date (type 7A).
The HP Broadband Service Analyzer software and firmware has a 90 day, replacement warranty commencing at delivery
date (type 3C).
Limitation of Warranty
The foregoing warranty shall not apply to
defects resulting from improper or inadequate maintenance by Buyer, Buyer-supplied products or interfacing, unauthorized
modification or misuse, operation outside
of the environmental specifications of the
products, or improper site preparation or
maintenance.
THE WARRANTY SET FORTH ABOVE IS
EXCLUSIVE AND NO OTHER WARRANTY,
WHETHER WRITTEN OR ORAL, IS
EXPRESSED OR IMPLIED. HP SPECIFICALLY DISCLAIMS THE IMPLIED WARRANTIES OF MERCHANTABILITY AND
FITNESS FOR A PARTICULAR PURPOSE.
Exclusive Remedies
THE REMEDIES PROVIDED HEREIN ARE
BUYER’S SOLE AND EXCLUSIVE REMEDIES. UNLESS REQUIRED BY APPLICABLE
LAW, IN NO EVENT SHALL HP BE LIABLE
FOR DIRECT, INDIRECT, SPECIAL, INCIDENTAL, OR CONSEQUENTIAL DAMAGES
(INCLUDING LOSS OF PROFITS) WHETHER
BASED ON CONTRACT, TORT, OR ANY
OTHER LEGAL THEORY.
Restricted Rights Legend
Use, duplication, or disclosure by the U.S.
Government is subject to the restrictions as
set forth in subdivision (b)(3)(ii) of the
Rights in Technical Data and Computer
Software clause at 52.227-7-13. Hewlett
Packard Australia, 347 Burwood Highway,
Burwood East, Victoria, Australia.
Additional Information for Test and
Measurement Equipment
If test and measurement equipment is
operated with unscreened cables and/or
used for measurements on open setups,
the Buyer has to ensure that under operating conditions the Radio Interference Limits
are still met at the border of the Buyer’s
premises.
Disclaimer
Except where otherwise stated, the parameters described are warranted performance
specifications. Parameters described as
“typical” or “nominal” are supplemental
characteristics that provide a useful indication of typical, but non-warranted, performance.
iii
Page 4

Warnings
The following general safety precau-
tions must be observed during all
phases of operation, service, and
repair of this product. Failure to
comply with these precautions or
with specific warnings elsewhere in
this manual violates safety standards of design, manufacture, and
intended use of the product.
Hewlett-Packard Company assumes
no liability for the Buyer’s failure to
comply with these requirements.
Ground the equipment For equipment
having a protective ground terminal (Safety
Class 1), an uninterruptible safety ground
must be provided from the mains power
source to the product input wiring terminals or supplied power cable.
DO NOT operate the product in an
explosive atmosphere or in the presence of flammable gases or fumes
For continued protection against fire,
replace the line fuse(s) only with fuse(s) of
the same voltage and current rating and
type. DO NOT use repaired fuses or shortcircuited fuse holders.
Keep away from live circuits
Operating personnel must not remove
equipment covers or shields. Procedures
involving the removal of covers and shields
are for use by service-trained personnel
only. Under certain conditions, dangerous
voltages may exist even with the equipment switched off. To avoid electrical
shock, DO NOT perform procedures involving cover or shield removal unless you are
qualified to do so.
DO NOT operate damaged
equipment Whenever it is possible that
the safety protection features built into this
product have been impaired, either through
physical damage, excessive moisture, or
any other reason, REMOVE POWER and do
not use the product until safe operation can
be verified by service-trained personnel. If
necessary, return the product to a HewlettPackard Sales and Service Office for service
and repair to ensure the safety features are
maintained.
DO NOT substitute parts or modify
equipment Because of the danger of
introducing additional hazards, do not
install substitute parts or perform any
unauthorized modification to the product.
Return the product to a Hewlett-Packard
Sales and Service Office for service and
repair to ensure features are maintained.
DO NOT clean with fluids
Doing so may make the equipment unsafe
for use.
Safety Symbols
Instruction manual symbol affixed to product. Indicates that the user must refer to
the manual for specific Warning or Caution
information to avoid personal injury, or
damage to the product.
Protective conductor terminal indicates the
field wiring terminal that must be connected to ground before operating the
equipment—protects against electrical
shock in case of fault.
Frame or chassis ground terminal—typically
connects to the equipment’s metal frame.
Earth (ground) terminal.
Alternating current (ac).
Direct current (dc).
Indicates hazardous voltages.
Warning
Calls attention to a procedure, practice, or
condition that could cause bodily injury or
death
Caution
Calls attention to a procedure, practice, or
condition that could possibly cause damage
to equipment or permanent loss of data.
Indicates that antistatic precautions should
be taken.
iv
Page 5

Avertissement
Cet appareil répond aux normes de la
“Classe de sécurité 1” et est muni d’un fil
de mise à la terre pour votre protection.
Pour prévenir les risques de choc électrique, la broche de mise à la terre du
cordon d’alimentation ne doit pas être désactivée.
Restrictions d’utilisation
L’utilisateur se doit d’observer les mesures
de précaution énumérerais-dessous pour
toutes les phases d’utilisation, de service et
de réparation de cet appareil. Le fait de ne
pas s’y conformer équivaut à ne pas
respecter les mises en gardes spécifiques
contenues dans ce manuel et constitue une
violation des normes de sécurité relatives à
la conception, la fabrication et l’utilisation
prévue de cet appareil. La société HewlettPackard n’assume aucune responsabilité
envers un client qui manquerait de se conformer à ces exigences.
Mise à la terre
Afin de minimiser les risques de choc électrique, le châssis et le cabinet de l’appareil
doivent être mis à la terre. L’appareil est
équipé d’un cordon d’alimentation muni
d’une fiche homologuée à trois lames, compatible c.a. La prise murale et la prise
femelle de la rallonge électrique doivent
respecter les normes de sécurité de la
“Commission Électrotechnique Internationale” (IEC).
Environnement
Ne faites pas fonctionner cet appareil en
présence de gaz inflammables ou de
vapeurs dangereuses. L’utilisation de
n’importe quel appareil électrique dans ces
conditions constitue un risque élevé pour
votre sécurité.
Service et ajustement
Des “tensions dangereuses” résident dans
cet appareil. Par conséquent, le service et
l’ajustement doivent être effectué uniquement par une personne qualifiée.
Ne remplacez pas de composantes lorsque
le cordon d’alimentation est sous tension. Il
pourrait y avoir présence de “tension dangereuses” même lorsque l’appareil est
déconnecté.
Manipulation du tube cathodique
Une manipulation brusque, ou le fait de
secouer l’appareil, peut provoquer le bris du
tube cathodique. L’implosion qui s’en suivrait entraînerait la dispersion à grande
vélocité d’éclats de verre. Le retrait ou
l’installation du tube cathodique ne doit
être exécuté que par un technicien qualifié,
portant un masque et des gants de sécurité
homologués.
Service non autorisé
L’installation de pièces étrangères, ou tous
modification apportée à l’appareil sans le
consentement de Hewlett-Packard est
formellement interdit. Le fait de procéder à
de tels modifications sans autorisation
pourrait entraîner l’annulation de la garantie de l’appareil ou de tout contrat de service.
Pour un service et des réparations
autorisées, retournez l’appareil à un point
de vente et service Hewlett-Packard.
Symboles des sécurité
Attention (voir documents d’accompagnement)
Le conducteur protectif indique que la prise
de terre doit être connectée avant d’utiliser
l’equipment—protège contre le choc electrique en cas de faute.
Borne de terre
ou
Borne de masse, châssis
Courant alternatif
Courant continu
Risque de choc electriques
WARNING
Attire l’attention sur une procédure, une
pratique, ou des conditions qui peuvent
entraîner des blessures corporelles ou la
mort.
CAUTION
Attire l’attention sur une procédure, une
pratique, ou des conditions qui peuvent
endommager l’équipement.
Signale que des précautions antistatique
doivent étre prises.
v
Page 6

DECLARATION OF CONFORMITY
According to ISO/IEC Guide 22 and EN 45014
Manufacturer’s Name Hewlett Packard Australia Ltd.
Manufacturer’s Address Australian Telecom Operation
347 Burwood Highway
Burwood East, 3151
Victoria, Australia
declares that the product:
Product Name Broadband Service Analyzer
Model Number HP E5200A
Product Options This declaration covers all options of the above product.
conforms to the following product specifications:
Safety EN 61010-1:1993 / IEC 1010-1:1990 + A1
EMC EN 55011:1991 / CISPR 11:1990 (Group 1, Class A
Supplementary Information This product herewith complies with the requirements of the Low Voltage
CSA C22.2 No. 1010-1:1992
UL 3111-1:1994
1
EN 50082-1:1992
IEC 801-2:1991 4 kV CD, 8 kV AD
IEC 801-3:1984 3 V/m
IEC 801-4:1988 0.5 kV Signal Lines, 1 kV Power Lines
.
Directive 73/23/EEC and the EMC Directive 89/336/EEC.
This product uses high speed digital interfaces which are susceptible to
Electrostatic Discharge (ESD). ESD may corrupt received data.
1
The product meets the listed specifications with interface pods
installed in both ports.
)
Melbourne, Australia, December 5,1995
Issue 1
European Contact: Your local Hewlett-Packard Sales and Service Office or Hewlett-Packard GmbH, Department ZQ/
Standards Europe, Herrenberger Straße 130, D-71034 Böblingen, Germany (FAX +49-7031-14-3143)
Graeme Cobb - Quality Manager
vi
Page 7

What is the HP Broadband Service Analyzer?
What is the HP Broadband Service Analyzer?
The HP E5200A Broadband Service Analyzer is a portable yet powerful tool
designed specifically to test broadband equipment, networks, and services. It
can be used by public and private network providers to
• test network equipment
• aid in equipment installation
• test interworking devices
• test end-to-end services
Y ou can use the analyzer to test the physical, ATM, and AAL layers in network
traffic.
The analyzer’s user interface has four main components that provide most of
the tools you need to install, test, and support network equipment and
services:
• Link Monitor and Channel Monitor continuously measure the key
indicators of the health of the link or of a specific channel (VPI/VCI), and
display the information in an easy-to-read summary format.
• SMARTtests and predefined macros speed up the common and
routine tasks you need to perform when installing and testing network
equipment and services, and to ensure quality of service.
• Simulator gives you all of the tools you need to have manual control of
the transmit functions of the analyzer.
• Capture Viewer shows you details of captured traffic. You can
troubleshoot any fault in any level of the protocol stack, such as LAN
emulation, classical IP, and Frame Relay over ATM.
Y ou can use the analyzer as a standalone test solution for dispatched testing in
installation, commissioning, or maintenance applications. You can also display
the user interface on any HP-UX workstation and connect the instrument to a
network for remote monitoring.
vii
Page 8

Where to Find Information
Where to Find Information
The HP E5200A Broadband Service Analyzer comes with a comprehensive set
of paper and online documentation. Use the following table to determine
which documents you should use.
What is it? What does it do? Who is it for?
User’s Guide
Chapter 1
“Setting Up the
Analyzer”
User’s Guide
Chapter 2
“Using the
Analyzer”
User’s Guide
Chapter 3
“Using the
Online Help”
User’s Guide
Chapter 4
“System
Administration”
contains instructions on
how to set up and install
the analyzer
provides an outline of
the most common
analyzer functions
describes the types of
online help available
provides an outline of
the most common
system administration
functions
users who are
responsible for the initial
setup and any
subsequent relocation
of the analyzer
users who want a quick
introduction to the
analyzer and its main
functions
all users
all users
viii
Page 9

Where to Find Information
What is it? What does it do? Who is it for?
User’s Guide
Chapter 5
“Standards and
Specifications”
Online Help three help volumes—
Quick Reference provides a brief overview
Setting Up the
Interface Pod
guides
lists the electrical,
mechanical, and
environmental
specifications
User, Macro, and UPE
Compatibility—contain
information about, and
instructions for using,
the analyzer
of the analyzer’s main
features and functions
a series of guides that
provide descriptions of,
and instructions for
installing, individual
interface pods
users who are
responsible for
connecting the analyzer
to other equipment
all users
all users
all users
Worldwide
Support card
Release Notice
(if relevant)
provides information
about support, service,
and warranty
provides information
not available when this
guide was printed
all users
all users
ix
Page 10

Where to Find Information
The release 1.7 documentation, in PDF format, is included on the CD ROM that
contains the distribution software. This includes the Release 1.7 Broadband
Network Analyzer User’s Guide. The files are in the manuals directory on the CD
ROM. This directory contains the following files.
File Manual
5200ug31.pdf Broadband Network Analyzer User’s Guide
5120ig1a.pdf Setting up the DS1DS3 Interface Pod
5121ig1a.pdf Setting up the E3 Interface Pod
5122ig1a.pdf Setting up the OC-3/STM-1 Optical Interface Pod
5123ig1a.pdf Setting up the STM-1 Electrical Interface Pod
5125ig1.pdf Setting up the E1 Interface Pod
5126ig1.pdf Setting up the J2 6.3 Mb/s Electrical Interface Pod
x
Page 11

Contents
What is the HP Broadband Service Analyzer? ........................................... vii
Where to Find Information ......................................................................... viii
Appendixes ............................................................................................. xi
1 Setting Up the Analyzer
Introduction ................................................................................................. 1-2
To Unpack the Analyzer .............................................................................. 1-3
Connector Panel at a Glance .................................................................. 1-5
To Connect the Analyzer to a Computer ................................................... 1-6
To Connect the Analyzer as a Standalone System ............................... 1-7
To Connect the Analyzer as a Networked System ................................ 1-10
To Connect the Analyzer Using a Modem ............................................. 1-16
To Change Configuration Parameters ................................................... 1-20
To Connect a Printer to the Analyzer ........................................................ 1-21
To Switch the Analyzer On and Off ............................................................ 1-22
To Back Up and Restore Files .................................................................... 1-23
To Back Up Files ..................................................................................... 1-24
To Restore Files ...................................................................................... 1-25
To Reset the Notebook PC ..................................................................... 1-27
To Insert or Remove an Interface Pod ....................................................... 1-28
To Troubleshoot the Analyzer .................................................................... 1-30
To Print a Window .................................................................................. 1-33
2 Using the Analyzer
To Connect to the System Under Test ....................................................... 2-2
Intrusive System Connection ................................................................. 2-3
Non-Intrusive System Connection ......................................................... 2-6
Diagnostic System Connection .............................................................. 2-8
To Log In to the Analyzer ........................................................................... 2-11
To Log In to the Analyzer Graphical User Interface ............................. 2-11
To Log In to the Command Line Interface ............................................ 2-13
To Read the Analyzer’s Main Screen ..................................................... 2-14
To Log Out from the Analyzer .................................................................... 2-16
xi
Page 12

To Configure the Analyzer and Ports ..................................................2-18
To Configure the Analyzer ...............................................................2-18
To Configure a Port ..........................................................................2-18
To Monitor the Link (Network) ...........................................................2-20
Link Summary ..................................................................................2-21
Channel Summary ............................................................................2-24
To Monitor a Channel (VPI/VCI) .........................................................2-26
To Monitor Alarms and Errors .............................................................2-28
To Monitor Alarms and Errors on the Link .....................................2-28
To Monitor Alarms and Errors on a Channel ..................................2-31
To Log Statistics ...................................................................................2-33
To Run SMARTtests and Predefined Macros ......................................2-36
To Capture and View Data ...................................................................2-38
To Capture Data ...............................................................................2-39
To View Captured Data ....................................................................2-41
To Simulate Traffic ...............................................................................2-44
To Inject Alarms and Errors .................................................................2-48
To Inject Protocol Layer Alarms and Errors ...................................2-48
To Inject Physical Layer Alarms and Errors ...................................2-51
To Use Macros .......................................................................................2-54
To Create a Macro ............................................................................2-55
To Edit a Macro ................................................................................2-56
To Play a Macro ................................................................................2-56
xii
3 Using the Online Help
To Install the Online Help ......................................................................3-2
To Install the Online Help on a PC ....................................................3-2
To Install the Online Help on a Workstation .....................................3-3
To Display the Online Help ....................................................................3-5
4 System Administration
To Use the System Administration Functions ......................................4-2
To Start the System Administration Functions ................................4-2
To Move Around in the System Administration Functions .............4-4
To Change a Password ...........................................................................4-6
To Set the System Date, Time, and Time Zone ....................................4-7
To Change the System Date and Time ..............................................4-8
To Change the System Time Zone ....................................................4-9
Page 13

To Upgrade the Analyzer Software ............................................................ 4-10
To Upgrade Software Using Diskettes ................................................... 4-11
To Upgrade Software Using FTP ........................................................... 4-12
5 Standards and Specifications
Standards ..................................................................................................... 5-2
Electrical Specifications .............................................................................. 5-3
External Connectors ................................................................................... 5-4
Timing and Frequency References ............................................................ 5-10
Foreground Traffic Generation .................................................................. 5-11
Capture and Playback System .................................................................... 5-13
Mechanical and Environmental Specifications .......................................... 5-14
Appendixes
Hexadecimal to ASCII Conversion ............................................................. A-2
Default Acadia Configuration ..................................................................... B-2
xiii
Page 14

xiv
Page 15

1
Introduction 1-2
To Unpack the Analyzer 1-3
To Connect the Analyzer to a Computer 1-6
To Connect a Printer to the Analyzer 1-21
To Switch the Analyzer On and Off 1-22
To Back Up and Restore Files 1-23
To Insert or Remove an Interface Pod 1-28
To Troubleshoot the Analyzer 1-30
1 Setting Up the
Analyzer
Setting Up the Analyzer
Page 16

Setting Up the Analyzer
Introduction
Introduction
When you receive your HP Broadband Service Analyzer, you must perform
the following steps before you can use it:
• Unpack the analyzer.
• Connect the analyzer to a controlling computer.
• Switch on the analyzer.
• Prepare the analyzer for use.
• Insert the interface pods.
1-2
Page 17
Setting Up the Analyzer
To Unpack the Analyzer
To Unpack the Analyzer
When you receive your HP Broadband Service Analyzer, ensure you have
received the correct items by checking the contents of the package
against the packing list in each box within the packing carton.
Caution The external connectors on the analyzer and interface pods are
susceptible to electrostatic discharge (ESD). Handle the equipment with
the necessary care to avoid ESD damage during unpacking, installation,
and operation.
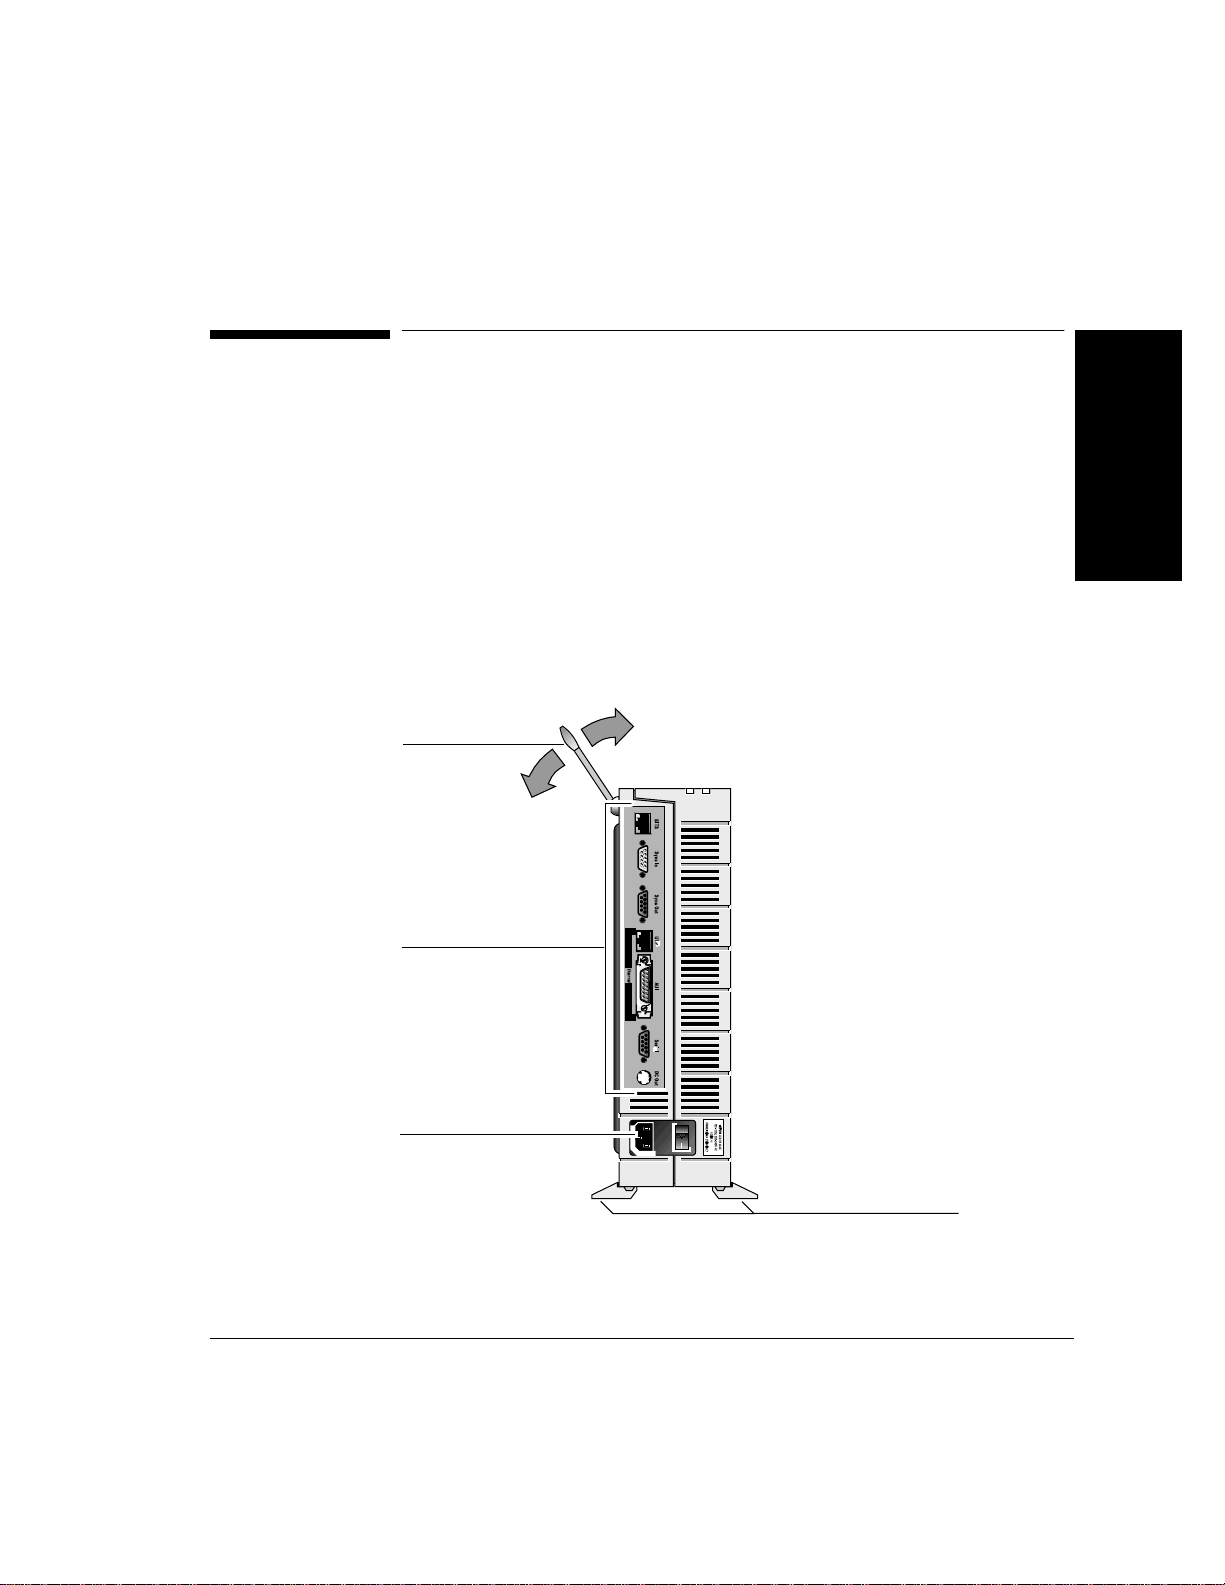
The analyzer can operate either standing up or lying flat. Use the
stabilizing feet if you want the unit to stand up.
Carry handle
1 Setting Up the
Analyzer
Connector panel
Power connector and
switch
Stabilizing feet
1-3
Page 18

Setting Up the Analyzer
To Unpack the Analyzer
Analyzer Software
All of the required software is preinstalled. If you have the HP Broadband
Service Analyzer (E5200A), the application software is pre-installed on
the analyzer.
If you have the HP Broadband Service Analyzer with the notebook PC
(E5200A option 050), the application software is pre-installed on the
analyzer, and the following software is pre-installed on the notebook PC:
• analyzer software (as backup)
• interface pod software (as backup)
• online help
• MS-DOS (Ver. 6.2)
• Microsoft Windows (Ver. 3.1)
• PC-Xware (Ver. 2.1)
• Acadia/VxD (Ver. 2.2)
• Borland C++ (optional—supplied with the Broadband Series UPE
Conversion Toolkit p/n E5190A)
Y ou will also receive a set of diskettes containing the PC based online help,
and/or a CD-ROM that contains the
• analyzer software
• notebook PC software
• PC based online help
• UNIX based online help
Caution When you receive your analyzer, you should make a complete backup of
the notebook PC hard disk. This will save you time in the future if you
ever have any problems with the notebook PC hard disk. For backup
procedures, refer to “To Back Up Files” on page 1-24.
Caution Do not load any non-analyzer related software on the notebook PC. This
may cause damage to the analyzer’s software.
You can also use the analyzer with an HP-UX workstation as the display
server.
The HP Broadband Service Analyzer is certified to operate only with the
supplied notebook PC or an HP-UX workstation. If you have any problems,
contact your local HP representative.
1-4
Page 19
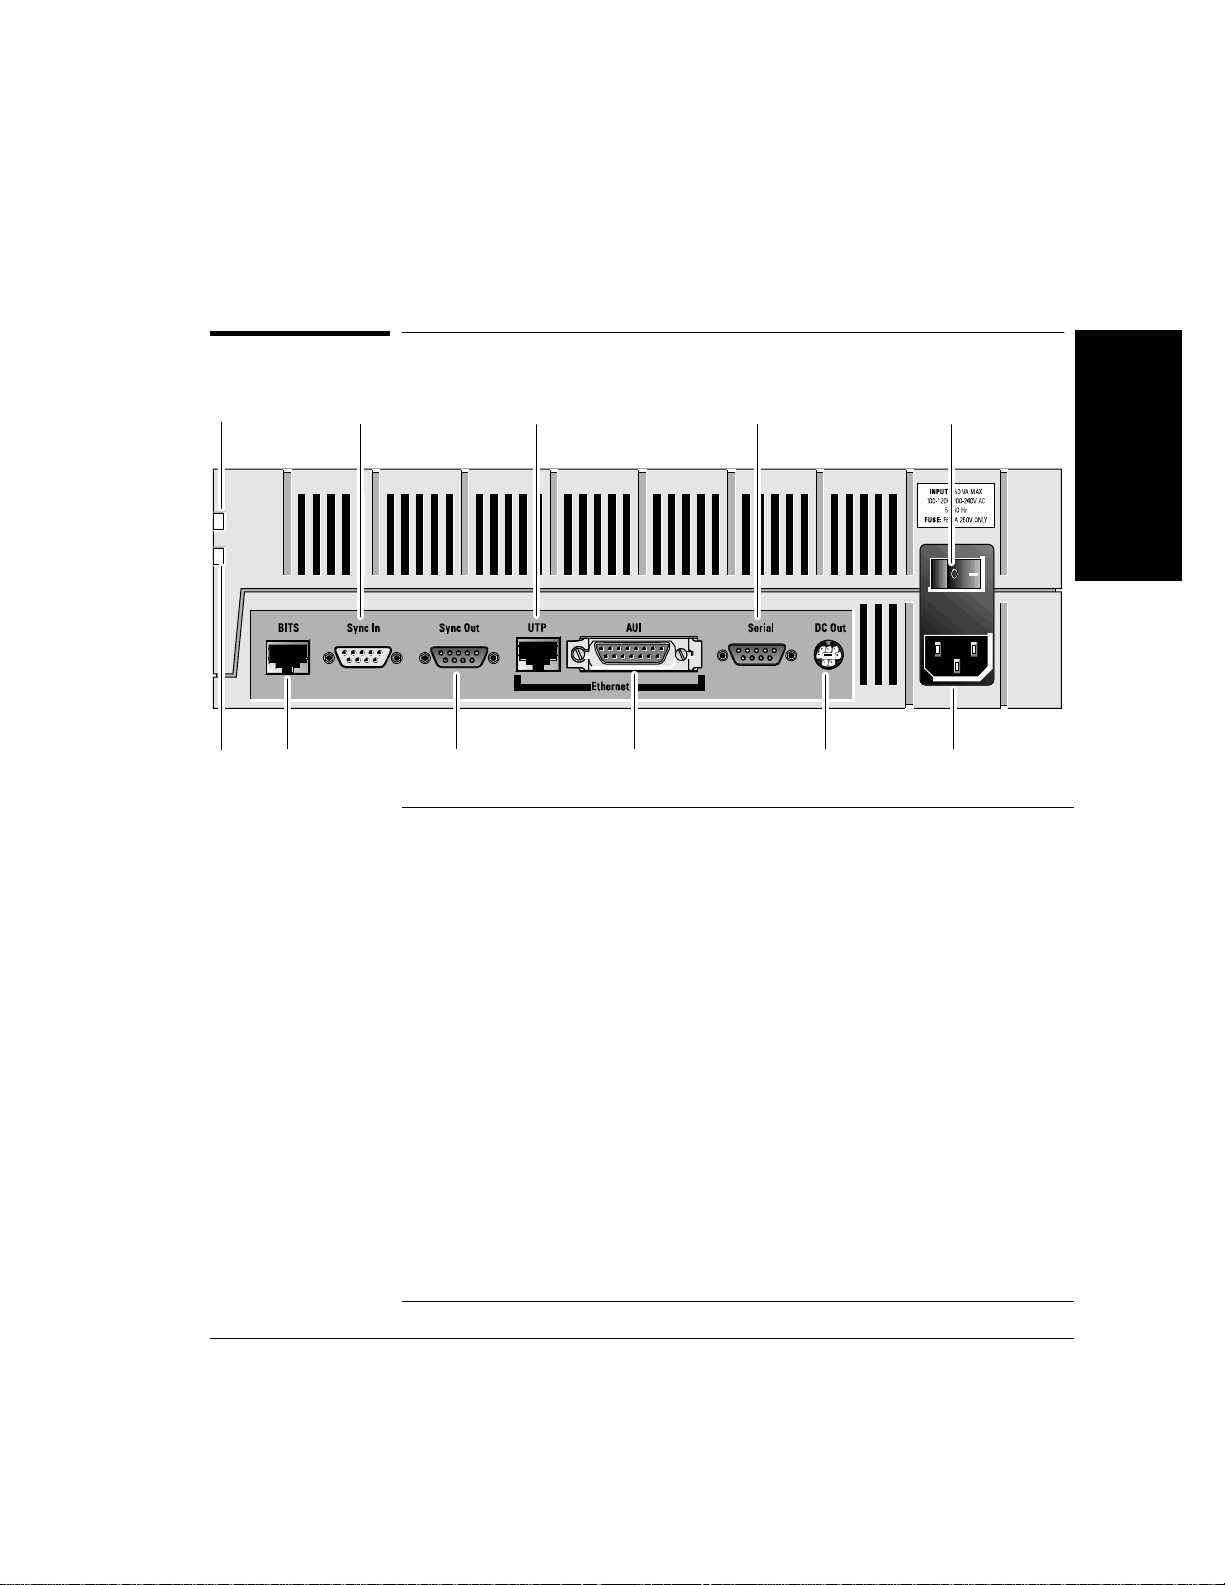
Connector Panel at a Glance
Setting Up the Analyzer
To Unpack the Analyzer
1 Setting Up the
Analyzer
Power LED
Access
LED
BITS
Sync In
Sync Out
Power LED Light emitting diode (LED) that indicates when power is supplied to the
Access LED Light emitting Diode (LED) that indicates when the analyzer is accessing
BITS Input for synchronizing the analyzer to a Building Integrated Timing Source
Sync In Input for synchronizing the analyzer’s Data Clocks, Measurement System,
Sync Out Output for synchronizing external equipment, or for synchronizing the Data
UTP Connects the analyzer to a 10BaseT (Ethertwist/TPE) Local Area Network.
AUI Attachment Unit Interface connector used with an external MAU (Medium
Serial Port for connecting the analyzer to a Terminal using RS-232C serial
DC Out This output is not active.
UTP
(LAN)
AUI
(LAN)
analyzer.
information from a network.
(BITS) or to a DS1 or E1 source.
or Data Timestamp to external equipment or another analyzer.
Clocks, Measurement System, or Data Timestamps of another analyzer to
this analyzer.
When the analyzer is supplied with an Omnibook, the UTP port is used for
connecting the analyzer to the Omnibook.
Attachment Unit) to allow connection of the analyzer to a variety of
different Local Area Networks.
communications.
Serial
DC Out
Power On/Off
Switch
Power
Outlet
1-5
Page 20

Setting Up the Analyzer
To Connect the Analyzer to a Computer
To Connect the Analyzer to a Computer
The analyzer is designed for both onsite and remote broadband testing
applications. The way in which you connect the analyzer to a computer
depends on whether you want to perform remote or local testing. You can
connect the analyzer as a
• standalone system (with a notebook PC)
• networked system
• remote system (using a modem)
Both the HP Broadband Service Analyzer and the supplied notebook PC
are pre-configured for all of these connections (except for network
specific configuration parameters). For a networked system, you will need
to record additional information. See “To Connect the Analyzer as a
Networked System” on page 1-10.
The default configuration for the analyzer is as follows:
1-6
Boot source Local Disk
Ethernet IP Address 10.0.0.1
Ethernet IP Netmask 255.255.255.0
Host IP Address 10.0.0.2
Host Gateway IP Address not used
SLIP IP Address 10.0.1.1
The default configuration for the notebook PC is as follows:
Ethernet IP Address 10.0.0.2
Ethernet IP Netmask 255.255.255.0
SLIP IP Address 10.0.1.2
Page 21

Setting Up the Analyzer
To Connect the Analyzer to a Computer
Warning For your safety, the power cord supplied with the analyzer has a
grounded plug. Always use the power cord with a properly grounded
mains power outlet to avoid electrical shock.
If you will be converting data captured by the analyzer into HP
Broadband Series Test System (BSTS) captured data files, you must
install the Data Conversion Utility (p/n E5200-10010). See the
Installing/Upgrading Software section in the HP BSTS System
Installation & Startup Guide.
After you have prepared the analyzer for use, back up the analyzer’s hard
disk to the notebook PC or workstation; then archive this data using
backup storage media. See “To Back Up and Restore Files” on page 1-23.
To Connect the Analyzer as a Standalone System
You should connect the analyzer as a standalone system for onsite
testing, for example, at an installation site or a monitoring point. There
are two ways you can connect the analyzer as a standalone system:
• point-to-point ethernet interface
• point-to-point serial interface
1 Setting Up the
Analyzer
Normally, you would use the point-to-point ethernet interface. You can
use the point-to point serial interface as a backup connection when there
is a problem with the ethernet interface, or when you need to set up the
configuration parameters for a networked system. See “To Change
Configuration Parameters” on page 1-20.
The computer to which you connect your analyzer should only contain
the software specified in “Analyzer Software” on page 1-4.
1-7
Page 22
Setting Up the Analyzer
To Connect the Analyzer to a Computer
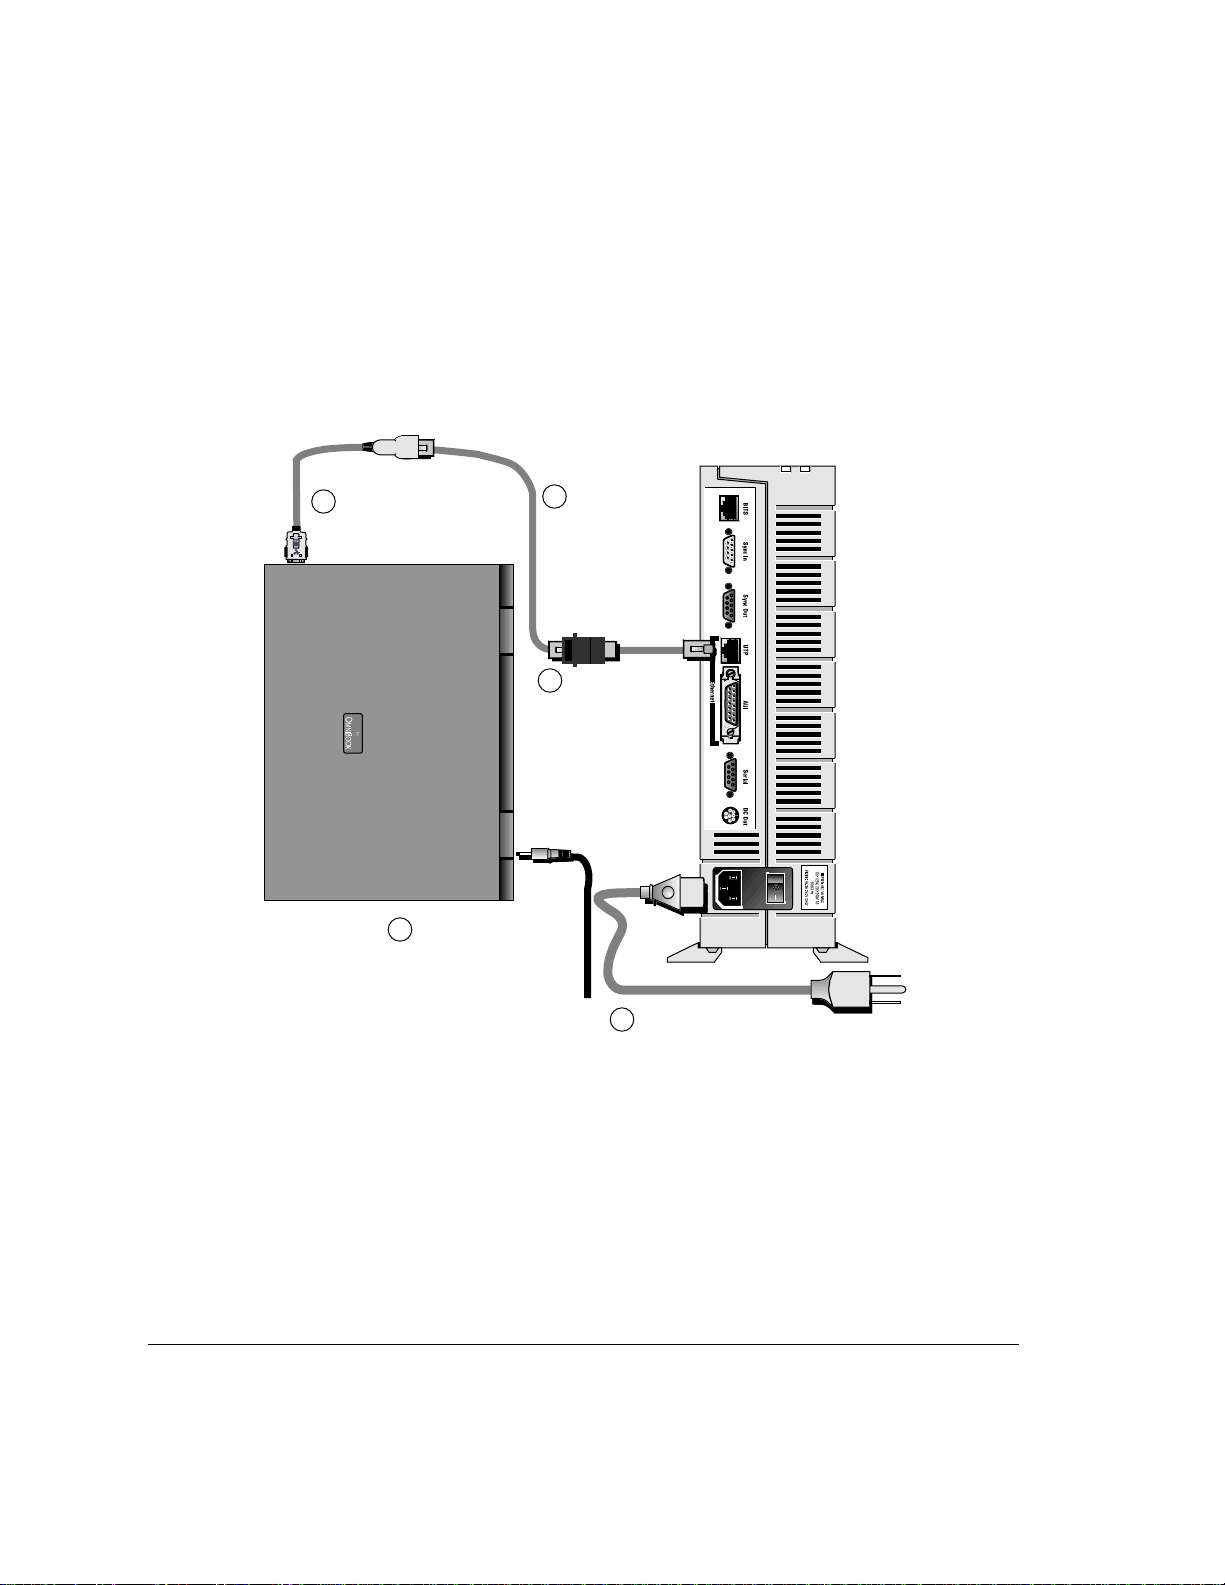
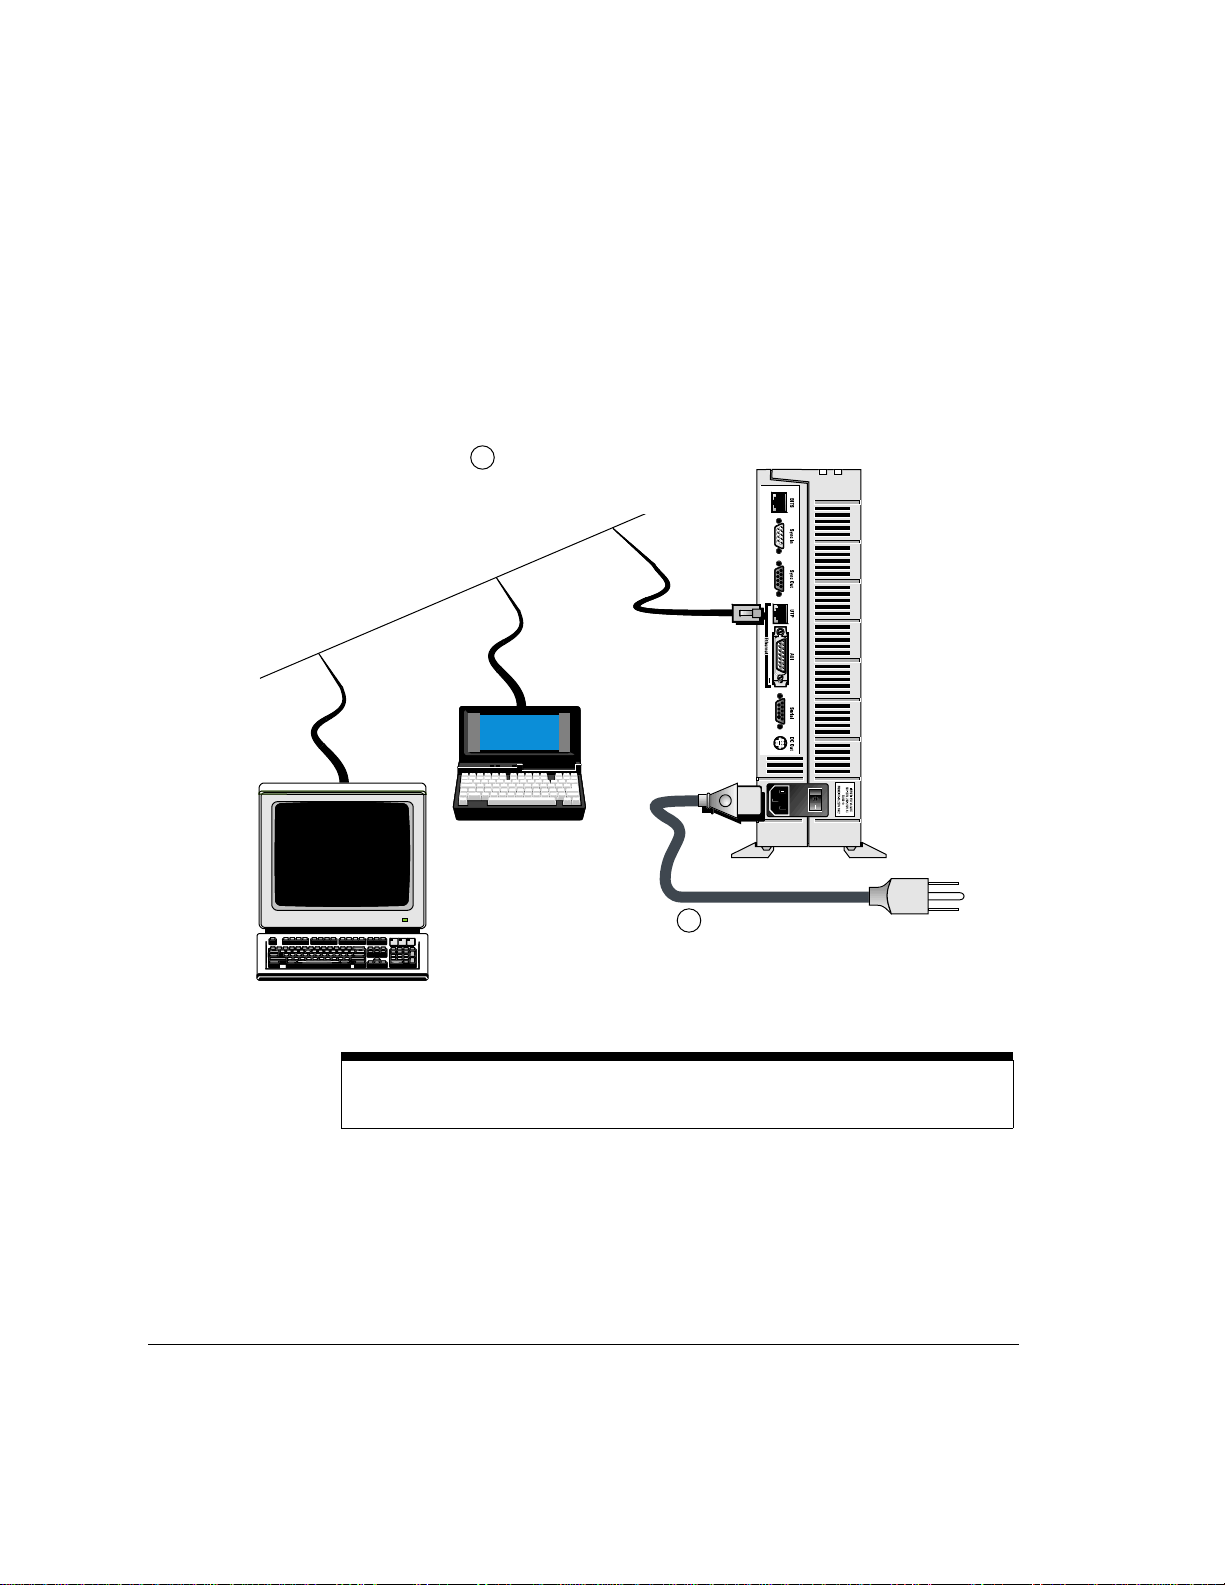
To Connect the Analyzer to a Point-to-Point
Ethernet Interface
Connect the analyzer to
3
the notebook PC using
the PCMCIA LAN cable.
Connect the
2
network cable
(E5200-64005)
to the PCMCIA
LAN cable.
Connect the cross-
1
over cable
(E5200-64006) to
the network
cable (E5200A-
64005).
Connect the AC adapter
4
to the notebook PC.
Connect the analyzer to a
5
mains power outlet.
Caution Make sure at least 3 cm of clear space is left between the analyzer
ventilation openings and other objects.
If there is a boot failure, the analyzer attempts to boot from the host
computer using the configured boot host, and analyzer IP address.
1-8
Page 23
Setting Up the Analyzer
To Connect the Analyzer to a Computer
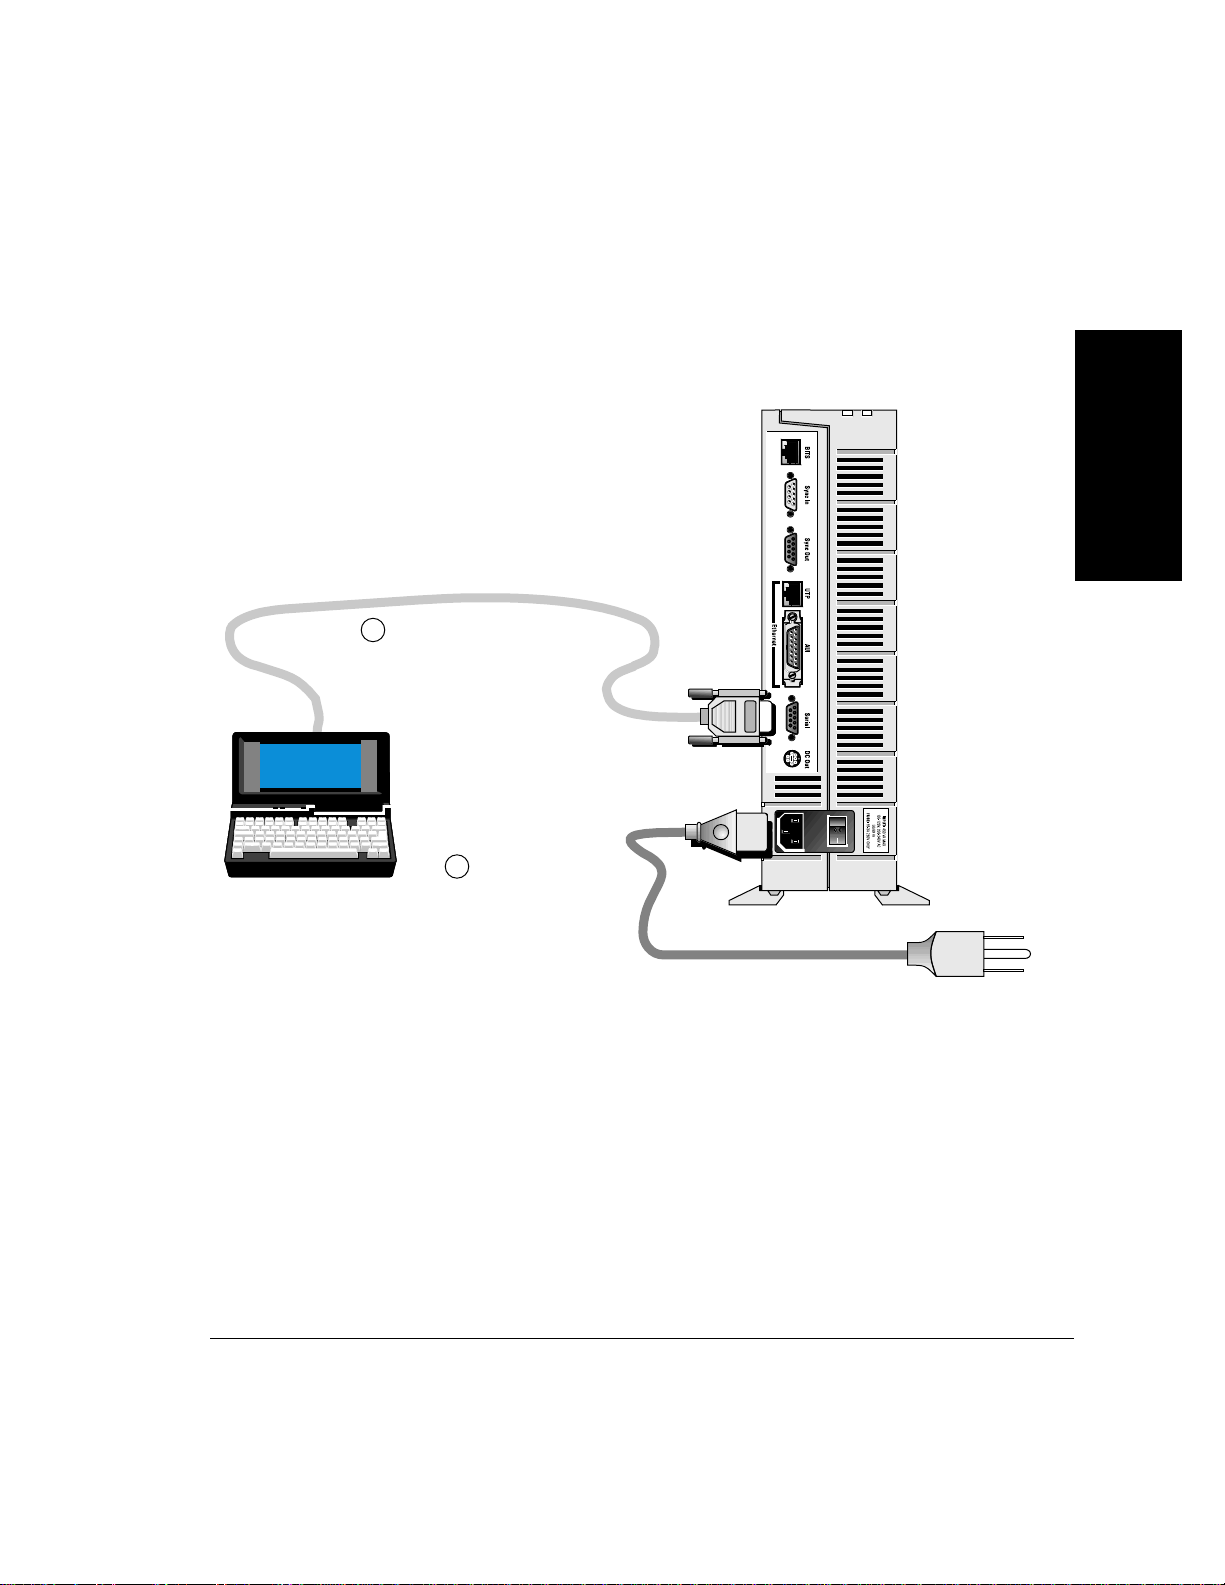
To Connect the Analyzer to a Point-to-Point
Serial Interface
Connect the analyzer to the
1
notebook PC’s serial
connector. If this cable is
not supplied, use cable p/n
24542U.
Connect the
2
analyzer to a mains
power outlet.
1 Setting Up the
Analyzer
To Record the System Administration Information
After you have connected the analyzer, switch on the analyzer (see “To
Switch the Analyzer On and Off” on page 1-22); then use the system
administration functions of the analyzer to set the
• system administrator password (see “To Change a Password” on
page 4-6)
• required users (see User Online Help)
• date, time, and time zone (see “To Set the System Date, Time, and
Time Zone” on page 4-7)
• printer (see User Online Help)
1-9
Page 24

Setting Up the Analyzer
To Connect the Analyzer to a Computer
To Connect the Analyzer as a Networked System
You should connect the analyzer as a networked system when you want to
remotely monitor a network. By connecting the analyzer to a networked
system, you can use either the supplied notebook PC, or an HP-UX
workstation at a remotely controlled monitoring point.
To connect the analyzer as a networked system, you need to perform the
following steps:
1 Configure the notebook PC or workstation.
2 Configure the analyzer.
3 Connect the analyzer.
4 Test for network connectivity.
5 Install the online help (UNIX workstation only).
6 Record the system administration information.
1-10
To Configure the Notebook PC or Workstation
If you are connecting the analyzer to the notebook PC via your network,
use Acadia/Vxd to reconfigure the following parameters (assigned by the
system administrator):
• notebook PC hostname
• notebook PC IP address
• notebook netmask
• default router IP address
• analyzer’s IP address
If you are connecting the analyzer to a HP-UX workstation via your
network, complete the following steps:
1 Note down the workstation’s hostname and IP address. You will find
this information in the /etc/hosts file.
2 Add the analyzer’s hostname and IP address to your workstation’s
/etc/hosts file.
Page 25

Setting Up the Analyzer
To Connect the Analyzer to a Computer
3 Note down the workstation’s netmask. You will find this information in
the /etc/netlinkrc file.
4 Note down your workstation’s default route. You will find this
information in the /etc/netlinkrc file.
To Configure the Analyzer
Before you connect the analyzer as a networked system, you must set up
the following configuration parameters:
Notebook PC UNIX Workstation
Boot source local disk local disk
Analyzer Ethernet
IP Address
Analyzer Ethernet
IP Netmask
Boot Host IP
Address
This must match the analyzer’s IP
address that you recorded in
Acadia/Vxd.
This must match the notebook
PC’s ethernet netmask IP address
that you recorded in Acadia/Vxd.
This must match the notebook
PC’s ethernet IP address that you
recorded in Acadia/Vxd.
This must match the analyzer’s
IP address you added to the
/etc/hosts file.
This must match the netmask
IP address noted down from
your workstation’s
/etc/netlinkrc file.
This must match your
workstation’s IP address as
indicated in the /etc/hosts
file.
1 Setting Up the
Analyzer
Boot Host Gateway
IP Address
To set up the configuration parameters for a networked system, you can
either
• use the Network Configuration utility—see “To Change Configuration
Parameters” on page 1-20
• set up the analyzer as a standalone system; then use the system
administration functions—see the User Online Help
This must match the notebook
PC’s default router IP address that
you recorded in Acadia/Vxd.
This must match your
workstation’s default router as
indicated in the
/etc/netlinkrc file.
1-11
Page 26
Setting Up the Analyzer
To Connect the Analyzer to a Computer
To Connect the Analyzer
Connect the analyzer to the LAN
1
using the UTP cable
(E5200-64005).
1-12
Connect the
2
analyzer to a mains
power outlet.
Note You can also connect the analyzer to a LAN using a Medium Attachment Unit (MAU).
An MAU cable is not provided with the analyzer.
Page 27

Setting Up the Analyzer
To Connect the Analyzer to a Computer
To Test for Network Connectivity
If you have connected the analyzer to a workstation, do the following:
• Use the UNIX ping command to verify that the analyzer is up and
running on your network. The syntax of the ping command may vary
from site to site. See your system administrator or the UNIX online
man pages for more details. If you cannot ping to the analyzer, check
all of the cable connections and configuration parameters.
• Check that you have given xhost authority for the analyzer to connect
to your X-display. See your system administrator or the UNIX online
man pages for more details.
If you are using the notebook PC, click the Ping icon in the Acadia/Vxd
program group. Ping the notebook PC and the analyzer separately using
their hostnames.
To Install the Online Help
If you have HP-UX superuser permission, you can install the analyzer
help on an HP series 700 workstation running HP-UX 9.05.
Note This installation modifies the following files:
1 Setting Up the
Analyzer
• /etc/inetd.conf
• /etc/services
1 Mount the CD-ROM onto your file system by typing:
/bin/mkdir /cdrom
/etc/mount <cdrom_device_file> /cdrom
See your system administrator if you are unsure of the CD-ROM device
file name.
2 Run the HP-UX update utility by typing:
/etc/update
The update utility Main Menu is displayed.
1-13
Page 28

Setting Up the Analyzer
To Connect the Analyzer to a Computer
3 Select “Change Source or Destination” by using the arrow keys to
highlight the option; then pressing either Enter or F4.
The Change Source or Destination window is displayed.
4 Select “From Tape Device to Local System” as the Update from Source
to Destination by using the arrow keys to highlight the option; then
pressing either Enter or F4.
The From Tape Device to Local System window is displayed.
5 In the Source field, type /cdrom/HELP/HYPHELP/HELP.PKG
6 Press F4.
The Main Menu is redisplayed.
7 Select “All Filesets on the Source Media” by using the arrow keys to
highlight the option; then pressing either Enter or F4.
The Select All Filesets on the Source Media window is displayed.
8 Select “Start Loading Now” by using the arrow keys to highlight the
option; then pressing either Enter or F4.
1-14
A message window is displayed asking you whether you want to “Start
loading filesets now?”
9 Type y.
The Loading Partitions and Filesets window is displayed. This window
indicates the progress of the installation.
The help package is installed in the /OPT/E5200A/ directory.
10 When the installation is complete, you should view the log file to check
for errors in the installation. At the # prompt type more
/tmp/update.log
.
11 Errors are displayed at the end of the file. If there are errors, correct
the problem and reinstall the help.
12 Unmount the CD-ROM from your file system by typing:
cd /
/etc/unmount /cdrom
Page 29

Setting Up the Analyzer
To Connect the Analyzer to a Computer
13 To print help topics, set up the current printer for the help viewer
using the Printer Setup option in the File menu. For more information
see the How to use Help option in the Help menu in the help viewer.
To Record the System Administration Information
1 Switch on the analyzer (see “To Switch the Analyzer On and Off” on
page 1-22).
2 Log in to the analyzer using the following user name and password.
Note The HP Broadband Service Analyzer has two sets of default login information:
• User Name—boomer
• User Name—root
See “To Log In to the Analyzer” on page 2-11.
3 After you have connected the analyzer, use the system administration
functions of the analyzer to set the
• system administrator password (see “To Change a Password” on
page 4-6)
• required users (see User Online Help)
• date, time, and time zone (see “To Set the System Date, Time, and
Time Zone” on page 4-7)
• printer (see User Online Help)
• remote hosts (see User Online Help)
• routing details (see User Online Help)
• remote file systems (see User Online Help)
Password—broadband
Password—rootpasswd
1 Setting Up the
Analyzer
Note You must have the appropriate privileges to perform system administration
functions.
1-15
Page 30

Setting Up the Analyzer
To Connect the Analyzer to a Computer
To Connect the Analyzer Using a Modem
You can use a modem (configured to no parity, 8 data bits, 1 stop bit) to
remotely access the analyzer from the notebook PC. You should use a
modem connection only to access the Tcl interface.
You can set up a modem connection using either:
• an external modem
• a PCMCIA internal modem
To connect the analyzer using a modem, complete the following steps:
1 If you are using the PCMCIA internal modem, change the COM port
assignments for the notebook PC.
2 Connect the analyzer.
3 Set the remote modem to auto answer.
4 Set up the modem connection.
1-16
5 Record the system administration information.
To Change the COM Port Assignment
1 From the Main program group, click the Control Panel icon.
2 Click the OmniBook icon. The OmniBook Configuration window is
displayed.
3 Click the Change button in the COM Port Assignments area. The Select
COM Port Assignments window is displayed.
4 Set the serial port to COM4 by clicking COM4 in the Serial Port
column; then click OK.
Page 31

Setting Up the Analyzer
To Connect the Analyzer to a Computer
Connect the notebook
3
PC’s serial port to the
modem (RS-232C
US/Euro modem cable
p/n 24542M—part not
supplied), or connect
the PCMCIA internal
modem to the telephone
outlet.
To Connect the Analyzer
Note You can either connect the notebook PC’s serial port to an external modem, or you can
connect the PCMCIA internal modem directly to the telephone socket.
Connect the
1
analyzer’s serial
port to the modem
(RS-232C US/Euro
modem cable p/n
24542M—part not
supplied).
1 Setting Up the
Analyzer
Connect the
2
analyzer to a mains
power outlet.
To Set the Remote Modem to Auto Answer
Set the remote modem (connected to the analyzer) to auto answer by
setting the S parameter zero (SO) to a value greater than zero. See your
modem’s user’s guide.
1-17
Page 32

Setting Up the Analyzer
To Connect the Analyzer to a Computer
To Set up the Modem Connection
1 Double-click the Dialer icon in the Acadia/VxD program group.
The Ipswitch, Inc. SLIP/PPP Configure & Dial window is displayed.
2 Click the phone number (e5200a) in the Phonebook list; then click the
Dial button.
3 If required, change the baud rate. To change the baud rate, click the
Setup button on the Ipswitch, Inc. SLIP/PPP Configure & Dial window;
then select the required baud rate from the Speed pull-down list. The
analyzer SLIP baud rate must match this baud rate.
4 If required, change the remote phone number. To change the remote
phone number, select e5200a from the Phonebook on the Ipswitch, Inc.
SLIP/PPP Configure & Dial window, click the Setup button, then type
the new phone number in the Phone #: field.
Dialer
1-18
To Record the System Administration Information
1 Switch on the analyzer (see “To Switch the Analyzer On and Off” on
page 1-22).
2 Log in to the analyzer via the SLIP connection using the following user
name and password.
Note The HP Broadband Service Analyzer has two sets of default login information:
• User Name—boomer
• User Name—root
See “To Log In to the Analyzer” on page 2-11.
Password—broadband
Password—rootpasswd
Page 33

Setting Up the Analyzer
To Connect the Analyzer to a Computer
3 After you have connected the analyzer, use the system administration
functions of the analyzer to set the
• system administrator password (see “To Change a Password” on
page 4-6)
• required users (see User Online Help)
• date, time, and time zone (see “To Set the System Date, Time, and
Time Zone” on page 4-7)
• printer (see User Online Help)
• remote hosts (see User Online Help)
• routing details (see User Online Help)
• remote file systems (see User Online Help)
Note You must have the appropriate privileges to perform system administration
functions.
Note After you have logged out, you must disconnect the modem. To disconnect the modem
1 Double-click the Dialer icon in the Acadia/VxD program group. The Ipswitch, Inc. SLIP/PPP
Configure & Dial window is displayed.
1 Setting Up the
Analyzer
2 Select e5200a from the Phonebook list.
3 Click the Hangup button.
The connection is now closed.
1-19
Page 34

Setting Up the Analyzer
To Connect the Analyzer to a Computer
To Change Configuration Parameters
You can change the configuration parameters for the analyzer and the
controlling computer using either
• the Network Configuration utility. Use this method of changing the
configuration parameters when you want to connect the analyzer as a
networked system. You must change the configuration parameters
before you connect the analyzer.
• the analyzer system administration functions. Use this method when
the analyzer is connected as a standalone system.
To Configure the Analyzer Using the Network
Configuration Utility
1 Double click the HP Analyzer Terminal over SLIP icon in the HP
Broadband Analyzer program group.
1-20
2 Switch on the analyzer and hold down the Enter key on the terminal
for five seconds until the HP Broadband Service Analyzer
Configuration menu appears. You must press the Enter key
immediately after turning on the power switch.
The keyboard on the remote workstation must be configured to autorepeat.
3 Type 2 to change the current boot parameters; then press Enter.
4 Record the configuration parameters for the analyzer.
5 Close the terminal window by pressing Ctrl-C.
6 Switch off the analyzer. You must reboot the analyzer after you have
changed the configuration parameters.
7 Disconnect the terminal from the serial port.
8 Connect the analyzer to the network (see “To Connect the Analyzer as
a Networked System” on page 1-10).
Page 35

Setting Up the Analyzer
To Connect a Printer to the Analyzer
To Connect a Printer to the Analyzer
You can print from the analyzer if a printer is connected to your
computer. The printer must be compatible with PCL 5. If the analyzer is
connected to a network, you can also print using a LAN printer (using
PCL 5).
Refer to the computer’s user’s guide for information on how to connect
the printer. See the system administration functions in theUser Online
Help to set the current printer.
1 Setting Up the
Analyzer
1-21
Page 36

Setting Up the Analyzer
To Switch the Analyzer On and Off
To Switch the Analyzer On and Off
After you connect the analyzer to the computer, you can switch on the
equipment.
Turn on the power
2
switch.
Turn on the computer power switch.
1
The analyzer takes approximately two minutes to run its self-tests and
switch on. While it is switching on, the Power LED flashes green, and if the
analyzer is booting from a PC or LAN, the Access LED flashes orange.
When the analyzer is on, the Power LED remains green and the Access
LED flashes orange intermittently. If the Power LED stays red, contact
your HP support representative.
To switch off the analyzer, switch off the power to the computer and the
analyzer. When you switch off, the analyzer performs a shutdown under
software control which makes sure all files are properly closed.
When you switch off the analyzer, the Power LED flashes green during
shutdown and then goes off.
Caution Make sure shutdown is complete before unplugging or removing the
power cables, or switching off power at the AC wall outlet.
1-22
Page 37

Setting Up the Analyzer
To Back Up and Restore Files
To Back Up and Restore Files
When you use the HP Broadband Service Analyzer, you create files that
are stored on the analyzer’s hard disk. You should back up these files
• after you connect and change the configuration of the analyzer
• on a regular basis to safeguard against data loss
See the Acadia/VxD Installation, Overview and Command Reference
for more detailed information about how to NFS mount a file system.
When you first start the notebook PC, you should create a bootable
diskette in case there is a complete hard disk crash (see “To Create a
Bootable Diskette” on page 1-23). You should also backup the notebook
PC hard disk (see “To Back Up Files” on page 1-24).
1 Setting Up the
Analyzer
To Create a Bootable Diskette
1 Place a formatted diskette in drive A.
2 At the C:\> prompt, type sys A:
3 Copy the following files from the C:\DOS directory onto the diskette:
• format.com
• msbackdb.ovl
• msbackdr.ovl
• msbackfb.ovl
• msbackfr.ovl
• msbackup.exe
• msbackup.hlp
• msbackup.ovl
• msbconfg.hlp
• msbconfg.ovl
1-23
Page 38

Setting Up the Analyzer
To Back Up and Restore Files
To Back Up Files
You should perform regular backups to ensure minimal loss of data if a
problem arises with the analyzer’s hard disk. You should back up the
analyzer’s hard disk to the controlling computer’s hard disk, then archive
the data to backup storage media. The backup storage media may be
either diskettes, tape, or a network storage device.
To Back Up Files from the Analyzer to a Notebook PC
1 Open the HP Broadband Analyzer program group within the Windows
2 Open the NFS Client icon within the HP Broadband Analyzer program
3 Set the Network Path to E5200A:\IDE
Program Manager.
group.
4 Set the Drive to G or any unused drive designator.
5 Click the Connect button. The current drive connection information
should now display E5200A:\IDE on G.
6 Click the Close button to close NFS Client.
7 Open the Windows File Manager.
8 Back up drive G to drive C by dragging and dropping the G:\usr
directory to the C:\ directory.
9 Rename C:\usr to C:\usr_old.
10 Copy G:\usr to C:\usr. This process will take approximately 1 hour.
See the MS-DOS User’s Guide and the Microsoft Windows User’s Guide
for more information.
To Back Up Files from a Notebook PC to Backup Storage
Media
Use the Microsoft Backup Utility in the Microsoft Utilities program group.
See the Microsoft Windows (Ver. 3.1) User’s Guide.
1-24
Page 39

Setting Up the Analyzer
To Back Up and Restore Files
To Back Up Files from the Analyzer to an HP-UX
Workstation
1 On the networked HP-UX workstation, NFS mount the analyzer file
system under the local workstation file system, using the following
command:
/etc/mount <E5200A IP address>:/IDE /<mount point>
2 Copy all files and directories under /<mount point>/ to your
workstation file system or a backup device.
To Restore Files
If any data is damaged or lost from the analyzer’s hard disk, you should
restore the latest version of the files that you have backed up.
To Restore Files from Backup Storage Media to a
Notebook PC
If the notebook PC boots, restore the files using the Microsoft Restore
Utility in the Microsoft Utilities program group. See the Microsoft
Windows (Ver. 3.1) User’s Guide.
1 Setting Up the
Analyzer
If the Notebook PC Does Not Boot
1 Press F2 then F8.
2 Set the Boot From parameter to FDD. This allows the notebook PC to
boot from drive A.
3 Press F3 and insert the bootable diskette (see “To Create a Bootable
Diskette” on page 1-23) in drive A.
4 Switch the notebook PC off and then on again so that it can boot from
drive A.
1-25
Page 40

Setting Up the Analyzer
To Back Up and Restore Files
5 At the A:\> prompt, type
format/s C:\
This command formats drive C as a system disk.
Caution All information on drive C is lost.
6 At the C:\> prompt, type
mkdir C:\dos
This command creates a DOS directory on drive C.
7 At the A:\> prompt, type
copy msb*.* C:\dos
This command copies all of the MS backup program files to the C:\DOS
directory.
8 Type cd C:\dos and press Enter.
9 Type msbackup to start the backup/recovery program.
1-26
10 Follow the instructions on the screen to restore files from the backup
storage media.
To Restore Files from a Notebook PC to the Analyzer
1 Open the HP Broadband Analyzer program group within the Windows
Program Manager.
2 Open the NFS Client icon within the HP Broadband Analyzer program
group.
3 Set the Network Path to E5200A:\IDE
4 Set the Drive to G or any unused drive designator.
5 Click the Connect button. The current drive connection information
should now display E5200A:\IDE on G:
6 Click the Close button to close NFS Client.
7 Open the Windows File Manager.
8 Restore drive C to drive G by dragging and dropping the C:\usr
directory to the G:\ directory.
Page 41

Setting Up the Analyzer
To Back Up and Restore Files
9 Switch the analyzer power off for 5 seconds.
See the MS-DOS User’s Guide and theMicrosoft Windows User’s Guide
for more information.
To Restore Files from an HP-UX Workstation to the
Analyzer
1 On the networked HP-UX workstation, NFS mount the analyzer file
system under the local workstation file system, using the following
command:
/etc/mount<E5200A IP address>:/IDE /<mount point>
2 Restore all files and directories from the workstation file system or
the backup device to /<mount point>/.
To Reset the Notebook PC
To reset the notebook PC to the default configuration
1 Exit Windows.
1 Setting Up the
Analyzer
2 At the DOS prompt, type cd \resetpc; then press Enter.
3 At the c:\resetpc prompt, type resetpc; then press Enter.
This utility resets the analyzer and the Windows configuration to the
default values. If the notebook PC had non-analyzer related software
loaded on it, the relevant program groups will not be displayed. The
software files, however, will remain on the notebook PC. The network
configuration for the analyzer also returns to the default values.
If the utility is corrupt or fails to restore the notebook PC to its factory
defaults restore the notebook PC hard disk backup (see “T o Restore Files
from Backup Storage Media to a Notebook PC” on page 1-25).
1-27
Page 42

Setting Up the Analyzer
To Insert or Remove an Interface Pod
To Insert or Remove an Interface Pod
Interface pods can be inserted or removed from the analyzer at any time.
The power does not need to be switched off. You insert an interface pod
when you initially set up the analyzer, and subsequently when you change
the type of line to be monitored.
Caution Handle the interface pod with extreme care to avoid electrostatic
discharge (ESD) damage during unpacking, installation, and operation.
The connectors on the front and back of the interface pod are susceptible
to ESD.
The analyzer uses high speed digital interfaces which are susceptible to
ESD. ESD may cause received data to be corrupted.
To Insert an Interface Pod into the Analyzer
1-28
1 Hold the interface pod with the front-panel connectors facing toward
you and the Hewlett-Packard logo facing upwards.
2 Insert the interface pod into Port 1 or Port 2 of the analyzer.
3 Push the interface pod firmly into the analyzer until the connectors are
properly seated. The clip on the base of the interface pod clicks into
place when the interface pod is fully inserted.
The analyzer automatically sets the transmit and receive parameters
according to the signal it receives from the interface pod. The port is
automatically configured for full duplex mode.
Page 43

Setting Up the Analyzer
To Insert or Remove an Interface Pod
Caution You must always have two interface pods inserted in the analyzer while
it is operating. If your operations require only a single interface pod,
insert the blank interface pod (provided with the analyzer) into the
other port.
The two interface pods are necessary to maintain a balanced airflow for
cooling of internal components and to comply with EMC emission
standards.
Note Before you use an optical interface pod, you should clean the optical connectors and
test cables. See the appropriate Setting Up the Interface Pod guide.
Note To avoid any possibility of eye damage, the laser is automatically turned off when you
insert or remove an optical interface pod.
To Remove an Interface Pod
1 Setting Up the
Analyzer
Press on the clip underneath
the interface pod and firmly
pull the interface pod out of
the analyzer.
When you remove an interface pod, make sure you store it in a dust-free
location that meets the environmental requirements listed in the Setting
Up the Interface Pod guide. An electrostatic bag has been supplied for
storing each interface pod.
1-29
Page 44

Setting Up the Analyzer
To Troubleshoot the Analyzer
To Troubleshoot the Analyzer
If the Power LED is Not On
❑ Check that the analyzer’s power switch is on.
❑ Check that the analyzer’s power cable is connected to the analyzer and
If the Power LED is Red When You Switch On the
Analyzer
If the Power LED flashes red, there is a hardware fault. The analyzer may
still start, however, it will not work properly (for example, you may only be
able to use one port). Return the analyzer to Hewlett-Packard at your
convenience.
plugged in to the power outlet, and the mains power is on.
1-30
If the Power LED is continuously red, there is a serious hardware fault.
Return the analyzer to Hewlett-Packard.
If the Analyzer Switches on Normally, but You Cannot
Display the User Interface
❑ Check that the LAN cable between the analyzer and the notebook PC or
workstation is properly connected.
❑ Check that the analyzer is correctly configured for the network.
❑ Check that the computer has only the software specified in “Analyzer
Software” on page 1-4 loaded. Other software may interfere with the
computer configuration. Restore the hard disk by either
• restoring the backup (see “To Restore Files from Backup Storage
Media to a Notebook PC” on page 1-25)
• using the reset facility (see “To Reset the Notebook PC” on
page 1-27)
Page 45

Setting Up the Analyzer
To Troubleshoot the Analyzer
If the Controlling Computer has No Display
❑ Check that the controlling computer power switch is on.
❑ Check that the power cable is properly connected to the controlling
computer.
❑ Check that the brightness and contrast controls are correctly set.
❑ Check that the computer has only the software specified in “Analyzer
Software” on page 1-4 loaded. Other software may interfere with the
computer configuration. Restore the hard disk by either
• restoring the backup (see “To Restore Files from Backup Storage
Media to a Notebook PC” on page 1-25)
• using the reset facility (see “To Reset the Notebook PC” on
page 1-27)
If You Cannot NFS Mount the Analyzer File System
❑ Check that Nfsdw and Inetdw are running on the notebook PC. If they
are running, the icons will be displayed on the screen.
If You Cannot Print to the Connected Printer
1 Setting Up the
Analyzer
❑ Check that the PC-Xware LPD is running on the notebook PC.
❑ Check that all printer cables are connected correctly.
If the Cables Do Not Fit the Sockets
❑ Check the Box Contents lists to confirm that you have the correct
equipment.
❑ Check that you are using the correct cables for each connection. Check
the part numbers on the cables against the part numbers in the diagrams
in this User’s Guide.
1-31
Page 46

Setting Up the Analyzer
To Troubleshoot the Analyzer
If the System Failure Window is Displayed
❑ Contact HP Customer Support. Print the window and fax it to HP
Note If you cannot access the analyzer after performing the required checks, refer to the
Worldwide Support card for information on how to obtain customer support.
Customer Support. See “To Print a Window” on page 1-33.
1-32
Page 47

Setting Up the Analyzer
To Troubleshoot the Analyzer
To Print a Window
To Print a Window from the Notebook PC
1 Ensure that the printer is connected.
2 Make sure the window you want to print has the keyboard focus.
3 Press Alt-PrtSc.
4 From the Accessories program group, click the Paintbrush icon to
open Paintbrush.
5 From the Edit menu, select Paste to copy the captured screen into
Paintbrush.
6 From the File menu, select Print; then click OK. If you want, you can
save the file using the Save option on the File menu.
1 Setting Up the
Analyzer
The captured window will print on your default printer.
To Print a Window from an HP-UX Workstation
1 Make sure the window you want to print does not have any other
window in front of it.
2 In a shell window, type
xwd -out <file_name>
You must save and name the captured window file in order to print it.
The cursor turns into a cross hair.
3 Move the cursor over the window you want to save; then click the left
mouse button. The keyboard bell will sound three times.
4 Print the file using the xpr command. For example, to print to the
default LaserJet (PCL) printer, type the following in a shell window:
xpr <filename> | lp
If you want to specify a printer, add the -d<printer_name> command to
the end of the above string. See your HP-UX user’s guide for more
information.
1-33
Page 48

Setting Up the Analyzer
To Troubleshoot the Analyzer
1-34
Page 49

2
To Connect to the System Under Test 2-2
To Log In to the Analyzer 2-11
To Log Out from the Analyzer 2-16
To Configure the Analyzer and Ports 2-18
To Monitor the Link (Network) 2-20
To Monitor a Channel (VPI/VCI) 2-26
To Monitor Alarms and Errors 2-28
To Log Statistics 2-33
To Run SMARTtests and Predefined Macros 2-36
To Capture and View Data 2-38
To Simulate Traffic 2-44
To Inject Alarms and Errors 2-48
To Use Macros 2-54
2 Using the Analyzer
Using the Analyzer
Page 50

Using the Analyzer
To Connect to the System Under Test
To Connect to the System Under Test
1 Before you connect to the system under test (SUT), ensure that
• the analyzer is connected to the controlling computer (workstation or
notebook PC)
• two interface pods are inserted in the analyzer, one of which may be a
blank pod
2 Connect the interface pod(s) to the SUT. Each interface pod has a
transmit and receive connector on its front panel that you use to
connect to the SUT. See the Setting Up the Interface Pod guides for
specific details relating to your interface pods.
Note If you are using an optical interface pod, ensure that the connectors on the front
panel and the test cables are clean. Refer to the appropriate Setting Up the Interface Pod
guide for more information.
2-2
Receive (Rx) Transmit (Tx)
Page 51

Using the Analyzer
To Connect to the System Under Test
There are three system connection options:
• intrusive
• non-intrusive
• diagnostic
Intrusive System Connection
When you install or remove an intrusive system connection, it affects the
traffic on the link to which the analyzer is connected. Either you need to
take the link offline to make the connection, or you need to interrupt
traffic.
The test connections available for intrusive system are
• network element
• remote loopback
• in-line
2 Using the Analyzer
The interface configuration options for an intrusive connection are
• full duplex
• receive loopback
• regenerator
• loop through
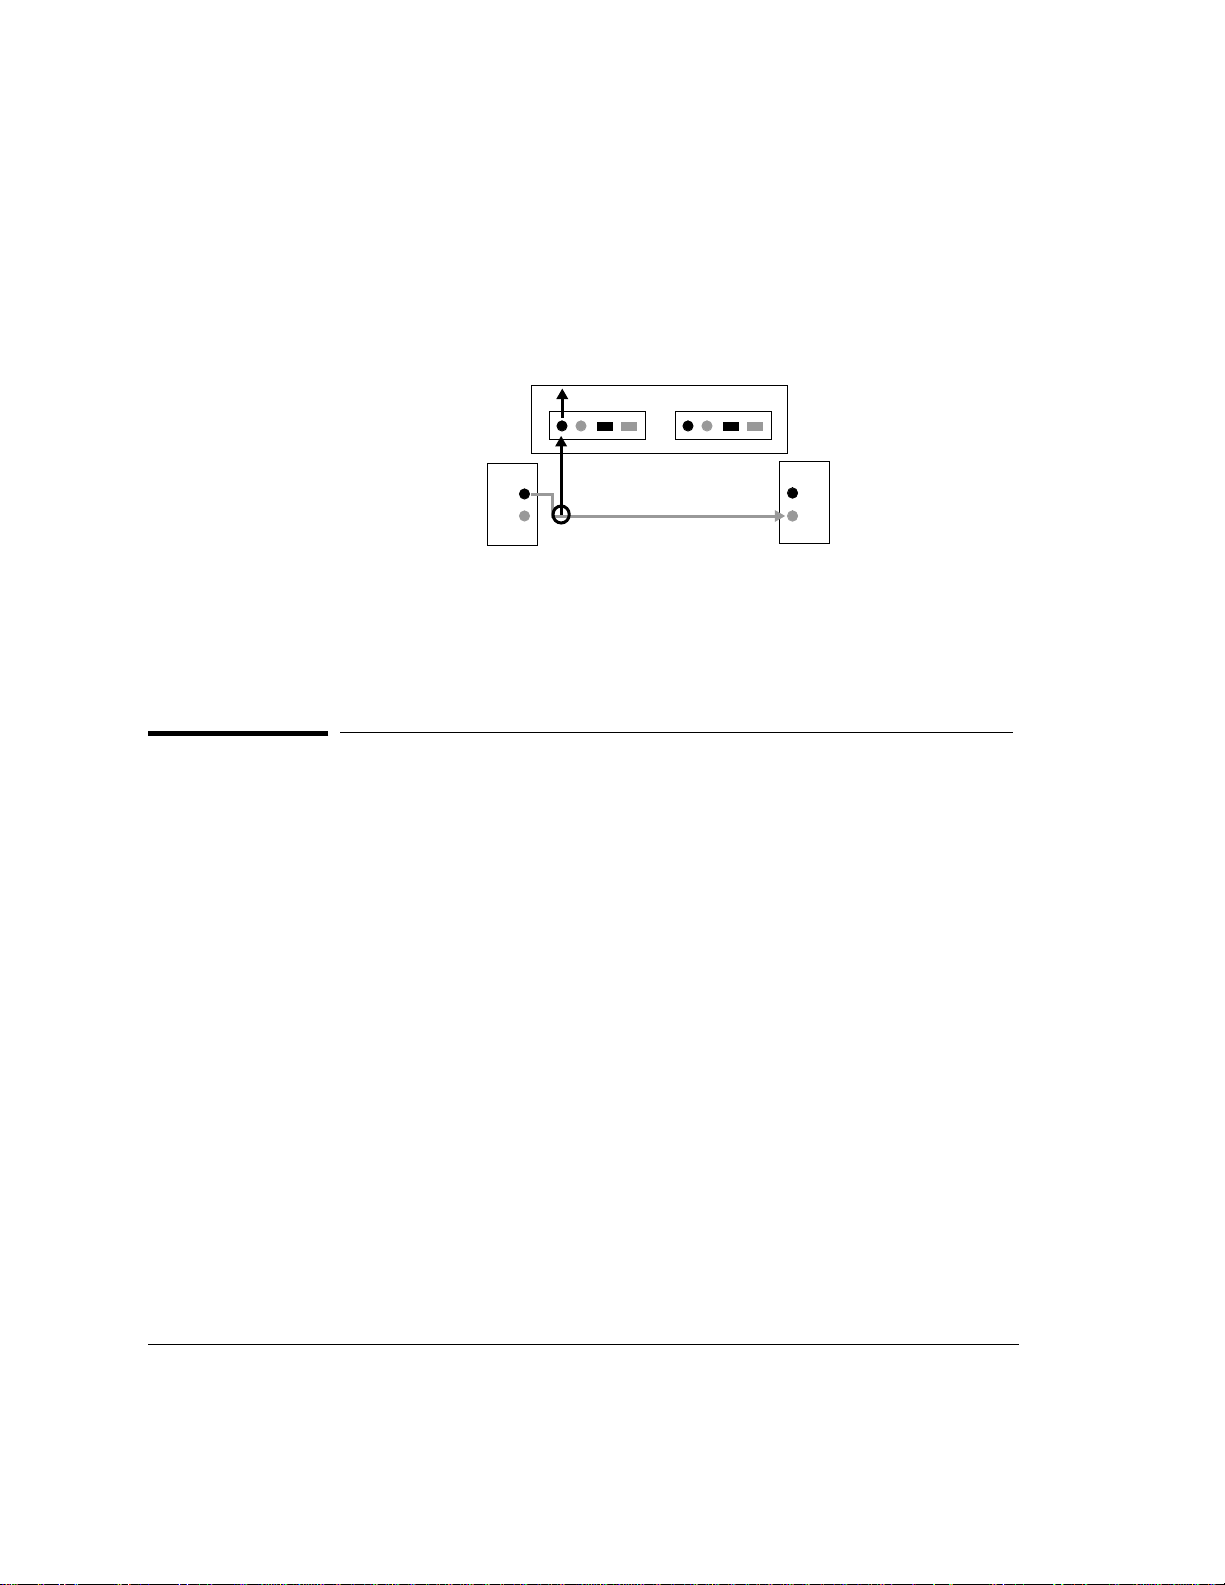
Network Element Test Connection
You can use the analyzer to transmit test traffic that passes through the
network element, then returns to the analyzer for analysis and
comparison with the originally transmitted test traffic.
A typical application for this type of connection is installing and
troubleshooting a single network element, for example, checking whether
the network element is performing according to its specifications. Use this
connection to monitor, capture, and transmit traffic.
2-3
Page 52

Using the Analyzer
To Connect to the System Under Test
Equipment under test
The network element connection is an out-of-service test, that is, the
system is not live. Use this connection to check things such as
• protocol transfer and conversion
• connection verification
• quality of service parameters
• policing mechanisms
Configure the affected port(s) for full duplex for the network element
connection. If you use the receive loopback configuration or the recovered
clock timing source, make sure the network element transmitter is
synchronized to an independent timing reference (to avoid problems that
may be caused by possible clock failure).
Port 1 Port 2
Tx
Rx
2-4
Remote Loopback Test Connection
The remote loopback test connection is an out-of-service test, that is, the
network is not live. The analyzer generates and receives all system traffic.
Port 1
Tx
Rx
Equipment under test
Tx
Rx
Page 53

Using the Analyzer
To Connect to the System Under Test
A typical application for this type of test connection is testing the
integrity of the system under test. The remote loopback test connection is
similar to the network element test connection in its uses. However, while
the network element connection tests a single element at a time, the
remote loopback connection tests all network elements in the loop. Use
this connection to monitor, capture, and transmit traffic.
The main uses for this type of connection are to test
• continuity
• mean cell delay
• loop cell loss
Typically, you use a network element test connection to test any new
element you add to the network. When the element passes all relevant
tests, you change to the remote loopback test connection, and test to see
what effect the new element is having on the other network elements in
the loop. You can also use this test to identify a problem with a system
that is offline.
2 Using the Analyzer
Configure the affected port(s) for full duplex for this type of test
connection.
In-line Test Connection
The in-line test connection is an intrusive system connection. A typical
application for the in-line test connection is testing equipment when it is
being installed. Using this connection, you don’t need to complicate your
test with optical or electrical splitters and T-pieces.
Port 1
Tx
Rx
Equipment under test
The loop through interface configuration is another type of in-line test
connection.
Port 2
Tx
Rx
2-5
Page 54

Using the Analyzer
To Connect to the System Under Test
Port 1
Tx
Rx
Equipment under test
When using an in-line test connection, configure the affected port(s) for a
full duplex, regenerator, or loopthrough interface configuration (according
to the type of interface pod installed).
The disadvantage of the in-line test connection is that you need to break
the link to install and remove the connection. Therefore, for networks that
are already running live traffic, it is better to use a non-intrusive system
connection, such as passive and T-piece test connections.
Port 2
Tx
Rx
Non-Intrusive System Connection
A non-intrusive system connection does not affect the traffic on the link to
which the analyzer is connected. A non-intrusive system connection is
most useful because you can run in-service tests without interfering with
the live system traffic.
2-6
There are two test connections available for the non-intrusive system
connection:
• passive
• T-piece
The analyzer interface configuration options for a non-intrusive system
connection are full duplex and receive loopback.
Page 55

Using the Analyzer
To Connect to the System Under Test
Passive Test Connection
Some ATM switches have dedicated test access ports. All traffic from the
switch is transmitted through both the regular port and the dedicated test
port. Connecting the analyzer to the dedicated test port is completely
non-intrusive. This type of connection never interferes with live traffic,
even during set up.
Port 1
Tx
Rx
Equipment under test
When using a non-intrusive, passive connection, the interface
configuration of the analyzer is not important. The analyzer’s default
interface configuration is full duplex.
Port 2
Tx
Rx
T-piece Test Connection
This is a type of non-intrusive test connection that requires a T-piece or
splitter already present at a cross-connect. However, it does steal some
power from the traffic being transmitted over the network, so the T-piece
or splitter should be as close as possible to the transmit source (where the
power is at its strongest).
• For electrical networks, using a T-piece or splitter is common practice.
• For optical networks, special optical splitters are available. Using a T-
piece is possible only if your switch or network supports it. (The
splitter can draw up to 10% of the transmitted power, which affects
the transmission distance.)
2 Using the Analyzer
2-7
Page 56
Using the Analyzer
To Connect to the System Under Test
Port 1
Tx
Rx
When using a non intrusive, T-piece connection, the interface
configuration of the analyzer is not important. The analyzer’s default
configuration is full duplex.
T-piece
Equipment under test
Port 2
Tx
Rx
Diagnostic System Connection
A diagnostic connection does not affect the traffic on the link to which the
analyzer is connected. Use this connection when you want to test the
analyzer.
There are two diagnostic test connections available for the diagnostic
system connection:
• transmit loopback
• external loopback
2-8
You can connect any of the interface pods available with the analyzer in a
diagnostic system connection.
Page 57

To Connect to the System Under Test
Transmit Loopback Test Connection
Port 1 Port 2
Tx
Rx
Using the Analyzer
Equipment under test
Transmit loopback is both an interface configuration option and a test
connection.
Transmitted data is directed both out of the transmit connector and
internally (within the interface pod) to the measurement system.
The analyzer ignores external connections to the receive connector.
For E1 interface pods set for the transmit loopback interface
configuration, you can select either the BNC or RJ-48 (equipment, or line
connector) as the transmitting connector. For all other interface pods,
you can only transmit using the connector labeled Out.
External Loopback Test Connection
Typical applications for this type of connection include calibration, selftesting, troubleshooting, and demonstrations. This is an out-of-service
test that runs independently of a network. The analyzer acts as both the
transmitter and receiver.
2 Using the Analyzer
2-9
Page 58

Using the Analyzer
To Connect to the System Under Test
You can perform this test using either a single port with a single interface,
or across two ports using two interfaces of the same line rate and
configuration. For example, you can make an external loopback
connection across two ports, between two OC-3/STM-1 interfaces.
Port 1 Port 2
Port 1 Port 2
Use the external loopback connection to monitor, capture, and transmit
traffic.
Configure the affected ports for full duplex interface configuration for the
external loopback test connections.
2-10
Page 59

Using the Analyzer
To Log In to the Analyzer
To Log In to the Analyzer
To start up the HP Broadband Service Analyzer from the notebook PC,
you must double-click the appropriate icon in the HP Broadband Analyzer
program group. You can display either the analyzer Graphical User
Interface, or the analyzer Command Line Interface.
If at any time you cannot log in to the analyzer, reboot the notebook PC by
pressing Ctrl-Alt-Del.
If you still cannot log in, refer to the Worldwide Support card for
information about how to obtain customer support.
2 Using the Analyzer
To Log In to the Analyzer Graphical User Interface
Double-click one of the following icons in the HP Broadband Analyzer
program group:
Use this icon to start the HP Broadband
Service Analyzer with a PC connected
HP Analyzer
HP Analyzer
over SLIP
through a Local Area Network (LAN).
Use this icon to start the HP Broadband
Service Analyzer with a PC connected
through the serial port.
2-11
Page 60

Using the Analyzer
To Log In to the Analyzer
Type your user
1
name. You are
assigned a user
name by your
System
Administrator.
The HP Broadband Service Analyzer Login window is displayed after you
double-click an icon.
Click OK.
3
2
2-12
Type your
password.
Note The HP Broadband Service Analyzer has two sets of default login information:
• User Name—boomer
• User Name—root
The analyzer checks the information that you entered. If your user name
and password are correct, it starts a new session using the default
configuration and displays the analyzer’s main screen and Link Monitor. If
any of the information you entered is incorrect, the analyzer displays an
error message and prompts you to try again.
Password—broadband
Password—rootpasswd
Page 61

Using the Analyzer
To Log In to the Analyzer
If at any time you cannot log in to the analyzer, reboot the notebook PC in
one of the following ways:
• Press the Reset button underneath the PC.
• Press Ctrl-Alt-Del.
If you still cannot log in, refer to the Worldwide Support card for
information about how to obtain customer support.
To Log In to the Analyzer’s Graphical User Interface on
an HP-UX Workstation
1 Type xhost +<analyzer hostname>
2 Type telnet <analyzer hostname> 5200
The analyzer hostname is assigned by your system administrator.
The HP Broadband Service Analyzer Login window displays.
2 Using the Analyzer
To Log In to the Command Line Interface
Double-click one of the following icons:
Use this icon to start the Command Line
Interface to the HP Broadband Service
HP Analyzer
Terminal
HP Analyzer
Terminal over
SLIP
Analyzer (see the Macro Online Help). The
terminal is connected through a Local Area
Network (LAN).
Use this icon to start the Command Line
Interface to the HP Broadband Service
Analyzer (see the Macro Online Help). The
terminal is connected through the serial port.
2-13
Page 62

Using the Analyzer
To Log In to the Analyzer
Type your login name. You
1
are assigned a login name by
your System Administrator.
Type your password.
2
The Command Line Interface Login window is displayed.
2-14
The CLI (Command Line Interface) accepts Tcl (Tool Command
Language) commands, not UNIX commands. Tcl is the scripting language
used in macros. Some commands you can use at the Tcl prompt (%) are
• help—show CLI information
• version—show the software version
• saf—start the System Administration functions
• reboot—reboot the analyzer
• exit—exit the CLI
See the Macro Online Help for information about how to use the
Command Line Interface.
To Read the Analyzer’s Main Screen
The analyzer’s main screen is the first screen displayed after you log in.
Link Monitor is shown for each active port. You can view either Link
Monitor or the Simulator for each port by clicking the appropriate tab.
Page 63

Menu Bar.
Tests. See “To
Run
SMARTtests
and Predefined
Macros” on
page 2-36.
Using the Analyzer
To Log In to the Analyzer
A port is active as soon as an interface pod is inserted. The left side of the
screen displays information about port 1, and the right side of the screen
displays information about port 2.
Measurement Controls. Start, stop, or reset
the measurement system and analyzer
configuration. See “To Configure the
Analyzer and Ports” on page 2-18.
2 Using the Analyzer
Alarm and Error
Indicators. See
“To Monitor
Alarms and
Errors” on
page 2-28.
Link Monitor.
See “To
Monitor the
Link
(Network)” on
page 2-20 and
“To Monitor a
Channel
(VPI/VCI)” on
page 2-26.
Simulator. See
“To Simulate
Traffic” on
page 2-44 and
“To Inject
Alarms and
Errors” on
page 2-48.
Help hints. See “Help Hint
Bar” on page 3-7.
The analyzer automatically configures itself when you first log in and
when you change an interface pod. You can change the configuration
settings if required. See “To Configure the Analyzer and Ports” on
page 2-18.
If you want to use the same configuration in the future but do not want to
re-enter all the session details, from the File menu choose Save Session.
T o load a saved system configuration into the analyzer , from the File menu
select Restore Session.
2-15
Page 64

Using the Analyzer
To Log Out from the Analyzer
To Log Out from the Analyzer
From the File
1
menu, select
Exit.
or
Double-click
1
the Controlmenu box.
2
2-16
Click Yes.
If you are logging alarms and errors when you log out, the analyzer
displays a message reminding you that you are still logging. When you exit
the analyzer, logging stops.
Page 65

Using the Analyzer
To Log Out from the Analyzer
If you are using a modem connection, you must disconnect the modem.
1 Double-click on the Dialer icon in the Acadia/VxD program group. The
Ipswitch, Inc. SLIP/PPP Configure & Dial window displays.
2 Select e5200a from the Phonebook list.
3 Click the Hangup button. The connection closes.
After you have logged out, switch off the analyzer. See “To Switch the
Analyzer On and Off” on page 1-22.
2 Using the Analyzer
2-17
Page 66

Using the Analyzer
To Configure the Analyzer and Ports
To Configure the Analyzer and Ports
After you log in you must configure the analyzer for the type of test you
want to perform, then specify the A TM and physical layer configuration for
each port.
To Configure the Analyzer
1 From the Configure menu, select the appropriate port.
2 Select the required configuration option:
• Select full duplex for intrusive tests.
• Select transmit loopback for diagnostic tests.
• Select receive loopback for non-intrusive tests.
• Select regenerator for intrusive tests for optical interface pods.
The default configuration option is full duplex. These options are also
available from the Simulator.
To set the measurement system and the reference clock, see the User
Online Help.
To Configure a Port
The analyzer auto-configures each port after you switch on the power and
insert an interface pod, and when you click the Reset button on the main
screen. When you configure a port, the analyzer changes the reference
clock to match the configuration. You can configure the analyzer manually
to override the automatic settings.
2-18
Page 67

Using the Analyzer
To Configure the Analyzer and Ports
Caution You should reconfigure the ports only when the measurement system is
stopped. Reconfiguring the ports causes the measurements and some
data to be lost. A warning message appears when this occurs.
To Manually Configure Each Port
Click the ATM tab;
2
then specify the ATM
configuration
parameters for the
port.
2 Using the Analyzer
Click the physical layer
1
tab; then specify the
physical layer
configuration parameters
for the port.
Click the Signaling
3
tab; then specify
the signaling
configuration
parameters for the
port.
If you want to reset the configuration parameters to the default values
after you have changed them, click the Auto button. Clicking the Reset
button on the main screen also resets the port configuration parameters
to their default values.
2-19
Page 68

Using the Analyzer
To Monitor the Link (Network)
To Monitor the Link (Network)
While the measurement system is on, the analyzer continuously measures
the key indicators of the health of the link, and displays that information in
an easy-to-read summary format. To start the measurement system, click
the Start button on the main screen.
Use Link Monitor to see overall trend information. It provides an overview
of what is happening in the link and highlights any abnormalities.
Information relating to the interface pod and the link for port 1 is shown
on the left side of the screen; information relating to the interface pod and
link for port 2 is shown on the right side of the screen. When one of the
ports is empty, the analyzer displays a message telling you that there is no
interface pod inserted in that port.
All measurements shown on Link Monitor are current. The analyzer
collects measurements every 100 ms. At the end of a sampling period of 3
to 5 seconds, it uses these measurements to calculate statistics; then
displays the statistics on the screen (set the update period on the Set
Measurement Period window).
2-20
Page 69

Link Monitor is divided into two main areas.
Link summary graphs
Channel summary
Using the Analyzer
To Monitor the Link (Network)
2 Using the Analyzer
Link Summary
These graphs show you a summary of the condition of the link. You can
double-click each graph to enlarge it and see detailed information.
These measurements are current, and the values are updated in real-time
while you view the graph.
2-21
Page 70

Using the Analyzer
To Monitor the Link (Network)
10 Highest Mb/s Graph
The first link summary graph shows the ten channels in the link that are
using the largest amounts of bandwidth. When you click a bar in the graph,
the VPI and VCI are shown under the graph and the channel is highlighted
in the channel summary. When you double-click the graph to enlarge it,
the analyzer displays the following information:
• mean sample bandwidth
Enlarged 10 Highest
Mb/s graph
• maximum sample bandwidth
• long term average bandwidth
These measurements are updated at the end of the update period (as set
on the Set Measurement Period window). The top ten channels might
change at the end of an update period.
Y ou can go to Channel Monitor from the enlarged graph by clicking a bar in
the graph to select a channel; then clicking the Monitor Channel button.
Enlarged AAL Usage
graph
AAL Usage Graph
The second link summary graph shows what percentage of the traffic is
made up of each AAL type. This is based on the mean sample bandwidths
of all channels in the link. When you double-click the graph to enlarge it,
you get detailed information about each AAL type, including the usage
ratio and bandwidths.
The detailed AAL Usage graph shows the
• percentage of bandwidth used by each AAL type
• amount of bandwidth (in Mb/s) used by each AAL type
Null refers to channels of unknown AAL type.
2-22
Page 71

Using the Analyzer
To Monitor the Link (Network)
Total Mb/s Graph
The third link summary graph shows the maximum sample bandwidth
usage over time. There is a vertical indicator on the right side of the
graph. You can click the graph to move the vertical indicator to different
positions and see what the bandwidth usage was at any time during the
previous 300 seconds (5 minutes). The bandwidth usage is shown under
the graph in Mb/s.
Enlarged Total Mb/s
graph
When you double-click the graph to enlarge it, the analyzer displays the
following information:
2 Using the Analyzer
• maximum bandwidth available for the port (which is the maximum
value on the bandwidth axis for the graph)
• maximum sample bandwidth over the past 300 seconds (dark blue
line)
• mean sample bandwidth over the past 300 seconds (light blue line)
The gap between the maximum and mean sample lines is an indication of
how bursty the traffic is. The further apart the lines are the more bursty is
the traffic on the link.
At the start of each new update period (as set on the Set Measurement
Period window), the vertical indicator returns to the right side of the
graph.
2-23
Page 72

Using the Analyzer
To Monitor the Link (Network)
Channel Summary
Virtual Channel Identifier (VCI)
in decimal.
Virtual Path Identifier
(VPI) in decimal.
Display Channel Monitor
for the selected channel.
Maximum sample bandwidth.
AAL type.
Capture data.
The table at the bottom of Link Monitor is a summary of the first 1023
active channels (VPI/VCI) that the analyzer reads for each port (shown in
the order in which they were detected) and one user-selected channel
(selected through Channel Monitor). Above the table is the total number
of channels for each port that have been active during the current
measurement period.
To go to Channel Monitor and see detailed information about a specific
channel, select a channel by clicking on the row for that channel; then
click the Monitor Channel button.
2-24
The analyzer can monitor up to 1024 channels at a time. Any channels
over the 1024 limit are not shown in the channel summary. You can select
a specific channel on Channel Monitor that will display on the channel
summary as the 1024th channel.
Page 73

To select a specific channel
1 Start Channel Monitor.
2 Click the Set Up button.
3 Type the VPI and VCI to set up a new channel.
4 Select either automatic decode or manual decode to set the PRBS
pattern or AAL type.
5 Click OK.
See also “To Monitor a Channel (VPI/VCI)” on page 2-26.
Using the Analyzer
To Monitor the Link (Network)
2 Using the Analyzer
2-25
Page 74

Using the Analyzer
To Monitor a Channel (VPI/VCI)
To Monitor a Channel (VPI/VCI)
Channel Monitor displays a summary of bandwidth usage, alarms, and
errors over the past 300 seconds (5 minutes) for individual channels
within the link. It works together with Link Monitor, which gives you a
summary of up to 1024 active channels in the link. When you find a
channel of interest, or an error or abnormality in Link Monitor, you can use
Channel Monitor to look at specific channels in greater detail. Channel
Monitor is particularly helpful for solving protocol problems.
Channel Monitor analyzes the protocol stack running on the channel. It
shows the links between the layers, and what effects alarms or errors in
one layer have on other (higher) layers. It also provides graphs that show
the way the channel is working, which help to highlight any abnormalities.
All measurements shown on Channel Monitor are current. The analyzer
updates the measurements at the end of the update period (as set on the
Set Measurement Period window).
2-26
Note If the analyzer receives a large number of errors for a channel, it detects that channel’s
AAL type as Null. If you want to monitor AAL statistics for that channel, you need to set up the
channel and set the AAL type manually.
Start the Channel Monitor in one of the following ways:
• Select one of the channels shown in the channel summary in Link
Monitor; then click the Monitor Channel button.
• From the Monitor menu, select the required port; then select the
Channel option and enter the required VPI/VCI.
• Click the Monitor Channel button from the
❍ Simulator
❍ 10 Highest Mb/s graph
❍ AAL error summary
❍ OAM F5 flow alarm summary
Page 75

Select the VPI/VCI and MID
(for AAL-3/4) of the channel
you want to view.
If required, select the AAL
type for the channel.
The analyzer automatically
detects the AAL type.
The maximum sample
bandwidth during the past
300 seconds.
Alarms and errors that
occurred during the past
300 seconds for each
protocol layer.
Capture data from the
current channel.
Using the Analyzer
To Monitor a Channel (VPI/VCI)
If required, select the
PRBS type for the channel.
To display more detailed
information about a
particular layer, click one
of the protocol tabs. See
“To Monitor Alarms and
Errors on a Channel” on
page 2-31.
2 Using the Analyzer
Channel Monitor collects and displays statistics after a channel is selected
using Link Monitor, or after a channel is specified on the Monitor Channel
window. When the statistics are available, Channel Monitor shows them
for the past 300 seconds. The analyzer starts collecting statistics as soon
as you select a channel, even if Channel Monitor is not displayed.
Note For AAL-3/4 SAR, ATM statistics for the entire channel are displayed; however, AAL
statistics are displayed only for the selected MID.
For AAL-3/4 channels with more than one MID, Channel Monitor AAL measurements are
available only after you select a specific MID. You can select a MID in the Channel Monitor
window only if you select to decode the channel manually as AAL-3/4 in the Set Up Channel
window.
2-27
Page 76

Using the Analyzer
To Monitor Alarms and Errors
To Monitor Alarms and Errors
The analyzer can display a summary of the alarms and errors at both the
link and channel level.
You can select the way you want to view the error statistics using the pulldown lists on the status screens. Select from the following options:
• Count—the number of times the error occurred
• Ratio—the number of errored cells or frames received as a ratio of all
• Seconds—the number of one-second intervals that contain the error
For AAL-3/4 you can choose to view either SAR or CPCS statistics.
See the User Online Help (look up details of the individual alarms and
errors) to find out what the relationships between the different alarms or
errors mean. This tells you the probable cause for an alarm or error, which
can help you resolve network problems.
cells or frames received
2-28
To Monitor Alarms and Errors on the Link
A row of indicators at the top of Link Monitor warns you when alarms and
errors occur within the link at the physical, ATM, AAL, and OAM levels.
The color of the indicator shows the status of the level.
An indicator can be either
• green to indicate that there have been no alarms or errors since the
start of the current measurement period
• red to indicate a current alarm or error
• orange to indicate that an alarm or error has occurred since the start of
the current measurement period but is now clear
Y ou can click each indicator to go to a summary window to see information
about the alarms, errors, and measurements.
Page 77

Click an alarm and
1
error status
indicator to
display the
summary window
for a specific
protocol layer.
Using the Analyzer
To Monitor Alarms and Errors
Select to display
2
the errors as a
count, a ratio, or
seconds.
2 Using the Analyzer
The color assignments are the same as for the higher level (summary)
indicators.
Alarms of similar durations or errors with similar counts are usually
related.
Note If unexpected alarms and errors occur while you are using an optical interface pod, run
an external loopback test on the port to determine whether there is a problem with the
network, or with the test cables or connectors. If the problem is not in the network, clean the
optical connectors and cable connectors. See the appropriate Setting Up the Interface Pod
guide for instructions.
2-29
Page 78

Using the Analyzer
To Monitor Alarms and Errors
The status windows display the following information:
• Physical Layer
• ATM Layer
• ATM Adaptation Layer (AAL)
❍ types of alarms and the number of one-second intervals that contain
each alarm (this is called “errored seconds”)
❍ a summary of errors displayed as seconds, count, or ratio
❍ types of alarms and the number of one-second intervals that contain
each alarm
❍ count and bandwidth of ATM cells
❍ a summary of errors displayed as seconds, count, or ratio
❍ affected channel (VPI/VCI) for each AAL type
❍ Sequence Number and Cell Loss errors for AAL-1
❍ CRC errors for AAL-3/4 and AAL-5
❍ number of affected channels
2-30
• OAM
❍ affected channel or path
❍ flow type (segment or end-to-end)
❍ the number of one-second intervals that contain AIS or RDI alarms
❍ number of affected F4 and F5 flows
Page 79

Using the Analyzer
To Monitor Alarms and Errors
To Monitor Alarms and Errors on a Channel
Alarms and errors on a channel are displayed in Channel Monitor. To start
Channel Monitor see “To Monitor a Channel (VPI/VCI)” on page 2-26.
The summary shows details of the alarms and errors that occurred at each
layer. Click a tab for more information about ATM and AAL alarms and
errors.
Note If the analyzer receives a large number of errors for a channel, it detects that
channel’s AAL type as Null. If you want to monitor AAL statistics for that channel, you need to
set up the channel and set the AAL type manually.
2 Using the Analyzer
Ensure you select the
Summary tab. Use
Channel Monitor to
interpret the effects of
the alarms and errors.
2-31
Page 80

Using the Analyzer
To Monitor Alarms and Errors
Click a protocol tab to view
detailed information about the
alarms, errors, and other
statistics for a specific protocol.
Note All alarms and errors that occur at the physical layer affect the ATM layer, and
might render all ATM statistics invalid.
On the summary Channel Monitor, look for
• alarms and errors in the lower protocol layers and see what effects
they had on the higher layers
• the bandwidth during the periods that alarms and errors occurred to
see whether the bandwidth was affected
On the protocol specific Channel Monitor, look for
• alarms of similar duration
• errors with similar counts
See also User Online Help
2-32
Page 81

Turn logging
4
on/off.
Specify whether
3
you want to log
predefined
statistics, userdefined
statistics, or
both.
To Log Statistics
If required, append the new
2
statistics to the end of an
existing log file.
Specify the file to which you
1
want to log statistics.
Using the Analyzer
To Log Statistics
2 Using the Analyzer
When you click the On button, the statistics you define are logged to the
specified file. Logging continues until you click the Stop button.
2-33
Page 82

Using the Analyzer
To Log Statistics
Select the port for
1
which you want to
display the
statistics.
Click one or more of
3
the available
variants.
2-34
Select the layer for
2
which you want to
display the statistics.
Click Select.
4
To Print the Log File
Click the Stop button to stop logging statistics; then click the Print button
to send the contents of the log file to the default printer. You cannot print
the log file while you are still logging statistics.
Page 83

Using the Analyzer
To Log Statistics
To View the Log File
Log files are formatted as straight text. You can view log files up to 32,000
bytes in size using the macro editor.
1 Click the Stop button in the Log window to stop logging statistics.
2 From the Macro menu, select Edit to display the macro editor.
3 Specify the name of the log file you want to view. The analyzer
displays the named log file in the editor window.
2 Using the Analyzer
2-35
Page 84

Using the Analyzer
To Run SMARTtests and Predefined Macros
To Run SMARTtests and Predefined Macros
The analyzer provides a number of SMARTtests and predefined macros to
help you perform routine tasks.
SMARTtests
Simply select a SMARTtest from the Test pull-down list at the top of the
main screen, change any default values you require, and click the Start
button. It’s as easy as 1, 2, 3; the analyzer does the rest.
If you are not sure which SMARTtest to run, see the User Online Help.
Help is available for all SMARTtests describing what each one does, who
should run it, and why and when to run it.
Make sure the analyzer is connected to the system under test, and the port
is configured for full duplex mode. Refer to “To Connect to the System
Under Test” on page 2-2.
Select the transmit and receive
1
connection for the SMARTtest.
Change the default values to run the
2
SMARTtest in the way you want.
You can change the criteria and
traffic profile; then re-run the
SMARTtest any number of times.
Click the Start button.
3
2-36
Page 85

Using the Analyzer
To Run SMARTtests and Predefined Macros
Before the SMARTtest starts to run, the analyzer checks to make sure the
affected ports are configured in full duplex mode and that there are no
alarms present. If either of these conditions is not met, an error message
appears and the SMARTtest does not run.
The figure at the bottom of the window starts running to indicate that the
SMARTtest has started, and relevant details are shown on the window as
the SMARTtest runs. The SMARTtest continues to run until it completes
or fails, as specified by the pass criteria. To stop the SMARTtest before
completion, click the Stop button.
When the SMARTtest completes, the figure jumps up if the SMARTtest
passes, or falls down if it fails. The SMARTtest Results window also
appears indicating whether the SMARTtest passed or failed, and if
relevant, why it failed.
The analyzer automatically captures data for each SMARTtest. If the
SMARTtest fails, you might find this captured information useful for
diagnostic purposes.
Note When you start and stop a SMARTtest, you also start and stop Link Monitor and
the analyzer’s measurement system.
Predefined Macros
Select the predefined macro you want to run from the Test pull-down list
at the top of the main screen, then click the Test button to play the
macro. The predefined macro window is displayed; showing any results or
output that the predefined macro produces.
If you are not sure which predefined macro to run, see the User Online
Help.
2 Using the Analyzer
2-37
Page 86

Using the Analyzer
To Capture and View Data
To Capture and View Data
You can capture real data from the link at any time and use it for testing
and analysis. The analyzer captures incoming data from one or more ports
at full line rates up to 155 Mb/s. Capture data when you want to analyze a
fault condition or see what the data actually looks like. For example, you
can capture data to
• look for protocol errors
• look at pre-trigger and post-trigger data to determine the possible
causes of a fault
• produce reports from captured, logged, and monitored data
• look for patterns in protocols not currently supported by the analyzer
• store data for offline analysis at another time
The analyzer’s data capture options let you choose
2-38
• the source of the data to capture, for example, data for a specific
channel or set of channels
• the IP address or subnet of the data to capture (if there is IP traffic on
the link)
• whether to capture from one or both ports
• the start/stop criteria for the capture
After capturing data, you can view it using the View Captured Data
window.
Page 87

Using the Analyzer
To Capture and View Data
To Capture Data
Display the View Captured Data window for a single port in one of the
following ways:
• From the Monitor menu, select the required port; then select the
Capture option.
• From Link Monitor, click a channel in the channel summary; then click
the Capture button.
• From Channel Monitor, click the Capture button.
• From the AAL error or OAM alarm summary, click the Capture button.
• From the Simulator, click the Capture icon.
To display the View Captured Data window for a multiport capture, from
the Monitor menu, select Multiport; then select the Capture option.
2 Using the Analyzer
2-39
Page 88

Using the Analyzer
To Capture and View Data
Start the capture.
5
Select whether
1
you want to
capture cells or
AAL-5 frames.
Select the type of
2
data you want to
capture.
If required, select
3
the events to
start and stop
the capture.
If required, select
4
to capture cells
that match a
specific pattern
only.
2-40
Click the Patterns button
if you want to define a
capture pattern.
If you are performing a multiport capture, repeat steps 2 to 5 for the
second port. For more detailed information, see the User Online Help.
Click the Triggers button if you want
to select interface pod capture
events to trigger the capture.
Page 89

Using the Analyzer
To Capture and View Data
To View Captured Data
After you capture or load data, it is displayed on the View Captured Data
window. You can use this window to view different portions of the data,
and save it to a file using the Save option on the File menu.
Save your captured data files in the following directory:
/USR/E5200A/HOME/[USERNAME]/PDU
Stop capturing data.
Start capturing data.
Indicates the capture memory
capacity and current level.
You can also use this window to load and view previously captured data.
Continue capturing data after
you have stopped a capture.
Set up the data to
capture.
Indicates the
PDU/cell you are
currently viewing in
capture memory.
Use the Hexadecimal to ASCII conversion table when analyzing PDUs and
byte values. See “Hexadecimal to ASCII Conversion” on page A-2.
2 Using the Analyzer
2-41
Page 90

Using the Analyzer
To Capture and View Data
To use Data Captured by the Analyzer on a BSTS
If you are using the analyzer on a series 400 or series 700 HP-UX
workstation, you can convert the Broadband Service Analyzer captured
data files into Broadband Series Test System (BSTS) data files.
Ensure that the Data Conversion Utility (p/n E5200-10010) is installed.
See the Installing/Upgrading Software section in the HP BSTS System
Installation & Startup Guide.
To convert the analyzer captured data files to BSTS data files
1 In a terminal window, type
cap2bsts [-in analyzer_file_name] -out BSTS_file_name
If the complete in or out file path is not specified, the default directory
$HOME/broadband/recordings is used.
If you only type cap2bsts, information about converting data is displayed.
This information provides details of the conversion utility, such as version
number.
2-42
As the conversion progresses, messages are displayed indicating the
number of cells that have been converted. When all of the cells have been
converted, a message is displayed indicating that the file was successfully
converted.
When you convert data captured by the analyzer to BSTS format, the data
is converted to a stream of ATM cells.
2 Type bisdn_playback to display the BSTS Playback Recording
window.
Note If you use the bisdn_test command, you cannot select the Open option from the File
menu in BSTS.
3 From the File menu, select Open to display the Load Data window.
Page 91

Using the Analyzer
To Capture and View Data
4 Click the converted data file in the list; then click OK. The captured
data file is displayed on the BSTS Playback Recording window.
Note When you convert data captured by the analyzer to BSTS, you will lose the dates in
the timestamps
2 Using the Analyzer
2-43
Page 92

Using the Analyzer
To Simulate Traffic
To Simulate Traffic
The Simulator is like a toolbox, filled with all of the tools you need for
manual control of the transmit functions of the analyzer. Use the Simulator
to customize traffic and simulate actual traffic conditions; then transmit
the traffic into the system under test.
The types of traffic you can transmit include
• captured data
• Protocol Data Units (PDUs) and sequences
• predefined patterns
• timestamped data
• user-defined byte values (see “Hexadecimal to ASCII Conversion” on
page A-2)
Using the Simulator you can also simulate controlled alarms and errors
and inject them into the transmitted traffic, which lets you further test
your network. After transmitting the traffic, you can monitor its effect
using Link Monitor and Channel Monitor.
2-44
Note When the port from which you’re transmitting is configured in full duplex mode with a
recovered clock, clock errors may occur if the receiver signal is poor. To avoid errors, change
the clock to internal, or monitor the link and make sure you have a healthy input signal.
Display the Simulator by clicking the Simulate tab for the required port
from the main screen.
Note For optical interface pods, the laser is automatically switched off when you log in
to the analyzer. You must turn the laser on when you are ready to transmit traffic and inject
alarms or errors. When you are not simulating traffic, alarms, or errors, make sure the laser
is off.
To turn the laser on or off, either
• click the Laser On or Off button on the Simulator
• from the Simulate menu, select the required port; then select Laser On or Off
Page 93

Using the Analyzer
To Simulate Traffic
Select to generate traffic or replay
captured data.
Display the View
Captured Data window
to capture data. See “To
View Captured Data” on
page 2-41.
Display Channel Monitor.
See “To Monitor a Channel
(VPI/VCI)” on page 2-26.
Select the configuration
for the port. See “To
Configure the Analyzer
and Ports” on page 2-18.
Turn the laser on or off for
optical interface pods.
Display the Simulate Traffic window
to select the traffic to transmit.
Display the Protocol Alarms/ Errors
window to simulate AAL or ATM
errors, or OAM alarms or cell losses.
See “To Inject Protocol Layer
Alarms and Errors” on page 2-48.
Display the Physical Alarms/ Errors
window to simulate physical layer
alarms, errors, or PLCP frameword
errors. See “To Inject Physical Layer
Alarms and Errors” on page 2-51.
Use the Simulate Traffic from Traffic Generator window or the Simulate
Traffic from Capture Memory window (shown on the following pages) to
simulate and transmit traffic. You display these windows in either of the
following ways:
• From the Simulate menu, select the required port; then select Traffic;
then select Traffic Generator or Capture Memory.
• From the main screen, click the Simulate tab for the required port to
display the Simulator; then use the pull-down list to select Traffic
Generator or Capture Memory; then click the Traffic icon.
2 Using the Analyzer
Use Traffic Generator to transmit traffic, such as predefined patterns,
Protocol Data Units (PDUs), or sequences. Use Capture Memory to
transmit captured data that is currently in the capture memory . At the top
of both Simulate Traffic windows are On/Off buttons to turn traffic
transmission on and off.
2-45
Page 94

Using the Analyzer
To Simulate Traffic
To Simulate Traffic from the Traffic Generator
Edit the encode
3
options for each
channel if required.
Enter the VPI/VCI
2
for each channel.
Select the
1
channels on
which you want
to transmit data.
Channel 0 is the
foreground
channel, and
channels 1—10
are background
channels.
Set the traffic profile
4
and bandwidth for the
foreground channel.
Set the bandwidth for
6
the background channels.
Select to transmit data
5
continuously or as single
cells for the foreground
channel.
Specify the type of
7
payload for each
channel.
2-46
Note If you select single cells, when you click the Transmit On button a Transmit button
appears. Click the Transmit button to transmit a single cell.
Use the Hexadecimal to ASCII conversion table when editing PDUs and
transmitting byte values. See “Hexadecimal to ASCII Conversion” on
page A-2.
Page 95

Select to transmit
1
continuously or as
single cells. If you
select single cells,
click the Transmit
button to transmit.
Select the traffic
2
profile you want to
use. The currently
selected profile is
shown on the button.
To Simulate Traffic from Capture Memory
Click this button to
change the profile
(distribution and
bandwidth).
Using the Analyzer
To Simulate Traffic
View the contents of
the capture memory
or capture new data
from the link.
2 Using the Analyzer
2-47
Page 96

Using the Analyzer
To Inject Alarms and Errors
To Inject Alarms and Errors
The analyzer can generate the following types of alarms and errors:
• protocol layer alarms and errors
• physical layer alarms and errors
• frameword errors
You must be transmitting traffic to be able to inject alarms or errors.
For more details about simulating and injecting alarms and errors, see the
User Online Help.
To Inject Protocol Layer Alarms and Errors
The analyzer can generate the following protocol layer alarms and errors:
• ATM and AAL errors
• OAM alarms
• cell losses
Display the Protocol Alarms/Errors window in either of the following ways:
• From the Simulate menu, select the required port; then select Protocol
Alarms/Errors.
• Click the Simulate tab for the required port to display the Simulator;
then click the Protocol Alarms/Errors button.
Note For optical interface pods, the laser is automatically switched off when you log in
to the analyzer. You must turn the laser on when you are ready to simulate traffic, alarms,
or errors. When you are not simulating traffic, alarms, or errors, make sure the laser is off.
To turn the laser on or off, either
• Click the Laser On or Off button on the Simulator.
• From the Simulate menu, select the required port; then select Laser On or Off.
2-48
Page 97

To Inject OAM Alarms
Using the Analyzer
To Inject Alarms and Errors
Click the OAM Alarms
1
tab.
Click the On button to
3
start injecting OAM
cells, or click the Inject
button to inject a
specified number of
OAM cells.
2 Using the Analyzer
Enter details about
2
the type of alarm you
want to simulate
(either F4 or F5).
2-49
Page 98

Using the Analyzer
To Inject Alarms and Errors
To Inject ATM and AAL errors
2-50
Click the Errors tab.
1
Select the
2
channel(s) on
which to simulate
Click the bits you
5
want to error.
Click the On button to
6
start injecting errors, or
click the Error On For or
the Error Off For button
to transmit errors for a
specified number of cells.
Select the type of error.
3
If required, select the
4
part of the cell to error.
Watch the results of the injected alarms or errors. The numbers of errors
and OAM cells injected is shown at the top of the Protocol Alarms/Errors
window. If you are using an external loopback or transmit loopback mode,
you can also monitor the errors and alarms by watching the Alarm and
Error indicators at the top of the main screen.
Page 99

Using the Analyzer
To Inject Alarms and Errors
To Inject Physical Layer Alarms and Errors
The analyzer can generate physical layer alarms and errors, and
frameword errors.
Display the Protocol Alarms/Errors window in either of the following
ways:
• From the Simulate menu, select the required port; then select
Physical Alarms/Errors.
• Click the Simulate tab for the required port to display the Simulator;
then click the Physical Alarms/Errors button.
To Inject Physical Alarms
2 Using the Analyzer
Click the Alarms tab.
1
Click the On
2
button for
the alarms
you want to
inject.
The number of alarms you can select at one time depends on the interface
pod installed.
2-51
Page 100

Using the Analyzer
To Inject Alarms and Errors
To Inject Physical Errors
Click the Errors tab.
1
Select the type of
2
error to inject.
Enter the rate at
3
which you want to
inject errors; then
click the On button
to start injecting
errors.
2-52
or
Click the Inject
3
button each time you
want to inject a
single error.
The type of errors you can inject depends on the interface pods installed.
Watch the results of the injected alarms or errors. The number of alarm or
error cells injected is shown at the top of the Physical Alarms/Errors
window. If you are using an external loopback or transmit loopback mode,
you can also monitor the errors and alarms by watching the Alarm and
Error indicators at the top of the main screen.
 Loading...