

Hp COMPAQ PROLIANT 4500, COMPAQ PROLIANT 4000 Highwater Benchmark Test of SAP R/3 2.2D; Oracle 7.1; Windows NT 3.5
Page 1

WHITE PAPER
.
.
[June 1995]
Compaq Computer
Corporation
CONTENTS
Introduction ................... 1
SAP Benchmarks
Overview........................ 3
Description of the Benchmark
Method ............................... 3
Interpretation ...................... 4
Interpretation of
"# of users with
2 seconds MRT" .................. 4
Interpretation of "SAPs" ....... 5
Highwater Benchmark
Scenario ........................ 6
Intent................................ .. 6
Configuration ...................... 6
Configuration I .................... 7
Configuration II ................... 8
Configuration III .................. 9
Results .......................... 9
Results Summary ................. 9
Summary and Outlook ........ 11
.
.
.
.
Highwater Benchmark Test of
.
.
.
.
.
.
.
.
.
SAP R/3 2.2D; Oracle 7.1; Windows NT 3.5
.
.
.
.
.
.
.
Introduction
.
.
.
.
.
.
The objective of this benchmark was to test the newly released SAP R/3 2.2D, Oracle
.
.
.
.
7.1, Windows NT 3.5 environment to generate data to be built into the Compaq sizing
.
.
.
.
tools for central and distributed systems. This environment is automatically supported
.
.
.
.
.
by SAP because certification has been bound to R/3 version 2.2 in general. The 2.2D
.
.
.
.
correctional stage has also been verified through iXOS, a company that certifies all NT
.
.
.
.
hardware platforms for the use of Windows NT. The sizing white paper describing the
.
.
.
.
Compaq methodology and the corresponding tools has been provided to the Compaq
.
.
.
.
teams who are sizing SAP systems.
.
.
.
.
.
.
This paper is an introduction to SAP benchmarking and provides an overview of the
.
.
.
.
steps that were taken to obtain the final result described. This result is an indication of
.
.
.
.
.
the performance capabilities of Compaq ProLiant Servers. The environment/setup that
.
.
.
.
was used, including the distribution of work processes do not reflect the setup for a
.
.
.
.
specific customer. However, it can be used as a guideline for maximizing system
.
.
.
.
performance.
.
.
.
.
.
.
Compaq will conduct ongoing tests on basis service packs, SSD’s, ROMPaq's,
.
.
.
.
operating system enhancements, R/3 releases and RDBMS’s. Compaq will also
.
.
.
.
maintain a matrix in the Notes-based Technical Issues database provided by TSS
.
.
.
.
.
EMEA.
.
.
.
.
.
.
.
.
.
.
.
.
.
.
.
.
.
.
.
.
.
.
.
.
.
.
.
.
.
.
.
.
.
.
.
.
.
.
.
.
.
.
.
.
.
.
.
.
.
.
.
.
.
.
.
.
.
.
.
.
.
.
.
.
.
.
.
.
.
.
.
.
.
.
.
.
.
.
.
.
.
.
.
.
.
.
.
.
.
.
.
.
.
.
.
.
.
.
.
.
229A/1095 1
Page 2

WHITE PAPER
.
.
NOTICE
.
.
.
.
.
.
.
.
.
.
The information in this publication is subject to change without notice.
.
.
.
.
.
.
.
.
.
.
.
.
COMPAQ COMPUTER CORPORATION SHALL NOT BE LIABLE FOR TECHNICAL OR
.
.
.
.
EDITORIAL ERRORS OR OMISSIONS CONTAINED HEREIN, NOR FOR INCIDENTAL
.
.
.
.
OR CONSEQUENTIAL DAMAGES RESULTING FROM THE FURNISHING,
.
.
.
.
PERFORMANCE, OR USE OF THIS MATERIAL.
.
.
.
.
.
This publication contains information protected by copyright. Except for internal use
.
.
.
.
distribution, no part of this publication may be photocopied or reproduced in any form without
.
.
.
.
prior written consent from Compaq Computer Corporation.
.
.
.
.
.
.
This publication does not constitute an endorsement of the product or products that were tested.
.
.
.
.
The configuration or configurations tested or described may or may not be the only available
.
.
.
solution. This test is not a determination of product quality or correctness, nor does it ensure
.
.
.
.
compliance with any federal, state or local requirements. Compaq does not warrant products
.
.
.
.
other than its own strictly as stated in Compaq product warranties.
.
.
.
.
.
.
Product names mentioned herein may be trademarks and/or registered trademarks of their
.
.
.
.
respective companies.
.
.
.
.
.
.
© 1995 Compaq Computer Corporation. All rights reserved. Printed in the U.S.A.
.
.
.
.
.
Compaq, Systempro, Compaq Insight Manager, Fastart, registered U.S. Patent and Trademark
.
.
.
.
Office.
.
.
.
.
.
.
ProSignia, ProLiant and QVision are trademarks of the Compaq Computer Corporation.
.
.
.
.
.
.
Microsoft, Windows, Windows NT, Windows NT Advanced Server, SQL Server for Windows
.
.
.
.
NT are trademarks and/or registered trademarks of Microsoft Corporation.
.
.
.
.
.
.
.
.
.
.
.
Highwater Benchmark Test of
.
.
.
.
SAP R/3 2.2D; Oracle 7.1; Windows NT 3.5
.
.
.
.
.
.
First Edition (June 1995)
.
.
.
.
Document Number 229A/1095
.
.
.
.
.
.
.
.
.
.
.
.
.
.
.
.
.
.
.
.
.
.
.
.
.
.
.
.
.
.
.
.
.
.
.
.
.
.
.
.
.
.
.
.
.
.
.
.
.
.
.
.
.
.
.
.
.
.
.
.
.
.
.
.
.
.
.
229A/1095
2
Page 3

WHITE PAPER
.
.
.
.
.
SAP BENCHMARKS OVERVIEW
.
.
.
.
.
.
.
.
.
When presented with results from SAP benchmarks, the following figures are often
.
.
.
.
encountered :
.
.
.
.
.
.
.
.
• Number of users supported in a given SAP module (FI, MM, SD, WM, PP) with a mean
.
.
.
.
.
.
.
.
.
.
.
.
.
.
.
.
.
.
.
.
.
.
.
.
.
.
.
.
.
.
.
.
.
.
.
.
.
.
.
.
.
.
.
.
.
.
.
.
.
.
.
.
.
.
.
.
.
.
.
.
.
.
.
.
.
.
.
.
.
.
.
.
.
.
.
.
.
.
.
.
.
.
.
.
.
.
.
.
.
.
.
.
.
.
.
.
.
.
.
.
.
.
.
.
.
.
.
.
.
.
.
.
.
.
.
.
.
.
.
.
.
.
.
.
.
.
.
.
.
.
.
.
.
.
.
.
.
.
.
.
.
.
.
.
.
.
.
.
.
.
.
.
.
.
.
.
.
.
.
.
.
.
.
.
.
.
.
.
.
.
.
.
.
.
.
.
.
response time (MRT) less than 2 seconds.
• Throughput in terms of SAPs.
Both results are tightly coupled and can be extrapolated approximately if the benchmarks were
run using the correct SAP defined method.
Description of the Benchmark Method
A single benchmark user executes a dialogue step (DS), obtains a response and then waits for a
simulated think time of 10 seconds. The response time is measured by the dialogue work
process. The actual user must wait until the response is transferred to the screen (transmission
time, display time). After the user finishes a fixed number of tightly related dialogue steps (a
loop), the process starts over again. The number of specified loops determines the duration of a
test run.
A benchmark run consists of a specified number of benchmark users and loops. To achieve a
statistically significant result, the benchmark runs for one hour.
A complete test consists of multiple benchmark runs with an increasing number of benchmark
users. Each run leads to a higher resource utilization, because the requested load increases. The
main resource is processor power. The steady growth of processor utilization leads to an
exponentially increasing response time. Systems based on a single processor show an almost
linear growth. The test is terminated when the mean response time exceeds 2 seconds.
NOTE: A mean response time of 1 second can be achieved in different ways:
• 10 DS with 100ms-response time and 1 DS with 10-second response time, or
• 11 DS with 1-second response time
229A/1095
3
Page 4
WHITE PAPER
.
.
Interpretation
.
.
.
.
.
.
All performance values are related to the complete system consisting of:
.
.
.
.
.
.
.
.
• Hardware: System Processor, Disk, Memory, and Bus system
.
.
.
.
• Software: Operating System, R/3 application, and Database Management System
.
.
.
.
.
.
.
.
A change in any one of these components will influence the results.
.
.
.
.
.
.
.
NOTE: There cannot be a performance guarantee for any customer based on the standard
.
.
.
.
benchmark environment, because many components can differ in the final system.
.
.
.
.
.
.
.
.
The objective of SAP benchmarks is to make a relative performance comparison between
.
.
.
.
hardware platforms running the same application modules.
.
.
.
.
.
.
.
.
Interpretation of "# of users with 2 seconds MRT"
.
.
.
.
.
.
.
.
Only a system with a poor architecture should reach a 2-second MRT with a processor
.
.
.
.
utilization below 100 percent. Based on current knowledge, there is no such system in the SAP
.
.
.
environment.
.
.
.
.
.
.
.
.
Systems with a strong processor subsystem exhibit a 100-percent processor utilization and a
.
.
.
.
MRT still below one second. Configuring a benchmark run to show exactly two seconds MRT
.
.
.
.
is difficult, because very few additional users can change the MRT significantly.
.
.
.
.
.
.
.
.
SAP strongly recommends that all system sizing should be based around the number of users
.
.
.
supported when the processor utilization is at 60 percent. This allows for peak loading during
.
.
.
.
busy times of the day or to support background batch processing. However, great care should
.
.
.
.
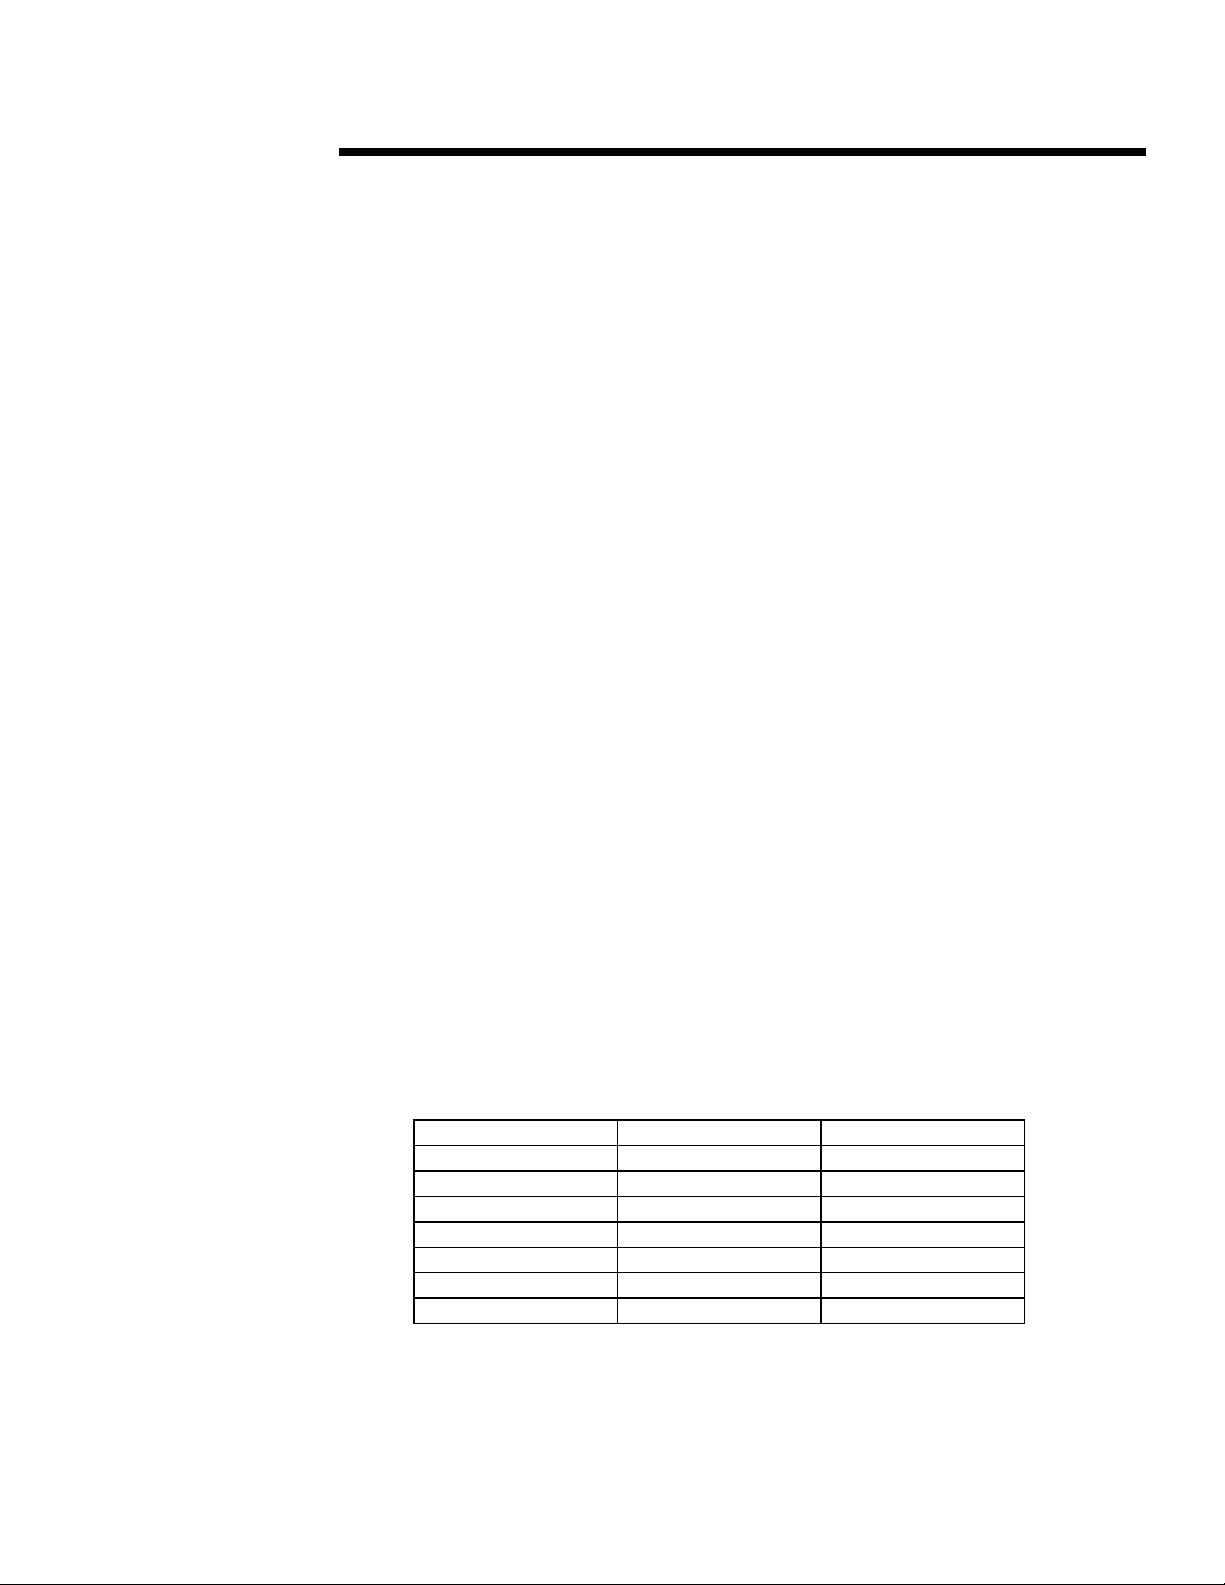
be taken when arriving at the number of FI users supported. Take the following example:
.
.
.
.
.
.
.
.
.
.
.
.
.
.
.
.
.
.
.
.
.
.
.
.
.
.
.
.
.
.
.
.
.
.
.
.
.
.
.
.
.
.
.
.
.
.
.
.
.
.
.
.
.
.
.
.
.
.
.
.
.
.
.
.
.
.
.
.
.
.
.
.
.
.
.
From this we see that 25-26 FI benchmark users would create a processor utilization of 60
.
.
.
.
percent, but also note that the MRT is below 0.5 seconds.
.
.
.
.
.
.
.
.
Because every application always runs as quickly as possible (when there is no bottleneck, such
.
.
.
.
as disk I/O), it is not possible to force a 2-second MRT at 60-percent processor utilization.
.
.
.
A 50 FI User Benchmark gives a 2-second MRT and 100-percent processor utilization
Incorrect Interpretation:
50 users = 100 percent, therefore, 30 users = 60 percent
Correct Interpretation:
Use the complete set of results from the benchmark:
Users MRT [ms] Utilization [%]
50 2000 100
45 1200 100
40 900 95
35 700 85
30 500 70
25 300 58
20 250 44
229A/1095
4
Page 5

WHITE PAPER
.
.
.
Interpretation of "SAPs"
.
.
.
.
.
.
.
.
To avoid these discussions concerning processor utilization, response time, and number of
.
.
.
.
users, SAP launched a single figure of merit called SAPs. This figure measures the maximum
.
.
.
.
throughput of a system.
.
.
.
.
.
.
.
.
Every system exhibits an increasing throughput if there is processor capacity available. The
.
.
.
baseline is the ratio between requested load and delivered throughput.
.
.
.
.
.
.
.
.
Example:
.
.
.
.
.
.
.
.
50 users with a think time of 10 seconds per dialogue step are requesting a load of 50/10 = 5
.
.
.
.
dialogue steps per second (DS/s). Only a theoretical system with 0.00 seconds MRT could
.
.
.
.
deliver this throughput. As soon as the MRT differs, the delivered throughput decreases.
.
.
.
.
.
.
.
Example:
.
.
.
.
.
.
.
.
50 users having a think time of 10 seconds per dialogue step and a MRT of 1 second leads
.
.
.
.
to 50 / 11 = 4.5 DS/s
.
.
.
.
.
.
.
.
NOTE: Although response time is time/dialogue step and throughput is dialogue steps/time
.
.
.
interpretation of the figures is not as simple.
.
.
.
.
.
.
.
.
Example:
.
.
.
.
.
.
.
.
10 DS/s equals:
.
.
.
.
.
.
.
System A: 110 users with 10 seconds think time and 1 second MRT (110/11 = 10)
.
.
.
.
System B: 120 users with 10 seconds think time and 2 seconds MRT (120/12 = 10)
.
.
.
.
.
.
.
.
Interpretation: System B handles 10 percent more users with a 100 percent higher MRT
.
.
.
.
.
.
.
.
Once the processor utilization reaches 100 percent, the response time (theoretically) increases
.
.
.
.
linearly to the requested load, keeping the delivered throughput at a constant level.
.
.
.
.
.
.
.
The definition of 100 SAPs is taken as one of the following:
.
.
.
.
.
.
.
.
FI 3000 records/h 16200 DS/h
.
.
.
.
MM 2100 business operations/h 6720 DS/h
.
.
.
.
SD 2000 business operations/h 6000 DS/h
.
.
.
.
.
.
.
.
It is possible that the SAPs figure may vary (in a reasonable scale) when evaluated with
.
.
.
.
different benchmarks. SAP is recommending the use of the SD benchmark to evaluate SAPs.
.
.
.
.
.
.
.
.
.
.
.
.
.
.
.
.
.
.
.
.
.
.
.
.
.
.
.
.
.
.
.
.
.
.
.
.
.
229A/1095
5
Page 6

WHITE PAPER
.
.
.
.
.
.
.
.
HIGHWATER BENCHMARK SCENARIO
.
.
.
.
.
.
.
.
.
.
.
.
Intent
.
.
.
.
.
.
.
.
The prime intent behind the highwater benchmark was to achieve as much information as
.
.
.
.
possible about the performance in a distributed environment. This information was worked into
.
.
.
.
our sizing process. Therefore, we stayed as close as possible to a base customer environment,
.
.
.
.
applying tuning in a methodical manner.
.
.
.
.
.
.
.
.
Configuration
.
.
.
.
.
.
.
.
Software:
.
.
.
.
.
.
.
.
Microsoft Windows NT 3.5, build 807 (November SmartStart); SSD 1.14A
.
.
.
Oracle 7.1.3.3.6
.
.
.
.
SAP R/3 2.2D
.
.
.
.
.
.
.
.
Hardware:
.
.
.
.
.
.
.
.
Compaq ProLiant 4000 and 4500 systems.
.
.
.
.
.
.
.
.
1 x Database Server 4 x 5/100 MHz 320 MB
.
.
.
.
4 x Application Server 4 x 5/100 MHz 256 MB
.
.
.
.
2 x Application Server 2 x 5/100 MHz 256 MB
.
.
.
.
1 x Application Server 2 x 5/90 MHz 256 MB
.
.
.
.
.
.
.
.
The processor and memory were configured in the systems solely to run enough benchmark
.
.
.
.
users to generate the necessary load.
.
.
.
.
.
.
.
Because there is a very high demand on the speed of the network connection between the
.
.
.
.
application and the database server we have used FDDI boards from Schneider & Koch
.
.
.
.
SysKonnect (SK-NET FDDI-FE, single attach).
.
.
.
.
.
.
.
.
.
.
.
.
.
.
.
.
.
.
.
.
.
.
.
.
.
.
.
.
.
.
.
.
.
.
.
.
.
.
.
.
.
.
.
.
.
.
.
.
.
.
.
.
.
.
.
.
.
.
.
.
.
.
.
.
.
.
.
.
.
229A/1095
6
Page 7

WHITE PAPER
.
.
.
Configuration I
.
.
.
.
.
.
.
.
The initial configuration involved having the R/3 work processes Update, Message, and
.
.
.
.
Enqueue installed on the database server and Dialogue on the application servers. This is the
.
.
.
.
setup currently supported by the R3INST tool. As load was increased the update process was
.
.
.
.
the first work process to be stressed.
.
.
.
.
.
.
.
.
.
.
.
.
.
.
.
.
.
.
.
.
.
.
.
.
.
.
.
.
.
.
.
.
.
.
.
.
.
.
.
.
.
.
.
.
.
.
.
.
.
.
.
.
.
.
.
.
.
.
.
.
.
.
.
.
.
.
.
.
.
.
.
.
.
.
.
.
.
.
.
.
.
.
.
.
.
.
.
.
.
.
.
.
.
.
.
.
.
.
.
.
.
.
.
.
.
.
.
.
.
.
.
.
.
.
.
.
.
.
.
.
.
.
.
.
.
.
.
.
.
.
.
.
.
.
.
.
.
.
.
.
.
.
.
.
.
.
.
.
.
.
.
.
.
.
.
.
.
.
.
.
.
.
.
.
.
.
.
.
.
.
.
.
.
.
.
.
.
.
.
.
Dialogue
FDDI Ring
Schneider & Koch
Sysconnect
Dialogue
Oracle 7.1.3.3.6
Update
Enqueue
Message
Dialogue
DialogueDialogue
Dialogue
Dialogue
229A/1095
7
Page 8

WHITE PAPER
.
.
.
Configuration II
.
.
.
.
.
.
.
.
The next step was to distribute the update work processes equally across the application
.
.
.
.
servers. This allowed the load to be increased symmetrically without a single server becoming
.
.
.
.
a bottleneck. A possible disadvantage could be that maximal benchmark load cannot be
.
.
.
.
applied to the application servers due to a reduced hit rate in second-level cache.
.
.
.
.
.
.
.
.
.
.
.
.
.
.
.
.
.
.
.
.
.
.
.
.
.
.
.
.
.
.
.
.
.
.
.
.
.
.
.
.
.
.
.
.
.
.
.
.
.
.
.
.
.
.
.
.
.
.
.
.
.
.
.
.
.
.
.
.
.
.
.
.
.
.
.
.
.
.
.
.
.
.
.
.
.
.
.
.
.
.
.
.
.
.
.
.
.
.
.
.
.
.
.
.
.
.
.
.
.
.
.
.
.
.
.
.
.
.
.
.
.
.
.
.
.
.
.
.
.
.
.
.
.
.
.
.
.
.
.
.
.
.
.
.
.
.
.
.
.
.
.
.
.
.
.
.
.
.
.
.
.
.
.
.
.
.
.
.
.
.
.
.
.
.
.
.
.
.
.
.
Dialogue
Update
Dialogue
Update
FDDI Ring
Schneider & Koch
Sysconnect
Dialogue
Update
Oracle 7.1.3.3.6
Enqueue
Message
Dialogue
Update
Dialogue
Update
Dialogue
Update
Dialogue
Update
229A/1095
8
Page 9

WHITE PAPER
.
.
.
Configuration III
.
.
.
.
.
.
.
.
Because the previous configuration caused a 100-percent processor load on the database
.
.
.
.
server, the message and enqueue work processes were also moved to a single application
.
.
.
.
server, leaving a pure Oracle database server. This now results in an asymmetric configuration
.
.
.
.
because message and enqueue cannot run on multiple machines.
.
.
.
.
.
.
.
.
.
.
.
.
.
.
.
.
.
.
.
.
.
.
.
.
.
.
.
.
.
.
.
.
.
.
.
.
.
.
.
.
.
.
.
.
.
.
.
.
.
.
.
.
.
.
.
.
.
.
.
.
.
.
.
.
.
.
.
.
.
.
.
.
.
.
.
.
.
.
.
.
.
.
.
.
.
.
.
.
.
.
.
.
.
.
.
.
.
.
.
.
.
.
.
.
.
.
.
.
.
.
.
.
.
.
.
.
.
.
.
.
.
.
.
.
.
.
.
.
.
.
.
.
.
.
.
.
.
.
.
.
.
.
.
.
.
.
.
.
.
.
.
.
.
.
.
.
.
.
.
.
.
.
.
.
.
.
.
.
.
.
.
.
.
.
.
.
.
.
.
.
Dialogue
Update
RESULTS
The maximum number of SD benchmark users that can be achieved for a configuration is
primarily determined by the distribution of the SAP R/3 work processes. The result below was
achieved with a stable environment and is reproducible.
Results Summary
Maximum SD Benchmark Users 220
SAPs 1137
Mean Response Time/Dialog Step (MRT/DS) 1.56s
Processor Utilization : Database Server 80%
: Application Server (D,U) 85% (average)
: Application Server
(D,U,E,M)
Disk Utilization : Database Files 60 IO/sec
: Database Log 15 IO/sec
This result is comparable to any other announcement which is stating SD benchmark users in
conjunction with SAP R/3 2.2.
Dialogue
Update
FDDI Ring
Schneider & Koch
Sysconnect
Dialogue
Update
Oracle 7.1.3.3.6
Dialogue
Update
Enqueue
Message
Dialogue
Update
Dialogue
Update
Dialogue
Update
75%
229A/1095
9
Page 10

WHITE PAPER
For system sizings, we built into the sizing tools the value of 180 SD benchmark users (450
SD real/concurrent active users) corresponding to a mean processor utilization of the servers at
60 percent.
10
229A/1095
Page 11

WHITE PAPER
.
.
.
Summary and Outlook
.
.
.
.
.
.
.
.
This test was a snapshot of what we can expect from Compaq systems. There are, of course,
.
.
.
.
many other tunable parameters that are not detailed in this paper. In addition to new hardware,
.
.
.
.
new database technologies (for example, ADABAS 6.1, SQL Server 6.0, ORACLE 7.2),
.
.
.
.
operating system enhancements (Windows NT 3.51) and improvements to the SAP software
.
.
.
.
(SAP R/3 3.0) will be benchmarked on a priority basis by the Compaq SAP teams in Munich
.
.
.
and Houston.
.
.
.
.
.
.
There is currently no need to certify benchmark results because it is standard practice for
.
.
.
.
hardware vendors to generate and communicate performance data. SAP is considering an
.
.
.
.
official auditing process of benchmark results with the release of SAP R/3 3.0. Because iXOS
.
.
.
.
took part in the benchmarking effort, there will be an additional paper available from iXOS.
.
.
.
.
.
.
.
.
.
.
.
.
.
.
.
.
.
.
.
.
.
.
.
.
.
.
.
.
.
.
.
.
.
.
.
.
.
.
.
.
.
.
.
.
.
.
.
.
.
.
.
.
.
.
.
.
.
.
.
.
.
.
.
.
.
.
.
.
.
.
.
.
.
.
.
.
.
.
.
.
.
.
.
.
.
.
.
.
.
.
.
.
.
.
.
.
.
.
.
.
.
.
.
.
.
.
.
.
.
.
.
.
.
.
.
.
.
.
.
.
.
.
.
.
.
.
.
.
.
.
.
.
.
.
.
.
.
.
.
.
.
.
.
.
.
.
.
.
.
.
.
.
.
.
.
229A/1095
11
 Loading...