

Hp COMPAQ PROLIANT 3000, COMPAQ PROLIANT 1600, COMPAQ PROLIANT 1200, COMPAQ PROLIANT 1500 I/O Performance Tuning of Compaq Servers
Page 1

Technical Guide
March 1999
ECG044.0399
I/O Performance Tuning of
Prepared by OS Integration
Engineering
Compaq Computer Corporation
Contents
Executive Summary ...................3
Introduction................................4
I/O Performance and
Recommendations .....................4
Network Interface...................... 5
Peripheral Component
Interconnect (PCI) Bus..............6
SCSI Bus..................................9
Fibre Channel......................... 12
Drive Technology ....................14
System Memory......................18
OS Performance Monitoring
Tools.........................................19
Microsoft Windows NT............20
Novell NetWare.......................21
SCO UnixWare and
OpenServer............................21
Conclusion..............................22
Appendix - Performance
Tuning Data..............................23
Fibre Channel Bus..................23
Drive Technology ....................28
RAID Level Performance.........35
Hardware RAID vs. Software
RAID......................................36
Compaq Servers
Abstract: Tuning the disk system and I/O paths can be key to
achieving maximum performance from your server. This paper
begins with definitions, guidelines, and recommendations for I/O
performance tuning. The last section of this paper provides actual
performance data to reinforce recommendations. In general, this
paper deals with universal I/O concerns and applies to a wide range
of server applications. The major areas examined in this paper are
• disk systems
• NICs
• memory
• system configuration
• performance monitoring tools.
Help us improve our technical communication. Let us know what you think
about the technical information in this document. Your feedback is valuable
and will help us structure future communications. Please send your
comments to: novell.feedback@compaq.com
Page 2

I/O Performance Tuning of Compaq Servers 2
Notice
The information in this publication is subject to change without notice and is provided “AS IS” WITHOUT
WARRANTY OF ANY KIND. THE ENTIRE RISK ARISING OUT OF THE USE OF THIS
INFORMATION REMAINS WITH RECIPIENT. IN NO EVENT SHALL COMPAQ BE LIABLE FOR
ANY DIRECT, CONSEQUENTIAL, INCIDENTAL, SPECIAL, PUNITIVE OR OTHER DAMAGES
WHATSOEVER (INCLUDING WITHOUT LIMITATION, DAMAGES FOR LOSS OF BUSINESS
PROFITS, BUSINESS INTERRUPTION OR LOSS OF BUSINESS INFORMATION), EVEN IF
COMPAQ HAS BEEN ADVISED OF THE POSSIBILITY OF SUCH DAMAGES.
The limited warranties for Compaq products are exclusively set forth in the documentation accompanying
such products. Nothing herein should be construed as constituting a further or additional warranty.
This publication does not constitute an endorsement of the product or products that were tested. The
configuration or configurations tested or described may or may not be the only available solution. This test
is not a determination or product quality or correctness, nor does it ensure compliance with any federal
state or local requirements.
Product names mentioned herein may be trademarks and/or registered trademarks of their respective
companies.
Compaq, Contura, Deskpro, Fastart, Compaq Insight Manager, LTE, PageMarq, Systempro, Systempro/LT,
ProLiant, TwinTray, ROMPaq, LicensePaq, QVision, SLT, ProLinea, SmartStart, NetFlex, DirectPlus,
QuickFind, RemotePaq, BackPaq, TechPaq, SpeedPaq, QuickBack, PaqFax, Presario, SilentCool,
CompaqCare (design), Aero, SmartStation, MiniStation, and PaqRap, registered United States Patent and
Trademark Office.
Netelligent, Armada, Cruiser, Concerto, QuickChoice, ProSignia, Systempro/XL, Net1, LTE Elite,
Vocalyst, PageMate, SoftPaq, FirstPaq, SolutionPaq, EasyPoint, EZ Help, MaxLight, MultiLock,
QuickBlank, QuickLock, UltraView, Innovate logo, Wonder Tools logo in black/white and color, and
Compaq PC Card Solution logo are trademarks and/or service marks of Compaq Computer Corporation.
Microsoft, Windows, Windows NT, Windows NT Server and Workstation, Microsoft SQL Server for
Windows NT are trademarks and/or registered trademarks of Microsoft Corporation.
NetWare and Novell are registered trademarks and intraNetWare, NDS, and Novell Directory Services are
trademarks of Novell, Inc.
NetBench and ServerBench are registered trademarks of ZDInc.
NetBench 5.01. Copyright© 1997 by ZD Inc. All rights reserved.
ServerBench 4.02. Copyright© 1998 by ZD Inc. All rights reserved.
Pentium is a registered trademark of Intel Corporation.
Copyright ©1998 Compaq Computer Corporation. All rights reserved. Printed in the U.S.A.
I/O Performance Tuning of Compaq Servers
Technical Guide prepared by OS Integration Engineering
First Edition (March 1999)
Document Number ECG044.0399
ECG044.0399
Page 3

I/O Performance Tuning of Compaq Servers 3
Executive Summary
In order to maximize your investment, it is crucial that you get the highest consistent performance
from your server. As the demands placed on your server grow, the hardware performance and
configuration efficiency must keep pace. However, poorly implemented expansion and upgrades,
such as, unbalanced busses and memory bottlenecks, can seriously degrade performance. For
example, simply adding or rearranging drives or adapters can, in some cases, increase the
throughput of your entire disk system by as much as 96%. While not all servers will realize gains
of this magnitude so easily, every server can be optimized to increase its functionality and
longevity.
Performance tuning may not only save money now, but may also prevent premature replacement
of viable equipment. Since technology budgets are limited, it is important to get the most out of
every investment, in terms of both performance and, especially, longevity. Less than optimal
server configuration can shorten server life cycles as network demands outpaces server
performance. In the meantime, your network clients will work less efficiently and become
frustrated as they deal with a slower network.
You can prevent the adverse effects of a slow network by making sure that your server is
delivering maximum performance. Compaq performs extensive tests to determine the optimal
configuration for different environments. The results of these tests can be invaluable tools in
configuring and tuning your server. Many of the recommendations can be implemented
immediately, some without any cost. All of these guidelines, however, prevent the maintenance
and frustrations caused by poor server performance.
By implementing the recommendations found in this paper, your server can immediately become
more responsive. The amount of maintenance and total cost of ownership required by your server
can also drop dramatically. In the long run, you will have earned a greater return on your
investment from both your server and clients.
ECG044.0399
Page 4

I/O Performance Tuning of Compaq Servers 4
Introduction
Perhaps the most common term when maximizing server performance is bottleneck. Invariably,
one component in a system will be stressed more than others and, as a result, the performance of
the entire system will be limited when the limits of that device have been reached. A bottleneck is
not always a single device, and in some cases, it’s not a device at all. Often, an entire subsystem
or simply a less than optimal configuration limits performance. Given any configuration, there are
bottlenecks and, usually, the limiting factor can not be eliminated completely. Maximizing
performance for a server involves careful analysis and reconfiguration to reduce the effect of the
bottlenecks.
In order to identify and reduce the impact of the most stressed component, you must know the
hardware present and normal operating conditions for your server. As you will see, an important
factor in tuning a server is the server mix. The server mix is the ratio that expresses the amount of
server requests that are:
• random vs. sequential
• small vs. large block transfers
• reads vs. writes
By understanding what data is requested,and how often, you can decide which components are
most likely to become a bottleneck in your environment. For instance, a lightly-loaded server that
performs all random, small file transfers will most likely incur a delay as the drives seek to find
the requested data; the bus on this server remains relatively idle. On the other hand, large,
contiguous file transfers need only position the drive heads initially to begin streaming data to the
client; these requests are more likely to run into a bus saturation limitation.
Perhaps a more obvious factor in server performance is the server itself. In every server
environment, there are variables that must be considered regardless of configuration and
operation. For instance, physical drive delays as the heads are positioned over the data are present
in every computer. Performance tuning seeks to reduce the effect of individual delays on overall
system performance. This document will give general recommendations for reducing the effect of
any given delay and the role that some of the new technology can play.
I/O Performance and Recommendations
Dynamic systems, such as a network, operate within a set of boundary conditions. These
boundary conditions describe the limitations imposed by the individual components of the
system. Optimization of your system for maximum performance involves
• Knowledge of the components and their relationships
• Discovery of current performance through measurements and analysis
• Adaptation to increase performance.
ECG044.0399
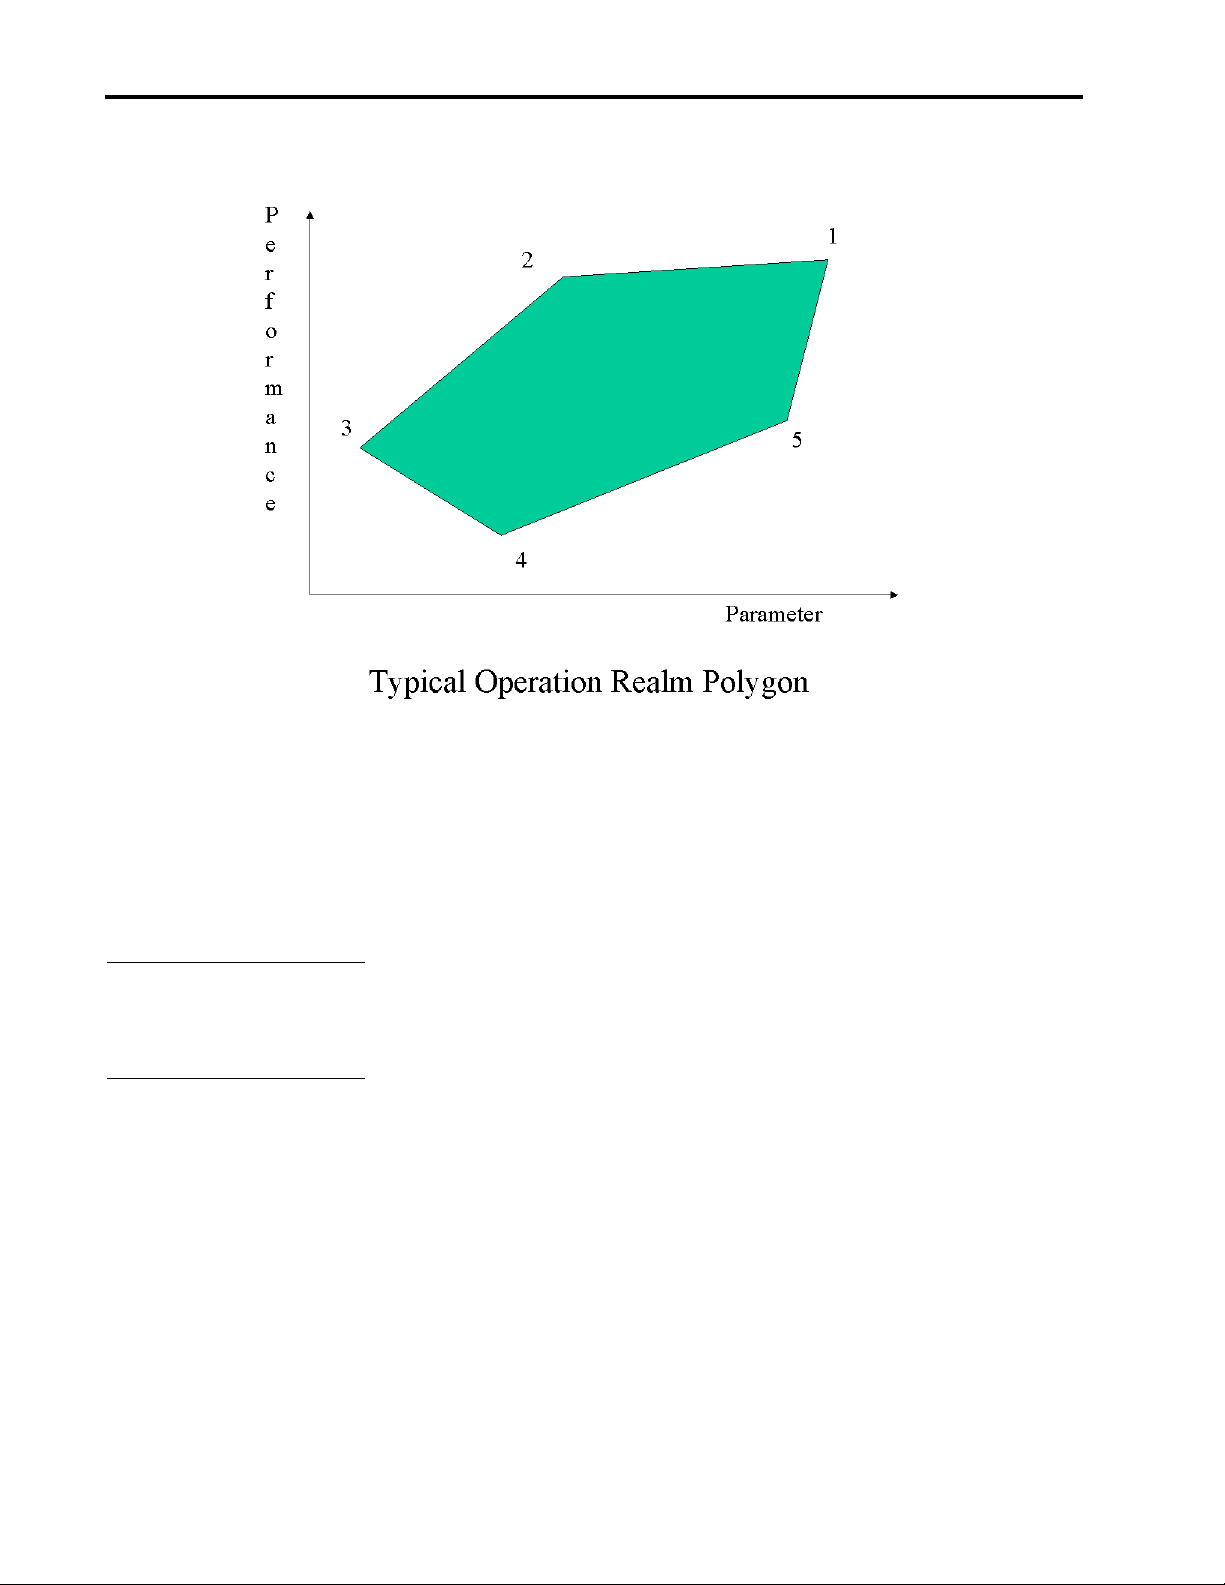
The operating realm is a solution of the boundary conditions. In a graphical form, as in Figure 1,
the solution for each operating parameter is a polygon. While the system can operate anywhere
within the polygon, the boundaries of the polygon are where the system usually operates. In
particular the modes of a solution are usually at an apex of the polygon.
Page 5
I/O Performance Tuning of Compaq Servers 5
Figure 1. Boundary Value Conditions Graphical Solution
In Figure 1, the Parameter axis could represent a complex, composite variable such as disk
systems or a simpler variable such as the type of disks used in a system. The performance axis is
usually the axis being optimized. The optimal solution in this example is apex 1, but operating at
2 is not to be ignored. The differences between these points could represent a 5% performance
and a 40% price difference.
P In this paper, a flag
indicates a key point to a
performance recommendation.
performance. For example, if a SCSI bus is nearly fully populated, with all disk drives in a single
RAID array, sustained read performance will be only marginally better than the same bus with
fewer drives tuned more appropriately for the load. This example benefits more from splitting the
single SCSI bus into two or more busses than from adding more drives to an already saturated
bus. When tuning the I/O of a server, you seek to find the level of redundancy that provides
optimal performance in your server’s application.
Network Interface
In general, simply adding redundant instances of a system allows parallel
execution of that system’s task and can increase the effective performance of
that system. For instance, striping the data from a single drive onto two
physical devices can nearly double drive throughput in some cases.
Unfortunately, this is a situation of diminishing returns. In fact, adding more
than the optimal number of redundant devices can actually degrade
ECG044.0399
The key to realizing the optimal performance from your server is understanding the way in which
clients access your server. The mix of client access can vary widely from server to server, and
even from hour to hour on the same server. In some cases, clients may be requesting random,
scattered, smaller files from the server; as in a web-server. Other situations may ask the server to
retrieve large, contiguous graphic or CAD files. While still other servers will have to respond to a
Page 6

I/O Performance Tuning of Compaq Servers 6
PPP
great deal of write requests. In each of these situations, tuning the performance of the server
requires a different approach. As a result, knowing the kind of load, or server mix, that clients
place on your server is key to tuning your I/O.
On most local area networks, servers are connected to clients over an Ethernet network.
Currently, there are three Ethernet specifications:
• 10BASE-T provides each client with a shared resource with a maximum bandwidth of 10
Megabits per second (Mb/s) or 1 Megabyte per second (MB/s).
• 100BASE-T is 10 times faster than 10BASE-T, providing 10 MB/s of bandwidth.
• Gigabit Ethernet, the newest specification, can move approximately 120 MB of data per
second; 100 times faster than the original 10BASE-T specification.
Ideally, the server should be able to deliver the full 1 MB/s, 10 MB/s, or 100 MB/s to every
network segment, depending on the NICs used.
In practice, however, on multi-client networks with unswitched hubs and repeaters each client
shares the bandwidth resource with all other clients on the segment. To overcome this limitation,
intelligent network switches enable point to point communication between nodes. When using
network switches, each port on the switch is seen as the only client on that network segment. In
this case, your network maximizes throughput because collisions are eliminated. Switches allow
greater utilization of bandwidth, however the added cost of intelligent switches may outweigh the
performance gains in smaller, less stressed network segments.
When planning or implementing your network, be aware of utilization limitations. Either
distribute network traffic between separate network segments or use intelligent switches
to eliminate packet collisions and maximize throughput.
Peripheral Component Interconnect (PCI) Bus
The PCI bus is a high-performance, 32 or 64-bit local bus that provides an interface for highspeed transfers to peripheral components without taxing the host processor. A single 32-bit PCI
bus provides 133 MB/s of bandwidth between PCI devices and the host bus, which holds the CPU
and main memory. In order to provide greater performance and connectivity, Compaq ProLiant
servers (models 1200 to 7000) use a bridged-PCI architecture to connect multiple PCI busses
within the server. Compaq uses two different architectures to connect the two PCI busses to the
host bus: the dual-peer PCI bus and the bridged PCI bus.
In order to maintain maximum performance, Compaq recommends that you balance the
load according to the architecture in your server.
Bus Balancing in ProLiant Servers
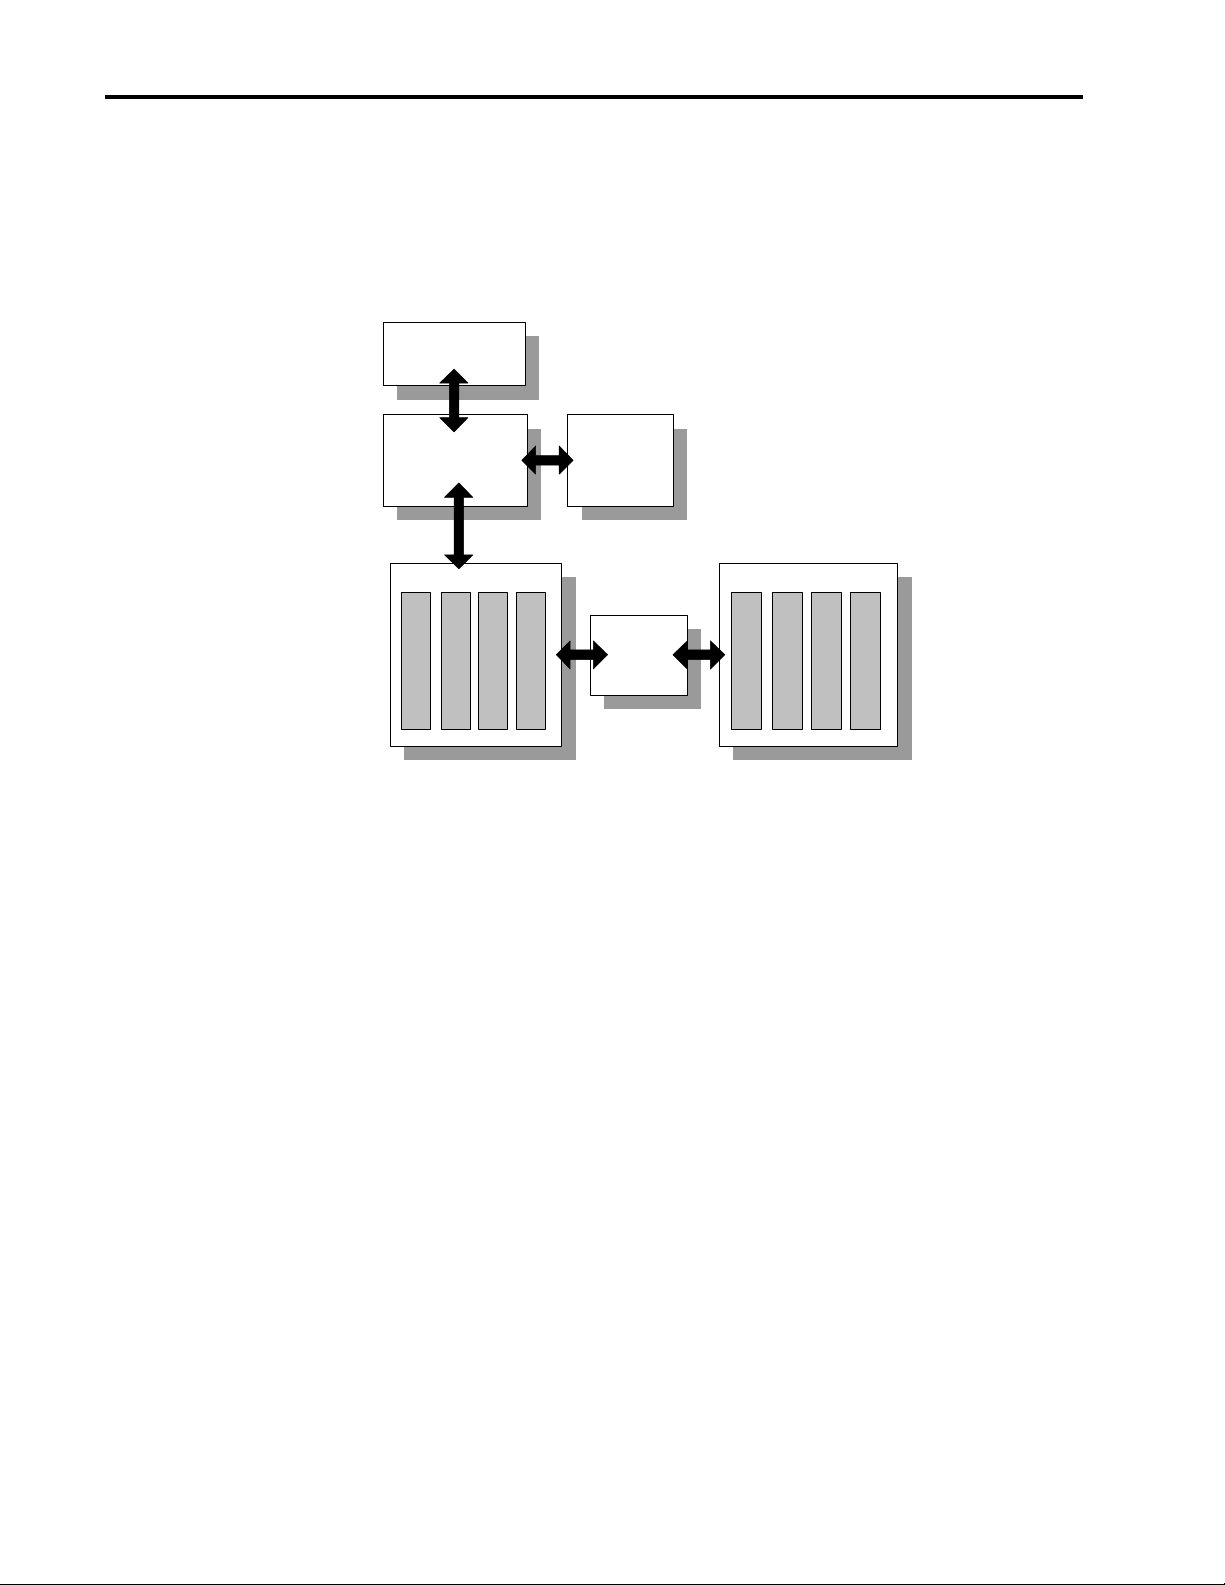
Bridged PCI bus
In bridged PCI busses, such as the ProLiant 2500 and ProLiant 2500R, you should
populate the primary PCI bus completely before adding any adapters to the secondary
bus.
Because the secondary PCI bus shares the data path of the primary PCI bus, bus balancing is not
recommended in bridged-PCI servers. In fact, Compaq recommends that you have the primary
bus completely populated before adding cards to the secondary bus. Cards in the secondary bus
need to pass their control and data through the extra bridge chip and incur delays not only from
ECG044.0399
Page 7
I/O Performance Tuning of Compaq Servers 7
PCI Slot
P
the bridge chip itself, but also from any synchronization or contention with the primary bus.
Simply stated, I/O loads on the secondary bus are not handled as efficiently as equivalent loads
on the primary bus. When placing devices on the secondary bus, select the adapters with the
lightest I/O load.
Microprocessor
Motherboard
Chipset
133MB/s
Primary PCI Bus
PCI Slot
PCI Slot
PCI Slot
Figure 2. Bridged PCI Architecture
Memory
PCI Slot
System
133MB/s
PCI
Bridge
Chip
133MB/
Secondary PCI Bus
s
PCI Slot
PCI Slot
PCI Slot
Peer PCI bus
In Peer PCI busses, however, you should attempt to balance the I/O load between the
busses.
Since each 32-bit PCI bus can move 133 MB of data per second, making efficient use of both PCI
busses can deliver 266 MB/s of combined throughput. By balancing the I/O load evenly between
peered PCI busses, you ensure most efficient use of PCI throughput. Although evenly distributing
adapters between the two busses is a good starting point, balancing the load on the two PCI
busses requires a bit more insight into the loads generated by each type of device.
ECG044.0399
Generally, the guidelines below will deliver a balanced bus when adding controllers to your
server.
1. When installing an even multiple of network or array controllers, split the controllers
evenly between the busses. For example, if you were adding two array controllers
and two network controllers, you should put one each of the network and array
controllers in each of the PCI busses.
2. If installing an "odd" number of controllers, for example, two NICs (Network
Interface Controller) and one drive array controller, split the two network controllers
between the busses. Network controllers consume more bandwidth than array
controllers do, so it is best to split the workload between two busses if possible.
Page 8
I/O Performance Tuning of Compaq Servers 8
Secondary PCI Bus
Primary PCI Bus
3. Avoid putting two network controllers together in the same bus unless both busses
already have a network controller installed. Note thatSince fewer devices can lower
contention, it is generally better to have a system with one dual-port NIC in each
bus than to have two single-port NICs in each bus.
4. When adding redundant NIC pairs, place both NICs on the same bus. If the server
was to failover to the backup device the load would remain balanced.
PCI Slot
133MB/s
PCI Slot
PCI Slot
PCI Slot
Microprocessor
Motherboard
Chipset
System
Memory
266MB/s
133MB/s
PCI Slot
PCI Slot
PCI Slot
PCI Slot
Figure 3. Peer PCI Architecture
These guidelines should not be followed if one device consistently operates at a higher load. If,
for example, one particular NIC operates at or near its upper limit while 3 other NICs in the same
server remain relatively idle, you should not split the number of NICs evenly. In this case, you
should attempt to balance the loads by placing the heavily loaded card in one bus and the less
active NICs in another bus. Balancing the total load on the PCI bus, from all devices, is the key to
maximizing PCI throughput.
Table 1. PCI Bus Architectures of ProLiant servers
PCI Slot
Number
1 Secondary Secondary Secondary Primary Primary
2 Secondary Secondary Secondary Primary Secondary Primary
3 Secondary Secondary Secondary Primary Secondary Primary Secondary
4 Primary Primary Primary Primary Secondary Primary Secondary
5 Primary Primary Primary Secondary Primary Primary Secondary
6 Primary Primary Primary Secondary Primary Primary Secondary
7 Secondary Primary Secondary Secondary
8 Secondary Primary Secondary Secondary
9 Secondary
10 Secondary
11 Secondary
Bridged PCI Bus
Systems
ProLiant 2500 ProLiant 1200 ProLiant 1600
Peered PCI Bus Systems
ProLiant 3000/
ProLiant 5500
ProLiant 5000
ProLiant 6000/
ProLiant 7000
ProLiant 6500
ECG044.0399
Page 9

I/O Performance Tuning of Compaq Servers 9
PCI Bandwidth & Saturation
While balancing the busses cannot increase your maximum throughput of 133 MB/s per bus, it
can increase the potential sustained throughput of the server. By making sure that you use the
maximum bandwidth on the two busses, you can increase overall performance. When a bus is
carrying its maximum sustained throughput, the bus is said to be saturated. Once any bus has
become saturated, it becomes a limiting factor in server performance. Balanced busses saturate at
higher performance levels. Here again, the loads placed on your server will determine the
importance of a balanced bus. In general, the high-speed PCI busses in Compaq servers are less
likely to become saturated in environments where random, small-block transfers are the norm.
Operating at 33 MHz and transmitting 32 bits in parallel, small files common in web serving and
user storage are not usually on the bus long enough to cause any sustained saturation. However,
exceptionally heavy loads of small block transfers or large block transfers, common in video
streaming or CAD storage, can make a balanced bus a critical part of your server’s performance.
Compaq recommends that you always balance the loads on your PCI busses according to the
guidelines above. However, the impact that balancing will have on performance will vary
depending on the load placed on your server.
SCSI Bus
SCSI provides performance and features that have made it the interface of choice for Compaq
servers. Originally, there was SCSI, which was renamed to SCSI-1 with the advent of SCSI-2.
SCSI-1 suffered from many compatibility issues that were addressed in the next revision. At the
same time SCSI-2 clarified and established SCSI standards, it extended the performance and
functionality, both making SCSI more powerful and resolving compatibility issues. SCSI-3, the
newest standard, extends the functionality of the SCSI bus to new devices such as Fibre Channel,
SCSI-3 Parallel Interface, and the High Performance Serial Bus. Most importantly, SCSI-3 paves
the way for a higher-performance bus interface.
When referencing SCSI devices, prefixes, such as Wide, Narrow, and Fast, are used. Each of
these prefixes gives some insight to the maximum performance of the SCSI device. There are two
classes of prefixes; those that deal with the bus speed and those that deal with bus width. Table 1
summarizes and defines some common SCSI prefixes.
Table 2. SCSI prefixes
Bus speed
Bus width
Regular
Fast Defined in SCSI-2, the Fast protocol increases the speed of the SCSI bus to
Ultra The Ultra protocol, part of the SCSI-3 specification, builds on the performance of Fast
Narrow The original SCSI bus is capable of transmitting 8 bits per clock cycle. The term narrow
Wide Introduced as part of the SCSI-2 specification, Wide busses allow the transmission of 2
This term is no longer used. Regular, or the lack of Fast or Ultra, denotes the original 5
MHz SCSI bus speed. On a narrow bus, Regular SCSI could transmit 5 MB/s.
10 MHz. On narrow busses, which transmit 1 byte per clock cycle, this gives a
maximum throughput of 10 MB.
SCSI, but doubles the clock again to 20 MHz. Ultra SCSI can transmit up to 20MB/s on
a narrow bus.
is rarely used, but implied by the lack of the Wide prefix.
bytes or 16 bits per clock cycle. By doubling the data bus width, the throughput of the
SCSI bus doubles. In Wide-Fast SCSI, the throughput reaches 20 MB/s; and in WideUltra SCSI, the throughput has a maximum of 40 MB/s.
ECG044.0399
Page 10

I/O Performance Tuning of Compaq Servers 10
SCSI Bus Interface
Since SCSI was introduced, several specifications have been released and many new extensions
have been defined. With each subsequent release of the SCSI specification; expandability,
performance, flexibility, and compatibility have increased or improved. Currently, there are three
SCSI specifications.
SCSI-1
The original SCSI standard, approved by ANSI in 1986, defined the first SCSI bus in terms of
cabling length, signaling characteristics, commands, and transfer modes. The default (Regular)
speed for SCSI was 5 MB/s. It had an 8-bit (Narrow) parallel bus that transferred a single byte of
data with each bus cycle. “Regular” and “Narrow” conventions are no longer mentioned in the
SCSI protocol names.
SCSI-2
The second version of the SCSI standard, SCSI-2, was approved in 1990. SCSI-2 was an
extensive enhancement that defined support for many advanced features, including:
• Fast SCSI: A high-speed transfer protocol that doubles the speed of the bus to 10 MHz.
With an 8-bit data pathway, the transfer rate is 10 MB/s.
• Wide SCSI: Widens the original 8-bit SCSI bus to 16 bits to permit more data
throughput at a given signaling speed. The combination of Fast and Wide (Fast-Wide
SCSI-2) offers data transfer rates up to 20 MB/s.
• More Devices per Bus: Wide SCSI busses support 16 devices (15 drives, plus
controller) as opposed to eight with regular (Narrow) SCSI.
• Better Cables and Connectors: SCSI-2 defined a new high-density 68-pin “B” cable
and connectors.
• Active Termination: Provided more reliable termination of the bus.
In addition to these features, SCSI-2 maintained backward compatibility with all SCSI devices.
SCSI-3
SCSI-3 is a group of documents that define the implementation of SCSI protocols on different
physical layers (SCSI-3 Parallel Interface, High Performance Serial Bus, Fibre Channel, and
Serial Storage Architecture). Each physical layer has different performance characteristics and
uses different hardware. Other documents in the SCSI-3 standard are still being developed.
Currently, the SCSI-3 standard includes SCSI-2’s performance and functionality enhancements
plus:
• Ultra SCSI: Doubles the bus speed to 20 MHz and the transfer rate to 20 MB/s with an
8-bit data pathway.
• Wide-Ultra SCSI-3: Doubles the Ultra SCSI transfer rate to 40 MB/s using a 16-bit data
pathway.
ECG044.0399
• Improved Cabling: A new 68-pin “P” cable replaces the “B” cable for use with Wide
SCSI.
Compaq has extensively tested and integrated the Wide-Ultra SCSI-3 technology in Compaq
servers and storage options because it allows the highest available performance in a SCSI host
Page 11

I/O Performance Tuning of Compaq Servers 11
P
interface and because its backward compatibility provides investment protection for Compaq
customers.
In general, use devices with the highest SCSI specification that your controller can
support.
In the case of Fibre Channel Arrays, use Wide-Ultra SCSI-3 compatible drives for maximum
performance. In all SCSI configurations, note that:
• Wide-SCSI will outperform narrow SCSI.
• Higher clock-rate interfaces (Fast and Ultra) will usually give performance gains.
Compaq does not recommend mixing SCSI revisions or protocols within RAID arrays. If you
were to put a SCSI-1 device as part of a RAID array of Wide-Ultra SCSI-3 devices, the
performance of the entire array would suffer. However, if drives are configured as independent
drives (not as a RAID array), protocols may be mixed to some extent.
Wide and narrow devices may be used on the same bus without affecting the performance of the
individual devices. That is, Wide devices will transfer 16 bits per clock; and Narrow devices will
use 8-bit transfers.
However, when mixing non-Ultra and Ultra drives, you must be aware of potential performance
implications. When the SCSI bus is initialized, the host adapter negotiates the highest transfer
protocol that each drive is capable. Ideally, the controller will use this maximum speed to do all
transfers to that device. In practice, however, operating a SCSI bus at Ultra speeds places strict
requirements on the configuration in order to maintain signal integrity. For any component of
your Compaq SCSI chain to use Ultra speeds you must adhere to the following:
• Both the device and your controller must be capable of Ultra SCSI.
• The SCSI controller must not be in the middle of a SCSI chain.
• For every 5 Narrow devices, you must have at least one Wide device.
• Any device that communicates at Ultra speeds must be Wide.
If any one of the above rules is broken, no device on the SCSI bus will be able to communicate at
Ultra speeds. In this case, the bus will fall back to Fast, 10 MHz transfers.
SCSI Bus Balancing
Just as with PCI, balancing the load across multiple SCSI busses can increase sustained
throughput. Here again, balancing SCSI controller loads is not as simple as evenly distributing the
number of disks between the busses. Proper bus balancing evenly distributes the loads generated
by access to each disk.
All Compaq SMART-2 SCSI controllers, Compaq SMART-2 SCSI Array Controllers, and most
ProLiant Storage Systems are available with multiple SCSI busses.
ECG044.0399
Page 12

I/O Performance Tuning of Compaq Servers 12
Table 3. Smart-2 Controller Family
Model Number of SCSI Channels (Busses) Maximum Number of Spindles
Smart-2SL Controller 2 30
Smart-2DH Controller 2 30
Smart-2/P Controller 2 30
Smart-2/E Controller 2 30
Smart Array 3100 ES 3 45
Smart Array 3200 2 30
Table 4. ProLiant Storage Systems
Model Number of SCSI Channels
(Busses)
ProLiant Storage System U1 1 7 Wide-Ultra SCSI-3
ProLiant Storage System U2 2 8 Wide-Ultra SCSI-3
ProLiant Storage System 1 7 Fast-Wide SCSI-2
ProLiant Storage System UE 2 12-1" or 8-1.6" Wide-Ultra SCSI-3
Maximum Number of
Drives
SCSI Revision Supported
The SMART-2 family of controllers and the ProLiant Storage System boxes provide an
integrated storage array solution. The various topologies these combinations present must be load
balanced with the awareness of where the busses and their combined load are. Details of the
Smart-2 family of array controllers and the ProLiant Storage System boxes are presented in the
two tables above.
On controllers with two independent busses, making certain that the I/O load is evenly distributed
can provide higher sustained throughput from the SCSI interface. When drives of similar
performance and load are used, balancing the SCSI busses is as simple as dividing the number of
drives on each bus evenly. However, drives should not be divided evenly if dividing the drives
between the SCSI busses will require placing a higher I/O load on one of the two busses.
SCSI Bandwidth & Saturation
Because disk requests can be combinations of reads or writes, random or sequential, and small or
large; SCSI throughput is the most application-dependent I/O factor. In some server mixes the
bandwidth limit will never be reached. If you are doing random data retrieval, your drives will
spend more time seeking the data, and the data is so small that the transfer will be off of the SCSI
bus before the next read is completed by the drive. When small, random reads are the norm, you
can have many more devices on your SCSI bus before you reach saturation.
However, large block data transfer environments, such as video editing, will cause the drives to
do fewer seeks and retrieve large, contiguous streams of data. In this case, a Wide-Ultra SCSI-3
bus can be saturated by as few as 4 drives. Once the SCSI bus has become saturated adding more
drives can actually degrade performance.
Be aware of the load placed on your server and maximize SCSI bandwidth accordingly.
Fibre Channel
Fibre Channel (FC) is the next generation in storage technology. FC combines a high-speed
connection between server and storage with flexibility and expandability. This high-speed link is
ECG044.0399
Page 13

I/O Performance Tuning of Compaq Servers 13
capable of transmitting 100 MB/s over tremendous distances. Fibre Channel can be deployed
using many topologies.
Fibre Channel Bandwidth & Saturation
Similar to the SCSI and PCI busses, a Fibre Channel Arbitrated Loop (FC-AL) can become
saturated and limit performance. Since FC bus can carry 100 MB/s, saturating the FC bus would
require at least two Fibre Channel Arrays, delivering greater than 50MB/s each. Compaq Fibre
Channel Arrays are dedicated storage enclosures with integrated SMART-2 technology, each
array can deliver a theoretical maximum of 80 MB/s. Here again, knowing the loads placed on
your server provides insight to the number of devices that would saturate your Fibre Channel.
In practice, only when operating in the most I/O stressful environments would the FC-AL become
saturated. For example, in order to saturate the FC loop, you would need to have three
simultaneous, broadcast-quality video streams on the FC. If you operate your server under such
extreme I/O conditions, you should install additional Fibre Channel Controllers to provide
another 100 MB/s pathway to your storage.
If you use multiple Fibre Channel loops, you should try to balance the I/O load between the
loops. However, balancing the loads may provide only marginal performance improvements
unless one loop has consistently high utilization.
Distance and Arbitration Issues
Compaq Fibre Channel technology allows greater distance than any other storage bus. However,
as the distances between server and storage, and storage and hub become several kilometers, the
delay introduced by the data traversing the bus becomes noticeable. The delay, caused by data
travelling at the speed of light, cannot be eliminated. By understanding the source of the delay,
you can better implement distant storage for your server.
Server
Compaq Fibre
Channel Array 5
Compaq Fibre
Channel Array 4
Compaq Fibre
Channel Array 3
Fibre Channel
Storage Hub 7
Compaq Fibre
Channel Array 2
Compaq Fibre
Channel Array 0
Compaq Fibre
Channel Array 1
10km
140km
ECG044.0399
Figure 4. Fibre Channel Arbitrated Loop Topology
Page 14

I/O Performance Tuning of Compaq Servers 14
P
P
In a FC-AL, all data requests must traverse the entire loop to reach the server. When a hub is used
to connect multiple FC Arrays, passing data from one chassis to another requires a path through
the hub. In other words, for every FC chassis data must travel between the hub and the chassis
twice. In a six Fibre Channel Array system with 10 km between the server and hub, and an
additional 10 km between the hub and each array chassis, the data must travel 140 km to
complete the loop. Even when data is moving at the speed of light, 140 km introduces measurable
delay (.467 msec for 140 km).
When deploying Fibre Channel storage over extremely large distances, the delays
introduced can have an effect on performance.
Fibre Channel Array Storage Arrays
Just as with PCI, Compaq employs dual, independent SCSI busses in each Fibre Channel Array.
The concept of balanced SCSI busses applies within each Fibre Channel Storage Array chassis.
Since there are two independent busses, making certain that the I/O load is evenly distributed can
provide higher sustained throughput to the Fibre Channel interface. When populating the Fibre
Array with drives, you should take care to split the I/O load between the two busses. When drives
of similar performance are used, balancing the SCSI busses is as simple as dividing the number of
drives on each bus evenly. However, drives should not be divided evenly if dividing the drives
between the SCSI busses will require mixing of SCSI revisions or placing a heavier load on one
bus.
Compaq storage on Fibre Channel is the Fibre Channel Array. These arrays consist of a chassis
with a Fibre Channel adapter and bays for eight 1-1/2 inch drives or twelve 1 inch drives. There
are two SCSI busses in each array; one on the left and the other on the right. Care must be taken
when plugging drives into the array to insure the drives are distributed evenly over the two busses
or contention could reduce the array's performance. Placing two drives on the same bus can
reduce the performance as much as 5% from placing one drive on each bus. Placing four drives
on one bus can degrade performance by as much as 7%. Six drives on one bus can yield a 20%
lower performance than a balanced distribution.
When deploying disk drives in Fibre Channel storage, distribute them evenly between the
busses in the array.
Drive Technology
Since the physical hard drive must retrieve and write any and all data, delays caused by the drive
are propagated throughout the I/O chain. So, it is important to understand what factors affect
drive performance and what can be done to minimize the effect of the unavoidable delays.
The hard drive is the only device in the I/O chain that contains moving parts and, therefore, is
subject to physical delay. Because the drive head must move across the spinning platter, delays
are introduced by locating the data and positioning the head on the platter. When characterizing
the delays associated with hard drives, there are three primary parameters:
• Rotational Latency
• Seek Time
• Access Time
ECG044.0399
Page 15

I/O Performance Tuning of Compaq Servers 15
All of these delays are associated with positioning the drive head above the requested data. The
delay caused by the swinging of the head to any given cylinder is called seek time. In some cases,
the head may only have to seek from one track to the next; other cases may require the head to
move across the entire data area. By averaging the time required for the head to move between
any two random tracks, we can obtain average seek time. Lower average seek times provide
faster data access.
Once the drive head has completed the seek to the requested cylinder, it is likely that the drive
will have to wait for the platter to rotate the data under the drive head. The delay introduced by
waiting for the data to rotate to the head is called rotational latency. Since the likelihood of
having to complete a full rotation in order to position the head over the data is just as great as
having the head land immediately on the requested data, we can define the average latency as the
time required to rotate the disk through one half of a revolution.
By combining the two physical performance factors, we obtain the measurement of average
access time. Average access time is simply the average seek time added to the average latency.
The average, non-cached request that the drives must perform will be subject to delays equal to
this average access time. While there is no way to eliminate the physical delays of hard drives,
there are a few tools that can help reduce their effect.
Drive technology is constantly improving, and doing so at an ever-increasing pace. By using
newer drives, you can take advantage of this technology allowing
• Faster and more accurate head movement – New servomotors allow faster placement of the
drive head, thereby reducing the average seek time.
• Higher velocity platters. – Higher velocity platters reduce latency by moving more data under
the head faster. Higher speed platters also enable the drive to read more data in shorter
periods of time.
• Greater data density – Combined with faster platters, greater data density allows the drive to
retrieve more data per track and more tracks per surface.
The table below shows comparative measures of physical delays in various drives.
Table 5. Relative Performance of Drive Technologies
Rotational Speed Average Latency Average Seek Average Access Time
3,600 rpm 8.3 ms 13 ms 21.3 ms
5,400 rpm 5.5 ms 11 ms 16.5 ms
7,200 rpm 4.2 ms 7.1 ms 11.3 ms
10,000 rpm 3 ms 5.4 ms 8.4 ms
RAID levels and performance
ECG044.0399
Another tool to help reduce data access delays is RAID technology. When implemented wisely,
RAID can provide phenomenal performance for your drive system and at the same time protect
your server from data loss. Published in 1987, RAID combines many smaller disks to yield
performance that is greater than a single drive of the same capacity.
In terms of seek time and latency, RAID cannot change the physical characteristics of the drive.
What RAID can do is distribute the workload so that each drive in an array has fewer requests to
Page 16

I/O Performance Tuning of Compaq Servers 16
service. To a client, distributing the workload means that any individual request will be filled
more quickly. By spanning the data and workload to multiple devices, it becomes more likely that
an individual drive will be able to handle a request immediately. In effect, RAID allows parallel
retrieval of data. With RAID more requests can be filled simultaneously than with a single drive.
Perhaps the greatest benefit that can be gained from using RAID technology is data guarding.
RAID systems can provide highly reliable redundancy for storage systems. In some cases RAID
can even reconstruct data that is on a drive that has failed. Proper implementation of RAID,
however, requires a basic knowledge of the systems and options involved.
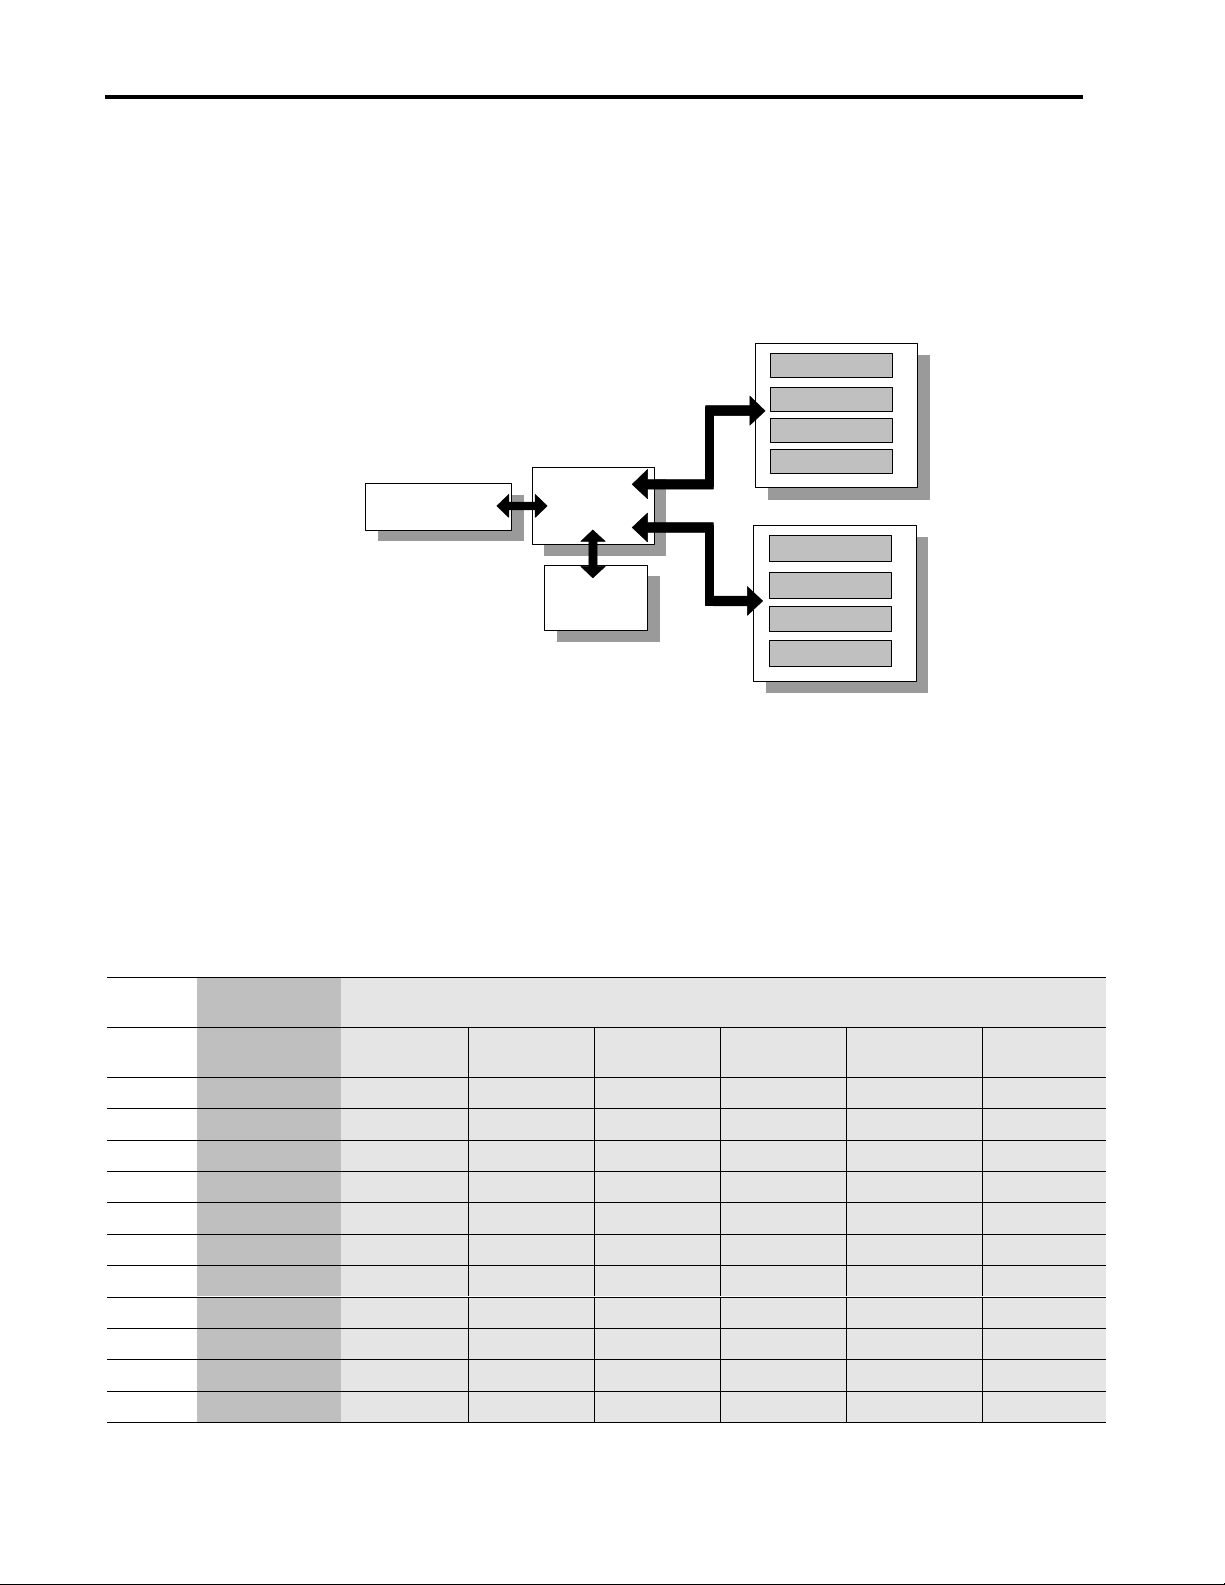
RAID 0 (No Fault Tolerance): This RAID level is not a true fault tolerance method because it does
not provide data redundancy; therefore, provides no fault protection against data loss. RAID 0 is
known as “stripe sets” because data is simply striped across all of the drives in the array. This
configuration provides high performance at a low cost. However, you incur a risk of possible data
loss. You may consider assigning RAID level 0 to drives that require large capacity (in some
cases, full capacity of the disks) and high speed, and can afford the loss of data in the event of a
disk failure.
RAID 1 (Disk Mirroring): This configuration of mirrored sets of data uses 50 percent of drive
storage capacity to provide greater data reliability by storing a duplicate of all user data on a
separate disk drive. Therefore, half of the drives in the array are duplicated or “mirrored” by the
other half. This RAID level provides high level of fault tolerance, but your drive cost doubles
because this level requires twice as many disk drives to store the same amount of data and
therefore might not be cost-effective for your environment.
RAID 4 (Data Guarding): In RAID 4 one of the disks in the stripe set is used for drive parity. To
calculate the parity, data from all the data drives in the stripe set are read. RAID 4 is not
commonly used for database applications.
Data
Data
Data
Data
Data
1
2
3
4
1
1
Data
2
Data
3
Data
4
Data
RAID 0 - Data Striping
1
Data
Copy
2
Data
of
1
Data
RAID 1 - Drive Mirroring
Data
Data
Data
Data
Data
Data
Data
1
2
3
4
1
2
2
Data
Data
Data
Data
Parity
Copy
Data
of
Data
1
2
3
4
1
2
2
1
Data
2
Data
3
Data
4
Data
1
Data
2
Parity
3
Data
4
Data
RAID 5 - Distributed Data Guarding
1
Data
2
Data
3
Data
4
Data
RAID 4 - Data Guarding
1
Data
2
Data
3
Parity
4
Data
Data
Data
Data
Data
Data
Data
Data
Parity
1
Parity
2
Parity
3
Parity
4
Parity
1
2
Parity
Data
3
Data
4
Data
1
2
3
4
1
2
3
4
ECG044.0399
Figure 5. Data and Parity Distribution for RAID
Page 17

I/O Performance Tuning of Compaq Servers 17
P
P
RAID 5 (Distributed Data Guarding) RAID 5 is also called “Stripe Sets with Parity”. This level of
RAID actually breaks data up into blocks, calculates parity, then writes the data blocks in
“stripes” to the disk drives, saving one stripe on each drive for the parity data. This method is the
most cost-effective fault-tolerant RAID level. The total amount of disk space used for redundancy
is equivalent to the capacity of a single drive; therefore, the overall cost for this method of fault
tolerance is lower than Disk Mirroring. In RAID 5 configuration, if a drive fails, the controller
uses the parity and data on the remaining drives to reconstruct data from the failed drive. This
allows the system to continue operating with slightly reduced performance until you replace the
failed drive.
Recommended RAID configurations are very situation dependent. If performance is the
only factor to be considered and fault tolerance is a non-issue, RAID 0 will best suit your
needs. However, most enterprise-class server applications demand fault tolerance. In
these cases, RAID 5 provides the most effective combination of performance, economy,
and reliability. If fault tolerance is the primary concern RAID 1 provides complete
redundancy for the entire drive system, at the cost of doubled space requirements.
Hardware vs. Software RAID
Some modern operating systems provide a software implementation of RAID as part of the OS.
Many users look at this as free RAID. However, when considering the total cost of ownership and
the performance impact on your system, hardware RAID is, by far, a better solution.
In a hardware-driven RAID system, dedicated logic controllers handle parity and recovery
information. In high level RAID systems, such as RAID 5, using OS RAID solutions and
allowing the server CPU to handle this task can consume a great deal of CPU resources.
Moreover, the hardware RAID implementation itself is up to nine times faster than a software
array.
Hardware RAID also offers a great many features than are not present in any of the current
software implementations, such as:
• Battery backed ECC read and write cache.
• On-the-fly failover and rebuild without user intervention.
• Drive monitoring and pre-fail warning.
• Easy configuration and management.
Compaq highly recommends using hardware driven RAID systems for improved
performance and reliability.
Scaling
The common thread in both hardware and software RAID is the concept of scaling. Scaling refers
to the method of distributing the load to multiple devices. Both hardware and software RAID use
multiple drives functioning as one logical unit to complete requests faster than a single drive. In
the case of hard drives, we may scale by adding more identical drives (called like drive scaling)
or we may scale by dividing a desired storage capacity between different numbers of drives (like
capacity scaling). In both cases, there are benefits and concerns.
ECG044.0399
Page 18

I/O Performance Tuning of Compaq Servers 18
P
As mentioned, spanning your data across more drives gives a case of increased performance with
diminishing returns. Compaq has found that adding drives to an array provides greater throughput
regardless of storage capacity and fault tolerance level. This is true for both like drive and like
18GB
1 - 18GB drive
Figure 6. Drive Scaling Schemes
18GB
2 - 9GB drives
Like Capacity Scaling
18GB 18GB
3 - 6GB drives
6 - 3GB drives
2GB
1 - 2GB drive
4GB
2 - 2GB drives
Like Drive Scaling
6GB 12GB
3 - 2GB drives
6 - 2GB drives
capacity scaling. The danger of using many small drives to reach your storage requirements is
that you limit the maximum amount of storage that would be available on that SCSI bus. If you
had filled a Fibre Channel Array with twelve, 2 GB drives to maximize the number of spindles,
and, in turn, performance, there would be no free drive slots in the array for future expansion.
Using six, 4 GB storage would provide you with the same 24 GB of storage as well as six open
slots in your Fibre Channel Array chassis. However, the six-drive configuration would not
respond as quickly to random, small-block transfers. Another factor to consider is cost. In most
cases, it costs less to implement the same capacity with more drives, until you reach a point that
more chassises are required to hold too many of the smaller drives.
Newer technology disk drives are usually faster and smaller with greater storage area, but cost a
premium. Disk technologies and drive costs are changing so fast that making specific
recommendations is difficult. Choose carefully the parameters you want to maximize for your
system: costs, performance, capacity, replaceability, or future expandability. Saving money now,
may cost more in the future when the failed drive becomes harder to find.
It is up to you to determine which type of drive scaling is right for your server’s
workload. More random, small-block transfers enjoy greater performance benefits with
more spindles. On the other hand, large, sequential transfer environments show
decreasing gains much sooner when scaling by adding drives.
In addition to adding drives, adding controllers may provide significant performance gains in
certain environments. Since fault-tolerant RAID requires parity calculations for all data written
to the drives, dividing this load between redundant hardware can, once again, provide increased
throughput, especially in RAID 5. Redundant controllers provide little or no gains;roughly 3%,
for lower RAID levels that do not use parity information. Conversely, a RAID 5 system can
realize up to a 57% increase in throughput when parity generation is assisted by a second
controller. As usual, knowing your server setup and RAID level implemented will help you weigh
the performance gains against the added cost of the second controller card.
System Memory
Even the most optimized server can improve response time to client requests by adding additional
system memory. Since server operating systems employ powerful caching algorithms, client
ECG044.0399
Page 19

I/O Performance Tuning of Compaq Servers 19
requested data is retained in high-speed RAM after the request has been filled. If this file is
accessed frequently, subsequent requests can be filled immediately, without requiring the hard
drive to fetch data. By adding more RAM to your server, you can allocate additional memory and
increase the amount of data that can be cached. When properly implemented, cache can enable
your server to fill more client requests faster. The increase in performance comes from not only
filling the request from faster RAM, but also the fact that the busses between the memory and
drives were not used to get the data. In other words, by not using the Fibre Channel or SCSI
busses to access this request, these busses are free to handle other requests. In turn, the other
requests, which may not be in cache, can be retrieved more quickly. Using larger and better-tuned
caches eliminates redundant bus traffic for commonly accessed data.
In general, adding RAM increases I/O, as well as overall, performance.
As with other hardware systems, adding more RAM is a case of diminishing returns. That is, the
more RAM you have installed, the smaller the gain of adding more will be. Additionally, some
operating systems have limits on the amount of RAM that can be used efficiently. Check with the
operating system developer to see if your OS is subject to any RAM limitations.
Each operating system implements data caching differently. Therefore, to maximize the
investment in RAM, make sure that your OS is making the most efficient use of the available
RAM. Novell NetWare, Microsoft Windows NT, SCO UnixWare, and SCO OpenServer have
many cache tuning parameters that can optimize data caching to your environment and workload.
OS Performance Monitoring Tools
In every server environment the effect of each bottleneck will differ. Each operating system
provides specialized tools for assessing the load placed on your server and the impact each
bottleneck has on server performance. The first step in server performance tuning is
understanding the sources of performance limitations. The next step is to identify which sources
of limitation are most prevalent in your server. Finally, tune hardware and configure the operating
system to eliminate or reduce the effect of these bottlenecks.
In order to identify which hardware elements may be limiting your server performance, each
operating system provides tools to monitor and record hardware performance data. In addition,
the monitoring tools provide insight into the operating system itself, providing information about
how the OS is using its resources. While many modern operating systems are “auto-tuning,”
manual adjustment of the server environment variables and registry entries may be necessary to
achieve optimal server performance. Most of the OS-variable tuning modifies caching or
hardware allocation algorithms. By making accurate adjustments to the caching and OS variables,
you can mask or reduce hardware bottlenecks.
In this section, we will introduce the OS-specific performance monitoring tools available in
Microsoft Windows NT, Novell NetWare, SCO UnixWare, and SCO OpenServer. Each tool
provides different insight into server performance. None of these tools provide specific analyses
or recommendations on tuning. Rather, these tools gather general information that is not hardware
or environment specific. With some intuitive thinking and careful analysis, you can use this
insight to identify which bottlenecks are most noticeable in your system.
ECG044.0399
From the initial gathering of data, to the final implementation of changes, performance tuning is
not a straightforward process. To effectively use these tools, you should
• Collect relevant, useful data.
• Be aware of unusual spikes in the data.
Page 20

I/O Performance Tuning of Compaq Servers 20
• Establish a baseline for the performance of your server.
• Make a single modification of hardware or software.
• Recollect data with newer configuration and compare to baseline.
When generating reports or logs of server performance and activity, knowing which data to
collect can quickly provide clear insight. You should be familiar with which components can be
monitored by your tools and how the data reflects the operation and performance of this
component. Moreover, gather data that is representative of the most common load placed on the
server. For instance, if your server spends most of the evening hours idle, do not use data
gathered during this period to evaluate server performance.
Gathering data during off-hours is analogous to taking measurements during unusually high
traffic periods, in that both of these situations will provide false insight into the day-to-day
operation of your server. Instead, gather your data for performance tuning during normal daily
operation. Be aware of any data samples that are abnormally high or low. Investigate any peaks
and valleys in the data to verify if they are part of the normal operation or a single event.
Once you have gathered sufficient valid data, you can develop a baseline for your server. Any
changes or optimizations to your server can be compared to this baseline to measure the impact
on performance. Changes in hardware or OS settings should be made one at a time. Data should
then be recollected during normal operation and compared to the original baseline data.
As you can see, OS performance tuning is an involved, lengthy process. The rewards, however,
can be reaped throughout your network.
Microsoft Windows NT
In both Microsoft Windows NT Version 3.51 and Microsoft Windows NT Version 4.0,
Performance Monitor can display and record performance data for nearly every system in the
server. Performance Monitor has several easy-to-read reporting interfaces, including scrolling
graphs, bar charts, and text-based log files.
To monitor a particular hardware subsystem, you need to know the Object, Counter, and Instance
of the system you would like to monitor. The Object refers to the general classification of a
system, such as processor, physical disk, or cache. The Counter option lets you select which
aspect of the specified Object, or component, you would like to monitor. In some cases, you may
have more than one instance of a given system. The Instance option lets you specify to a given
counter which one of the multiple occurrences should be monitored. For example, in a multiple
CPU server, you may want to monitor the number of interrupts handled by CPU #1 only. In this
case you would select the Processor object, then the Interrupts/sec counter, and the #1 instance.
Compaq Resource Paq Version 5.0 for Microsoft Windows NT contains additional hardware
performance monitoring components that give specific insight into your Compaq server PCI bus,
Compaq NetFlex 3 network interface, and Compaq 32-Bit SCSI-2 controllers. Additionally, the
Compaq Resource Paq for Microsoft Windows NT contains a utility called the Performance
Monitor Analysis tool. The data in the log files created by Performance Monitor are not readily
viewable. Performance Monitor Analysis parses the information into easy to read sections for
easy interpretation. To manage analysis of interrelated subsystems, Performance Monitor
Analysis can create functions and equations using the data from Performance Monitor.
ECG044.0399
Performance Monitor provides the identical functionality for many software components of the
system. Performance and utilization data on OS components, such as cache utilization and page
file access, can be logged and analyzed at the same time as hardware information.
Page 21

I/O Performance Tuning of Compaq Servers 21
Novell NetWare
For the newer NetWare 5, as well as NetWare 4, MONITOR.NLM provides real-time
measurements of OS performance parameters. While MONITOR.NLM, the NetWare Console
Monitor, does not provide for logging data to an external file, the on-screen, real-time feedback
provides clear insight to the efficiency and effectiveness of the operating system. NetWare
Console Monitor is primarily an operating system monitor. By observing trends in parameters
such as cache utilization and network traffic, you can pinpoint hardware and software
bottlenecks.
Monitor is a menu driven utility that provides detailed information for systems such as Storage
Devices, Disk Cache Utilization, and LAN/WAN Drivers. To monitor a particular system or
component, highlight the appropriate menu item and press Tab to view all available real-time
data for that system. Monitor does not affect server performance while monitoring the system, so
analysis can be done while the server is under normal operation, even with active connections to
clients. Certain parameters that are displayed within MONITOR measure directly the
performance of a given system, others, however, may require calculation and cross-referencing to
other parameters to fully understand the implications. Similarly, some measurements reflect OS
and software parameters, some reflect purely hardware performance or utilization, while others
reflect the interdependence of the many systems.
Additionally, Compaq Insight Manager can provide insight into CPU and, in some servers, PCI
bus or EISA bus utilization. Compaq Insight Manager for NetWare adds the ability to add
utilization thresholds to the comprehensive alerting and reporting management system.
SCO UnixWare and OpenServer
With SCO UNIX operating systems Compaq and SCO have partnered to bring an impressive
array of monitoring utilities. Compaq has provided several utilities to monitor the Compaq SCSI
Host Bus Adapters (HBA).
SCSI Utilities
ida_disks – indicates which HBAs in the system are SMART Array Controllers. To use
this utility, run it as root with no arguments. It is used by the ida_menu utility to build a
list of SMART HBAs to pass to the idadiag utility.
ida_menu – allows you to probe SMART Array Controllers for information including:
controller type, slot in the system, and board revision number.
idadiag – the back-end of the ida_menu utility. It is run with the name of all the SMART
Array HBAs as defined by ida_disks.
Wide-Ultra SCSI Utilities
cpqsmu – allows you to probe the HBAs controlled by the CPQSC driver, and any
devices connected to them.
ECG044.0399
cpqultra – allows you to take a snapshot of the HBAs controlled by the CPQSCSI driver
and devices connected to them.
The following Compaq utilities provide similar monitoring and operation as the SCSI
applications listed above.
Page 22

I/O Performance Tuning of Compaq Servers 22
Fibre Channel Utilities
casa_disks – used by the casa_menu utility to build a list of FC adapters to pass to the
casadiag utility.
casa_menu – allows you to probe FC Array Controllers for information, including:
controller type, PCI slot, and board revision number.
casadiag – the back end of the casa_menu utility. Casadiag is run with the name of all the
FC Array Controllers as defined by casa_disks.
casacfg – used to configure the loops on a FC adapter, the arrays on a FC loop, and
remove the casa driver from the system.
casautil – allows you to perform basic administrative functions like manually testing the
LEDs on an array or taking an array on- or offline.
Perhaps the most comprehensive tool for analyzing and recording performance data on SCO
operating systems is sar, or systems activity report. sar allows for both real-time and logged data
gathering of nearly every system in your server. sar can gather data which may highlight both
kernel and non-kernel, such as disk I/O or CPU utilization, bottlenecks. Consult the man pages
for sar for a complete listing and explanation of sar’s functionality.
sar’s greatest weakness is the arcane method of reporting the data. rtpm, real-time performance
monitor, can display the same data as sar in real-time in a dense format which is usually easier to
follow. In addition, rtpm allows individual parameters to be displayed in a real-time graph.
However, rtpm does not allow the same data logging capability as sar. Instead, only the screen is
used for output of rtpm’s tables of data.
If sar’s output files are too obtuse, you may consider third-party utilities such as SarCheck.
SarCheck analyzes your sar data and generates a report, in a clear, easy to read format, indicating
what performance problems are most evident in your server and offers possible solutions for
common performance issues.
Conclusion
Hopefully, this paper has provided you with a firm understanding of hardware performance
tuning and analysis. This information, combined with the introduction to the tools available to
identify performance issues, should establish the basis for evaluating your server performance.
From there, you can investigate what tools and parameters are available to make the most
appropriate use of your hardware. Careful testing and investigation combined with accurate
diagnosis and solutions can prolong the life and improve performance of any server.
Since it would be nearly impossible for this paper to proceed to the next step of diagnosing
application-dependent problems and recommending specific solutions, tuning the server is
something for you to explore on your own. There are many books, websites, and magazines that
provide volumes of information that may be specific enough to actually provide clear tuning
instructions for your environment. As part of the ASE training courses, Compaq offers in-depth
classes on Integration and Tuning for each of the supported operating systems. Information of
these classes can be obtained via the Compaq website at http://www.compaq.com/resellers.
ECG044.0399
Page 23

I/O Performance Tuning of Compaq Servers 23
Appendix - Performance Tuning Data
In this section of the paper we provide some data to illustrate and reinforce the recommendations
made previously in this paper. The following graphs were collected using ZD's ServerBench 4.02,
ZD's NetBench 5.01, and Intel's Iometer, rev 1998.10.08. Tests were run on a variety of Compaq
servers, including ProLiant 1850R, ProLiant 6500, and ProLiant 5000. The results shown here are
not intended as competitive benchmarks; rather the information shown here is to show relative
performance gains afforded by performance tuning.
Fibre Channel Bus
When considering Fibre Channel Storage Arrays, you should expect to see performance
equivalent to a comparably populated SCSI bus over short distances. At the same time, FC
affords expandability and flexibility not available in any SCSI storage system.
Fibre Channel vs. SMART-2DH performance
Below are several graphical performance comparisons between Fibre Channel Storage Array and
a SMART-2DH SCSI Array Controller. According to the data, across all applications Fibre
Channel delivers performance on par with local SCSI storage.
Simulated Application: OLTP
(2 KB, 67% Read, 33% Write, 0% Sequential, 100% Random)
1000
900
800
700
600
500
400
300
200
100
0
RAID 0 RAID 1 RAID 5 RAID 5 No
Cache
RAID Level
Fibre Channel Array SMART-2DH
Figure 7. Relative performance of SCSI and Fibre Channel storage for online transaction
processing. These results were obtained using Iometer version 1998.10.08, Copyright 1998 by Intel
Corporation. Intel does not endorse any Iometer results.
ECG044.0399
Page 24

I/O Performance Tuning of Compaq Servers 24
Simulated Application: Web Server
(8 KB, 100% Read, 0% Write, 0% Sequential, 100% Random)
900
800
700
600
500
400
300
200
100
0
RAID 0 RAID 1 RAID 5 RAID 5 No
Cache
RAID Level
Fibre Channel Array SMART-2DH
Figure 8. Relative performance of SCSI and Fibre Channel storage for web server applications.
These results were obtained using Iometer version 1998.10.08, Copyright 1998 by Intel Corporation.
Intel does not endorse any Iometer results.
Simulated Application: Video Server Read
(512 KB, 100% Read, 0% Write, 100% Sequential, 0% Random)
80
70
60
50
40
30
20
10
0
RAID 0 RAID 1 RAID 5 RAID 5 No
Cache
RAID Level
Fibre Channel Array SMART-2DH
Figure 9. Relative performance of SCSI and Fibre Channel storage for video server applications.
These results were obtained using Iometer version 1998.10.08, Copyright 1998 by Intel Corporation.
Intel does not endorse any Iometer results.
ECG044.0399
Page 25

I/O Performance Tuning of Compaq Servers 25
Simulated Application: Maximum MB/sec
(1 MB, 100% Read, 0% Write, 100% Sequential, 0% Random)
45
40
35
30
25
20
15
10
5
0
RAID 0 RAID 1 RAID 5 RAID 5 No Cache
RAID Level
Fibre Channel Array SMART-2DH
Figure 10. Relative maximum throughput for SCSI and Fibre Channel storage systems. These
results were obtained using Iometer version 1998.10.08, Copyright 1998 by Intel Corporation. Intel
does not endorse any Iometer results.
Distance vs. Performance
The following graphs illustrate the impact of latency over long distances. The throughput of the 2
x 10km cable system quickly becomes limited by the latency introduced by the extended loop. In
situations where remote storage is required, the performance implications should be taken into
consideration.
Simulated Workload: WS Mix
(4 KB, 50% Read, 50% Write, 50% Sequential, 50% Random)
1600
1400
1200
1000
800
600
400
200
0
1 2 3 4 5 6
Number of Fibre Channel Arrays
5 Meter Cable 10 Kilometer Cable 2 x 10 Kilometer Cables
ECG044.0399
Figure 11. Relative performance of FC-AL systems for common workstation loads. These results
were obtained using Iometer version 1998.10.08, Copyright 1998 by Intel Corporation. Intel does not
endorse any Iometer results.
Page 26

I/O Performance Tuning of Compaq Servers 26
Simulated Workload: OLTP
(2 KB, 67% Read, 33% Write, 0% Sequential, 100% Random)
3000
2500
2000
1500
1000
500
0
1 2 3 4 5 6
Number of Fibre Channel Arrays
5 Meter Cable 10 Kilometer Cable 2 x 10 Kilometer Cables
Figure 12. Relative performance of FC-AL systems for online transaction processing. These results
were obtained using Iometer version 1998.10.08, Copyright 1998 by Intel Corporation. Intel does not
endorse any Iometer results.
Simulated Workload: Web Server
(8 KB, 100% Read, 0% Write, 0% Sequential, 100% Random)
3500
3000
2500
2000
1500
1000
500
0
1 2 3 4 5 6
Number of Fibre Channel Arrays
5 Meter Cable 10 Kilometer Cable 2 x 10 Kilometer Cables
Figure 13. Relative performance of FC-AL systems for web server applications. These results were
obtained using Iometer version 1998.10.08, Copyright 1998 by Intel Corporation. Intel does not
endorse any Iometer results.
ECG044.0399
Page 27

I/O Performance Tuning of Compaq Servers 27
Simulated Workload: Decision Support
(25% Access, 8 KB, 0% Read, 100% Write, 100% Sequential, 0% Random
75% Access, 8 KB, 100% Read, 0% Write, 80% Sequential 20% Random)
900
800
700
600
500
400
300
200
100
0
1 2 3 4 5 6
Number of Fibre Channel Arrays
5 Meter Cable 10 Kilometer Cable 2 x 10 Kilometer Cables
Figure 14. Relative performance of FC-AL systems for decision support applications. These results
were obtained using Iometer version 1998.10.08, Copyright 1998 by Intel Corporation. Intel does not
endorse any Iometer results.
I/O performance vs. Number of FC Arrays
The following graphs provide some insight into the performance gains associated with
distributing the Fibre Channel storage load across multiple FC Arrays. As you can see from
Figure 15 and Figure 16, performance increases across all applications with the addition of more
storage arrays.
IO/sec vs Number of Fibre Channel Arrays
(512 B, 100% Read, 0% Write, 100% Sequential, 0% Random)
18000
16000
14000
12000
10000
8000
6000
4000
2000
0
0 1 2 3 4 5 6 7 8 9 10 11
Number of Fibre Channel Arrays
ECG044.0399
Figure 15. Sustained I/O rates for Fibre Channel systems as a function of the number of attached
FC arrays. These results were obtained using Iometer version 1998.10.08, Copyright 1998 by Intel
Corporation. Intel does not endorse any Iometer results.
Page 28

I/O Performance Tuning of Compaq Servers 28
IO/sec vs. Number of Fibre Channel Arrays
4500
4000
3500
3000
2500
2000
1500
1000
500
0
0 1 2 3 4 5 6 7 8 9 10 11
Number of Fibre Channel Arrays
2 KB OLTP WS Mix Web Server Decision Support
Figure 16. Relative sustained I/O for each number of FC arrays under different applications. These
results were obtained using Iometer version 1998.10.08, Copyright 1998 by Intel Corporation. Intel
does not endorse any Iometer results.
Drive Technology
10K RPM Drives
10K RPM drives represent a significant improvement in SCSI drive throughput and latency. The
following set of graphs illustrate the performance gains afforded by using 10K RPM drives.
10K vs. 7200 RPM drives
As the graph illustrates, 10k drives can deliver as much as a 46% improvement in per second I/O
over 7200 RPM drives. While the improvements would affect any application, the graph shows a
greater improvement for small block transfers. For large block transfers, the performance gains of
the 10K drives are masked by SCSI bus saturation.
ECG044.0399
Page 29

I/O Performance Tuning of Compaq Servers 29
I/Os per second
Composite Performance
Sequential Read: 2% Sequential Write: 1% Random Read: 58% Random Write: 39%
1400
1200
1000
800
600
400
200
0
Representative Compaq 7,200-rpm drive
Compaq 10k-II drive
With larger block sizes, the SCSI
bus will saturate, limiting the I/O rate
1 2 3 4 5 6 7
Number of Drives/Block Count
Figure 17. Composite performance of 10k-II drives and 7,200-rpm drives in a typical server
environment. These results were obtained using Iometer version 1998.10.08, Copyright 1998 by Intel
Corporation. Intel does not endorse any Iometer results.
In Figure 17, the x-axis indicates the number of drives on the SCSI bus. The eight marks between
each number indicate the number of blocks transferred in a single input/output (I/O) (1, 2, 4, 8,
16, 32, 64, and 128 blocks of data, respectively). One block is 512 bytes. Write caching is
disabled. Queuing is simple with 16 tagged commands.
Composite Performance
Sequential Read: 2% Sequential Write: 1% Random Read: 58% Random Write: 39%
50
40
30
20
10
(based-10k)/base
Percentage/Scaled
0
-10
Representative Compaq 7,200-rpm drive
Compaq 10k-II drive
1 2 3 4 5 6 7
Number of Drives/Block Count
Figure 18. Percent improvement calculated using values from Figure 17. These results were
obtained using Iometer version 1998.10.08, Copyright 1998 by Intel Corporation. Intel does not
endorse any Iometer results.
Figures 19 and 20 illustrate the additional performance gains associated with 10K RPM drives.
Figure 19 shows the decrease in latency for both read and write operations.While Figure 20
exhibits the increased throughput for client requests.
ECG044.0399
Page 30

I/O Performance Tuning of Compaq Servers 30
60
50
40
30
Latency (ms)
20
10
0
0 500 1000 1500 2000 2500 3000 3500 4000 4500
Read Latency - 7,200-rpm Write Latency - 7,200-rpm
Read Latency - 10k-II Write Latency - 10k-II
I/Os per Second
Figure 19. Response versus throughput for 10k and 7.2k rpm hard drives (7,200-rpm 9.1-GB versus
10k-II 9.1-GB drives. Cache disabled. 2k I/Os. 100 percent random access: 67 percent reads, 33
percent writes)
160
140
120
100
80
60
Throughput (Transactions per Second)
40
9.1 GB 10k-II
9.1 GB 7,200-rpm
12 16 20 24 28 32
Number of Clients
30-50% Performance
Gain
Figure 20. Single drive throughput comparison. These results were obtained using ServerBench
version 4.02 Copyright 1998 by ZD Inc. All rights reserved. ZD did not independently verify this test
and makes no representations or warranties as to the results of the test.
Figure 21 shows the expected increase in performance for 10K RPM drives when used in a RAID
array.
ECG044.0399
Page 31

I/O Performance Tuning of Compaq Servers 31
600
500
400
300
Throughput
200
(transactions per second)
100
0
1 2 4 6 8 12 16 20 24 28 32 36 40 44 48 52 56 60
Server Configuration:
128MB RAM
Number of Clients
7 x 9.1 GB 7,200-rpm RAID 5
7 x 9.1 GB 10k-II RAID 5
Figure 21. Relative performance of a 7-disk, RAID 5 array of 10k rpm drives and a 7-disk, RAID 5
array of 7.2k rpm drives under Windows NT. These results were obtained using NetBench version
5.01. Copyright 1997 by ZD Inc. All rights reserved. ZD did not independently verify this test and
makes no representations or warranties as to the results of the test.
Like Drive Scaling
As is the case with most systems, adding additional devices can increase the performance of that
system. By distributing the load, as shown in the following figures, drive throughput can be
increased. With Like Drive Scaling your drive system maintains higher performance over a wider
number of clients.
Like Drive Scaling (RAID 0 - 1 Controller)
20,000,000.00
18,000,000.00
16,000,000.00
14,000,000.00
12,000,000.00
10,000,000.00
8,000,000.00
6,000,000.00
4,000,000.00
2,000,000.00
-
25%
57%
4 8 16 20 24 28 32 36 40 44 48 52 56 57
Number of Clients
96%
12 x 2GB
8 x 2GB
4 x 2GB
ECG044.0399
Figure 22. Like-drive scaling performance comparison in a RAID 0 environment. These results were
obtained using NetBench version 5.01. Copyright 1997 by ZD Inc. All rights reserved. ZD did not
independently verify this test and makes no representations or warranties as to the results of the
test.
Page 32

I/O Performance Tuning of Compaq Servers 32
16,000,000
Server Throughput (Bytes/sec)
Server Throughput (Bytes/sec)
Like Capacity Scaling
Figures 23 through 27 show, again, the sustained performance of distributing loads to more drives
regardless of the RAID level.
Like Capacity Scaling (RAID 0 - 1 Controller)
14,000,000
4 x 2GB
12,000,000
10,000,000
8,000,000
68%
6,000,000
4,000,000
2,000,000
2 x 4GB
1 x 9GB
0
4 8 16 20 24 28 32 36 40 44 48 52 56 57
Number of Clients
Figure 23. Like-capacity scaling performance comparison in a RAID 0 environment. These results
were obtained using NetBench version 5.01. Copyright 1997 by ZD Inc. All rights reserved. ZD did
not independently verify this test and makes no representations or warranties as to the results of the
test.
Like Capacity Scaling (RAID 0 - 1 Controller)
20,000,000
18,000,000
16,000,000
14,000,000
12,000,000
10,000,000
8,000,000
6,000,000
4,000,000
2,000,000
33%
0
4 8 16 20 24 28 32 36 40 44 48 52 56 57
Number of Clients
12 x 2GB
6 x 4GB
3 x 9GB
ECG044.0399
Figure 24. Like-capacity scaling performance comparison in a RAID 0 environment. These results
were obtained using NetBench version 5.01. Copyright 1997 by ZD Inc. All rights reserved. ZD did
not independently verify this test and makes no representations or warranties as to the results of the
test.
Page 33

I/O Performance Tuning of Compaq Servers 33
Server Throughput (Bytes/sec)
Server Throughput (Bytes/sec)
Like Capacity Scaling (RAID 5 - 1 Controller)
14,000,000
7+1 x 2GB
12,000,000
10,000,000
8,000,000
54%
6,000,000
4,000,000
2,000,000
0
4 8 16 20 24 28 32 36 40 44 48 52 56 57
Number of Clients
3+1 x 4GB
Figure 25. Like-capacity scaling performance comparison in a RAID 5 environment. These results
were obtained using NetBench version 5.01. Copyright 1997 by ZD Inc. All rights reserved. ZD did
not independently verify this test and makes no representations or warranties as to the results of the
test.
Like Capacity Scaling (RAID 5 - 1 Controller)
14,000,000
11+1 x 2GB
12,000,000
10,000,000
8,000,000
6,000,000
4,000,000
2,000,000
28%
0
4 8 16 20 24 28 32 36 40 44 48 52 56 57
Number of Clients
5+1 x 4GB
2+1 x 9GB
ECG044.0399
Figure 26. Like-capacity scaling performance comparison in a RAID 5 environment. These results
were obtained using NetBench version 5.01. Copyright 1997 by ZD Inc. All rights reserved. ZD did
not independently verify this test and makes no representations or warranties as to the results of the
test.
Page 34

I/O Performance Tuning of Compaq Servers 34
2,000,000
4,000,000
Server Throughput (Bytes/sec)
4,000,000
Server Throughput (Bytes/sec)
Drive Controller Scaling
Figures 27 and 28 illustrate the performance gains of distributing parity calculations by adding
RAID array controllers. In Figure 29, the gains are negligible because the RAID 0 does not place
a computational load on the array controller. Therefore, a single controller can handle the RAID 0
environment.
Disk Controller Scaling (RAID 5)
20,000,000
18,000,000
16,000,000
14,000,000
12,000,000
10,000,000
8,000,000
6,000,000
57%
10+2 x 4GB, 2 Ctr
11+1 x 4GB, 1 Ctr
0
4 8 16 20 24 28 32 36 40 44 48 52 56 57
Number of Clients
Figure 27. Drive controller scaling performance comparison in a RAID 5 environment. These results
were obtained using NetBench version 5.01. Copyright 1997 by ZD Inc. All rights reserved. ZD did
not independently verify this test and makes no representations or warranties as to the results of the
test.
Disk Controller Scaling (RAID 0)
20,000,000
18,000,000
16,000,000
14,000,000
12,000,000
10,000,000
8,000,000
6,000,000
2,000,000
3%
0
4 8 16 20 24 28 32 36 40 44 48 52 56 57
Number of Clients
12 x 4GB, 1 Ctr
12 x 4GB, 2 Ctr
ECG044.0399
Figure 28. Drive controller scaling performance comparison in a RAID 0 environment. These results
were obtained using NetBench version 5.01. Copyright 1997 by ZD Inc. All rights reserved. ZD did
not independently verify this test and makes no representations or warranties as to the results of the
test.
Page 35

I/O Performance Tuning of Compaq Servers 35
RAID Level Performance
The following 3 figures show relative performance of the various RAID levels for the SMART2DH controller for common applications. Figure 32 shows a comparison of the maximum
sustained throughput for RAID 0, 1, and 5. Using these graphs you can better determine which
balance of fault tolerance and speed are best for your environment.
Compaq Smart-2DH SCSI Controller
Simulated Application: OLTP
(2 KB, 67% Read, 33% Write, 0% Sequential, 100% Random)
1000
900
800
700
600
500
400
300
200
100
0
RAID 0 RAID 1 RAID 5 RAID 5 No
RAID Level
Cache
Figure 29. Relative performance of RAID levels in an online transaction processing application.
These results were obtained using Iometer version 1998.10.08, Copyright 1998 by Intel Corporation.
Intel does not endorse any Iometer results.
Compaq Smart-2DH SCSI Controller
Simulated Application: Web Server
(8 KB, 100% Read, 0% Write, 0% Sequential, 100% Random)
900
800
700
600
500
400
300
200
100
0
RAID 0 RAID 1 RAID 5 RAID 5 No
RAID Level
Figure 30. Relative performance of RAID levels in a web server application. These results were
obtained using Iometer version 1998.10.08, Copyright 1998 by Intel Corporation. Intel does not
endorse any Iometer results.
Cache
ECG044.0399
Page 36

I/O Performance Tuning of Compaq Servers 36
Compaq Smart-2DH SCSI Controller
Simulated Application: Video Server Read
(512 KB, 100% Read, 0% Write, 100% Sequential, 0% Random)
80
70
60
50
40
30
20
10
0
RAID 0 RAID 1 RAID 5 RAID 5 No
RAID Level
Figure 31. Relative performance of RAID levels in a video server application. These results were
obtained using Iometer version 1998.10.08, Copyright 1998 by Intel Corporation. Intel does not
endorse any Iometer results.
Cache
Compaq Smart-2DH SCSI Controller
Simulated Application: Maximum MB/sec
(1 MB, 100% Read, 0% Write, 100% Sequential, 0% Random)
45
40
35
30
25
20
15
10
5
0
RAID 0 RAID 1 RAID 5 RAID 5
Figure 32. Relative sustained maximum throughput of RAID levels. These results were obtained
using Iometer version 1998.10.08, Copyright 1998 by Intel Corporation. Intel does not endorse any
Iometer results.
Hardware RAID vs. Software RAID
RAID Level
No Cache
ECG044.0399
Figures 34 through 35 highlight the performance benefits of a hardware RAID solution,
especially when a drive in a RAID 5 array fails.
Page 37

I/O Performance Tuning of Compaq Servers 37
KB/sec
IO/sec
(256 KB Block Size, 100% Read, 100% Sequential)
30000
25000
20000
15000
10000
5000
26053
17000
10480
7656
0
RAID 1 ( 2 drvs ) RAID 5 ( 6 drvs ) RAID 5, Degraded ( 5 drvs )
25874
4779
SMART-2SL
SW RAID in NT
Figure 33. Relative maximum sustained throughput for both hardware and software RAID systems
with 256KB block, 100% sequential reads. These results were obtained using Iometer version
1998.10.08, Copyright 1998 by Intel Corporation. Intel does not endorse any Iometer results.
(512 Byte Block Size, 100% Read, 100% Sequential)
3000
2844
2850
2841
2500
2000
1500
1000
500
921
0
RAID 1 ( 2 drvs ) RAID 5 ( 6 drvs ) RAID 5, Degraded ( 5 drvs )
1035
280
SMART-2SL
SW RAID in NT
Figure 34. Relative maximum sustained throughput for both hardware and software RAID systems
with 512KB block, 100% sequential reads. These results were obtained using Iometer version
1998.10.08, Copyright 1998 by Intel Corporation. Intel does not endorse any Iometer results.
ECG044.0399
Page 38

I/O Performance Tuning of Compaq Servers 38
(8KB Block Size, 67% Read, 100% Random)
IO/sec
IO/s for a Common Database Profile
450
400
350
300
250
200
150
100
200
121
50
0
RAID 1 ( 2 drvs) RAID 5 ( 6 drvs ) RAID 5, Degraded ( 5 drvs)
335
377
288
SMART-2SL
SW RAID in NT
75
Figure 35. Relative maximum sustained throughput for both hardware and software RAID systems
under simulated database loads (8KB block, 67% sequential reads). These results were obtained
using Iometer version 1998.10.08, Copyright 1998 by Intel Corporation. Intel does not endorse any
Iometer results.
ECG044.0399
 Loading...