

Page 1

Publication Date
June 1998
Compaq
Database Technology
and Solutions Center
CONTENTS
NOTICE............................... 2
INTRODUCTION................... 3
WORKFLOW APPLICATION
ENVIRONMENT.................... 4
VIEWSTAR APPLICATION
ARCHITECTURE ..................6
Workflow Services ................7
Data Services.......................7
File Services ........................ 7
Storage Devices................... 7
Enterprise Server..................7
Oracle Configuration............. 7
TEST APPROACH.................8
TEST RESULTS ................. 11
Phase 1 Tests .................... 11
Phase 1 Test Result............ 11
Analysis of Phase 1 Test
Results.............................. 14
Phase 2 Tests .................... 15
Phase 2 Test Result............ 15
Analysis of Phase 2 Test
Results.............................. 18
RECOMMENDATIONS......... 19
Workflow Application Tuning 19
SQL Select and Commit
Statements ........................ 19
User Connect and
Disconnect......................... 19
Queuing Process ................ 20
Use Of Stored Procedures ... 20
CONCLUSIONS .................. 21
WHITE PAPER
Database Application Performance and Characterization Series
Tuning Enterprise Workflow Applications
on ProLiant Servers
Customer Application Case Study with Oracle/ViewStar on
Microsoft Windows NT
Compaq’s Database Technology and Solutions Center (DTSC) has commissioned the
Application Performance and Characterization White Paper Series to investigate
techniques and practices designed to improve the performance of enterprise applications
running on Compaq ProLiant Servers with Oracle RDBMS on Microsoft Windows NT.
This case study jointly performed by Compaq and Oracle explores the performance
characteristics of a real world application on Compaq ProLiant servers. The testing was
performed at the Compaq/Oracle International Competency Center (ICC), located within
the Compaq DTSC in San Bruno, California. The Compaq/Oracle ICC was established to
address Oracle database related issues such as solution development and validation,
advanced technology, customer case studies and proof of concept projects.
The study involved evaluating and optimizing an enterprise class application based on
Mosaix’s1 ViewStar workflow application framework. This White Paper details the
techniques and practices used to improve the performance of the customer’s workflow
application running Oracle’s Enterprise Server on Windows NT. The results of the tests
performed indicate that:
• Identifying and correcting poorly tuned transactions significantly improved application
responsiveness.
• Tuning the ViewStar Application components within the production environment reduced the
application transaction throughput time.
• Modifying the RAID configuration of the server’s disk sub-system improved the I/O
throughput and overall application performance.
• Partitioning the data and index files on the physical disks, improved the overall database
performance
ECG096/0698
1 Formerly ViewStar Corporation
1
Page 2

WHITE PAPER (cont.)
NOTICE
The information in this publication is subject to change without notice.
COMPAQ COMPUTER CORPORATION SHALL NOT BE LIABLE FOR
TECHNICAL OR EDITORIAL ERRORS OR OMISSIONS CONTAINED
HEREIN, NOR FOR INCIDENTAL OR CONSEQUENTIAL DAMAGES
RESULTING FROM THE FURNISHING, PERFORMANCE, OR USE OF
THIS MATERIAL.
This publication does not constitute an endorsement of the product or products that were tested.
The configuration or configurations tested or described may or may not be the only available
solution. This test is not a determination of product quality or correctness, nor does it ensure
compliance with any federal, state or local requirements. Compaq does not warrant products other
than its own strictly as stated in Compaq product warranties.
Product names mentioned herein may be trademarks and/or registered trademarks of their
respective companies.
Compaq, Compaq Insight Manager, ProLiant, SmartStart, NetFlex, registered United States Patent
and Trademark Office.
Netelligent is a trademark and/or service mark of Compaq Computer Corporation.
Other product names mentioned herein may be trademarks and/or registered trademarks of their
respective companies.
©1998 Compaq Computer Corporation
Printed in the U.S.A.
Microsoft, Windows, Windows NT, Windows NT Advanced Server, SQL Server for Windows NT
are trademarks and/or registered trademarks of Microsoft Corporation.
ORACLE CORPORATION
Oracle Consulting Services
Compaq Products Division
-------
COMPAQ COMPUTER CORPORATION
Enterprise Solutions Division
Database Technology and Solutions Center
Compaq/Oracle Enterprise Solutions Lab
All rights reserved. Printed in the USA
ECG096/0698
2
Page 3

WHITE PAPER (cont.)
INTRODUCTION
The workflow application was a project developed and managed by the customer’s internal IT
Division. The customer’s workflow application consists of components from a number of system
and software vendors:
• Oracle database software
• Compaq ProLiant servers
• ViewStar workflow application software
• Microsoft Windows NT operating system
• Microsoft Visual Basic software
In order to analyze the performance characteristics of the customer’s application, the application
software and sample database files were installed at the Compaq/Oracle International Competency
Center (ICC). Test results of the customer’s production system revealed that the application
response time was much higher than expected. This prompted further study of the customer’s
environment to identify possible performance bottlenecks.
To establish a performance baseline for the customer’s application, the test environment was
configured exactly the same as the customer’s production system. To accurately simulate the
customer’s production environment, a log routine was run on one of the process agents at the
customer site. The routine was run for a period of 24 hours and a copy of all the SQL transactions
processed by that agent was recorded and saved to an ASCII file. The SQL transaction log file was
used as a sample of workflow application.
After the baseline testing was completed, a series of system upgrades, application transaction
changes and database modifications were made to determine the impact on the application’s
performance and throughput.
The tests began with 30 users and increased to over 150 end users over time. The underlying
hardware was then upgraded to include a second P166 MHz processor with an additional 256MB
of memory to accommodate the additional users.
ECG096/0698
3
Page 4
WHITE PAPER (cont.)
ViewStar Application
Oracle Database
Scanning, Optical and Fax
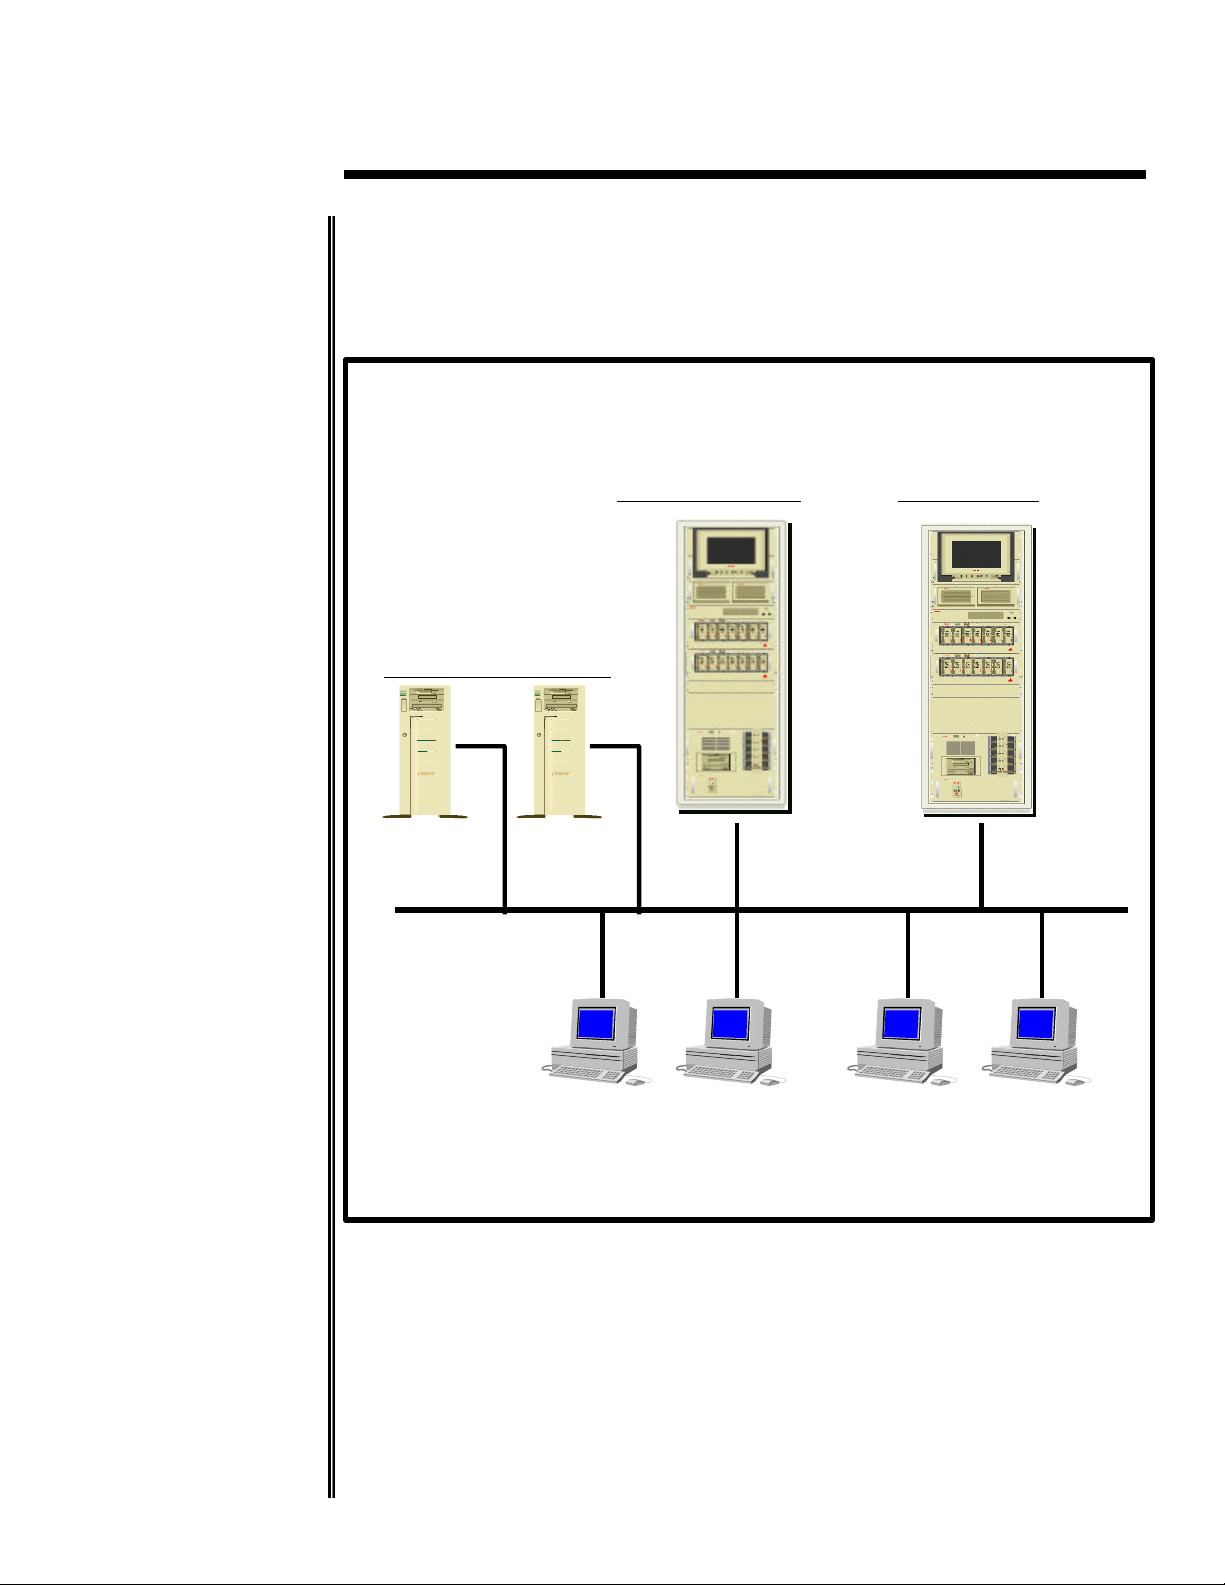
WORKFLOW APPLICATION ENVIRONMENT
Figure 1 illustrates the workflow application hardware environment. The ViewStar Application
server and Oracle database server were configured to simulate the customer’s production
environment. The systems used for Scanning and Fax were not configured and only one client and
ViewStar process machine were used during the testing.
Figure 1 – Workflow Application Environment
ECG096/0698
4
Page 5

WHITE PAPER (cont.)
The systems used during the testing consisted of the following hardware components. Test
environment consisted of a ProLiant 2500 which served as the Client system, a ProLiant 4500
which served as the ViewStar Application Server and Backup Domain Controller, ProLiant 5000
which served as the Oracle database server, and ProLiant 2000 that served as the database
performance monitor and Primary Domain Controller.
SYSTEM CPU SYSTEM
MEMORY
ProLiant 2500 1 200MHz
Pentium Pro
Processor
Table 1 – Client System Configuration
1GB System Memory 10 base-T
SYSTEM CPU SYSTEM
MEMORY
ProLiant 4500 1 100MHz
Pentium
Processor
Table 2 – Backup Domain Controller Server Configuration
256MB System
Memory
SYSTEM CPU SYSTEM
MEMORY
ProLiant 5000 2 200MHz
Pentium Pro
Processor
Table 3 – Oracle Database Server Configuration
512GB System
Memory
1 Compaq Smart 2/P
Array Controllers
NETWORK SOFTWARE
Windows NT
Network Card
Server 4.0 w/SP3
NETWORK SOFTWARE
10 base-T
Network Card
Windows NT
Server 4.0 w/SP3
NETWORK SOFTWARE
10 base-T
Network Card
Windows NT
Server 4.0 w/SP3
SYSTEM CPU SYSTEM
NETWORK SOFTWARE
MEMORY
ProLiant 2000 1 100MHz
Pentium
Processor
Table 4 – Server Configuration for Oracle Performance Monitor
ECG096/0698
128MB System
Memory
10 base-T
Network Card
Windows NT
Server 4.0 w/SP3
5
Page 6

WHITE PAPER (cont.)
VIEWSTAR APPLICATION ARCHITECTURE
The ViewStar workflow software combines business rules and procedures with document
information to manage the flow of work throughout the enterprise. The ViewStar system is an
open, network solution that automates and manages business processes.
Workflow is the automated flow of work, documents and related information through the business
process. Workflow comprises aggregating and consolidating information from diverse sources and
routing it to the people who need it to accomplish their work.
ViewStar’s development environment can be used to define the work content, business rules,
workflow maps, and user roles and activities. A library of predefined business functions and
reusable tasks can be employed to create workflow maps that represent the business process.
The customer implemented the ViewStar workflow application to manage the documents
generated as part of the customer’s forms processing system. All forms submitted by applicants are
scanned into binary files and stored into a virtual folder. Information on each applicant is assigned
a virtual folder, which contains pertinent data submitted by the applicant. All letters, mortgage
forms, and insurance forms to be processed are scanned into binary formats and stored within the
workflow repository. All other information required to be linked with individual binary files to
each other and customers are stored and updated within the Oracle (7.3.3) database. Alteration to
any of the documents are also archived and stored within the database. Figure 2 illustrates a
typical Forms Processing Workflow Architecture.
The workflow application architecture as illustrated in Figure 2, is designed to support a number of
systems working cooperatively to serve the needs of the enterprise. This application provides a set
of services, and delivers comprehensive functionality and benefits for systems deployment.
Figure 2 – Typical Workflow Application Architecture
ECG096/0698
6
Page 7

WHITE PAPER (cont.)
Workflow Services
Workflow services provide configurable and programmable automated task processing. It executes
either actively generated tasks during the workflow, such as printing, or pre-scheduled tasks to be
run periodically at pre-determined times or at specific events.
Data Services
Information associated with work documents such as location is managed by ViewStar’s data
services. The information can be contained in the workflow system or in the document repository.
File Services
The file services provide online storage and object data. All objects or unstructured data associated
with documents, folders and work packets involved in workflow applications are stored and
managed by ViewStar’s file services.
Storage Devices
The storage devices provide archived document storage on optical devices. These services control
the writing of files to optical jukeboxes and platters for long-term archival storage.
Enterprise Server
The enterprise server provides enterprise-wide workflow, including document and data
distribution. Wide-area, multi-site workflows are linked by Microsoft MAPI messaging and
replication services using ViewStar’s enterprise server. The enterprise server moves centralized
resources to the database and enables the distribution of work geographically for local processing
with local data.
Only one ViewStar process agent was configured in our test, this was done to simplify the test
environment. In addition, the process of collecting the data generated from the test and performing
data analysis was simplified.
A log routine was initiated against one of the process agents set up at the customer site. The
contents of all the activities carried out by the agent were spooled to an ASCII log file. The routine
was run for a period of 24 hours and a copy of all the SQL transactions processed by that agent
was recorded and saved to the file. This SQL transaction log file was used as a sample of the
customer’s application workload.
Oracle Configuration
A ProLiant 5000 running Microsoft Windows NT and Oracle RDBMS v7.3.3 was used as the
database server. Oracle Enterprise Manager Performance Pack was also installed on the main PDC
(Windows NT Primary Domain Controller) machine. The database monitoring tools in the
Performance Pack were used to monitor the Oracle database during system and the application
load.
ECG096/0698
7
Page 8

WHITE PAPER (cont.)
TEST APPROACH
The main objective of the tests were:
• Evaluate the database software implementation and make suitable recommendations based on
key findings.
• Evaluate the Compaq hardware used to host the Oracle database and make suitable
recommendations based upon the findings.
• Make firm recommendations on the main areas of resource contention that affect the overall
system performance and response time.
• Evaluate the physical database layout as well as the underlying I/O subsystem. Make
recommendations on the most suitable configuration.
The test was executed in two phases. In addition to the Phase 1 and Phase 2, Oracle and Windows
NT performance monitoring tools and techniques were used to identify key performance
bottlenecks. Based on these findings, modifications were made to the Oracle database and the
ViewStar application environment to improve the overall performance. A description of Phase 1
and Phase 2 are described below:
• PHASE 1
− The primary goal Phase 1 was to obtain an accurate set of baseline statistics on the system
usage and it’s underlying database and application. A database was created identical to the
database in use at the customer’s site. The data files, control files and the redo log files
were all created as indicated by the customer. Mixed queries were run against the
database to establish a set of baseline performance metrics.
• PHASE 2
− Server hardware modifications, system disk configuration and the database layout were
modified based on the findings in Phase 1. These modifications resulted in dramatic
improvements to the overall application performance, utilization and transaction
throughput.
ECG096/0698
8
Page 9

WHITE PAPER (cont.)
The tables below detail the Phase 1 initial configuration of the database server used for baseline
testing and the system modifications used during Phase 2.
SYSTEM CPU SYSTEM
MEMORY
ProLiant 5000 1 200MHz
Pentium Pro
Processor
Table 5 – Phase 1 Oracle Server System Configuration
256MB System
Memory
1 Compaq Smart 2/P
Array Controllers
SYSTEM CPU SYSTEM
MEMORY
ProLiant 5000 2 200MHz
Pentium Pro
Processor
Table 6 – Phase 2 Oracle Server System Configuration
512MB System
Memory
1 Compaq Smart 2/P
Array Controllers
NETWORK SOFTWARE
10 base-T
Network Card
Windows NT
Server 4.0 w/SP3
NETWORK SOFTWARE
10 base-T
Network Card
Windows NT
Server 4.0 w/SP3
ECG096/0698
9
Page 10

WHITE PAPER (cont.)
Test Case Description
A total of five test cases were used during Phase 1 and Phase 2. Each test executed the test script
containing sample transactions extracted from the original customer environment. There was one
user - MIS_OWNER, issuing a complex and long running query against the database as one of the
test requirements in the customer environment. The initial results from Test 1, Test 2, and Test 3
indicated an excessive amount of full table scans. In order to reduce the number of full table scans,
it was necessary to create indexes on selected tables for Test 4 and Test 5.
Below is a brief description of the tests used during Phase 1 and Phase 2:
• Test 1
− Execute the pre-defined test script 50 times with the MIS_OWNER account issuing the
query.
• Test 2
− Execute the pre-defined test script 100 times with the MIS_OWNER account issuing the
query.
• Test 3
− Disconnect all users except MIS_OWNER. The MIS_OWNER account is the only user
issuing the long running complex query.
• Test 4
− Execute the pre-defined test case 50 times against the database after the indexes were
created. The MIS_OWNER was disconnected.
• Test 5
− Execute the pre-defined test case 100 times against the database after the indexes were
created. The MIS_OWNER was disconnected.
Before every test, the Oracle utility Bstat/Estat was used to collect database performance statistics.
Bstat clears all previous statistics from Oracle dictionary tables; Estat converts the collected
statistics into a readable form that can be accessed through a standard word processor.
ECG096/0698
10
Page 11

WHITE PAPER (cont.)
TEST RESULTS
Phase 1 Tests
The primary objective of the tests in Phase 1 was to obtain an accurate set of system utilization
statistics using the customer’s original (production) application and its underlying database.
A database was created on the main database server identical to the production database used at the
customer site. The data files, control files and the redo log files were created in the similar
directories as well. The system configuration is described below:
• 1 200 MHz Pentium Pro Processor
• 256MB RAM
• RAID-0 for operating system drives
• RAID-5 for all database files
The data files were placed onto a logical volume made up of several physical disks and configured
as a RAID-5 (Redundant Array of Independent Disks) disk set. The indexes created for Test 4 and
Test 5 also used RAID-5 disk set.
Phase 1 Test Result
Table 7 lists the statistics being collected and the corresponding figure name of the result during
phase 1 test. The same statistics will be collected in phase 2 test.
FIGURE NAME TEST DESCRIPTION
Figure 3:PHASE 1 – A CPU Utilization of Tests 1 – 5
Figure 4:PHASE 1 – B Elapsed time of Tests 1 – 5
Figure 5:PHASE 1 – C Physical Reads of Tests 1 – 5
Figure 6:PHASE 1 – D Physical Writes of Tests 1 – 5
Figure 7:PHASE 1 – E Total Number of Rows Scanned for Test 1 – 5
Table 7 – Test Descriptions
ECG096/0698
11
Page 12

WHITE PAPER (cont.)
PHASE 1-A CPU UTILIZATION
100
80
60
40
20
0
Test 1 Test 2 Test 3 Test 4 Test 5
Figure 3 - Phase 1 - A Test Results
PHASE 1-B ELAPSED TIME
14
12
10
8
PHASE 1-A
(Minutes)
6
4
2
0
Test 1 Test 2 Test 4 Test 5
Figure 4 - Phase 1 - B Test Results
ECG096/0698
PHASE 1-B
12
Page 13

WHITE PAPER (cont.)
PHASE 1-C PHYSICAL READS
4000000
3500000
3000000
2500000
2000000
1500000
1000000
500000
0
Test1Test2Test3Test4Test
PHASE 1-C
5
Figure 5 - Phase 1 - C Test Results
PHASE 1-D PHYSICAL WRITES
6000
5000
4000
3000
2000
1000
0
Test1Test2Test3Test4Test
Figure 6 - Phase 1 - D Test Results
PHASE 1-D
5
ECG096/0698
13
Page 14

WHITE PAPER (cont.)
PHASE 1-E ROW SCANNED
80
70
60
50
40
30
20
10
0
Test1Test2Test3Test4Test
(Millions)
PHASE 1-E
5
Figure 7 - Phase 1 - E Test Results
Analysis of Phase 1 Test Results
The main observation from the tests in this phase were:
• A large number of table scans (sequential reads) were observed – typically this is abnormal for
OLTP type applications.
• Figure 7, phase 1–E, illustrated a high number of rows scanned in Test 1 and 2. This resulted
in a high number of physical reads (Figure5, Phase1-C) and physical writes (Figure 6, Phase 1
– D).
• After creating indexes for selected tables, the number of rows scanned was reduced
significantly in Tests 4, and 5 (Figure 7, Phase1-E). Physical writes were reduced in Test 5 as
well.
• By decreasing the number of rows scanned, better overall disk I/O throughput was achieved.
ECG096/0698
14
Page 15

WHITE PAPER (cont.)
Phase 2 Tests
The primary objective of the tests in Phase 2 was to compare the performance and transaction
throughput of the customer’s application after making the following changes to the test
environment.
• Operating system files and Oracle RDBMS server engine were placed on one drive with
RAID-0
• The Redo Log files were placed on another drive with RAID-0 to minimize the I/O for the
test. The Redo file should never be on RAID-0 in the customer environment.
• All database tables and indexes were distributed to the rest of the drives with RAID-1
• The database server box was changed from one CPU to two CPUs
• The system memory on the database server was expanded from 256MB to 2GB
Phase 1 test environment was completely removed to make a clean build for phase 2 test
environment. The system configuration was rebuilt including the operating system and Oracle
software and database files were recreated.
Phase 2 Test Result
Table 8 lists the statistics being collected and the corresponding figure name of the result during
phase 2 test. Each figure also includes the corresponding result from phase 1 for comparisons.
TEST NAME TEST DESCRIPTION
Figure 8:PHASE 2 – A CPU Utilization of Tests 1 - 5
Figure 9:PHASE 2 – B Elapsed time of Tests 1 – 5
Figure 10:PHASE 2 – C Physical Reads of Tests 1 – 5
Figure 11:PHASE 2 – D Physical Writes of Tests 1 – 5
Table 8 – Phase 2 Test Descriptions
ECG096/0698
15
Page 16

WHITE PAPER (cont.)
PHASE 2-A CPU UTILIZATION
100
90
80
70
60
50
40
30
20
10
0
Test1Test2Test3Test4Test
Phase 1 vs. Phase 2
PHASE 1-A
PHASE 2-A
Figure 8 - Phase 2 - A Test Results
PHASE 2-B ELAPSED TIME
14
12
10
8
6
4
2
5
Phase 1 vs. Phase 2
(Minutes)
PHASE 1-B
PHASE 2-B
Figure 9 - Phase 2 - B Test Results
ECG096/0698
0
Test 1 Test 2 Test 4 Test 5
16
Page 17

WHITE PAPER (cont.)
PHASE 2-C PHYSICAL READS
4000000
3000000
Phase 1 vs. Phase 2
2000000
1000000
0
Test1Test2Test3Test4Test
Figure 10 - Phase 2 - C Test Results
PHASE 2-D PHYSICAL WRITES
6000
5000
4000
PHASE 1-C
PHASE 2 -C
5
Phase 1 vs. Phase 2
3000
2000
1000
Figure 11 - Phase 2 - D Test Results
ECG096/0698
PHASE 1-D
PHASE 2-D
0
Test1Test2Test3Test4Test
5
17
Page 18

WHITE PAPER (cont.)
Analysis of Phase 2 Test Results
The main observation from the tests performed in this phase showed that:
• Phase 2-C and Phase 2-D ( Figure 10,11) shows improvement in both physical read and
writes. This was accomplished by moving the Oracle database files from RAID-5 to a RAID-1
disk set.
• The test results indicate that the tests in Phase 2 were still showing a significant number of
table scans, the number of rows scanned were not dramatically reduced. Performance related
database improvements can be made by creating indexes on heavily used tables.
• Additional evaluation of the application is necessary to determine the reason for its high reads,
and CPU utilization. However, the scope of this case study did not allow for extensive testing
to identify the potential causes.
• There was benefit gained by adding the second processor and additional memory to the
database server. Additional test cases are needed to quantify the effect of upgrading the
hardware.
ECG096/0698
18
Page 19

WHITE PAPER (cont.)
RECOMMENDATIONS
Workflow Application Tuning
After careful analysis of the overall test environment, we found one additional areas, the Workflow
application, can be enhanced. The Windows NT Performance Monitor report from the test
indicated an alarming amount of reads on several Oracle data files. The Oracle statistic report
shows excessive connect/disconnect and significant number of COMMIT statements issued in the
application. We analyzed the application and made the following recommendations.
-Reduce COMMIT statement
-Eliminate excessive connect/disconnect in application
-Improve the queuing process within the workflow environment
-Use of stored procedures
-Improve database table access by establishing public synonyms with proper privileges for users
during logon/logoff process
SQL Select and Commit Statements
The ViewStar workflow transaction SQL script contained a large number of unnecessary commit
statements. Analysis of the application revealed the following performance related issues:
• A significant number of COMMIT statements issued after a SELECT statement.
• Multiple COMMIT statements issued one after another for no apparent reason.
The main test script was modified to use a single COMMIT statement at the end of the transaction.
This significantly reduced the number of redundant COMMIT statements used for each
transaction.
User Connect and Disconnect
In the existing workflow environment, a user is required to log into each individual scheme to
access the data (tables) in that scheme. The customer’s workflow application contained a large
number of unnecessary connect/disconnect statements. There is a noticeable overhead involved
with this process. The SQL script was modified to use a single connect statement at the start of the
transaction and a single disconnect statement at the end.
In order to insure proper workflow processing, unique global names (Oracle synonyms) were used
along with grant access to tables within a scheme. This would allow a user connected as USER1 to
access tables without logging off and log back on as a different user. To make tables to all schemes
(user accounts) accessible, Oracle public synonyms were created and the required privileges were
granted to enable global access by all user accounts.
TRANSACTIONS TIME
A single run with multiple Connects/Disconnects 9 Mins
100 runs with Multiple Connects/ Disconnects 10 Mins
A single run with modified One Connect/ Disconnect 3 Mins
100 runs with modified One Connect / Disconnect 4 Mins
Table 9: Results of Application tuning
ECG096/0698
19
Page 20

WHITE PAPER (cont.)
QUEUE 1
QUEUE 2
QUEUE 3
QUEUE 4
Queuing Process
The customer’s workflow environment uses a number of processing queues to move records
through the system. This queuing technique was designed to segment the record processing
workflow. The main advantage of this approach is to insure that records are protected as they are
processed through each queue. The figure below illustrates the system queue process:
RECORD 1
Figure 12 – Application Workflow Queuing Process
As record 1 is moved from one queue to another, it is updated to reflect the work performed in
each queue. This requires that the record in Queue 1 is selected and then deleted when inserted
into Queue 2. This technique requires at least three disk I/O’s to be performed for every record
processed through the workflow system.
After analyzing the performance impact of this approach, a status column was added to the
database table to eliminate the need to delete and re-insert records into the queue. By adding the
status column, each record could be updated to indicate the status in the workflow. This resulted in
only a single disk I/O for each record processed through the workflow system. This modification to
the system resulted in a significant improvement to the overall performance of the customer’s
application. The single queue approach provided a shorter elapsed time than the multiple queue
approach.
Use Of Stored Procedures
It was recommended that the customer investigate the feasibility of using Oracle Stored
Procedures. Stored Procedures are SQL statements written, compiled and stored within the Oracle
Enterprise Database Server. It is one of the most efficient ways to use Oracle’s functionality in a
Client/Server OLTP environment. Using stored procedures will significantly reduce the amount of
data sent from the client to the Oracle Database Server.
RECORD 1
RECORD 1
RECORD 1
ECG096/0698
20
Page 21

WHITE PAPER (cont.)
CONCLUSIONS
• Establishing a multi-phased approach to characterizing the application and its underlying
components (database, O/S, and hardware) is critical to successfully identifying performance
bottlenecks.
• Using both Oracle and Windows NT supplied tools and utilities and implementing a
systematic approach to performance analysis, it is possible to identify key performance
problems and improve the application performance.
• A detailed knowledge of the application, underlying database, O/S environment and hardware
configuration is essential to understanding what modifications should be made to the
application environment.
• Establishing performance baselines and making controlled modifications to key areas,
followed by measuring resultant performance impact is the most efficient method to improve
application performance and scalability.
• Although the customer’s initial assumption suggested the Compaq ProLiant Server might not
be well suited to meet the requirements for the workflow application. The system and
workflow application modifications identified in this case study prove that a ProLiant server is
well suited for running this type of mission critical complex application.
ECG096/0698
21
 Loading...