

Page 1

HP Cluster Test Administration Guide
HP Part Number: 5900-3310
Published: January 2014
Edition: 6
Page 2

© Copyright 2010, 2014 Hewlett-Packard Development Company, L.P.
Confidential computer software. Valid license from HP required for possession, use or copying. Consistent with FAR 12.211 and 12.212, Commercial
Computer Software, Computer Software Documentation, and Technical Data for Commercial Items are licensed to the U.S. Government under
vendor’s standard commercial license. The information contained herein is subject to change without notice. The only warranties for HP products
and services are set forth in the express warranty statements accompanying such products and services. Nothing herein should be construed as
constituting an additional warranty. HP shall not be liable for technical or editorial errors or omissions contained herein.
Acknowledgments
Intel®, Itanium®, Pentium®, Intel Inside®, Intel® Xeon®, and the Intel Inside logo are trademarks or registered trademarks of Intel Corporation or
its subsidiaries in the United States and other countries. Microsoft®, Windows®, Windows® XP, and Windows NT® are U.S. registered trademarks
of Microsoft Corporation. UNIX® is a registered trademark of The Open Group.
Revision history
Publication dateEdition numberManufacturing part number
January 201465900-3310
September 201255900-2457
October 201145900-1970
May 201135070-6699
October 201025900-1262
September 201015900-1039
Page 3

Contents
1 Varieties of Cluster Test................................................................................5
CT Image................................................................................................................................5
CT Image using a network.........................................................................................................5
RPM........................................................................................................................................6
2 The Cluster Test GUI....................................................................................7
Starting Cluster Test...................................................................................................................7
Files generated by Cluster Test....................................................................................................7
Running cluster tests..................................................................................................................7
Configuration settings.........................................................................................................10
Running tests in a batch......................................................................................................11
Using scripts to run tests......................................................................................................12
Test descriptions.................................................................................................................14
Monitoring tests and viewing results..........................................................................................15
The nodes monitoring window.............................................................................................15
The test output window.......................................................................................................16
Performance analysis..........................................................................................................18
Test report.........................................................................................................................19
Checking the InfiniBand fabric..................................................................................................20
The Cluster Test toolbar menus..................................................................................................21
3 The accelerator test GUI............................................................................22
Starting accelerator tests..........................................................................................................22
Files generated by accelerator test............................................................................................22
Running accelerator tests.........................................................................................................23
4 Cluster Test procedure as recommended by HP.............................................26
Additional software.................................................................................................................26
Configuring Cluster Test when using RPM...................................................................................26
Accelerator test procedure.......................................................................................................27
The Cluster Test procedure.......................................................................................................29
5 The performance monitor...........................................................................33
The performance monitor utility................................................................................................33
The xperf utility......................................................................................................................35
6 Cluster Test tools.......................................................................................36
Hardware Inventory................................................................................................................36
Firmware Summary.................................................................................................................36
Server health check.................................................................................................................37
Excluding the head node from tests...........................................................................................38
Disk Scrubber........................................................................................................................39
7 Running tests in parallel.............................................................................41
8 Creating and changing per node files.........................................................42
An example per-node directory.................................................................................................42
An example cloned per-node directory......................................................................................42
9 NFS performance tuning...........................................................................43
10 Troubleshooting......................................................................................44
Detecting new hardware..........................................................................................................44
Troubleshooting Cluster Test.....................................................................................................45
11 Support and other resources.....................................................................46
Scope of this document...........................................................................................................46
Contents 3
Page 4

Intended audience..................................................................................................................46
Contacting HP .......................................................................................................................46
Before you contact HP........................................................................................................46
HP contact information.......................................................................................................46
Documentation feedback....................................................................................................46
New and changed information in this edition ............................................................................47
Related information.................................................................................................................47
Documentation..................................................................................................................47
Websites..........................................................................................................................47
Typographic conventions.........................................................................................................48
Customer self repair................................................................................................................48
A Useful files and directories.........................................................................50
B Utility commands......................................................................................51
analyze.................................................................................................................................51
apply_new_model_updates......................................................................................................51
archive_logs..........................................................................................................................51
checkadm..............................................................................................................................51
checkic..................................................................................................................................51
conrep..................................................................................................................................52
cpu_rate................................................................................................................................52
getMP...................................................................................................................................52
hponcfg................................................................................................................................52
ib_fabric_check......................................................................................................................52
inspect_ib_fabric.pl.................................................................................................................54
ipmitool.................................................................................................................................57
light......................................................................................................................................57
list_messages.........................................................................................................................57
pdsh.....................................................................................................................................58
run_cluster_script.pl.................................................................................................................58
setMP....................................................................................................................................58
C Sample test output....................................................................................59
CrissCross.............................................................................................................................59
Test4.....................................................................................................................................61
Pallas....................................................................................................................................62
Stream..................................................................................................................................65
Disk Test................................................................................................................................67
Linpack.................................................................................................................................68
D Documentation feedback...........................................................................72
Glossary....................................................................................................73
Index.........................................................................................................74
4 Contents
Page 5

1 Varieties of Cluster Test
All the Cluster Test varieties are designed to:
• verify the validity of a cluster configuration.
• test the functionality of the cluster as a whole, with emphasis on testing interconnect, including
the interconnect switch, cabling, and interface cards.
• provide stress testing on the cluster nodes.
Cluster Test detects failures of hardware and network connections to the node level early, so the
failed components can be replaced or corrected before cluster software (HP Insight Cluster
Management Utility (CMU), XC, Scali, Scyld, etc.) installation is started. This makes cluster software
integration much easier and faster, particularly on a complex solution with several hundred nodes.
Cluster Test is available in the following versions:
• Image
• RPM
• Ctlite
The Cluster Test Image and RPM versions have a common GUI and suite of tests. Ctlite is a
lightweight text-based CLI version.
For the requirements of each version of Cluster Test, see the HP Cluster Test Installation Guide
available at http://www.hp.com/go/ct-docs.
CT Image
Cluster Test Image is installed on one or more head nodes by means of a DVD or USB media. This
method destroys any information on the head node's installation hard drive. The Cluster Test Image
compute node installation uses a diskless setup, which does not destroy or alter any information
on the compute nodes.
For Cluster Test Image it is recommended that even when the cluster solution comes with disk drives
in its compute nodes, the diskless test set up should be followed, for both time savings during cluster
test and for simplicity.
The Image version of Cluster Test:
• allows you to configure and test a High-Performance Computing (HPC) cluster without being
• contains CentOS, libraries, software packages, scripts, and CT GUIs.
• provides the ability to test and diagnose HPC cluster hardware that doesn't yet have an OS
• configures compute nodes in a diskless cluster environment – compute nodes are not altered
• requires installation on the head nodes' hard drives.
• may be distributed via DVD ISO image, USB flash drive, or over the network.
• allows compute nodes to boot over Mellanox 10GigE.
a Linux or cluster expert.
installed.
any way.
CT Image using a network
Cluster Test Image can be installed on a cluster using a network installation server. A network
installation server is a separate Linux server required to serve the Cluster Test Image. This server
must have an available NIC to serve the image, and run DHCP, TFTP, and NFS on this NIC. This
method is useful for installing Cluster Test on multiple head nodes.
CT Image 5
Page 6

RPM
Cluster Test RPM is installed on an existing cluster as an additional software package. The current
cluster settings are not modified. Once Cluster Test RPM is installed and set up, the testing process
is the same as Cluster Test Image. The RPM version of Cluster Test:
• is available as an RPM.
• allows someone with average computing skills to set up and test a High-Performance Computing
(HPC) cluster in very little time.
• contains software packages, scripts, and CT GUIs.
• does not include the Linux OS – you test the cluster using your existing OS. The RPM kit includes
binaries for RHEL6 and the equivalent CentOS releases.
• requires the OS, drivers, and other software already installed on each cluster node.
• is a good solution for clusters that are already up and running.
• currently supports only X86–64 systems.
• includes accelerator tests for Nvidia GPUs.
Cluster Test RPM files are available from www.hp.com/go/ct-download.
The Cluster Test RPM file is Clusterx64_rpm-vx.x-XXXX.bin.
6 Varieties of Cluster Test
Page 7

2 The Cluster Test GUI
Starting Cluster Test
The entire suite of cluster tests can be invoked through the Cluster Test interface. Start Cluster Test
with the command
# /opt/clustertest/bin/testnodes.pl
A directory for Cluster Test output messages will be created under /opt/clustertest/logs,
if it does not already exist. Sequencing will be set to avoid conflict with any other testnodes.pl
processes already running. See “Running tests in parallel” (page 41) for important information
regarding running multiple cluster tests.
NOTE: Make sure the X server is running and the DISPLAY environment variable is set
appropriately.
If you want to test accelerators, first validate the performance of the cluster with the procedures in
this chapter, then perform the accelerator tests described in “The accelerator test GUI” (page 22).
NOTE: Accelerator tests are only available with the RPM version of Cluster Test.
Files generated by Cluster Test
As you run the tests, output is collected in log files. You can set the log directory using command
line options. For example, testnodes.pl <logdirectory>.
Upon each new invocation of Cluster Test, a new directory is generated under /opt/
clustertest/logs with the current timestamp (year/month/day/time). The log, error, and
script files are saved in this directory.
NOTE: Remove all files when you are finished testing with Cluster Test.
Running cluster tests
Cluster Test includes the following test buttons:
• CrissCross
• Test4
• Pallas
• Stream
• Disk Test
• Linpack
• Netperf
• InfiniBand verbs tests (ib_send_bw)
Tests are described in detail in “Test descriptions” (page 14).
Starting Cluster Test 7
Page 8
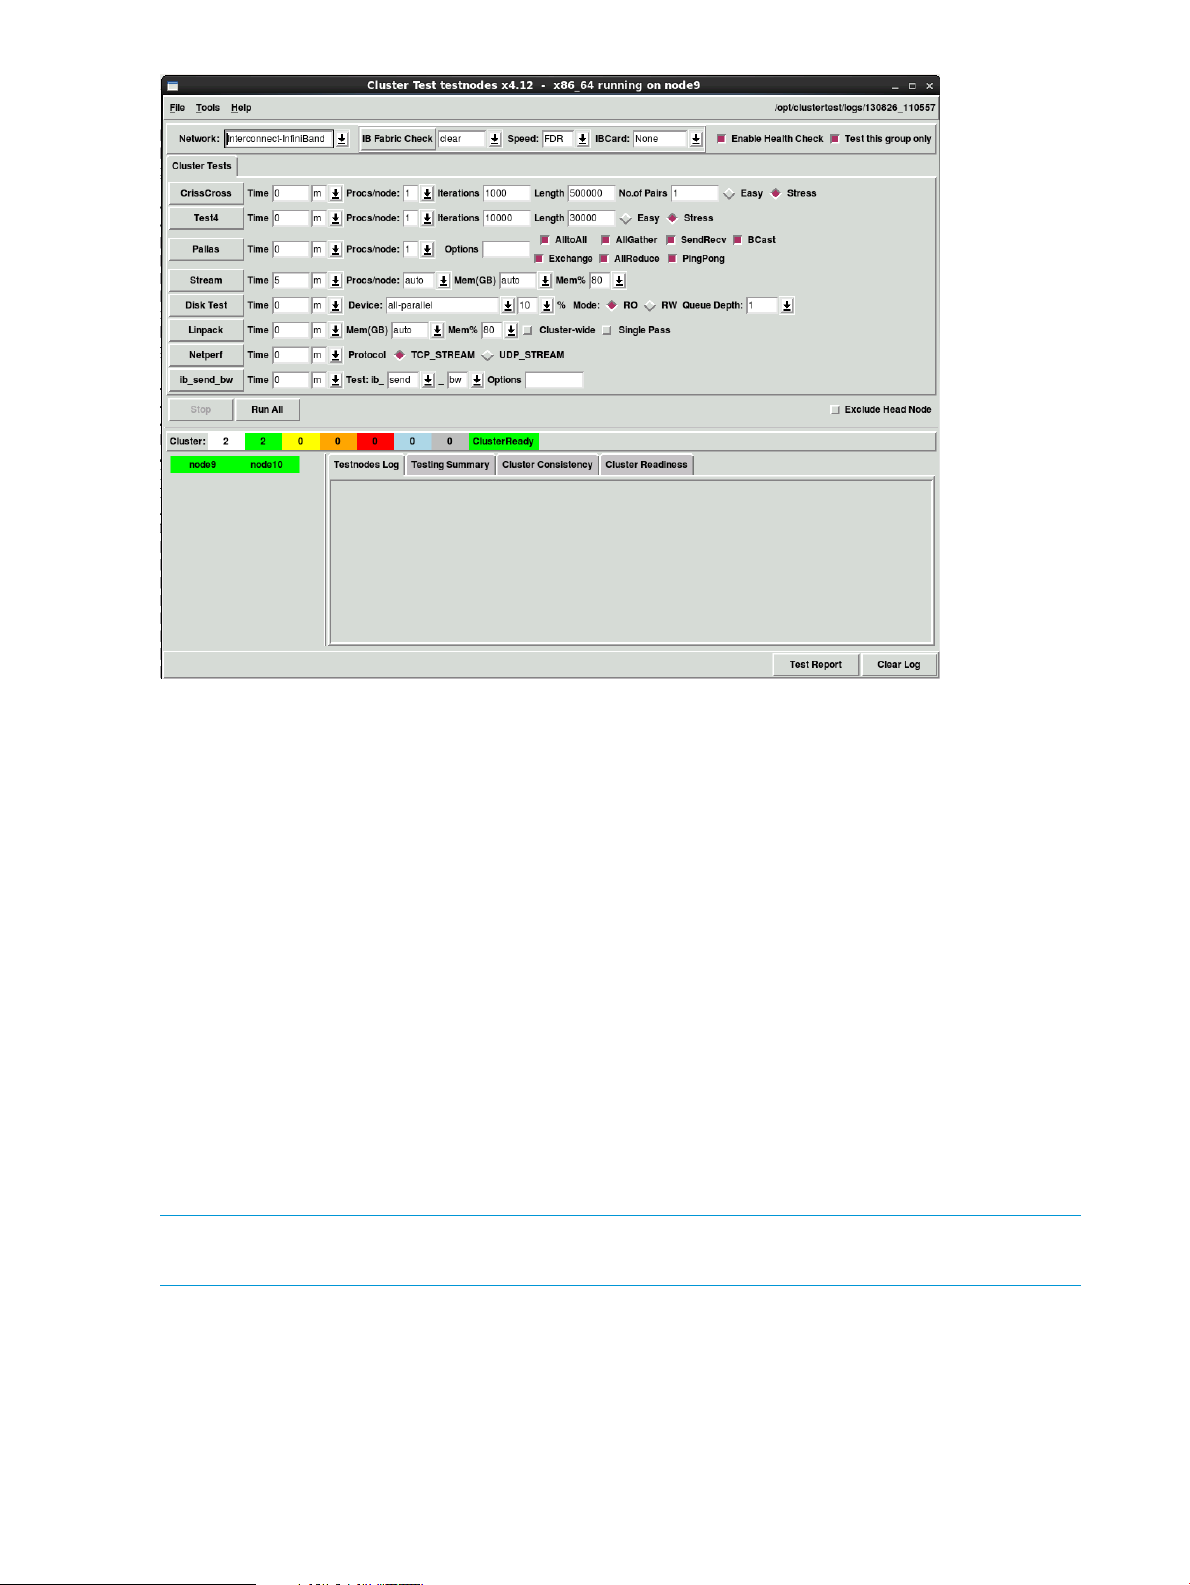
To start an individual test, select that test's button. Test parameters are on the same row as the test
button.
For each of the tests, the run time can be specified in minutes (m), hours (h), or days (d). The default
run time of 0 will run the test for one pass. Normally, the default values are good enough and
won't need to be changed. However, in a large cluster solution, these values might need to be
changed to reduce the load on CPUs or shorten the test time.
When a test is running, all test buttons are disabled (in grey color).
After each test, all nodes in the test are checked for disk and memory errors – the test fails if the
error count exceeds the threshold.
The Network: pull-down is at the top of the interface. This is for selecting the cluster interconnect
type: Admin, Interconnect, or Alternate networks. The Admin network can be a GigE or 10GigE
network, the Interconnect and Alternate networks may be GigE, InfiniBand, 10GigE, or None, if
they have not been configured. For example, if you are testing an InfiniBand-based cluster with
one IB connection per node, you will see Admin, and Interconnect-InfiniBand as options in the
pull-down. If you are testing a dual-rail IB cluster, you will see Admin, Interconnect-InfiniBand,
Alternate-InfiniBand, and Combined-InfiniBand. In this case, Interconnect-InfiniBand will test the
first rail, Alternate-InfiniBand will test the second rail, and Combined-InfiniBand will use both rails
for testing.
NOTE: Only MPI applications can use both rails for testing; the Ibverbs tests (ib_send_bw,
ib_read_bw, etc.) and Netperf will only work on one rail at a time.
The Stop button halts the current test. When no test is running, this button is disabled.
The Test this group only check box allows tests to be run on either a group of nodes or on the
whole cluster. If this box is checked, the tests will run on the group of nodes that includes the head
node and compute nodes under its control. If this box is unchecked, the tests run on the whole
cluster. When there is only one head node in the cluster solution, Test this group only has no effect.
8 The Cluster Test GUI
Page 9

The Clear Log button clears the Cluster Test interface output window. The Test Report button allows
users to generate a summary pass/fail report from all test runs. The test report can be found in the
current test directory under /opt/clustertest/logs.
Running cluster tests 9
Page 10
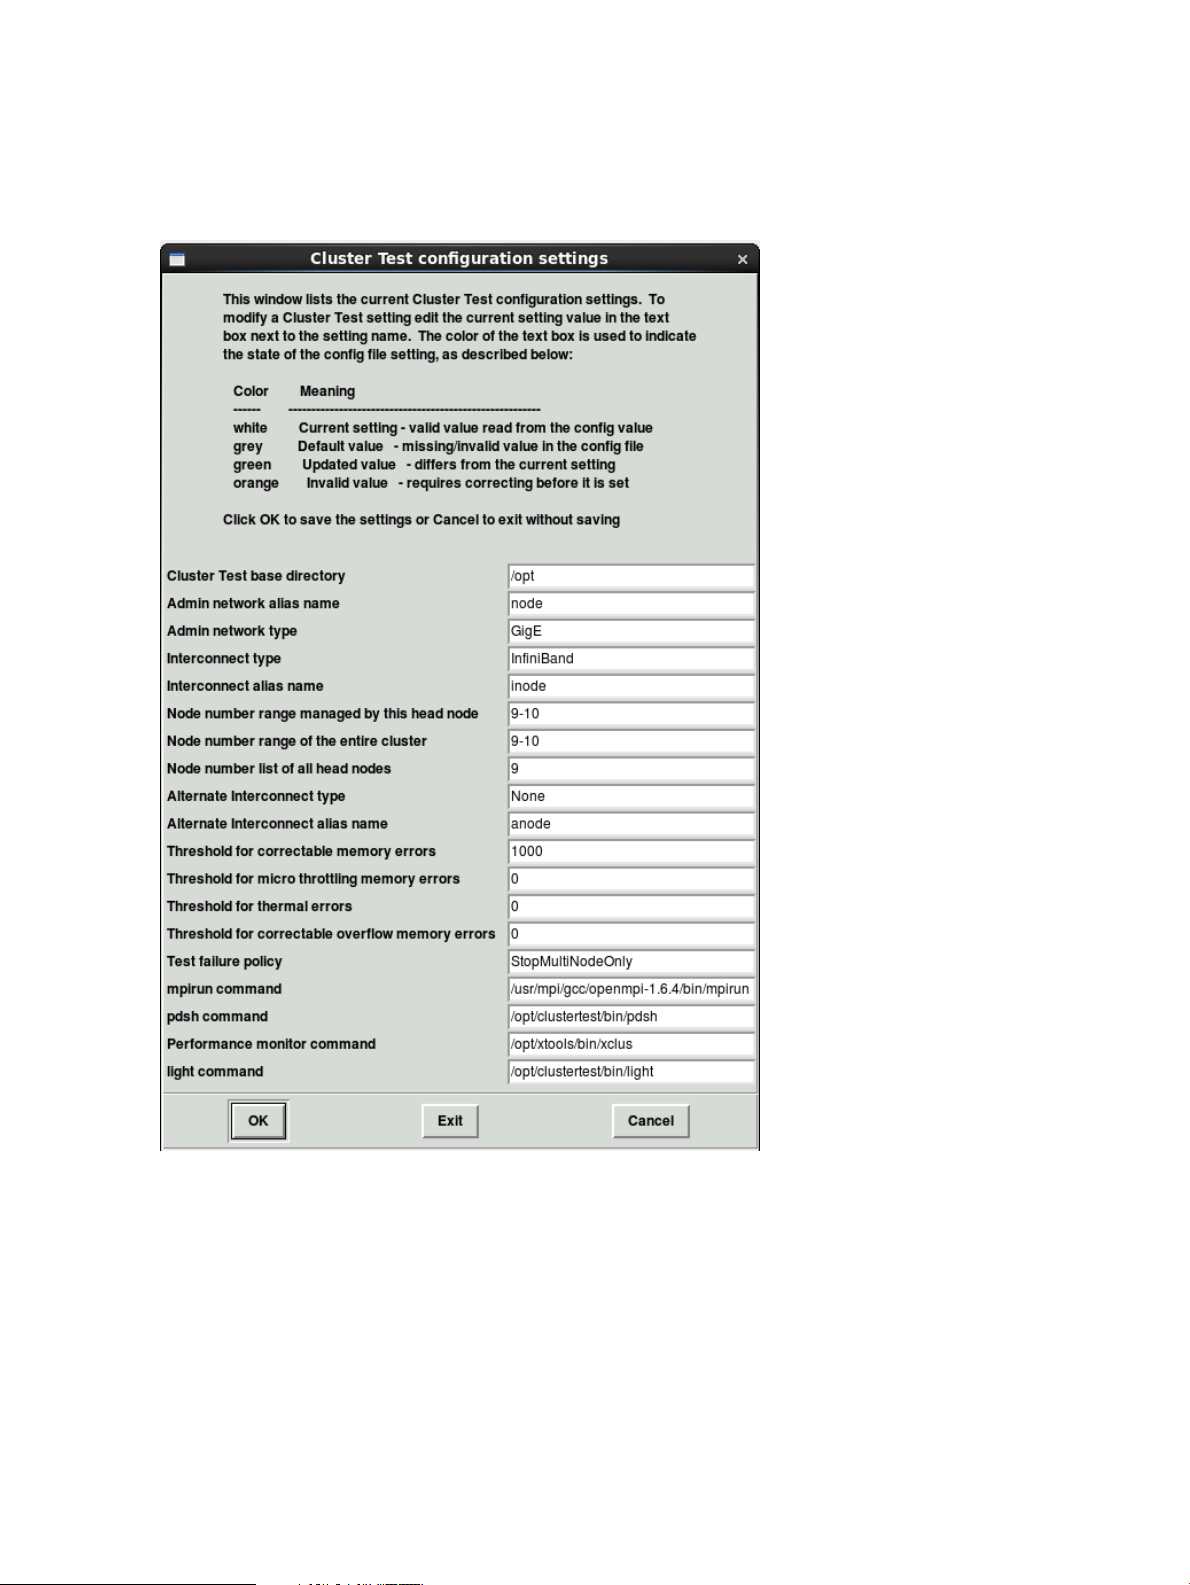
Configuration settings
Cluster Test provides an interface to modify the Cluster Test configuration settings. The window
displays the current configuration settings and allows you to modify any setting. You can access
the Cluster Test configuration settings dialog box from the Cluster Test toolbar: File→Config File
Settings .
This window displays the current admin and interconnect node name settings along with the range
of nodes being tested. Simply select a field and modify it to make any changes. The color of the
field will change to indicate if the updated setting is valid (green) or invalid (orange). The “Node
number range managed by this head node” setting is the range of nodes being tested when Test
this group only is selected on the Cluster Test interface. The “Node number range of the entire
cluster” setting is the range of nodes being tested when the Test this group only button is not
selected.
Both Open MPI and HP MPI may be used for the tests, provided they are installed. By default,
Open MPI is used. To use Open MPI, select File→Config File Settings... and edit the “mpirun
command” field to /usr/mpi/gcc/openmpi-<version>/bin/mpirun. Look in the /usr/
mpi/gcc file on your system to find what version number to use. You can change back to HP MPI
by changing the “mpirun command” field to /opt/hpmpi/bin/mpirun.
10 The Cluster Test GUI
Page 11
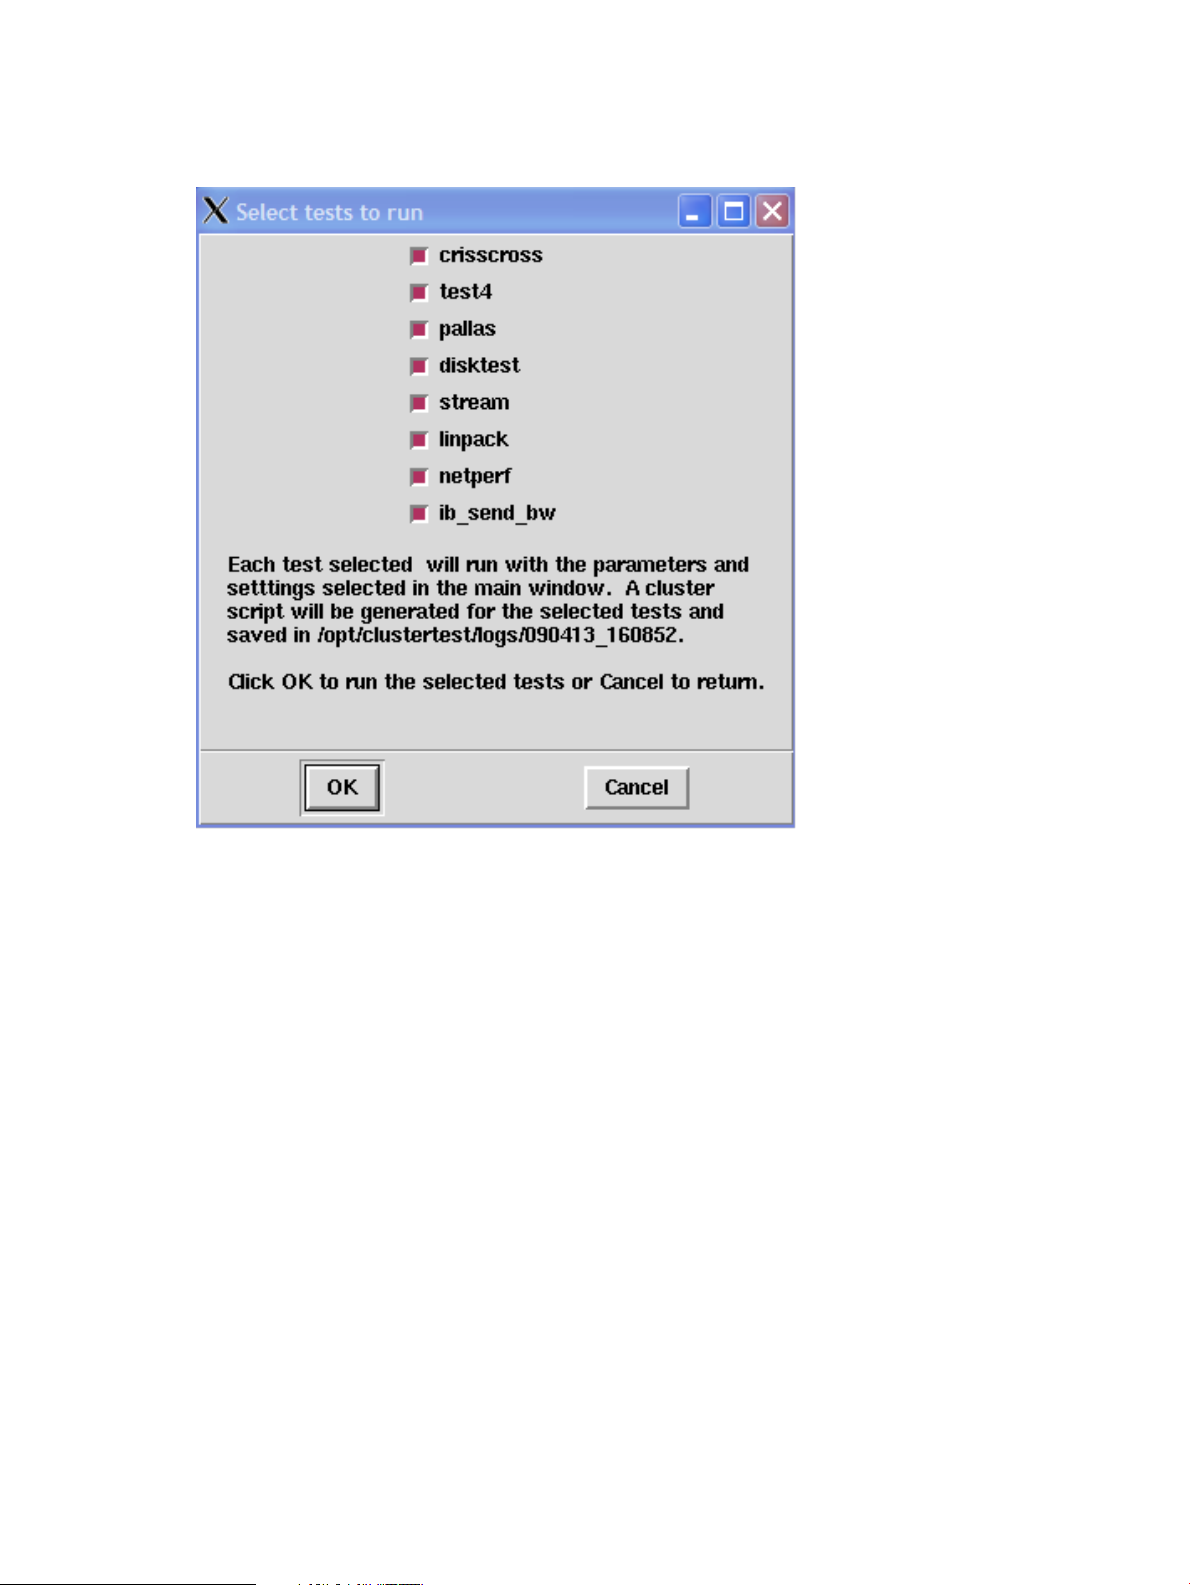
Running tests in a batch
The Run All button runs a selection of tests serially. Choose the tests for the batch from the Run All
dialog box.
Individual tests can be selected by checking or un-checking the boxes.
The order test are run in may be changed by editing the Run Order field. This number expresses
the ascending order in which tests will be run. To change the order, edit this number to a lower
or higher value. Duplicate numbers are allowed. For example, if you select only the tests CrissCross,
Test4, and Pallas, and change the CrissCross Run Order to 3, the run order may be Test4, CrissCross,
and Pallas, or it may be Test4, Pallas, and CrissCross.
Selected tests are run serially in the specified order in a loop for an iteration, a duration, or
continuously. Based on the selected Run Options, the test run will loop:
• iteration – for the number of times specified in this field. The default is 1 iteration.
• duration – for the duration in hours and minutes starting when the dialog box OK button is
clicked. The test run stops when the time is expired. Specify the duration in hours and minutes
using the form HH:MM in 24-hour-clock format. Days can be expressed in 24 hour units. For
example, 3 days is 72 hours.
• continuous – continuously until the Stop button is clicked in the main window.
The dialog box lists the output file names for all the tests. Each selected test will run and a cluster
script will be saved in the current directory. When one of the tests is running, the Run All button is
disabled.
The ib_send_bw test is disabled if InfiniBand is not selected.
Running cluster tests 11
Page 12

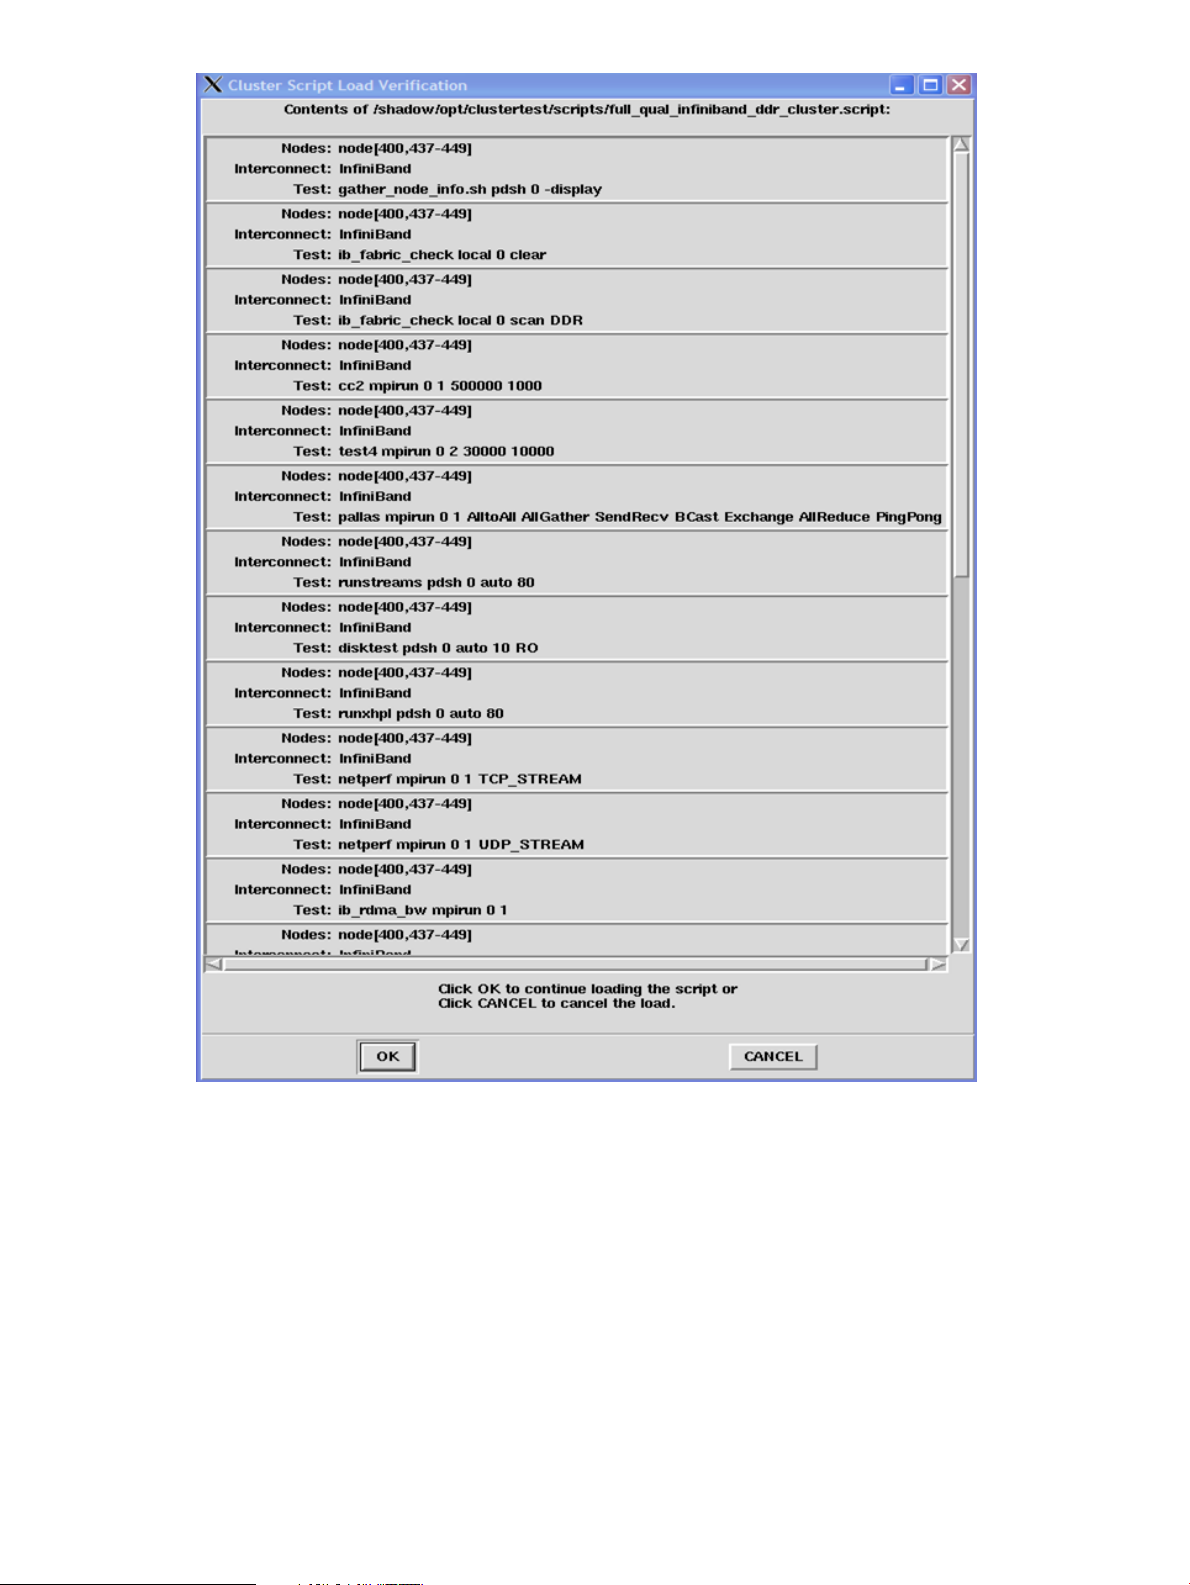
Using scripts to run tests
The Load Cluster Script window (File Load Script) allows you to repeat a previous test. Each time
a test is run, the test parameters selected in the GUI are saved to a script file. This script file is then
added to a cluster script file that also includes the selected interconnect and the list of active nodes
at the time of the test’s invocation. A single cluster script can contain one or more test scripts, as
is the case when Run All is used. When a cluster test script is loaded and run, neither a new test
script nor a new cluster script is created. By default, the scripts are written to and listed from the
current logs directory.
After a script is selected, a confirmation window is displayed listing the tests that will be run by
that cluster script. You have the option to continue (OK) or cancel (CANCEL) loading the selected
cluster script.
12 The Cluster Test GUI
Page 13
The run_cluster_script command basically does the same thing as File Load Script, except
you can use run_cluster_script to run tests on independent nodes in the same cluster in
parallel. See “Running tests in parallel” (page 41) for important information regarding running
multiple cluster tests.
Running cluster tests 13
Page 14

Test descriptions
CrissCross
In the CrissCross test, nodes take turns sending data packets to every other process. This test is
used to determine the maximum point-to-point bandwidth for the interconnect network. CrissCross
can be run in Easy or Stress mode. The Easy mode provides a basic connectivity test with small
packets. In this mode the actual transfer rates will vary significantly from node to node because of
the small packet size. The default parameters are 1 process per node and 300 bytes for an Easy
test. Once the Easy test passes, the Stress option should be run. A much larger packet, depending
on the interconnect type, is required for a network Stress test. The Stress test is expected to return
true bandwidth values, which are generally greater than 3000 MBs for a QDR IB network.
Test4
In this test, the nodes send small packets to all other nodes at the same time. This test basically
floods the network with data, and in the process also stresses the CPUs. The default number of
CPUs per node is the number of processors (cores) the node has. It is recommended that this test
should not be run in a large group of nodes, because the time it takes to run the test grows
exponentially with the number of nodes. The time setting for Test4 limits the runtime so a setting of
3 hours takes close to 3 hours regardless of how many iterations were specified. Test4 can be run
in Easy or Stress modes. In easy mode, the test uses smaller data packets and is intended to verify
basic connectivity of the selected network. Stress mode is a much longer test that more fully verifies
network performance.
Pallas
This is the industry standard test suite formerly known as Pallas, now known as IMB (Intel MPI
Benchmark). Only a few of the original tests are available: AllGather, SendRecv, Bcast, Exchange,
AllReduce, AlltoAll, and PingPong. You may select individual tests with their check boxes. The
number of processors (cores) can be selected. Most of the current platforms have up to 4 cores,
maximum.
Stream
This test is a standard memory benchmark. Depending on the hardware configuration, the memory
size selected for this test should be a little less than the actual memory size on the node. Otherwise,
the test will take a very long time to complete. The default setting, auto, will select an amount of
memory based on the available memory on each node. You can control the percentage of memory
used with the Mem% pull-down. You can also explicitly select a different amount of memory using
the Mem(GB) pull-down. You can also select the number of CPUs used in this test.
Disk test
This test takes the parameters:
• Disk device
• Percentage of the disk to be tested
• Queue Depth
For Queue Depth:, the default value of 4 will produce bandwidth measurements that are more
stable than using a queue depth of 0. If auto is entered for Device, then the first block device will
be automatically selected. If all or all-parallel is entered for Device, then all block devices on
each node will be tested in parallel. If all-sequential is entered for the device, then all block devices
on each node will be tested on at a time. On the head node (the node serving NFS to the group)
the test will run a read-only (RO) test. On all other nodes, the test can be run read-only or read-write
(RW).
14 The Cluster Test GUI
Page 15

Linpack
Linpack is an industry standard cluster performance test used for submitting numbers to the Top
500 Supercomputers list. The test is implemented to run separately on each node using all CPU
cores and about 80% or less of memory. Two parameters need to be specified: Mem(GB) and
Mem(%). Mem(GB) is the total memory in gigabytes on each node, and Mem(%) is the percentage
of total memory used in the test. By default, this test will not give cluster-wide performance, but it
exercises CPU and memory at the same time, and it provides another set of numbers you can use
to compare the performance among the cluster nodes. The amount of memory required is set to
auto by default – this will run each node at the specified percentage of the memory available. For
example, using auto and 80%, a 2 GB node will use 80% of 2 GB, while a 16 GB node will use
80% of 16 GB. The amount of memory used on any head node is adjusted to allow for increased
memory consumption on head nodes. The default Linpack test run performs three iterations of the
test using the same input data for each run. To limit the number of iterations to one, select the Single
Pass option.
Netperf
Netperf is a benchmark used to measure network performance (for example, GigE and 10GigE).
It currently provides tests for unidirectional throughput. You must select TCP (TCP_STREAM) or UDP
(UDP_STREAM) protocol. The first half of the selected nodes receives messages from the second
half. For example, in a 10 node cluster, node 5 sends to node 0; node 6 sends to node 1; node
7 sends to node 2; and so on. An even number of nodes must be selected to run this test.
InfiniBand verbs tests
This is a collection of InfiniBand verbs bandwidth/latency performance tests provided with OFED.
Verbs-layer performance is usually higher than what is reported by the MPI-level tests, such as
Pallas. The InfiniBand verbs test (shown in the GUI as ib_send_bw) is selected by choosing the
test name from the first two spin boxes. These selections will update the test button used to run the
test. Test options can be specified in the Options box. Please refer to the documentation for each
individual InfiniBand verbs test for the available options. Some of the useful options include –a to
include all message sizes, and –b for bi-directional test. The node settings are identical to the
Netperf test above. These tests are only available with the InfiniBand interconnect on non-QLogic
IB hardware.
Deviation test
This test measures the consistency of bandwidth and latency between nodes using MPI over IB.
The node settings are identical to the Netperf test above. This test is only available with the InfiniBand
interconnect on QLogic IB hardware.
Monitoring tests and viewing results
The nodes monitoring window
The bottom left window on the Cluster Test interface is the nodes monitoring window. It can be
resized to give more space to the test output window.
This window indicates whether a node is active (online) or inactive (offline).
Monitoring tests and viewing results 15
Page 16
An overall cluster node status bar, Cluster:, indicates the total number of nodes in each state as
listed below:
• White: currently configured for testing
• Green: active admin and interconnect networks
• Yellow: only the admin network is active
• Orange: only the interconnect network is active
• Red: no active networks
• Blue: status update is pending
• Gray: excluded from this testing
A node can be disabled (removed from the test) or enabled (added to the test) by clicking on the
node name. If a node is enabled, clicking on its node name disables it. In reverse, if a node is
disabled, clicking on its node name enables it. When a node is disabled, its node name is shown
in gray color. Right-clicking on any active node name and holding it will pop up a menu as follows:
• UID – turns on/off the UID of the node
• Terminal – opens a terminal to the node
• Reboot – reboots the node from the OS
• Power Off – powers off the node from the OS
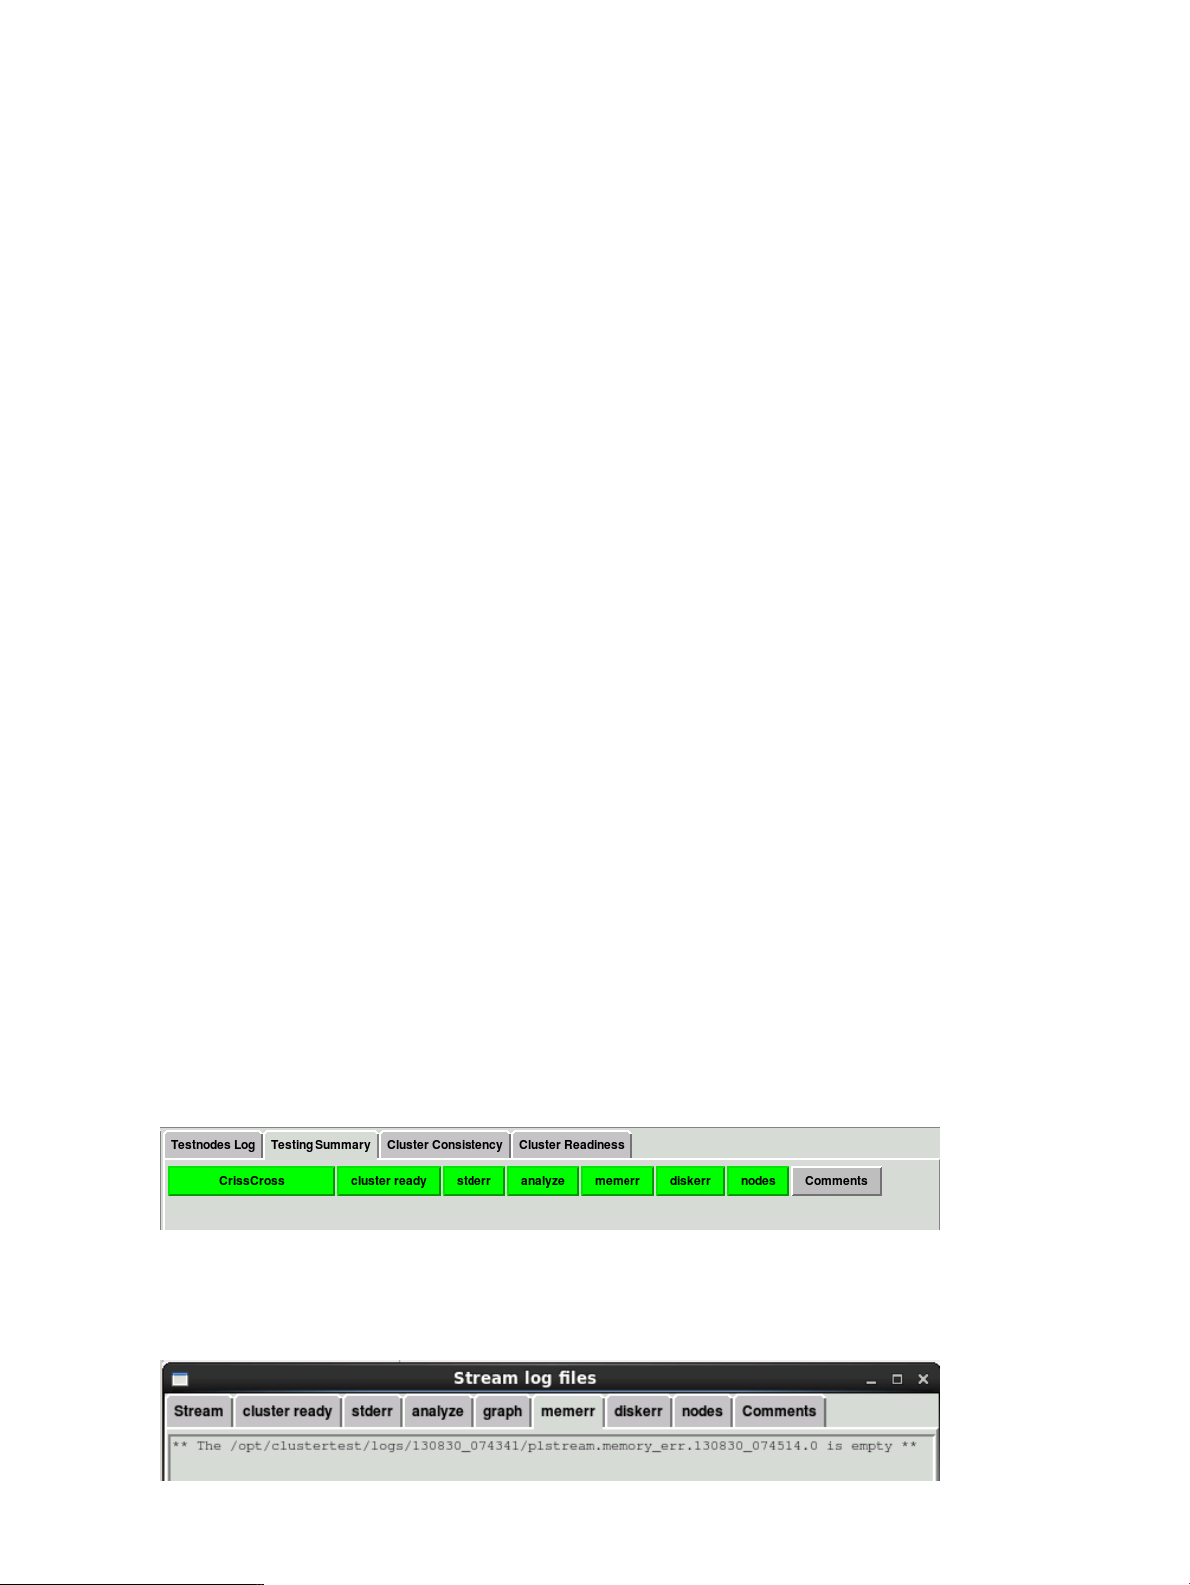
The test output window
The bottom right window on the Cluster Test interface is the test output window. It has four tabs:
• Testnodes Log – All tests display results in this window while they run. You can save the contents
of this window by clicking Save Log, then entering a file name.
• Testing Summary – Use this to track test progress. Progress is indicated by color: yellow
indicates the test/check is in progress; green indicates the test/check is complete. The newest
run is at the top.
• Cluster Consistency – This tab collects information from all the nodes in the cluster into categories
like Model, ILO/MP, BIOS, Processors, Memory, Network, Storage, Location, and so on. The
categories are displayed with a pass (green) or fail (red) status. Pass or fail is determined by
matching the data fields for each node in each category. Nodes are sorted by matching fields.
Clicking on one of the categories displays its details in a pop-up dialog box.
• Cluster Readiness – This tab verifies that all enabled nodes are up and BIOS hyper-threading
is disabled on all the nodes. A Cluster Readiness failure status in any aspect is used to mark
CT tests as failed if cluster ready status is not green.
You can customize the displayed output for a particular test by selecting the test name (CrissCross
in this example), cluster ready, stderr, analyze, memerr, diskerr, nodes, or Comments. An example
of memerr output is shown below.
16 The Cluster Test GUI
Page 17
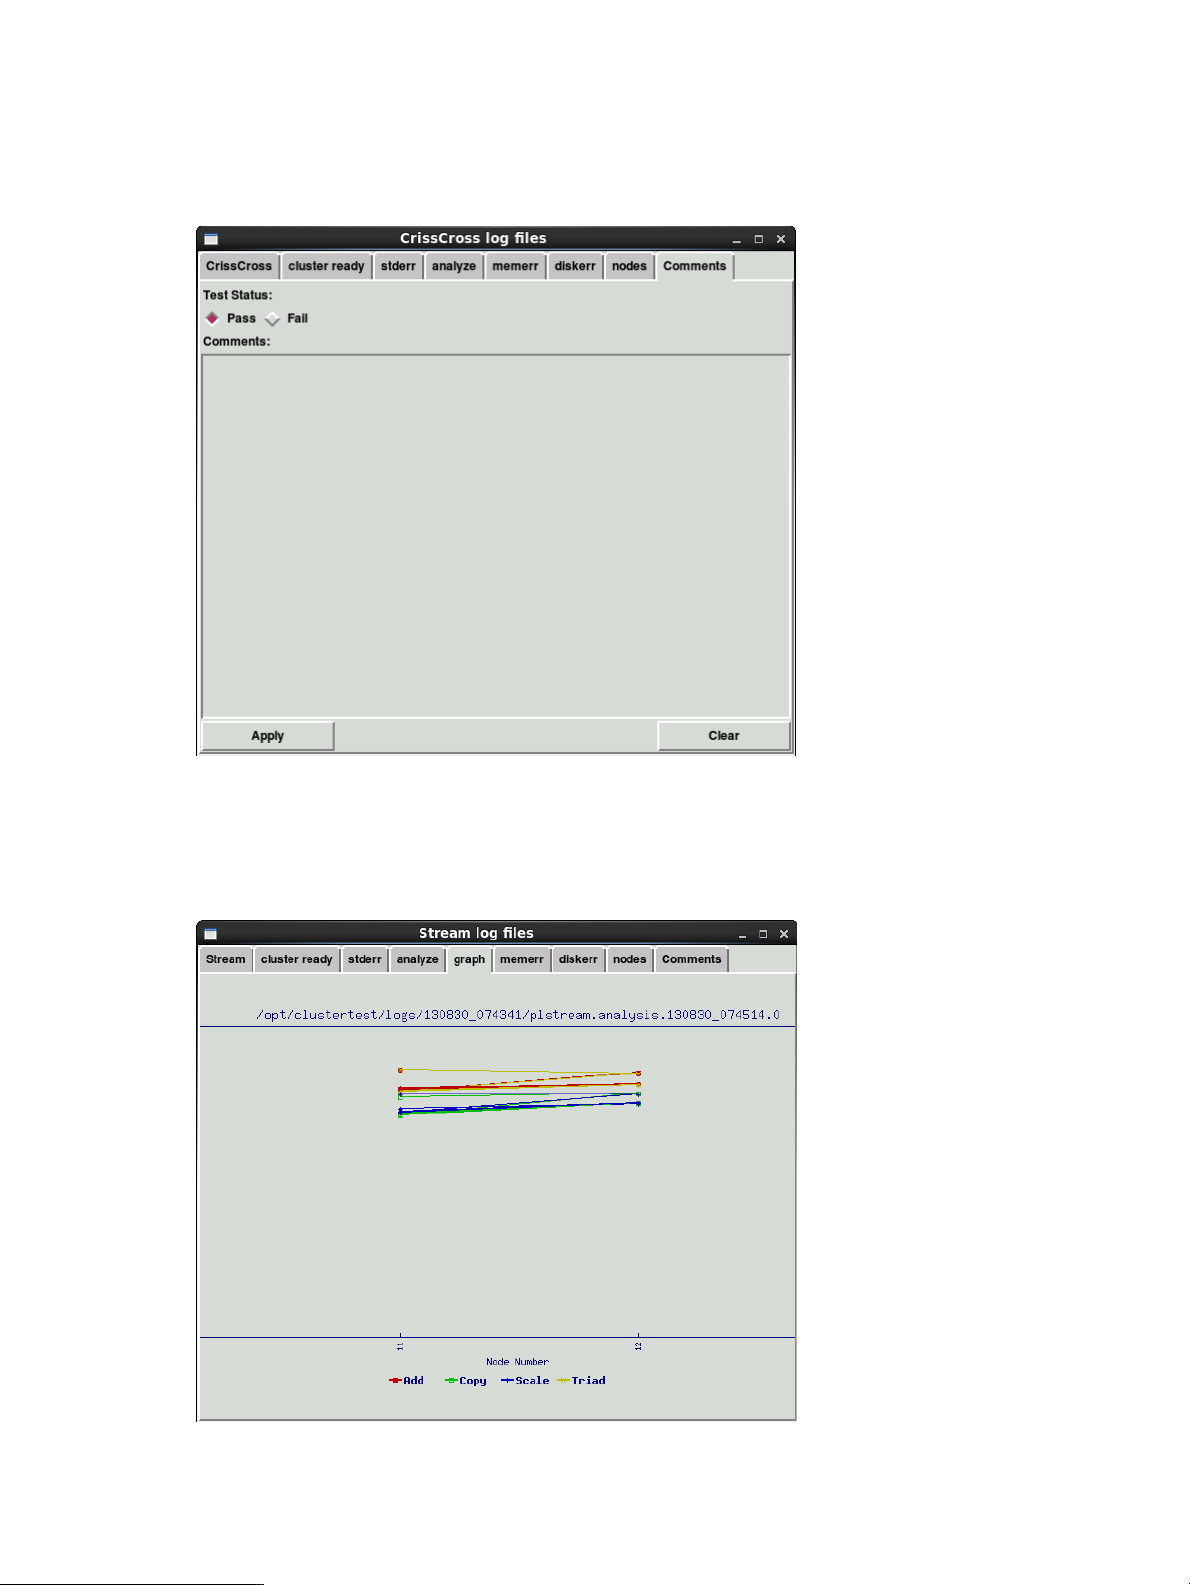
The Comments button allows you to override the test status (Pass or Fail) and enter a comment
describing why that status better reflects the actual results. When a test status is overridden, the
Comments button on the Testing Summary display changes from grey (no comments or override)
to whatever test status the user chose, as does the test name button. The check buttons (stderr,
analyze, memerr, and diskerr) will continue to reflect their original status.
Select Apply to set the selected status. Select Clear to restore the original test status, thus eliminating
the override.
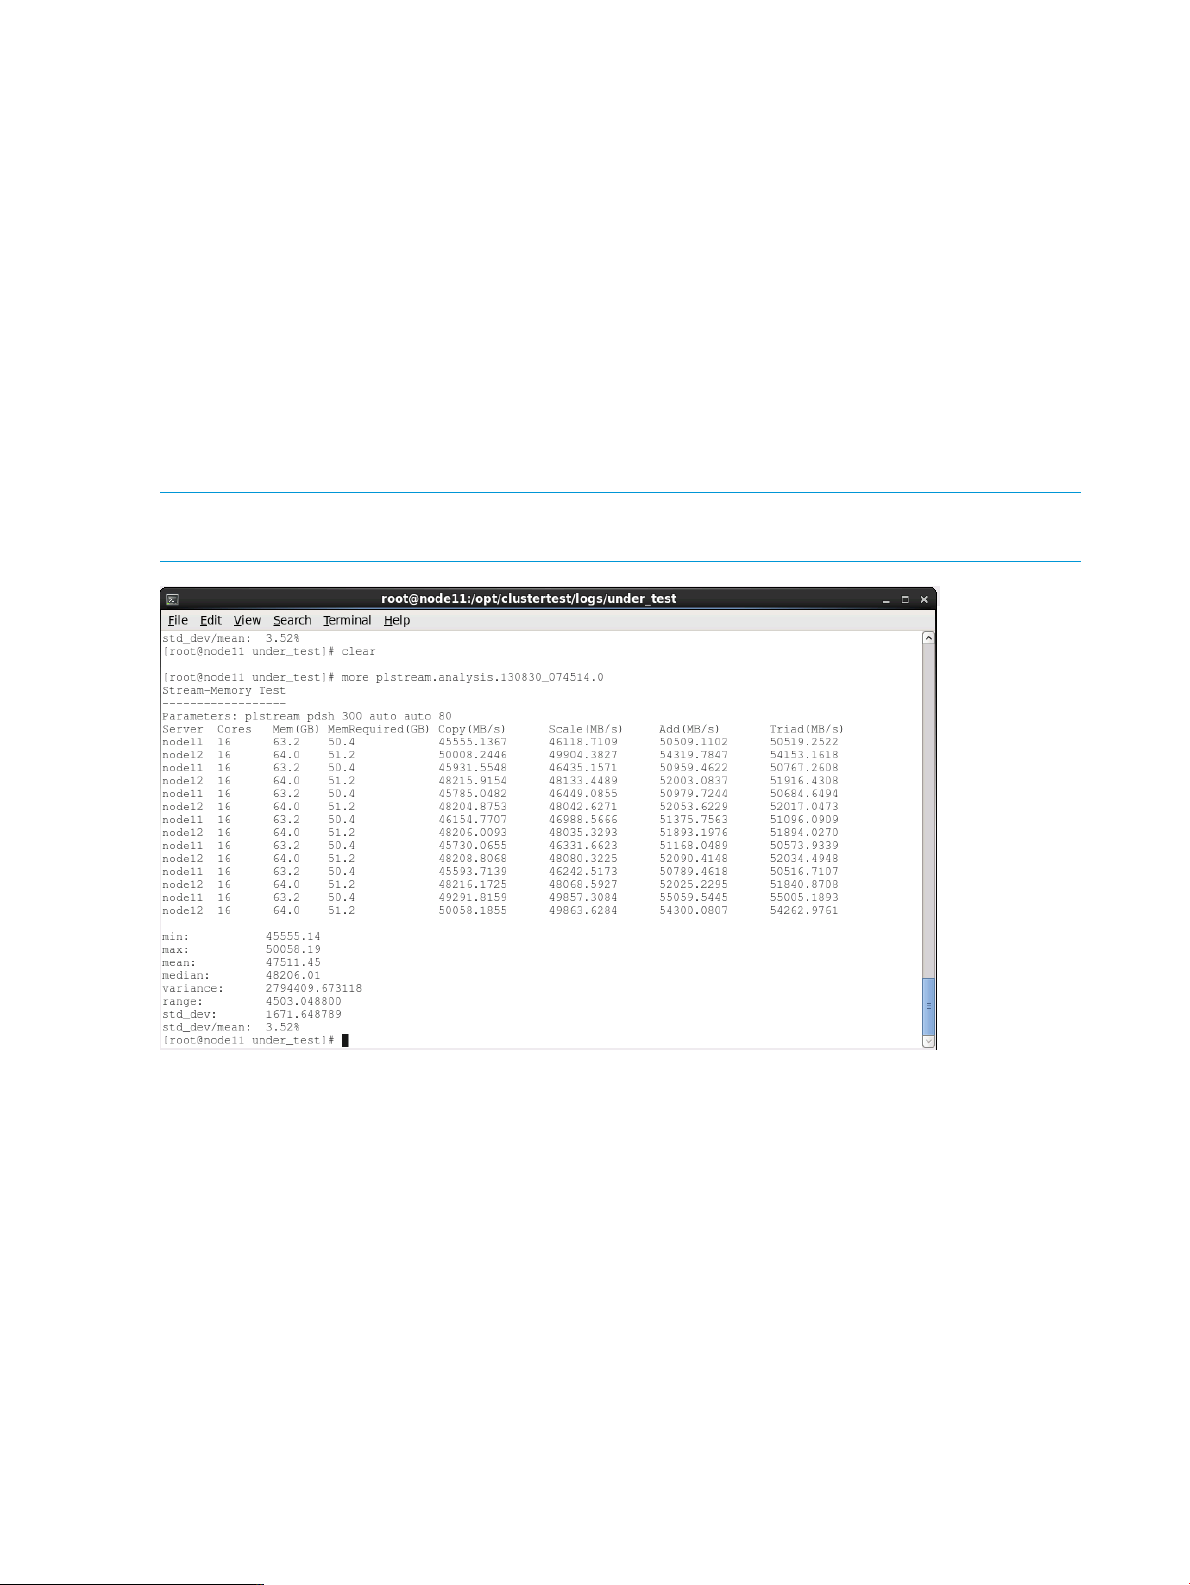
If you run a Stream test, Disk Test, or Linpack test, a graph tab is also available. An example graph
is shown below.
Monitoring tests and viewing results 17
Page 18
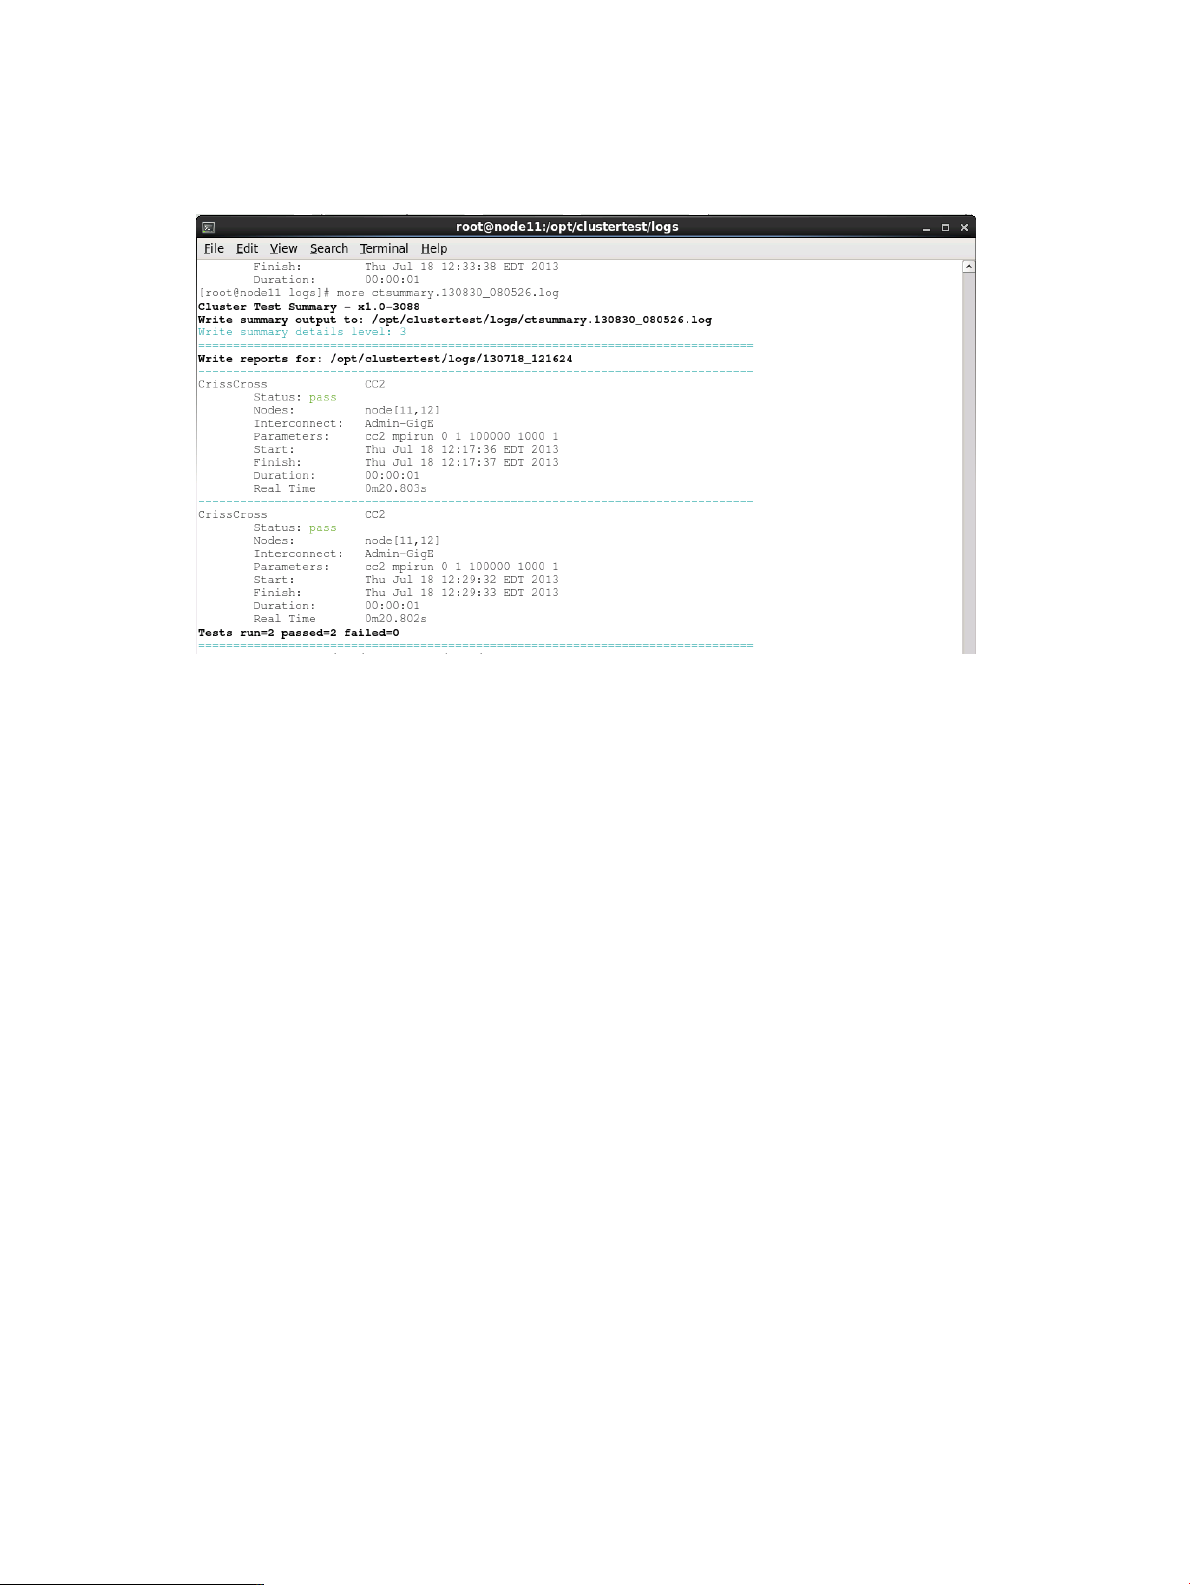
Performance analysis
After a test has completed, the analyze tool (see “Utility commands” (page 51)) runs on the test
output. The analyze tool compares the performance of all tested nodes to the mean value, and
identifies the nodes outside the acceptable range. The performance of each node is also compared
to the standard deviation. The full analysis is saved to a analysis log file (for example
090406_070956_runstreams.analysis) in the current logs directory. Currently, only
CrissCross, Stream, Linpack, Disk Test, Netperf, InfiniBand Verbs Test, and Pallas Test have
performance analyses.
If the performance of some nodes is less than the mean value by three standard deviations, these
nodes are marked as outside the acceptable range. The nodes outside the acceptable range are
included in the analysis summary. In cases where a large standard deviation is detected, a warning
is issued – you should review the analysis file in order to detect nodes with lower performance.
For Stream, Disk Test, and Linpack, a graphical view of the analyze results is generated. It can
be viewed by selecting the graph tab from the Testing Summary window as described in “The test
output window” (page 16).
NOTE: For the analysis to be meaningful, it’s recommended you run it on a minimum of
approximately 20 homogeneous nodes.
Although multiple values may be parsed from the log file during analysis, only the following values
are used for reporting the statistical information and test run performance:
• CrissCross: interconnect bandwidth
• Stream: memory bandwidth; only Copy bandwidth is used for summary analysis
• Linpack: floating-point performance (in gigaFLOPS)
• Disk Test: disk bandwidth (read or write)
• Netperf: network bandwidth (TCP or UDP)
• InfiniBand verbs tests: InfiniBand bandwidth (average and peak) and latency (typical, best
and worst)
• Pallas: interconnect bandwidth and time taken (minimum, maximum and average)
The analyze tool can also be used from the command line. See “Utility commands” (page 51)
for details.
18 The Cluster Test GUI
Page 19
Test report
The Test Report button generates a summary pass/fail report from all test runs. The test report can
be found in the current test directory under /opt/clustertest/logs. An example of a test
report is shown below.
Monitoring tests and viewing results 19
Page 20
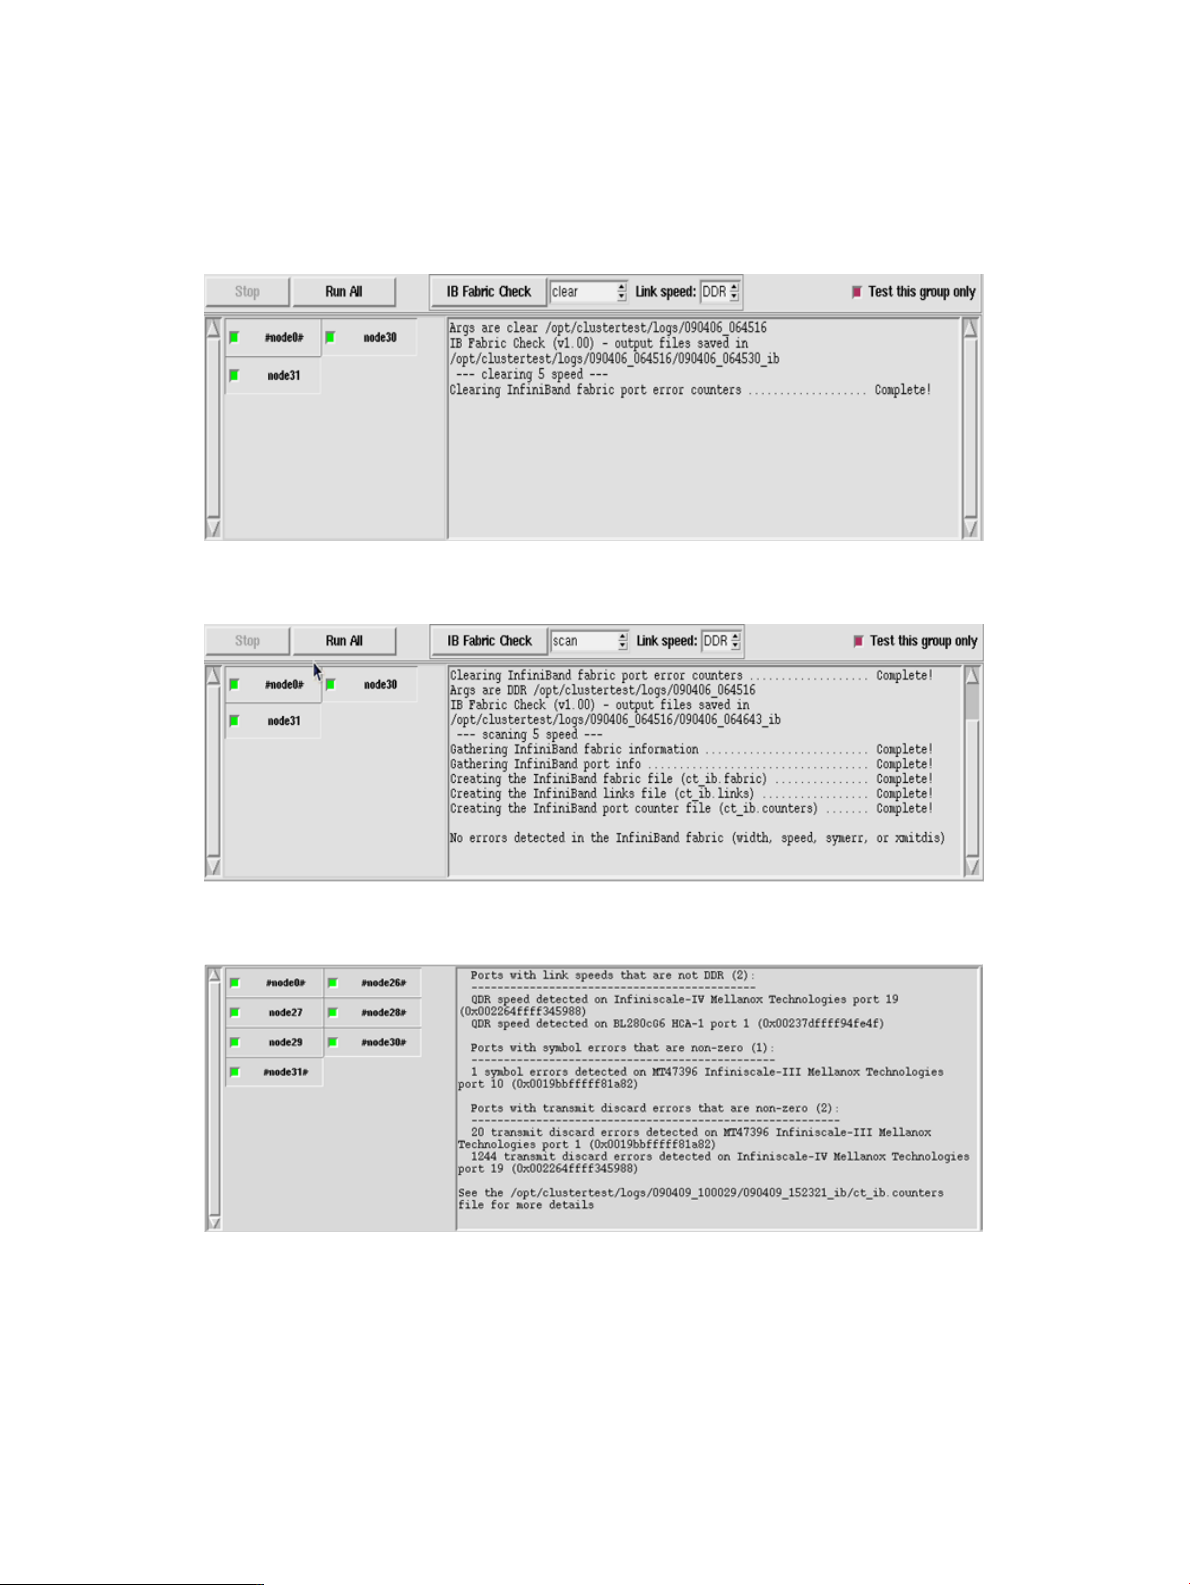
Checking the InfiniBand fabric
The IB Fabric Check allows you to clear and scan the InfiniBand fabric for errors. The
ib_fabric_check utility uses scripts provided with the OFED drivers to gather information about
the InfiniBand fabric and clear the port counters. See “Utility commands” (page 51) for more
details, including sample log files. The recommend usage is as follows:
1. Select the appropriate link speed and clear the fabric.
2. Run the initial scan of the fabric.
3. Run the tests and then scan the fabric again to check for InfiniBand fabric errors.
20 The Cluster Test GUI
Page 21

The Cluster Test toolbar menus
The menus File, Tools, and Help are at the top of the Cluster Test interface.
Table 1 Cluster Test toolbar menus
This function has been deprecated.DebugFile
For Cluster Test RPM only. See “Configuration settings” (page 10).Config File Settings
Load Script
Performance MonitorTools
Hardware Inventory
Firmware Summary
Select a cluster script to run. See “Using scripts to run tests” (page
12).
Close the Cluster Test interface – tests continue running.Exit
Launches the Performance Monitor. See the HP Cluster Test Procedures
Manual for more information.
Allow all nodes in the group or cluster to be tested.Enable All
No nodes in the group or cluster will be tested.Disable All
Selects all active nodes for testing.Select Active
Selects all active nodes with good interconnect for testing.Select Active IC
Turns UID on for all nodes in the group or cluster.All UID ON
Turns UID off for all nodes in the group or cluster.All UID OFF
View and save a hardware inventory. For more information, see
“Hardware Inventory” (page 36).
View and save a firmware inventory. For more information, see
“Firmware Summary” (page 36).
Invoke the Forge data gathering script.Forge Cluster Inventory
Invoke the Intel Xeon Phi status display. Requires Xeon Phi.MIC Status Panel
Launches the Firmware Update utility.Firmware Update
Server Health
Disk Scrubber
Set date/time for all selected nodes to be the same as headnode time.Sync Node Time
Interface to report any Cluster Test issue to the support team.Report Problem
Opens window to display available server health data. For more
information, see “Server health check” (page 37).
Erases the disk contents of all compute nodes' hard disks by running
simple dd commands. For more information, see “Disk Scrubber”
(page 39).
Displays author information.InfoHelp
The Cluster Test toolbar menus 21
Page 22
3 The accelerator test GUI
IMPORTANT: Accelerator tests are only available with the RPM version of Cluster Test. The Image
version does not include accelerator tests.
Starting accelerator tests
NOTE: Make sure the X server is running and the DISPLAY environment variable is set
appropriately.
NOTE: Cluster Test will recognize and test nodes with one to eight GPU cards.
Start accelerator tests with the command
# /opt/clustertest/bin/testnodes.pl -gpu
or
# testnodes.pl -gpu
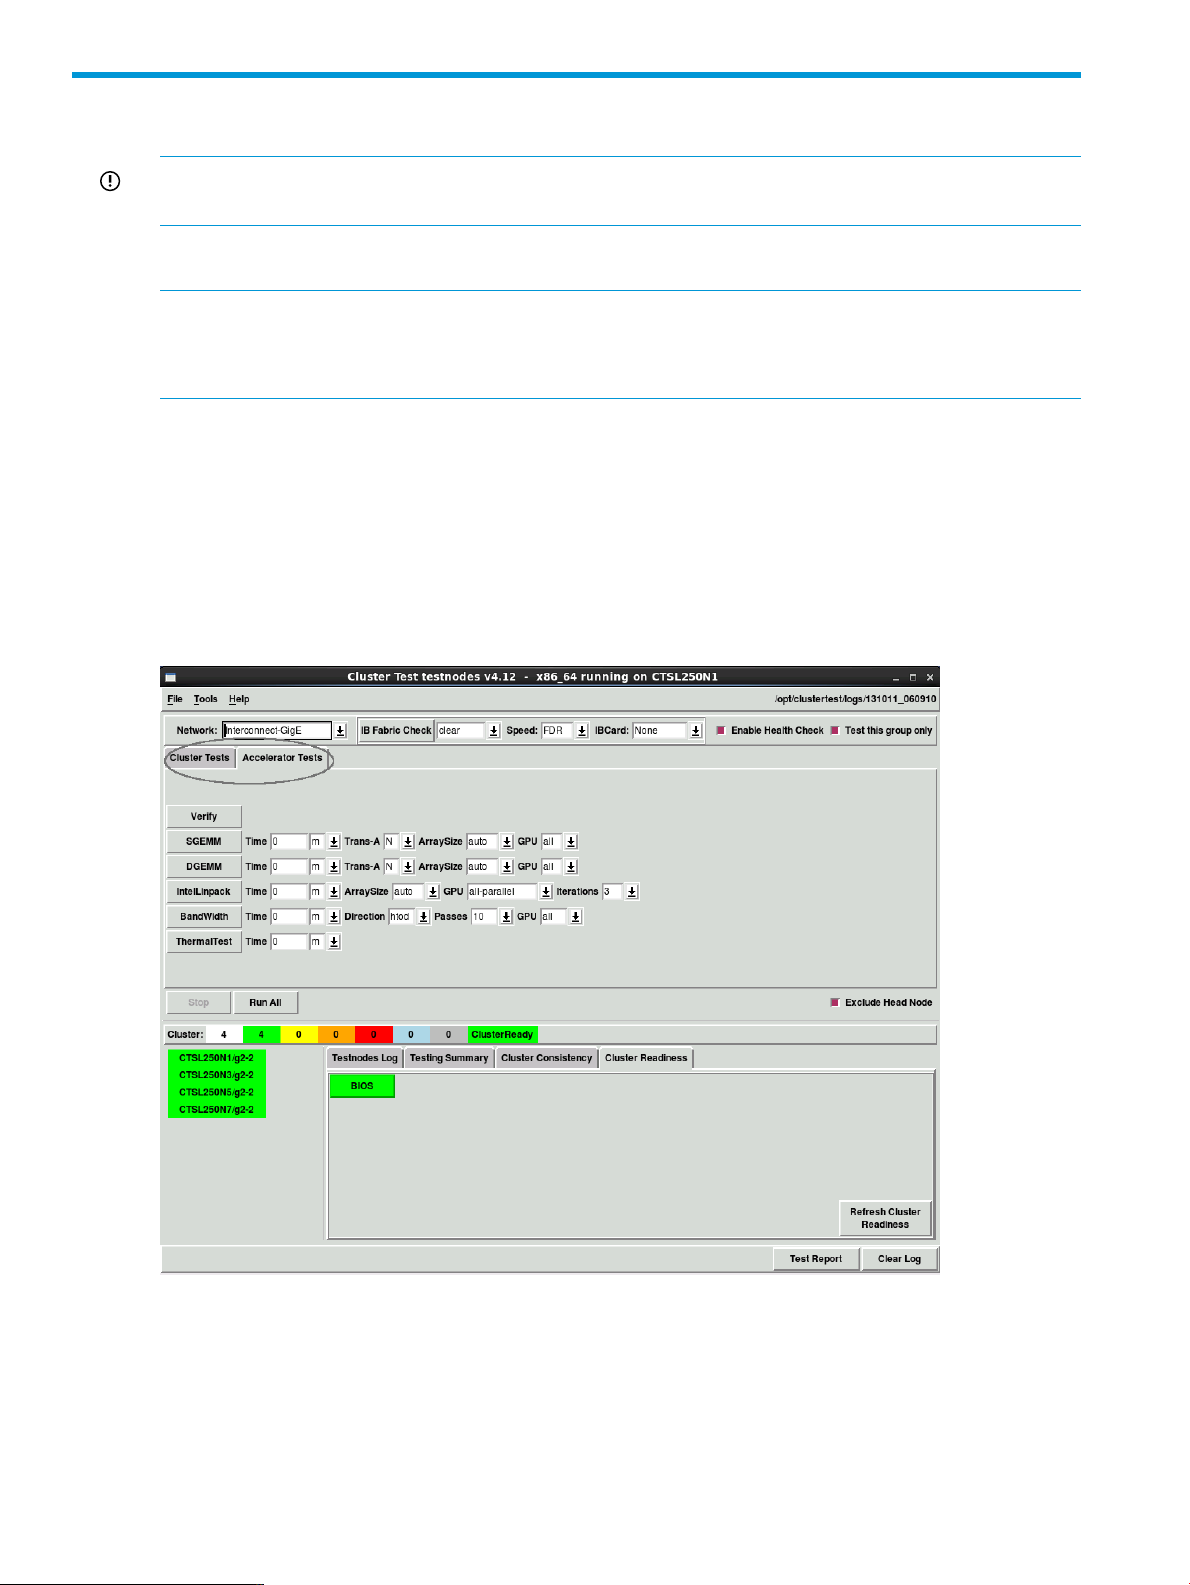
The Cluster Test testnodes window has the following tabs:
• Cluster Tests – contains all the Cluster Tests described in “The Cluster Test GUI” (page 7).
• Accelerator Tests – contains the accelerator tests described in “Running accelerator tests”
(page 23).
Files generated by accelerator test
As you run the tests, output is collected in log files. You can set the log directory using command
line options. For example, testnodes.pl <logdirectory>.
Upon each new invocation of accelerator test, a new directory is generated under /opt/
clustertest/logs with the current timestamp (year/month/day/time). The log, error, and
script files are saved in this directory.
22 The accelerator test GUI
Page 23
NOTE: Remove all files when you are finished testing with accelerator test.
Running accelerator tests
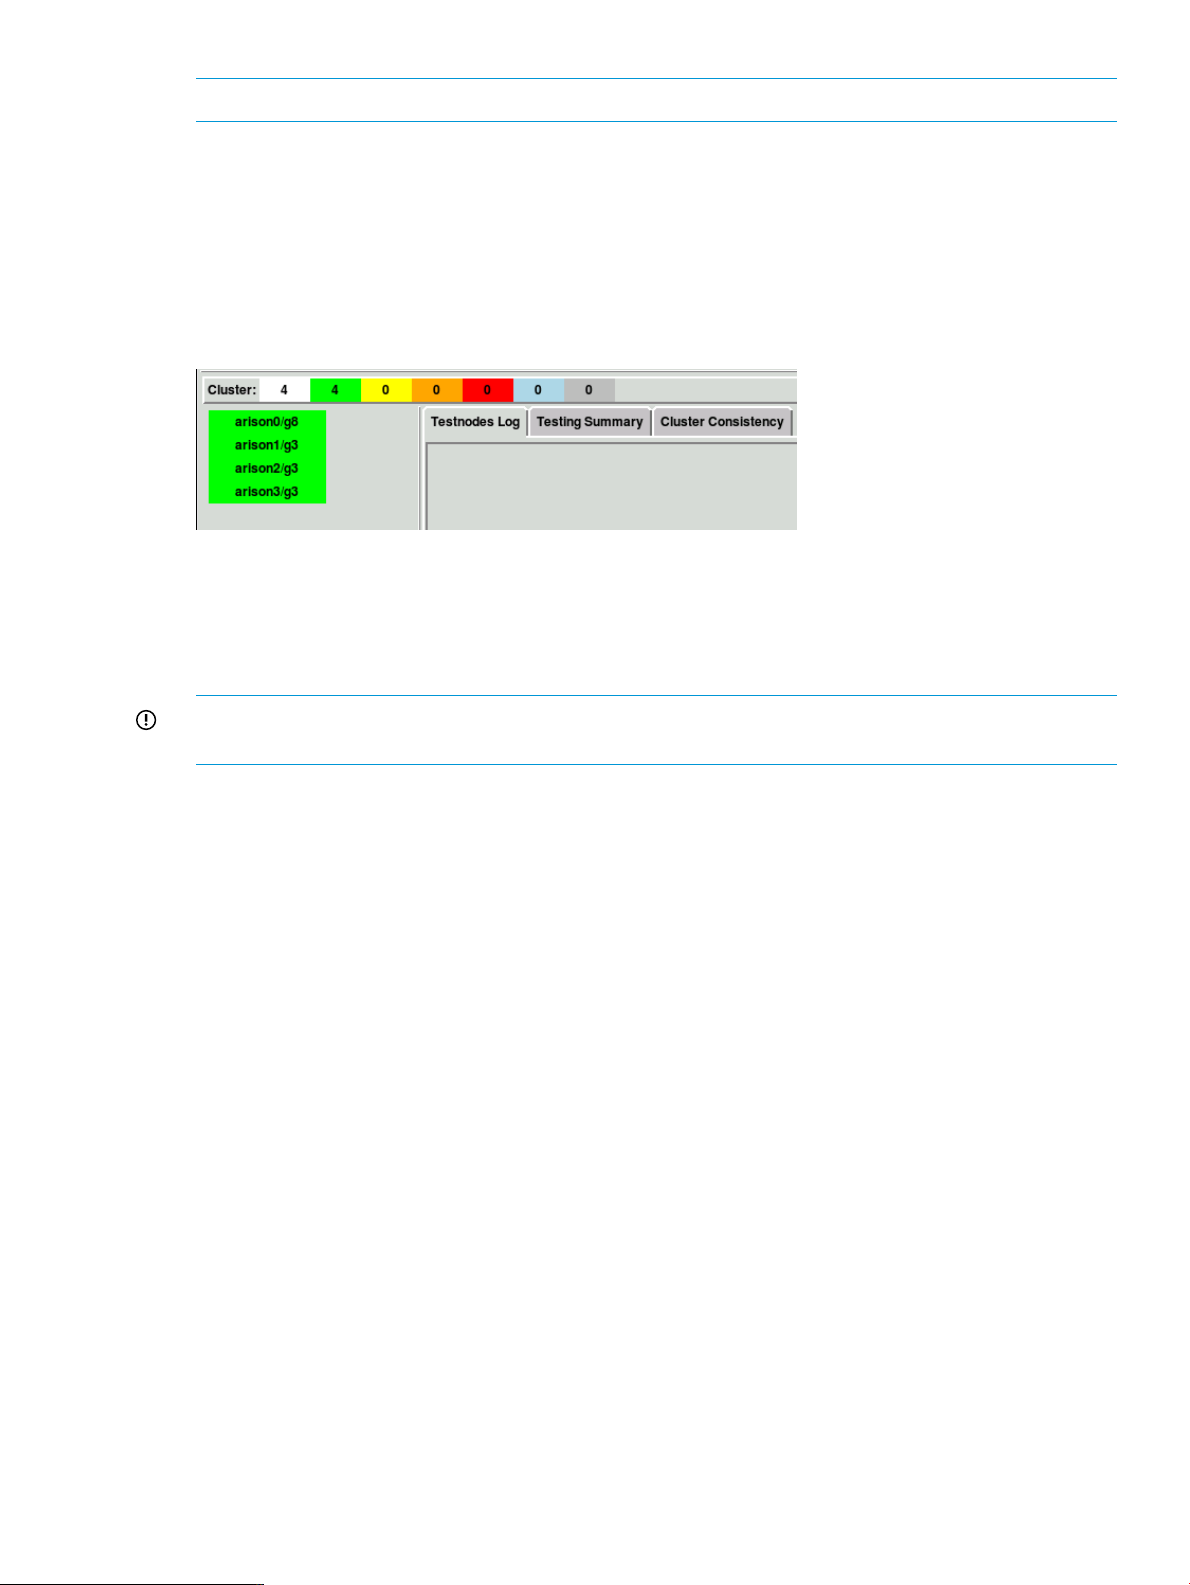
GPU detection
When you start testnodes.pl -gpu, a test is launched to check all nodes for the presence of
accelerator cards (GPUs). If any GPUs are detected and they are responsive to communication,
the node will be marked by adding /g<number of nodes> to the node name in the nodes
window. In the example below, each node has three detected and responsive GPUs.
You should compare the number of GPUs indicated in the nodes monitoring window to the actual
number of GPUs for each node. Any discrepancies indicate a problem with GPUs on that node.
It might be helpful to run the Verify test, described below, to get more information about problem
nodes. Additional information on the nodes monitoring window is available at “The nodes
monitoring window” (page 15).
IMPORTANT: For all the accelerator tests, only nodes with detected GPUs should be selected.
Deselect any nodes that do not have GPUs.
Verify
The Verify test is similar to the GPU detection run on testnodes.pl -gnu startup. Each selected
node is tested for the presence of GPUs using lspci and is then queried. The test report shows
the accelerators detected for each node and whether communication with the GPU was successful.
If a GPU is installed on a node but not detected, reseat the GPU and repeat the test. An example
test report is shown below.
---------------n21
---------------** The lspci command shows that there are 3 GPGPUs installed on node
** All 3 GPGPUs appear to be functional on this node
GPU Model Video BIOS Link Speed Width Bus ID
0 Tesla S2050 70.00.2f.00.03 5GT/s, x16, 06.00.0
1 Tesla S2050 70.00.2f.00.03 5GT/s, x16, 14.00.0
2 Tesla S2050 70.00.2f.00.03 5GT/s, x16, 11.00.0
To use the Verify test report:
• Make sure all GPUs are listed for each node.
• Verify the Model numbers.
• Verify the Video BIOS.
• The Link Speed can be reported as either 2.5, 5, or UNKNOWN. A report of 5 or UNKNOWN
indicates the GPU is running at Gen2 speed and is acceptable. A value of 2.5 might indicate
the GPU is not properly configured. However this test is timing sensitive, so it is recommended
you retest any nodes reporting 2.5. If the test consistently reports 2.5, the GPU should be
re-seated and the test repeated. If all the GPUs report 2.5, there might be a BIOS setting
error.
Running accelerator tests 23
Page 24

• A Width of x16 is expected for Gen2 GPUs.
• The Bus ID can be used to identify the physical location of each GPU.
SGEMM: Single Precision General Matrix Multiply Test
• The Trans-A setting determines whether the matrix A is to be transposed. The default is N.
• ArraySize sets the size of the array to be used. The default is Auto, which means the test
will automatically compute the array size. Test results are very sensitive to array size.
• GPU sets which GPU to test. The default is all.
Expected results for Nvidia GPUs: All nodes should report 520 – 550 GFlop/s.
Expected results for AMD GPUs: All nodes should report about 430-440 Gflop/s.
DGEMM: Double Precision General Matrix Multiply Test
• The Trans-A setting determines whether the matrix A is to be transposed. The default is N.
• ArraySize sets the size of the array to be used. The default is Auto, which means the test
will automatically compute the array size. Test results are very sensitive to array size.
• GPU sets which GPU to test. The default is all.
Expected results for Nvidia GPUs: All nodes should report 200 – 250 GFlop/s.
Expected results for AMD GPUs: All nodes should report about 200 Gflop/s.
BandWidth: GPU Bandwidth Test
• Direction sets the direction of the transfers. Available options are htod (host-to-device)
and dtoh (device-to-host). The default is htod.
• TransferSize is the number of bytes in a transfer block. The default is 32 GB.
• Iterations is the number of times to repeat the test. The default is 10.
• GPU sets which GPU to test. The default is all.
Expected results for Nvidia GPUs: All GPUs should report 5650-5750 MBs. Values of half the
expected range might indicate the GPU is running at Gen1 speed instead of Gen2 speed. This
might be caused by a BIOS setting or might indicate a GPU hardware issue.
Expected results for AMD GPUs: All GPUs should report about 3000-3300 MB/s.
Memory Test
NOTE: For Nvidia GPUs only.
This test writes and then reads a pattern to memory and tests for errors. GPU sets which GPU to
test. The default is all. All GPUs tested should report zero errors.
Thermal Test
NOTE: For Nvidia GPUs only.
This test reports GPU temperatures for five minutes while a benchmark runs in the background. The
GPU temperature should remain below 81° C. GPU temperatures are obtained using the IPMI
ipmitool command. It is necessary for IPMI to be installed and enabled for this test to run.
NOTE: The Thermal Test does not report meaningful results for accelerators installed in
Workstations (WS490).
24 The accelerator test GUI
Page 25

Nvidia Linpack: CUDA Accelerated Linpack Benchmark
NOTE: For Nvidia GPUs only.
This test is implemented to run separately on each node using all CPU cores and all GPUs with
about 80% or less of memory. Two parameters must be specified: Mem (GB) and Mem (%). Mem
(GB) is the total memory in Giga Bytes on each node and Mem (%) is the percentage of total
memory used in the test. This test does not give the cluster wide performance but it exercises CPU,
GPU, and memory at the same time and it provides another set of numbers used to compare the
relative performance among the cluster nodes. The amount of memory required is set to auto by
default. This runs each node at the specified percentage of the memory available. For example,
using auto and 80% a 2GB node uses 80% of 2GB while a 16GB node uses 80% of 16GB. The
amount of memory used on any management node is adjusted to allow for increased memory
consumption on management nodes.
Running accelerator tests 25
Page 26

4 Cluster Test procedure as recommended by HP
A good cluster solution must pass five mandatory cluster tests: CrissCross, Test4, Stream, Linpack,
and Disk Test. The Pallas test is another interconnect test and is recommended as a supplement to
CrissCross and Test4.
If you have accelerators (GPUs) in your cluster, run the accelerator tests first as described in
“Accelerator test procedure” (page 27).
If you replace any node in the cluster, it is suggested you run all mandatory tests again.
Cluster Test uses the following directory structure.
Table 2 Directory structure for Cluster Test
/opt/clustertest/bin/
CAUTION: Make sure no one else is running tests on the nodes you will be testing. Running
simultaneous tests on a single node will most likely cause all tests to fail.
Additional software
Some of the features of Cluster Test rely on additional software packages that might not be installed
on your cluster. These features, while not vital to running Cluster Test, can assist in troubleshooting
problems with the cluster.
One such feature is the ability to turn on or off the UID light on a server. In order to make this
feature available, either the ipmitool or hponcfg software (depending on the node model)
must be installed and set up on each node of the cluster. In general, ipmitool is used for nodes
with LO100 and hponcfg is used with nodes with iLO and iLO 2. See “Utility commands”
(page 51) for more information.
Configuring Cluster Test when using RPM
When running the RPM version of Cluster Test for the first time, you will need to provide some
configuration settings. A warning message will appear when you launch Cluster Test, as shown
below.
location of tests, including the testnodes.pl Cluster Test
user interface
location of test output/opt/clustertest/logs/
location of install/uninstall scripts and sources/opt/clustertest/setup/
The configuration settings screen, shown below, will be displayed after accepting the warning
message. Verify the default settings and update any incorrect settings. At a minimum, the two node
number range fields should be updated to reflect the nodes in your cluster.
26 Cluster Test procedure as recommended by HP
Page 27

Accelerator test procedure
This is the Cluster Test procedure recommended by HP when your cluster contains nodes with
accelerator cards. You should run these accelerator tests and the tests described in “The Cluster
Test procedure” (page 29).
Each of these tests use default values. You may change parameters as desired, but be careful the
current system limits are not exceeded.
1. Make sure the X server is running and the DISPLAY environment variable is set appropriately.
2. Make sure no one else is running tests on the nodes you will be testing.
3. Run /opt/clustertest/bin/testnodes.pl -gpu on the first head node.
Accelerator test procedure 27
Page 28

As soon as you start testnodes.pl -gpu a test is launched to check all nodes for the
presence of accelerator cards (GPUs). If any GPUs are detected and they are responsive to
communication, the node will be marked by adding /g<number of nodes> to the node
name in the nodes window. In the example below, each node has three detected and
responsive GPUs.
4. Compare the number of GPUs indicated in the nodes monitoring window to the actual number
of GPUs for each node. Any discrepancies indicate a problem with GPUs on that node.
5. Deselect any nodes that do not have GPUs.
6. Select Verify and use the generated report for the following checklist.
• Make sure all GPUs are listed for each node.
• Verify the Model numbers.
• Verify the Video BIOS.
• The Link Speed can be reported as either 2.5, 5, or UNKNOWN. A report of 5 or
UNKNOWN indicates the GPU is running at Gen2 speed and is acceptable. A value of 2.5
might indicate the GPU is not properly configured. However this test is timing sensitive,
so it is recommended you retest any nodes reporting 2.5. If the test consistently reports
2.5, the GPU should be re-seated and the test repeated. If all the GPUs report 2.5, there
might be a BIOS setting error.
28 Cluster Test procedure as recommended by HP
Page 29

• A Width of x16 is expected for Gen2 GPUs.
• The Bus ID can be used to identify the physical location of each GPU.
7. Select SGEMM to start the Single Precision General Matrix Multiply Test. All nodes should
report a rate of 520 – 545 Gflop/s.
8. Select DGEMM to start the Double Precision General Matrix Multiply Test. All nodes should
report a rate of 200 – 220 Gflop/s.
9. Select BandWidth to start that test. All GPUs should report 5650-5750 MBs. Values of half
the expected range might indicate the GPU is running at Gen1 speed instead of Gen2 speed.
This might be caused by a BIOS setting or might indicate a GPU hardware issue.
10. Run the Memory Test.
11. Run the Thermal Test. All GPU temperatures should remain below 81 °C.
The Cluster Test procedure
This procedure outlines the Cluster Test procedure recommended by HP.
If your cluster has accelerator cards (GPUs), first run the accelerator tests as described in “Accelerator
test procedure” (page 27).
The test parameters for each of these tests are default values. You may change parameters as
desired, but be careful the current system limits are not exceeded.
See “Sample test output” (page 59) for example output of these tests.
Refer to “Troubleshooting” (page 44) if any of the following tests fail.
This procedure assumes a diskless cluster of 77 nodes has been set up successfully.
NOTE: All commands and utilities in this procedure reside in the /opt/clustertest/bin
directory. Cluster Test does not modify the PATH environment variable on the head node, therefore
any calls to commands and utilities referenced in this section must be preceded with the path to
the command.
1. Make sure the X server is running and the DISPLAY environment variable is set appropriately.
2. Make sure no one else is running tests on the nodes you will be testing.
3. Run testnodes.pl on the first head node. This will launch the Cluster Test interface.
A log directory will be created under /opt/clustertest/logs with a timestamp
(year/month/day/time). The log, error, and script files are saved to this directory.
You can override the default test logging directory with the command testnodes.pl
<my_log_dir>. This will create a directory my_log_dir in /opt/clustertest/logs
and set the sequence to avoid any conflict with other testnodes.pl jobs already running.
The Cluster Test procedure 29
Page 30

4. Deselect Test this group only so you will be running tests on the entire cluster.
5. Run the checkadm script to ping all the nodes on the admin network.
# checkadm
Fix any errors before continuing. See the “Troubleshooting” (page 44) section for information.
6. If the cluster solution has an interconnect network other than the admin network (such as GigE
or InfiniBand), run the checkic script to ping all nodes on the interconnection network. To
run the script, open a terminal window and enter the following command.
# checkic
Fix any errors before continuing. See the “Troubleshooting” (page 44) section for information.
TIP: If all nodes are shown as green on the Node Status display (lower left corner of the
Cluster Test GUI), you will get no errors from checkadm or checkic.
7. Run CrissCross Easy on the admin and interconnect networks to check the networks'
functionality. The output of the CrissCross Easy test might indicate a slow network; that's okay
and is to be expected.
The CrissCross test takes two to three minutes on a cluster of 350 nodes.
a. Select the admin network by choosing Admin from the Network: pull-down menu on the
Cluster Test interface. Then, select Easy for the CrissCross test and enter the test parameters
(it's suggested you use the default values). Select CrissCross to run the test on the admin
network.
b. Select a GigE or InfiniBand network by choosing from the Network: pull-down menu on
the Cluster Test interface. For this example, we choose InfiniBand. Select CrissCross to
run the test on the interconnect (InfiniBand) network.
c. Select Clear Log to clear the output window.
8. If the CrissCross Easy test completes successfully, run CrissCross Stress on the interconnect
network. The CrissCross Stress test takes approximately 30 minutes on a cluster of 350 nodes
with InfiniBand interconnect.
30 Cluster Test procedure as recommended by HP
Page 31

a. Select Stress for the CrissCross test on the Cluster Test interface. Leave the Procs/node
value unchanged. Unless you have a cluster of several hundred nodes, leave the default
values for Length and Iterations. If you do have a cluster of several hundred nodes, you
might need to change these parameters to smaller values, something like Length: 50000,
Iterations: 1000, to shorten the test time.
NOTE: In general, CrissCross runtime goes up as the square of the number of nodes.
For example, for a fixed message length and number of iterations, if it takes 5 minutes
on 10 nodes, it will take 20 minutes on 20 nodes, and 500 minutes on 100 nodes.
CrissCross will stop when it hits the specified time limit, but will not have tested all node
pairs. You can control the number of node pairs tested simultaneously, which will make
CrissCross run faster at the cost of sometimes having more variation in performance due
to congestion.
b. Select CrissCross to start the test.
c. When the CrissCross test finishes, select Save Log to save your test result to a file, then
select Clear Log to clear the output window.
d. If this test fails, see “Troubleshooting” (page 44) for more information. Repair or replace
any failed components before continuing with other tests.
9. Run Test4 on the interconnect network, first on Easy and then on Stress.
a. Select Easy, then Test4 to start the test. You don’t need to change the test parameters.
b. Wait for Test4 Easy to finish. Test4 Easy takes less than 15 minutes on a cluster of 350
nodes.
c. Select Stress. You don’t need to change the value in the Length box; the default value is
appropriate. Run Test4 Stress for at least four hours by specifying an appropriate time
limit. The test will stop when the time limit is reached. If necessary, the test will repeat
until the time limit is reached.
d. Select Test4 to start the test.
e. While Test4 is running, use the Performance Monitor, accessed from Tools→Performance
Monitor on the Cluster Test toolbar, to verify that all nodes are being exercised. See “The
performance monitor” (page 33)for more information.
f. Select Save Log to save your test results to a file, then select Clear Log to clear the output
window.
10. At this point, the cluster should have undergone the CrissCross and Test4 tests – the cluster
network connections are fully functional. The next step is to test memory with the Stream test.
Usually, the default settings (auto/80%) for Stream are sufficient. If you want to choose an
explicit memory size, select the memory size that is a little smaller than the actual memory
size on the nodes. In this example, each server has 4 GB of memory, so we select 3 GB.
Select Stream to start the test. This test takes approximately 30 minutes on a cluster of 350
nodes.
11. The next test focuses on CPU testing – Linpack. The Linpack test requires two parameters:
Mem(GB) and Mem%.
Linpack can either run separate instances on each node, or a single instance covering the
whole cluster. To run one instance of Linpack covering the entire cluster, select Cluster-wide.
Linpack runtime varies depending on how much memory is available on each node, and the
number and speed of the CPUs.
The Cluster Test procedure 31
Page 32

a. The auto Mem(GB) setting selects a memory size for each node that will accommodate
the amount of memory available on that node. You may select an explicit size by clicking
on the arrow adjacent to the Mem(GB) box. If you have more than one memory
configuration in the cluster, select the one with lowest memory. For example, if one node
in the cluster is configured with 8 GB and one with 16 GB, you should select 8 in the
Mem(GB) box. When using the Cluster-wide option with Linpack, the Mem(GB) box will
still be the amount of memory on each node – the values will be collected together to
calculate how large the matrix should be for the whole cluster.
b. Next, select the percentage of total memory for the Linpack test by clicking on the arrow
adjacent to the Mem% box. The default value is 80%. A Mem% value over 80% is likely
to cause swapping or running out of memory.
c. Select Linpack to start the test.
d. Linpack running on individual nodes takes approximately one hour. The output of Linpack
test is saved to files named HPL-node<x> where x is a node number. In this example,
output is saved to files HPL-node0 – HPL-node76.
12. The final required test is Disk Test.
a. Enter the disk device (for example, /dev/sda) in the Device box. If nodes in the cluster
have only one disk installed, you can select auto and let Disk Test figure out the device.
You don’t need to change the % (percentage) parameter – the default value (10) is good.
Do not run the test with more than 10% of the disk size because it will take a very long
time to complete.
Time limits can be specified to control the amount of time that Disk Test runs.
When run with all, all-parallel, or all-sequential, Disk Test avoids testing physical disks
and the logical volumes containing them.
b. Select Disk Test to begin the test.
NOTE: There is a known issue with Disk Test that causes Cluster Test to always indicate
errors in Disk Test’s standard error output. As long as the Disk Test .err file in the logs
directory only lists the node names of the systems tested with Disk Test, this error can be
ignored.
c. If you want to save your test results to a file, select Save Log. To clear the output window,
select Clear Log.
13. Remember to run a Hardware Inventory (Tools→Hardware Inventory from the Cluster Test
toolbar) to check and save the cluster hardware configuration. See “Hardware Inventory”
(page 36) for more information.
14. When all the testing is complete, uninstall Cluster Test and remove all associated log, error,
and script files. Refer to the HP Cluster Test Installation Guide, available at http://www.hp.com/
go/ct-docs, for the appropriate uninstall instructions for Cluster Test.
32 Cluster Test procedure as recommended by HP
Page 33

5 The performance monitor
The performance monitor utility
The Performance Monitor (or the xcxclus utility) is a graphic utility that monitors nodes in a cluster
simultaneously. The Performance Monitor displays an array of icons. Each icon represents a node
in the cluster and provides the following information:
• Ethernet activity
• Core utilization
• Memory utilization
• Interconnect I/O activity
• Disk I/O activity
The Performance Monitor can be invoked from the Tools menu at the top of the Cluster Test interface.
The data are color-coded with respect to the percent of utilization. For example, red indicates 90%
to 100% utilization; purple represents 0% to 10% utilization. The color legend is displayed at the
bottom of the window. The description of various boxes is provided by positioning a mouse over
the box.
Except for the values in the arrows, numbers are in MB; the icons show the node utilization statistics
as a percentage of total resource utilization.
Positioning the mouse pointer over a node icon opens a popup that describes the purpose of that
portion of the icon. This information is also presented in the status bar at the bottom of the window.
The performance monitor utility 33
Page 34

• The node designator, ct465g1n1, is in the upper left corner.
• The center portion displays core usage data for each CPU core in the node. As many as four
CPU cores can be displayed. This examples shows four cores utilized at 100%.
• The right portion of the icon displays memory statistics. This example shows 82% memory
utilization.
• The leftmost arrows at the bottom of the icon represent Ethernet connections. This example
shows two Ethernet connections. As many as four Ethernet connections may be displayed.
• The single rightmost arrow represents I/O activity.
Clicking on an icon launches the xcxperf utility. See “The xperf utility” (page 35) for more
information.
The toolbar menu options are described below.
Table 3 The Performance Monitor toolbar menu
Terminates the Performance MonitorExitFile
Specify the utilization data in terms of cumulative or incremental utilizationUtilizationOptions
Opens a dialog box for setting the refresh rateRefresh...
Displays the core utilization in terms of user or system statistics, or bothCPU
Displays the system's total memory or memory used by the applicationSystem Memory
Names
Displays network utilization or bandwidthNetwork
Hide the color key at the bottom of the displayKeyView
Hide the values in the node iconsValues
View the full node name instead of the node number for each nodeFull Node
Scale the Performance Monitor window to 50%, 75%, 100%, and 125%Zoom
Suspends the display until the Hold button is releasedHold
34 The performance monitor
Page 35

The xperf utility
The xperf utility is a dynamic graph that displays performance on a number of measurements for
a single node. It is started by clicking on a node icon on the Performance Monitor display.
Statistics for each measurement are shown real-time in a color-coded histogram. To see the meaning
of the color-coding for an item, click on the toolbar for that measurement. For example, to see the
color key for an Ethernet connection histogram, select Ethernet from the xperf toolbar.
The xperf utility 35
Page 36
6 Cluster Test tools
The tools in this section are run from the Cluster Test interface. Be sure to check for additional tools
that run from the command line. Utility commands are listed in “Utility commands” (page 51).
Hardware Inventory
For the Hardware Inventory tool to work correctly, you must have the HP Lights-Out Online
Configuration Utility, hponcfg, or the ipmitool installed, depending on the node model. In
general, if your nodes are in the list of supported models for hponcfg, then you will need that
tool, otherwise you will need ipmitool. See the HP SmartStart Scripting Toolkit page and look
for the HP SmartStart Scripting Toolkit Linux and Windows Editions Support Matrix for a list of
supported models for hponcfg.
To get a hardware inventory, select Tools→Hardware Inventory from the Cluster Test Interface
toolbar. This tool performs a hardware inventory on all active nodes in the cluster. Reported
hardware includes server models, serial numbers, BIOS versions, BMC firmware versions, number
of CPU’s, NIC’s status, and memory in MBytes.
The Hardware Inventory report can be saved to a file by selecting File→Save from the Hardware
Inventory toolbar.
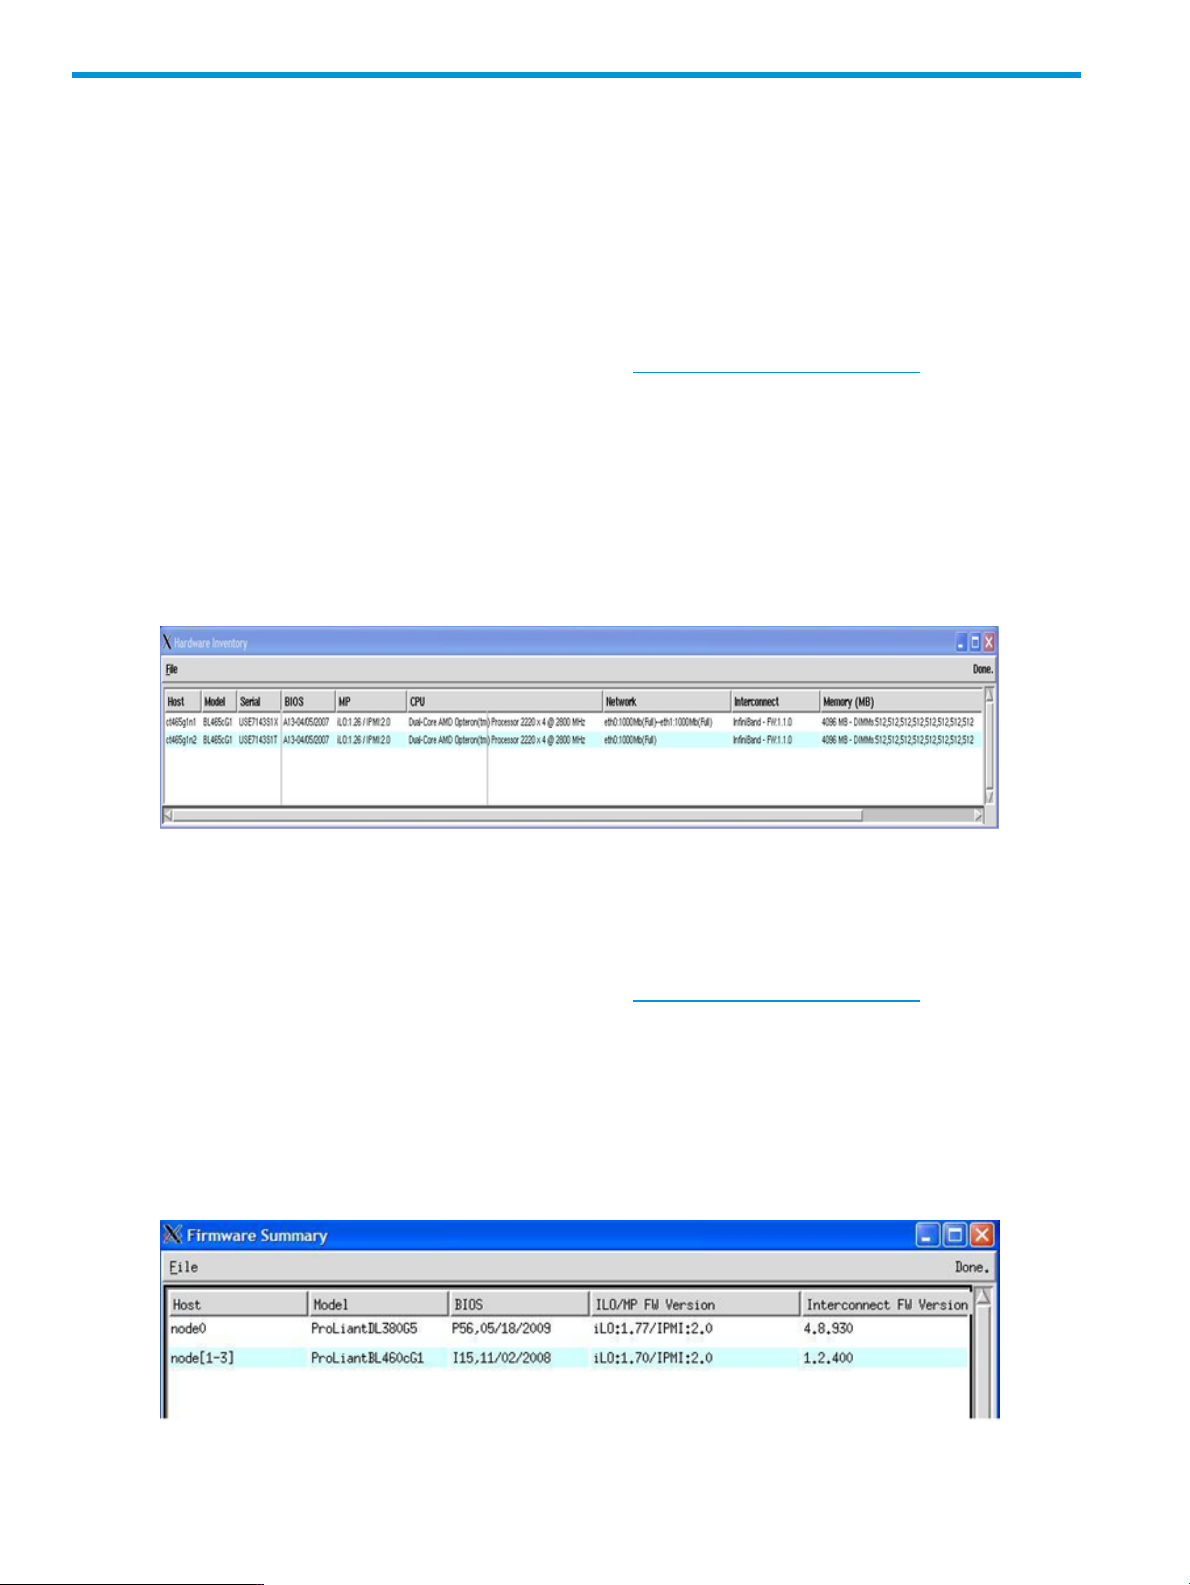
Firmware Summary
For the Firmware Summary tool to work correctly, you must have the HP Lights-Out Online
Configuration Utility, hponcfg, or the ipmitool installed, depending on the node model. In
general, if your nodes are in the list of supported models for hponcfg, then you will need that
tool, otherwise you will need ipmitool. See the HP SmartStart Scripting Toolkit page and look
for the HP SmartStart Scripting Toolkit Linux and Windows Editions Support Matrix for a list of
supported models for hponcfg.
To get a firmware summary, select Tools→Firmware Summary from the Cluster Test toolbar. This
tool summarizes the firmware versions on all nodes in the cluster. Each row in the Firmware Summary
window represents a group of nodes of the same model, BIOS firmware version, iLO/MP firmware
version, and Interconnect HCA firmware version; the window is sorted based on node type
(hardware model) so it’s easier to check for correct firmware versions.
36 Cluster Test tools
Page 37

Server health check
The server health check tool reports the overall health status of the nodes. It generates Temperature,
Fan, and Power reports based on values retrieved from the management interface (LO100i or
iLO2) of the server. This tool provides reports for every active node in the cluster. The health data
is polled every five minutes on the head node if the Enable Health Check option on the Cluster Test
interface is selected.
Once you select Enable Health Check, Cluster Test starts polling the health data for all servers,
including the head node. Results are written to the following location:
/opt/clustertest/logs/server-health/<node-name>.
You may also see the health check results via the Cluster Test toolbar at Tools→Server Health.
From the Server Health Status window, hold the left mouse button down over a node item to display
a menu with the items Temperature, Fan, and Power. From this menu, select the report you'd like
to view for that node.
Below is an example Temperature report. The data in the report are historic, beginning from the
time Enable Health Check is selected on the Cluster Test interface.
Server health check 37
Page 38

Below is an example Power report. Check a node's Present Power, Average Power, Maximum
Power, and Minimum Power.
Zeros in power readings indicate that the firmware is not responding to the Power Monitoring
module at that time stamp.
IMPORTANT: Power Monitoring is not supported on all Cluster Test server models. For more
information, contact HP support.
Excluding the head node from tests
To exempt the head nodes in the current cluster configuration from tests, select Exclude Head Node
on the Cluster Test interface.
38 Cluster Test tools
Page 39

Disk Scrubber
The Disk Scrubber tool erases the disk contents of all the compute nodes' hard disks by running
simple dd commands.
CAUTION: Make sure you back up the contents of your compute nodes, both local and attached
disks, before using Disk Scrubber.
To start Disk Scrubber, select Tools→Disk Scrubber from the Cluster Test interface toolbar.
Disk Scrubber 39
Page 40

40 Cluster Test tools
Page 41

7 Running tests in parallel
It is possible to run tests on independent groups of nodes in the same cluster in parallel. This is
done from the command line, using the run_cluster_script command (see “Utility commands”
(page 51)). The run_cluster_script command does basically what the FileLoad Script menu
item does in the Cluster Test GUI – loads and runs a cluster script describing one or more tests.
(See “Using scripts to run tests” (page 12).)
You may run as many simultaneous cluster scripts as you like, provided they don’t use the same
nodes. For example, in a 256-node cluster of HP ProLiant BL280c G6 Server Blades, you could
run 16 separate cluster scripts, each on the nodes in one enclosure. No attempt is made to check
that the nodes in question are actually unused.
CAUTION: Running tests in parallel is an advanced use of Cluster Test. The responsibility of
making sure a node is not subjected to multiple, simultaneous tests is yours. Make sure you assign
specific nodes to testers. Running simultaneous tests on a single node will most likely cause all tests
to fail.
By default, files associated with tests run from a single run_cluster_script command go into
a separate time-stamped directory under /opt/clustertest/logs, the same as a single
invocation of testnodes.pl. If you would like to have all your separate run_cluster_script
files go into the same directory, you can use the –logdir option to control which directory the
test files go into – perhaps the same directory being used by the current .pl. File names are
assigned sequence numbers, so several run_cluster_script commands can share a single
directory without conflict.
Scripts used with run_cluster_script.pl should adhere to one of the following forms:
• <full path to test script><full path to machines file><interconnect>
• <full path to machines file><interconnect><full path to test
script><[optional test script parameters]>
• <full path to machines file><interconnect><test name><[optional test
parameters]>
This last form is for a test script with the machines file and interconnect at the beginning of
the line.
41
Page 42

8 Creating and changing per node files
NOTE: This section applies only to the image version of Cluster Test.
In Cluster Test Image v3.2 and later, per-node files for the compute nodes (used for /tmp, /etc/
sysconfig/network-scripts, and a few other things) are implemented differently than in
previous versions. Instead of seeing per-node files on the head node under /shadow with suffixes
like $$IP=192.168.1.2$$, they will appear as symbolic links to something under
/node-specific/thisnode . The Cluster Test set up process does all of this for you
automatically, but if you need to create or change per-node files yourself, this chapter describes
how to do it.
There are two ways per-node files and directories can be represented, depending on what is
needed. A simple per-node file is visible on the head node as a symbolic link somewhere under
/shadow to the same location under /node-specific/thisnode. The actual per-node file or
directory is located in /node-specific/<ip-addr>/.
A cloned per-node directory is where individual nodes are expected to have unique files present,
but share some files. In this case, the original directory under /shadow is copied to the
corresponding location under /node-specific/clone and replaced with a symbolic link to
the corresponding directory under /node-specific/thisnode. The real per-node directory
located under /node-specific/<ip-addr>/ is filled with symbolic links to the corresponding
files, now located under /node-specific/clone. Any files in the directory that must be added,
changed, or removed for a particular node are handled by removing the symbolic link under
/node-specific/<ip-addr> and creating or changing the file as necessary.
An example per-node directory
The per-node directory, /shadow/tmp, is visible on the head node as a symbolic link to
/node-specific/thisnode/tmp. Each compute node has its own copy. The
/node-specific/thisnode/tmp directory doesn’t exist on the head node.
The actual per-node /tmp directory appears on the head node in
/node-specific/<ip-addr>/tmp and is NFS-mounted appropriately so it appears as
/node-specific/thisnode/tmp on the compute nodes. So, on the head node, /tmp for
node2 (IP address 10.0.1.2) is located in /node-specific/10.0.1.2/tmp, and /tmp for
node10 (IP address 10.0.1.10) is located in /node-specific/10.0.1.10/tmp.
An example cloned per-node directory
The /etc/sysconfig/network-scripts directory is a typical cloned per-node directory. It
contains configuration scripts for setting up the network on a node, with files named ifcfg-eth0,
ifcfg-eth1, and so forth, corresponding to Ethernet NICs. Different node models have different
numbers of NICs, and of course different nodes will have different IP addresses assigned to the
NIC of the same name.
There are some additional scripts associated with starting and stopping the network that are the
same across all nodes. In Cluster Test, this scripts directory is a cloned per-node directory (after
running clsetup.pl). The /shadow/etc/sysconfig/network-scripts directory has been
copied to /node-specific/clone/etc/sysconfig/network-scripts. The /shadow/
etc/sysconfig/network-scripts directory is then replaced with a symbolic link to
/node-specific/thisnode/etc/sysconfig/network-scripts. Each node has a
/node-specific/<ip-addr>/etc/sysconfig/network-scripts directory created,
initially populated with symbolic links to the contents of /node-specific/clone/etc/
sysconfig/network-scripts. The clsetup.pl command replaces entries such as
/node-specific/<ip-addr>/etc/sysconfig/network-scripts/ifcfg-eth0 with
files containing the appropriate IP address for eth0 on that node.
42 Creating and changing per node files
Page 43

9 NFS performance tuning
NOTE: This section applies only to the image version of Cluster Test.
Cluster Test Image allows some kernel parameter tuning that improves NFS performance and slow
node booting when all the compute nodes are booted simultaneously. These parameters are optimal
values derived after evaluation with supported HP hardware.
The RPCNFSDCOUNT value is increased to 128 from the default value of 8 in /etc/sysconfig/
nfs.
These are the TCP tuning parameters implemented in /etc/sysctl.conf file.
net.core.rmem_default 524288
net.core.rmem_max 524288
net.ipv4.tcp_rmem "8192 262144 524288"
net.ipv4.tcp_wmem "8192 262144 524288"
43
Page 44

10 Troubleshooting
Detecting new hardware
NOTE: This section applies only to the image version of Cluster Test.
When Cluster Test is installed on a head node of a new, unsupported model, or when Cluster Test
is booted on a compute node on a new, unsupported model, a menu will be displayed with options
for you to choose from. The message will look similar to
Model DL370G10 is not supported
Your options are:
1) Gather information about this model to send to the ClusterTest team.
2) Assume this model is like another, supported model and continue
Option 1: Cluster Test gathers information about the model, and if possible, saves it to the install
media (this works for USB and network installs, but will not work for DVD installs). Information
about the system is written to a tar file that is copied to the install media. Assuming everything
goes well, your install media (your USB drive for USB installs, the capture directory for network
installs, or the network install directory if no capture directory was specified) will contain a tar
file similar to CT_<model-name>_<kernel-version>.tar.
Send the tar file to the Cluster Test team at ct-support@hp.com, who will provide a new kit that
supports the new hardware.
Option 2: You will be prompted for a supported model to use instead.
These are the models supported by ClusterTest:
DL360G4 DL360G5 DL360G6
What model do you want to assume to boot this DL360G7 (enter q for quit)?
Cluster Test will attempt to complete the installation by assuming your DL360G7 is the model you
specify. This might not work. If the installation is successful, an entry will be made to /opt/
clustertest/model_info on the head node, that describes the new model. This description
will be used by clsetup.pl and other commands run from the head node.
Once you have successfully installed the head node using this approach, you may update the
/tftpboot/netboot_initrd.gz file, which is used to boot the compute nodes, by running
the apply_new_model_updates command. This command updates the /tftpboot/
netboot_init.gz with the collected information and should be run before booting any of the
compute nodes.
44 Troubleshooting
Page 45

Troubleshooting Cluster Test
Table 4 Cluster Test Troubleshooting Guide
Possible solutionHow to diagnoseSymptom
A test terminates right
away.
CrissCross test fails to
complete.
Check the message on the output window or
terminal:
• Cannot check out license
• ssh: connect to host 192.168.1.X port 22:
No route to host.
Check the message on the output window or
terminal:
• Mpirun: one or more remote shell
commands exited with non-zero status
which may indicate a remote access
problem.
• Use the checkic command to find out
which nodes have a broken interconnect.
• The Platform MPI license has expired. Get
new license and copy it to /opt/hpmpi/
licenses
• The date and time on the head node is not
set correctly. This often happens in
fresh-from-the-factory machines. Set the date
and time with the date command. See
date(1) for more information.
License failures can also occur because the
dates on the compute nodes are not
consistent with the date on the head node.
To fix this, select Tools→Sync Node Times.
• Admin network connection to node
192.168.1.X can’t be established. Check
Ethernet cable. Restart network daemon on
that node.
Interconnect between nodes can't be
established:
• You might have a bad cable or bad
Interconnect PCI card (InfiniBand, or driver
not loaded).
• Restart the network daemon or openibd
on the node having the problem.
CrissCross test: a node
responds with less
optimal bandwidth
compared to others.
Test4 fails to complete
Linpack can’t start on a
node
itself during Linpack test
• Check the interconnect cable and the link
LED on the PCI card.
• •Check firmware of the Interconnect PCI
card.
• Use diagnostics software that comes with
the interconnect switch to diagnose the
switch.
• Did the CrissCross test complete
successfully?
• Does any node shut itself down during the
Test4 test? • Heat related problem – check to see if all
• Observe the Performance Monitor to see
if any node drops off or has no activity on
the interconnect. See “The performance
monitor” (page 33). • You might need to replace bad nodes.
date is far off the current date, Linpack can’t
start because the hpmpi license might expire.
Heat relatedA node shuts down
• Replace the interconnect cable, the
interconnect PIC card, or both.
Update card firmware.
• Reseat the line cards on the interconnect
switch.
• Update switch firmware.
• Follow the hints above for troubleshooting
the CrissCross test if CrissCross did not
complete successfully.
fans on the shut down node are running at
expected speeds. If not, replace fans on
that node.
Set the system date to current date.Check the system date on that node. If the
• Check fans on that node.
• Replace the node.
Troubleshooting Cluster Test 45
Page 46

11 Support and other resources
Scope of this document
The scope of the cluster test administration tasks described in this document is limited to fully cabled
Cluster Platform solutions. In general, these will be based on the HP Cluster Platform 3000 (CP3000),
4000 (CP4000), and 6000 (CP6000) product offerings. It is assumed that all component hardware
in the solution has undergone full functionality and burn-in using standard manufacturing test
procedures.
See the HP Cluster Test Release Notes, available at http://www.hp.com/go/ct-docs, for a list of
supported platforms and components.
Not included in the scope of this document is software validation of the cluster configuration
following customer software load. This validation will occur based on the validation diagnostics
provided with the particular flavor of cluster software ordered by the customer (HP Insight Cluster
Management Utility (CMU), XC, Scali, Scyld, or other.) Also, the software deployment functionality
provided by System Imager and described in this document is currently only used in support of the
test image deployment. Customer software load is beyond the scope of this document and again
will be performed based on the type of cluster.
Intended audience
It is assumed the reader has the experience in the following areas:
• the Linux operating system
• HP hardware, including all HP ProLiant models, Integrity servers, and ProCurve switches
• configuration of BIOS settings, iLO/IPMI, and ProCurve switches
Contacting HP
Before you contact HP
Be sure to have the following information available before you contact HP:
• Technical support registration number (if applicable)
• Product serial number (if applicable)
• Product model name and number
• Applicable error message
• Add-on boards or hardware
• Third-party hardware or software
• Operating system type and revision level
HP contact information
For HP technical support, send a message to mailto:ClusterTestSupport@hp.com.
Documentation feedback
HP welcomes your feedback. To make comments and suggestions about product documentation,
send a message to docsfeedback@hp.com. Include the document title and manufacturing part
number. All submissions become the property of HP.
46 Support and other resources
Page 47

New and changed information in this edition
The following additions and changes have been made for this edition:
• Updated default MPI to Open MPI
• Updated CMU product name to HP Insight Cluster Management Utility
• Updated several screen shots
• Updated info for Running tests in a batch
• Updated info for Node monitoring
• Updated info for Power monitoring
• Added archive_logs utility command
• Added cpu_rate utility command
Related information
Documentation
All Cluster Test documentation is available at http://www.hp.com/go/ct-docs.
• HP Cluster Test Installation Guide: for instructions on installing and removing Cluster Test, as
well as requirements information.
• HP Cluster Test Release Notes: for information on what's in each Cluster Test release and the
hardware support matrix.
• HP Cluster Test Administration Guide: to learn the full functionality of HP Cluster Test to select
• HP SmartStart Scripting Toolkit Linux Edition User Guide
• HP SmartStart Scripting Toolkit Linux and Windows Editions Support Matrix
Websites
HP Documentation
• HP Cluster Test Software documentation: http://www.hp.com/go/ct-docs
• HP Cluster Software documentation: http://www.hp.com/go/linux-cluster-docs
• HP Cluster Hardware documentation: http://www.hp.com/go/hpc-docs
• Cabling Tables: HP Cluster Platform Cabling Tables
• HP SmartStart Scripting Toolkit Software
Open source software
• Linux Kernels: http://www.kernel.org/
• PDSH Shell: http://www.llnl.gov/linux/pdsh.html
• IPMITool: http://ipmitool.sourceforge.net/
• Open MPI: http://www.open-mpi.org/
the best version of Cluster Test for your environment, to create custom Cluster Test procedures,
and for step-by-step instructions for running Cluster Test as recommended by HP.
HP software
• HP Cluster Test software download: http://www.hp.com/go/ct-download
• HP Message Passing Interface: http://www.hp.com/go/mpi
• HP Lights-Out Online Configuration Utility (hponcfg)
New and changed information in this edition 47
Page 48

Hardware vendors
• InfiniBand: http://www.mellanox.com
Typographic conventions
This document uses the following typographical conventions:
%, $, or # A percent sign represents the C shell system prompt. A dollar sign
audit(5) A manpage. The manpage name is audit, and it is located in
Command A command name or qualified command phrase.
Computer output Text displayed by the computer.
Ctrl+x A key sequence. A sequence such as Ctrl+x indicates that you
ENVIRONMENT VARIABLE The name of an environment variable, for example, PATH.
ERROR NAME The name of an error, usually returned in the errno variable.
Key The name of a keyboard key. Return and Enter both refer to the
Term The defined use of an important word or phrase.
User input Commands and other text that you type.
represents the system prompt for the Bourne, Korn, and POSIX
shells. A number sign represents the superuser prompt.
Section 5.
must hold down the key labeled Ctrl while you press another key
or mouse button.
same key.
Variable The name of a placeholder in a command, function, or other
syntax display that you replace with an actual value.
[] The contents are optional in syntax. If the contents are a list
separated by |, you must choose one of the items.
{} The contents are required in syntax. If the contents are a list
separated by |, you must choose one of the items.
... The preceding element can be repeated an arbitrary number of
times.
Indicates the continuation of a code example.
| Separates items in a list of choices.
WARNING A warning calls attention to important information that if not
understood or followed will result in personal injury or
nonrecoverable system problems.
CAUTION A caution calls attention to important information that if not
understood or followed will result in data loss, data corruption,
or damage to hardware or software.
IMPORTANT This alert provides essential information to explain a concept or
to complete a task
NOTE A note contains additional information to emphasize or supplement
important points of the main text.
Customer self repair
HP products are designed with many Customer Self Repair parts to minimize repair time and allow
for greater flexibility in performing defective parts replacement. If during the diagnosis period HP
(or HP service providers or service partners) identifies that the repair can be accomplished by the
48 Support and other resources
Page 49

use of a Customer Self Repair part, HP will ship that part directly to you for replacement. There
are two categories of Customer Self Repair parts:
• Mandatory—Parts for which Customer Self Repair is mandatory. If you request HP to replace
these parts, you will be charged for the travel and labor costs of this service.
• Optional—Parts for which Customer Self Repair is optional. These parts are also designed for
customer self repair. If, however, you require that HP replace them for you, there may or may
not be additional charges, depending on the type of warranty service designated for your
product.
NOTE: Some HP parts are not designed for Customer Self Repair. In order to satisfy the customer
warranty, HP requires that an authorized service provider replace the part. These parts are identified
as No in the Illustrated Parts Catalog.
Based on availability and where geography permits, Customer Self Repair parts will be shipped
for next business day delivery. Same day or four-hour delivery may be offered at an additional
charge where geography permits. If assistance is required, you can call the HP Technical Support
Center and a technician will help you over the telephone. HP specifies in the materials shipped
with a replacement Customer Self Repair part whether a defective part must be returned to HP. In
cases where it is required to return the defective part to HP, you must ship the defective part back
to HP within a defined period of time, normally five (5) business days. The defective part must be
returned with the associated documentation in the provided shipping material. Failure to return the
defective part may result in HP billing you for the replacement. With a Customer Self Repair, HP
will pay all shipping and part return costs and determine the courier/carrier to be used.
For more information about the HP Customer Self Repair program, contact your local service
provider. For the North American program, visit the HP website (http://www.hp.com/go/selfrepair).
Customer self repair 49
Page 50

A Useful files and directories
Table 5 Cluster Test Useful Files and Directories
PurposeLocation
DHCP configuration file./etc/dhcpd.conf
/opt/clustertest/bin
/opt/clustertest/model_info
testnodes.pl
CT_<model_name>_<kernel_version>.tar
xcxclus
Location of tests and utility commands, including the
testnodes.pl Cluster Test user interface.
Location of test output./opt/clustertest/logs
The results from the server health check tool./opt/clustertest/logs/server-health/<node-name>
Contains information regarding hardware models. It's used
by clsetup.pl and other commands on the head node.
Location of install/uninstall scripts and sources./opt/clustertest/setup/
Location of MPI license information./opt/hpmpi/licenses
The command to start Cluster Test. You can find it in /opt/
clustertest/bin.
Contains information required to boot compute nodes./tftpboot/netboot_initrd.gz
The command to start Cluster Setup.clsetup.pl
This file contains information on unsupported hardware
captured by Cluster Test and is written to install media.
This is the performance monitor command. You can find it
in /opt/clustertest/bin.
A utility that displays a node performance graph.xcxperf
50 Useful files and directories
Page 51

B Utility commands
The following utility commands are usually invoked from the head node.
NOTE: Cluster Test does not modify the PATH variable on the head node, and therefore any
calls to any commands or utilities referenced in this section must be preceded with the path to the
command, /opt/clustertest/bin/, unless otherwise noted.
analyze
Description – The analyze command creates a performance analysis of a test run. It requires a
test log file and an accompanying test script in order to analyze the test output. An optional third
parameter can be used to specify the location and name of the analysis output file.
Usage –
# analyze <test_log_file> <test_script> [<analysis_log_file>]
In Cluster Test v3.4 and later, the <test_script> parameter is ignored and may be replaced
with a dash.
Files – By default, the analysis file is placed in the current directory and named
yymmdd_hhmm_<testname>.analysis.
apply_new_model_updates
Description – The apply_new_model_updates command is used when there are unsupported
models in the cluster being used as compute nodes. After booting the first node of an unsupported
model and selecting an existing supported model to use as an alias, the initrd used in booting
compute nodes will be updated (/tftpboot/netboot_initrd.gz). The unsupported model
will be treated as a supported model, allowing compute nodes to boot untouched by human hands.
Usage –
# apply_new_model_updates
archive_logs
Description – The archive_logs script is used to capture log files on a cluster after CT is completed
so they can be saved for future reference. It creates a tarball archive of all log files. Options are
available to include or exclude specific logs if necessary, but the default is to grab everything. To
see all the options available, use the help option:
# archive_logs –h
Usage –
# archive_logs [--nohealth] [--notestlogs] [--noinventory] [--nofabric] [--nodmesg] [--noimlsel] [--nosyslog]
<dest_tarball_name>
checkadm
Description – The checkadm command is a Perl script that pings all nodes in the cluster over the
admin network using socktest/socksrv. This command is designed to help in troubleshooting
the admin network connection.
Usage –
# checkadm
checkic
Description – The checkic command is a Perl script that pings all nodes in the cluster over the
interconnect network. This command is designed to help in troubleshooting the cluster's interconnect.
Usage –
# checkic
analyze 51
Page 52

conrep
Description – The conrep script is a wrapper to the conrep utility, which will select the appropriate
conrep version and xml file for the current platform. The conrep utility is used to read and write
system environmental settings. For more information on conrep, refer to the HP SmartStart Scripting
Toolkit Linux Edition User Guide.
Usage –
# conrep -s|-l
Files – When reading server environment settings, the output is written to conrep.dat in the
current directory.
TIP: If you wish to issue the conrep command across multiple nodes in the cluster, it is
recommended you use a pdsh –a “cd /tmp; conrep –s” command. This places the output
file in a node-specific directory in order to avoid overwriting the output file.
cpu_rate
Description – The cpu_rate script benchmarks a variety of system performance parameters. For
more information, use the help option:
# cpu_rate –h
Usage –
# cpu_rate
getMP
Description – The getMP command is a shell script that displays the IP and MAC addresses of an
iLO or IPMI port on a node. This command currently does not support HP Integrity rxXX20 and
rxXX40 models.
Usage –
# getMP
hponcfg
Description – The hponcfg command is an online configuration tool used to set up and reconfigure
RILOE II, iLO, and iLO 2 without requiring a reboot of the server operating system. The utility runs
in command line mode and must be executed from an operating system command line.
Usage – Refer to the HP SmartStart Scripting Toolkit Linux Edition User Guide available at the HP
SmartStart Scripting Toolkit page for hponcfg command line syntax.
ib_fabric_check
Description – The ib_fabric_check command is used to identify ports in the InfiniBand fabric,
check the port error counters, clear the port error counters, locate subnet managers, and indicate
port connections. This utility utilizes OFED scripts provided with the driver to gather information
about the InfiniBand fabric. By default ib_fabric_check will scan the fabric and indicate ports
with link widths that are not 4x, link speeds that are not DDR, ports with non-zero symbol error
counters, and ports with non-zero transmit discard counters. These criteria can be adjusted via the
input parameters.
Usage –
52 Utility commands
Page 53

# ib_fabric_check [clear|scan|fullscan] [<output_dir>] [<link_speed>] [<link_width>]
• clear – The clear option is used to reset the port counters.
• fullscan – The fullscan option adds checking the link receive, link down, and port
receive port counter errors.
• link_speed and link_width – The link_speed and link_width options allow you
to indicate the expected link speed and width, respectively. If a port is found not to have either
of these expected values it is indicated as such in either scan mode (scan or fullscan).
Files – The ib_fabric_check utility will create the following log files in the output_dir, if
specified. The default location is a subdirectory in the current directory named yymmdd_hhmmss_ib.
Table 6 Files generated by ib_fabric_check
a list of all the port counter values per portct_ib.counters
a list of all the active switch and HCA ports detectedct_ib.fabric
a list of all the active port connections detectedct_ib.links
a log of the command outputct_ib.log
output of the ibnetdiscover –p commandibnetdiscover.ports
In addition to the above files, the following ibdiagnet files are also retained. (See ibdiagnet
documentation for file details.)
• ibdiagnet.db
• ibdiagnet.fdbs
• ibdiagnet_ibis.log
• ibdiagnet.log
• ibdiagnet.lst
• ibdiagnet.mcfdbs
• ibdiagnet.pkey
• ibdiagnet.pm
• ibdiagnet.sm
An example ct_ib.counters file is shown below.
[root@node1 ~]# cat 090415_103331_ib/ct_ib.counters
PORT COUNTERS INFORMATION - 090415_103331 - v1.00
Switch Description Port SymbolErr LinkErrRec LinkDown PortRcvErr XmitDiscrd
---------------------------------------- ---- ---------- ---------- ---------- ---------- ----------
MT47396 Infiniscale-III Mellanox Tech 1 0 0 0 0 0
MT47396 Infiniscale-III Mellanox Tech 2 - - - - MT47396 Infiniscale-III Mellanox Tech 3 - - - - MT47396 Infiniscale-III Mellanox Tech 4 0 0 0 0 0
MT47396 Infiniscale-III Mellanox Tech 5 - - - - MT47396 Infiniscale-III Mellanox Tech 6 - - - - MT47396 Infiniscale-III Mellanox Tech 7 - - - - MT47396 Infiniscale-III Mellanox Tech 8 - - - - MT47396 Infiniscale-III Mellanox Tech 9 - - - - MT47396 Infiniscale-III Mellanox Tech 10 0 0 0 0 0
MT47396 Infiniscale-III Mellanox Tech 11 0 0 0 0 0
MT47396 Infiniscale-III Mellanox Tech 12 0 0 0 0 0
MT47396 Infiniscale-III Mellanox Tech 13 0 0 0 0 0
MT47396 Infiniscale-III Mellanox Tech 14 0 0 0 0 0
MT47396 Infiniscale-III Mellanox Tech 15 - - - - MT47396 Infiniscale-III Mellanox Tech 16 0 0 0 0 0
MT47396 Infiniscale-III Mellanox Tech 17 - - - - MT47396 Infiniscale-III Mellanox Tech 18 - - - - MT47396 Infiniscale-III Mellanox Tech 19 - - - - MT47396 Infiniscale-III Mellanox Tech 20 - - - - MT47396 Infiniscale-III Mellanox Tech 21 - - - - MT47396 Infiniscale-III Mellanox Tech 22 - - - - MT47396 Infiniscale-III Mellanox Tech 23 - - - - MT47396 Infiniscale-III Mellanox Tech 24 - - - - -
HCA Description Port SymbolErr LinkErrRec LinkDown PortRcvErr XmitDiscrd
---------------------------------------- ---- ---------- ---------- ---------- ---------- ----------
node5 HCA-1 1 0 0 0 0 0
node1 HCA-1 1 0 0 0 0 0
ib_fabric_check 53
Page 54

node6 HCA-1 1 0 0 0 0 0
node8 HCA-1 1 0 0 0 0 0
node3 HCA-1 1 0 0 0 0 0
node4 HCA-1 1 0 0 0 0 0
node8 HCA-1 1 0 0 0 0 0
node7 HCA-1 1 0 0 0 0 0
inspect_ib_fabric.pl
Description – The inspect_ib_fabric.pl utility is provided as an additional tool for checking
for errors in the InfiniBand fabric. This utility invokes ibnetdiscover and perfquery to detect
components in the fabric and check their port counters. This information is then displayed in various
formats, including one that shows errors on an InfiniBand link basis, depending on which output
format flags are specified.
Usage –
# inspect_ip_fabric.pl [-(details|summary|links|linkerrs|mapping|full)]
[-scan=<file>] [-map=<file>] [-refresh] [-nocounters] [-swirate=<rate>]
[hcarate=<rate>] [-rate=<rate>]
Output Format Options:
• -details – Displays each InfiniBand switch and HCA, along with a list of active ports with
their error counters. Includes GUID, lid, and total port count information.
• -summary – Displays a single-line entry for each InfiniBand component detected in the fabric.
Includes GUID, name, active/available port count, and total error count.
• -links – Displays each physical link between the InfiniBand components in the fabric. Links
are depicted by either a ‘<====>’, ‘<**==>’, ‘<==**>’, or ‘<****>’. A ‘**’ in the link
depiction indicates an error on that side of the link. Links are displayed using the component
name. Detected link speed is also shown.
• -linkerrs – Displays only the links with errors and provides the detailed view of the link
error.
• -mapping – Displays each InfiniBand component along with the name being used to identify
that component.
• -full – Default. displays all the above formats.
Fabric Scan Options:
• -scan=<file> – Specifies the ibnetdiscover input/output file. By default the output file
is /opt/clustertest/logs/ibnetdiscover.log.
• -map=<file> – Specifies a node-name map file to use with the ‘-node-name-map’
ibnetdiscover option. This file is used to override the default description text that is tied
to each GUID.
• -refresh – When specifying an ibnetdiscover input file (-scan), this option skips
running ibnetdiscover to generate a new file. Skips scanning the InfiniBand fabric.
• -nocounters – Do not collect port counter information.
Expected Link Rate Options:
• -swirate=<rate> – Sets the expected switch-to-switch link rate (for example, ‘4xDDR’).
• -hcarate=<rate> – Sets the expected switch-to-HCA link rate (for example, ‘4xDDR’)
• -rate=<rate> – Sets the expected switch-to-switch and switch-to-HCA link rate. The default
expected link rate is ‘4xQDR’.
Naming and mapping – The inspect_ib_fabric.pl utility identifies GUIDs in the InfiniBand
fabric by the description text common to other InfiniBand utilities and by a generated name. The
generated name is in the format SWxxxyy or HCAxxxyy for switches and HCAs respectively.
Whenever possible, inspect_ib_fabric.pl attempts to group InfiniBand components together
using the system GUID. If multiple components are detected in the fabric with the same system
GUID, then they will use the same xxx identifier. The yy identifier is used to uniquely identify each
component with the same system GUID. For example, if a switch with a fabric board and two line
boards were discovered in the fabric utilizing the same system GUID, they would be named
54 Utility commands
Page 55

SW00101, SW00102, and SW00103. The actual numeric order is determined by the order the
components are listed in the idnetdiscover output.
Since the inspect_ib_fabric.pl naming and the default description text might not be enough
to easily identify the components in your InfiniBand fabric, there is the –map option to specify your
own description text. This mapping file specifies a GUID followed by description text which is fed
into ibnetdiscover via its –node-name-map option. Using the mapping file will change the
description text in the inspect_ib_fabric.pl output. The –mapping output format flag can
be used to create the base –map input file.
Link rate and ExpLinkRate – By default, inspect_ib_fabric.pl will expect all InfiniBand
links to be running at 4xQDR. This behavior can be modified by specifying any of the –swirate,
-hcarate, or –rate flags with a new link rate. This allows you to specify a different expected
link rate for switches and HCAs, as can be the case when using multiple QDR switches in a DDR
environment.
If the expected link rate does not match the detected link rate, then a place-holder error counter,
called “ExpLinkRate” is set to 1. If the expected and detected link rates match, then this error
counter is set to 0.
NOTE:
The ExpLinkRate error counter is not a real error counter reported by other InfiniBand utilities.
It is unique to the inspect_ib_fabric.pl utility.
Scan input file and the refresh option – Using the –scan input file flag and the –refresh option
together allows you to view preexisting ibnetdiscover output without the need to run
ibnetdiscover. If the –nocounters option is specified, the input file could also specify
components that currently do not exist in the current fabric, but error counters would not be available.
If error counters are requested (the default) the components should exist in the current fabric.
Sample output
The following is an example of the inspect_ib_fabric.pl -details output.
inspect_ib_fabric.pl 55
Page 56

The following is an example of the inspect_ib_fabric.pl –summary output.
The following is an example of the inspect_ib_fabric.pl –links output.
56 Utility commands
Page 57

The following is an example of the inspect_ib_fabric.pl –linkerrs output.
ipmitool
Description – The ipmitool is a utility for managing and configuring devices that support the
Intelligent Platform Management Interface (IPMI) version 1.5 and version 2.0 specifications. The
ipmitool program provides a simple command-line interface to the BMC (Baseboard Management
Controller.) This utility is integrated into test images. For help with how to use this utility, refer to
its documentation, available at http://ipmitool.sourceforge.net/, or run the command man
ipmitool at the command prompt.
light
Description – The light command is a shell script to illuminate the uid (unit identification) LED on
a node. This command is useful for locating a defective node in the cluster.
Usage –
# light on|off
Example: To illuminate the uid LED on node25, run the following command from the head node:
# ssh node25 light on
list_messages
Description – The list_messages command looks for messages in /var/log/messages and
similar log files for messages matching specific criteria.
ipmitool 57
Page 58

pdsh
Usage –
# list_messages [-q] [-[no]messages] [-[no]summary] [-tag <tag-name>] [-notag <tag-name>]
[-[no]bytest] [-before <date-time>] [-after <date-time>] [-csv] input-file
• -q – Quiet flag – suppresses headings on summary output.
• -h | --help | -help – Prints a help message and quits.
• -[no]messages – Displays any matching messages (-nomessages is the default)
• -[no]summary – Displays summary of mcelog errors; –summary is the default.
• -[no]tag <tag-name> – Displays (or not) messages with the given tag, for example,
mcelog or kernel.
• -[no]bytest – Includes information about what test was running in –summary; –nobytest
is the default.
• -before <date-time> – Only show messages before <date-time>, which is of the form
‘Apr 30 2009 23:14:01’.
• -after <date-time> – Only show messages after <date-time>, which is of the form
‘Apr 30 2009 23:14:01’.
Description – The Open Source pdsh command is a multi-thread remote shell that can be used to
execute a command in parallel on multiple nodes in the cluster. This shell is integrated into test
images. For help with how to use pdsh, refer to its document or run the command man pdsh at
command prompt.
Cluster Test includes a modified version of pdsh that adds a -m option for specifying a different
machines file than the one used by the -a option (/opt/clustertest/logs/machines).
The default fanout value is set to a higher value: 2048 nodes versus the default 32 nodes.
run_cluster_script.pl
Description – The run_cluster_script.pl command is used to run tests from the command
line. It is the command-line equivalent of the Load Script menu option in testnodes.pl.
Usage –
# run_cluster_script.pl <cluster-script-filename>
[check] [-logdir <log-file-directory>]
• -check – Display the contents of the script and exit.
• -logdir <log-file-directory> – By default, each run_cluster_script.pl puts
its test output files in a time-stamped directory under /opt/clustertest/logs just like
testnodes.pl. Using the –logdir option, you can have all the run_cluster_script.pl
commands use the same directory.
See “Running tests in parallel” (page 41) for important information regarding running multiple
cluster tests.
setMP
Description – The setMP command is used to set a static IP for a single IPMI/iLO port. This command
currently does not support HP ProLiant DL145 G2, and HP Integrity rxXX20 and rxXX40 models.
For DL145 G2, the IPMI ports appear to take the new settings but will return to the original settings
when a hard power reset occurs.
Usage –
# setMP <IPaddress> [<netmask>]
• IPaddress – The IP you want to set.
• netmask – The subnet mask. This value may be omitted, and defaults to 255.255.0.0.
58 Utility commands
Page 59

C Sample test output
CrissCross
This sample output of the CrissCross test is with Stress: Length:50000, Iteration: 1000, on a cluster
of 22 nodes – (2) HP ProLiant DL385, and (20) DL145 G2. Node0 and node21 are DL385 with
PCI-X InfiniBand cards. Node[1– 20] are DL145 G2 with PCI-E InfiniBand cards.
n_loops=1000 n_bytes=500000
node0 [ 0] =====>> node1 [ 1] 595.0 MBs
node0 [ 0] =====>> node2 [ 2] 606.3 MBs
node0 [ 0] =====>> node3 [ 3] 609.4 MBs
…
…
…
node0 [ 0] =====>> node21 [ 21] 608.5 MBs
node1 [ 1] =====>> node0 [ 0] 645.5 MBs
node1 [ 1] =====>> node2 [ 2] 924.9 MBs
node1 [ 1] =====>> node3 [ 3] 925.0 MBs
…
…
…
node1 [ 1] =====>> node21 [ 21] 718.7 MBs
node2 [ 2] =====>> node0 [ 0] 701.6 MBs
node2 [ 2] =====>> node1 [ 1] 924.3 MBs
node2 [ 2] =====>> node3 [ 3] 924.9 MBs
…
…
…
node2 [ 2] =====>> node21 [ 21] 717.2 MBs
node3 [ 3] =====>> node0 [ 0] 718.3 MBs
node3 [ 3] =====>> node1 [ 1] 924.9 MBs
node3 [ 3] =====>> node2 [ 2] 924.4 MBs
…
…
…
node3 [ 3] =====>> node21 [ 21] 718.7 MBs
node4 [ 4] =====>> node0 [ 0] 718.6 MBs
node4 [ 4] =====>> node1 [ 1] 924.7 MBs
node4 [ 4] =====>> node2 [ 2] 925.2 MBs
…
…
…
node4 [ 4] =====>> node21 [ 21] 718.8 MBs
node5 [ 5] =====>> node0 [ 0] 718.0 MBs
node5 [ 5] =====>> node1 [ 1] 925.1 MBs
node5 [ 5] =====>> node2 [ 2] 924.9 MBs
…
…
…
node5 [ 5] =====>> node21 [ 21] 718.6 MBs
node6 [ 6] =====>> node0 [ 0] 718.4 MBs
node6 [ 6] =====>> node1 [ 1] 924.6 MBs
node6 [ 6] =====>> node2 [ 2] 924.9 MBs
…
…
…
node6 [ 6] =====>> node21 [ 21] 718.6 MBs
…
…
…
node7 [ 7] =====>> node21 [ 21] 718.6 MBs
node8 [ 8] =====>> node0 [ 0] 718.0 MBs
CrissCross 59
Page 60

node8 [ 8] =====>> node1 [ 1] 924.5 MBs
node8 [ 8] =====>> node2 [ 2] 924.8 MBs
…
…
…
node8 [ 8] =====>> node21 [ 21] 718.3 MBs
node9 [ 9] =====>> node0 [ 0] 718.4 MBs
node9 [ 9] =====>> node1 [ 1] 924.6 MBs
node9 [ 9] =====>> node2 [ 2] 924.6 MBs
…
…
…
node9 [ 9] =====>> node21 [ 21] 718.7 MBs
node10 [ 10] =====>> node0 [ 0] 718.4 MBs
node10 [ 10] =====>> node1 [ 1] 924.4 MBs
node10 [ 10] =====>> node2 [ 2] 924.2 MBs
…
…
…
node10 [ 10] =====>> node21 [ 21] 718.4 MBs
node11 [ 11] =====>> node0 [ 0] 718.1 MBs
node11 [ 11] =====>> node1 [ 1] 924.6 MBs
node11 [ 11] =====>> node2 [ 2] 924.3 MBs
…
…
…
node11 [ 11] =====>> node21 [ 21] 718.4 MBs
node12 [ 12] =====>> node0 [ 0] 718.2 MBs
node12 [ 12] =====>> node1 [ 1] 924.7 MBs
node12 [ 12] =====>> node2 [ 2] 924.7 MBs
…
…
…
node12 [ 12] =====>> node21 [ 21] 718.5 MBs
node13 [ 13] =====>> node0 [ 0] 714.6 MBs
node13 [ 13] =====>> node1 [ 1] 924.9 MBs
node13 [ 13] =====>> node2 [ 2] 924.8 MBs
…
…
…
node13 [ 13] =====>> node21 [ 21] 718.7 MBs
node14 [ 14] =====>> node0 [ 0] 718.3 MBs
node14 [ 14] =====>> node1 [ 1] 924.6 MBs
node14 [ 14] =====>> node2 [ 2] 924.9 MBs
…
…
…
node14 [ 14] =====>> node21 [ 21] 718.6 MBs
node15 [ 15] =====>> node0 [ 0] 704.4 MBs
node15 [ 15] =====>> node1 [ 1] 924.6 MBs
node15 [ 15] =====>> node2 [ 2] 924.6 MBs
…
…
…
node15 [ 15] =====>> node21 [ 21] 718.5 MBs
node16 [ 16] =====>> node0 [ 0] 699.2 MBs
node16 [ 16] =====>> node1 [ 1] 924.2 MBs
node16 [ 16] =====>> node2 [ 2] 924.4 MBs
…
…
…
node16 [ 16] =====>> node21 [ 21] 718.4 MBs
node17 [ 17] =====>> node0 [ 0] 718.0 MBs
node17 [ 17] =====>> node1 [ 1] 924.1 MBs
node17 [ 17] =====>> node2 [ 2] 924.1 MBs
60 Sample test output
Page 61

…
…
…
node17 [ 17] =====>> node21 [ 21] 718.6 MBs
node18 [ 18] =====>> node0 [ 0] 718.4 MBs
node18 [ 18] =====>> node1 [ 1] 924.9 MBs
node18 [ 18] =====>> node2 [ 2] 924.6 MBs
…
…
…
node18 [ 18] =====>> node21 [ 21] 718.6 MBs
node19 [ 19] =====>> node0 [ 0] 718.2 MBs
node19 [ 19] =====>> node1 [ 1] 924.8 MBs
node19 [ 19] =====>> node2 [ 2] 924.5 MBs
…
…
…
node19 [ 19] =====>> node21 [ 21] 716.9 MBs
node20 [ 20] =====>> node0 [ 0] 712.8 MBs
node20 [ 20] =====>> node1 [ 1] 925.0 MBs
node20 [ 20] =====>> node2 [ 2] 924.9 MBs
…
…
…
node20 [ 20] =====>> node21 [ 21] 716.2 MBs
node21 [ 21] =====>> node0 [ 0] 604.5 MBs
node21 [ 21] =====>> node1 [ 1] 610.1 MBs
node21 [ 21] =====>> node2 [ 2] 610.1 MBs
…
…
…
node21 [ 21] =====>> node20 [ 20] 609.9 MBs
Test4
This is sample output of Test4 with Stress, Length: 30000, Iterations: 4000; a cluster of 262 nodes.
Starting /clustertest/test4 with 1048 PE; Loops=4000 Length=30000
14:25:43 - completed 0 iterations...................
14:29:33 - completed 20 iterations...................
14:32:59 - completed 40 iterations...................
14:36:19 - completed 60 iterations...................
14:39:14 - completed 80 iterations...................
14:42:16 - completed 100 iterations...................
14:45:13 - completed 120 iterations...................
14:48:12 - completed 140 iterations...................
…
…
…
16:42:46 - completed 920 iterations...................
16:45:40 - completed 940 iterations...................
16:48:34 - completed 960 iterations...................
16:51:29 - completed 980 iterations...................
16:54:25 - completed 1000 iterations...................
16:57:21 - completed 1020 iterations...................
17:00:20 - completed 1040 iterations...................
17:03:17 - completed 1060 iterations...................
17:06:13 - completed 1080 iterations...................
17:09:11 - completed 1100 iterations...................
17:12:05 - completed 1120 iterations...................
17:14:57 - completed 1140 iterations...................
…
…
…
Test4 61
Page 62

19:48:16 - completed 2180 iterations...................
19:51:12 - completed 2200 iterations...................
19:54:08 - completed 2220 iterations...................
19:57:05 - completed 2240 iterations...................
20:00:02 - completed 2260 iterations...................
20:02:59 - completed 2280 iterations...................
20:05:56 - completed 2300 iterations...................
…
…
…
21:22:17 - completed 2820 iterations...................
21:25:12 - completed 2840 iterations...................
21:28:11 - completed 2860 iterations...................
21:31:05 - completed 2880 iterations...................
21:34:02 - completed 2900 iterations...................
21:37:01 - completed 2920 iterations...................
21:39:58 - completed 2940 iterations...................
21:42:52 - completed 2960 iterations...................
21:45:45 - completed 2980 iterations...................
21:48:42 - completed 3000 iterations...................
21:51:37 - completed 3020 iterations...................
21:54:35 - completed 3040 iterations...................
21:57:33 - completed 3060 iterations...................
22:00:30 - completed 3080 iterations...................
22:03:27 - completed 3100 iterations...................
22:06:26 - completed 3120 iterations...................
22:09:20 - completed 3140 iterations...................
…
…
…
23:40:11 - completed 3760 iterations...................
23:43:07 - completed 3780 iterations...................
23:46:02 - completed 3800 iterations...................
23:48:58 - completed 3820 iterations...................
23:51:56 - completed 3840 iterations...................
23:54:51 - completed 3860 iterations...................
23:57:46 - completed 3880 iterations...................
0:00:41 - completed 3900 iterations...................
0:03:37 - completed 3920 iterations...................
0:06:32 - completed 3940 iterations...................
0:09:34 - completed 3960 iterations...................
0:12:29 - completed 3980 iterations...................
0:12:29 - completed 4000 iterations
---------------TIMING RESULTS---------------
Average Time = 35381.426915 seconds
Minimum Time = 35379.747124 @ rank = 443
Maximum Time = 35384.055447 @ rank = 1035
Average Rate = 115.615385 MB/S
Minimum Rate = 114.619332 MB/S @ rank = 0
Maximum Rate = 116.599550 MB/S @ rank = 1047
--------------------------------------------
Test4 Test PASSED
Pallas
#--------------------------------------------------# Intel (R) MPI Benchmark Suite V2.3, MPI-1 part
#--------------------------------------------------# Date : Tue Feb 27 19:18:31 2007
# Machine : x86_64# System : Linux
# Release : 2.6.18.6
# Version : #1 SMP Fri Dec 22 12:05:38 CST 2006
62 Sample test output
Page 63

#
# Minimum message length in bytes: 0
# Maximum message length in bytes: 4194304
#
# MPI_Datatype : MPI_BYTE
# MPI_Datatype for reductions : MPI_FLOAT
# MPI_Op : MPI_SUM
#
#
# List of Benchmarks to run:
# Exchange
# Sendrecv
# Bcast
# Allgather
# Allreduce
#----------------------------------------------------------------------------# Benchmarking Exchange
# #processes = 22
#---------------------------------------------------------------------------- #bytes #repetitions t_min[usec] t_max[usec] t_avg[usec] Mbytes/sec
0 1000 13.16 13.19 13.17 0.00
1 1000 13.19 13.21 13.20 0.29
2 1000 13.40 13.42 13.41 0.57
4 1000 13.29 13.32 13.30 1.15
8 1000 13.25 13.27 13.26 2.30
16 1000 13.32 13.36 13.34 4.57
32 1000 13.83 13.86 13.84 8.81
64 1000 13.51 13.56 13.54 18.00
128 1000 15.62 15.69 15.65 31.13
256 1000 16.19 16.24 16.21 60.12
512 1000 17.18 17.21 17.19 113.48
1024 1000 19.34 19.41 19.37 201.22
2048 1000 23.34 23.40 23.36 333.91
4096 1000 38.03 38.23 38.14 408.71
8192 1000 66.65 66.97 66.81 466.65
16384 1000 134.90 135.71 135.36 460.55
32768 1000 322.05 323.30 322.73 386.64
65536 640 658.32 663.55 661.15 376.76
131072 320 1267.95 1288.82 1279.23 387.95
262144 160 2462.22 2546.07 2507.56 392.76
524288 80 4863.05 5199.07 5044.41 384.68
1048576 40 8758.75 10103.50 9484.46 395.90
2097152 20 14739.60 20112.30 17641.88 397.77
4194304 10 18561.22 40058.40 30159.69 399.42
#----------------------------------------------------------------------------# Benchmarking Sendrecv
# #processes = 22
#---------------------------------------------------------------------------- #bytes #repetitions t_min[usec] t_max[usec] t_avg[usec] Mbytes/sec
0 1000 7.42 7.45 7.43 0.00
1 1000 7.45 7.47 7.46 0.26
2 1000 7.45 7.50 7.48 0.51
4 1000 7.47 7.49 7.48 1.02
8 1000 7.50 7.52 7.51 2.03
16 1000 7.43 7.45 7.44 4.09
32 1000 7.61 7.69 7.67 7.94
64 1000 7.55 7.59 7.57 16.08
128 1000 8.23 8.27 8.25 29.51
256 1000 9.86 9.90 9.88 49.32
512 1000 8.85 8.89 8.87 109.82
1024 1000 9.49 9.52 9.50 205.23
2048 1000 12.45 12.50 12.47 312.50
4096 1000 18.33 18.40 18.36 424.48
8192 1000 31.23 31.43 31.34 497.17
16384 1000 59.41 59.84 59.65 522.23
32768 1000 142.70 143.56 143.18 435.35
65536 640 259.30 261.97 260.77 477.16
131072 320 487.65 498.05 493.36 501.96
Pallas 63
Page 64

262144 160 929.73 970.74 952.13 515.07
524288 80 1761.65 1926.17 1851.64 519.16
1048576 40 3170.28 3827.90 3529.97 522.48
2097152 20 5001.29 7626.65 6437.38 524.48
4194304 10 4963.40 15219.00 10481.13 525.66
#---------------------------------------------------------------# Benchmarking Bcast
# #processes = 22
#--------------------------------------------------------------- #bytes #repetitions t_min[usec] t_max[usec] t_avg[usec]
0 1000 0.03 0.04 0.04
1 1000 27.20 27.32 27.23
2 1000 26.78 26.79 26.79
4 1000 27.36 27.38 27.37
8 1000 27.39 27.42 27.40
16 1000 27.13 27.15 27.13
32 1000 27.24 27.31 27.26
64 1000 27.41 27.44 27.42
128 1000 29.74 29.75 29.75
256 1000 29.81 29.86 29.82
512 1000 30.51 30.52 30.51
1024 1000 33.78 33.90 33.80
2048 1000 42.52 42.54 42.53
4096 1000 51.99 52.03 52.01
8192 1000 77.67 77.77 77.74
16384 1000 142.16 142.27 142.21
32768 1000 284.29 284.45 284.38
65536 640 465.54 465.83 465.74
131072 320 829.94 830.96 830.61
262144 160 1559.57 1563.34 1561.91
524288 80 3007.90 3022.06 3016.72
1048576 40 5840.35 5895.48 5874.34
2097152 20 11108.60 11326.46 11242.41
4194304 10 23759.60 24624.30 24290.34
#---------------------------------------------------------------# Benchmarking Allgather
# #processes = 22
#--------------------------------------------------------------- #bytes #repetitions t_min[usec] t_max[usec] t_avg[usec]
0 1000 0.02 0.03 0.02
1 1000 153.92 153.94 153.93
2 1000 153.86 153.89 153.88
4 1000 175.11 175.13 175.12
8 1000 155.73 155.76 155.75
16 1000 154.61 154.63 154.62
32 1000 154.34 154.36 154.35
64 1000 154.85 154.89 154.87
128 1000 168.69 168.73 168.71
256 1000 172.43 172.46 172.44
512 1000 177.11 177.15 177.12
1024 1000 199.90 199.93 199.92
2048 1000 297.04 297.08 297.06
4096 1000 402.43 402.51 402.46
8192 1000 671.18 671.38 671.29
16384 1000 1272.68 1273.13 1272.94
32768 1000 3058.58 3059.46 3059.04
65536 640 5694.53 5697.22 5695.95
131072 320 10611.49 10621.93 10617.14
262144 160 20616.96 20658.34 20639.47
524288 80 41122.01 41287.57 41212.10
1048576 40 81751.72 82413.50 82112.76
2097152 20 161162.40 163806.06 162606.90
4194304 10 317121.79 327695.49 322904.26
#---------------------------------------------------------------# Benchmarking Allreduce
# #processes = 22
#--------------------------------------------------------------- #bytes #repetitions t_min[usec] t_max[usec] t_avg[usec]
0 1000 0.02 0.02 0.02
64 Sample test output
Page 65

Stream
4 1000 42.60 42.61 42.61
8 1000 45.14 45.14 45.14
16 1000 42.83 42.84 42.84
32 1000 46.46 46.46 46.46
64 1000 44.62 44.63 44.62
128 1000 58.27 58.29 58.28
256 1000 61.13 61.15 61.15
512 1000 70.58 70.60 70.60
1024 1000 81.64 81.66 81.65
2048 1000 113.24 113.29 113.27
4096 1000 158.73 158.80 158.78
8192 1000 296.67 296.83 296.78
16384 1000 534.17 534.48 534.39
32768 1000 925.54 926.11 925.76
65536 640 1643.30 1644.20 1643.76
131072 320 1211.07 1211.61 1211.35
262144 160 2377.06 2379.35 2378.28
524288 80 9937.20 9945.09 9941.42
1048576 40 14141.08 14171.55 14157.80
2097152 20 23278.50 23407.60 23348.72
4194304 10 41601.71 42125.80 41887.28
This is sample output of a Stream test on a cluster of 349 nodes.
Running Memory Benchmark
node1: ------------------------------------------------------------node1: This system uses 8 bytes per DOUBLE PRECISION word.
node1: ------------------------------------------------------------node1: Array size = 44739242, Offset = 0
node1: Total memory required = 1024.0 MB.
node1: Each test is run 25 times, but only
node1: the *best* time for each is used.
node1: Function Rate (MB/s) Avg time Min time Max time
node1: Copy: 2679.4987 0.2566 0.2671 0.2675
node1: Scale: 2606.1366 0.2640 0.2747 0.2776
node1: Add: 3090.3320 0.3339 0.3475 0.3507
node1: Triad: 3086.9809 0.3342 0.3478 0.3488
node1: ------------------------------------------------------------node1: Solution Validates
node1: ------------------------------------------------------------node9: ------------------------------------------------------------node9: This system uses 8 bytes per DOUBLE PRECISION word.
node9: ------------------------------------------------------------node9: Array size = 44739242, Offset = 0
node9: Total memory required = 1024.0 MB.
node9: Each test is run 25 times, but only
node9: the *best* time for each is used.
node9: Function Rate (MB/s) Avg time Min time Max time
node9: Copy: 2672.2059 0.2582 0.2679 0.2714
node9: Scale: 2605.7793 0.2648 0.2747 0.2781
node9: Add: 3095.3829 0.3345 0.3469 0.3518
node9: Triad: 3093.9731 0.3348 0.3470 0.3522
node9: ------------------------------------------------------------node9: Solution Validates
node9: ------------------------------------------------------------node24: ------------------------------------------------------------node24: This system uses 8 bytes per DOUBLE PRECISION word.
node24: ------------------------------------------------------------node24: Array size = 44739242, Offset = 0
node24: Total memory required = 1024.0 MB.
node24: Each test is run 25 times, but only
node24: the *best* time for each is used.
node24: Function Rate (MB/s) Avg time Min time Max time
node24: Copy: 2662.2282 0.2587 0.2689 0.2725
node24: Scale: 2599.2867 0.2649 0.2754 0.2786
node24: Add: 3081.9215 0.3353 0.3484 0.3533
Stream 65
Page 66

node24: Triad: 3078.7949 0.3355 0.3488 0.3536
node24: ------------------------------------------------------------...
…
…
…
…
node343: ------------------------------------------------------------node343: This system uses 8 bytes per DOUBLE PRECISION word.
node343: -------------------------------------------------------------
node343: Array size = 44739242, Offset = 0
node343: Total memory required = 1024.0 MB.
node343: Each test is run 25 times, but only
node343: the *best* time for each is used.
node343: Function Rate (MB/s) Avg time Min time Max time
node343: Copy: 1895.4436 0.3643 0.3777 0.3870
node343: Scale: 1880.2992 0.3671 0.3807 0.3857
node343: Add: 2067.1742 0.5001 0.5194 0.5243
node343: Triad: 2064.0705 0.5009 0.5202 0.5248
node343: ------------------------------------------------------------node343: Solution Validates
node343: ------------------------------------------------------------node342: ------------------------------------------------------------node342: This system uses 8 bytes per DOUBLE PRECISION word.
node342: ------------------------------------------------------------node342: Array size = 44739242, Offset = 0
node342: Total memory required = 1024.0 MB.
node342: Each test is run 25 times, but only
node342: the *best* time for each is used.
node342: Function Rate (MB/s) Avg time Min time Max time
node342: Copy: 1891.2135 0.3651 0.3785 0.3836
node342: Scale: 1875.7765 0.3681 0.3816 0.3867
node342: Add: 2067.3014 0.5001 0.5194 0.5241
node342: Triad: 2065.2414 0.5007 0.5199 0.5249
node342: ------------------------------------------------------------node342: Solution Validates
node342: ------------------------------------------------------------node341: ------------------------------------------------------------node341: This system uses 8 bytes per DOUBLE PRECISION word.
node341: ------------------------------------------------------------node341: Array size = 44739242, Offset = 0
node341: Total memory required = 1024.0 MB.
node341: Each test is run 25 times, but only
node341: the *best* time for each is used.
node341: Function Rate (MB/s) Avg time Min time Max time
node341: Copy: 1892.0167 0.3651 0.3783 0.3856
node341: Scale: 1876.0308 0.3682 0.3816 0.3871
node341: Add: 2067.1145 0.5002 0.5194 0.5254
node341: Triad: 2062.9841 0.5013 0.5205 0.5276
node341: ------------------------------------------------------------node341: Solution Validates
node341: ------------------------------------------------------------node344: ------------------------------------------------------------node344: This system uses 8 bytes per DOUBLE PRECISION word.
node344: ------------------------------------------------------------node344: Array size = 44739242, Offset = 0
node344: Total memory required = 1024.0 MB.
node344: Each test is run 25 times, but only
node344: the *best* time for each is used.
node344: Function Rate (MB/s) Avg time Min time Max time
node344: Copy: 1897.6503 0.3875 0.3772 0.4227
node344: Scale: 1881.8608 0.3933 0.3804 0.4294
node344: Add: 2067.7703 0.5438 0.5193 0.5958
node344: Triad: 2065.9766 0.5438 0.5197 0.5957
66 Sample test output
Page 67

node344: ------------------------------------------------------------node344: Solution Validates
node344: -------------------------------------------------------------
Disk Test
********************************************************************
Node: node1 - Serial: USE644N3HV
Testing random Read/Write for 1200 seconds
********************************************************************
IOIOIOIOIOIOIOIOIOIOI XDD version 6.4.121805.1912MST IOIOIOIOIOIOIOIOIOIOIOI
xdd - I/O Performance Inc. c1992-2005
Starting time for this run, Tue Nov 14 17:34:24 2006
ID for this run, 'No ID Specified'
Maximum Process Priority, disabled
Passes, 1
Pass Delay in seconds, 0
Maximum Error Threshold, 0
I/O Synchronization, 0
Target Offset, 0
Total run-time limit in seconds, 1200
Output file name, stdout
CSV output file name,
Error output file name, stderr
Pass seek randomization, disabled
File write synchronization, disabled
Pass synchronization barriers, enabled
Number of Targets, 1
Number of I/O Threads, 1
Computer Name, node1, User Name, (null)
OS release and version, Linux 2.6.18 #6 SMP Thu Nov 2 16:25:15 CST 2006
Machine hardware type, x86_64
Number of processors on this system, 4
Page size in bytes, 4096
Number of physical pages, 4109386
Megabytes of physical memory, 16052
Seconds before starting, 0
Target[0] Q[0], /dev/sda
Target directory, "./"
Process ID, 6850
Thread ID, 1082132832
Processor, all/any
Read/write ratio, 50.00, 50.00
Throttle in MB/sec, 0.00
Per-pass time limit in seconds, 0
Blocksize in bytes, 1024
Request size, 128, blocks, 131072, bytes
Start offset, 0
Number of MegaBytes, 512
Pass Offset in blocks, 0
I/O memory buffer is a normal memory buffer
I/O memory buffer alignment in bytes, 4096
Data pattern in buffer, 0x0
Data buffer verification is , disabled.
Direct I/O, enabled
Seek pattern, staggered
Seek range, 1048576
Preallocation, 0
Queue Depth, 1
Timestamping, disabled
Delete file, disabled
T Q Bytes Ops Time Rate IOPS Latency %CPU OP_Type ReqSize
Combined 1 1 15243411456 116298 1200.005 12.703 96.91 0.0103 0.00 mixed
131072
Ending time for this run, Tue Nov 14 17:54:24 2006
********************************************************************
Node: node2 - Serial: USE644N3HS
Testing random Read/Write for 1200 seconds
********************************************************************
IOIOIOIOIOIOIOIOIOIOI XDD version 6.4.121805.1912MST IOIOIOIOIOIOIOIOIOIOIOI
xdd - I/O Performance Inc. c1992-2005
Starting time for this run, Tue Nov 14 17:34:28 2006
ID for this run, 'No ID Specified'
Maximum Process Priority, disabled
Passes, 1
Pass Delay in seconds, 0
Maximum Error Threshold, 0
I/O Synchronization, 0
Target Offset, 0
Total run-time limit in seconds, 1200
Output file name, stdout
CSV output file name,
Error output file name, stderr
Pass seek randomization, disabled
Disk Test 67
Page 68

File write synchronization, disabled
Pass synchronization barriers, enabled
Number of Targets, 1
Number of I/O Threads, 1
Computer Name, node2, User Name, (null)
OS release and version, Linux 2.6.18 #6 SMP Thu Nov 2 16:25:15 CST 2006
Machine hardware type, x86_64
Number of processors on this system, 4
Page size in bytes, 4096
Number of physical pages, 4109386
Megabytes of physical memory, 16052
Seconds before starting, 0
Target[0] Q[0], /dev/sda
Target directory, "./"
Process ID, 11280
Thread ID, 1082132832
Processor, all/any
Read/write ratio, 50.00, 50.00
Throttle in MB/sec, 0.00
Per-pass time limit in seconds, 0
Blocksize in bytes, 1024
Request size, 128, blocks, 131072, bytes
Start offset, 0
Number of MegaBytes, 512
Pass Offset in blocks, 0
I/O memory buffer is a normal memory buffer
I/O memory buffer alignment in bytes, 4096
Data pattern in buffer, 0x0
Data buffer verification is , disabled.
Direct I/O, enabled
Seek pattern, staggered
Seek range, 1048576
Preallocation, 0
Queue Depth, 1
Timestamping, disabled
Delete file, disabled
T Q Bytes Ops Time Rate IOPS Latency %CPU OP_Type ReqSize
Combined 1 1 15270805504 116507 1200.009 12.726 97.09 0.0103 0.00 mixed
131072
Ending time for this run, Tue Nov 14 17:54:28 2006
Linpack
============================================================================
HPLinpack 1.0a -- High-Performance Linpack benchmark -- January 20, 2004
Written by A. Petitet and R. Clint Whaley, Innovative Computing Labs., UTK
============================================================================
An explanation of the input/output parameters follows:
T/V : Wall time / encoded variant.
N : The order of the coefficient matrix A.
NB : The partitioning blocking factor.
P : The number of process rows.
Q : The number of process columns.
Time : Time in seconds to solve the linear system.
Gflops : Rate of execution for solving the linear system.
The following parameter values will be used:
N : 12000
NB : 200
PMAP : Row-major process mapping
P : 1
Q : 2
PFACT : Left Crout Right
NBMIN : 2 4
NDIV : 2
RFACT : Left Crout Right
BCAST : 1ring
DEPTH : 0
SWAP : Mix (threshold = 64)
L1 : transposed form
U : transposed form
EQUIL : yes
ALIGN : 4 double precision words
----------------------------------------------------------------------------
68 Sample test output
Page 69

- The matrix A is randomly generated for each test.
- The following scaled residual checks will be computed:
1) ||Ax-b||_oo / ( eps * ||A||_1 * N )
2) ||Ax-b||_oo / ( eps * ||A||_1 * ||x||_1 )
3) ||Ax-b||_oo / ( eps * ||A||_oo * ||x||_oo )
- The relative machine precision (eps) is taken to be 1.110223e-16
- Computational tests pass if scaled residuals are less than 16.0
============================================================================
T/V N NB P Q Time Gflops
---------------------------------------------------------------------------WR00L2L2 12000 200 1 2 67.61 1.704e+01
----------------------------------------------------------------------------
||Ax-b||_oo / ( eps * ||A||_1 * N ) = 0.0031333 ...... PASSED
||Ax-b||_oo / ( eps * ||A||_1 * ||x||_1 ) = 0.0061184 ...... PASSED
||Ax-b||_oo / ( eps * ||A||_oo * ||x||_oo ) = 0.0012344 ...... PASSED
============================================================================
T/V N NB P Q Time Gflops
---------------------------------------------------------------------------WR00L2L4 12000 200 1 2 66.97 1.720e+01
----------------------------------------------------------------------------
||Ax-b||_oo / ( eps * ||A||_1 * N ) = 0.0033367 ...... PASSED
||Ax-b||_oo / ( eps * ||A||_1 * ||x||_1 ) = 0.0065157 ...... PASSED
||Ax-b||_oo / ( eps * ||A||_oo * ||x||_oo ) = 0.0013146 ...... PASSED
============================================================================
T/V N NB P Q Time Gflops
---------------------------------------------------------------------------WR00L2C2 12000 200 1 2 67.56 1.706e+01
----------------------------------------------------------------------------
||Ax-b||_oo / ( eps * ||A||_1 * N ) = 0.0031333 ...... PASSED
||Ax-b||_oo / ( eps * ||A||_1 * ||x||_1 ) = 0.0061184 ...... PASSED
||Ax-b||_oo / ( eps * ||A||_oo * ||x||_oo ) = 0.0012344 ...... PASSED
============================================================================
T/V N NB P Q Time Gflops
---------------------------------------------------------------------------WR00L2C4 12000 200 1 2 66.93 1.722e+01
----------------------------------------------------------------------------
||Ax-b||_oo / ( eps * ||A||_1 * N ) = 0.0033554 ...... PASSED
||Ax-b||_oo / ( eps * ||A||_1 * ||x||_1 ) = 0.0065522 ...... PASSED
||Ax-b||_oo / ( eps * ||A||_oo * ||x||_oo ) = 0.0013220 ...... PASSED
============================================================================
T/V N NB P Q Time Gflops
---------------------------------------------------------------------------WR00L2R2 12000 200 1 2 66.94 1.721e+01
----------------------------------------------------------------------------
||Ax-b||_oo / ( eps * ||A||_1 * N ) = 0.0031333 ...... PASSED
||Ax-b||_oo / ( eps * ||A||_1 * ||x||_1 ) = 0.0061184 ...... PASSED
||Ax-b||_oo / ( eps * ||A||_oo * ||x||_oo ) = 0.0012344 ...... PASSED
============================================================================
T/V N NB P Q Time Gflops
---------------------------------------------------------------------------WR00L2R4 12000 200 1 2 66.97 1.720e+01
----------------------------------------------------------------------------
||Ax-b||_oo / ( eps * ||A||_1 * N ) = 0.0027432 ...... PASSED
||Ax-b||_oo / ( eps * ||A||_1 * ||x||_1 ) = 0.0053566 ...... PASSED
||Ax-b||_oo / ( eps * ||A||_oo * ||x||_oo ) = 0.0010807 ...... PASSED
============================================================================
T/V N NB P Q Time Gflops
---------------------------------------------------------------------------WR00C2L2 12000 200 1 2 66.94 1.721e+01
----------------------------------------------------------------------------
||Ax-b||_oo / ( eps * ||A||_1 * N ) = 0.0031333 ...... PASSED
||Ax-b||_oo / ( eps * ||A||_1 * ||x||_1 ) = 0.0061184 ...... PASSED
||Ax-b||_oo / ( eps * ||A||_oo * ||x||_oo ) = 0.0012344 ...... PASSED
============================================================================
T/V N NB P Q Time Gflops
---------------------------------------------------------------------------WR00C2L4 12000 200 1 2 66.84 1.724e+01
----------------------------------------------------------------------------
||Ax-b||_oo / ( eps * ||A||_1 * N ) = 0.0033367 ...... PASSED
||Ax-b||_oo / ( eps * ||A||_1 * ||x||_1 ) = 0.0065157 ...... PASSED
||Ax-b||_oo / ( eps * ||A||_oo * ||x||_oo ) = 0.0013146 ...... PASSED
Linpack 69
Page 70

============================================================================
T/V N NB P Q Time Gflops
----------------------------------------------------------------------------
WR00C2C2 12000 200 1 2 67.02 1.719e+01
----------------------------------------------------------------------------
||Ax-b||_oo / ( eps * ||A||_1 * N ) = 0.0031333 ...... PASSED
||Ax-b||_oo / ( eps * ||A||_1 * ||x||_1 ) = 0.0061184 ...... PASSED
||Ax-b||_oo / ( eps * ||A||_oo * ||x||_oo ) = 0.0012344 ...... PASSED
============================================================================
T/V N NB P Q Time Gflops
----------------------------------------------------------------------------
WR00C2C4 12000 200 1 2 67.17 1.715e+01
----------------------------------------------------------------------------
||Ax-b||_oo / ( eps * ||A||_1 * N ) = 0.0033554 ...... PASSED
||Ax-b||_oo / ( eps * ||A||_1 * ||x||_1 ) = 0.0065522 ...... PASSED
||Ax-b||_oo / ( eps * ||A||_oo * ||x||_oo ) = 0.0013220 ...... PASSED
============================================================================
T/V N NB P Q Time Gflops
----------------------------------------------------------------------------
WR00C2R2 12000 200 1 2 67.07 1.718e+01
----------------------------------------------------------------------------
||Ax-b||_oo / ( eps * ||A||_1 * N ) = 0.0031333 ...... PASSED
||Ax-b||_oo / ( eps * ||A||_1 * ||x||_1 ) = 0.0061184 ...... PASSED
||Ax-b||_oo / ( eps * ||A||_oo * ||x||_oo ) = 0.0012344 ...... PASSED
============================================================================
T/V N NB P Q Time Gflops
----------------------------------------------------------------------------
WR00C2R4 12000 200 1 2 67.05 1.718e+01
----------------------------------------------------------------------------
||Ax-b||_oo / ( eps * ||A||_1 * N ) = 0.0027432 ...... PASSED
||Ax-b||_oo / ( eps * ||A||_1 * ||x||_1 ) = 0.0053566 ...... PASSED
||Ax-b||_oo / ( eps * ||A||_oo * ||x||_oo ) = 0.0010807 ...... PASSED
============================================================================
T/V N NB P Q Time Gflops
----------------------------------------------------------------------------
WR00R2L2 12000 200 1 2 67.08 1.718e+01
----------------------------------------------------------------------------
||Ax-b||_oo / ( eps * ||A||_1 * N ) = 0.0031333 ...... PASSED
||Ax-b||_oo / ( eps * ||A||_1 * ||x||_1 ) = 0.0061184 ...... PASSED
||Ax-b||_oo / ( eps * ||A||_oo * ||x||_oo ) = 0.0012344 ...... PASSED
============================================================================
T/V N NB P Q Time Gflops
----------------------------------------------------------------------------
WR00R2L4 12000 200 1 2 66.81 1.725e+01
----------------------------------------------------------------------------
||Ax-b||_oo / ( eps * ||A||_1 * N ) = 0.0033367 ...... PASSED
||Ax-b||_oo / ( eps * ||A||_1 * ||x||_1 ) = 0.0065157 ...... PASSED
||Ax-b||_oo / ( eps * ||A||_oo * ||x||_oo ) = 0.0013146 ...... PASSED
============================================================================
T/V N NB P Q Time Gflops
----------------------------------------------------------------------------
WR00R2C2 12000 200 1 2 66.98 1.720e+01
----------------------------------------------------------------------------
||Ax-b||_oo / ( eps * ||A||_1 * N ) = 0.0031333 ...... PASSED
||Ax-b||_oo / ( eps * ||A||_1 * ||x||_1 ) = 0.0061184 ...... PASSED
||Ax-b||_oo / ( eps * ||A||_oo * ||x||_oo ) = 0.0012344 ...... PASSED
============================================================================
T/V N NB P Q Time Gflops
----------------------------------------------------------------------------
WR00R2C4 12000 200 1 2 66.85 1.724e+01
----------------------------------------------------------------------------
||Ax-b||_oo / ( eps * ||A||_1 * N ) = 0.0033554 ...... PASSED
||Ax-b||_oo / ( eps * ||A||_1 * ||x||_1 ) = 0.0065522 ...... PASSED
||Ax-b||_oo / ( eps * ||A||_oo * ||x||_oo ) = 0.0013220 ...... PASSED
============================================================================
T/V N NB P Q Time Gflops
----------------------------------------------------------------------------
WR00R2R2 12000 200 1 2 67.01 1.719e+01
----------------------------------------------------------------------------
||Ax-b||_oo / ( eps * ||A||_1 * N ) = 0.0031333 ...... PASSED
||Ax-b||_oo / ( eps * ||A||_1 * ||x||_1 ) = 0.0061184 ...... PASSED
||Ax-b||_oo / ( eps * ||A||_oo * ||x||_oo ) = 0.0012344 ...... PASSED
70 Sample test output
Page 71

============================================================================
T/V N NB P Q Time Gflops
---------------------------------------------------------------------------WR00R2R4 12000 200 1 2 67.71 1.702e+01
----------------------------------------------------------------------------
||Ax-b||_oo / ( eps * ||A||_1 * N ) = 0.0027432 ...... PASSED
||Ax-b||_oo / ( eps * ||A||_1 * ||x||_1 ) = 0.0053566 ...... PASSED
||Ax-b||_oo / ( eps * ||A||_oo * ||x||_oo ) = 0.0010807 ...... PASSED
============================================================================
Finished 18 tests with the following results:
18 tests completed and passed residual checks,
0 tests completed and failed residual checks,
0 tests skipped because of illegal input values.
----------------------------------------------------------------------------
End of Tests.
============================================================================
Linpack 71
Page 72

D Documentation feedback
HP is committed to providing documentation that meets your needs. To help us improve the
documentation, send any errors, suggestions, or comments to Documentation Feedback
(docsfeedback@hp.com). Include the document title and part number, version number, or the URL
when submitting your feedback.
72 Documentation feedback
Page 73

Glossary
administration disk The disk located on the image server on which HP Insight CMU is installed. A dedicated space
can be allocated to the cloned images.
administration
network
clone image The compressed image of the installation from the master disk. One clone image is needed for
cluster A set of independent computers combined into a unified system through system software and
CMU HP Insight Cluster Management Utility
compute node A node that is assigned only with the compute role and no other. Jobs are distributed to and run
control node Another word for the head node.
head node The node on which HP Cluster Test is installed on and run. Typically, the head node is also the
iLO Integrated Lights Out. A self-contained hardware technology that enables remote management
iLO 2 The next generation of iLO that provides full remote graphics console access and remote virtual
image server A node specifically designated to hold images that will be distributed to the nodes dedicated as
logical group A group of similar machines running the same image. A node can belong to several logical
management card A hardware device on a server that enhances remote manageability. The management cards
management
network
management node Another term for head node.
master disk A reference disk where the operating system and layered products are manually installed. Its
network entity A group of machines that are connected with an Ethernet switch. In each network entity, one of
OA Onboard Administrator. The enclosure management hardware, software, and firmware that is
PXE Preboot Execution Environment. A standard client/server interface that enables uninstalled network
RPM Red Hat Package Manager.
The private network within the system that is used for administrative operations.
each logical group.
networking technologies.
on nodes with the compute role. No other services run on a compute node.
image server. More than one head node can exist in a cluster.
of any node within a system.
media.
secondary servers in each network entity. In a standard HP Insight CMU installation, the head
node acts as the image server.
groups.
supported by HP Insight CMU are iLO, iLO 2, and LO 100i.
Typically, a private, Ethernet-based LAN that connects all the nodes in a cluster. HP Insight CMU
communicates with the compute nodes and terminal servers over the management network.
contents are duplicated on the other nodes of a group.
the nodes is temporarily dedicated as the secondary server, which means that it has the same
role as the image server. Each node belongs to a unique network entity.
used to support all managed devices contained within the enclosure.
computers with an operating system to be configured and booted remotely. PXE booting is
configured at the BIOS level.
1. A utility that is used for software package management on Linux operating systems, most
notably to install and remove software packages.
2. A software package that is capable of being installed or removed with the RPM software
package management.
secondary server A dedicated node in a network entity where the cloned image is temporarily stored. The cloned
image is propagated only to the other nodes that are defined inside the entity.
target disk The hard drive on a target node where the cloned image is installed.
target node A compute node that will receive the cloned image from a secondary server.
73
Page 74

Index
A
accelerator
testing procedure, 27
accelerator test, 22
admin see network
analyze command, 51
apply_new_model_updates command, 51
using, 44
archive_logs command, 51
B
BandWidth accelerator test, 29
C
cabling tables documentation, 47
checkadm
command, 51
checkadm command
using, 30
checkic
command, 51
checkic command
using, 30
using for troubleshooting, 45
cluster script, 12
cluster software, 46
Cluster Test, 7
and cluster software, 46
commands, 51
documentation, 47
excluding head nodes, 38
nodes monitoring window, 15
output window, 16
overview, 5
performance analysis, 18
running multiple tests on a single node, 26
tests, 14
toolbar menus, 21
versions, 5
websites, 47
Cluster Test Image see image
Cluster Test RPM see RPM
commands
analyze, 51
apply_new_model_updates, 51
archive_logs, 51
checkadm, 51
checkic, 51
conrep, 52
cpu_rate, 52
directory, 51
getMP, 52
hponcfg, 52
ib_fabric_check, 52
inspect_ib_fabric.pl, 54
ipmitool, 57
light, 57
list_messages, 57
pdsh, 58
run_cluster_script.pl, 58
setMP, 58
compute node
boot information file, 50
erasing contents with Disk Scrubber, 39
hardware unsupported, 44
conrep command, 52
cpu_rate command, 52
CrissCross
description, 14
Easy as part of the Cluster Test procedure, 30
performance analysis, 18
sample test output, 59
Stress as part of the Cluster Test procedure, 30
troubleshooting, 45
D
Disk Scrubber, 39
Disk Test
as part of the Cluster Test procedure, 32
description, 14
graph, 17
performance analysis, 18
sample test output, 67
documentation, 47
websites, 47
F
files
boot information for compute nodes, 50
Cluster Setup command, 50
Cluster Test command, 50
DHCP configuration, 50
hardware information, 50
install, 50
log, 7, 22, 50
node performance utility xperf, 50
performance monitor command, 50
server health logs, 50
test, 50
uninstall, 50
unsupported hardware information, 50
firmware
and troubleshooting, 45
Firmware Summary, 21
Firmware Summary tool, 36
G
getMP command, 52
glossary, 73
74 Index
Page 75

H
hardware
apply_new_model_updates command, 44
documentation, 47
inventory, 21
unsupported, 44
vendor websites, 48
Hardware Inventory
description, 36
requirements, 36
using, 32
head node
best CT method for multiple, 5
destruction of information by CT Image, 5
excluding from Cluster Tests, 38
hardware unsupported, 44
HP Lights-Out Online Configuration Utility see hponcfg
HP software websites, 47
hponcfg
command, 52
using with additional software, 26
using with Firmware Summary, 36
using with Hardware Inventory, 36
website, 47
I
ib_fabric_check command, 52
ibnetdiscover, 54
image
considerations, 5
server considerations, 5
InfiniBand
fabric check, 20
ib_fabric_check command, 52
inspect_ib_fabric.pl command, 54
selecting fpr Cluster Test, 30
setting interconnect type for Cluster Test, 8
websites, 48
InfiniBand verbs test
description, 15
performance analysis, 18
inspect_ib_fabric.pl command, 54
inventory
firmware, 21
hardware, 21
ipmitool
command, 57
using with additional software, 26
using with Firmware Summary, 36
using with Hardware Inventory, 36
website, 47
K
kernel
Linux website, 47
tuning, 43
L
light command, 57
Linpack
as part of the Cluster Test procedure, 31
description, 15
graph, 17
performance analysis, 18
sample test output, 68
troubleshooting, 45
list_messages command, 57
M
Memory accelerator test, 29
Message Passing Interface (MPI)
license file, 50
website, 47
Message Passing Solution (MPI)
troubleshooting solution, 45
MGEMM accelerator test, 29
MPI
troubleshooting solution, 45
N
Netperf
description, 15
performance analysis, 18
network
admin troubleshooting, 51
interconnect troubleshooting, 51
monitoring, 15
performance analysis, 18
scripts, 42
setting interconnect type for Cluster Test, 8
test – CrissCross, 14
test – InfiniBand, 15
test – Netperf, 15
toolbar menu, 8
tuning, 43
node performance utility see xperf
O
open source software
ipmitool, 57
pdsh, 58
websites, 47
P
Pallas, 26
description, 14
performance analysis, 18
sample test output, 62
pdsh
command, 58
using with conrep, 52
website, 47
performance analysis, 18
performance monitor
command name, 50
description, 33
running xperf, 35
toolbar menu, 34
75
Page 76

using, 31
using to troubleshoot Test4, 45
perfquery, 54
procedures
running accelerator tests, 27
running Cluster Test, 29
R
recommendations
conrep command, 52
for performance analysis, 18
for Test4, 14
IB Fabric Check, 20
RPM
config file setting, 10
considerations, 6
test kit download, 6
run_cluster_script.pl command, 58
running test concurrently, 41
S
scripts
created by Run All, 11, 12
directory, 7, 22
in an image, 5
in Cluster Test RPM, 6
network, 42
running from the Cluster Test GUI, 12
running in parallel from command line, 41
server, 5
see also image server
server health check
description, 37
log file, 50
setMP command, 58
SGEMM accelerator test, 29
software, 47
see also open source software
additional for Cluster Test, 26
cluster, 5
Cluster Test RPM, 6
Disk Scrubber, 39
documentation, 47
Firmware Summary, 36
Hardware Inventory, 36
hponcfg, 26
ipmitool, 26
performance monitor, 33
server health check, 37
xperf, 35
Stream
as part of the Cluster Test procedure, 31
description, 14
graph, 17
performance analysis, 18
sample test output, 65
Test4, 14
as part of the Cluster Test procedure, 31
sample test output, 61
troubleshooting, 45
tests, 26
see also CrissCrossTest4StreamLinpackDisk TestPallas
accelerator, 27
CrossCross, 14
descriptions, 14
Disk Test, 14
excluding head nodes, 38
IB Fabric Check, 20
InfiniBand verbs test, 15
Linpack, 15
list, 7
manditory, 26
monitoring, 15
Netperf, 15
output, 16
Pallas, 14
parallel, 41
performance analysis, 18
report, 19
running from scripts, 12
running in a batch, 11
running multiple on a single node, 26
running simultaneous, 41
Stream, 14
Test4, 14
Thermal accelerator test, 29
U
unsupported hardware, 44
W
websites
hardware vendors, 48
HP software, 47
InfiniBand, 48
MPI, 47
open source software, 47
product documentation, 47
X
xperf
command name, 50
description, 35
launching from performance monitor, 34
T
test script, 12
76 Index
 Loading...