

Page 1

Diagnostic/IPR Media User's Guide
PA-RISC Computer Systems
B6191-90015a
June 1999
© Copyright 1999 Hewlett-Packard Company
Page 2

Legal Notices
The information contained in this document is subject to change without notice.
Hewlett-Pac kard makes no warranty of any kind with regard to this manual, including , but
not limited to, the implied warranties of merchantability and fitness for a particular
purpose. Hewlett-P ac kard shall not be liable for errors contained herein or direct, indirect,
special, incidental or consequential damages in connection with the furnishing,
performance, or use of this material.
Copyright © 1999 Hewlett-Packard Company.
This document contains information which is protected by copyright. All rights are
reserved. Reproduction, adaptation, or translation without prior written permission is
prohibited, except as allowed under the copyright laws.
Corporate Offices:
Hewlett-Packard Co.
3000 Hanover St.
Palo Alto, CA 94304
Use, duplication or disclosure by the U.S. Government Department of Defense is subject to
restrictions as set forth in paragraph (b)(3)(ii) of the Rights in Technical Data and
Software clause in FAR 52.227-7013.
Rights for non-DOD U.S. Government Departments and Agencies are as set forth in FAR
52.227-19(c)(1,2).
Use of this manual and flexible disc(s), compact disc(s), or tape cartridge(s) supplied for
this pack is restricted to this product only. Additional copies of the programs may be made
for security and back-up purposes only. Resale of the programs in their present form or
with alterations, is expressly prohibited.
A copy of the specific warranty terms applicable to your Hewlett-Packard product and
replacement parts can be obtained from your local Sales and Service Office.
© Copyright 1980, 1984, 1986 AT&T T ec hnologies , Inc . UNIX and System V are registered
trademarks of AT&T in the USA and other countries.
UNIX is a registered trademark in the United States and other countries, licensed
exclusively through X/Open Company Limited.
© Copyright 1979, 1980, 1983, 1985-1990 Regents of the University of California. This
software is based in part on the Fourth Berkeley Software Distribution under license from
the Regents of the University of California.
Copyright © The Regents of the University of Colorado, a body corporate 1979
This document has been reproduced and modified with the permission of the Regents of
the University of Colorado, a body corporate.
PostScript is a trademark of Adobe Systems, Inc.
Intel is a registered trademark and Intel 80386 is a trademark of Intel Corporation.
2
Page 3

Ethernet is a trademark of Xerox Corporation.
© Copyright 1985-1986, 1988 Massachussetts Institute of T echnology. X Window System is
a trademark of the Massachussetts Institute of Technology.
MS-DOS and Microsoft are U.S. registered trademarks of Microsoft Corporation.
OSF/Motif is a trademark of the Open Software Foundation, Inc. in the U.S. and other
countries. Certification for conformance with OSF/Motif user environment pending.
3
Page 4

4
Page 5

Contents
1. Diagnostic/IPR Media Product Overview
Design of the Diagnostic/IPR Media . . . . . . . . . . . . . . . . . . . . . . . . . . . . . . . . . . . . . . . . . . . . . 12
Media Layout. . . . . . . . . . . . . . . . . . . . . . . . . . . . . . . . . . . . . . . . . . . . . . . . . . . . . . . . . . . . . . 12
2. Hardware Support Tools Overview
Support Tools Manager (STM) System. . . . . . . . . . . . . . . . . . . . . . . . . . . . . . . . . . . . . . . . . . . 14
Initial System Loader (ISL) Standalone Environment . . . . . . . . . . . . . . . . . . . . . . . . . . . . . . 15
Hardware Support Tools Usage. . . . . . . . . . . . . . . . . . . . . . . . . . . . . . . . . . . . . . . . . . . . . . . . . 16
Will the OS boot?. . . . . . . . . . . . . . . . . . . . . . . . . . . . . . . . . . . . . . . . . . . . . . . . . . . . . . . . . . . 16
Will ISL boot from the main disk? . . . . . . . . . . . . . . . . . . . . . . . . . . . . . . . . . . . . . . . . . . . . . 16
Will the Diagnostic/IPR Media boot? . . . . . . . . . . . . . . . . . . . . . . . . . . . . . . . . . . . . . . . . . . . 17
Which online tools should be used? . . . . . . . . . . . . . . . . . . . . . . . . . . . . . . . . . . . . . . . . . . . . 18
3. Using the Diagnostic/IPR Media to Run Offline Diagnostics
How to Run ODE's Command Line Interface. . . . . . . . . . . . . . . . . . . . . . . . . . . . . . . . . . . . . . 21
Test Module Manager (TMMGR) . . . . . . . . . . . . . . . . . . . . . . . . . . . . . . . . . . . . . . . . . . . . . . . . . 23
Running TMMGR. . . . . . . . . . . . . . . . . . . . . . . . . . . . 23
Environment Variables. . . . . . . . . . . . . . . . . . . . . . . . . . . . . . . . . . . . . . . . . . . . . . . . . . . . . .26
Commands. . . . . . . . . . . . . . . . . . . . . . . . . . . . . . . . . . . . . . . . . . . . . . . . . . . . . . . . . . . . . . . . 27
Updating Processor Firmware Using the Diagnostic/IPR Media . . . . . . . . . . . . . . . . . . . . . . 30
4. Support Tools Manager (STM)
Running STM . . . . . . . . . . . . . . . . . . . . . . . . . . . . . . . . . . . . . . . . . . . . . . . . . . . . . . . . . . . . . . . 34
Three Interfaces . . . . . . . . . . . . . . . . . . . . . . . . . . . . . . . . . . . . . . . . . . . . . . . . . . . . . . . . . . . . . 35
System Map and Device Icons. . . . . . . . . . . . . . . . . . . . . . . . . . . . . . . . . . . . . . . . . . . . . . . . . . 36
System Map in xstm . . . . . . . . . . . . . . . . . . . . . . . . . . . . . . . . . . . . . . . . . . . . . . . . . . . . . . . .36
System Map in mstm . . . . . . . . . . . . . . . . . . . . . . . . . . . . . . . . . . . . . . . . . . . . . . . . . . . . . . .37
System Map in cstm . . . . . . . . . . . . . . . . . . . . . . . . . . . . . . . . . . . . . . . . . . . . . . . . . . . . . . . . 38
Kinds of Support Tools. . . . . . . . . . . . . . . . . . . . . . . . . . . . . . . . . . . . . . . . . . . . . . . . . . . . . . . . 39
Menus and Commands. . . . . . . . . . . . . . . . . . . . . . . . . . . . . . . . . . . . . . . . . . . . . . . . . . . . . . . .40
xstm Menus and Commands . . . . . . . . . . . . . . . . . . . . . . . . . . . . . . . . . . . . . . . . . . . . . . . . . 40
mstm Menus and Commands. . . . . . . . . . . . . . . . . . . . . . . . . . . . . . . . . . . . . . . . . . . . . . . . . 41
cstm Menus and Commands. . . . . . . . . . . . . . . . . . . . . . . . . . . . . . . . . . . . . . . . . . . . . . . . . . 45
Getting Result Information (Logs) . . . . . . . . . . . . . . . . . . . . . . . . . . . . . . . . . . . . . . . . . . . . . . 46
Remote Execution. . . . . . . . . . . . . . . . . . . . . . . . . . . . . . . . . . . . . . . . . . . . . . . . . . . . . . . . . . . . 47
Distributed Structure . . . . . . . . . . . . . . . . . . . . . . . . . . . . . . . . . . . . . . . . . . . . . . . . . . . . . . . 48
Improving Performance . . . . . . . . . . . . . . . . . . . . . . . . . . . . . . . . . . . . . . . . . . . . . . . . . . . . . 48
Getting Help . . . . . . . . . . . . . . . . . . . . . . . . . . . . . . . . . . . . . . . . . . . . . . . . . . . . . . . . . . . . . . . . 49
Kinds of Help. . . . . . . . . . . . . . . . . . . . . . . . . . . . . . . . . . . . . . . . . . . . . . . . . . . . . . . . . . . . . . 49
Common Problems . . . . . . . . . . . . . . . . . . . . . . . . . . . . . . . . . . . . . . . . . . . . . . . . . . . . . . . . . . . 51
Exercisers sometimes enter a "Hung" state. . . . . . . . . . . . . . . . . . . . . . . . . . . . . . . . . . . . . . 51
The user interface will not connect to a machine.. . . . . . . . . . . . . . . . . . . . . . . . . . . . . . . . . 51
A device in the STM map is "Unknown" or its icon is blank. . . . . . . . . . . . . . . . . . . . . . . . . 52
Slow response to user commands. . . . . . . . . . . . . . . . . . . . . . . . . . . . . . . . . . . . . . . . . . . . . . 52
SCSI Tape and Disk Tools report SCSI commands as failed in the Test Activity Logs. . . . 53
No tools are available for a particular device.. . . . . . . . . . . . . . . . . . . . . . . . . . . . . . . . . . . . 53
The "Device — >Select Class" command did not work.. . . . . . . . . . . . . . . . . . . . . . . . . . . . . 53
5
Page 6

Contents
5. Using the Diagnostic/IPR Media to Install Diagnostics on Your System
Support Tools Manager (HP-UX 9000 Series 800/700) . . . . . . . . . . . . . . . . . . . . . . . . . . . . . . .56
EMS Hardware Monitors . . . . . . . . . . . . . . . . . . . . . . . . . . . . . . . . . . . . . . . . . . . . . . . . . . . . . .57
HP Predictive Support. . . . . . . . . . . . . . . . . . . . . . . . . . . . . . . . . . . . . . . . . . . . . . . . . . . . . . . . .58
How the Process Works . . . . . . . . . . . . . . . . . . . . . . . . . . . . . . . . . . . . . . . . . . . . . . . . . . . . . .58
What HP Predictive Support Covers. . . . . . . . . . . . . . . . . . . . . . . . . . . . . . . . . . . . . . . . . . . .58
LIF-LOAD (HP-UX 9000 Series 800 and 700 Systems) . . . . . . . . . . . . . . . . . . . . . . . . . . . . . .60
Installing Online Support Tools from the Diagnostic/IPR Media (CD-ROM) . . . . . . . . . . . . .61
A. Disk Copy Utility — To make an image of a disk after install or upgrade (HP-UX 10.x
to 11.x)
Operating Environment . . . . . . . . . . . . . . . . . . . . . . . . . . . . . . . . . . . . . . . . . . . . . . . . . . . . . . .72
Quick Start Instructions . . . . . . . . . . . . . . . . . . . . . . . . . . . . . . . . . . . . . . . . . . . . . . . . . . . . . . .73
Executing COPYUTIL . . . . . . . . . . . . . . . . . . . . . . . . . . . . . . . . . . . . . . . . . . . . . . . . . . . . . . . .73
B. EMS Hardware Monitors
Enabling Hardware Monitoring . . . . . . . . . . . . . . . . . . . . . . . . . . . . . . . . . . . . . . . . . . . . . . . . .78
6
Page 7

Printing History
Table 1
June 1999 ..... Edition 1
This printing date and part number indicate the current edition. The printing date
changes when a new edition is printed. (Minor corrections and updates which are
incorporated at reprint do not cause the date to change.) The part number changes when
extensive technical changes are incorporated.
New editions of this manual will incorporate all material updated since the previous
edition.
Internal Date: May 28, 1999
HP Printing Division:
Systems Supportability Lab
Hewlett-Packard Co.
19091 Pruneridge Ave.
Cupertino, CA 95014Printing History
7
Page 8

8
Page 9

About This Manual
The Diagnostic/IPR Media performs two functions:
• The Diagnostic/IPR Media is the swinstall format distribution media for the
following hardware support products for 10.01, 10.10, 10.20, 10.30, and 11.x HP-UX
systems; it is also the update format distribution media for the 9.04 and 9.07 HP-UX
systems)
• Online diagnostics subsystem)
• Support Tools Manager (HP-UX 10.x and 11.x))
• EMS Hardware Monitors (HP-UX 10.20 and 11.x only)
• HP Predictive Support tools (Series 800 only)
• LIF-resident offline diagnostics
• IPR patches
• It is the platform for running offline diagnostics for all PA-RISC systems.
This manual is intended to provide an overview of how to use the Diagnostic Media for
these two functions.
The following is a summary of the contents of the chapters in this manual:
Chapter 1 Diagnostic/IPR Media product overview
Chapter 2 Hardware support tools overview
NOTE Chapter 2, “Hardware Support Tools Overview,” provides a simplified
approach to starting the hardware problem solving process, using the tools
provided on the Diagnostic/IPR Media. This is not intended as a
comprehensive troubleshooting guide, nor as a tutorial on the products
themselves. It is merely intended as an aid in beginning the process, and in
explaining briefly how the various tools can be used.
Chapter 3 Using the Diagnostic/IPR Media to run offline diagnostics
Chapter 4 Support Tools Manager (STM)
Chapter 5 Using the Diagnostic/IPR Media to install the diagnostic products on your
system
Appendix A Disk Copy Utility - To make an image of a disk after install or upgrade
(HP-UX to 11.x)
Appendix B EMS Hardware Monitors
9
Page 10

Problem Reporting. If you have any problems with the software or documentation,
please contact your local Hewlett-Packard Sales Office or Customer Service Center.
Reader Comments. We welcome your comments about our documentation. If you have
editorial suggestions or recommended improvements for this document, please write to us.
You can reach us through e-mail at: hardwaredocs@cup.hp.com or by sending your letter
to: Information Engineering Group, M/S 5657, Hewlett-Packard Company, 8000 Foothills
Blvd, Roseville, CA 95747-6588 USA.
Please include the following information in your message:
• Title of the manual you are referencing.
• Manual part number (from the title page).
• Edition number or publication date (from the title page).
• Your name.
• Your company's name.
SERIOUS ERRORS, such as technical inaccuracies that may render a program or a
hardware device inoperative, should be reported to your HP Response Center or directly to
a Support Engineer.
Current Information on the Web. This manual contains information that was current
at the time of publication.
For the most current information on Support Tools, see our Web site, “Systems Hardware,
Diagnostics, and Monitoring, ” athttp://www.docs.hp.com/hpux/systems/. This Web
site also contains additional documents, such as tutorials, quick reference guides, and
release information.
10
Page 11

Diagnostic/IPR Media Product Overview
1 Diagnostic/IPR Media Product Overview
The Diagnostic/IPR Media allows you to diagnose and fix problems when the operating
system cannot be booted from the system disk. The Diagnostic/IPR Media runs on minimal
hardware, with or without the system disk.
The Diagnostic/IPR Media performs two functions:
• The Diagnostic/IPR Media is the swinstall format distribution media for the
following hardware support products for 10.01, 10.10, 10.20, 10.30, and 11.x HP-UX
systems; it is also the update format distribution media for the 9.04 and 9.07 HP-UX
systems)
• Online diagnostics subsystem
• Support Tools Manager (HP-UX 10.x and 11.x))
• EMS Hardware Monitors (HP-UX 10.20 and 11.x only)
• HP Predictive Support tools (Series 800 only)
• LIF-resident offline diagnostics
• IPR patches
• It is the platform for running offline diagnostics for all PA-RISC systems.
The Diagnostic/IPR Media is primarily intended for HP-UX systems; however , it is used for
running offline diagnostics on MPE/iX systems.
NOTE If you have an HP Hardware and Software Support Agreement, then
be sure to install HP Predictive Support along with the HP-UX
Support Tools. For details, see the HP Predictive Support/UX User's
Guide (part number: H2571-90008).
Chapter 1 11
Page 12

Diagnostic/IPR Media Product Overview
Design of the Diagnostic/IPR Media
Design of the Diagnostic/IPR Media
The following subsections discuss the physical layout of the Diagnostic/IPR Media.
Media Layout
The Diagnostic/IPR Media contains Software Distributor (SD) bundles, which contain all
of the online tools to be loaded onto your system, including the following:
• Online diagnostics subsystem)
• Support Tools Manager (HP-UX 10.x and 11.x))
• EMS Hardware Monitors (HP-UX 10.20 and 11.x only)
• HP Predictive Support tools (Series 800 only)
• LIF-resident offline diagnostics
• IPR patches
In general terms, the Diagnostic/IPR Media is organized as follows (details of organization
for your particular media type may vary):
| LIF | SD Products (filesystem contains online |
| | diagnostic bundles at |
| | /mountpoint/diagnostics) |
12 Chapter 1
Page 13

Hardware Support Tools Overview
2 Hardware Support Tools Overview
The purpose of this chapter is to give a brief high-level overview of the recommended use of
HP hardware support tools. This is not intended as a comprehensive troubleshooting
guide, nor as a tutorial on the products themselves. It is merely intended as an aid in
beginning the process, and in explaining briefly how the various tools can be used.
There are several support tools platforms provided by HP, each targeted at a different
troubleshooting situation or type of user. A brief description of these products follows. In
addition, each system provides a help facility to assist users in getting started,
determining what tools are available and how to run them, etc.
For the HP-UX 10.01, 10.10, 10.20, 10.30, and 11.x releases, the Support Tools Manager
(STM) diagnostic systems is available. The STM diagnostic system is the diagnostic
system used for information, verification, and diagnosis. The STM system provides a map
of the system, and lets you know what tools are available for each component, at the time
it is accessed.
NOTE Included on the Diagnostic/IPR Media are the EMS Hardware Monitors -- an
important new tool for maintaining system availability. The EMS hardware
monitors allow you to monitor the operation of a wide variety of hardware
products and be alerted immediately if any failure or other unusual event
occurs.
For more information, see Appendix B, “EMS Hardware Monitors.” in this
manual.
Chapter 2 13
Page 14

Hardware Support Tools Overview
Support Tools Manager (STM) System
Support Tools Manager (STM) System
The Support Tools Manager (STM) is an online support tools platform that is currently
available on HP9000 series 700 and 800 machines. STM provides automatic configuration
mapping, and a set of verifiers, exercisers, information modules, expert tools, utilities, and
firmware update tools for various devices on HP-UX systems. STM provides three user
interfaces: a graphical interface for X-based terminals (XSTM), a menu interface for HP
ASCII terminals (MSTM), and a command line interface for all ASCII terminals (CSTM).
The graphical and menu interfaces are designed to be intuitive and usable by novices. The
command line interface is provided mainly as a convenient method of driving STM via
scripts. STM is invoked via the "xstm", "mstm", or "cstm" commands, depending on which
interface is desired.
The STM verifiers are designed to quickly determine whether or not a specific device is
operational by performing tasks similar in nature to the way applications use the device.
No license is required to run the verifiers.
The STM exercisers are designed to stress devices in order to facilitate the reproduction of
intermittent problems. The exercisers on HP-UX 9.X systems require a license to run.
The STM information modules create a log of information specific to one device, including:
• The product identifier
• A description of the device
• The hardware path to the device
• The vendor
• On-board log information (if applicable)
• Miscellaneous information associated with the device
Typically, the firmware revision code, if firmware is present in the device, will also be
displayed.
The STM expert tools are device specific troubleshooting utilities for use by sophisticated
users. Their functionality varies from tool to tool, but they are intended to be interactive,
and rely on you to provide information necessary to perform a particular task. These tools
require you to have the appropriate license if you wish to run them.
The STM utilities are support tools which are not device specific. Current tools include log
viewing and disk backup tools.
The STM firmware update tool initiates the firmware update process for a selected device.
Most require that you have the appropriate license in order to run them.
14 Chapter 2
Page 15

Hardware Support Tools Overview
Initial System Loader (ISL) Standalone Environment
Initial System Loader (ISL) Standalone Environment
The ISL standalone environment consists of the Initial System Loader, ISL-based tools
which run directly from ISL, and the Offline Diagnostic Environment (ODE). On most
PA-RISC machines, ISL is the first program run after execution of the firmware. ISL
implements a command line interface which allows the user to obtain information on the
bootup characteristics of the system; to modify these characteristics; and to load and
execute programs such as the operating system, ISL-based tools, and the Offline
Diagnostics Environment.
ISL-based tools consist of a set of diagnostics that diagnose the Central Processing Unit
(CPU), memory, and portions of the I/O system on older series 700, 800, and 900 machines;
and the Offline Diagnostics Environment (ODE).
The Offline Diagnostics Environment is an offline support tools platform that is run from
ISL and is available on series 700, 800, and 900 machines. ODE provides a common
user-friendly interface for diagnostics and utilities developed to run in this environment.
Diagnostics and utilities provided under ODE include:
• MAPPER - a utility for mapping out the physical layout of the SPU and its peripherals
• IOTEST - a utility for testing I/O cards using IODC
• PERFVER - a utility for testing peripherals attached to the boot path
• A set of diagnostics/utilities for testing disks.
• A set of diagnostics for testing CPU, memory, and selected I/O modules.
A license is required to run most of the ODE diagnostics and utilities.
The main purpose of the offline tools is to enable the user to troubleshoot a system which
cannot be tested via the online tools, generally because a hardware problem exists which
prevents the system from booting. The offline environment is also useful for some types of
testing in which it is not desirable to have to boot the system first, as is often the case in
manufacturing applications.
Chapter 2 15
Page 16

Hardware Support Tools Overview
Hardware Support Tools Usage
Hardware Support Tools Usage
Each one of the products described above plays a role in the overall system troubleshooting
strategy. Figure 2-1 contains a simple flow diagram that outlines the intended use of the
hardware support tools. Please note that this diagram is not intended to cover every aspect
and corner case of system troubleshooting, but rather to provide an overall picture of what
roles the various products play in troubleshooting systems.
As can be seen from the flow diagram, the basic assumption is that if the system can boot
to the operating system prompt, it is generally desirable to do so. In a majority of cases, the
system is probably already booted and it is not desirable to take it down to run diagnostics.
If there are problems with the hardware, the online support tools should be used to
attempt to troubleshoot them. If the system will not boot, the offline tools from the
Diagnostic/IPR Media should be used to troubleshoot the problem with the intent of
getting the system to boot again. Once booted, the online tools can be used if any further
testing is desired.
Of course, before altering the state of a system that is exhibiting problems, it is crucial to
record any error messages, symptoms, etc., before proceeding. This information may be
very valuable later on in determining what action to take to isolate the problem cause.
The following key decisions drive the troubleshooting strategy as outlined in the flow
diagram:
Will the OS boot?
This step determines whether or not the online versus offline support tools can be used. If
the OS cannot boot, the offline tools are the only option. If the OS can boot, the
recommendation is to use the online tools. Of course, the user still has the option of taking
down the system and using the offline tools if it is so desired.
Will ISL boot from the main disk?
If the machine will boot to ISL from the main disk, the user would typically run the offline
tools to troubleshoot the problem that is preventing the system from booting to the OS.
The hardware problems that would be common here would be problems with the boot disk
or other disks on the system that are used during boot; problems with the boot path that
only manifest themselves under a load; configuration problems, etc. Great care must be
taken when running the ODE disk tools, since they can alter data on the disk. Backups of
all OS and user files should be available, in case they need to be restored after the disk is
repaired.
After ODE has been run and any problems that were encountered are fixed, the user
should again try to boot to the OS. If boot is successful, the online tools can be used for any
further testing that is desired. If the OS will still not boot, the user should continue the
troubleshooting process by turning to the Diagnostic/IPR Media.
16 Chapter 2
Page 17
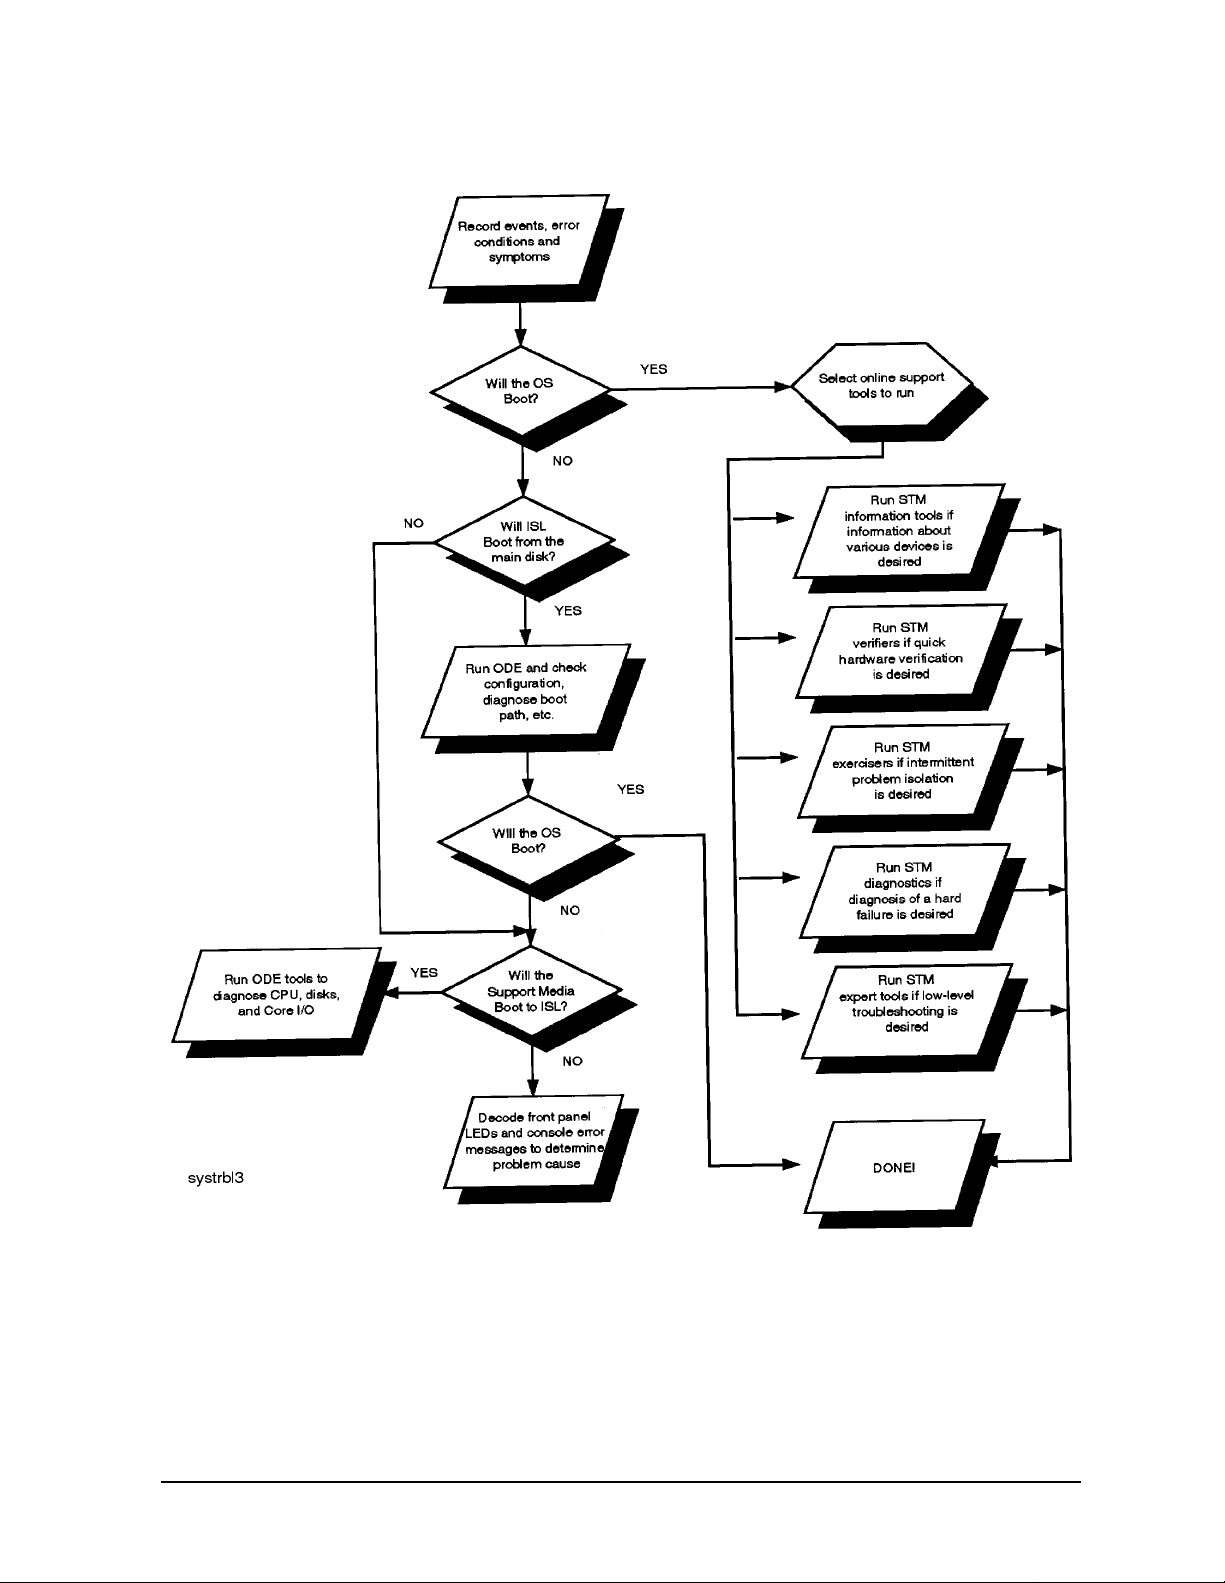
Figure 2-1 Hardware Support Tools Usage Flow Diagram
Hardware Support Tools Overview
Hardware Support Tools Usage
Will the Diagnostic/IPR Media boot?
If the machine will not boot to ISL from the main disk, or even if it will boot ISL, but still
won't boot the OS, the user has little choice but to either start sw apping suspect hardware ,
using the error codes displayed on the front panel LEDs and console error messages for
guidance, or attempt to boot from the Diagnostic/IPR Media. This decision is likely to be
Chapter 2 17
Page 18

Hardware Support Tools Overview
Hardware Support Tools Usage
influenced by the type of machine that is having the problem and the error symptoms. If
the user is troubleshooting a high-end server with many Field Replaceable Units (FRUs),
it is usually beneficial to use the Diagnostic/IPR Media approach to try and isolate the
most likely failing FRU. If, on the other hand, the machine is a workstation with CPU,
memory, and I/O all in one FRU, it may be desirable at this point to just replace the board
and see if that takes care of the problem.
If the user elects to boot from the Diagnostic/IPR Media, and does so successfully, the
problem is likely to be with the main disk or the I/O path to it, although it could still be a
memory or SPU problem that is not manifested in the Diagnostic/IPR Media environment.
In this case, the tools on the Diagnostic/IPR Media should be used to test the SPU, boot
path components, the main disk and, if necessary, perform data recovery operations on the
main disk.
If the machine will not even boot to ISL from the Diagnostic/IPR Media, the front panel
LEDs and console error messages should contain error information that may help to
isolate the most probable cause. The typical approach at this point is to go to a minimum
configuration (e.g., just the boot device and the console) and start swapping hardware to
try to get to the point where the system can at least boot ISL.
Which online tools should be used?
If the system can be booted to the OS, the user has several online tools available to
troubleshoot problems. The following are the strategic uses for each set of tools:
1. STM verifiers are useful primarily for finding reproducible problems that are causing a
particular device to fail. They will run a quick verification on selected devices and
indicate whether they are basically functioning properly or not. This type of testing is
probably most useful when new hardware is added or configuration changes have been
made and need to be verified.
2. STM exercisers are designed to help the user reproduce intermittent problems by
stressing various system components and devices. In general, if the user has no good
evidence that seems to indicate where the problem is, the exercisers should be used to
try and isolate the problem to a specific device or area of the system.
3. STM diagnostics provide fault isolation capabilities for some devices. Typically,
diagnostics are only available for hardware which comprises numerous FRUs.
4. STM information tools provide comprehensive information about specific devices. They
typically also provide basic verification that the device is responding.
5. STM expert tools are used for interactive testing of a particular device, in order to
isolate a particular problem.
NOTE Included on the Diagnostic/IPR Media are the EMS Hardware Monitors -- an
important new tool for maintaining system availability. The EMS hardware
monitors allow you to monitor the operation of a wide variety of hardware
products and be alerted immediately if any failure or other unusual event
occurs.
18 Chapter 2
Page 19
Using the Diagnostic/IPR Media to Run Offline Diagnostics
3 Using the Diagnostic/IPR Media to Run
Offline Diagnostics
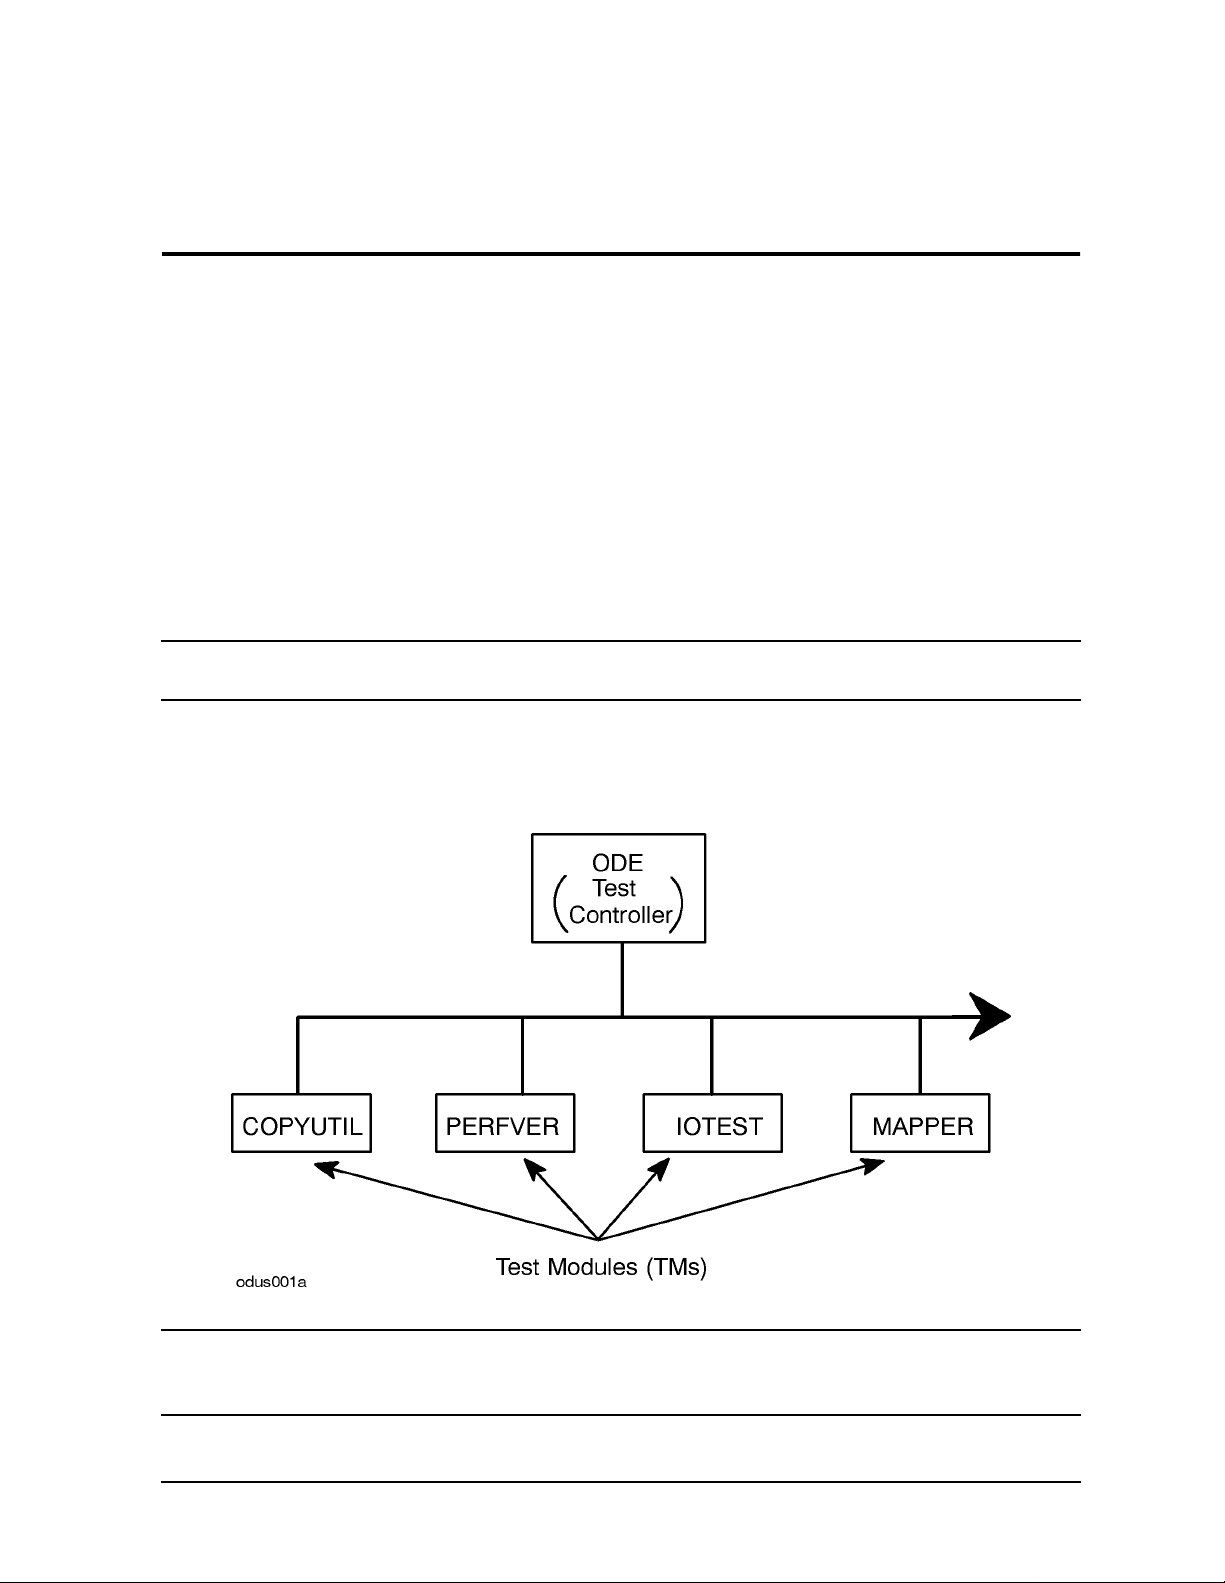
The Offline Diagnostics Environment (ODE) consists of a Test Controller (TC), a System
Library (SysLib), and any number of Test Modules (TMs), all resident on the
Diagnostic/IPR Media in the LIF. It provides you with a consistent interface for executing
the ISL-based support tools from the Diagnostic/IPR Media, in the event that your system
is offline.
The TC provides the user with two basic interfaces: a pure command-line interface for
expert users, and a menu-oriented interface for less experienced users. In the
command-line interface, users can select and run specific tests and/or utilities. In the
menu-oriented interface, users select specific hardware modules to test, and do not have to
know which diagnostic is associated with a particular module.
NOTE ODE utilities like MAPPER and FUPDATE (formerly UPDATE) can only be run
from the command-line interface.
Figure 3-1 provides a graphic representation of the relationship that exists between the
ODE Test Controller (TC) and the underlying Test Modules (TMs):
Figure 3-1 Relationship Between ODE Test Controller and Test Modules
NOTE To see ISL-based programs, type ls at the ISL prompt. To see ODE-based
programs, start ODE from the ISL prompt, and then type ls at the ODE
prompt.
Chapter 3 19
Page 20

Using the Diagnostic/IPR Media to Run Offline Diagnostics
NOTE Changes to Offline Diagnostics as of June 1999 (IPR 9906):
• The UPDATE utility for ODE has been replaced by FUPDATE. FUPDATE is
backward compatible with existing computer systems
• For 64-bit systems like N-Class, there will be a different version of the
offline diagnostic programs. The 64-bit version will have a “2” appended to
its name. For example, the 64-bit version of MAPPER is MAPPER2.
• The ODE module TMMGR (TM Manager) will only be updated to support
new 32-bit systems (such as the J5000, J7000, C3000, and B1000). TMMGR
will NOT be updated to support new 64-bit systems (such as the L-Class
and N-Class).
20 Chapter 3
Page 21

Using the Diagnostic/IPR Media to Run Offline Diagnostics
How to Run ODE's Command Line Interface
How to Run ODE's Command Line Interface
To start ODE's command line interface, do the following:
1. If you are at the PDC prompt (e.g., BOOTADMIN>), type search for a list of bootable
devices:
BOOTADMIN>search
2. Select the tape or CD device, depending upon your Diagnostic/IPR Media, and boot from
that device:
BOOTADMIN>boot SCSI.3.3
3. At the ISL> prompt, type the following:
ISL>ODE
The following prompt will then be displayed:
ODE>
4. Type the following, for a list of available commands with a capsule description of each:
ODE>help
The following information will be displayed:
MAIN HELP SCREEN
Basic Commands
HELP Prints detailed information to the screen, when "help <command>"
or "help <var>" is typed
LS List modules available on boot medium
<Module_Name> Load and initialize a module by typing its name
RUN Run a module (after setting desired environment variables)
Control-Y|Control-C Abort an ODE command; pause a module run
RESUME Restart a paused module
DISPLOG After running a module, display contents of a log
EXIT Return to next higher level prompt
Environmental Variables
SHOWSTATE Display the value of the following environment variables:
LOOP Run a test this many times
ERRPRINT [ON|OFF] Print low-level error messages to console
(primarily for manufacturing use)
ERRNUM [ON|OFF] Print one-line, numbered errors to the console
ERRPAUSE [ON|OFF] Pause module upon error detection
ERRONLY [ON|OFF] Print ONLY error messages; disable non-error
and isolation message printing
INFOPRINT [ON|OFF] Print informational messages to the console
ISOPRINT [ON|OFF] Print fault isolation messages to the console
ISOPAUSE [ON|OFF] Pause module when isolation message is generated
LOGSIZE Set the size of a message log
DEFAULT Reset environment variables to default state
(For more help, type "help module_name")
5. For more information on any of these commands or options, type help <command> or
help <var>, as appropriate.
6. To list the ODE modules that will run on the current SPU, type ls at the ODE prompt.
Chapter 3 21
Page 22

Using the Diagnostic/IPR Media to Run Offline Diagnostics
How to Run ODE's Command Line Interface
7. Select the test module on the LIF that you wish to run, and decide whether you wish to
run it interactively, or non-interactively.
8. If you wish to run interactively, type the following at the ODE prompt:
ODE><module_name>
This command loads the module from LIF into memory, and initializes it, displaying the
module_name prompt:
MODULE_NAME>
To run interactively, type help for a list of commands which are valid for use with
selected module:
MODULE_NAME>help
9. To run non-interactively, type the following at the ODE prompt:
ODE>run module_name
22 Chapter 3
Page 23

Using the Diagnostic/IPR Media to Run Offline Diagnostics
Test Module Manager (TMMGR) .
Test Module Manager (TMMGR) .
TMMGR (pronounced TM Manager) is a special ODE module that implements an ease-of-use
user interface for ODE. TMMGR is a hybrid menu/command interface that enables the user
to test specific hardware modules without having to know which diagnostic to load and
launch — instead, the user simply selects from a menu the specific hardware module to
test, and the appropriate diagnostic is executed. TMMGR provides the user with a consistent
set of commands, as well as context-sensitive help. Note, TMMGR can only be run from the
Support CD-ROM.
NOTE As of the June 1999 release (IPR 9906), the ODE module TMMGR (TM
Manager) will only be updated to support new 32-bit systems (such as the
J5000, J7000, C3000, and B1000). TMMGR will NOT be updated to support
new 64-bit systems (such as the L-Class and N-Class).
Running TMMGR
To launch TMMGR, enter the following:
ODE>MENU
After TMMGR loads and configures the system (this may take several minutes), it allows the
user to interact with ODE through several different screens. Following is a brief summary
of each screen:
System Screen The system screen is the first screen displayed to the user. It provides a
map of all hardware modules in the system and allows the user to select
and test sets of modules.
Test Screen A test screen displays a list of tests for a particular module. It allows the
user to select and run a set of tests for a specific module.
Logging Screen The logging screen displays of log of all test activity. The user can use
this screen to get detailed error or isolation information from a particular
TM.
Environment Screen The environment screen displays a list of environment variables
accessible to the user. From this screen the user can adjust certain aspects
of TMMGR.
For all screens, the set of available user commands is displayed across the top of the
display. These are the only commands that can be entered at the command prompt. To get
a summary of each available command, use the HELP command with no parameter. To
display detailed information about a specific command, use the HELP command with the
command's name as the parameter. Note, some screens may contain more than one page of
information. To displa y the previous or subsequent page , use thePREV or NEXT commands
or their respective shortcuts, Ctrl-P or Ctrl-N. To quickly go to the first or last page of a
Chapter 3 23
Page 24

Using the Diagnostic/IPR Media to Run Offline Diagnostics
Test Module Manager (TMMGR) .
screen, use the FIRST or LAST commands. User commands at the command prompt may
be chained together using a semicolon as a separator. For example, to select items 1 and 5
and then run them, the following could be entered at the command prompt:
Command-> select 1 5;run <cr>
System Screen
Below is an example of the system screen:
Commands: EXIT, NEXT, LAST, LOG, ENV, RUN, SELECT, INFO, REFRESH, HELP
** HP 9000/712 **
Selection Module/Device Path Status
1 Processor [1 Found] N/A
2 * Memory [1 Controller Found] READY
3 Builtin Graphics 1 N/A
4 * Core Bus Adapter 2 READY
5 * Core SCSI 2/0/1 READY
6 * Core LAN 2/0/2 READY
7 * Core RS-232 2/0/4 READY
8 * Core Centronics 2/0/6 READY
9 * Audio 2/0/8 READY
10 * Core Floppy 2/0/10 READY
11 * Core PS/2 2/0/11 READY
12 * Core PS/2 2/0/12 READY
13 * Core Bus Adapter 6 READY
%< Page 1 of 2 > %< Test Loops Completed: 0 >
Command->
The system screen shows a map of the computer system displaying a short description of
each HP- architected module, its architected path, and its status. The status field gives
information about the test state of the hardware module. The status field may have the
following values:
N/A The TM for this module is not available. Either the TM does not exist on
the LIF volume, or the TM is unable to be executed.
READY No tests for this module have been launched. The TM for this module is
ready for execution.
PASSED All tests run on this module passed.
FAILED One or more tests run on this module failed.
ABORTED The user aborted test execution, or all tests run were aborted by the
system
SKIPPED Tests for this module were launched, but all were skipped.
An asterisk next to a selection number indicates that this module is selected for testing.
The set of all selected modules will be tested when the user executes the RUN command.
Use the SELECT command to alter the set of selected modules. To launch the tests for all
selected modules, enter RUN at the command prompt. This will run all default or
24 Chapter 3
Page 25

Using the Diagnostic/IPR Media to Run Offline Diagnostics
Test Module Manager (TMMGR) .
user-selected tests for all selected hardware modules. Note, not all available tests for a
module may be considered default. At any time the user may hit Ctrl-C to abort test
execution. To do detailed testing on just one particular module , one can enter the module's
selection number at the command prompt. This will cause the module's test screen to be
displayed.
Test Screen
Below is an example test screen:
Commands: EXIT, LOG, ENV, RUN, SELECT, INFO, REFRESH, HELP
** Memory Controller@9**
Test Description Status
1 * Single Bit Error Test READY
2 * Walking Ones Test READY
3 * Refresh Test READY
4 * Read Hammer Write Test READY
5 * Write Hammer Read Test READY
6 * Full Address Test READY
7 * Marching Ones Test READY
8 * Pseudorandom Architected Test READY
9 * Binary Tree Test READY
%< Page 1 of 1 > %< Test Loops Completed: 0 >
Command->
The test screen displays all the tests for a selected module and indicates which ones are
selected for testing. By default, not all tests may be tagged. For example, tests that require
special loopback connectors may not be selected by default. Therefore, if one wants to
ensure that a specific set of tests is run for a particular module, one should enter the test
screen for that module and select the appropriate tests. The test screen also displays the
status of each test. The status field may have the following values:
READY This test has not been run. It is ready for execution.
PASSED The test passed.
FAILED The test failed.
ABORTED The user aborted test execution, or the test was aborted by the system
SKIPPED The test was skipped.
The user can execute the RUN command to run the set of selected tests. At any time the
user may hit Ctrl-C to abort test execution. Use the EXIT command to return to the system
screen. The current set of selected tests will be preserved. Thus, on a subsequent RUN from
the system screen, only the user-selected tests will be executed.
Chapter 3 25
Page 26

Using the Diagnostic/IPR Media to Run Offline Diagnostics
Test Module Manager (TMMGR) .
Logging Screen
To enter the logging screen, typeLOG at the command prompt. The logging screen displays
detailed information that each TM may have output during its execution. One can display
the various pages of the log to correlate a failing test with any associated error information
that the TM may have output.
Environment Screen
To enter the environment screen, type ENV at the command prompt. The following is an
example environment screen:
Commands: EXIT, ERRCOUNT, ROWS, SCROLL, TERM, LOOP, REFRESH, HELP
** Environment Variables **
Variable Description State
ERRCOUNT Number of errors that stop test execution 0
ROWS Number of console text rows 24
SCROLL Activates scrolling during screen redraws ON
TERM Terminal type UNKNOWN
LOOP Number of times to loop test execution 1
%<Page1of1>
Command->
The environment screen displays each environment variable, an associated description,
and its current state. Use the HELP command to get more online information about each
environment variable.
Environment Variables
This section gives a brief discussion of each environment variable. Note, the command
syntax for each variable indicates its legal states. A | in the command syntax means or.
ROWS
ROWS <integer>
NOTE <integer> must be 12 or greater.
The ROWS environment variable indicates the number of text rows supported by the
current console display.
SCROLL
SCROLL ON|OFF
The SCROLL environment variable controls how screen redraws are performed. When the
state of SCROLL is ON, the screen is redrawn by scrolling the current text off the top of the
console display.
26 Chapter 3
Page 27

Using the Diagnostic/IPR Media to Run Offline Diagnostics
Test Module Manager (TMMGR) .
When the state of SCROLL is OFF, the console display is updated using special
terminal-specific control mechanisms (allowing the redraw to occur much faster). If one
wants to save previous screen displays in terminal display memory, or if one is using a
terminal not supported by TMMGR, SCROLL should be set to ON. Note, if the current
terminal type is unknown, one will not be able to change the state of SCROLL to OFF.
LOOP
LOOP <integer>|FOREVER
The LOOP environment variable indicates how many times to loop on test execution before
control is returned to the user. To loop forever, the state of LOOP should to set to
FOREVER. When in this state, the user must hit <Ctrl>-Y or <Ctrl>-C to stop test
execution. Note, the effect of the LOOP environment variable is context-dependent. If test
execution is launched from the system screen, the LOOP state indicates how many times
the tests for the tagged modules will be executed. If test execution is launched from a test
screen, the LOOP state indicates how many times the tagged tests will be executed.
TERM
TERM HP|UNKNOWN
The TERM environment variable indicates the current type of the console. Currently, only
HP serial terminals are fully supported by TMMGR. If one is using a non HP terminal or a
graphics display, TERM should be set to UNKNOWN.
ERRCOUNT
ERRCOUNT <integer>
The ERRCOUNT environment variable indicates how many test errors can be generated
before test execution is stopped and control returned to the user. If one does not want error
generation to stop test execution, the state of ERRCOUNT should be set to 0.
Commands
This section gives a brief description of each user command supported by TMMGR. The
following conventions are used in the command syntax:
|or
[] items within brackets are optional
... item to the left can be repeated 0 or more times
{} groups items together
FIRST
FIRST
Use this command to display the first page of the system screen, the environment screen,
the logging screen, or a test screen.
LAST
LAST
Use this command to display the last page of the system screen, the environment screen,
the logging screen, or a test screen.
Chapter 3 27
Page 28

Using the Diagnostic/IPR Media to Run Offline Diagnostics
Test Module Manager (TMMGR) .
NEXT
NEXT (N)
Use this command to display the next page of the system screen, the environment screen,
the logging screen, or a test screen. Note, <Ctrl>-N (N) can be used as a shortcut for this
command.
PREV
PREV (P)
Use this command to display the previous page of the system screen, the environment
screen, the logging screen, or a test screen. Note, <Ctrl>-P (P) can be used as a shortcut for
this command.
REFRESH
REFRESH
Use this command to redraw the current console display. Using this command may become
necessary if the console display becomes unsynchronized with internal program data
structures.
ENV
ENV
Use this command to go to the environment screen. The environment screen allows one to
view and modify all environment variables.
SELECT
SELECT
<num> is an integer indicating any valid selection number. <range> is a range of selection
numbers of the form A/B (A %< B). Use this command to select a group of modules to test
or a group of tests to execute. A group of modules or tests is specified by explicitly
specifying a list of selection numbers and/or a range of selection numbers. All tests or
testable modules can be selected at once by using the command parameter, ALL. To
deselect a group of modules or tests, one can prepend - to each element in the group
specification. Note, elements of a group specification are processed from left to right. This
fact can be used to specify groups with minimal effort.
Examples:
To select modules or tests 1, 4, 6, 7, 8, and 9, enter:
-> select146789<cr> or -> select 1 4 6/9 <cr>
To select all modules or tests except 3 and 4, enter:
-> select all -3 -4 <cr>
EXIT
EXIT [ALL]
Use this command to return back to the previous screen. To exit all the way back to ISL,
type EXIT ALL.
28 Chapter 3
Page 29

Using the Diagnostic/IPR Media to Run Offline Diagnostics
Test Module Manager (TMMGR) .
LOG
LOG
Use this command to go to the logging screen. The pages within the logging screen show
detailed output from each test previously run.
RUN
RUN
Use this command to execute the currently tagged tests or to execute the tests for the
currently tagged modules.
HELP
HELP [<name>]
<name> is the name of a valid command for the current page in the current screen. Use
this command to display help information for the various commands valid for the current
page in the current screen. Executing this command with no parameter will display a
short summary of each valid command.
INFO
INFO <num>
NOTE <num> is a valid module or test selection number.
Use this command to display general information about a module or test. The desired
module or test should be specified by its associated selection number as indicated on
screen.
Chapter 3 29
Page 30

Using the Diagnostic/IPR Media to Run Offline Diagnostics
Updating Processor Firmware Using the Diagnostic/IPR Media
Updating Processor Firmware Using the
Diagnostic/IPR Media
CAUTION If you should run ODE support tools with the wrong revision of
processor firmware (PDC) on your system, you could cause an
HPMC. The following procedure will ensure that your ODE support tools and
your PDC are running compatible versions.
NOTE As of the June 1999 release (IPR 9906), the UPDATE utility for ODE has been
replaced by FUPDATE. FUPDATE is backward compatible with existing
computer systems
Following is the procedure for updating the PDC on your system, prior to running any
ODE support tools:
1. At the prompt, type swinstall. Three windows will be displayed.
2. Move the cursor to the window displaying the Machine and Depot dialog boxes.
3. Enter the appropriate information in the Machine field (this is the machine you are
loading PDC update script onto; the default is the machine on which you are running
the Diagnostic/IPR Media).
4. Enter the appropriate information in the Depot field (this is the media — that is, the
tape or CD-ROM — from which you are loading the PDC update script).
5. Move the cursor to Change Software View and select it.
6. Select Products.
7. Move the highlight bar to PROC_FIRMWARE.
8. Move the cursor to the Actions pulldown menu, and select Install.
You should see the messages Loading and then Done.
9. Once you see the message Done displayed, you should exit.
10.Type cd usr/sbin/diag/firmware at the prompt.
You should see the following three files listed:
FRMW_LIF README cp_lif_tape
11.Be sure you have a blank tape inserted into the drive; then type cp_lif_tape.
12.You will be prompted to enter the tape drive address (a typical address would be 0m).
The cp_lif_tape script will copy the LIF file FRMW_LIF to a DAT tape.
13.Once you have made the DAT tape with FRMW_LIF on it, you should insert that tape
into a bootable DAT tape drive connected to the system whose firmware you wish to
change.
30 Chapter 3
Page 31

Using the Diagnostic/IPR Media to Run Offline Diagnostics
Updating Processor Firmware Using the Diagnostic/IPR Media
14.It is necessary that you shutdown the operating system on the system whose firmware
you wish to change. This can be done with the reboot -h command.
15.Once the system's operating system is shutdown, you can then cycle the power of the
system by pushing the power button OFF and then ON. The system should then begin
to boot. If you look at the console, you will observe the system eventually display a boot
prompt or indicate that in 10 seconds it will autoboot unless you hit a key.
16.If you see the 10 second message, you should hit a key to get to the boot prompt.
17.At the boot prompt, you have to tell the system which path to boot from. You will want
to boot from the path that points to the DAT tape drive in which you placed the DAT
tape that you made earlier.
18.If you do not know the path to the DAT tape drive, type search at the boot prompt and
then hit
Return. The system will display all the bootable devices it can find. The DAT tape
will be a sequential boot device.
19.Once you have selected the boot path for the DAT tape drive, you should issue a boot
command using that path.
20.As the system boots, it may prompt you to know if it should interact with ISL or not. If
the system prompts you for such information, you should type y. Next, you should see
the ISL prompt.
21.At the ISL prompt, you should type ODE and hit
Return.
22.At the ODE prompt, you should type README. The README utility will display an index
indicating which image files on the LIF are for which systems, along with the versions
associated with those image files.
23.If you would like to see more detailed information about a particular firmware revision,
you can use the README utility commands to scroll through appropriate text files.
24.Once you have determined which image file(s) are appropriate for your system, you
should exit the README utility and type FUPDATE (or UPDATE) at the ODE prompt.
25.At the FUPDATE (or UPDATE) prompt, you should type the IMAGE command,
followed by the image filename(s) you determined was correct for your system. If your
system requires more than one image file, you should list the filenames in the order
they appeared in the README index.
CAUTION IF YOU SELECT THE WRONG IMAGE FILE(S), YOU CAN RENDER
YOUR SYSTEM UNUSABLE!
26.Once you have entered the IMAGE command, you can type the RUN command to start
the processor firmware update process on the system.
27.You will be prompted by the FUPDATE (or UPDATE) utility and you should respond as
appropriate. Once the update process is complete, the UPDATE utility will reboot your
system so that the new firmware can begin to operate.
THIS ENDS THE PROCEDURE FOR UPDATING THE PDC ON YOUR SYSTEM
FROM THE SUPPORT MEDIA.
Chapter 3 31
Page 32

Using the Diagnostic/IPR Media to Run Offline Diagnostics
Updating Processor Firmware Using the Diagnostic/IPR Media
32 Chapter 3
Page 33

Support Tools Manager (STM)
4 Support Tools Manager (STM)
The Support Tools Manager (STM) is a platform for online support tools currently
available for HP9000 Series 700 and 800 machines.
Upon startup, you connect to a local or remote system. STM displays a map of the
hardware configuration. You use this system map to select one or more devices, then run
the desired tool (such as a verifier, exerciser, or expert tool) on the selected device(s).
Results are displayed on the system map.
NOTE For the most current information on Support Tools, see our Web site,
“Systems Hardware, Diagnostics, and Monitoring,” at
http://www.docs.hp.com/hpux/systems/. This Web site also contains
additional documents, such as tutorials, quick reference guides, and release
information.
This chapter introduces STM and covers the following topics:
• Running STM
• Three Interfaces
• System Map and Device Icons
• Menus and Commands
• Getting Result Information (Logs)
• Remote Execution
• Getting Help
• Common Problems
Chapter 4 33
Page 34

Support Tools Manager (STM)
Running STM
Running STM
To start STM and run support tools:
1. Enter the command appropriate for your terminal.
• For X Windows terminals and workstations, enter /usr/sbin/xstm.
• For non-graphics terminals, enter /usr/sbin/mstm (menu-based version) or
/usr/sbin/cstm (command-line version).
You can also enter /usr/bin/stm. This command will start the X-windows
interface, if the DISPLAY environment variable is set; otherwise, the menu interface
will be started.
2. If you want to test a remote machine, select the computer system to test. The remote
machine must be running a compatible version of STM (i.e., the version running on the
system you wish to connect to must be identical to, or a later version than, the version
running on the system you are connecting from).
3. Select one or more devices from the system map that is displayed.
4. Choose a support tool (for example a verifier) to run on the selected device(s).
5. Results appear on the system map (for example on xstm, a green icon indicates that a
device successfully passed the test).
6. If the device fails, see the device Failure Log for the cause of the failure and suggested
actions.
7. If a test result is anything other than Successful or F ailure, look at the Test Activity Log
for the device.
The specific steps depend on whether you are running xstm, mstm, or cstm. For example,
in xstm, commands are accessed by means of pull-down menus. In mstm, you traverse
menus and select commands by pressing function keys. In cstm, you enter the command
name (or its abbreviated form) at the prompt.
For detailed instructions , use the STM online help system. (See “Getting Help”later in this
chapter.)
34 Chapter 4
Page 35

Support Tools Manager (STM)
Three Interfaces
Three Interfaces
You can access the Support Tools Manager (STM) through any of three interfaces. Choose
the interface appropriate for your needs, preferences, and resources. If possible, use xstm.
xstm (X Window graphical)
• X Window graphics terminals or workstations
• Command: /usr/sbin/xstm or /usr/sbin/stm/ui/bin/stm -x
mstm (menu-based)
• Non-graphics terminals
• Command: /usr/sbin/mstm or /usr/sbin/stm/ui/bin/stm -m
cstm (command line)
• For running scripts
• Command: /usr/sbin/cstm or /usr/sbin/stm/ui/bin/stm -c
Displays from the three interfaces are shown in the rest of this chapter.
Chapter 4 35
Page 36

Support Tools Manager (STM)
System Map and Device Icons
System Map and Device Icons
When you first connect to a computer system, you see a system map showing all the
hardware entities in the system (CPU, memory, device adapters, and I/O devices).
You use the system map to select the devices to test. After a test runs, the system map
displays the results. For example, a device icon in xstm is green for Successful and red for
Failure.
System Map in xstm
In xstm, the system map is composed of device icons (see Figure 4-1). You left-click on a
device icon to select that device and unselect all others.
Do a Control-left-click on a device icon to toggle the select of that device and leave all other
selected devices in their current state.
Figure 4-1 xstm System Map
36 Chapter 4
Page 37

System Map in mstm
The following figure shows a system map in mstm:
Figure 4-2
Support Tools Manager (STM)
System Map and Device Icons
/usr/sbin/stm/ui/bin/stm
File System Device Tools Options Help
==== ====== ====== ===== ======= ====
Path Product Active Tool Status
=========== ========================= =========== ==================
8 Bus Adapter Information Successful
8/0 Bus Adapter Information Successful
8/0/0 NIO Terminal Multiplexor Information Successful
8/4 Fast/Wide SCSI Interface Information Successful
8/4.3.0 SCSI Disk Exercise Aborted
8/4.4.0 SCSI Disk Verify Successful
8/4.10.0 SCSI Disk FW Update Successful
8/4.11.0 SCSI Disk FW Update Successful
8/16 Core I/O Adapter Information Successful
8/16/0 Centronics Interface Information Successful
8/16/5 SCSI Interface Information Successful
8/16/5.1.0 SCSI Tape Verify Query Pending
8/16/5.2.0 SCSI Disk Information Successful
8/16/6 LAN Interface Exercise Abort Pending
8/16/7 Built-in Keyboard/Mouse Information Successful
8/20 Core I/O Adapter Information Successful
8/20/2 RS-232 Interface Information Successful
8/20/5 EISA Adapter Information Successful
10 Bus Adapter Information Successful
32 CPU Exercise Successful
34 CPU Exercise Successful
49 MEMORY Exercise Successful
hpdst199
Last Last Op
Navigation of the system map is done by using the Up/Down/Left/Right arrow keys and the
Prev/Next or Page Up/Page Down keys.
To select a specific device for testing, place the cursor on the specific device and press
Return; all other devices are unselected. (To select a device and leave all other selected
devices in their current state, place the cursor on the specific device and press the space
bar.):
You can use the TAB key to activate a pull down menu which allows you to select the
specific tool that you want to run on the selected device(s). :
Chapter 4 37
Page 38

Support Tools Manager (STM)
System Map and Device Icons
System Map in cstm
The cstm system map is almost identical to the mstm system map. The main difference is
that cstm provides each device with a device number:
Figure 4-3
/usr/sbin/stm/ui/bin/stm
Dev Last Last Op
Num Path Product Active Tool Status
=== =========== ========================= =========== ==================
1 8 Bus Adapter Information Successful
2 8/0 Bus Adapter Information Successful
3 8/0/0 NIO Terminal Multiplexor Information Successful
4 8/4 Fast/Wide SCSI Interface Information Successful
5 8/4.3.0 SCSI Disk Exercise Aborted
6 8/4.4.0 SCSI Disk Verify Successful
.
.
.
hpdst199
You select devices by using the select command with a device number or path modifier. A
minus sign (-) in front of a parameter unselects it. Examples:
select device 1
select path 5/4.3.2
select device -1
select path -5/4.3.2
38 Chapter 4
Page 39

Support Tools Manager (STM)
Kinds of Support Tools
Kinds of Support Tools
To use the diagnostics and support tools, the user first invokes one of the user interface
modules (xstm, mstm, or cstm), selects one or more devices, and invokes one of the
following tools to specify what type of operation is to be performed on the device(s):
Information Creates a log of information specific to one device, including the product
identifier, a description of the device, the hardware path to the device, the
vendor, and the firmware revision code, if firmware is present in the
device.
Verify If available, performs a simple test of component function, providing a
"pass/fail" indication of device condition; typically, this is the first level test
of a device's condition.
Diagnose If available, runs a diagnostic program on the device, which is designed to
detect and isolate faulty hardware on that device. Diagnose tools equire a
Support Class or Node license.
Exercise If available, stresses the device or subsystem. This function is useful in
providing very high confidence verification, and in detecting intermittent
errors.
Firmware Update Initiates the firmware update process for a selected device. While the
user interface to the firmware update tools is generic, the tools themselves
are device-specific.
Expert Tools Are device specific troubleshooting utilities for use by sophisticated users.
Their functionality varies from tool to tool, but they are intended to be
interactive, and rely on you to provide information necessary to perform a
particular task. Expert tools require a Support Class or Node license, or in
some cases an HP-only license.
Utilities Are support tools which are not device specific. Current tools include
logtool (for reading system logs) and a disk copy utility. Most utilities do
not require a license.
V erifiers , exercisers and information tools require no license to run. Some of the other tools
may require a license. To see the license level required for the tools available on a device,
perform a “current device status” request on the device. For example in xstm, select the
device, then select “Current Device Status” from the Device pull-down menu.
Chapter 4 39
Page 40

Support Tools Manager (STM)
Menus and Commands
Menus and Commands
The xstm, mstm, and cstm interfaces all have different ways to display menus and accept
commands from the user.
The following subsections detail the xstm, mstm, and cstm menus and commands.
xstm Menus and Commands
In xstm, commands are accessed by means of pull-down menus.
Figure 4-4 xstm Menus and Commands
40 Chapter 4
Page 41

Support Tools Manager (STM)
Menus and Commands
mstm Menus and Commands
In mstm, you traverse screens and menus, and select commands from pulldown menus,
which are similar to those found in xstm:
Figure 4-5 mstm Menu Bar and Softkeys
Figure 4-6 mstm Pulldown Menu Example
Chapter 4 41
Page 42

Support Tools Manager (STM)
Menus and Commands
Screen Navigation
There are two types of screen navigation:
• Navigating between screens
• Navigating within screens
To navigate between one screen and another, use the Tab key.
To na vigate from one portion to another portion of the same screen, use the Prev and Next
keys (or, alternatively, the Cursor Up and Cursor Down keys).
Menu Bar
The following table summarizes the use of the menu bar.
Table 4-1 Menu Bar Navigation
To do this: Do this:
Position the cursor on the
menu bar
Use the Tab key (or the Menu Bar on/off
function key).
Move to a pulldown menu Use the cursor arrow keys
Expand a menu/sub-menu Use the Return key.
Highlight a command or
sub-men
u
Use the cursor keys.
Perform a command Use the Return key.
Invoke a menu directly:
Use Alt function key; then hit
non-underlined character in menu title.
Activate a menu command/expand
pulldown sub-menu:
Hit the letter which is underlined in the
command or sub-men
u.
.
42 Chapter 4
Page 43

Figure 4-7 mstm Menus and Commands
Support Tools Manager (STM)
Menus and Commands
Chapter 4 43
Page 44

Support Tools Manager (STM)
Menus and Commands
mstm Shortcut Keys
A new 'shortcuts' feature has been added to mstm which lets you do frequently performed
operations quickly. For example, to select all disks and then run the verify tool on them,
the user would hit the keys 'dv<RETURN>' while the mstm map is displayed. For a list of
the shortcut keys, hit the '?' key while the mstm map is displayed:
Shortcut Keys
Device Selections Device Tools Utilities
(a) all devices (v) verify (l) logtool
(d) disks (e) exercise
(m) memory (i) information
(p) processors (s) current device status
(t) tapes
Other Shortcut Keys
(?) this help page
<cr> execute shorcut key commands and exit from this help page.
<back-space> delete the last shortcut key entered and undo its selection.
Notes
- The first device selection will unselect all currently selected
devices.
Subsequent selections will be additive.
- Only one tool or utility operation is allowed per shortcut operation.
Shortcut Key Examples:
"av<cr>" Select all devices and run verifier.
"l<cr>" Run logtool.
"dte<cr>" Select only disk and tapes and run exerciser.
44 Chapter 4
Page 45

Support Tools Manager (STM)
Menus and Commands
cstm Menus and Commands
In cstm, you simply enter the command name (or its abbreviated form) at the prompt.
There are no menus and you can enter any command at any time.
The following lists the cstm commands for the HP-UX 10.10 to 11.0 releases by category.
The format is command (abbreviation):
File: System: Device:
saveconfig (scfg) connectsys (cs) currdevstatus (cds)
restoreconfig (rcfg) selcurrentsys (scs) cleartoolstatus (cts)
recordcmdfile (rcf) disconnectsys (ds) select (sel)
stoprecordcmd (srcf) savemap (smap) selall (sall)
runcmdfile (rncf) printmap (pmap) selclass (scl)
recordoutput (ro) remapsystem (rs) unselall (usal)
stoprecordout (sro) maplog (ml) unselclass (uscl)
uiactlog (uial) displaylic (dl)
readuutconfig (ruc) license (lic)
updatetoolinfo (uti) hplicense (hlic)
stmstartup (ssu) deinstalllic (dlic)
stmshutdown (ssd) sysactlog (sal)
resetsysactlog (rsa) daemonstartup (dsu)
localmaplog (lml) daemonshutdown (dsd)
localsysactlog (lsal) daemonkill (dk)
syslog (sl) daemonactlog (dacl)
os (os) map (map)
exit (ex)
Tools: Tools (Continued) Options:
information (info) fwupdatefaillog (ffl) infooptions (iop)
infolog (il) fwupdateinfo (finf) veroptions (vop)
infoactlog (ial) experttool (xt) diagoptions (dop)
infofaillog (ifl) expactlog (xal) exeroptions (eop)
infoinfo (iinf) expfaillog (xfl) fwupdateoptions (fop)
verify (ver) expinfo (xinf) expoptions (xop)
veractlog (val) runutil (ru) utiloptions (uop)
verfaillog (vfl) utilactlog (ual) launchoptions (lop)
verinfo (vinf) utilfaillog (ufl) mapoptions (mop)
diagnose (dgn) utilinfo (uinf) generaloptions (gop)
diagactlog (dal) lateactlog (lal)
diagfaillog (dfl) latefaillog (lfl)
diaginfo (dinf) aborttool (abt)
exercise (exc) suspendtool (st) Help:
exeractlog (eal) resumetool (ret) help
exerfaillog (efl) killtool (klt) help more
exerinfo (einf) abortutil (abu) help syntax
firmwareupdate (fwu) killutil (klu) help all
fwupdatelog (fal) displayquery (dq) help COMMAND (ACCEL)
attach (at) help help
wait (wait) version (vers)
Chapter 4 45
Page 46

Support Tools Manager (STM)
Getting Result Information (Logs)
Getting Result Information (Logs)
Most of the time you will get the information you need by looking at the status of device
icons on the system map. F or example, a device icon in xstm is green for Successful and red
for Failure.
If a device has a Failure, consult the device Failure Log for a message identifying likely
causes for the failure and suggesting possible actions. Figure 4-8 shows a sample Failure
Log in xstm.
Figure 4-8 Sample Failure Log in xstm
If a test result is anything other than Successful or Failure, look at the Test Activity Log
for the device. For example, if a test results in a Incomplete status, the Test Activity Log
will explain whether the problems is due to "malloc" failures or to missing device files, or
other possible errors.
Other logs are available with a record of STM system events (for example, a User Interface
Log).
46 Chapter 4
Page 47

Support Tools Manager (STM)
Remote Execution
Remote Execution
You can run the STM user interface on one machine, and use it to run support tools on one
or more remote machines. See Figure 4-9 for a display of possible connections.
The computer running the user interface is the UI system and the computer running the
support tools is the Unit Under Test or UUT).
As always you can run the user interface and support tools on the same machine. In this
case the UI machine and the UUT are one and the same.
Figure 4-9 Possible UI and UUT Connections
Chapter 4 47
Page 48

Support Tools Manager (STM)
Remote Execution
Distributed Structure
Efficient remote execution is possible because STM has a distributed structure. Figure
4-10 shows how the parts of STM are distributed between the UI machine and the UUT.
Figure 4-10Diagram of STM's Distributed Structure
The UI system contains the binaries for the graphical, menu, and command line interfaces,
as well as for the Core UI which underlies them. The UI also contains the text to be
displayed (message catalogs and help volumes).
The Unit Under Test (UUT) contains the binaries for the support tools (Diagnose, FW
Update, Exercise, Expert, etc) and the libraries which support them.
Improving Performance
This distributed design makes for good performance. This is because data and code reside
on the machine that makes use of them. The UI system has code for the UI, and message
text for both the UI and support tools. The UUT system has the support tool executables.
Little text is passed between the two machines, usually only the information required to
locate a message.
48 Chapter 4
Page 49

Support Tools Manager (STM)
Getting Help
Getting Help
STM provides sophisticated and full-featured help systems for the main STM interface and
for interactive tools such as Expert tools and Firmware Update tools. See F igure 4-11 for a
sample help display in xstm.
To access an online help system:
• xstm: Use the "Help" menu at the far right of the menu bar.
• mstm: Press the "Help" function key.
• xstm: Enter the command help.
Kinds of Help
Help for the main STM user interface covers the following:
• On Item: Context-sensitive information on parts of the interface (xstm only).
• On Tasks: Cookbook procedures for performing common system tasks using STM.
• On Application: General information about the Support Tool Manager
• On Help: Information about using the HP Help system.
• On Version: Copyright, version, and legal information about STM.
Chapter 4 49
Page 50

Support Tools Manager (STM)
Getting Help
Figure 4-11Sample Online Help in xstm (for FW Update Tool)
50 Chapter 4
Page 51

Support Tools Manager (STM)
Common Problems
Common Problems
Exercisers sometimes enter a "Hung" state.
STM monitors the progress of all running tools and expects each tool to send a "heartbeat"
every minute or so. If these heartbeat indications are not received within a two-minute
window, the tool state is changed to "Hung". Two possible causes:
• Cause 1: Not enough CPU time The most probable cause is that the tool is not getting
enough CPU time. This situation may occur if the computer is extremely busy or if
several exercisers are executing simultaneously, especially with the "Maximum Stress"
option.
If the cause of the problem is not enough CPU time, the tool will eventually make
enough progress to send another heartbeat at which time its state will be changed back
to "Running". You may choose to suspend or abort the tool and wait for the system to
become less busy. If you want to run several exercisers simultaneously, use the
"Medium Stress" option.
• Cause 2: Tool has stopped executing Only rarely would the tool stop executing . Typically,
this behavior would be caused by a kernel driver that has stopped responding or
something of that nature.
The tool may eventually start executing again if it becomes unblocked, at which time its
state will be changed back to "Running". You may choose to abort the tool at this point.
If the tool is blocked due to a kernel resource such as in a driver, you not be able to abort
the tool. In this case, the tool will stay in an "abort pending" state indefinitely.
The user interface will not connect to a machine.
This problem usually occurs when the machine address cannot be resolved or because the
diagmond daemon is not running on the machine that is being connected to. Use
/etc/ping to verify that the host address can be resolved.
If ping works, check to see if diagmond is running on the host machine. If it is not, log
into the host machine, run STM on it, and use the "File — >Administration — >Local UUT
Logs" command to view the log files on the host machine and determine what the problem
is.
The remote machine must have:
• HP-UX 10.01 or higher.
• The bundle containing STM (OnlineDiag) loaded.
• The diagmond demon running.
Chapter 4 51
Page 52

Support Tools Manager (STM)
Common Problems
The diagmond demon is automatically started for customers when they boot. It also
happens automatically when you update the diagnostic system, as that also forces a
reboot, which launches diagmond. If diagnostics are installed on the system but
diagmond is not running, you can start it in one of two ways (you need to be root for both
cases):
1. Type /usr/sbin/stm/uut/bin/sys/diagmond
2. Run xstm, mstm, or cstm and perform a local-startup:
• xstm: File->Administration->Local Startup
• mstm: file, admin, LOCAL STARTUP
• cstm: localstartup (lsu)
If diagmond won't stay up, follow the standard procedure to figure out why. Run xstm,
mstm, or cstm locally and look at the Local UUT Logs:
• cstm: localsyslog
• mstm: file, admin, local uut logs, sys act log
• xstm: File->Administration->Local UUT Logs->System Activity Logs
A device in the STM map is "Unknown" or its icon is blank.
This problem typically occurs if the driver that is associated with the device is not
recognized by STM. Please report all unknown devices through STARS. Include the
following information:
• The contents of the Scan HW Log.
• The output of the "Device — >Current Device Status" STM command.
• The output of the ioscan -kF HP-UX command.
• The type of device and its product number (if known).
Slow response to user commands.
When many tools are started simultaneously, STM may be slow to respond to user
commands. This is due primarily to the messaging traffic between the tools and STM
which is particularly heavy when tools are first run. During this time, one or more tools
may enter a "Hung" state.
These problems should disappear once all of the tools have gotten through the start-up
phase.
52 Chapter 4
Page 53

Support Tools Manager (STM)
Common Problems
SCSI Tape and Disk Tools report SCSI commands as failed in
the Test Activity Logs.
Some of the SCSI disk and tape tools log errors in their Test Activity logs indicating that
commands such as LOG SENSE and INQUIRY failed. This is usually because the drive
being tested is an older drive which did not implement these commands in the form they
are being used. If this is the case, the Cause/Action text in the log message will suggest
this as a possible cause of the problem.
No tools are available for a particular device.
Due to resource constraints, support tools for all device were not developed for this release.
Tools for these devices will probably be available in subsequent releases.
Some tools may not be available because they require a license. Currently the only tools
that require a license are expert tools. To see a list of the tools installed for a device and
the license level, if any, required to run the tool, use the "Device — >Current Device
Status…" command. The following is a display for a SCSI disk device:
Installed tools:
Diagnostic : None
Verifier : disk
Exerciser : disk
Informaton : scsi_disk
Expert Tool : scsi_disk (Licensed)
Firmware Update : scsi_disk
The "Device — >Select Class" command did not work.
This is usually because the "Device Type" and "Qualifier Type" you selected don't both
match a device in the system. For example, selecting a type of "Disk" and a qualifier of
"SCSI" will not select any devices because SCSI disks use qualifiers of "Hard," "Floppy,"
etc. Use the "Device — >Current Device Status" command to determine the valid type and
qualifier that apply to a specific device.
Chapter 4 53
Page 54

Support Tools Manager (STM)
Common Problems
54 Chapter 4
Page 55

Using the Diagnostic/IPR Media to Install Diagnostics on Your System
5 Using the Diagnostic/IPR Media to
Install Diagnostics on Your System
The Diagnostic/IPR Media is the swinstall format distribution media for the following
hardware support products for 10.01, 10.10, 10.20, 10.30, and 11.x HP-UX systems; it is
also the update format distribution media for the 9.04 and 9.07 HP-UX systems.
• Online diagnostics subsystem (STM)
• Support Tools Manager (HP-UX 10.x and 11.x)
• EMS Hardware Monitors (HP-UX 10.20 and 11.x only)
• HP Predictive Support tools (Series 800 only)
• LIF-resident offline diagnostics
• IPR patches
This chapter summarizes the hardware support products listed above, then describes how
to install the online support tools from the Diagnostic/IPR Media.
Chapter 5 55
Page 56

Using the Diagnostic/IPR Media to Install Diagnostics on Your System
Support Tools Manager (HP-UX 9000 Series 800/700)
Support Tools Manager (HP-UX 9000 Series 800/700)
The Support Tools Manager (STM) on HP-UX 10.x and 11.x systems provides a simple
interface to online diagnostics and support tools. For information on STM, see:
• Chapter 4, “Support Tools Manager (STM),” in this manual.
• The Web page for HP 9000/3000 Systems Hardware, Diagnostics and Monitoring at
http://www.docs.hp.com/hpux/systems/ - see the topics under “Diagnostics”
• The manpages xstm(1M),mstm(1M), and cstm(1M).
56 Chapter 5
Page 57

Using the Diagnostic/IPR Media to Install Diagnostics on Your System
EMS Hardware Monitors
EMS Hardware Monitors
Included on the Diagnostic/IPR Media are the EMS Hardware Monitors -- an important
new tool for maintaining system availability. The EMS hardware monitors allow you to
monitor the operation of a wide variety of hardware products and be alerted immediately if
any failure or other unusual event occurs. Hardware event monitoring is available to users
running HP-UX 10.20 or 11.x (IPR 9902 or later; 9902 refers to the February 1999 release).
Hardware event monitoring provides a high level of protection against system hardware
failure. By using hardware event monitoring, you can virtually eliminate undetected
hardware failures that could interrupt system operation or cause data loss.
The EMS Hardware Monitors are installed with the Support Tools Manager. Once the
monitoring software is installed, monitoring is automatically enabled and all supported
hardware devices on your system are automatically monitored. (In releases earlier than
June 1999, you must first enable hardware monitoring.)
For more information, see Appendix B (EMS Hardware Monitors) in this manual.
Chapter 5 57
Page 58

Using the Diagnostic/IPR Media to Install Diagnostics on Your System
HP Predictive Support
HP Predictive Support
HP Predictive Support helps improve the reliability of your HP 9000 Series 800s by
monitoring disk/tape drives and system memory for potential problems. If a potential
problem is detected, HP Predictive Support transfers this information to the
Hewlett-Packard Response Center.
HP Predictive Support monitors hardware by automatically collecting system information
and comparing it against historical data and predetermined thresholds. Then it reports
configuration changes, exceeded thresholds, and significant errors.
How the Process Works
HP Predictive Support involves your entire HP support team to help you monitor, prevent,
and resolve problems with your systems and peripherals:
1. Potential problem? After analyzing your system and peripherals, HP Predictive
Support sends any information on potential problems to the HP Response
Center.
2. HP Response Center analyzes the
problem. An HP Response Center Engineer (RCE) analyzes the data and adds it to
the system's history. If further action is needed, the RCE may ask the
system administrator to perform remote diagnostics, or may forward the
information to the HP Account CE.
3. HP Account CE may provide
backup support. The Account CE may suggest corrective actions to the system
administrator, or schedule a visit within the support agreement coverage
hours.
Usually, all of this activity occurs before there is any noticeable impact to system
performance.
What HP Predictive Support Covers
HP Predictive Support covers:
• Disk drives, by scanning the onboard logs of CS80 and SCSI/Fast-Wide SCSI disk
drives, and system logs. The DISCSCAN, SCSISCAN, and LOGSCAN utilities
provide coverage on disk drives.
• Memory, by scanning the memory logs with the MEMSCAN utility.
• Tape drives, by scanning system log files with the LOGSCAN utility.
• Low Priority Machine Checks (LPMC), by scanning system log files with the
LOGSCAN utility.
58 Chapter 5
Page 59

Using the Diagnostic/IPR Media to Install Diagnostics on Your System
HP Predictive Support
• The inventory of software and patches installed on your systems is tracked by the
PROACTIVE patching utility.
The HP Response Center Engineers use this information to recommend patches for
customers with high-end support agreements, such as Personalized System Support or
Business Continuity.
Chapter 5 59
Page 60

Using the Diagnostic/IPR Media to Install Diagnostics on Your System
LIF-LOAD (HP-UX 9000 Series 800 and 700 Systems)
LIF-LOAD (HP-UX 9000 Series 800 and 700 Systems)
The LIF-LOAD product provides offline diagnostic tools by installing a subset of the
Offline Diagnostics Environment (ODE) in the computer system's boot LIF volume. These
tools are then available at ISL level at the next reboot of the computer system. These tools
enable the user to verify the installation and operability of devices attached to HP
Precision Architecture RISC (PA-RISC) computer systems, prior to booting the computer
to the operating system level.
The following ODE tools are installed in the computer system's boot LIF volume:
MAPPER MAPPER is an ODE-based offline system configuration mapping utility. It
identifies and displays components of PA-RISC systems. System
components include hardware modules and peripheral devices.
IOTEST IOTEST is an ODE-based test module that runs supported IODC tests on
modules.
PERFVER PERFVER is an ODE-based test module that runs supported IODC tests
on devices.
The LIF-LOAD product is structured as follows:
SD-product: LIF-LOAD (for Series 800 and 700 systems)
After the LIF-LOAD product is installed, the ODE tools will be available at the ISL level at
the next reboot of the computer system. For further information about ODE, refer to
Chapter 3, “Using the Diagnostic/IPR Media to Run Offline Diagnostics.”
NOTE If the offline diagnostics failed to load onto your system, and the swagent log
contains the error message: There is not enough room in the
bootlif to install the offline diagnostics., please read the
following in order to manually install the offline diagnostics:
Requirements:
1. the root(/) disk has a 'Whole Disk' layout.
2. the bootlif has at least 4 megabytes of SWAP.
Instructions:
1. Carefully read and comprehend the mkboot (1m) manual page.
Please pay close attention to the -f option of mkboot.
2. From the console as root, issue the following commands:
shutdown 0
cd /usr/sbin/diag/lif
mkboot -vfb updatediaglif -p ISL -p HPUX -p AUTO /dev/rroot
reboot
You MUST immediately reboot the system following the mkboot command
line.
60 Chapter 5
Page 61

Using the Diagnostic/IPR Media to Install Diagnostics on Your System
Installing Online Support Tools from the Diagnostic/IPR Media (CD-ROM)
Installing Online Support Tools from the
Diagnostic/IPR Media (CD-ROM)
The following procedure is an example using a graphical user interface on an X11
terminal.
NOTE Prior to executing the following procedure on a 9.04 system, run the following
procedure to install the CD-ROM drivers and CDFS subsystem, assuming
they are not already installed:
• Run SAM.
• Choose Kernel Configuration Menu.
• Choose the Subsystems submenu.
• Select the CD-ROM/9000 subsystem to install in the kernel (the Current
State and Pending State fields should have values of Out and In,
respectively.
• Choose Actions from the Kernel Configurations menu bar.
• Choose Add Subsystem to Kernel from the Actions pulldown menu.
• Choose Create a New Kernel from the Actions pulldown menu; after a
new kernel is created, you are prompted to move the new kernel into place
and reboot.
• Move the new kernel, as indicated, and reboot your system.
The dart32 CD-ROM should now be accessible. You may now execute the
procedure immediately following the next note.
NOTE For further information on installing Predictive Support tools using the
terminal version of swinstall, see the HP Predictive Support/UX User's
Guide, part number: H2571-90008.
NOTE As of May 1999, the Support Tools can be downloaded from the HP Software
Depot at http://www.software.hp.com/.
At the site, select the product category named “Enhancement Releases”. Then
scroll down to the entry for “Support Tools for the HP 9000”. Click on the
entry for a description of the package. Installation instructions are also
available at the site. When the Support Tools have been downloaded to the
target system, move it to an appropriate directory (such as /tmp), then
proceed with the procedure described in this manual.
If you can obtain the current Diagnostic/IPR Media, consider installing the
Support Tools from it, instead of downloading them from the Web. The
Diagnostic/IPR Media contains the required patches and may be easier to
use.
Chapter 5 61
Page 62

Using the Diagnostic/IPR Media to Install Diagnostics on Your System
Installing Online Support Tools from the Diagnostic/IPR Media (CD-ROM)
1. Boot HP-UX
2. Insert the Diagnostic/IPR Media CD-ROM into the drive.
3. Find the device file for the CD-ROM drive by using the ioscan -fn or
ioscan -fnC disk command.
The following is an example of information displayed by ioscan for a CD-ROM drive at
address 2/0/1.3.0 on a series 700 system:
disk 3 2/0/1.3.0 sdisk CLAIMED DEVICE TOSHIBA CD-ROM XM-3301TA
/dev/dsk/c0t3d0 /dev/rdsk/c0t3d0
In this example, the device file needed to install support tools from the Diagnostic/IPR
Media is /dev/dsk/c0t3d0. (In the example commands that follow, substitute the
CD-ROM device file for your system.)
4. Create a temporary read-only mount point in order to access the data on the CD-ROM,
using commands similar to the following.
cd /
mkdir /diagtemp
mount -r /dev/dsk/c0t3d0 /diagtemp
In this example, we have used diagtemp as the name of the mount point.
NOTE If the -r option is not used, the following I/O error message appears and the
CD-ROM will not mount:
mount: /dev/dsk/c0t3d0 on /diagtemp : I/O error
5. Confirm that the CD-ROM has been mounted, by entering the mount command and
look for /diagtemp. The following is a sample output:
/diagtemp on /dev/dsk/c0t3d0 ro on Thu Mar 25 15:46:16 1999
6. Determine which patches must be installed first before you install the diagnostics.
(Without these patches, some versions of the Support Tools cannot be installed or will
not operate correctly.) See the section “Required Patches” in the
DIAGNOSTICS.readme file for the current release (IPR) of Support Tools. For IPR
9904, this file is located in the DOCUMENTATION directory on the CD-ROM. For IPR
9902 and IPR 9904, the files are available online at:
http://www.docs.hp.com/hpux/content/hardware/st/st_read.htm
7. If patches are required before loading the support tools, install them now. The
recommended method is to install the patches from the Diagnostic/IPR Media.The
patches are typically contained in the Hardware Critical (HWCR) or Hardware (HW)
patch bundle for your system, for example XSW800HWCR1020. Most people will only
want to install the individual patches required for STM rather than the entire HWCR
bundle which can be many megabytes in size.
The following is a summary of the process for installing patches using the swintall
program. For details on using swintall, see the steps on the next few pages.
a. Set the DISPLAY variable (for a graphics interface) and enter the command
swinstall -i .
62 Chapter 5
Page 63

Using the Diagnostic/IPR Media to Install Diagnostics on Your System
Installing Online Support Tools from the Diagnostic/IPR Media (CD-ROM)
b. Set Source Depot Type to “Local CDROM”. For the Source Depot Path, specify the
path to the appropriate HWCR or HW patch bundle for your system. For example,
/diagtemp/XSW800HWCR1020, /diagtemp/XSW700HW1020, or
/diagtemp/XSWHWCR1100.
c. Select the bundle from the swinstall display, then choose “Open Item” from the
“Actions” menu. All the patches in the patches bundle are displayed.
d. Select the patches required for STM by using the “Mark for Install” command in the
“Actions” menu.
e. Install the patches using the “Install (analysis)” command in the “Action menu.
Respond to the prompts that are displayed.
An advantage of installing patches from the Diagnostic/IPR Media is that only one
reboot is required for multiple kernel (OS) patches.
Alternately, you can obtain the patches through the HP Electronic Support Centers:
• For Americas and Asia-Pacific: http://us-support.external.hp.com/
• For Europe: http://europe-support.external.hp.com/
Log onto the appropriate URL and follow the directions given. One problem with
loading individual patches from these patch machines is that a system reboot is
required for every patch that requires a reboot (for example, patches to the kernel,
indicated by “PHKL” in the patch name).
8. Install support tool files using swinstall.
For a graphical user interface , set the DISPLAY variable with a command like export
DISPLAY=your_workstation:0.0 .
Then, enter the command swinstall -i.
9. The "Specify Source" window appears. Change the "Source Depot P ath" to the depot you
wish to load; for example, /diagtemp/DIAGNOSTICS/B.xx.xx, where xx.xx
represents 10.10, 10.20, or 11.00, depending upon which OS release your system is
running.
NOTE The following examples (Figures 5-1 to 5-4) use a source depot path for a
B.10.20 bundle. Set your path appropriately for the OS version on your
system (for example B.11.00, B.10.20, or B.10.10).
Chapter 5 63
Page 64

Using the Diagnostic/IPR Media to Install Diagnostics on Your System
Installing Online Support Tools from the Diagnostic/IPR Media (CD-ROM)
Figure 5-1 Specify Source Window
64 Chapter 5
Page 65

Using the Diagnostic/IPR Media to Install Diagnostics on Your System
Installing Online Support Tools from the Diagnostic/IPR Media (CD-ROM)
10.Click on the OK button. The "Software Selection Window" appears:
Figure 5-2 Software Selection Window
Chapter 5 65
Page 66

Using the Diagnostic/IPR Media to Install Diagnostics on Your System
Installing Online Support Tools from the Diagnostic/IPR Media (CD-ROM)
11.Select "OnlineDiag" and use the "Actions" menu option "Open Item" for a list of
products available from the CD-ROM:
Figure 5-3 Listing Available Online Diagnostic CD-ROM Products
Highlight the product to be installed. Use the "Actions" menu option "Mark for Install"
to indicate that the highlighted product is to be installed. Repeat the selection process
until all the desired products have been marked for installation.
It is not necessary to select EMS-Config and EMS-Core products, since these are
automatically installed when you install Support Tools Manager for HP-UX 10.20 or
11.x (IPR 9902 or later).
Most users select the offline diagnostics (LIF-LOAD) and the Support Tool Manager
(Sup-Tool-Mgr-x00) to be installed as shown in the following example. If you have an
S800 system, you may also choose HP Predictive Support (not shown in this example,
since it is not available on S700 systems).
66 Chapter 5
Page 67

Using the Diagnostic/IPR Media to Install Diagnostics on Your System
Installing Online Support Tools from the Diagnostic/IPR Media (CD-ROM)
Figure 5-4 Marking Products to Be Installed
12.To install the selected products, use the "Actions" menu option "Install (analysis)" to
begin the analysis phase of the installation:
Figure 5-5 Install Analysis Window
Chapter 5 67
Page 68

Using the Diagnostic/IPR Media to Install Diagnostics on Your System
Installing Online Support Tools from the Diagnostic/IPR Media (CD-ROM)
13.After the analysis has completed, click the OK button to start the installation. The first
"Confirmation" window appears.
Figure 5-6 First Confirmation Window
14.Click the
Yes button to continue with the installation. A second "Confirmation Window"
appears for 10.20 systems. (This window does not appear for 11.x systems, since a
reboot is not required.)
Figure 5-7 Second Confirmation Window
15.Click the
Yes button to continue with the installation.
16.Once installation is complete, unmount the CD-ROM with the umount command, for
example: umount /dev/dsk/c0t3d0 .
17.Eject the CD-ROM from the drive.
68 Chapter 5
Page 69

Using the Diagnostic/IPR Media to Install Diagnostics on Your System
Installing Online Support Tools from the Diagnostic/IPR Media (CD-ROM)
18.Check the Release Notes for other information on the products you installed. The
Release Notes contain any special post-installation actions that may be required
following this procedure.
• STM: /usr/sbin/stm/Rel_NOTES.STM
• EMS Hardware Monitors: /usr/sbin/stm/Rel_NOTES.HWE
• Predictive Support: /opt/pred/bin/Rel_NOTES.PRED
19.For the February 1999 or April 1999 releases of the Diagnostic/IPR media, you should
enable the EMS hardware monitors (the monitors are automatically enabled on June
1999 and later releases.) Follow this procedure to enable the monitors:
a. Run the monitoring request manager by typing:
/etc/opt/resmon/lbin/monconfig
b. From the main menu selection prompt, enter E(nable Monitoring)
c. See the “EMS Hardware Monitors User’s Guide” and other monitor documentation
for information about configuring and using the monitors.
THIS COMPLETES THE PROCEDURE FOR INSTALLING SUPPORT TOOLS..
For the most current information on Support Tools, see our Web site, “Systems Hardware,
Diagnostics, and Monitoring, ” athttp://www.docs.hp.com/hpux/systems/. This Web
site also contains additional documents, such as tutorials, quick reference guides, and
release information.
Chapter 5 69
Page 70

Using the Diagnostic/IPR Media to Install Diagnostics on Your System
Installing Online Support Tools from the Diagnostic/IPR Media (CD-ROM)
70 Chapter 5
Page 71

Disk Copy Utility — To make an image of a disk after install or upgrade (HP-UX 10.x to 11.x)
A Disk Copy Utility — T o make an image of
a disk after install or upgrade (HP-UX 10.x
to 11.x)
COPYUTIL is designed to copy data from a given disk to a tape and then at a later time,
copy the data from the tape back to a disk. The utility can be used to save off a bootable
copy of the operating system and if the system crashes, that version of the boot disk can be
restored. Lastly, COPYUTIL can be used to transfer data from a bad disk to a new good
disk.
NOTE For systems going from HP-UX 10.x to HP-UX 11.x, CopyUtil can be used to
make a system disk image so that the system can be dropped back to 10.x if
for some reason 11.x is not desired.
The utility uses two commands, BACKUP and RESTORE, to perform the copying of
information between devices. Both commands in effect perform the same function, copying.
However the BACKUP command copies data from disk to tape and can tolerate read errors
but will halt on a write error. The RESTORE command, on the other hand, copies data from
tape back to disk and will not tolerate read errors, or write errors.
COPYUTIL supports all bootable disks on all HPPA supported systems. Thus, all SCSI2
hard drives and Disk Arrays are supported. CD-ROM drives and MO drives are not
supported.
CAUTION CopyUtil is designed to recover data off of defective disks. It is NOT intended
to be a system-level backup tool.
Appendix A 71
Page 72

Disk Copy Utility — To make an image of a disk after install or upgrade (HP-UX 10.x to 11.x)
Operating Environment
Operating Environment
COPYUTIL operates under ODE and thus it only operates in an offline environment. When
COPYUTIL is executed, ODE handles all the I/O with the user and it handles several higher
level commands like LOG, HELP, and so forth.
COPYUTIL is a TM running under ODE. This means COPYUTIL must first satisfy all of
ODE's requirements. Since COPYUTIL is not a diagnostic all the hardware except the disk
drive must be working properly, and the disk drive can only have software read errors that
will not cause the system to halt.
NOTE An online version of COPYUTIL, running under STM, is also available.
Though COPYUTIL is not a diagnostic, all Read errors are isolated down to the block
address.
72 Appendix A
Page 73

Disk Copy Utility — To make an image of a disk after install or upgrade (HP-UX 10.x to 11.x)
Quick Start Instructions
Quick Start Instructions
Executing COPYUTIL .
To execute COPYUTIL, boot to ISL, then type:
ISL> ode copyutil
***************************************************************************
****** ******
****** Offline Diagnostic Environment ******
****** ******
****** (C) Copyright Hewlett-Packard Co 1993 ******
****** All Rights Reserved ******
****** ******
****** HP shall not be liable for any damages resulting from the ******
****** use of this program. ******
****** ******
****** TC Version A.00.14 ******
****** SysLib Version A.00.37 ******
****** ******
***************************************************************************
Type HELP for command information.
ISL_CMD> copyutil
Type HELP for command information.
***************************************************************************
****** ******
****** COPYUTIL ******
****** ******
****** Copyright (C) 1994 by Hewlett-Packard Company ******
****** All Rights Reserved ******
****** ******
****** HP shall not be liable for any damages resulting from the ******
****** use of this program. ******
****** ******
****** Version A.00.22 ******
****** ******
***************************************************************************
Please wait while I scan the device busses...
Ty Indx Path Product ID Bus Size Rev
D 0 2/0/1.0.0 QUANTUMLPS270S disc drive SCSI 258 MB 5909
D 1 2/0/1.1.0 SEAGATEST3600N disc drive SCSI 499 MB 9686
D 2 2/0/1.3.0 HPC2244 disc drive SCSI 1.0 GB 0B04
D 3 2/0/1.4.0 QUANTUMLPS525S/A2565A disc drive SCSI 499 MB 3100
T 4 2/0/1.5.0 HPC1504[X]/HPC1521B DDS tape SCSI N/A 1009
D 5 2/0/1.6.0 QUANTUMLPS270S disc drive SCSI 258 MB 5909
Legend:
Ty = Device type. 'D' for Disk; 'T' for Tape.
Indx = Index number used for referencing the device
Rev = Firmware Revision of the device
Size = Size of the Disk drive or "N/A" for a Tape drive.
Note: Due to different calculation methods used, the size
COPYUTIL>
of the device shown is only a rough approximation.
Appendix A 73
Page 74

Disk Copy Utility — To make an image of a disk after install or upgrade (HP-UX 10.x to 11.x)
Quick Start Instructions
At this point, typing UTILINFO would give you a good idea of what to do, but let us assume
we just want to copy data off the last Quantum disk drive (disk index 5) onto the DDS tape
drive (tape index 4). To do that, use the BACKUP command.
COPYUTIL> backup
Enter the Disk Index ([q]/?): 5
Enter the Tape Index ([q]/?): 4
**********************************************************************
* Please Load into Tape Drive, Tape Volume 0 for Backup.
**********************************************************************
If you have to, you may safely remove the SUPPORT MEDIA now.
Ready to continue ([y]/n/q/?): y
Checking for the beginning of tape: DONE.
..........10% completed
..........20% completed
..........30% completed
..........40% completed
..........50% completed
..........60% completed
..........70% completed
..........80% completed
..........90% completed
..........100% completed
COPYUTIL>
You can now exit the program, switch off the power, replace the bad disk and start the
program again.
COPYUTIL> exit
Replace the SUPPORT MEDIA now, if you removed it earlier.
ODE>
Assume you have restarted the program and it looks just like the last time. You now want
to restore the data back onto the new disk drive. To do this, you use the RESTORE
command.
COPYUTIL> restore
Enter the Tape Index ([q]/?): 4
Enter the Disk Index ([q]/?): 5
**********************************************************************
* Please Load into Tape Drive, Tape Volume 0 (or the Desire Tape).
**********************************************************************
If you have to, you may safely remove the SUPPORT MEDIA now.
Ready to continue ([y]/n/q/?): y
Checking for the beginning of tape: DONE.
..........10% completed
..........20% completed
..........30% completed
..........40% completed
..........50% completed
..........60% completed
..........70% completed
..........80% completed
..........90% completed
..........100% completed
74 Appendix A
Page 75

Disk Copy Utility — To make an image of a disk after install or upgrade (HP-UX 10.x to 11.x)
Quick Start Instructions
Restored Successful.
COPYUTIL>
You have now restored the data onto your new disk drive. You may wish to verify that the
data on the tape and the disk are the same. You now have restored data and can exit the
program and power cycle the machine.
Remember that if the BACKUP command could not read a block, the RESTORED block is
all nulls.
Appendix A 75
Page 76

Disk Copy Utility — To make an image of a disk after install or upgrade (HP-UX 10.x to 11.x)
Quick Start Instructions
76 Appendix A
Page 77

B EMS Hardware Monitors
Included on the Diagnostic/IPR Media are the EMS Hardware Monitors -- an important
new tool for maintaining system availability. The EMS Hardware Monitors allow you to
monitor the operation of a wide variety of hardware products and be alerted immediately if
any failure or other unusual event occurs. Hardware event monitoring is available to users
running HP-UX 10.20 or 11.x, with a Diagnostic/IPR Media of February 1999 or later..
Hardware event monitoring provides a high level of protection against system hardware
failure. By using hardware event monitoring, you can virtually eliminate undetected
hardware failures that could interrupt system operation or cause data loss.
NOTE Complete Information
For complete information on installing and using EMS hardware event
monitors, as well as a list of supported hardware, refer to the EMS Hardw are
Monitors Users Guide. An electronic copy of this book is included on the
Diagnostic/IPR Media CD-ROM in the /Documentation directory.
You can also download the latest version of the book from the Systems
Hardware, Diagnostics, and Monitoring section of Hewlett-Packard’s online
documentation web site at http://www.docs.hp.com/hpux/systems/.
This site also contains much additional information on the EMS product.
77
Page 78

EMS Hardware Monitors
Enabling Hardware Monitoring
Enabling Hardware Monitoring
The EMS Hardware Monitors are installed with the Support Tools Manager. Once the
monitoring software is installed, you simply need to enable hardware monitoring and all
supported hardware devices on your system will automatically be monitored.
On the June 1999 and later releases of the Diagnostic/IPR media, the monitors are
automatically enabled when they are installed. On February 1999 and April 1999 releases ,
you must enable hardware event monitoring with the following procedure:
1. Run the monitoring request manager by typing:
/etc/opt/resmon/lbin/monconfig
2. From the main menu selection prompt, enter E(nable Monitoring).
The default monitoring requests will automatically provide the following notification
methods for all monitors:
All events sent to text file /var/opt/resmon/log/event.log
Serious and Critical events sent to SYSLOG
Serious and Critical events sent to EMAIL address root
The Hardware Monitoring Request Manager, /etc/opt/resmon/lbin/monconfig, can be used
to customize the monitoring requests and add new ones.
At the time of publication, monitors are provided to support the following:
HP Disk Arrays
Fibre Channel Interconnect
Fibre Channel Interface Cards
High Availability Storage System Enclosures
SCSI Tape Products
HP SCSI Disk Products
HP Fibre Channel Disk Products
Memory
LPMCs
Core hardware
Kernel resources
In addition, a hardware status monitor is provided to monitor the current status of the
products supported by the above list.
For detailed information concerning which products are supported by which monitors and
additional dependencies, check the Systems Hardware, Diagnostics, and Monitoring
section of Hewlett-Packard’s online documentation website at
http://www.docs.hp.com/hpux/systems/.
NOTE EMS Hardware Monitors are installed as part of the STM-UUT-RUN Fileset.
However, the EMS Hardware Monitors are dependent on the EMS-Core and
EMS-Config products and additional filesets in the Sup-Tool-Mgr Product.
78 Appendix B
Page 79

EMS Hardware Monitors
Enabling Hardware Monitoring
Appendix B 79
Page 80

EMS Hardware Monitors
Enabling Hardware Monitoring
80 Appendix B
Page 81

Index
C
COPYUTIL (disk copy utility)
operating environment
cstm user interface
menus and commands
system map
D
device icons
diagnose tool (STM)
Diagnostic/IPR Media
overview
physical layout
purpose
will it boot?
diagnostics
installing
overview
usage
disk copy utility (COPYUTIL)
executing
quick start instructions
E
EMS hardware monitors
enabling
installing
exercise tool (STM)
entering a "hung" state
expert tool (STM)
F
failure log
firmware
updating processor firmware
firmware update tool (STM)
H
hardware monitors
enabling
installing
hardware support tools
installing
overview
usage
I
information tool (STM)
Initial System Loader (ISL)
ISL-based programs
standalone environment
will it boot?
installing hardware support tools
with theDiagnostic/IPR
Media
, 36
, 11
, 11
, 55
, 13
, 16, 17
, 73
, 78
, 61, 66
, 46
, 78
, 61, 66
, 55
, 13
, 16, 17
, 55
, 35
, 38
, 39
, 12
, 17
, 39
, 39
, 57, 77
, 19
, 16
, 71
, 72
, 45
, 71
, 73
, 57, 77
, 51
, 30
, 39
, 39
, 15
, 15
IODC tests
IOTEST
L
LIF-LOAD
M
MAPPER
monitors
enabling
installing
mstm user interface
menus and commands
shortcut keys
system map
O
offline diagnostics
installing
Offline Diagnostics Environment
installing
menu/command user interface
running the ODE command line
Test Module Manager
online tools
getting result information
installing
logs
tool types
Operating System (OS)
will it boot?
P
PERFVER
Predictive Support
processor firmware
updating
S
support tools
installing
overview
usage
Support Tools Manager (STM)
blank icon
common problems
device icons
device-select class command
distributed structure
, 60
, 60
, 60
, 19, 60
, 57, 77
, 78
, 61, 66
, 60
(ODE)
, 15, 19
, 60
23
interface
(TMMGR)
, 33
, 61
, 46
, 18, 39
, 60
, 30
, 55
, 13
, 16, 17
14, 33, 56
, 52
problem
, 35
, 41
, 44
, 37
, 19
, 21
, 23
, 46
, 16
, 11, 58
,
, 51
, 36
, 53
, 48
failed SCSI commands
failure log
gettting result information
installing
logs
menus and commands
no tools available
online help
remote execution
running
slow response
starting
system map
test activity log
tool types
Unit Under Test (UUT)
unknown device
User Interface (UI) machine
user interfaces
will not connect to a machine
system map
T
,
test activity log
Test Controller (TC)
Test Module (TM)
Test Module Manager (TMMGR)
23
Environment Screen
Environment Variables
running TMMGR
System Screen
Test Screen
U
Unit Under Test (UUT) machine
47
UPDATE
updating processor firmware
User Interface (UI) machine
utilities (STM)
V
verify tool (STM)
W
web site for diagnostics
information
X
xstm user interface
menus and commands
system map
, 46
, 61
, 46
, 34
, 34
, 18, 39
machine
, 36
, 19
, 49
, 52
, 36
, 46
, 47
, 52
, 35
, 46
, 19
, 24
, 25
, 39
, 39
, 33, 77
, 36
, 53
, 46
, 40
, 53
, 47
, 47
, 51
, 19
,
, 26
, 26
, 23
,
, 30
, 47
, 35
, 40
Index 81
 Loading...