

Page 1

Automating Measurements
HP 8712ET/ES and HP 8714ET/ES
RF Network Analyzers
User’s Guide Supplement
HP Part No. 08714-90014
Printed in USA
Print Date: October 1999
Supersedes: October 1998
© Copyright 1998, 1999 Hewlett-Packard Company
Page 2

Notice
Softkey
The information contained in this document is subject to change without
notice. Hewlett-Packard makes no warranty of any kind with regard to
this material, including but not limited to, the implied warranties of
merchantability and fitness for a particular purpose. Hewlett-Packard
shall not be liable for errors contained herein or for incidental or
consequential damages in connection with the furnishing, performance,
or use of this material.
Key Conventions
This manual uses the following conventions:
FRONT PANEL KEY
analyzer (a “hardkey”).
: This indicates a “softkey”—a key whose label is determined
by the instrument’s firmware, and is displayed on the right side of the
instrument’s screen next to the eight unlabeled keys.
: This represents a key physically located on the
ii
Page 3

Acknowledgments
Excel™ is a product of Microsoft Corp.
Lotus® 1-2-3®, and Lotus WordPro are U.S. registered trademarks of
Lotus Development Corporation.
Microsoft is a U.S. registered trademark of Microsoft Corporation.
QuickBasic™ is a product of Microsoft Corp.
Portions of the software include source code from the Info–ZIP group.
This code is freely available on the Internet by anonymous ftp
asftp.uu.net:/pub/archiving/zip/unzip51/.tar.Z, and from CompuServe
asunz51.zip in the IBMPRO forum, library 10, (data compression).
iii
Page 4

Hewlett-Packard Sales & Service Offices
UNITED STATES
Instrument Support Center
Hewlett-Packard Company
(800) 403-0801
EUROPEAN FIELD OPERATIONS
Headquarters
Hewlett-Packard S.A.
150, Route du Nant-d’Avril
1217 Meyrin 2/ Geneva
Switzerland
(41 22) 780.8111
Great Britain
Hewlett-Packard Ltd.
Eskdale Road, Winnersh Triangle
Wokingham, Berkshire RG41 5DZ
England
(44 734) 696622
INTERCON FIELD OPERATIONS
Headquarters
Hewlett-Packard Company
3495 Deer Creek Rd.
Palo Alto, CA 94304-1316
USA
(415) 857-5027
France
Hewlett-Packard France
1 Avenue Du Canada
Zone D’Activite De Courtaboeuf
F-91947 Les Ulis Cedex
France
(33 1) 69 82 60 60
Australia
Hewlett-Packard Australia Ltd.
31-41 Joseph Street
Blackburn, Victoria 3130
(61 3) 895-2895
Germany
Hewlett-Packard GmbH
Hewlett-Packard Strasse
61352 Bad Homburg v.d.H
Germany
(49 6172) 16-0
Canada
Hewlett-Packard (Canada) Ltd.
17500 South Service Road
Trans-Canada Highway
Kirkland, Quebec H9J 2X8
Canada
(514) 697-4232
Japan
Hewlett-Packard Japan, Ltd.
Measurement Assistance Center
9-1, Takakura-Cho, Hachioji-Shi
Tokyo 192-8510, Japan
TEL (81) -426-56-7832
FAX (81) -426-56-7840
China
China Hewlett-Packard Co.
38 Bei San Huan X1 Road
Shuang Yu Shu
Hai Dian District
Beijing, China
(86 1) 256-6888
iv
Singapore
Hewlett-Packard Singapore (Pte.) Ltd.
150 Beach Road
#29-00 Gateway West
Singapore 0718
(65) 291-9088
Taiwan
Hewlett-Packard Taiwan
8th Floor, H-P Building
337 Fu Hsing North Road
Taipei, Taiwan
(886 2) 712-0404
Page 5

HP 8712ET/ES and HP 8714ET/ES
Network Analyzer
Documentation Map
The CDROM provides the contents of all of the documents
listed below.
The User’s Guide shows how to make measurements,
explains commonly-used features, and tells you how to get
the most performance from the analyzer.
The LAN Interface User’s Guide Supplement shows
how to use a local area network (LAN) for programming and
remote operation of the analyzer.
The Automating Measurements User’s Guide
Supplement provides information on how to configure and
control test systems for automation of test processes.
The Programmer’s Guide provides programming
information including HP-IB and SCPI command
references, as well as short programming examples.
v
Page 6

The Example Programs Guide provides a tutorial
introduction using BASIC programming examples to
demonstrate the remote operation of the analyzer
.
The Service Guide provides the information needed to
adjust, troubleshoot, repair, and verify analyzer
conformance to published specifications.
The HP Instrument BASIC User’s Handbook describes
programming and interfacing techniques using
HP Instrument BASIC, and includes a language reference.
The HP Instrument BASIC User’s Handbook
Supplement shows how to use HP Instrument BASIC to
program the analyzer.
The Option 100 Fault Location and Structural Return
Loss Measurements User’s Guide Supplement provides
theory and measurement examples for making fault location
and SRL measurements. (Shipped only with Option 100
analyzers.)
vi
The CATV Quick Start Guide provides abbreviated
instructions for testing the quality of coaxial cables.
(Shipped only with Option 100 analyzers.)
The Cellular Antenna Quick Start Guide provides
abbreviated instructions for verifying the performance of
cellular antenna systems. (Shipped only with Option 100
analyzers.)
Page 7

Contents
1. Introduction
Automating Measurements. . . . . . . . . . . . . . . . . . . . . . . . . . . . . . . . . . . . . . . . . . . . . . . 1-2
2. Configuring Your Test System
Measurement System Configurations and Considerations. . . . . . . . . . . . . . . . . . . . . . 2-2
Stand-Alone Network Analyzers . . . . . . . . . . . . . . . . . . . . . . . . . . . . . . . . . . . . . . . . . 2-3
External Computer Control . . . . . . . . . . . . . . . . . . . . . . . . . . . . . . . . . . . . . . . . . . . . . 2-5
Expandability and Large Systems . . . . . . . . . . . . . . . . . . . . . . . . . . . . . . . . . . . . . . . . . 2-7
Throughput Considerations . . . . . . . . . . . . . . . . . . . . . . . . . . . . . . . . . . . . . . . . . . . . . . 2-8
Selecting a Measurement Controller . . . . . . . . . . . . . . . . . . . . . . . . . . . . . . . . . . . . . . . 2-9
Stand-Alone Operation using IBASIC. . . . . . . . . . . . . . . . . . . . . . . . . . . . . . . . . . . . . 2-9
Computer-Controlled HP-IB Operation . . . . . . . . . . . . . . . . . . . . . . . . . . . . . . . . . . . 2-9
Computer-Controlled LAN Operation. . . . . . . . . . . . . . . . . . . . . . . . . . . . . . . . . . . . 2-10
Using IBASIC and External Control Together. . . . . . . . . . . . . . . . . . . . . . . . . . . . . 2-10
Selecting a Programming Language. . . . . . . . . . . . . . . . . . . . . . . . . . . . . . . . . . . . . . . 2-11
HP BASIC. . . . . . . . . . . . . . . . . . . . . . . . . . . . . . . . . . . . . . . . . . . . . . . . . . . . . . . . . . 2-11
IBASIC . . . . . . . . . . . . . . . . . . . . . . . . . . . . . . . . . . . . . . . . . . . . . . . . . . . . . . . . . . . . 2-11
HP VEE. . . . . . . . . . . . . . . . . . . . . . . . . . . . . . . . . . . . . . . . . . . . . . . . . . . . . . . . . . . . 2-12
Microsoft® QuickBasic™ . . . . . . . . . . . . . . . . . . . . . . . . . . . . . . . . . . . . . . . . . . . . . . 2-12
C and C++ . . . . . . . . . . . . . . . . . . . . . . . . . . . . . . . . . . . . . . . . . . . . . . . . . . . . . . . . . . 2-12
VXI plug&play Driver . . . . . . . . . . . . . . . . . . . . . . . . . . . . . . . . . . . . . . . . . . . . . . . . 2-13
Example Programs. . . . . . . . . . . . . . . . . . . . . . . . . . . . . . . . . . . . . . . . . . . . . . . . . . . 2-13
3. Operator Interaction
Prompting the Operator . . . . . . . . . . . . . . . . . . . . . . . . . . . . . . . . . . . . . . . . . . . . . . . . . 3-4
Using Graphics to Create On-Screen Diagrams . . . . . . . . . . . . . . . . . . . . . . . . . . . . . . 3-5
User-Defined BEGIN Key Menu. . . . . . . . . . . . . . . . . . . . . . . . . . . . . . . . . . . . . . . . . . . 3-6
Loading a User BEGIN Program. . . . . . . . . . . . . . . . . . . . . . . . . . . . . . . . . . . . . . . . 3-10
Modifying a User BEGIN Program . . . . . . . . . . . . . . . . . . . . . . . . . . . . . . . . . . . . . . 3-10
Using a Switch with User BEGIN. . . . . . . . . . . . . . . . . . . . . . . . . . . . . . . . . . . . . . . 3-11
Using a Barcode Reader for Data Entry. . . . . . . . . . . . . . . . . . . . . . . . . . . . . . . . . . . . 3-13
Using an External Keyboard for Data Entry. . . . . . . . . . . . . . . . . . . . . . . . . . . . . . . . 3-14
Using the Analyzer's Title Feature. . . . . . . . . . . . . . . . . . . . . . . . . . . . . . . . . . . . . . . . 3-15
Hot Keys on External Keyboard for Common Functions . . . . . . . . . . . . . . . . . . . . . . 3-16
User-Defined TTL Input/Output. . . . . . . . . . . . . . . . . . . . . . . . . . . . . . . . . . . . . . . . . . 3-18
Using a Foot or Hand Switch . . . . . . . . . . . . . . . . . . . . . . . . . . . . . . . . . . . . . . . . . . . . 3-19
vii
Page 8

Contents
Limit-Test Pass/Fail TTL Input/Output . . . . . . . . . . . . . . . . . . . . . . . . . . . . . . . . . . . .3-21
Analyzer Port Numbers . . . . . . . . . . . . . . . . . . . . . . . . . . . . . . . . . . . . . . . . . . . . . . . . .3-22
Output for External VGA-Compatible Monitor . . . . . . . . . . . . . . . . . . . . . . . . . . . . . .3-24
4. Measurement Setup and Control with Fast Recall
Using Fast Recall with the Front Panel or a Keyboard . . . . . . . . . . . . . . . . . . . . . . . . .4-3
Using Fast Recall with a Switch . . . . . . . . . . . . . . . . . . . . . . . . . . . . . . . . . . . . . . . . . . .4-5
5. Automated Measurement Setup and Control
Setting the Instrument State . . . . . . . . . . . . . . . . . . . . . . . . . . . . . . . . . . . . . . . . . . . . .5-4
Recalling Instrument States from Disk. . . . . . . . . . . . . . . . . . . . . . . . . . . . . . . . . . . .5-4
Using Learn Strings to Save and Recall Instrument States . . . . . . . . . . . . . . . . . . .5-6
SCPI Commands that Modify a Single Parameter. . . . . . . . . . . . . . . . . . . . . . . . . . . . .5-7
Fast Iterative Control. . . . . . . . . . . . . . . . . . . . . . . . . . . . . . . . . . . . . . . . . . . . . . . . . . . .5-8
Responsive Communication using SRQs . . . . . . . . . . . . . . . . . . . . . . . . . . . . . . . . . . .5-10
Using Both of the Analyzer's Measurement Channels . . . . . . . . . . . . . . . . . . . . . . . .5-11
Using Single Sweep to Measure and View All Four S-Parameters. . . . . . . . . . . . . . .5-12
AUTOST files . . . . . . . . . . . . . . . . . . . . . . . . . . . . . . . . . . . . . . . . . . . . . . . . . . . . . . . . .5-15
6. Controlling Peripherals
Using the Parallel Port. . . . . . . . . . . . . . . . . . . . . . . . . . . . . . . . . . . . . . . . . . . . . . . . . . .6-3
Writing to the Parallel Port . . . . . . . . . . . . . . . . . . . . . . . . . . . . . . . . . . . . . . . . . . . . .6-6
Reading from the Parallel Port. . . . . . . . . . . . . . . . . . . . . . . . . . . . . . . . . . . . . . . . . . .6-9
Hardcopy Considerations. . . . . . . . . . . . . . . . . . . . . . . . . . . . . . . . . . . . . . . . . . . . . . . .6-10
Using the Serial Port . . . . . . . . . . . . . . . . . . . . . . . . . . . . . . . . . . . . . . . . . . . . . . . . . . .6-11
7. Displaying Measurement Results
Graticule On/Off. . . . . . . . . . . . . . . . . . . . . . . . . . . . . . . . . . . . . . . . . . . . . . . . . . . . . . . .7-3
Limit Testing . . . . . . . . . . . . . . . . . . . . . . . . . . . . . . . . . . . . . . . . . . . . . . . . . . . . . . . . . .7-4
To turn limit lines on or off. . . . . . . . . . . . . . . . . . . . . . . . . . . . . . . . . . . . . . . . . . . . . .7-4
To turn the fail icon on or off . . . . . . . . . . . . . . . . . . . . . . . . . . . . . . . . . . . . . . . . . . . .7-4
To turn the pass/fail text on or off . . . . . . . . . . . . . . . . . . . . . . . . . . . . . . . . . . . . . . . .7-4
To move the position of the pass/fail indicator . . . . . . . . . . . . . . . . . . . . . . . . . . . . . .7-5
Customized X-axis Annotation . . . . . . . . . . . . . . . . . . . . . . . . . . . . . . . . . . . . . . . . . . . .7-6
To turn on user-defined X-axis annotation . . . . . . . . . . . . . . . . . . . . . . . . . . . . . . . . .7-6
To specify your start and stop values. . . . . . . . . . . . . . . . . . . . . . . . . . . . . . . . . . . . . .7-6
viii
Page 9

Contents
To specify a custom suffix. . . . . . . . . . . . . . . . . . . . . . . . . . . . . . . . . . . . . . . . . . . . . . . 7-6
To turn the X-axis annotation on or off. . . . . . . . . . . . . . . . . . . . . . . . . . . . . . . . . . . . 7-7
Customized Measurement-Channel Annotation . . . . . . . . . . . . . . . . . . . . . . . . . . . . . . 7-8
To turn on user-defined measurement-channel annotation. . . . . . . . . . . . . . . . . . . . 7-8
To specify the string to be displayed . . . . . . . . . . . . . . . . . . . . . . . . . . . . . . . . . . . . . . 7-8
To restore default measurement-channel annotation . . . . . . . . . . . . . . . . . . . . . . . . 7-8
To turn measurement-channel annotation on or off. . . . . . . . . . . . . . . . . . . . . . . . . . 7-9
Markers . . . . . . . . . . . . . . . . . . . . . . . . . . . . . . . . . . . . . . . . . . . . . . . . . . . . . . . . . . . . . 7-10
Title and Clock. . . . . . . . . . . . . . . . . . . . . . . . . . . . . . . . . . . . . . . . . . . . . . . . . . . . . . . . 7-12
8. Saving Measurement Results
Querying Measurement Data . . . . . . . . . . . . . . . . . . . . . . . . . . . . . . . . . . . . . . . . . . . . . 8-3
Saving the Measurement to Disk — Save ASCII. . . . . . . . . . . . . . . . . . . . . . . . . . . . . . 8-4
Saving the Measurement to Disk — Save Data. . . . . . . . . . . . . . . . . . . . . . . . . . . . . . . 8-5
Querying Marker Searches . . . . . . . . . . . . . . . . . . . . . . . . . . . . . . . . . . . . . . . . . . . . . . . 8-6
Saving Measurement Results to Disk . . . . . . . . . . . . . . . . . . . . . . . . . . . . . . . . . . . . . . 8-7
Using Hardcopy Features to Print or Plot Results . . . . . . . . . . . . . . . . . . . . . . . . . . . . 8-8
Faster Hardcopies using a PCL5 Printer . . . . . . . . . . . . . . . . . . . . . . . . . . . . . . . . . . 8-9
Customizing Page Layout . . . . . . . . . . . . . . . . . . . . . . . . . . . . . . . . . . . . . . . . . . . . . . 8-9
Custom Data Sheets . . . . . . . . . . . . . . . . . . . . . . . . . . . . . . . . . . . . . . . . . . . . . . . . . . . 8-12
Statistical Process Control . . . . . . . . . . . . . . . . . . . . . . . . . . . . . . . . . . . . . . . . . . . . . . 8-14
Transferring Files . . . . . . . . . . . . . . . . . . . . . . . . . . . . . . . . . . . . . . . . . . . . . . . . . . . . . 8-15
ix
Page 10

Contents
x
Page 11

1 Introduction
1-1
Page 12

Introduction
Automating Measurements
Automating Measurements
An automated measurement system is one where a computer performs
some of the tasks that you would normally have to do manually.
The information in this book will help you learn how to automate your
measurement system. Several features of the instrument that are useful
for automation are explained.
NOTE The information in this book assumes that you are familiar with the
information provided in the Programmer's Guide, the HP Instrument
BASIC User's Handbook, and the HP Instrument BASIC User’s
Handbook Supplement that were supplied with your analyzer.
This book explains how to control your analyzer using internal IBASIC
or with an external computer connected via HP-IB. The analyzer’s
internal CPU running IBASIC programs acts as a complete system
controller residing inside your analyzer. You have the additional
capability of controlling the analyzer over a LAN. Refer to the LAN
Interface User’s Guide Supplement (supplied with the analyzer) for
information.
Some of the analyzer features that support automation are built-in and
operate solely on the analyzer; limit testing is one example of a built-in
automation feature. Other features can be executed by programs
running internally under IBASIC or on an external computer.
NOTE Example programs can be found in the following four locations:
• Web site http://www.hp.com or http://www.agilent.com. Use the
search function to find Web pages related to 8712 example programs.
• Example Programs Disk, HP 8712ET/ES and HP 8714ET/ES (DOS
format): HP part number 08714-10003
• Example Programs Disk, HP 8712ET/ES and HP 8714ET/ES (LIF
format): HP part number 08714-10004
• Example Programs Guide, HP 8712ET/ES and HP 8714ET/ES: HP
part number 08714-90016
1-2 Automating Measurements
Page 13

Introduction
Automating Measurements
Use of automation improves the productivity of a measurement system
by increasing the system's throughput. Throughput is typically
measured as the amount of units or components produced over a
particular period of time. Throughput can be increased by minimizing
the time for the following factors:
• device handling time
• operator interaction time
• measurement speed
• data transfer speed
• computation speed (when applicable)
Be sure to consider all of these factors when choosing and setting up an
automated system.
Automating your measurements can help ensure consistent quality on a
production line. An automated system can perform repetitive tasks
quickly and consistently. Automation can be used to direct you through a
sequence of tests, to set instrument parameters, and to send prompts
with helpful directions or diagrams. Automation is also used to collect
data, to monitor production line performance, and to archive and analyze
data.
Using a consistent, documented production process, while monitoring
product quality, are important attributes of modern production and
quality standards such as ISO-9000. These attributes are best achieved
with an automated system.
NOTE Hewlett-Packard offers professional consulting services to help increase
your manufacturing productivity. A complete test process analysis can be
performed by HP system engineers, who will work with your factory
management, engineering, and production groups to evaluate various
automation solutions. F or more information contact the nearest HP sales
office. Refer to the front of this book for a table of sales and service
offices.
Automating Measurements 1-3
Page 14

Introduction
Automating Measurements
1-4 Automating Measurements
Page 15

2 Configuring Your Test System
2-1
Page 16

Configuring Your Test System
Measurement System Configurations and Considerations
Measurement System Configurations
and Considerations
When configuring your test system, there are many things to consider,
such as:
• how many test stations do you need now?
• how many test stations will be needed in the future?
• how much space is available at each test station?
• what type of testing will be done?
• how will the measurements be controlled?
• how will the data be analyzed and archived?
• what level of throughput is required?
After answering these questions, you should decide which of the
following configurations best meets your needs.
2-2 Automating Measurements
Page 17

Configuring Your Test System
Measurement System Configurations and Considerations
Stand-Alone Network Analyzers
In the stand-alone configuration, you can either take advantage of the
operator-initiated automation features, or you can use the internal CPU
and IBASIC programs to further automate your measurements.
Stand-Alone Analyzer under Operator Control
In this configuration, the measurement is controlled directly by the
operator, with very little automation. No computer or IBASIC control is
used, however the fast-recall feature may be used to quickly change
between different instrument states. This configuration is well suited for
simple pass/fail testing using the built-in limit-testing features.
Configure your system as a stand-alone analyzer if you would like to
• simplify test-system configuration
• maintain full control by operators
• minimize test-development time
Stand-Alone Analyzer under IBASIC Control
In this configuration, the measurement is controlled by an IBASIC
program running inside the analyzer. With IBASIC, the measurement
setup and control can be highly automated, reducing the burden on the
operator. Since the measurement is under programmatic control, data
can be collected and analyzed in order to monitor your process and
quality. IBASIC's keystroke recording lets you construct programs
quickly, without needing to refer to the programming documentation.
Using AUTOST files, the analyzer will load and run your program when
power is turned on.
Since no external computer is required, there are fewer system
components to purchase, maintain, connect, and synchronize.
Automating Measurements 2-3
Page 18
Configuring Your Test System
Measurement System Configurations and Considerations
Configure your system as a stand-alone instrument with IBASIC if you
would like to
• simplify test-system configuration
• minimize the space required for a system
• simplify programming with keystroke recording
• use key macros
• automate measurement setup and control
• simplify measurements
• collect data
• run application programs on the analyzer
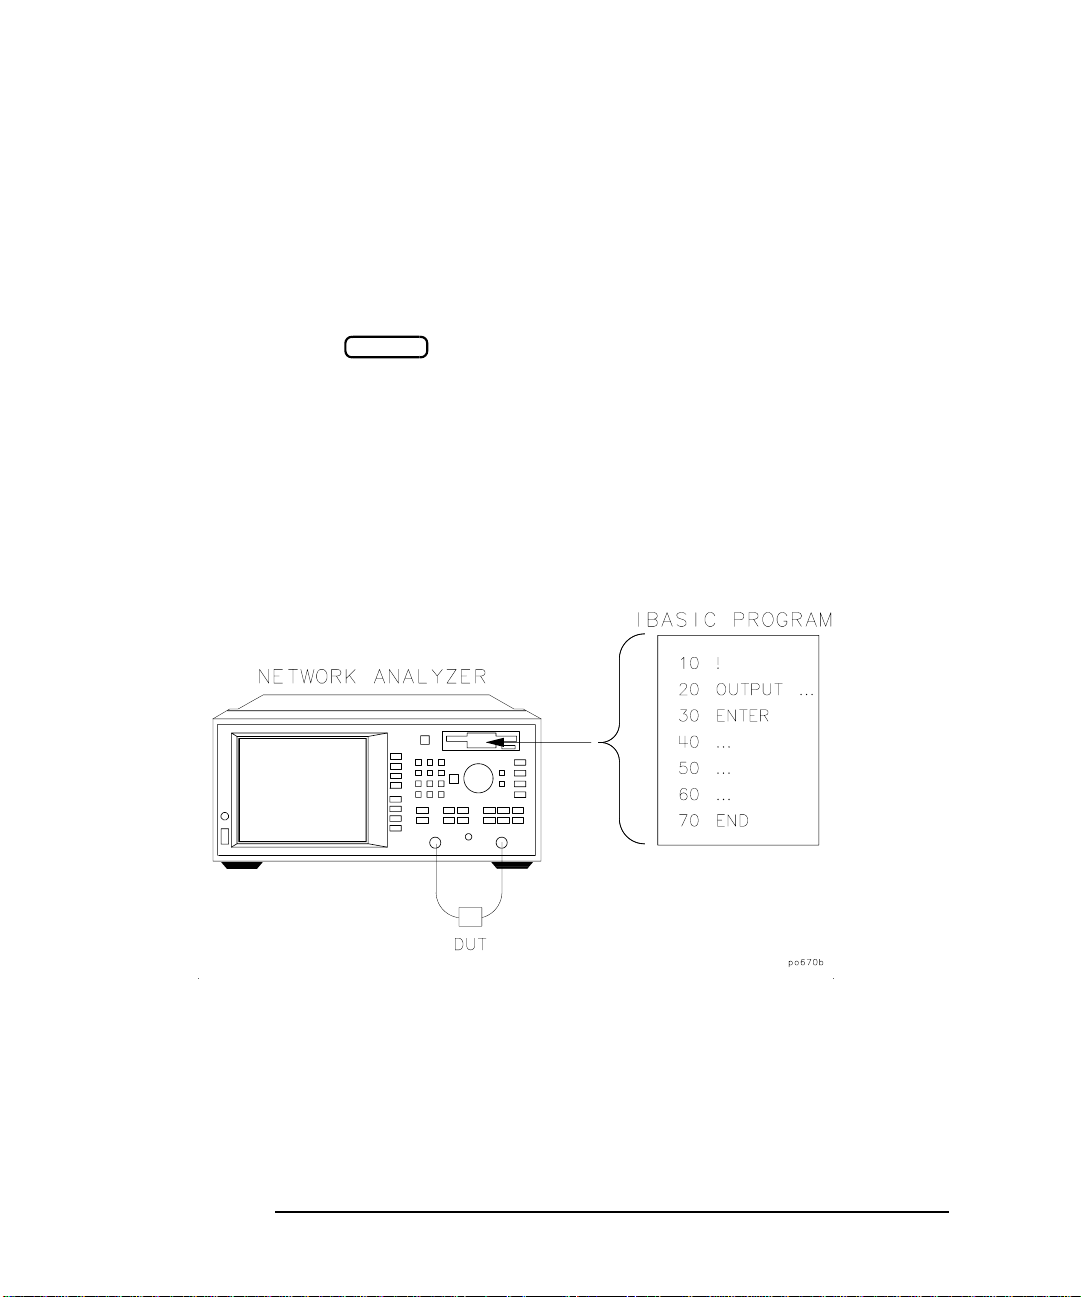
Figure 2-1 depicts a stand-alone network analyzer running IBASIC.
Figure 2-1 Stand-Alone Network Analyzer Running IBASIC
BEGIN
2-4 Automating Measurements
Page 19
Configuring Your Test System
Measurement System Configurations and Considerations
External Computer Control
You can use an external computer to control your analyzer or test system
by using the LAN or HP-IB interface on your analyzer. Additionally, you
can use an external computer in conjunction with the analyzer’s internal
CPU running IBASIC for optimum throughput. (F or more information on
using the LAN interface, refer to The LAN Interface User’s Guide
Supplement.)
External Computer Alone
In this configuration, the measurement is controlled by a computer
external to the analyzer, using the LAN or the HP-IB interface. The
measurement setup and control can be highly automated and designed
for optimum throughput. Data can be automatically collected and
analyzed in order to monitor quality and processes. You can connect one
or more analyzers to each computer. Since the computer can be
connected to other computers via a Local Area Network (LAN),
measurement statistics can be easily tracked and archived using
computer applications.
Configure your system as an analyzer controlled by an external
computer if you would like to
• centralize automation and application programs
• develop a more sophisticated data collection system
• add networking capability
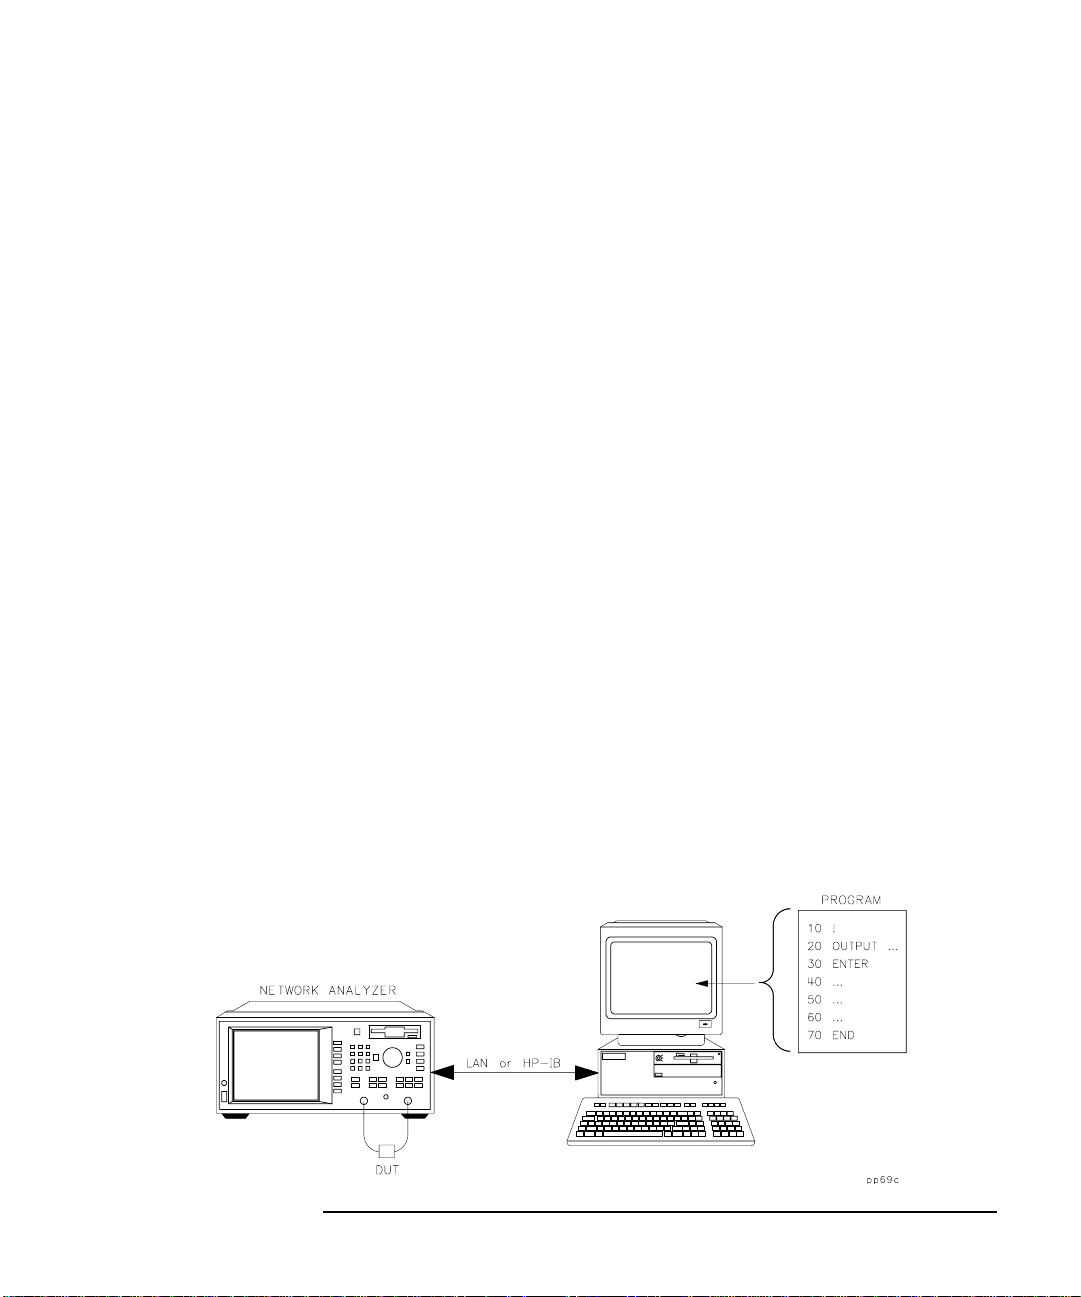
Figure 2-2 Network Analyzer Controlled by a Computer
Automating Measurements 2-5
Page 20
Configuring Your Test System
Measurement System Configurations and Considerations
External Computer in Conjunction with IBASIC
In this configuration, the measurement is controlled by an IBASIC
program running inside the analyzer. IBASIC can provide high-speed
measurement control and data collection, and save the results in
program memory or on a disk. The external computer then
communicates with IBASIC, and collects the measurement results at
some defined interval. This configuration can result in higher
throughput, especially if the measurement setup and control is complex.
Configure your system as an analyzer with IBASIC and an external
computer if you would like to
• centralize automation and application programs
• develop a more sophisticated data collection system
• add networking capability
• add local-automation capability
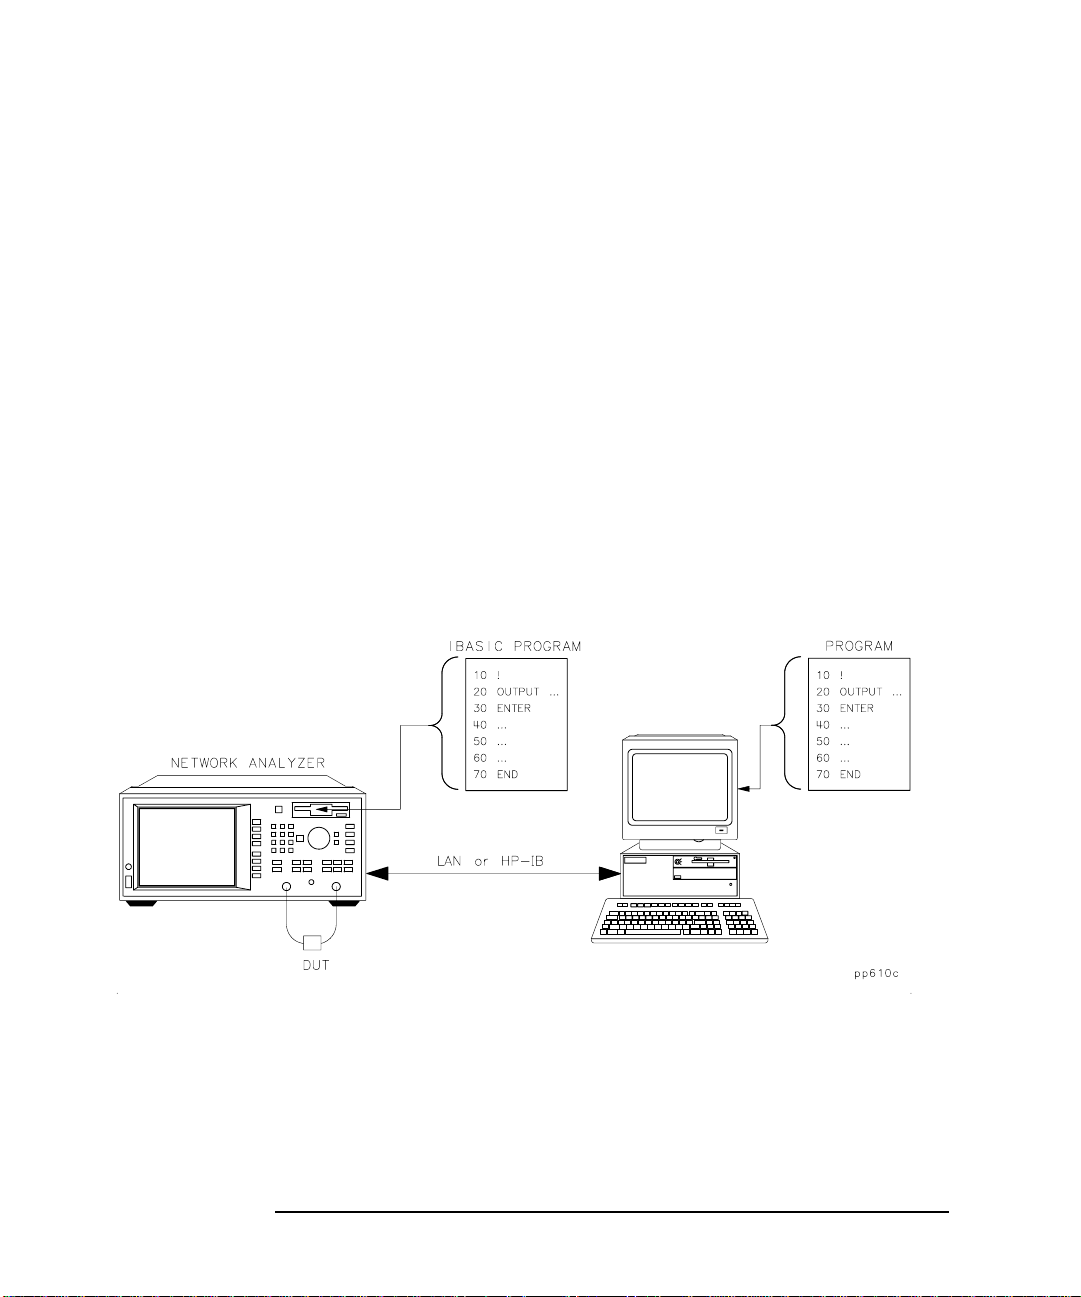
Figure 2-3 Network Analyzer Running IBASIC, Controlled by a Computer
2-6 Automating Measurements
Page 21

Configuring Your Test System
HP-IB
Expandability and Large Systems
Expandability and Large Systems
You can connect up to 10 analyzers to a single computer without
compromising maximum HP-IB bus speed. The IEEE-488 standard
states that the bus can achieve a data rate of 500 KBytes per second for
buses up to 20 meters in length, with up to 10 devices (one device per
2 meters of cable).
IEEE-488 provides for 31 unique addresses (0 through 30), however it
restricts the number of devices on the bus to 15. Due to this restriction,
you may need to add more computers as you add more analyzers. Set
each analyzer's address via the menu.
With your analyzer’s LAN feature, you can overcome the physical
limitations of HP-IB cabling and create large systems with hundreds of
analyzers. 10-BaseT LAN provides a theoretical bandwidth of close to
1 MByte/second, although in practice, throughput will be slower. See The
LAN Interface User’s Guide Supplement for more information.
SYSTEM OPTIONS
Automating Measurements 2-7
Page 22

Configuring Your Test System
Throughput Considerations
Throughput Considerations
When considering the throughput of the system configuration,
contributing factors are
• device handling time
• operator interaction time
• measurement speed
• data transfer speed
• computation speed (when applicable)
For more information, refer to Improving Throughput in Network
Analyzer Applications, HP application note number AN 1287-5
(or literature number 5966-3317E).
2-8 Automating Measurements
Page 23

Configuring Your Test System
Selecting a Measurement Controller
Selecting a Measurement Controller
There are three standard configurations that you can use to control the
analyzer:
• stand-alone operation using IBASIC
• computer-controlled HP-IB operation
• computer-controlled LAN operation
Stand-Alone Operation using IBASIC
IBASIC, in effect, puts a controller inside your analyzer and eliminates
the need for an external computer. IBASIC controls the analyzer by
sending SCPI commands to address 800 (OUTPUT 800;”Command”), or
by using high-speed built-in subprograms. Since IBASIC shares CPU
time with the analyzer, it may cause some degradation in measurement
throughput if your program performs intensive computations. However,
for most applications, it provides excellent performance and convenience.
Refer to the HP Instrument BASIC User's Handbook and HP Instrument
BASIC User’s Handbook Supplement for more information.
Computer-Controlled HP-IB Operation
An external computer can be used to control the analyzer. It can be a
personal computer (PC) or a dedicated HP BASIC controller. The
external computer sends standard SCPI commands to address
716 (default) (OUTPUT 716;”Command”) to control the analyzer . Refer to
the Programmer's Guide for more information.
You can use one computer to control several analyzers (see
“Expandability and Large Systems” earlier in this chapter). However , if a
large number of SCPI commands are required per measurement,
throughput may be degraded. Typical limits are 3 to 10 analyzers per
computer.
Automating Measurements 2-9
Page 24

Configuring Your Test System
Selecting a Measurement Controller
Computer-Controlled LAN Operation
An external computer can send SCPI commands via the LAN using a
telnet connection. Refer to The LAN Interface User’s Guide Supplement
for more information.
You can use one computer to control several analyzers. Performance will
typically be limited by the computer's speed, which in turn will limit the
number of analyzers per computer.
Using IBASIC and External Control Together
The analyzer can be controlled by commands from an external computer,
internal IBASIC, or from both at the same time, as long as certain
precautions are observed. Things to consider:
1. If both the analyzer and the computer send SCPI commands at the
same time, the analyzer may not finish the IBASIC command before
executing the computer's command, or vice-versa. The programmer
must ensure that SCPI commands executed by IBASIC do not overlap
with SCPI commands sent from an external computer, otherwise the
system may lock up. Synchronization between the analyzer and the
external computer must be ensured. See “Synchronizing IBASIC with
an External Controller” in HP Instrument BASIC User’s Handbook
Supplement for additional information.
2. Both IBASIC (SelectCode 8) and the external computer (LAN or
SelectCode 7) share the same HP-IB status model (the same analyzer
status bits go to each). Be careful sending commands which affect
status reporting, such as *CLS, STAT:PRES, *RST, etc.
2-10 Automating Measurements
Page 25

Configuring Your Test System
Selecting a Programming Language
Selecting a Programming Language
HP BASIC
HP BASIC has long been a favorite programming language for
instrument control. It features an extensive list of keywords, and
powerful OUTPUT and ENTER formatting, making it easy to perform
common tasks. This generally results in very high programming
productivity. HP BASIC runs on HP series 700 workstations and series
300 instrument controllers.
IBASIC
IBASIC is a version of BASIC that runs inside of the network analyzer.
IBASIC is a sub-set of HP's BASIC . It has roughly the same keywords as
HP BASIC 4.0. With very little effort, you can design your program so
that it will run either inside the analyzer or on a computer with no
modification.
The IBASIC program runs concurrently with normal instrument
measurement processing. Since IBASIC has direct access to the
analyzer's measurement arrays, it can read them and write to them very
quickly, eliminating the need to use SCPI commands. Using IBASIC's
keystroke recording, you can write a large portion of your instrument
control program by pressing the keys on the analyzer's front panel.
IBASIC can be used in a stand-alone instrument, or in conjunction with
an external computer.
For more information on IBASIC, refer to the HP Instrument BASIC
User's Handbook and HP Instrument BASIC User’s Handbook
Supplement that were shipped with your analyzer.
Automating Measurements 2-11
Page 26

Configuring Your Test System
Selecting a Programming Language
HP VEE
HP VEE is a powerful application which lets you graphically create
programs to control your instrument. VEE automatically handles the
programming details so you can focus on higher level tasks. It also
contains statistical functions which you can use to monitor your
production process.
VEE runs on PCs as well as HP-UX and Sun Workstations.
VEE can be used in conjunction with a VEE instrument driver. The VEE
instrument driver presents a picture of the instrument's front panel on
the computer display. Using the mouse, you can click on the front panel
keys to control the instrument, similar to IBASIC keystroke recording.
For information on VEE, including literature and preview disks, please
call the nearest HP instrument support center, or sales or service office.
Refer to the front of this book for a table of sales and service offices.
Microsoft® QuickBasic™
QuickBasic has been a popular programming language since it runs on
PCs. It does not offer a rich keyword set as does HP BASIC, and is not
optimized for instrument control. To control the analyzer via HP-IB, an
HP-IB card and driver library must be installed in the computer. The
driver library will provide subroutines such as IOOUTPUT and IOENTER
which let you control your analyzer.
C and C++
If you are using C or C++, you will need a driver library to use your
HP-IB card. HP offers a library called Standard Instrument Control
Library (SICL). SICL is available for PCs running Microsoft Windows®
and using HP's HP-IB card. SICL is also available on HP series 700
UNIX workstations.
For LAN communication with your analyzer, C or C++ is often used.
Multi-threaded programs can be created to allow easy and precise
control of many analyzers operating asynchronously. This approach
maximizes speed and throughput.
2-12 Automating Measurements
Page 27

Configuring Your Test System
Selecting a Programming Language
VXI plug&play Driver
Your analyzer is VXI plug&play compliant. VXI plug&play drivers
provide a high level control interface for the analyzer, thereby reducing
the level of instrument-specific knowledge required to program the
analyzer. The driver for the HP 8712ET/ES and HP 8714 ET/ES
functions in Win95, Win98, and WinNT (3.51 or higher) and was
designed for the following programming platforms:
• Microsoft Visual C++ version 4.0 or higher
• Microsoft Visual BASIC version 5.0 or higher
• Borland C++ version 4.5 or higher
• HP VEE version 3.2 or higher
• National Instruments Lab Window/CVI version 4.0.1 or higher
• National Instrument LabVIEW version 5.00 or higher
The free VXI plug&play driver for your analyzer should be available
soon on the Web at:
http://www.tmo.hp.com/tmo/software/English/comptest_VXI_drivers.html
OR
http://www.hp.com/go/ena
Example Programs
The Programmer's Guide contains detailed information on controlling
the analyzer via HP-IB. The Example Programs Guide includes several
example programs written in HP BASIC and in IBASIC.
The HP Instrument BASIC User's Handbook and HP Instrument BASIC
User’s Handbook Supplement contain detailed information on how to
control the analyzer using IBASIC.
The LAN Interface User’s Guide Supplement contains detailed
information on controlling the analyzer via LAN, including example
programs.
Automating Measurements 2-13
Page 28

Configuring Your Test System
Selecting a Programming Language
2-14 Automating Measurements
Page 29

3 Operator Interaction
3-1
Page 30

Operator Interaction
Many tests are performed by technicians, operators, or testers who
interact with the measurement system. When designing the automation
system, it is important that the system allow operators to perform the
measurement tasks quickly and consistently. The system must also be
easy to learn and easy to use, providing the user with instructions and
feedback.
The analyzer provides many features to satisfy these requirements. The
features include
• user-defined pop-up messages to prompt the operator
• on-screen graphics to create custom diagrams
• user-defined measurement channel and frequency annotation
• ability to define the key menu with frequently-used custom
softkeys
• IBASIC display window; configurable as full or split
• IBASIC DISP line and INPUT line
• data entry using a barcode reader
• data entry using an external keyboard
• hot keys on external keyboard for common functions
• operator control of measurements using a foot or hand switch
• beeper with adjustable volume and pitch
• limit test pass/fail TTL output
• user-defined TTL input/output
• output for external VGA-compatible color monitor
The following sections explain how to use these features, and show
several examples.
BEGIN
3-2 Automating Measurements
Page 31

Figure 3-1 shows an example test system setup which utilizes the
extensive connectivity capabilities of the analyzer. All of the interface
ports shown are standard equipment on your analyzer.
Figure 3-1 Example Test System Setup
Operator Interaction
Automating Measurements 3-3
Page 32

Operator Interaction
Prompting the Operator
Prompting the Operator
You can display a customized message in the center of the analyzer's
display by using the following SCPI command:
DISPlay:ANNotation:MESSage
For example,
OUTPUT @Rfna;"DISP:ANN:MESS 'Connect device, then press button'"
You can specify how long you want the message to remain on the screen
by using one of the following timeout words: SHORt, MEDium, LONG,
NONE. For example,
OUTPUT @Rfna;"DISP:ANN:MESS 'Test passed.'",MEDIUM
To clear the message immediately, use the following command:
DISPlay:ANNotation:MESSage:CLEar
The message string can contain a maximum of 25 lines with up to
47 characters per line. However , it cannot be more than 254 characters in
length, including carriage returns and line feeds.
If you are using IBASIC, you can use the B ASIC keywordDISP to display
a small one-line message near the bottom of the screen. For example,
DISP "Connect device to REFLECTION port"
3-4 Automating Measurements
Page 33

Operator Interaction
Using Graphics to Create On-Screen Diagrams
Using Graphics to Create On-Screen
Diagrams
Diagrams showing how to connect devices or perform measurements can
be a powerful tool. You can draw customized diagrams on the analyzer's
display using the following SCPI commands:
DISPlay:WINDow[1|2|10]:GRAPhics:
These commands let you draw lines, rectangles, circ les , and text onto the
screen. The number specified in the WINDow part of the command selects
where the graphics are to be drawn:
WINDow1 draws the graphics to the measurement channel 1
window.
WINDow2 draws the graphics to the measurement channel 2
window.
WINDow10 draws the graphics to the IBASIC display window.
Using split display, you can display the measurement in one half of the
screen while displaying a connection diagram in the other half.
command
For more details on SCPI graphics commands, refer to “Using Graphics”
in the Programmer's Guide.
If you are using IBASIC, you can use the B ASIC graphics keywords such
as MOVE and DRAW to draw diagrams in the IBASIC window.
MOVE X1,Y1
DRAW X2,Y2
Since IBASIC keywords always draw to the IBASIC window, you cannot
use them to draw in the same window as your measurement. To draw in
the measurement window, your IBASIC program must use the standard
SCPI commands.
DISP:WIND1:GRAPHICS:
and
DISP:WIND2:GRAPHICS:
For more details on IBASIC graphics, refer to “Graphics and Display
Techniques” in the HP Instrument BASIC User’s Handbook Supplement.
Automating Measurements 3-5
command
command
Page 34

Operator Interaction
User BEGIN
User BEGIN
User BEGIN
User-Defined BEGIN Key Menu
User-Defined BEGIN Key Menu
The feature adds the following capabilities:
• Create softkeys to allow one-key-press operation of functions that
usually take several key presses.
• Reassign softkeys to implement your most-used functions/features.
• Create softkeys to implement new features created with IBASIC—for
example, a gain-compression measurement.
• Create softkeys to implement application support.
This feature is designed to provide the fastest possible sweep speeds
while taking advantage of the flexibility provided by IBASIC. This is the
simplest way for recalling instrument states or configuring most-used
softkey functions under a single softkey menu. The eighth softkey in the
BEGIN
softkey to enable/disable or . You cannot
redefine the eighth softkey.
menu provides access to the menus below. Toggle the eighth
BEGIN
BEGIN
Amplifier
Filter
Broadband Passive
Mixer
Cable (Option 100 only)
User BEGIN on OFF −−−−>
Once you have selected a menu, the same menu will be displayed for
subsequent key presses of the hardkey.
3-6 Automating Measurements
BEGIN
User label 1
User label 2
User label 3
User label 4
User label 5
User label 6
User label 7
User BEGIN ON off
Page 35

Operator Interaction
System Config
User TTL Config
Softkey Auto-Step
User BEGIN
User BEGIN
User-Defined BEGIN Key Menu
By selecting
SYSTEM OPTIONS
, you can automatically step
through the user-defined menu keys by use of a switch
BEGIN
connected to the USER TTL IN/OUT rear panel connector. See “Using a
Switch with User BEGIN” on page 3-11 for more information.
Selecting the softkey will run a macro function defined
by a sequence of IBASIC commands defined within an IBASIC program.
IBASIC programs to be used for must have the following
structure:
10 !The following label must be present. DO NOT REMOVE
20 User_begin: !
30 ...
40 ! Define softkey labels
50 OUTPUT @871X;"DISP:MENU2:KEY1 'Test Setup 1';*WAI"
60 OUTPUT @871X;"DISP:MENU2:KEY2 'Test Setup 2';*WAI"
70 OUTPUT @871X;"DISP:MENU2:KEY3 'Save Results';*WAI"
80 OUTPUT @871X;"DISP:MENU2:KEY4 'Print Results 4';*WAI"
100 User_pause: PAUSE
110 GOTO User_pause
120 !The following key labels must be present. DO NOT REMOVE
140 User_key1: !Insert code for softkey 1 here
150 GOTO User_pause
160 User_key2: !Insert code for softkey 2 here
170 GOTO User_pause
200 User_key7: !Insert code for softkey 7 here
210 GOTO User_pause
...
Automating Measurements 3-7
Page 36

Operator Interaction
User BEGIN
User BEGIN
Mkr --> Max
User-Defined BEGIN Key Menu
The labels required are:
User_begin
User_pause
User_key1
User_key2
User_key3
User_key4
User_key5
User_key6
User_key7
NOTE Y our program must contain all of these labels, even if you
are not using all of the softkeys.
A default program is created automatically when there
is no IBASIC program installed. In the default program, the third
softkey is defined to be the function, the fourth softkey
prompts the user for a title, and also enables the clock. The default
program is listed next. You may edit this program to change the
functions you need. Once you have edited the program, be sure to save
the program to memory for later recall.
1 ! The following line is required. DO NOT REMOVE!
2 User_begin: ASSIGN @Hp8714 TO 800 ![User Begin] Program
3!
4 ! To Modify:
5 ! Use [IBASIC][EDIT] or [IBASIC][Key Record]
6!
7!
8 ! Declare storage for variables.
9 DIM Name$[60],Str1$[60],Str2$[60],Str3$[60]
10 !
11 ! Clear the softkey labels
12 OUTPUT @Hp8714;"DISP:MENU2:KEY8 '';*WAI"
13 !
14 ! Re-define softkey labels here.
15 OUTPUT @Hp8714;"DISP:MENU2:KEY1 '*';*WAI"
16 OUTPUT @Hp8714;"DISP:MENU2:KEY2 '*';*WAI"
17 OUTPUT @Hp8714;"DISP:MENU2:KEY3 'Mkr -> Max';*WAI"
18 OUTPUT @Hp8714;"DISP:MENU2:KEY4 'Title and Clock';*WAI"
19 OUTPUT @Hp8714;"DISP:MENU2:KEY5 '*';*WAI"
20 OUTPUT @Hp8714;"DISP:MENU2:KEY6 '*';*WAI"
21 OUTPUT @Hp8714;"DISP:MENU2:KEY7 '*';*WAI"
22 !
23 !The following 2 lines are required. DO NOT REMOVE!
3-8 Automating Measurements
Page 37

Operator Interaction
User BEGIN
User-Defined BEGIN Key Menu
24 User_pause: PAUSE
25 GOTO User_pause
26 !
27 User_key1: ! Define softkey 1 here.
28 GOSUB Message ! Remove this line.
29 GOTO User_pause
30 !
31 User_key2: ! Define softkey 2 here.
32 GOSUB Message ! Remove this line
33 GOTO User_pause
34 !
35 User_key3: ! Example Marker Function
36 OUTPUT @Hp8714;"CALC1:MARK1 ON"
37 OUTPUT @Hp8714;"CALC1:MARK:FUNC MAX"
38 GOTO User_pause
39 !
40 User_key4: ! Example Title Entry
41 INPUT "Enter Title Line 1. Press [Enter] when done.",Name$
42 OUTPUT @Hp8714;"DISP:ANN:TITL1:DATA '""'"
43 OUTPUT @Hp8714;"DISP:ANN:TITL ON"
44 GOTO User_pause
45 !
46 User_key5: ! Define softkey 5 here.
47 GOSUB Message ! Remove this line.
48 GOTO User_pause
49 !
50 User_key6: ! Define softkey 6 here.
51 GOSUB Message ! Remove this line.
52 GOTO User_pause
53 !
54 User_key7: ! Define softkey 7 here.
55 GOSUB Message ! Remove this line.
56 GOTO User_pause
57 !
58 Message: !
59 Str1$="This key is programmable."
60 Str2$="To modify, select"
61 Str3$="[System Options], [IBASIC], [Edit]."
62 OUTPUT @Hp8714;"DISP:ANN:MESS '""', MEDIUM"
63 RETURN
64 !
65 END
NOTE For more programs, see the Example Programs Disk and
the Example Programs Guide.
Automating Measurements 3-9
Page 38

Operator Interaction
User BEGIN
Autost
User BEGIN
User BEGIN
User BEGIN
IBASIC
Edit
Prior Menu
Key Record ON
IBASIC
Key Record OFF
User-Defined BEGIN Key Menu
Loading a User BEGIN Program
A program can be automatically loaded at power up if
the program is named “AUTOST”. An “AUTOST” program is loaded at
power up from the internal non-volatile memory or from a 3.5 inch floppy
disk inserted into the analyzer's disk drive. (To manually load and run
an “AUTOST” file, press .) A program
does not have to be an “AUTOST” program; it can also be loaded as any
other IBASIC program. (See the HP Instrument BASIC User’s Handbook
Supplement for more information.)
When the key is pressed, the program will remain idle
until it is needed. The program remains idle until a softkey is pressed
and code related to that softkey is executed. After the code is executed,
the program returns to idle. Use of does not restrict
access to any normally available front panel feature, nor does this key
affect sweep update rates.
BEGIN
Modifying a User BEGIN Program
You can modify the User BEGIN program with the built-in editor, an
ASCII file editor on a computer, or with keystroke recording. For
example, to modify the default program to recall a setup:
1. Select . Move the edit cursor
to line:
15 OUTPUT @Hp8712;"DISP:MENU2:KEY1 '*';*WAI"
2. Use an external keyboard to replace ‘*’ with ‘Setup 1’.
3. Move the edit cursor to line 28. Delete the line.
4. Use keystroke recording to create a setup function if you like, or you
can now insert code you have written.
To use keystroke recording to modify the program:
5. Exit the editor by selecting .
6. Enable keystroke recording with .
7. Now perform the keystrokes required for Setup 1.
8. When the setup is completed, select
3-10 Automating Measurements
SYSTEM OPTIONS
SYSTEM OPTIONS
.
Page 39

Operator Interaction
User BEGIN ON
User-Defined BEGIN Key Menu
9. To verify your change, select
.
10.Select the first softkey which should be labeled “Setup 1”. This should
return you to your correct setup.
11.You may save this program as an AUTOST file or other file for later
recall.
Refer to the HP Instrument BASIC User’s Handbook Supplement.
PRESET BEGIN
Using a Switch with User BEGIN
When user-defined is used in conjunction with a switch
connected to the USER TTL IN/OUT rear-panel connector, you can cycle
through up to seven softkeys in sequence by activating the switch.
1. Connect a switch to the USER TTL IN/OUT rear panel connector as
shown in Figure 3-2.
Figure 3-2 Connecting a Switch to the USER TTL IN/OUT Connector
BEGIN
Automating Measurements 3-11
Page 40

Operator Interaction
System Config
User TTL Config
Softkey Auto-Step
User-Defined BEGIN Key Menu
2. Make sure the analyzer is configured to use the USER TTL IN/OUT
connector for softkey sequencing: press
3. Press the switch several times while observing the analyzer.
4. Notice that with each press of the switch, the softkey labels are
highlighted (boxed) in succession, and that after the last available
key has been used, the sequence starts again at the top of the softkey
menu.
SYSTEM OPTIONS
.
3-12 Automating Measurements
Page 41

Operator Interaction
Using a Barcode Reader for Data Entry
Using a Barcode Reader for Data Entry
Devices under test (DUTs) are often labeled with a serial number and
part number. If the DUT is labeled with this information in barcode
format, a barcode reader can be used to enter the DUT information into
the analyzer or into the computer controlling the analyzer. Doing so
provides a simple and safe link between the DUT and the measurement
data. Information such as the operator's name or test station number can
also be entered, to allow correlation of the devices tested with the test
station.
Connect a barcode reader, such as the HP KeyWand HBKW-1220, to the
analyzer's DIN KEYBOARD connector (on the rear panel). Once
connected, the barcode reader will send scanned barcode characters to
the analyzer just as if they were typed on a keyboard. The barcode
characters will be followed by a carriage return. The barcode wand and
the external keyboard can be connected simultaneously.
See “Using the Analyzer's Title Feature” on page 3-15 for more
information on using the title feature with a barcode reader.
In addition to Hewlett-Packard's barcode wand, other vendors offer
products such as cordless barcode readers, laser scanner readers,
barcode label printers, barcode fonts for Windows®, and barcode labeling
software. For more information about Hewlett-Packard barcode
products—including listings for distributors worldwide—please visit our
Web page at http://www.hp.com/HP-COMP/barcode.
Automating Measurements 3-13
Page 42

Operator Interaction
Using an External Keyboard for Data Entry
Using an External Keyboard for Data
Entry
An IBM PC-AT compatible keyboard can be connected to your analyzer's
DIN KEYBOARD connector and used to quickly and conveniently enter
file names for instrument state save/recall, or text for title lines.
NOTE If your keyboard has a standard (large) DIN connector, you will need to
use a DIN to mini-DIN adapter to connect the keyboard to the analyzer.
These adapters are available as HP part number 1252-4141. Contact the
nearest HP sales or service office for more information.
See “Using the Analyzer's Title Feature” on page 3-15 for more
information.
3-14 Automating Measurements
Page 43

Operator Interaction
More Display
Title and Clock
Title Line 1
Using the Analyzer's Title Feature
Using the Analyzer's Title Feature
The analyzer has two 30-character title lines which can be entered using
the barcode reader. From the front panel, press
keyboard, press F9. Then use the barcode reader to scan in the
information from the DUT or use a keyboard to type in the information.
Once stored in the title line, the information will be included on hardcopy
dumps. The title lines can also be set or queried using the following SCPI
command:
DISPlay:ANNotation:TITLe[1|2]:DATA
For example:
OUTPUT @Rfna;"DISP:ANN:TITL1:DATA 'BPF-177, SN US95170001'"
and
OUTPUT @Rfna;"DISPlay:ANNotation:TITLe1:DATA?"
ENTER @Rfna;Title1$
Use the command
"DISPlay:ANNotation:TITLe[1|2] ON|OFF"
to display or hide the title. If you are using IBASIC, you can use the
INPUT statement to read in barcode or keyboard characters. For
example:
30 INPUT "Scan in the Barcode now",Dut$
40 OUTPUT 800;"DISP:ANN:TITL1:DATA '";Dut$;"'"
50 OUTPUT 800;"DISP:ANN:TITL1 ON"
60 END
DISPLAY
, or on an external
Automating Measurements 3-15
Page 44

Operator Interaction
Hot Keys on External Keyboard for Common Functions
Hot Keys on External Keyboard for
Common Functions
You can use a keyboard's keys instead of the analyzer's keys to control
the analyzer. provides the same information that can be found on a
template that is supplied with each analyzer (HP part number
08712-80028). Function keys F9, F10, and F11 are “hot keys” which
perform common operations such as entering measurement titles and
saving measurement results to disk.
3-16 Automating Measurements
Page 45

Hot Keys on External Keyboard for Common Functions
Table 3-1 Keyboard Template Definition
Operator Interaction
Keyboard
Key Name
F1 Softkey 1 Shift-F1
F2 Softkey 2 Shift-F2
F3 Softkey 3 Shift-F3
F4 Softkey 4 Shift-F4
F5 Softkey 5 Shift-F5
F6 Softkey 6 Shift-F6
F7 Softkey 7 Shift-F7
F8 Softkey 8 Shift-F8
F9 Title Keys Line 1 or RCL
F10
F11
F12
Analyzer Function
1
Title Keys Line 2 or Edit
Title Keys Clock or Window
Re-save File or Run
1
1
1
Keyboard
Key Name
Shift-F9
Shift-F10
Shift-F11
Shift-F12
Analyzer Function
MEAS 1
MEAS 2
FREQ
POWER
SWEEP
MENU
SCALE
MARKER
DISPLAY
FORMAT
CAL
AVG
Esc IBASIC Command Line On/Off Ctrl-F2
Print Screen Help Ctrl-F3
Ctrl-Print Screen Hardcopy Keyboard Template Ctrl-F4
Shift-Print Screen Hard Copy Graph and Softkeys Ctrl-F5
Ctrl-F1
1. When the IBASIC command line is enabled
SAVE RECALL
Automating Measurements 3-17
HARDCOPY
SYSTEM OPTIONS
PRESET
BEGIN
Page 46

Operator Interaction
System Config
User TTL Config
Default
User-Defined TTL Input/Output
User-Defined TTL Input/Output
The USER TTL port can be used as a general-purpose input or output.
Like the LIMIT TEST IN/OUT line, the USER TTL IN/OUT line is an
open-collector drive. When used as an input, the state of the USER TTL
IN/OUT line can be read with either the SCPI command
"DIAG:PORT:READ? 15,1"
or with the IBASIC command
I = READIO(15,1)
When used as an output, the state of the USER TTL IN/OUT line can be
set with either the SCPI command
"DIAG:PORT:WRITE 15,1,value"
or with the IBASIC command
WRITEIO 15,1;value
The USER TTL IN/OUT port can also be used in conjunction with an
external switch for softkey auto-stepping, or as a “sweep out” port. Be
sure that USER TTL IN/OUT port is configured properly for
general-purpose I/O by pressing
SYST:COMM:TTL:USER:FEED DEFAULT
SYSTEM OPTIONS
. Or use the following SCPI command:
CAUTION Be sure to observe static precautions when using this port.
3-18 Automating Measurements
Page 47

Operator Interaction
Using a Foot or Hand Switch
Using a Foot or Hand Switch
You can connect a foot switch, button box, or custom keyboard which has
a few function keys that are custom-labeled, and use this in conjunction
with IBASIC to allow consistent, error-free step-by-step measurement
control. The operator presses one key, then the next, in order.
NOTE A switch can also be used with the analyzer’s fast-recall feature. See
“Using Fast Recall with a Switch” on page 4-5.
The foot-switch simply connects two wires together, grounding the center
pin of the analyzer's USER TTL IN/OUT rear panel connector. (See
Figure 3-2.) The status of the USER TTL IN/OUT can be read using the
SCPI commands:
30 OUTPUT 716;"DIAG:PORT:READ? 15,1"
40 ENTER 716;X
or the IBASIC command:
30 X=READIO(15,1)
When the foot-switch is open, the variable “X” will be set to 1. When it is
closed, the variable “X” will be set to 0. Switch debounce is generally not
a problem, due to the relatively slow polling rate of the program.
Refer to “Analyzer Port Numbers” on page 3-22 for tables describing the
various analyzer ports that you can access using SCPI or IBASIC
commands.
Following is an example program which shows how to displa y a message
and read the foot switch to control your measurements. This program is
named “TTL_IO” on your Example Programs Disk.
For an example which uses the IBASIC READIO command, refer to the
program “USER_BIT” on your Example Programs Disk.
100 ! Filename: TTL_IO
110 !
120 ! This program reads the USER TTL IO
130 ! port, and counts how many times a
140 ! switch connected to the port is pressed.
150 !
160 DIM Msg$[200]
170 INTEGER X
180 !
190 IF POS(SYSTEM$("SYSTEM ID"),"HP 871") THEN
200 ASSIGN @Hp8711 TO 800
Automating Measurements 3-19
Page 48

Operator Interaction
Using a Foot or Hand Switch
210 ELSE
220 ASSIGN @Hp8711 TO 716
230 ABORT 7
240 CLEAR 716
250 END IF
260 !
270 Pass_count=0
280 Start: !
290 LOOP
300 ! Display message
310 Msg$="'DUTs passed: "&VAL$(Pass_count)&CHR$(10)
320 Msg$=Msg$&"Press button to measure next DUT.'"
330 OUTPUT @Hp8711;"DISP:ANN:MESS ";Msg$
340 !
350 ! Wait for button to be pressed
360 REPEAT
370 OUTPUT @Hp8711;"DIAG:PORT:READ? 15,1"
380 ENTER @Hp8711;X
390 UNTILX=0
400 DISP "Button is now pressed."
410 OUTPUT @Hp8711;"DISP:ANN:MESS:CLEAR"
420 !
430 ! Wait for button to be released
440 REPEAT
450 OUTPUT @Hp8711;"DIAG:PORT:READ? 15,1"
460 ENTER @Hp8711;X
470 UNTILX=1
480 DISP "Button is now released."
490 !
500 OUTPUT @Hp8711;"DISP:ANN:MESS 'Measuring...'"
510 ! Add code here to take sweep
520 ! and measure DUT.
530 WAIT 1
540 Pass_count=Pass_count+1
550 END LOOP
560 END
3-20 Automating Measurements
Page 49

Operator Interaction
Limit-Test Pass/Fail TTL Input/Output
Limit-Test Pass/Fail TTL Input/Output
When limit testing is turned on, the LIMIT TEST IN/OUT rear-panel
BNC connector indicates the status of the limit test. If the limit test
passes, this TTL output goes high. If the limit test fails, this TTL output
goes low. This signal can be used, for example, as an input to a materials
handler.
CAUTION Since the TTL output has limited current drive capability, it should be
buffered when controlling high current devices such as mechanical
relays. Otherwise, damage to the instrument may result.
The limit-test TTL can also be used as a general-purpose input, since the
analyzer drive to this line is open collector. When used as an input, limit
testing should be turned off so the instrument will allow the limit test
line to float high. The line can then be connected to an external switch
which should only pull the signal to ground or let it float (an external
circuit should not drive this line). A push button or foot switch can be
attached to the line to pull the signal to ground.
The state of the signal can be monitored by the automated system to
determine when the operator is ready for some action. The state of the
limit TTL line can be read with either the SCPI commands
20 INTEGER X
30 OUTPUT 716;"DIAG:PORT:READ? 15,2"
40 ENTER 716;X
or using the IBASIC command
30 X=READIO(15,2)
Finally, the LIMIT TEST TTL IN/OUT line can be used as a
general-purpose output line. With limit testing turned off, the state of
the line can be set to logic high or low with either the SCPI command
"DIAG:PORT:WRITE "
or with the IBASIC command
"WRITEIO ,value".
The following is an example of reading the LIMIT TEST TTL IN/OUT
line when used as an input:
30 Limit = READIO(15,2)
40 ! The "Limit" variable will be set to 0 if the signal is low
50 ! and 1 if the signal is high.
Automating Measurements 3-21
Page 50

Operator Interaction
Analyzer Port Numbers
Analyzer Port Numbers
Table 3-2 Writeable Ports
Port
Number
15 0 Outputs 8-bit data to the Cent_D0 thru D7 lines of the Centronics port.
15 1 Sets/clears the user bit according to the least significant bit of A. A least
15 2 Sets/clears the limit pass/fail bit according to the least significant bit of A.
15 3 Outputs 8-bit data to the Cent_D0 thru D7 lines of the Centronics port.
9 0 Outputs a byte to the serial port. The byte is output serially according to
Register Description
Cent_D0 is the least significant bit, Cent_D7 is the most significant bit.
Checks Centronics status lines for:
Out of Paper
Printer Not on Line
BUSY
ACKNOWLEDGE
significant bit equal to 1 sets the user bit high. A least significant bit of 0
clears the user bit.
A least significant bit equal to 1 sets the pass/fail bit high. A least
significant bit of 0 clears the pass/fail bit.
Cent_D0 is the least significant bit, Cent_D7 is the most significant bit.
Sets the Printer_select signal high (de-select). Does not check Centronics
status lines.
the configuration for the serial port.
NOTE When using the WRITEIO(15,0) or WRITEIO(15,3) command, the
Printer_Select Line is set high. However, when the instrument is doing
hardcopy, the Printer_Select Line is set low. The Printer_Select line may
or may not be used by individual printers. Check with your printer
manual.
3-22 Automating Measurements
Page 51

Table 3-3 Readable Ports
Operator Interaction
Analyzer Port Numbers
Port
Number
9 0 Reads the serial port.
15 0 Reads the 8-bit data port Cent_D0 thru D7.
15 1 Reads the user bit.
15 2 Reads the limit test pass/fail bit.
15 10 Reads the 8-bit status port.
Register Description
D0 — Cent_acknowledge
D1 — Cent_busy
D2 — Cent_out_of_paper
D3 — Cent_on_line
D4 — Cent_printer_err
Automating Measurements 3-23
Page 52

Operator Interaction
Output for External VGA-Compatible Monitor
Output for External VGA-Compatible
Monitor
You can connect a VGA-compatible external monitor to the VIDEO OUT
COLOR VGA connector for a large-screen color view of your
measurement if you wish. See “Using an External VGA Monitor” in
Chapter 4 of your analyzer’s User’s Guide for information on using an
external monitor with your system.
3-24 Automating Measurements
Page 53

4 Measurement Setup and
Control with Fast Recall
4-1
Page 54

Measurement Setup and Control with Fast Recall
The production and testing of RF components often involves several
steps, with each step requiring a unique set of instrument settings.
Likewise, the different test configurations at each step may require
associated calibrations. Manually entering these sets of parameters (or
“states”) or calibrating at each step in the manufacturing process is slow,
prone to operator error, and costly. The fast-recall feature allows you to
recall one of seven instrument states with just a single key press, or to
cycle through up to seven different instrument states with a switch.
4-2 Automating Measurements
Page 55

Measurement Setup and Control with Fast Recall
Fast Recall on OFF
Select Disk
Non-Vol RAM Disk
Prior Menu
Fast Recall on OFF
Rename File
Using Fast Recall with the Front Panel or a Keyboard
Using Fast Recall with the Front Panel
or a Keyboard
NOTE The following explanation assumes that you are familiar with the
information presented in “Saving and Recalling Measurement Results”
in Chapter 4 of your analyzer’s User’s Guide.
1. Press .
2. If the measurement display area changes to a listing of files on the
currently selected disk, fast recall is off.
If the measurement display area remains unchanged, fast recall is on.
To follow along with this explanation, turn fast recall off by pressing
3. If necessary, select the internal non-volatile RAM disk by pressing
4. If you have previously saved any files to this disk, they will now be
listed on the display.
5. The fast recall feature utilizes only the first seven files listed that
contain instrument state, calibration, or measurement data.
6. If you have not previously saved any files to this disk, you may want
to save a few instrument states now, to follow along.
7. Press so that “ON” is
capitalized. Note that the measurement display now reappears on the
screen and that there are file names next to the first seven softkeys.
(If any of the softkeys are blank, it's because you had less than seven
files saved on the disk.)
The files are placed on the softkeys in the order in which they appear
in the disk's directory table.
SAVE RECALL
so that “OFF” is capitalized.
.
NOTE You may want to use the feature to give your files more
meaningful names. See “Other File Utilities” in Chapter 4 of your
analyzer’s User’s Guide for information on renaming files.
8. To “fast recall” an instrument state, press the softkey next to the file
name that contains the instrument state.
Automating Measurements 4-3
Page 56

Measurement Setup and Control with Fast Recall
Using Fast Recall with the Front Panel or a Keyboard
9. The fast-recall mode will remain on (even when the analyzer is
PRESET
10.With the fast-recall feature turned on, you will always be only one or
two key presses away from recalling an instrument state.
11.With an external keyboard connected to the rear panel DIN
connector, keys F1 through F7 are equivalent to pressing softkeys 1
through 7 on the analyzer. See “Using a Keyboard” in Chapter 4 of
your analyzer’s User’s Guide for information on connecting and using
an external keyboard.
NOTE For test systems that include a multiport test set:
See the example program titled “MPSVRCL.” This IBASIC/RMB
program requires an HP 8712ET/ES or HP 8714ET/ES analyzer
connected to a multiport test set. The program saves three instrument
states, each measuring various ports in ALT sweep mode. Fast recall is
enabled so that subsequent recalls require a single keypress.
Example programs can be found in the following four locations:
• Web site http://www.hp.com or http://www.agilent.com. Use the
search function to find Web pages related to 8712 example programs.
• Example Programs Disk, HP 8712ET/ES and HP 8714ET/ES (DOS
format): HP part number 08714-10003
• Example Programs Disk, HP 8712ET/ES and HP 8714ET/ES (LIF
format): HP part number 08714-10004
• Example Programs Guide, HP 8712ET/ES and HP 8714ET/ES: HP
part number 08714-90016
) until manually turned off.
4-4 Automating Measurements
Page 57

Measurement Setup and Control with Fast Recall
System Config
User TTL Config
Softkey Auto Step
Fast Recall
Using Fast Recall with a Switch
Using Fast Recall with a Switch
When fast recall is used in conjunction with a switch connected to the
USER TTL IN/OUT rear panel connector, you can cycle through up to
seven instrument states in sequence by activating the switch.
1. Connect a switch to the USER TTL IN/OUT rear panel connector as
shown in Figure 4-1.
Figure 4-1 Connect a Switch to the USER TTL IN/OUT Connector
2. Make sure the analyzer is configured to use the USER TTL IN/OUT
connector for softkey sequencing: press
3. With toggled to ON, press the switch several times
while observing the analyzer.
4. Notice that with each press of the switch, the files are highlighted
(boxed) in succession, and that after the last available file has been
used, the sequence starts again at the top of the softkey menu.
Automating Measurements 4-5
SYSTEM OPTIONS
.
Page 58

Measurement Setup and Control with Fast Recall
Using Fast Recall with a Switch
4-6 Automating Measurements
Page 59

5 Automated Measurement Setup
and Control
5-1
Page 60

Automated Measurement Setup and Control
The production of RF components often involves several steps, with each
step requiring a unique set of instrument settings. Likewise, the
different test configurations at each step may require associated
calibrations. Requiring the operator to manually enter these sets of
parameters (or “states”) or to calibrate at each step in the manufacturing
process is slow, prone to operator error, and costly.
An automated measurement system can be used to achieve fast and
consistent transitions between measurement setups. In an automated
system, the instrument parameters are set under program control. The
control program can be an IBASIC program running inside the analyzer,
or a program in another language running on an external computer. The
control program sends SCPI and IEEE-488 commands to the analyzer's
HP-IB or LAN interface. The HP-IB commands rapidly change the
instrument settings or calibration.
Figure 5-1 Measurement Control
5-2 Automating Measurements
Page 61

Automated Measurement Setup and Control
The HP-IB or LAN interfaces can also be used to trigger sweeps, read
measurement values, or signal events within the analyzer. Most
operations that can be done from the front panel can also be done over
the HP-IB or LAN interface. See the Programmer's Guide and the LAN
Interface User’s Guide Supplement for details.
This chapter describes methods for changing instrument settings rapidly
under program control. It then briefly discusses how to synchronize the
modification of instrument settings with the collection of data and how to
use service requests (SRQs) to signal instrument states. Finally, it
describes how to utilize both measurement channels and a feature to
automatically start an IBASIC control program.
For information on techniques that can improve your sweep speed, refer
to “Optimizing Measurements” in your analyzer’s User’s Guide.
Automating Measurements 5-3
Page 62

Automated Measurement Setup and Control
Setting the Instrument State
Setting the Instrument State
A DUT will often undergo several different tests while at a single test
station. The analyzer's parameters (such as sweep frequencies, output
power, markers, and limits) must be set to the desired values before each
test is performed. In an automated test system, the controlling computer
modifies the instrument settings for the operator. The analyzer offers
several techniques for quickly changing the instrument's measurement
parameters:
• Recall of instrument states from disk
• The learn string HP-IB command (*LRN)
• SCPI commands that change specific parameters
Recalling Instrument States from Disk
The analyzer has two internal memory (RAM) disks: “Non-Vol RAM
Disk” and “Volatile RAM Disk.” A “RAM Disk” is a block of memory
inside the analyzer which you can access in the same way that you access
files on a floppy disk. In addition, the analyzer has a built-in 3.5 inch
floppy-disk drive accessible on the front panel.
The “Non-Vol RAM Disk” is non-volatile, meaning that its contents are
preserved while the analyzer is turned off. The contents of the “Volatile
RAM Disk” are erased when the analyzer is turned off. The volatile RAM
disk can be configured to be much larger than the non-volatile RAM disk,
allowing it to hold many more instrument states.
The instrument settings and calibrations associated with several tests
can be saved to instrument state files on any of the analyzer’s three disks
described above. The instrument states can later be recalled during a
test sequence. The advantage of using RAM disks rather than the
3.5 inch floppy disk is that recalling a state from RAM disks takes
several seconds less than recalling a state from the floppy disk.
5-4 Automating Measurements
Page 63

Automated Measurement Setup and Control
Setting the Instrument State
For example, suppose the instrument settings are entered for the third
test of a sequence of tests. The instrument settings can be saved in a file
with the name “TEST3.STA” on the non-volatile RAM disk. When the
third test must be performed, the control program can recall the
instrument state from the non-volatile RAM disk with the following
SCPI command:
MMEM:LOAD:STATe 1,'MEM:TEST3.STA'
Recalling a state from RAM disk typically takes about 4 seconds, but the
time is dependent on settings such as number of points.
One strategy for managing a large set of recall states is to initially store
them on a floppy disk. The files can then be copied from the floppy disk to
the volatile RAM disk at the start of each day. Since recall time from the
RAM disk is faster than recall from the floppy disk drive, throughput can
be increased. For example , to copy the file 'TEST3.ST A' from the 3.5 inch
disk to the non-volatile RAM disk, use the following SCPI command:
MMEM:COPY 'INT:TEST3.STA', 'MEM:'
For more details, see the Programmer's Guide.
When controlling the analyzer with a computer, you may want to copy an
instrument state file from your computer to one of the analyzer's built-in
RAM disks or the 3.5 inch disk. Later, the instrument can be instructed
to recall the state from its internal disk. The file can be sent from the
computer to the analyzer's disk using the SCPI MMEMory:TRANsfer
commands. For more details, see the Programmer's Guide.
For manually controlled test systems, the instrument state files for each
measurement can be stored onto disk by the test-system designer.
During the test sequence, the operator can press the
SAVE RECALL
key and recall the instrument state for a particular measurement.
Automating Measurements 5-5
Page 64

Automated Measurement Setup and Control
Define Save
Setting the Instrument State
Using Learn Strings to Save and Recall
Instrument States
The IEEE 488 *LRN (“learn”) command can also be used to set or query a
complete set of instrument parameters. This can be used as a
programming convenience, eliminating the need for using disk files when
saving and recalling instrument states.
To obtain the learn string containing the instrument state, use the
command *LRN? as follows:
10 DIM State1$[4000]
20 OUTPUT @Rfna;"*LRN?"
30 ENTER @Rfna USING "-K";State1$
...
160 ! Put the learn string back
170 OUTPUT @Rfna;State1$
Since *LRN?, by IEEE definition, only contains the actual instrument
state, exclusive of data traces and calibration arrays, the network
analyzer provides the command
SYST:SET:LRNLong?
This command saves the data traces and calibration arrays if they are
enabled using or by using the
MMEM:STOR:STATE SCPI commands. Using the *LRN command to set
the instrument settings takes about the same amount of time as
recalling a file from disk using MMEM:LOAD:STATe.
SAVE RECALL
For more details on learn strings, refer to the Example Programs Guide.
5-6 Automating Measurements
Page 65

Automated Measurement Setup and Control
SCPI Commands that Modify a Single Parameter
SCPI Commands that Modify a Single
Parameter
TIP If several measurement setups are similar — differing only by a few
instrument parameters — the fastest way to switch between the states is
for the control program to send the SCPI commands that modify only
those parameters.
For example, if center frequency and source power are the only
parameters that change in consecutive measurement setups, send the
SCPI commands SENS1:FREQ:CENT and SOUR1:POW to change these
parameters, leaving all other instrument settings unchanged. This will
be faster than either recalling an instrument state or sending a learn
string.
Automating Measurements 5-7
Page 66

Automated Measurement Setup and Control
Fast Iterative Control
Fast Iterative Control
You may want to quickly and iteratively change the analyzer's
parameters and monitor their effect on your device under test. This
section describes how to quickly change a parameter, take a sweep, and
query a marker.
For example, when measuring an amplifier, you may wish to quickly
choose the optimal input power to the amplifier which will result in a
maximum output of +10 dBm. To do so, you can first set the analyzer's
source power level, then measure the amplifier's output, and then
change the analyzer's source power in the direction that will cause the
measured signal to approach the desired value. This process can be
repeated until the measured amplifier output is within some specified
range of the target value.
When data at only a single frequency is needed, you can achieve the
fastest possible sweep by selecting a CW frequency and setting the
number of points to the minimum value of 3. A SCPI marker command
can be used to read the trace value.
Using this approach, you can typically achieve 3 to 5 sweeps per second.
Following is a listing of an example program named “FAST_CW” that
can be found on your Example Programs Disk.
100 DIM Freq_str$[20]
110 DIM Msg$[100]
120 !
130 IF POS(SYSTEM$("SYSTEM ID"),"HP 871") THEN
140 ASSIGN @Hp8711 TO 800
150 ELSE
160 ASSIGN @Hp8711 TO 716
170 ABORT 7
180 CLEAR 716
190 END IF
200 !
210 ! PRESET, to ensure known state.
220 OUTPUT @Hp8711;"SYST:PRES;*WAI"
230 CLS
240 !
250 ! Set up the analyzer to measure 3 data points.
260 OUTPUT @Hp8711;"SENS1:SWE:POIN 3;*WAI"
270 !
280 ! Select CW display and sweep
290 OUTPUT @Hp8711;"DISP:ANN:FREQ1:MODE CW"
300 OUTPUT @Hp8711;"SENS1:FREQ:SPAN 0 Hz;*WAI"
310 !
320 ! Take a single sweep, leaving the analyzer
330 ! in trigger hold mode.
5-8 Automating Measurements
Page 67

Automated Measurement Setup and Control
Fast Iterative Control
340 OUTPUT @Hp8711;"ABOR;:INIT1:CONT OFF;*WAI"
350 !
360 ! Turn on Marker 1
370 OUTPUT @Hp8711;"CALC:MARK1 ON"
380 !
390 Count=0
400 T0=TIMEDATE
410 ! Step from 175 MHz 463 MHz by 6 MHz
420 FOR Freq=175 TO 463 STEP 6
430 ! Take a sweep
440 Freq_str$=VAL$(Freq)&" MHz"
450 OUTPUT @Hp8711;"SENS1:FREQ:CENT ";Freq_str$
460 OUTPUT @Hp8711;"INIT1;*WAI"
470 !
480 ! Set marker to frequency
490 OUTPUT @Hp8711;"CALC:MARK:X ";Freq_str$
500 !
510 ! Query the marker value
520 OUTPUT @Hp8711;"CALC:MARK:Y?"
530 ENTER @Hp8711;Response
540 !
550 ! Display the first three numbers in the array.
560 Msg$="'"&Freq_str$&": "&VAL$(Response)&"'"
570 OUTPUT @Hp8711;"DISP:ANN:MESS ";Msg$
580 PRINT Msg$
590 Count=Count+1
600 NEXT Freq
610 T1=TIMEDATE
620 PRINT "Sweeps per second: ";Count/(T1-T0)
630 DISP "Sweeps per second: ";Count/(T1-T0)
640 END
Automating Measurements 5-9
Page 68

Automated Measurement Setup and Control
Responsive Communication using SRQs
Responsive Communication using SRQs
Service requests (SRQs) are a method by which you can instruct the
analyzer to tell your computer program when a condition changes or
when an event of interest occurs. This communication is done via HP-IB
signals.
Analyzer SRQ events include:
• Limit test fails
• A front panel key or external keyboard key is pressed
• Hardcopy in progress or complete
• Sweep in progress or complete
• Power has been cycled
The analyzer can be set to cause an SRQ on any combination of the above
events. Using SRQs allows your program to be interrupt driven, reducing
the latency and inefficiency of polling. For more details, refer to “Using
Status Registers” in the Programmer's Guide.
NOTE For test systems that include a multiport test set:
See the example program titled “MPCALSRQ.” This IBASIC/RMB
program requires an HP 8712ET/ES or HP 8714ET/ES analyzer
connected to a multiport test set. The program configures the analyzer’s
status reporting so that an SRQ is issued whenever a SelfCal is initiated.
Example programs can be found in the following four locations:
• Web site http://www.hp.com or http://www.agilent.com. Use the
search function to find Web pages related to 8712 example programs.
• Example Programs Disk, HP 8712ET/ES and HP 8714ET/ES (DOS
format): HP part number 08714-10003
• Example Programs Disk, HP 8712ET/ES and HP 8714ET/ES (LIF
format): HP part number 08714-10004
• Example Programs Guide, HP 8712ET/ES and HP 8714ET/ES: HP
part number 08714-90016
5-10 Automating Measurements
Page 69

Automated Measurement Setup and Control
Using Both of the Analyzer's Measurement Channels
Using Both of the Analyzer's
Measurement Channels
The analyzer is capable of making different measurements on each of its
two measurement channels. For example, you can set measurement
channel 1 to measure transmission over one set of sweep frequencies,
while measurement channel 2 is set to measure reflection over another
set of sweep frequencies. Thus, two measurements can be made by the
operator at the same time. Also, the controller can switch between
measurement channel 1 and measurement channel 2, while turning the
inactive channel off, to quickly change the test setup between two test
states.
Automating Measurements 5-11
Page 70

Automated Measurement Setup and Control
Trigger
Single
Using Single Sweep to Measure and View All Four S-Parameters
Using Single Sweep to Measure and
View All Four S-Parameters
You can save sweep time when measuring S-parameters on an
HP 8712ES or HP 8714ES by using the single sweep feature. As long as
a full two-port calibration has been performed, you can measure all four
S-parameters with a single sweep cycle, and then individually view each
S-parameter by then pressing the desired S-parameter softkey under the
MEAS 1 MEAS 2
From the front panel, set up your measurement parameters, perform (or
recall) a valid full two-port calibration, and then connect the DUT. Press
MENU
sweep to capture all four S-parameters, and then goes into “hold sweep”
mode. Press or , and then any of the S-parameter
measurement keys to view the desired parameter.
The SCPI command to perform a single sweep and then hold is
ABOR;:INIT[1|2]:CONT OFF;:INIT[1|2]; *WAI
or menu.
. The analyzer takes a forward and reverse
MEAS 1 MEAS 2
For an automated example, see the example program listed below. This
program is also available titled “FOURPARM” on your Example
Programs Disk.
1000 !Filename: FOURPARM
1010 !
1020 ! Demonstrates that all four S-parameters can be computed by
1030 ! the instrument after a single sweep.
1040 !
1050 ! Outline:
1060 ! 1. Select Default 2-Port Cal
1070 ! 2. Select S11 on MEAS 1. S21 on MEAS 2.
1080 ! These are Port 1 Reflection and forward transmission.
1090 ! Take a sweep.
1100 ! 3. Do Data->Mem on MEAS 1 and on MEAS 2.
1110 ! 4. Without taking another sweep, select
1120 ! S22 on MEAS 1 and S12 on MEAS 2.
1130 ! These are Port 2 Reflection and reverse transmission.
1140 !
1150 ! The display will show:
1160 !
1170 ! MEAS 1 : Port 1 and Port 2 REFLECTION (S11 and S22)
1180 ! MEAS 2 : forward and reverse TRANSMISSION (S21 and S12)
1190 !
1200 ! Note that a single MEAS channel could be used to gather all
four
1210 ! S-parameters after a single sweep. For display convenience
1220 ! however, this program uses both MEAS channels.
5-12 Automating Measurements
Page 71

Automated Measurement Setup and Control
Using Single Sweep to Measure and View All Four S-Parameters
1230 !
1240 DIM A$[10],Data1(1:201)
1250 INTEGER Digits,Bytes
1260 COM /Sys_state/ @Hp87xx,Scode
1270 !
1280 CALL Iden_port ! Identify I/O Port
1290 !
1300 OUTPUT @Hp87xx;”SYST:PRES” ! System Preset
1310 OUTPUT @Hp87xx;”*OPC?”
1320 ENTER @Hp87xx;Opc_flag ! Operation complete
1330 !
1340 ! Select Default Two Port Calibration on MEAS 1 and 2
1350 !
1360 DISP “Enabling 2-Port Calibration...”
1370 OUTPUT @Hp87xx;”SENS2:STAT ON” ! Turn on MEAS 2
1380 OUTPUT @Hp87xx;”SENS1:FUNC ‘XFR:S 1,1’” ! MEAS 1 = S11
1390 OUTPUT @Hp87xx;”SENS2:FUNC ‘XFR:S 2,1’” ! MEAS 2 = S21
1400 OUTPUT @Hp87xx;”SENS1:CORR:CLASS:SEL DEFAULT2” ! Default
2-Port
1410 OUTPUT @Hp87xx;”SENS2:CORR:CLASS:SEL DEFAULT2” ! Default
2-Port
1420 OUTPUT @Hp87xx;”DISP:FORM ULOW” ! Split Display
1430 OUTPUT @Hp87xx;”*OPC?”
1440 ENTER @Hp87xx;Opc_flag ! Operation complete
1450 DISP ““
1460 !
1470 ! Take a single sweep, leaving the analyzer
1480 ! in trigger hold mode.
1490 !
1500 OUTPUT @Hp87xx;”ABOR;:INIT1:CONT OFF;:INIT1;*WAI”
1510 !
1520 ! Copy MEAS 1 Data (S11) into MEAS 1 Memory trace
1530 ! Copy MEAS 2 Data (S21) into MEAS 2 Memory trace
1540 !
1550 DISP “Copy S11 to Mem1”
1560 OUTPUT @Hp87xx;”TRAC CH1SMEM,CH1SDATA” ! Ch1 Data->Mem
1570 DISP “Copy S21 to Mem2”
1580 OUTPUT @Hp87xx;”TRAC CH2SMEM,CH2SDATA” ! Ch2 Data-> Mem
1590 OUTPUT @Hp87xx;”*OPC?”
1600 ENTER @Hp87xx;Opc_flag
1610 !
1620 ! Now select S22 on MEAS 1 and S12 on MEAS 2.
1630 !
1640 DISP “Meas S22 on ch1”
1650 OUTPUT @Hp87xx;”SENS1:FUNC ‘XFR:S 2,2’” ! MEAS 1 = S22
1660 OUTPUT @Hp87xx;”*OPC?”
1670 ENTER @Hp87xx;Opc_flag ! Opeation complete.
1680 !
1690 DISP “Meas S12 on ch2”
1700 OUTPUT @Hp87xx;”SENS2:FUNC ‘XFR:S 1,2’” ! MEAS 2 = S12
1710 OUTPUT @Hp87xx;”*OPC?”
1720 ENTER @Hp87xx;Opc_flag ! Opeation complete.
1730 !
1740 ! Display Data and Memory on both MEAS channels. Autoscale
result.
1750 !
1760 OUTPUT @Hp87xx;”CALC1:MATH (IMPL);:DISP:WIND1:TRAC1 ON;TRAC2
ON”
1770 OUTPUT @Hp87xx;”DISP:WIND1:TRAC:Y:AUTO ONCE”
1780 OUTPUT @Hp87xx;”CALC2:MATH (IMPL);:DISP:WIND2:TRAC1 ON;TRAC2
Automating Measurements 5-13
Page 72

Automated Measurement Setup and Control
Using Single Sweep to Measure and View All Four S-Parameters
ON”
1790 OUTPUT @Hp87xx;”DISP:WIND2:TRAC:Y:AUTO ONCE”
1800 !
1810 DISP “Ch1: S11 (M:S22) Ch2: S12 (M:S21)” ! Done
1820 BEEP
1830 !
1840 END
1850 !
1860 !
1870
!**************************************************************
1880 ! Iden_port: Identify io port to use
1890 ! Description: This routines sets up the I/O port address for
1900 ! the SCPI interface. For “HP 87xx” instruments,
1910 ! the address assigned to @Hp87xx = 800 otherwise,
1920 ! 716.
1930
!**************************************************************
1940 SUB Iden_port
1950 COM /Sys_state/ @Hp87xx,Scode
1960 !
1970 IF POS(SYSTEM$(“SYSTEM ID”),”HP 87”)<>0 THEN
1980 ASSIGN @Hp87xx TO 800
1990 Scode=8
2000 ELSE
2010 ASSIGN @Hp87xx TO 716
2020 Scode=7
2030 END IF
2040 !
2050 SUBEND !Iden_port
2060 !
5-14 Automating Measurements
Page 73

Automated Measurement Setup and Control
Autost
AUTOST files
AUTOST files
When IBASIC is used, the measurement control program can be saved as
an AUTOST file on the analyzer's non-volatile RAM disk. When the
analyzer's power is turned on, it will first check for this file on the
non-volatile RAM disk and then on the 3.5 inch disk, and if found, load it
and run it. This feature simplifies the task of turning on an automated
test station at the beginning of a working day or test session. To
manually load and run an autostart file, press .
BEGIN
Automating Measurements 5-15
Page 74

Automated Measurement Setup and Control
AUTOST files
5-16 Automating Measurements
Page 75

6 Controlling Peripherals
6-1
Page 76

Controlling Peripherals
You can access the analyzer’s rear panel interface ports from your
measurement control program. Using this capability, you can
communicate with peripherals such as material handlers, custom DUT
interface circuits, external switch boxes, and printers.
This chapter will focus on use of the Centronics parallel port and the
RS-232 serial port. Communication with the DIN KEYBOARD interface,
the USER TTL, and the LIMIT TEST TTL connectors is described in
detail in Chapter 3, “Operator Interaction.”
NOTE Refer to your analyzer’s User’s Guide for pinout illustrations and
descriptions of the parallel and serial ports.
6-2 Automating Measurements
Page 77

Controlling Peripherals
Using the Parallel Port
Using the Parallel Port
The analyzer's parallel (Centronics) port can be used as an 8-bit TTL
output port and as a 5-bit TTL input port. The eight TTL outputs are for
output only, and cannot be read or used as bi-directional I/O lines. The
parallel port does not support the IEEE-1284-defined Extended
Capabilities Port (ECP) mode or Enhanced Parallel Port (EPP) mode.
The output signals are driven by standard TTL drivers. They should be
buffered for heavy-duty applications to avoid damaging the analyzer. The
inputs are standard TTL inputs, designed to accept signals in the 0 V to
5 V range.
The analyzer provides two ways to access the parallel port. You can use
the SCPI commands
OUTPUT @Rfna;"DIAG:PORT:WRITE <port>,<register>,<data>
and
OUTPUT @Rfna;"DIAG:PORT:READ? <port>,<register>
ENTER @Rfna;Data
or you can use IBASIC and its READIO and WRITEIO commands. See the
following tables for more information.
Automating Measurements 6-3
Page 78

Controlling Peripherals
Using the Parallel Port
Table 6-1 Writeable Ports
Port
Number
15 0 Outputs 8-bit data to the Cent_D0 thru D7 lines of the Centronics port.
15 1 Sets/clears the user bit according to the least significant bit of A. A least
15 2 Sets/clears the limit pass/fail bit according to the least significant bit of
15 3 Outputs 8-bit data to the Cent_D0 thru D7 lines of the Centronics port.
9 0 Outputs a byte to the serial port. The byte is output serially according to
Register Description
Cent_D0 is the least significant bit, Cent_D7 is the most significant bit.
Checks Centronics status lines for:
Out of Paper
Printer Not on Line
BUSY
ACKNOWLEDGE
significant bit equal to 1 sets the user bit high. A least significant bit of 0
clears the user bit.
A. A least significant bit equal to 1 sets the pass/fail bit high. A least
significant bit of 0 clears the pass/fail bit.
Cent_D0 is the least significant bit, Cent_D7 is the most significant bit.
Sets the Printer_select signal high (de-select). Does not check
Centronics status lines.
the configuration for the serial port.
6-4 Automating Measurements
Page 79

Table 6-2 Readable Ports
Controlling Peripherals
Using the Parallel Port
Port
Number
9 0 Reads the serial port.
15 0 Reads the 8-bit data port Cent_D0 thru D7.
15 1 Reads the user bit.
15 2 Reads the limit test pass/fail bit.
15 10 Reads the 8-bit status port.
Register Description
D0 — Cent_acknowledge
D1 — Cent_busy
D2 — Cent_out_of_paper
D3 — Cent_on_line
D4 — Cent_printer_err
NOTE When using the WRITEIO(15,0) or WRITEIO(15,3) command, the
Printer_Select Line is set high. However, when the instrument is doing
hardcopy, the Printer_Select Line is set low. The Printer_Select line may
or may not be used by individual printers. Check with your printer
manual.
Automating Measurements 6-5
Page 80

Controlling Peripherals
Using the Parallel Port
Writing to the Parallel Port
To write the value 52 decimal (34 hex, 0011 0100 binary) to the parallel
port's output pins, use one of the following commands:
OUTPUT @Rfna;"DIAG:PORT:WRITE 15,3,52"
WRITEIO 15,3;52
When the write command is executed, the parallel port's data lines (pins
2-9) will be set to the specified value, and then a pulse of at least 1 µs
duration will occur on the strobe line (pin 1). A data setup and data hold
time of at least 1 µs are guaranteed. See Figure 6-1.
Figure 6-1 Writing to the Parallel Port
6-6 Automating Measurements
Page 81

Table 6-3 shows the pin numbers, data bus bit numbers, and signal
names:
Table 6-3 Parallel Port Pins
Pin Bit Name
Controlling Peripherals
Using the Parallel Port
1
2
3
4
5
6
7
8
9
N/A
D0
D1
D2
D3
D4
D5
D6
D7
Strobe
Data 1
Data 2
Data 3
Data 4
Data 5
Data 6
Data 7
Data 8
The data will typically remain valid until the next write to the parallel
port, but you should always latch the data using the strobe. Figure 6-2
shows a simple circuit which can be used to write to an 8-bit DAC and a
digital latch.
Automating Measurements 6-7
Page 82

Controlling Peripherals
Using the Parallel Port
Figure 6-2 Digital Latch Circuit
6-8 Automating Measurements
Page 83

Reading from the Parallel Port
The parallel port has five TTL input signals, normally used for
determining the printer's status, which can be read. The signals and the
corresponding data bits and pins are shown in the following table:
Table 6-4 Parallel Port Inputs
Pin Bit Name
10 D0 Acknowledge
11 D1 Busy
12 D2 Out of Paper
13 D3 On Line
15 D4 Printer Error
Your custom interface circuit can drive these signals, and they can be
read using the following commands.
Controlling Peripherals
Using the Parallel Port
SCPI commands:
OUTPUT @Rfna;"DIAG:PORT:READ? 15,10"
ENTER @Rfna;Parallel_in
IBASIC command:
Parallel_in = READIO(15,10)
Automating Measurements 6-9
Page 84

Controlling Peripherals
Hardcopy Considerations
Hardcopy Considerations
The analyzer's feature can send output to printers
connected to the parallel port. If you have a custom interface circuit
attached to the parallel port, you don't want the hardcopy output to
interfere with it.
To address this issue, the analyzer uses the parallel port's printer-select
signal (pin 17) to differentiate between hardcopy dumps and user-issued
WRITEIO and DIAG:PORT:WRITe commands. During a hardcopy to the
parallel port, the printer-select signal is driven low. During WRITEIO and
DIAG:PORT:WRITe commands, it is driven high.
Using the printer-select signal, you can connect both an interface circuit
and a printer to the parallel port. The interface circuit should only
respond to the data strobe (pin 1) when the printer-select signal is high.
The printer should only respond to the data strobe when the
printer-select signal is low. Most printers require the printer-select line
to be low, or else they will not print. Some printers ignore this line. If you
are using a printer which ignores this line you have two choices:
1. Consult the printer’s manual to see if there is a DIP-switch setting
that controls how the printer responds to the printer-select signal, or
if not,
2. Design your interface circuit so that it gates and inhibits the data
strobe signal (pin 1) going to the printer when printer-select is high.
Similar to the output signals, you can use the printer-select signal to
multiplex the input signals, selecting either the signals from your
interface circuit or those from the printer.
HARDCOPY
6-10 Automating Measurements
Page 85

Controlling Peripherals
Using the Serial Port
Using the Serial Port
Like the parallel port, the RS-232 serial port can also be accessed using
SCPI and IBASIC commands.
To write a byte with a value of 52 decimal (34 hex, 0011 0100 binary) to
the serial port, use one of the following commands:
OUTPUT @Rfna;"DIAG:PORT:WRITE 9,0,52"
WRITEIO 9,0;52
To read a byte from the serial port, use the following commands:
OUTPUT @Rfna;"DIAG:PORT:READ? 9,0"
ENTER @Rfna;Serial_in
If you are using IBASIC, you can simply use the READIO statement:
Serial_in = READIO(9,0)
For general purpose I/O, the parallel port is much easier to interface to
than the serial port. To interface to the serial port, a Universal
Asynchronous Receiver Transmitter (UART) is typically used to decode
the RS-232 signals. Most UARTs are designed to be used with
microprocessors.
The advantage of the serial port is that it can operate over long
distances: up to 30 meters using the RS-232-C standard. Its
disadvantage is its slow speed which is limited to 19200 bits/second.
Before using the serial port, you must select the baud rate and
handshake style using the SCPI commands:
SYSTem:COMMunicate:SERial:TRANsmit:BAUD
SYSTem:COMMunicate:SERial:TRANsmit:HANDshake {XON|DTR}
One type of application for the serial port is data logging to a remote
computer. After each device is measured, an IBASIC program could use
the WRITEIO command shown above to send a brief summary of the
measurement result, such as a filter's 3 dB bandwidth and its serial
number, to a remote computer. A program on the remote computer would
monitor the serial port and read the incoming data and archive it to a
hard disk or network.
Automating Measurements 6-11
Page 86

Controlling Peripherals
Using the Serial Port
6-12 Automating Measurements
Page 87

7 Displaying Measurement
Results
7-1
Page 88

Displaying Measurement Results
It is often helpful to eliminate unnecessary and potentially distracting
information and annotation from the display, and only show the
information necessary to perform a particular task.
The analyzer provides several features to let you customize the
information shown on the display as shown in Figure 7-1. Many of the
features discussed in this chapter can also be implemented using the
analyzer's user interface. See “Customizing the Display” in Chapter 4 of
your analyzer’s User’s Guide for more information.
Figure 7-1 Customized Annotation
Customizing features such as limit testing, annotating the X-axis, and
using the title feature are described in this chapter.
7-2 Automating Measurements
Page 89

Displaying Measurement Results
More Display
Graticule ON off
Graticule On/Off
Graticule On/Off
The graticule is the set of grid lines that designate increments of value
on the X-axis and Y-axis of the measurement.
If you are comparing the trace against limit lines or marker values,
turning off the graticule makes it easier to view the measurement trace,
limit lines, and markers. To turn the graticule off, press
or use the following SCPI
command:
DISPlay:WINDow[1|2]:TRACe:GRATicule:GRID OFF
where the window number is 1 if in full-screen display, and 1 or 2 for the
upper and lower split-screen displays.
DISPLAY
Automating Measurements 7-3
Page 90

Displaying Measurement Results
Limit Menu
Limit Options
Limit Line ON off
Limit Menu
Limit Options
Limit Icon ON off
Limit Menu
Limit Options
Limit Text ON off
Limit Testing
Limit Testing
The measurement trace can be automatically compared to limits which
you define. The limits, entered as lines and points, can be displayed on
the screen or can be hidden. Whether or not the limits are displayed, the
analyzer will display “PASS” if the measurement satisfies the limits and
will display the FAIL symbol if the measurement fails to meet the
prescribed limits. Using limits gives the operator visual guides when
tuning devices, provides standard criteria for meeting device
specifications, and shows an instant indication of the comparison of data
versus specifications.
To turn limit lines on or off
To turn limit lines on or off, press
commands:
CALC[1|2]:LIMit:DISPlay ON
CALC[1|2]:LIMit:DISPlay OFF
where [1|2] indicates the measurement channel number; use either
1or2.
DISPLAY
, or use the following SCPI
To turn the fail icon on or off
To turn the fail icon on or off, press
commands:
DISP:ANN:LIM:ICON[1|2]:FLAG ON
DISP:ANN:LIM:ICON[1|2]:FLAG OFF
DISPLAY
, or use the following SCPI
To turn the pass/fail text on or off
To turn the pass/fail text on or off, press
commands:
DISP:ANN:LIM:ICON[1|2]:TEXT ON
DISP:ANN:LIM:ICON[1|2]:TEXT OFF
DISPLAY
, or use the following SCPI
7-4 Automating Measurements
Page 91

Displaying Measurement Results
Limit Menu
Limit Options
Limit Icon X Position
Limit Icon Y Position
Limit Testing
To move the position of the pass/fail indicator
To move the position of the pass/fail indicator, press
, and use the
and keys to reposition the indicator. Or use the
following SCPI commands:
DISP:ANN:LIM:ICON[1|2]:POS:X <num>
DISP:ANN:LIM:ICON[1|2]:POS:Y <num>
For more information on limit lines, see “Using Limit Testing” in
Chapter 4 of your analyzer’s User’s Guide.
See Figure 7-1 for an example of a measurement using limit lines with a
“PASS” test result.
DISPLAY
Automating Measurements 7-5
Page 92

Displaying Measurement Results
Customized X-axis Annotation
Customized X-axis Annotation
X-axis annotation consists of one or two lines of information that appear
below the graticule. You can replace this annotation with your own text
(see Figure 7-1) or eliminate the X-axis annotation completely.
By default, the X-axis annotation displays the stimulus frequencies
(default resolution is kHz), or powers if in power sweep. However, it can
be customized using SCPI commands to show your own start and stop
X-axis values and units. For example, when measuring mixers which
introduce a frequency offset, you can annotate the frequencies at the
output of the mixer.
To turn on user-defined X-axis annotation
To turn on user-defined X-axis annotation, use the command:
DISP:ANN:FREQ[1|2]:USER[:STATe] {OFF|0|ON|1}
For example:
DISP:ANN:FREQ1:USER ON
To specify your start and stop values
To specify your start and stop values, use:
DISP:ANN:FREQ[1|2]:USER:STARt <num>
DISP:ANN:FREQ[1|2]:USER:STOP <num>
The value <num> must be between −10,000 and 10, 000. For example:
DISP:ANN:FREQ1:USER:STAR -100
DISP:ANN:FREQ1:USER:STOP +100
To specify a custom suffix
To specify a custom suffix, use:
DISP:ANN:FREQ[1|2]:USER:SUFF[:DATA]
For example:
DISP:ANN:FREQ1:USER:SUFF 'uV'
The suffix can be up to 3 characters long.
7-6 Automating Measurements
Page 93

Displaying Measurement Results
More Display
Annotation Options
Freq Annot ON off
Customized X-axis Annotation
To turn the X-axis annotation on or off
To turn the X-axis (frequency) annotation on or off, press
the following SCPI commands:
DISP:ANN:FREQ[1|2] ON
DISP:ANN:FREQ[1|2] OFF
NOTE When using custom X-axis annotation, the SCPI command
CALC:MARK:X and query CALC:MARK:X? will return the analyzer's
stimulus value, not your custom annotation values. If this is a problem,
you can use the SCPI command CALC:MARK:POIN to specify the X-axis
point number at which you wish to position the marker.
For example:
OUTPUT @HP8711;"CALC:MARK1:POIN 134"
will put the marker at point number 134.
Custom X-axis annotation has no effect on Y-axis marker values
(CALC:MARK:Y?).
DISPLAY
or use
Automating Measurements 7-7
Page 94

Displaying Measurement Results
Customized Measurement-Channel Annotation
Customized Measurement-Channel
Annotation
The analyzer displays measurement-channel annotation above the
graticule. This annotation shows the measurement type, format,
scale/division, and reference level.
You may replace this annotation with your own text (see Figure 7-1) or
eliminate the measurement-channel annotation completely.
T o turn on user-defined measurement-channel
annotation
To turn on user-defined measurement-channel annotation, use the
command:
DISP:ANN:CHAN[1|2]:USER[:STATe] ON
where [1|2]indicates the measurement-channel number: either 1 or 2.
To specify the string to be displayed
To specify the string to be displayed use the command:
DISP:ANN:CHAN[1|2]:USER:LAB[:DATA]
For example:
DISP:ANN:CHAN1:USER:LABel '1: SuperNotch filter, test #3'
To restore default measurement-channel annotation
To restore the default measurement-channel annotation, use:
DISP:ANN:CHAN[1|2]:USER OFF
7-8 Automating Measurements
Page 95

Displaying Measurement Results
More Display
Annotation Options
Meas Annot ON off
Customized Measurement-Channel Annotation
To turn measurement-channel annotation on or off
To turn the measurement-channel annotation on or off , press
the following SCPI commands:
DISP:ANN:CHAN[1|2] ON
DISP:ANN:CHAN[1|2] OFF
DISPLAY
, or use
Automating Measurements 7-9
Page 96

Displaying Measurement Results
Markers
Markers
Well-designed use of the analyzer’s marker features in an automated
system can enhance the data gathering process, as well as provide
important visual feedback to the operator.
The active marker's value is displayed in the upper right area of the
graticule. If marker bandwidth (or notch) search is selected, the
bandwidth (or notch) information is displayed instead. This marker
information can be used to view exact measured data at critical
frequency points. Note the customized measurement channel notation in
Figure 7-1. In addition to the active marker's readout, four of the
marker's values are displayed in the softkey area during front panel use.
This makes it easy to quickly read the measured data at several marker
positions.
The triangular marker symbols can also be used to graphically indicate
critical frequency points of the measurement. For example , a marker can
be set at the desired center frequency for a notch filter, and the operator
can tune the filter until the notch is at the same frequency as the marker.
Marker search types include:
• max search
• min search
• target search
• bandwidth
• notch
• multi peak
• multi notch
When marker tracking is turned on, these searches will be automatically
performed at the end of each sweep. This can be useful in tuning
applications.
7-10 Automating Measurements
Page 97

Displaying Measurement Results
Markers
Other marker functions that can be useful are the marker math
functions:
• statistics
• flatness
• RF filter stats
These functions perform certain mathematical calculations on the
amplitude, phase, delay or SWR data of user -defined trace segments . See
“To Use Marker Math Functions” in Chapter 4 of your analyzer’s User’s
Guide for more information on these features.
Automating Measurements 7-11
Page 98

Displaying Measurement Results
More Display
Title and Clock
Title Line 1
Title and Clock
Title and Clock
The analyzer has two 30-character title lines. One of these lines can be
replaced with a real-time clock readout. Timestamps on measurement
data can be important when monitoring throughput, quality, and
processes.
For example , the title line can be set to show the serial number and type
of the DUT. Doing so provides a simple and safe link between the device
under test and the measurement data.
The title and clock lines are, by default, included on hardcopy printouts.
These can be configured using the
example, refer to “Using the Analyzer's Title Feature” on page 3-15.
DISPLAY
menu. For more details and a simple
7-12 Automating Measurements
Page 99

8 Saving Measurement Results
8-1
Page 100

Saving Measurement Results
After measuring a device, you will probably want to save the
measurement results so that you can perform statistical analyses on
them. Statistical quality control (SQC) can be a powerful tool to indicate
process drift or variation.
You may also want to produce a print or plot of the DUT's response, and
ship this to your customer along with the DUT.
8-2 Automating Measurements
 Loading...