

Page 1
TM 11-6425-2837-14&P-6
Page 2
TM 11-6425-2837-14&P-6
i
Page 3
Section
0.
I.
1-2.
1-6.
1-8.
1-12.
1-13. 1-2
1-13.
II.
2-1
4-2.
2-5.
2-7.
2-10.
2-12.
2-14.
2-16.
2-18.
2-23.
III.
3-1.
3-4.
3-6.
3-11.
IV.
4-1.
4-3.
4-8.
4-9.
4-10.
4-11.
4-12.
4-13.
4-14.
4-15. 4-6
4-15.
Page
0-1
4-1
4-1
Model 86601A
CONTENTS
Section IV.
1-1
1-1
1-1
1-1
1-1
1-2
2-1
2-1
2-1
2-1
2-1
2-1
2-1
2-1
2-1
2-1
2-1 5-4
3-1
3-1
3-1
3-1
3-1
4-1
4-1
4-1
4-2
4-2
4-3
4-4
4-5
4-7
4-17.
4-18.
4-19.
4-20.
4-21.
4-23.
4-23.
4-24.
4-25.
4-26.
V. 5-1
5-1. 5-1
5-7.
5-10.
5-13.
5-14.
5-15.
5-16.
5-17.
5-18.
VI.
6-1.
6-6.
VII.
7-1.
7-5.
VIII.
8-1.
8-3.
8-10.
8-12.
8-17.
Page
4-9
4-10
4-10
4-11
4-12
4-16
4-16
4-17
4-19
4-20
5-1
5-1
5-1
5-2
5-6
5-9
5-10
6-1
6-1
6-1
7-1
7-1
7-1
8-1
8-1
8-1
8-1
8-1
8-1
ILLUSTRATIONS
Figure
1-1.
1-2.
1-3.
1-4.
1-5.
3-1.
4-1.
ii
Page
1-0
1-1
1-6
1-6
1-6
3-0
4-1
Figure
4-2. Output Accuracy and Level Test Setup
4-3. Output Flatness Test Setup
4-4. Impedance Test Setup
4-5. Harmonic Signal Test Setup
4-6. Spurious Signal Test Setup
4-7. Signal-to-Phase Noise Test Setup.
4-8. Signal-to-AM Noise Ratio Test Setup
4-9. Amplitude Modulation Test Setup
.......
.........
.......
.......
.....
....
.....
...
Page
4-2
4-3
4-4
4-5
4-6
4-8
4-9
4-10
Page 4
Model 86601A
ILLUSTRATIONS (cont'd)
Figure
4-10. 4-12
4-11.
4-12.
4-13.
4-14.
4-15.
4-16.
5-1.
5-2.
5-3.
5-4.
5-5.
5-6.
7-1. 7-3
7-2. 7-5
7-3.
7-4.
7-5.
7-6.
7-7.
7-8.
8-1.
8-2.
8-3.
Page
4-13
4-15
4-16 8-8.
4-18 8-9.
4-19 8-10.
4-20
5-2
5-3
5-4
5-6
5-9
5-10
7-5
7-7
7-8
7-9 8-23.
7-10
7-11
8-0
8-3
8-4
Figure
8-4.
8-5.
8-6.
8-7.
8-11.
8-12.
8-13.
8-14.
8-15.
8-16.
8-17.
8-18.
8-19.
8-20.
8-21.
8-22.
8-24.
8-25.
8-26.
8-27.
8-28.
Page
8-6
8-7
8-7
8-8
8-10
8-11
8-11
8-11
8-11
8-12
8-13
8-13
8-13
8-13
8-15
8-15
8-15
8-16
8-17
8-17
8-17
8-19
8-19
8-21
8-21
TABLES
Table
1-1.
1-2. Test Equipment and
1-3. 40 dB Amplifier Specifications
4-1. Spurious checks
4-2. Carrier Envelope Distortion Test
4-3. Performance Test Record
5-1. Harmonic Distortion Level Checks
6-1. Part Numbers for
6-2. Reference Designators and
A.
B.
C.
D.
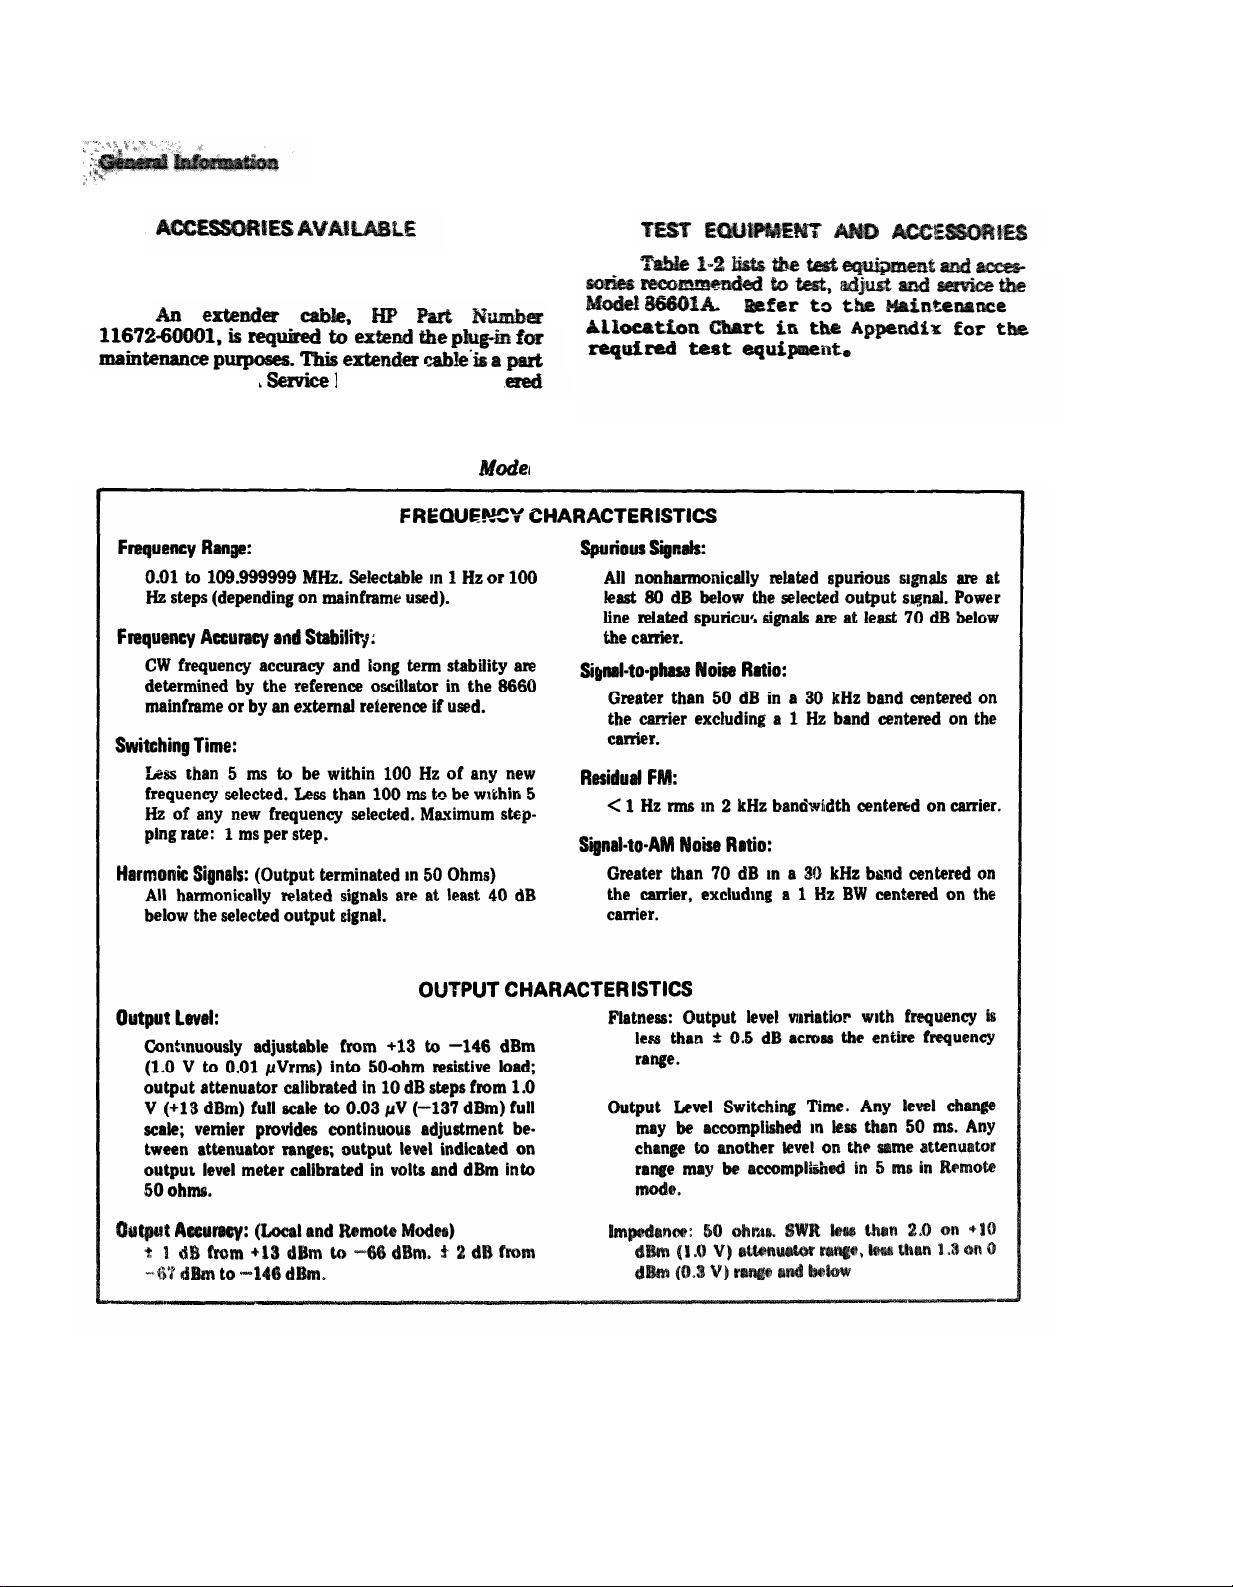
el 86601A Specifications 1-2
Accessories List 1-4
Assembly Exchange Orders
Abbreviations Used in
Parts List 6-2
REFERENCES A-1
COMPONENTS OF END ITEM LIST (NA)
ADDITIONAL AUTHORIZATION LIST (NA)
MAINTENANCE ALLOCATION
Page
1-6
4-7
4-14
4-22
5-5
6-1
APPENDIXES
D-l
Table
6-3. Replaceable Parts 6-3
6-4. Manufacture's Code List 6-15
6-5. Part Number-National Stock
Number Cross Reference Index
7-1. Manual Changes by Serial Number
7-2. Assembly-Change Cross Reference Index
8-1. Schematic Diagram Notes
8-2. Assembly Locations
8-3. 1 dB Attenuation Checks
8-4. Attenuator Driver Levels 8-20
E. REPAIR PARTS AND SPECIAL
TOOLS LISTS
EXPENDABLE SUPPLIES AND
F.
MATERIALS LIST (NA)
Page
6-16
7-1
7-4
8-5
8-7
8-16
E-1
iii
Page 5
INTRODUCTION
0-1. SCOPE
0-2. INDEXES OF PUBLICATIONS
0-3. MAINTENANCE FORMS, RECORDS,
AND REPORTS
TM 11-6425-2837-14&P-6
SECTION 0
0-4. REPORTING EQUIPMENT
IMPROVEMENT RECOMMENDATIONS
(EIR).
EIR can and must be submitted by anyone who is
aware of an unsatisfactory condition with the equip
ment design or use. It is not necessary to show a new
design or tit a better way to perform a procedure;
just simply tell why the design is unfavorable or why
a procedure is difficult. EIR may be submitted on SF
368 (Quality Deficiency Report). Mail direct to Commander, US Army Communications and Electronics
Materiel Readiness Command, ATTN: DRSEL-ME-
MQ, Fort Monmouth, NJ 07703. A reply will be fur-
nished to you.
agement System.
b. Report of Packaging ad Handling Deficiencies.
Fill out and forward DD Form 6 (Packaging Improvement Report) as prescribed in AR 700-58/NAVSUPINST 4030.29/AFR 71-13/MCO P4030.29A, and DLAR
4145.8.
c. Discrepancy in Shipment Report (DISREP) (SF
361). Fill out and forward Discrepancy in
Shipment
0-5. ADMINISTRATIVE STORAGE
Administrative storage of
used by Army activities shall be in accordance with
paragraph 2-16.
0-6. DESTRUCTION OF ARMY ELECTRONICS
MATERIEL
Destruction of Army electronics materiel to prevent
enemy use shall be in accordance with TM 750-244-2.
0-1
Page 6
Model 86601A
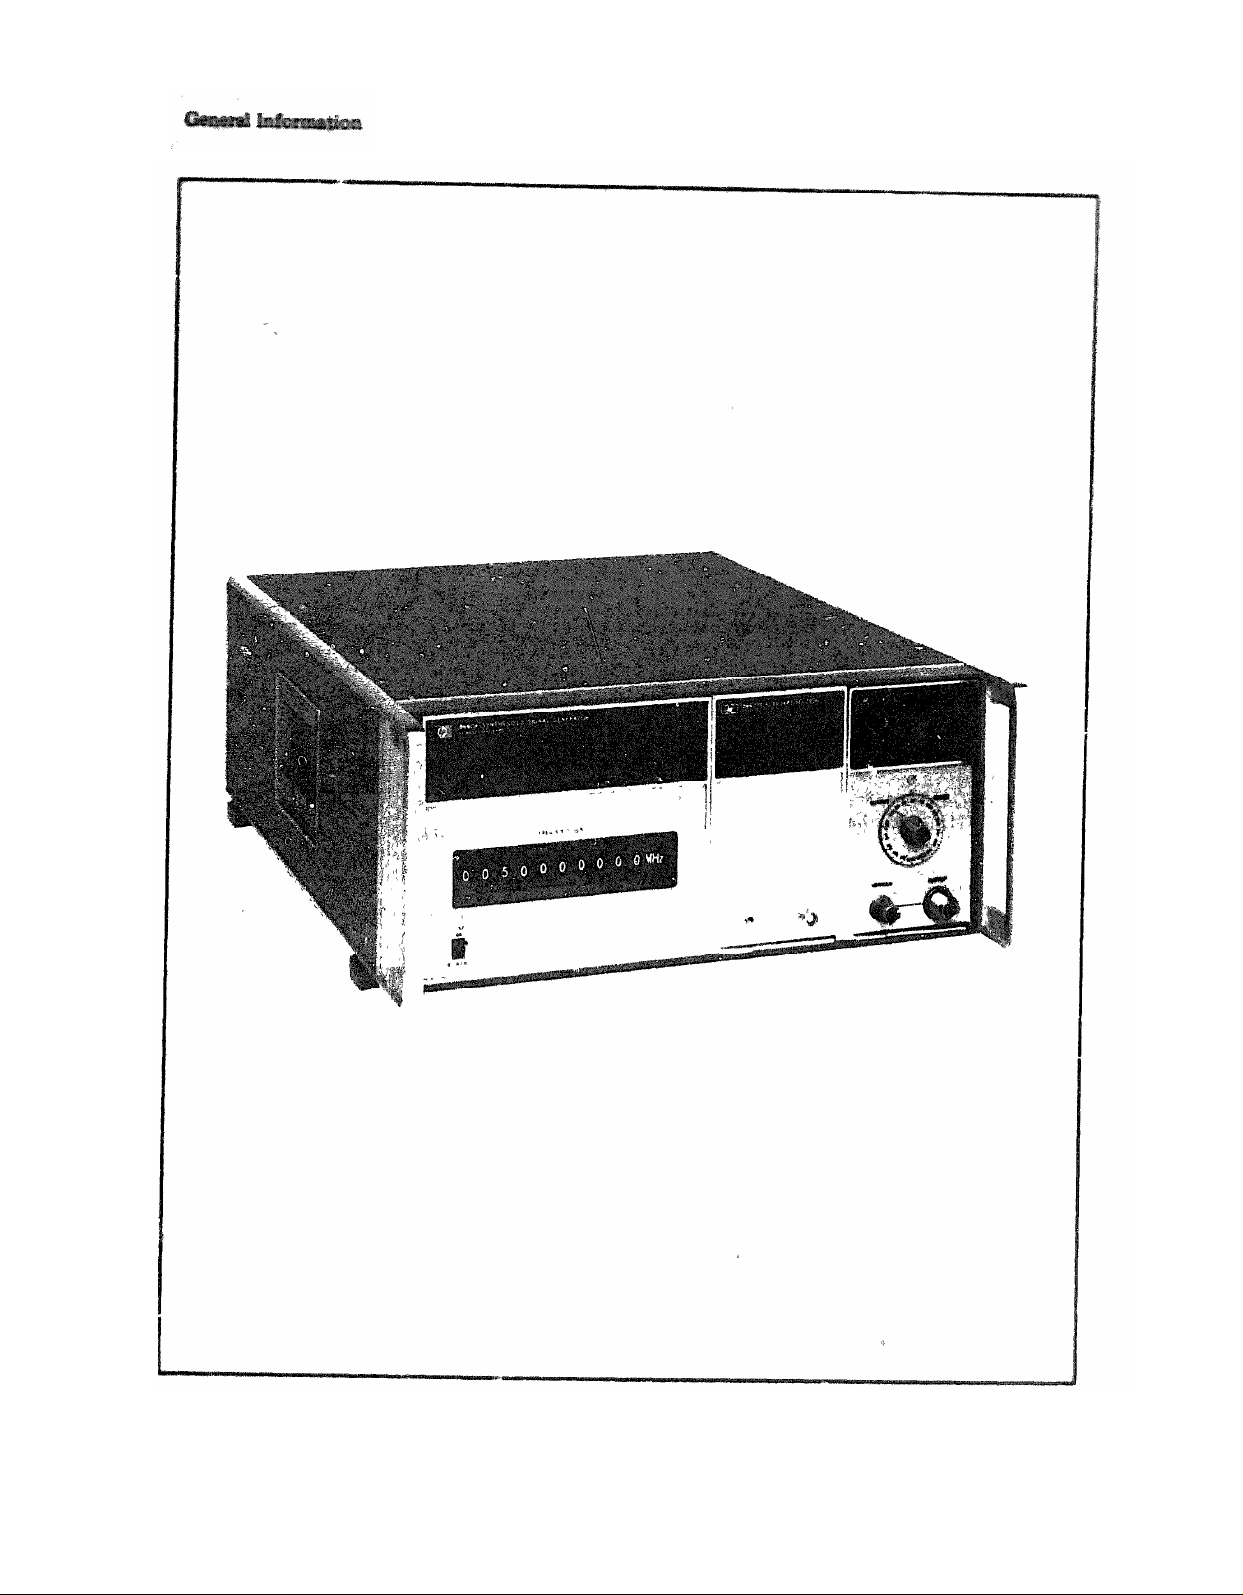
1-0
Figure 1-1. Model 88601A RF Section
Page 7
Model 86601A
SECTION I
GENERAL INFORMATION
1-1.
1-2.
1-3.
section covers instrument
ations and other basic in-
1-4. Figure 1-1 shows a front view of the HP
1A installed in the HP Model 8660A
mainframe ready for use.
1-5. The various sections of this manual provide
information as follows:
a. SECTION II, INSTALLATION, provides
information relative to incoming inspection, power
requirements, mounting, packing and shipping, etc.
b. SECTION III, OPERATION, provides in-
formation relative to operating the instrument.
c. SECTION IV, PERFORMANCE TESTS,
provides information required to asccitain that the
instrument is performin, in accordance with published specifications.
d. SECTION V, ADJUSTMENTS, provides
inform&ion required to properly adjust and align
the instrument after repairs are made.
e. SECTION VI REPLACEABLE PARTS
provides ordering information for all parts and
assemblies.
f.
SECTION VII, MANUAL CHANGES,
g.
1-6.
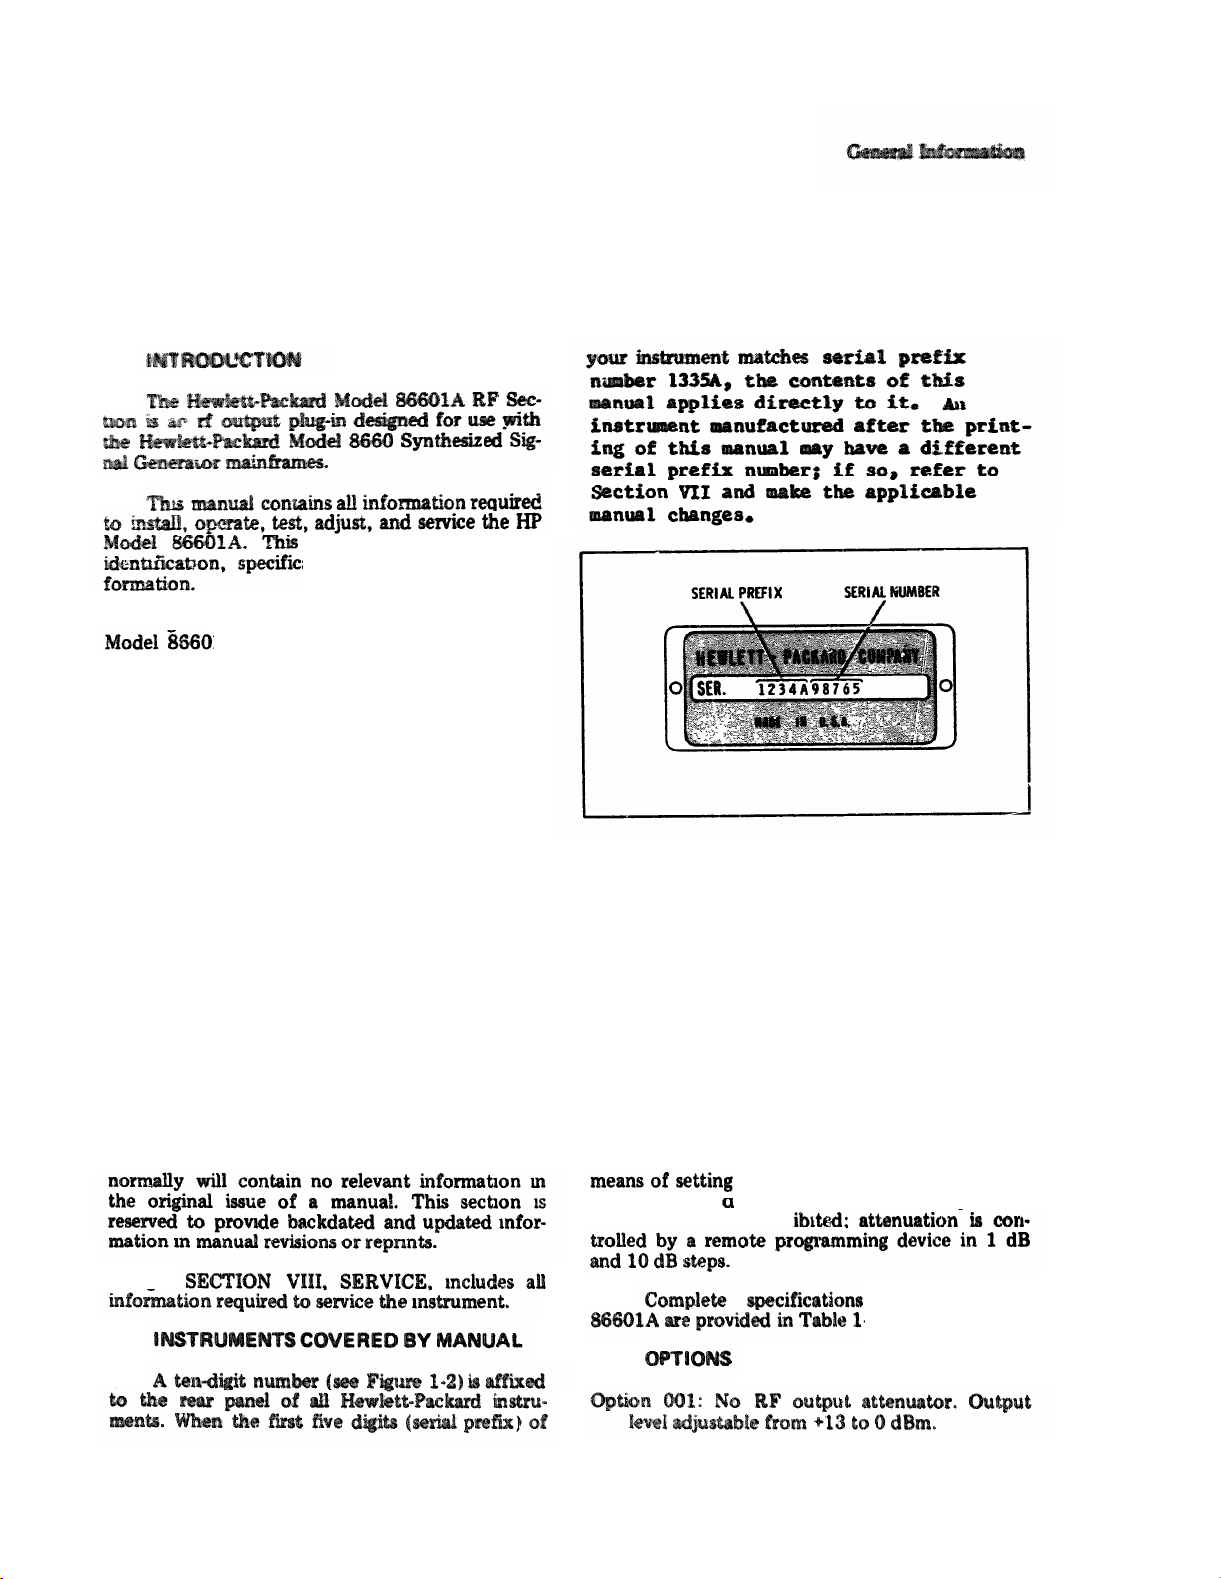
1-7.
Figure 1-2. Instrument Identification
1-8. DESCRIPTION
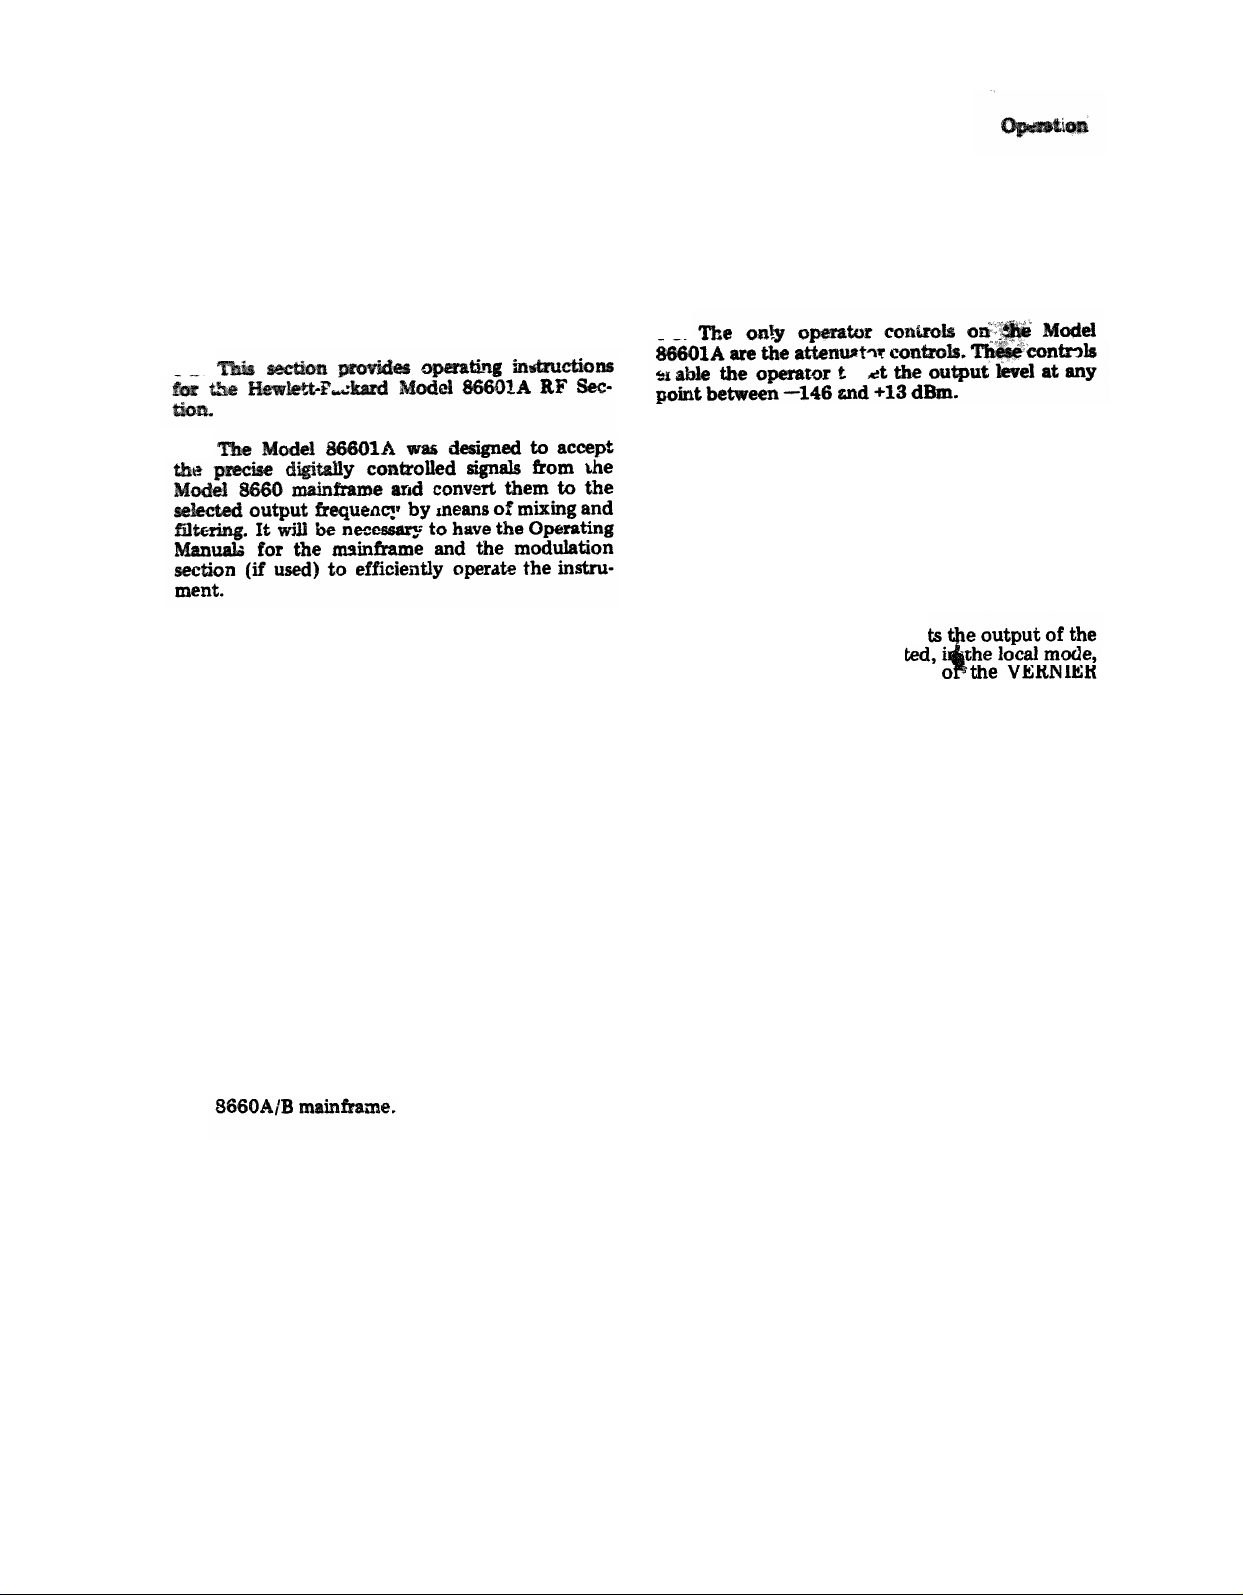
1-9. The HP Model 86601A RF Section output
plug-in provides a .01 to 109.999999 MHz output
when installed in one of the HP Model 8660
mainframes. The output frequency may be selected
in increments as low as 1 Hz or 100 Hz depending
on the mainframe used.
1-10. The only operator controls on the Model
86601A are the attenuator (OUTPUT RANGE and
VERNIER) controls. These controls provide a
the rf output at any level between
-146 dBm an +13 dBm. In remote operation
these controls are inh
1-11.
for the Model
-1.
1-12.
1-1
Page 8
Model 86601A
1-13.
1-14.
of the HP 11672A
Separately.
Kit, but may be ord
Table 1-1.
1-15.
1-16.
l 86602A Specifications
1-2
Page 9
Model 86601A
Table 1-1. Model 86601A Specifications (Cont'd)
1-3
Page 10
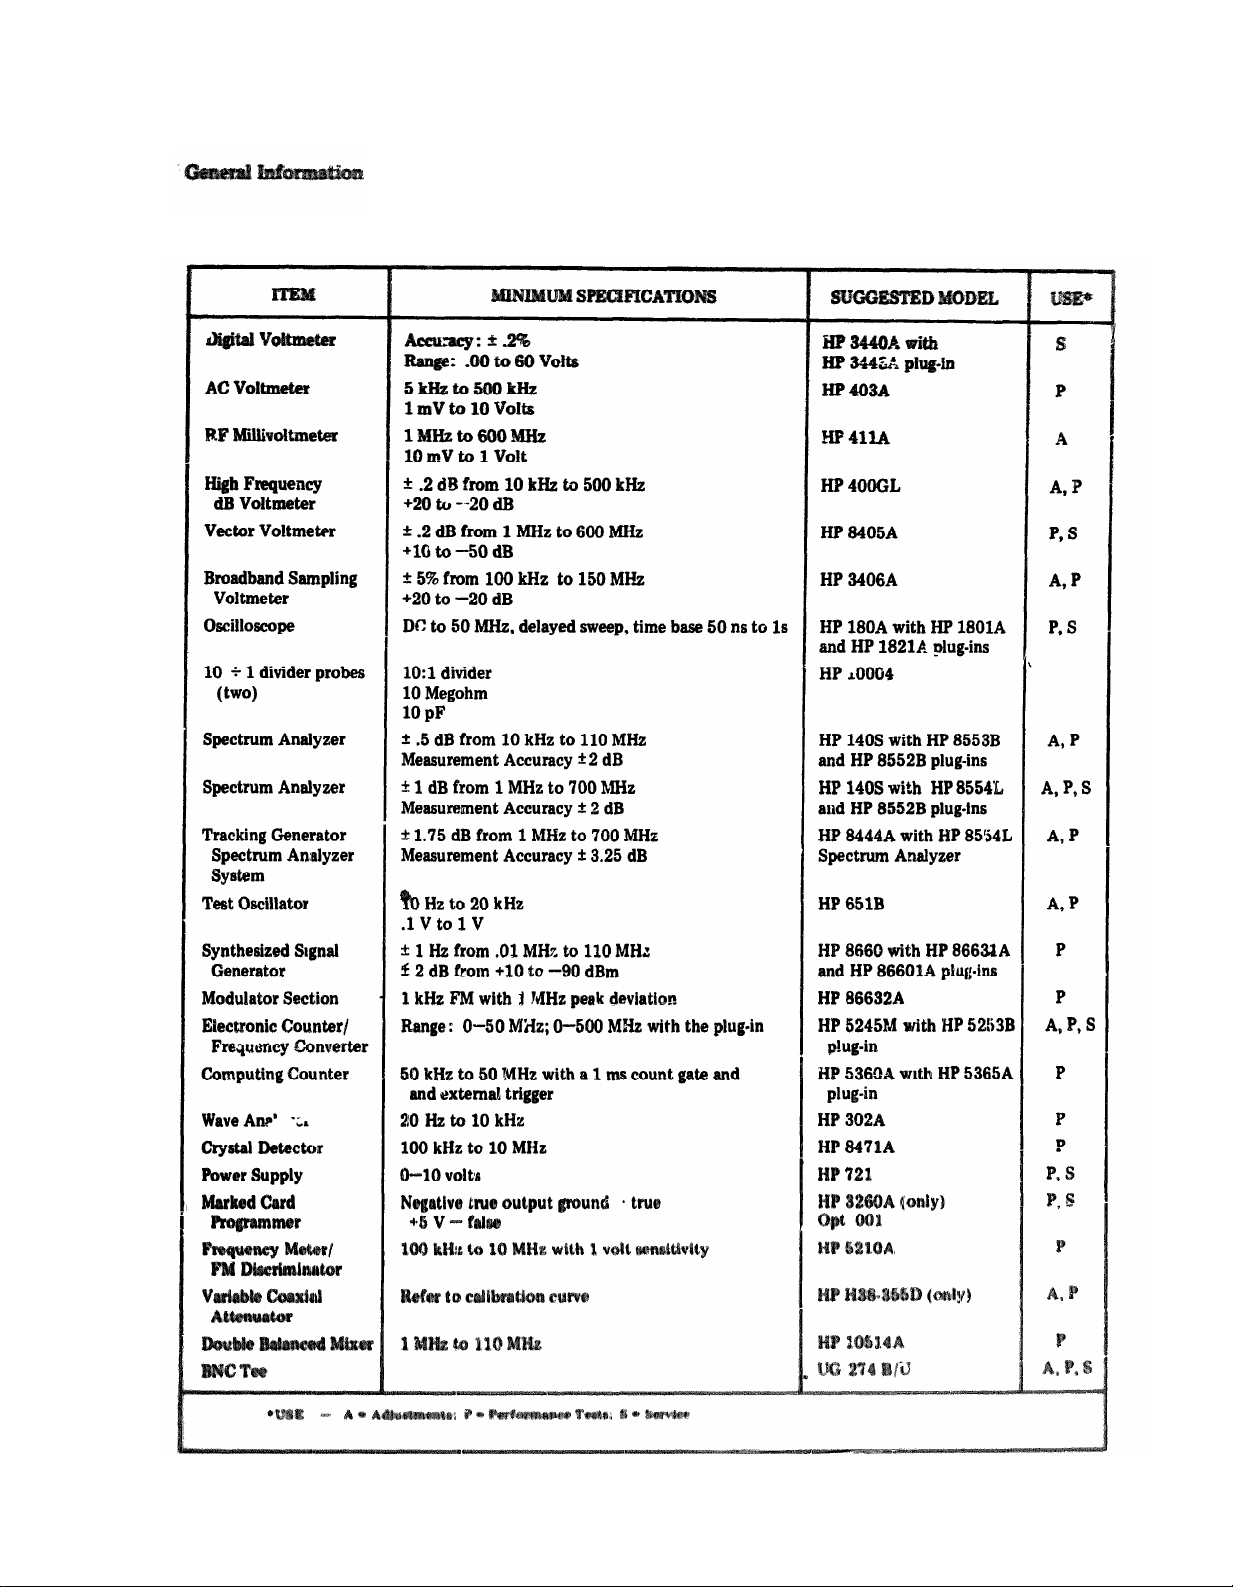
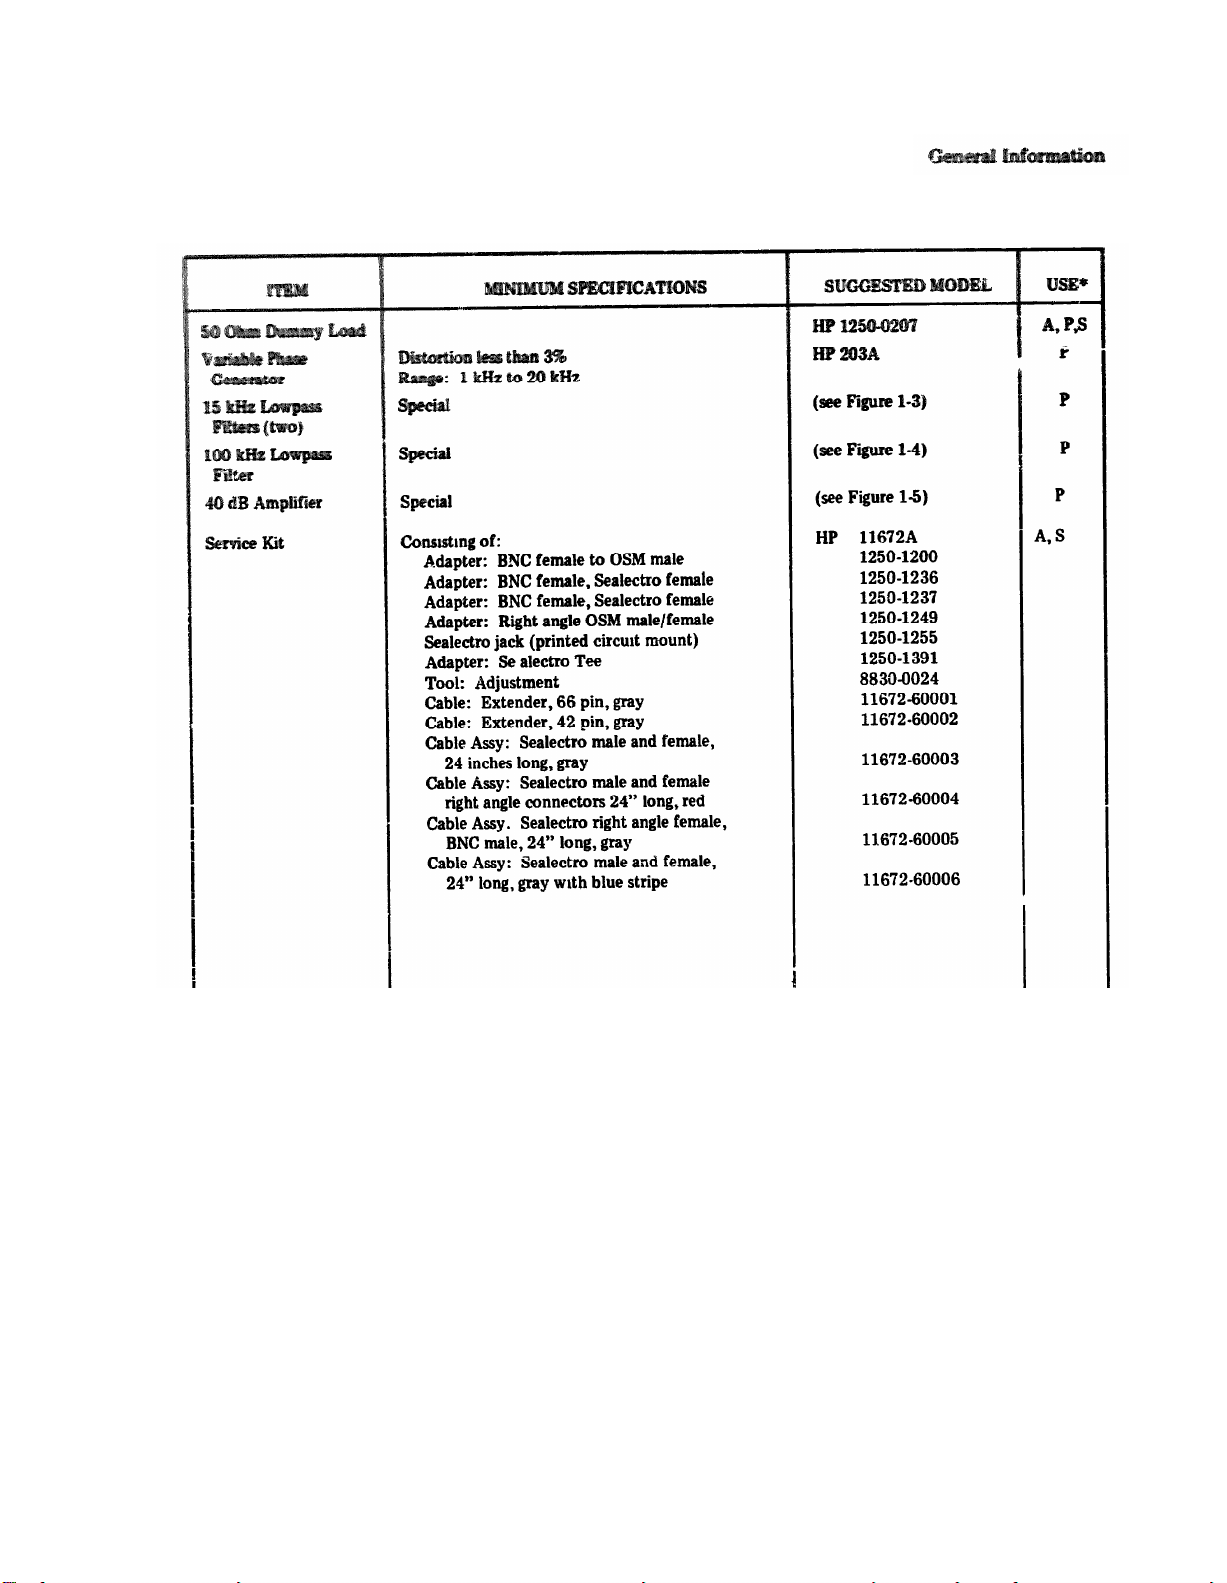
Table 1-2. Test and Equipment and Accessories List
Model 86601A
1-4
Page 11
Model 86601A
Table 1-2. Test Equipment and Accessories List (cont'd)
1-5
Page 12
Model 86601A
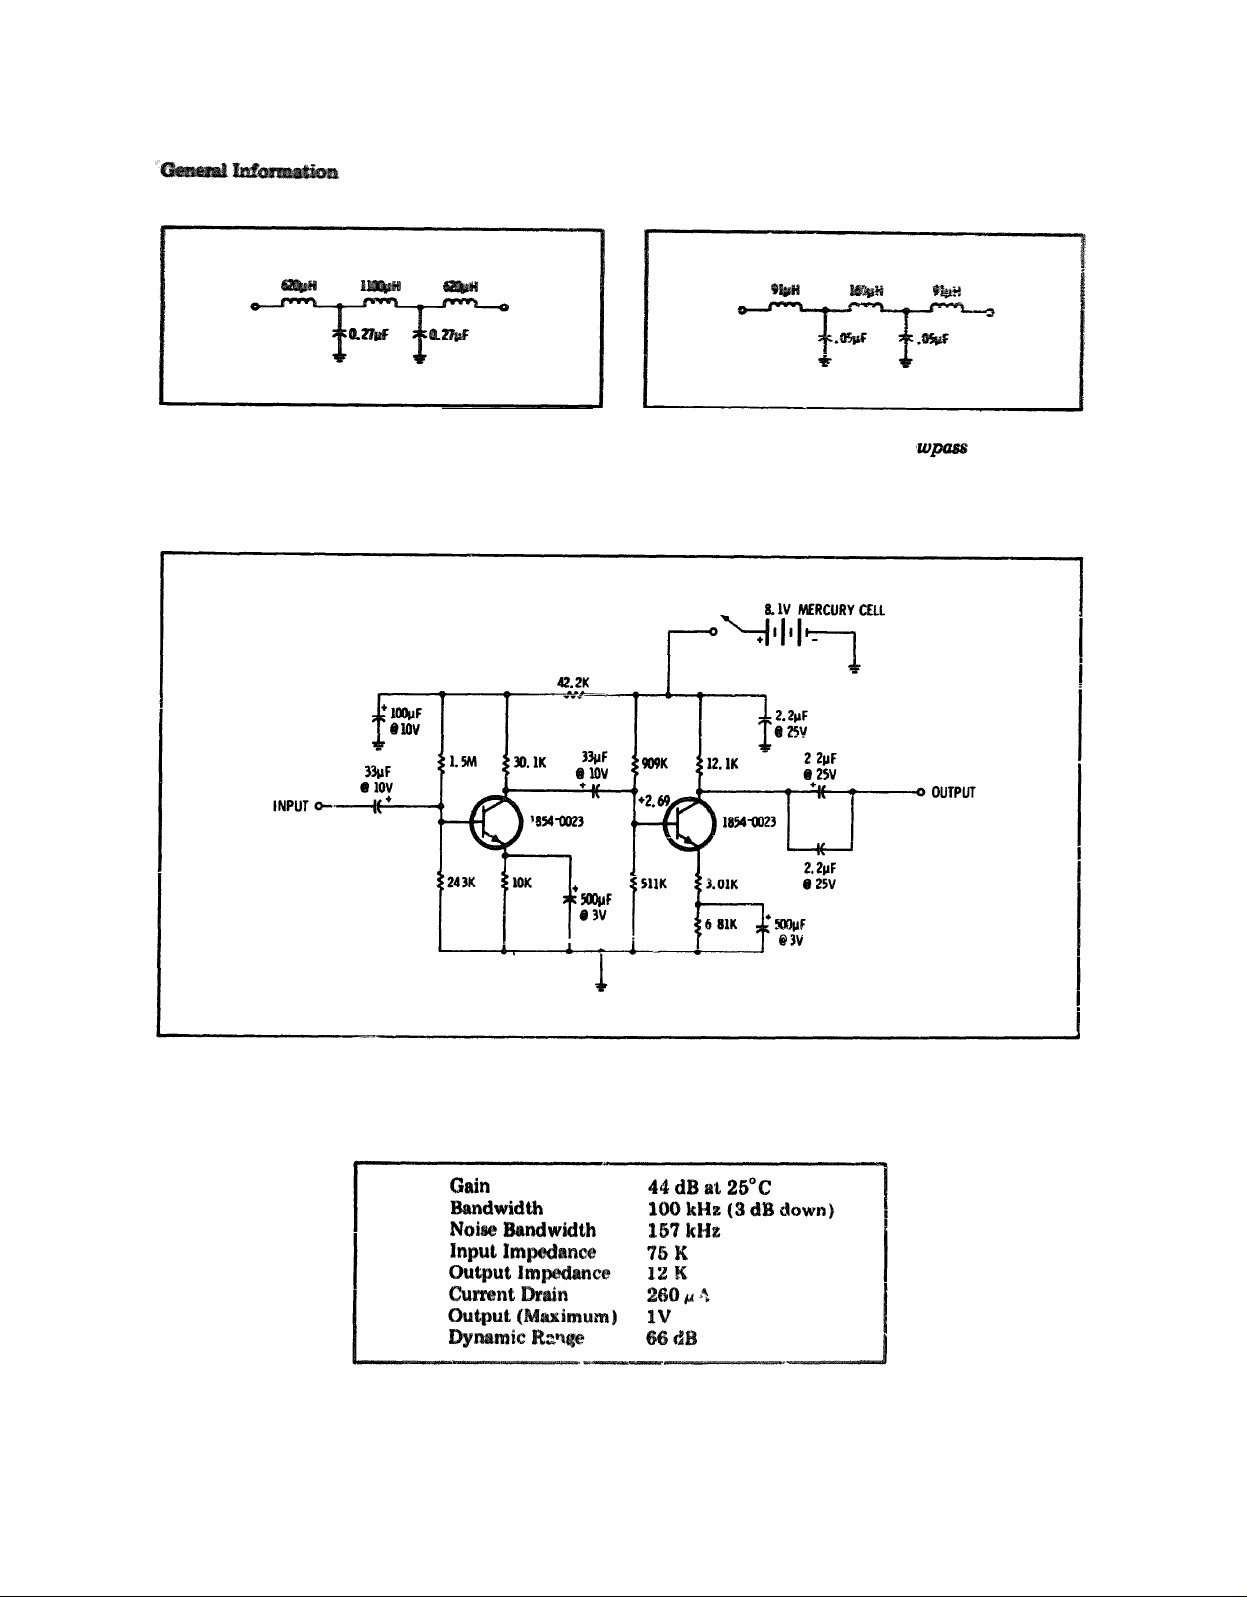
Figure 1-3.
15 kHz Lowpass Filter
Figure 1-4. 100 kHz Lo
Filter
1-6
Figure 1-5.
Table 1-3.
40 dB Amplifier
40 dB Amplifier Specifications
Page 13
Model 86601A
SECTION II
INSTALLATION
2-1.
2-2.
2-3.
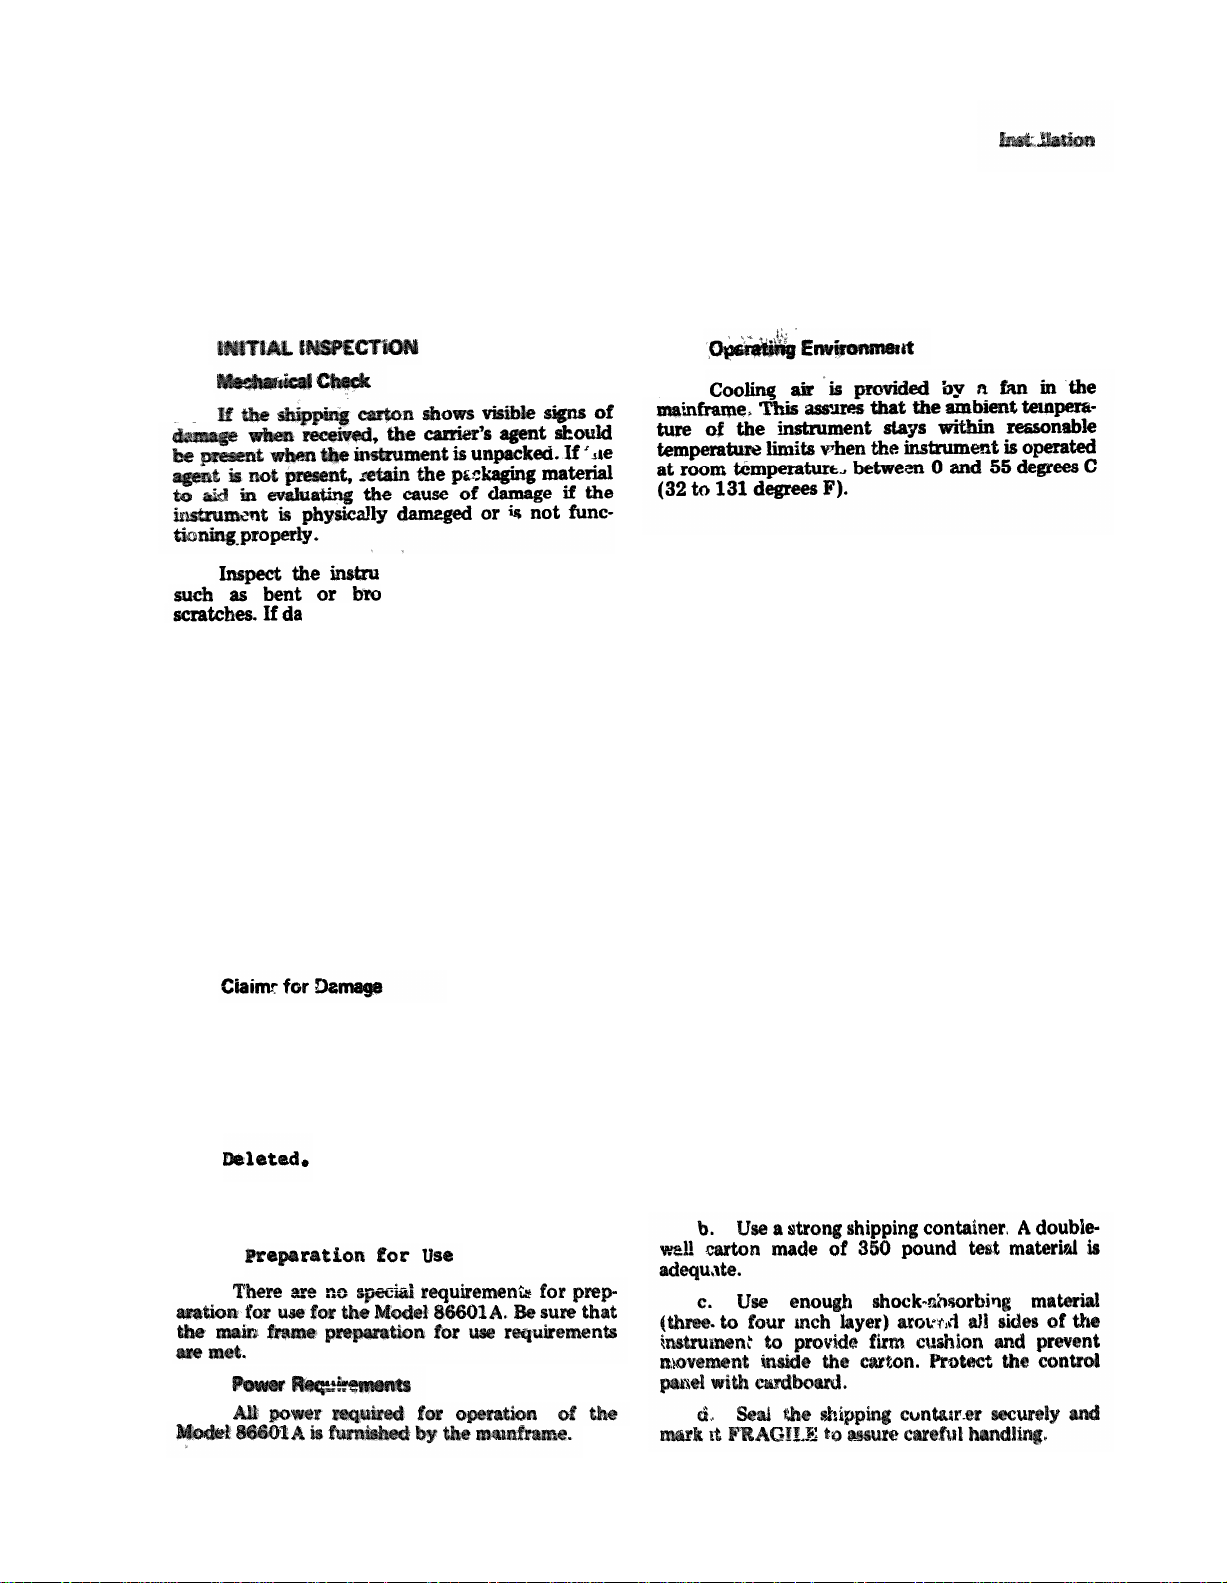
2-4.
ment for physical damage
ken parts and dents or
amage is found refer to paragraph 2-7
for recommended claim procedure. If the instrument appears to be free of damage, perform the
electrical check (see paragraph 2-5). The packaging
material should be retained for possible future use.
2-5. Electrical Check
2-6. The electrical performance check consists of
performing the performance test procedures in
Section IV of this manual. These procedures enable
the operator to determine that the instrument is,
or is not, operating within the specifications listed
in Table 1-1. The initial performance and accuracy
of the instrument are certified as stated on the
inside front cover of this manual. If the instrument
does not operate as specified, refer to paragraph
2-7 for the recommended claim procedure.
2-14.
2-15.
2-16. Storage and Shipment
2-17 If the instrument is to be stored for an
extended period of time it should be enclosed in a
clean sealed enclosure.
2-18. Original Packaging
2-19. The same containers and materials used in
factory packaging can be obtained through any
Hewlett-Packard Sales/Service office l
2-20. If the instrument is being returned to
Hewlett-Packard for service attach a tag indicating
the type of service required, return address, model
number and full serial number Also mark the
container FRAGILE to assure careful handling.
2-21. In any correspondence refer to the instrument by model number and full serial number.
2-7.
2-8. If physical damage is found when the instrument is unpacked, notify the carrier and the
nearest Hewlett-Packard Sales/Service office
immediately. The HP Sales/Service office will arrange for repair or replacement without waiting for
a claim to be settled with the carrier.
2-9.
2-10.
2-11.
2-12.
2-13.
2-22. Other Packaging Material
2-23. The following general instructions should be
followed when repackaging with commercially
available materials :
a. Wrap the instrument in heavy paper or
plastic. (If shipping to a Hewlett-Packard Service
office or center, attach a tag indicating the type of
service required, return address, model number and
full serial number.)
2-1
Page 14
Model 86601A
3-0
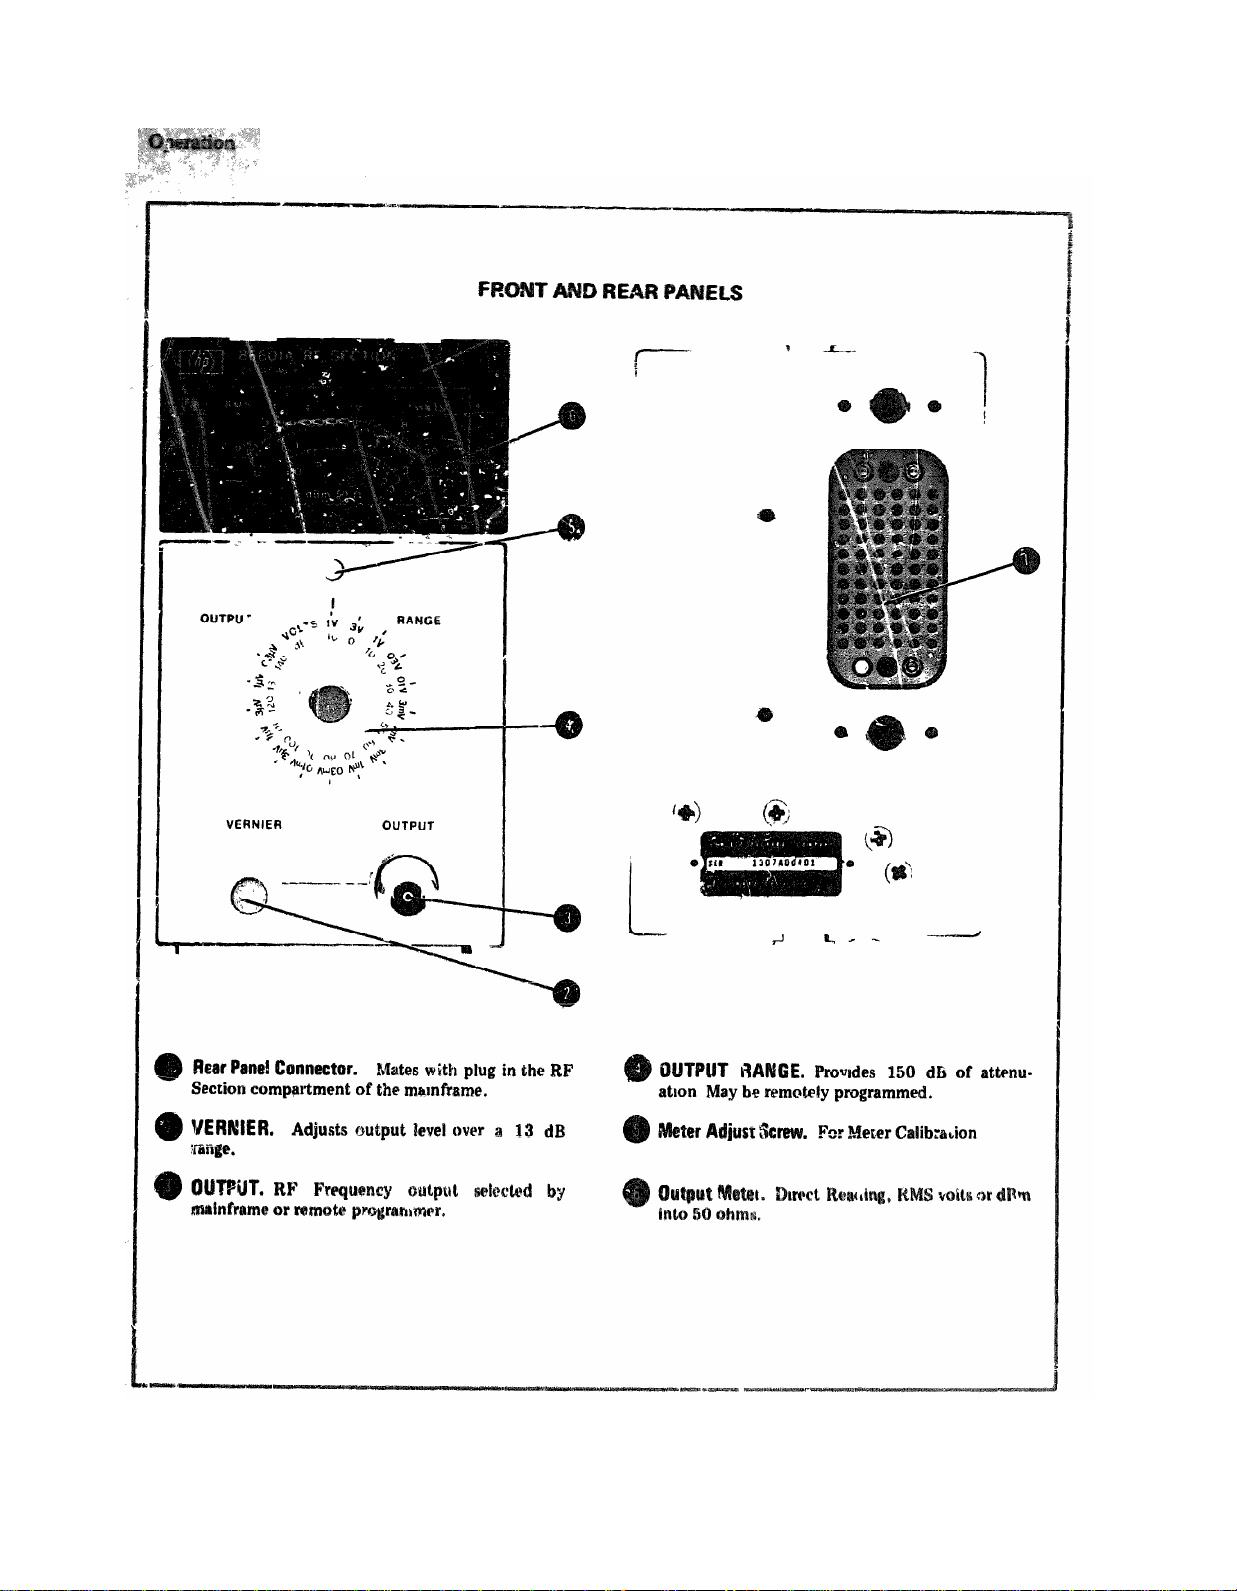
Figure 3-1. Front and Rear Panel Controls, Indicators and Connectors
Page 15
Model 86601A
SECTION III
OPERATION
3-1. INTRODUCTION
3-2.
3-3.
NOTE
If a modulation plug-in section is not used
it will be necessary to have the Model
86631A Auxiliary Section in place in the
modulation plug-in drawer.
3-4. PANEL FEATURES
3-5. Front and rear panel controls, indicators and
connectors of the Model 86601A are shown in
Figure 3-1.
3-6. OPERATING PRINCIPLES
3-7. The Model 86601A may be operated by front
panel controls in the local mode or externally
programmed in the remote mode.
NOTE
The remote mode is selected by the exter-
nal programming device which places a
ground on pin 5 of the blue ribbon con-
nector (J3) on the rear panel of the Model
3-8.
3-9. The front panel attenuator controls are inhibited when the instrument is operated in the
remote mode.
NOTE
Model 86601A Option 001 instruments
do not include the 150 dB (10 dB steps)
programmable attenuator.
3-10. In Option 001 instrumen
Model 86601A may be adjus
from +13 to 0 dBm by means
control; in the remote mode the output may be
reduced by 9 dB in 1 dB steps.
3-11. OPERATOR’S CHECKS
3-12. During checkout at the factory the Model
86601A RF Section if adjusted for proper operation. No adjustment should be required when the
instrument is received.
3-13. The Operator’s Checks specified in Section
III of the mainframe are adequate for checking the
output frequency of the Model 86601A.
3-14. If
a plug-in Modulation Section is being
used, the checks specified in Section III of the
Modulation Section Manual should also be performed.
3-1/3-2
Page 16
Model 86601A
SECTION IV
PERFORMANCE TESTS
4-1. INTRODUCTION
4-2. This section instructions for performance testing the Model
86601A RF Section
plug-in. it is assumed in all tests that the Model
86601A is interconnected with a mainframe that is
known to be functioning properly.
4-3. Purpose.
4-4. The performance test procedures are used to
check instrument performance for incoming
inspection and periodic evaluation. The tests are
designed to verify published specifications for the
instrument. Each test applies directly to a listed
specification (see Table l-l).
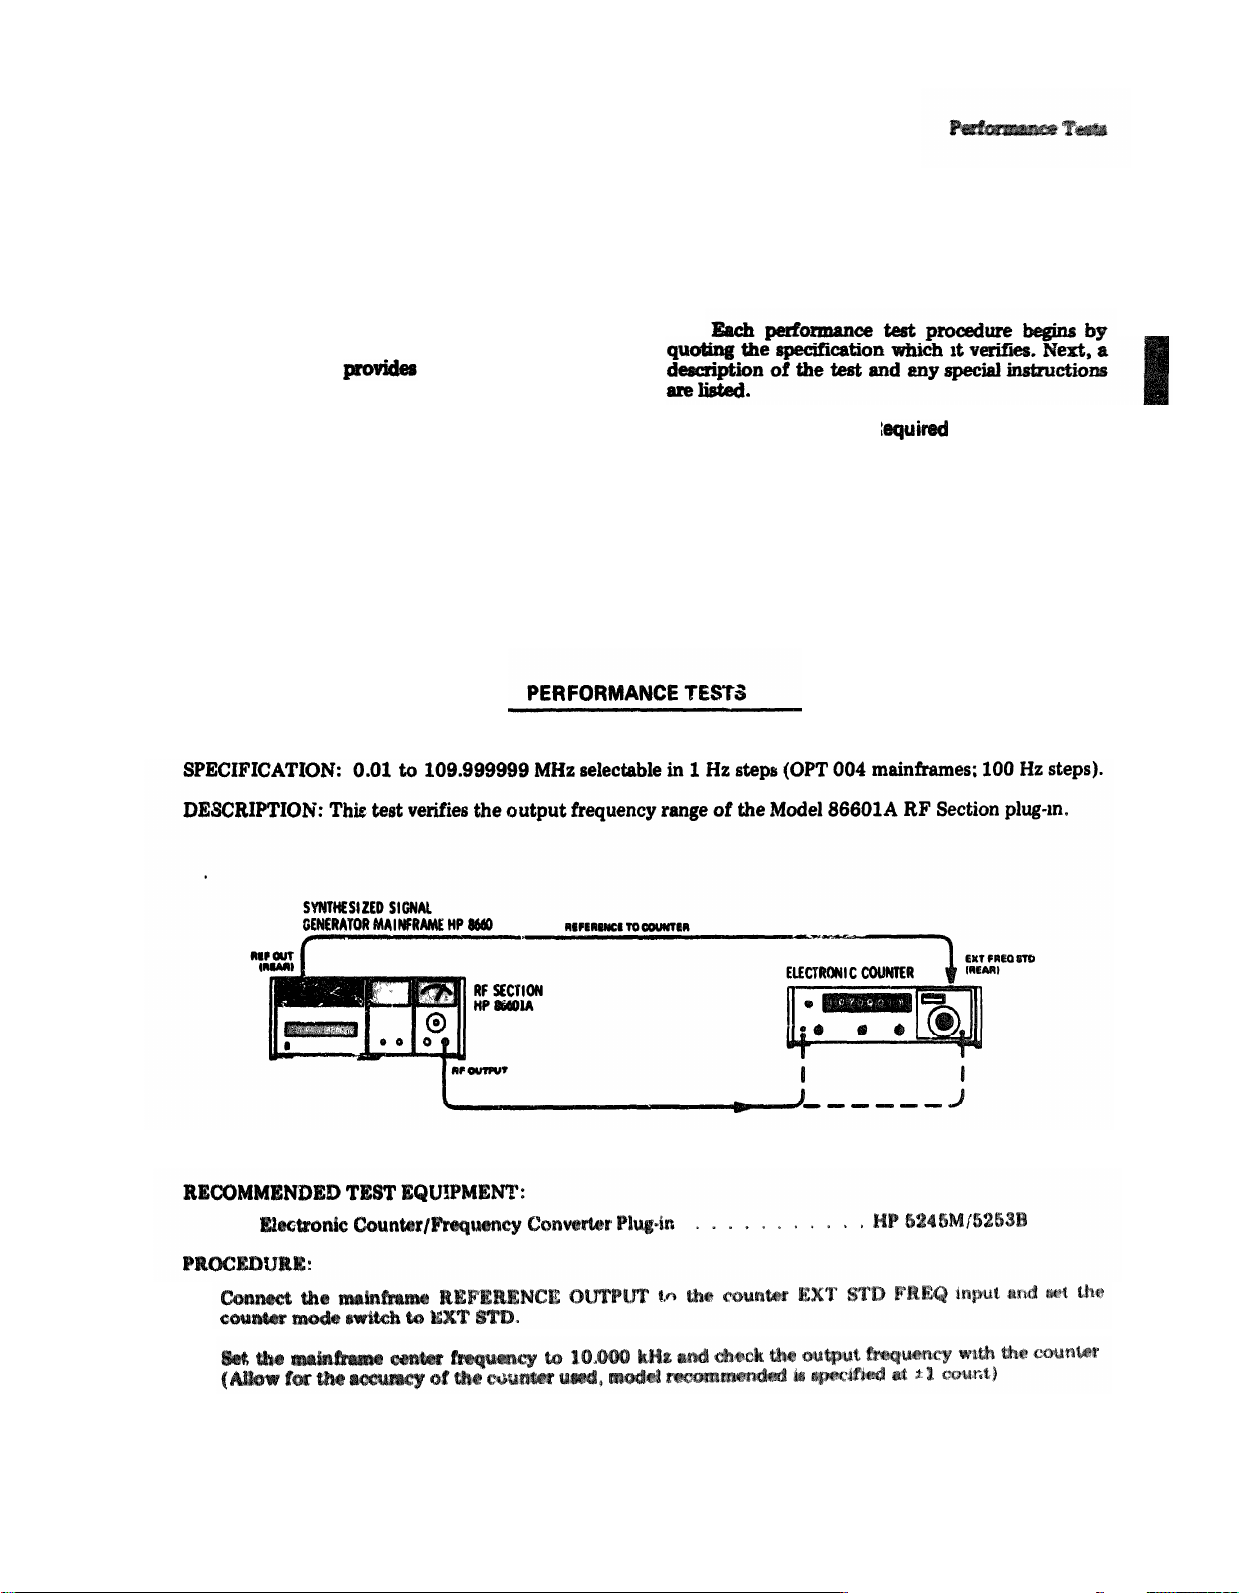
4-9. FREQUENCY RANGE
4-5.
4-6. Test Equipment
ment required for
R
The test equip-
performance testing is listed in
Table 1-2 and in the individual tests. Test instruments other than those listed may be used providing their performance equals or exceeds the specifications listed in Table 1-2.
4-7. Front Panel Checks and Adjustments. Refer
to paragraph 3-11, Operator’s Checks.
4-8. PERFORMANCE TESTS
1.
2.
Figure 4-1. Frequency Range and Accuracy Test Setup
4-1
Page 17

4-9.
3.
4-10.
4-11.
Model 86601A
PERFORMANCE TESTS
1.
2.
4-2
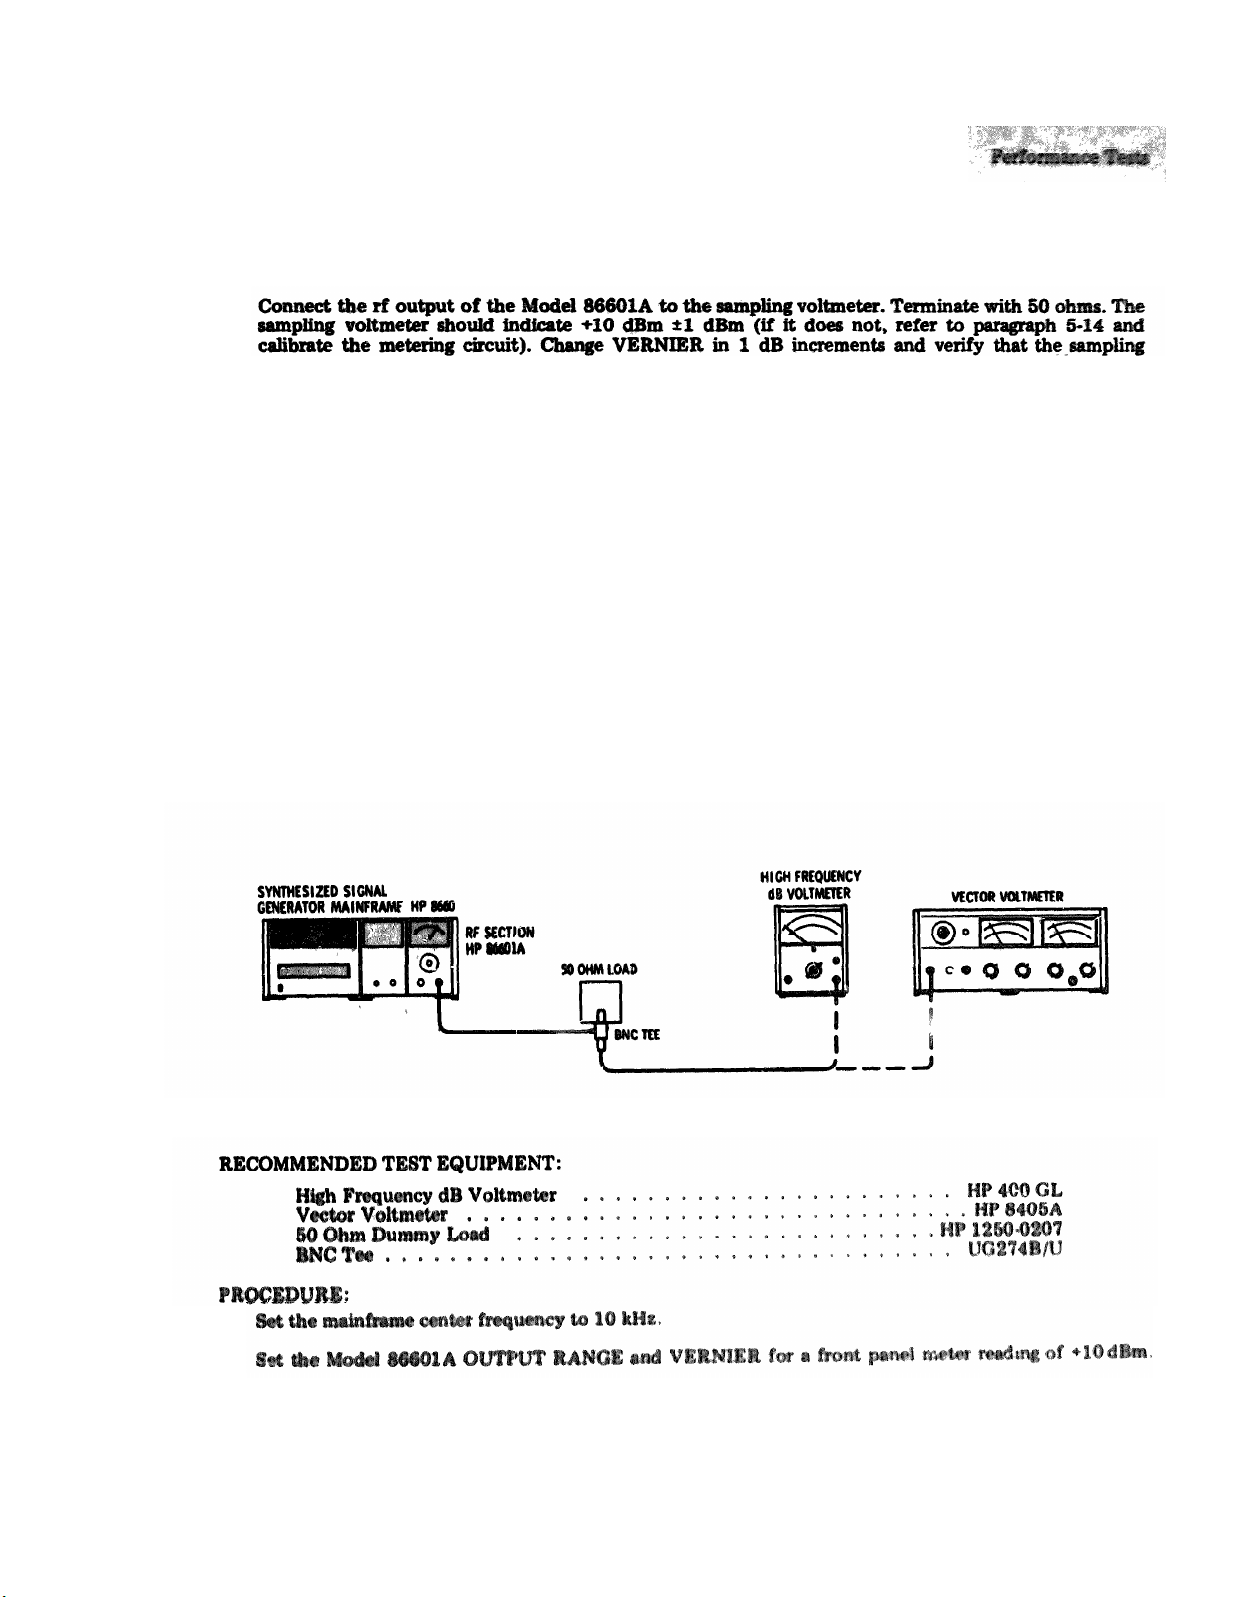
Figure 4-2. Output Accuracy and Level Test Setup
Page 18
Model 86601A
PERFORMANCE TESTS
4-11. OUTPUT ACCURACY AND LEVEL (cont'd)
3.
voltmeter indicates the correct level ±1 dB. Disconnect the sampling voltmeter.
4. Set the external attenuator to SO dB and connect it between the Model 86601A OUTPUT and the
Spectrum Analyzer RF INPUT. Set the Model 86601A output level to +10 dBm.
5. Set a convenient reference level on the Spectrum Analyzer with the vertical scale (LOG 2 dB/Div).
6. Change the external attenuator to 70 dB and the Model 86601A OUTPUT RANGE to 0 dBm. The
Spectrum Analyzer display should be within ± 1 dB of the established reference level.
7.
Continue decreasing the attenuation of the external attenuator and the Model 86601A OUTPUT
RANGE in 10 dB steps until the OUTPUT RANGE is set to
set to 0 dB. The spectrum Analyzer display should
remain within ±1 dB for levels down to --70 dBm.
-70 dBm and the external attenuator is
These tests assure the specification of ±2 dB from -67 dBm to -146 dBm.
4-12. OUTPUT FLATNESS
SPECIFICATION: Output flatness: Output level variations with frequency <± 0.5 dBm across the
frequency range.
DESCRIPTION:
1.
2.
This test verifies flatness of the output signal from 10 kHz to 109.9 MHz.
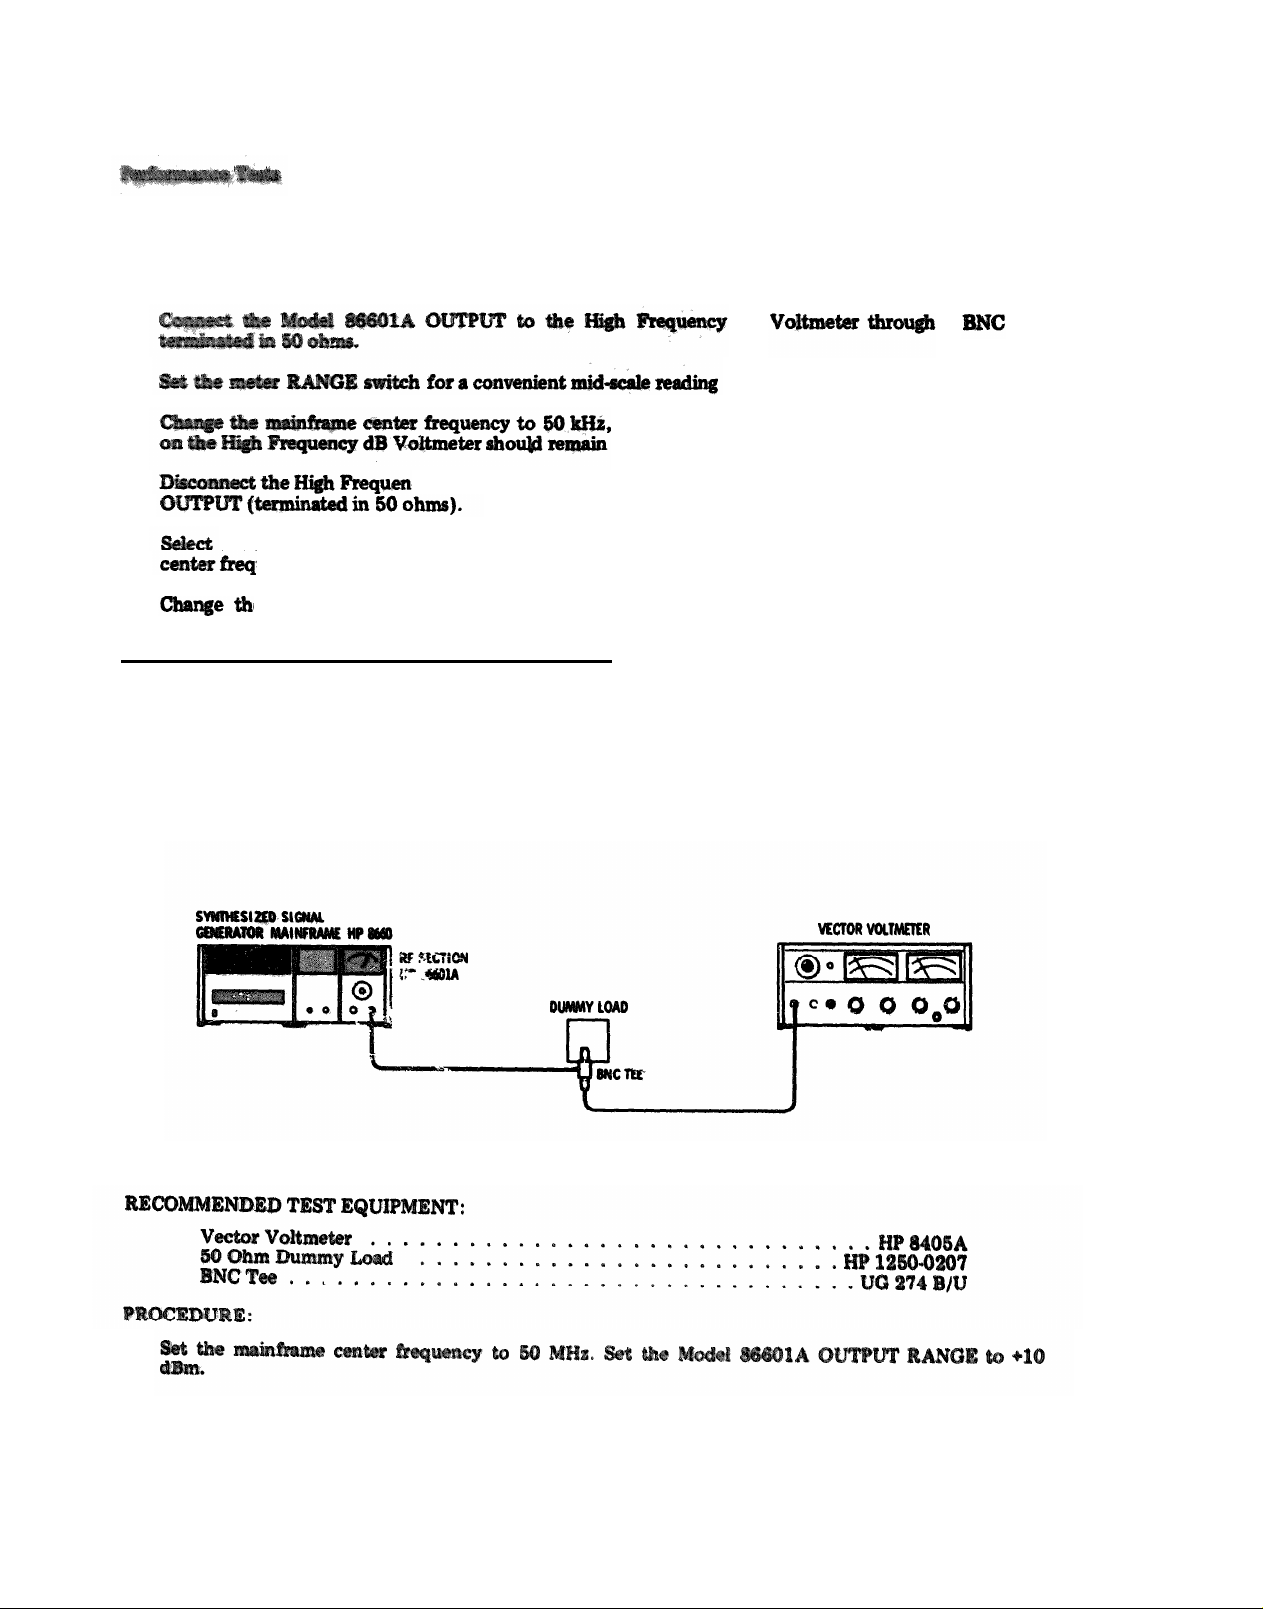
Figure 4-3. Output Flatness Test Setup
4-3
Page 19
4-12. OUTPUT FLATNESS (con'd)
Model 86601A
PERFORMANCE TESTS
3.
4.
5.
then 100 kHz, and finally 500 kHz. The level read
dB
a Tee
on the High Frequency dB voltmeter.
within a ±0.5 dB window.
6.
7.
a Vector Voltmeter range that will provide a convenient mid-scale reference with the mainframe
cy dB Voltmeter and connect the Vector Voltmeter to the Model 86601A
uency set to 1 MHz.
8.
e mainframe center frequency to 10 MHz, then 50 MHz, and finally 109.9 MHz. The
reference level indicated on the Vector Voltmeter should remain within the ±0.5 dB window.
4-13. IMPEDANCE: 50 OHMS
SPECIFICATION: SWR less than 2:1 on +10 dBm output range; less than 1.3:1 on 0 dBm output range
and below.
DESCRIPTION: The Model 86601A RF OUTPUT is measured with a voltmeter, first with no external
load, then with a 50 ohm external dummy load. The source resistance RS is determined and the SWR is
calculated by dividing RO by RS (or RS by RO if RO is < RS).
1.
4-4
Figure 4-4. Impedance Test Setup
Page 20
Model 86601A
4-13. IMPEDANCE: 50 OHMS (cont'd)
2.
3. Record the RF output level.
4. Terminate the BNC Tee 50 ohms.
PERFORMANCE TESTS
V
OC
mVrms
5. Record the RF output level.
V
6. The Model 86601A source resistance is found by using the following formula:
Ro V
RS =
V
oc -R
1
O
VOC = 1st measurement (step 3)
V1 = 2nd measurement (step 5)
RO = 50 ohm termination
7. Determine SWR. SWR =
RO or RS. SWR should be < 2.0:1.
R
S
R
O
8. Record SWR
9. Reduce the Model 86601A OUTPUT RANGE to 0 dBm.
10. Repeat steps 2 through 8 at 0 dBm. SWR should be < 1.3:1.
11. Record SWR
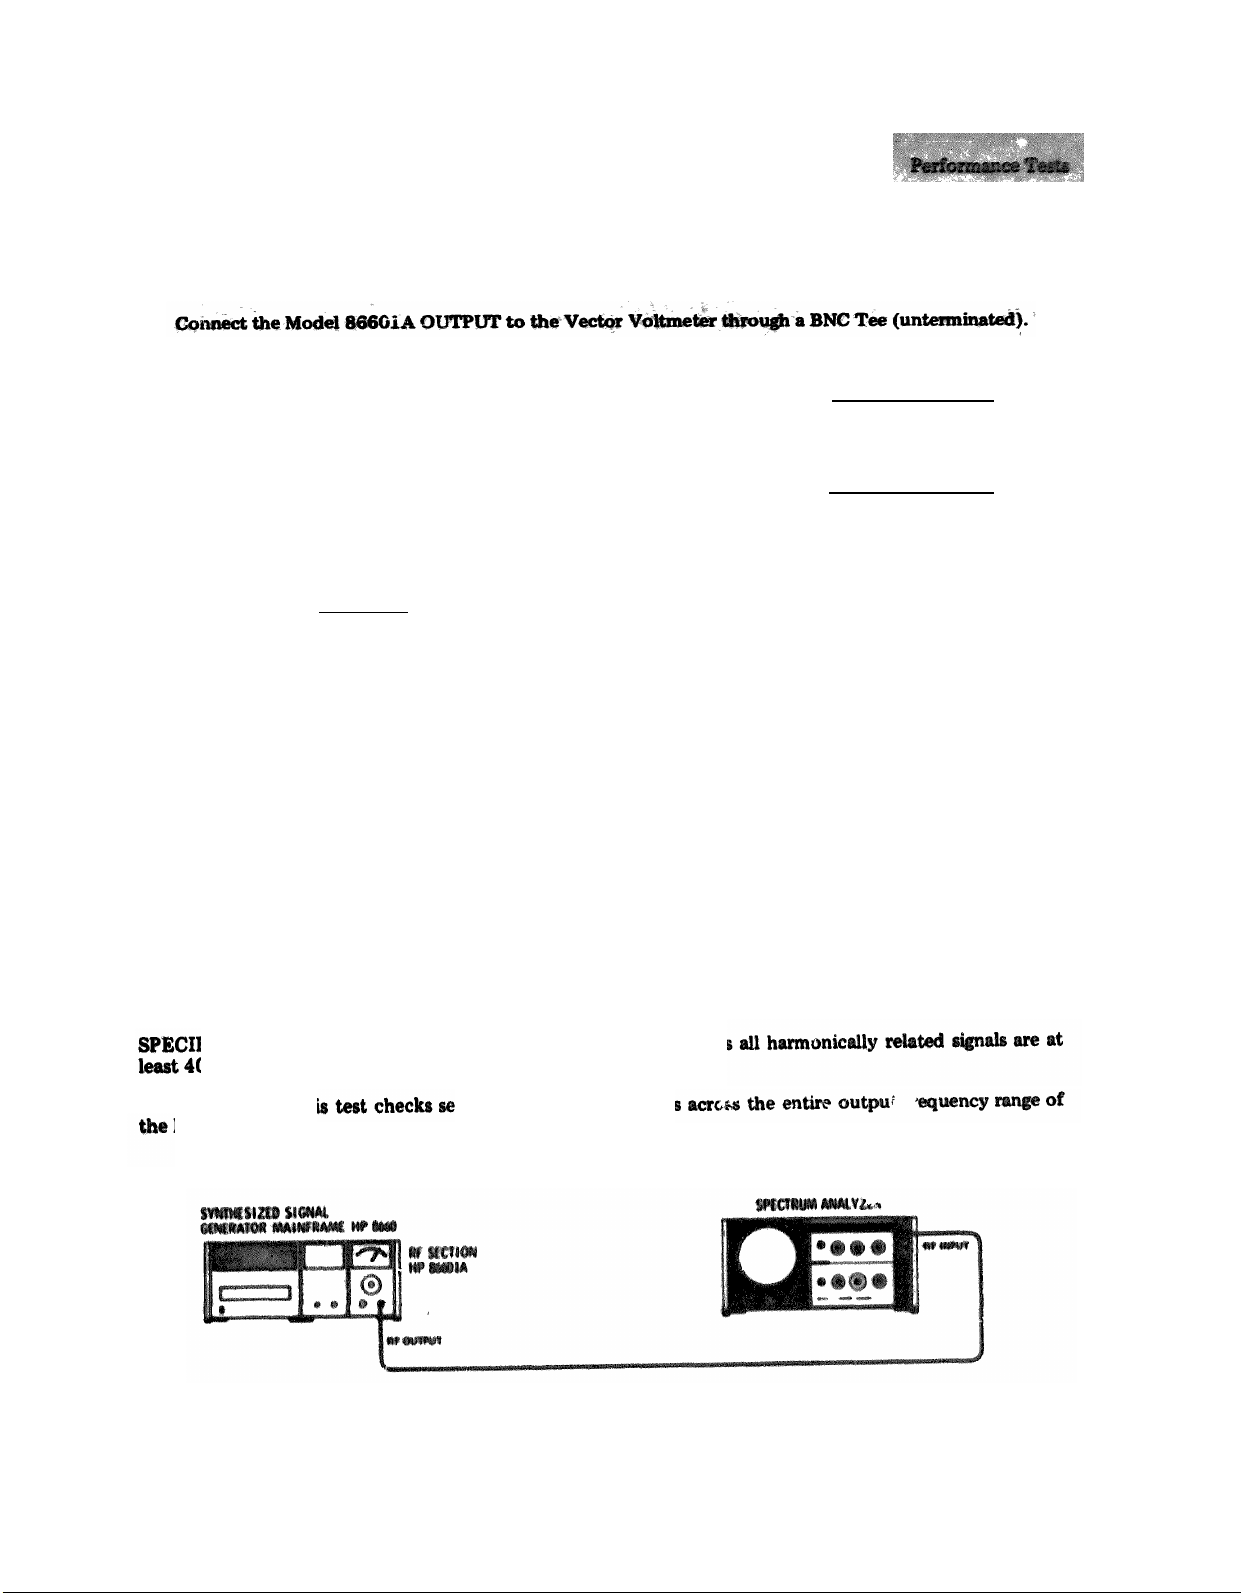
4-14. HARMONIC SIGNALS
FICATION:
With the Model 86601A terminated in 50 ohm
0 dB below the selected frequency.
1
mVrms
DESCRIPTION: Th
Model 86601A.
cond and third harmonic
Figure 4-5. Harmonic Signal Test Setup
4-5
Page 21
4-14.
Model 86601A
PERFORMANCE TESTS
HP 8554L/8552B/140S
1.
2.
1A OUTPUT RANGE to -10 dBm and set the VERNIER control to +3 dBm.
odel 8660A OUTPUT to the Spectrum Analyzer RF INPUT and set the Spectrum
INPUT ATTENUATION to 20 dB.
3.
third harmonics at the following center frequencies: 10 kHz, 400 kHz, 4 MHz, 10
MHz.All harmonic signals should be more than 40 dB below the level of the
SPURIOUS SIGNALS
4-15.
SPECIFICATION: All nonharmonically related spurious signals are at least 80 dB below the selected
output
signal. Power line related spurious signals are at least 70 dB below the carrier.
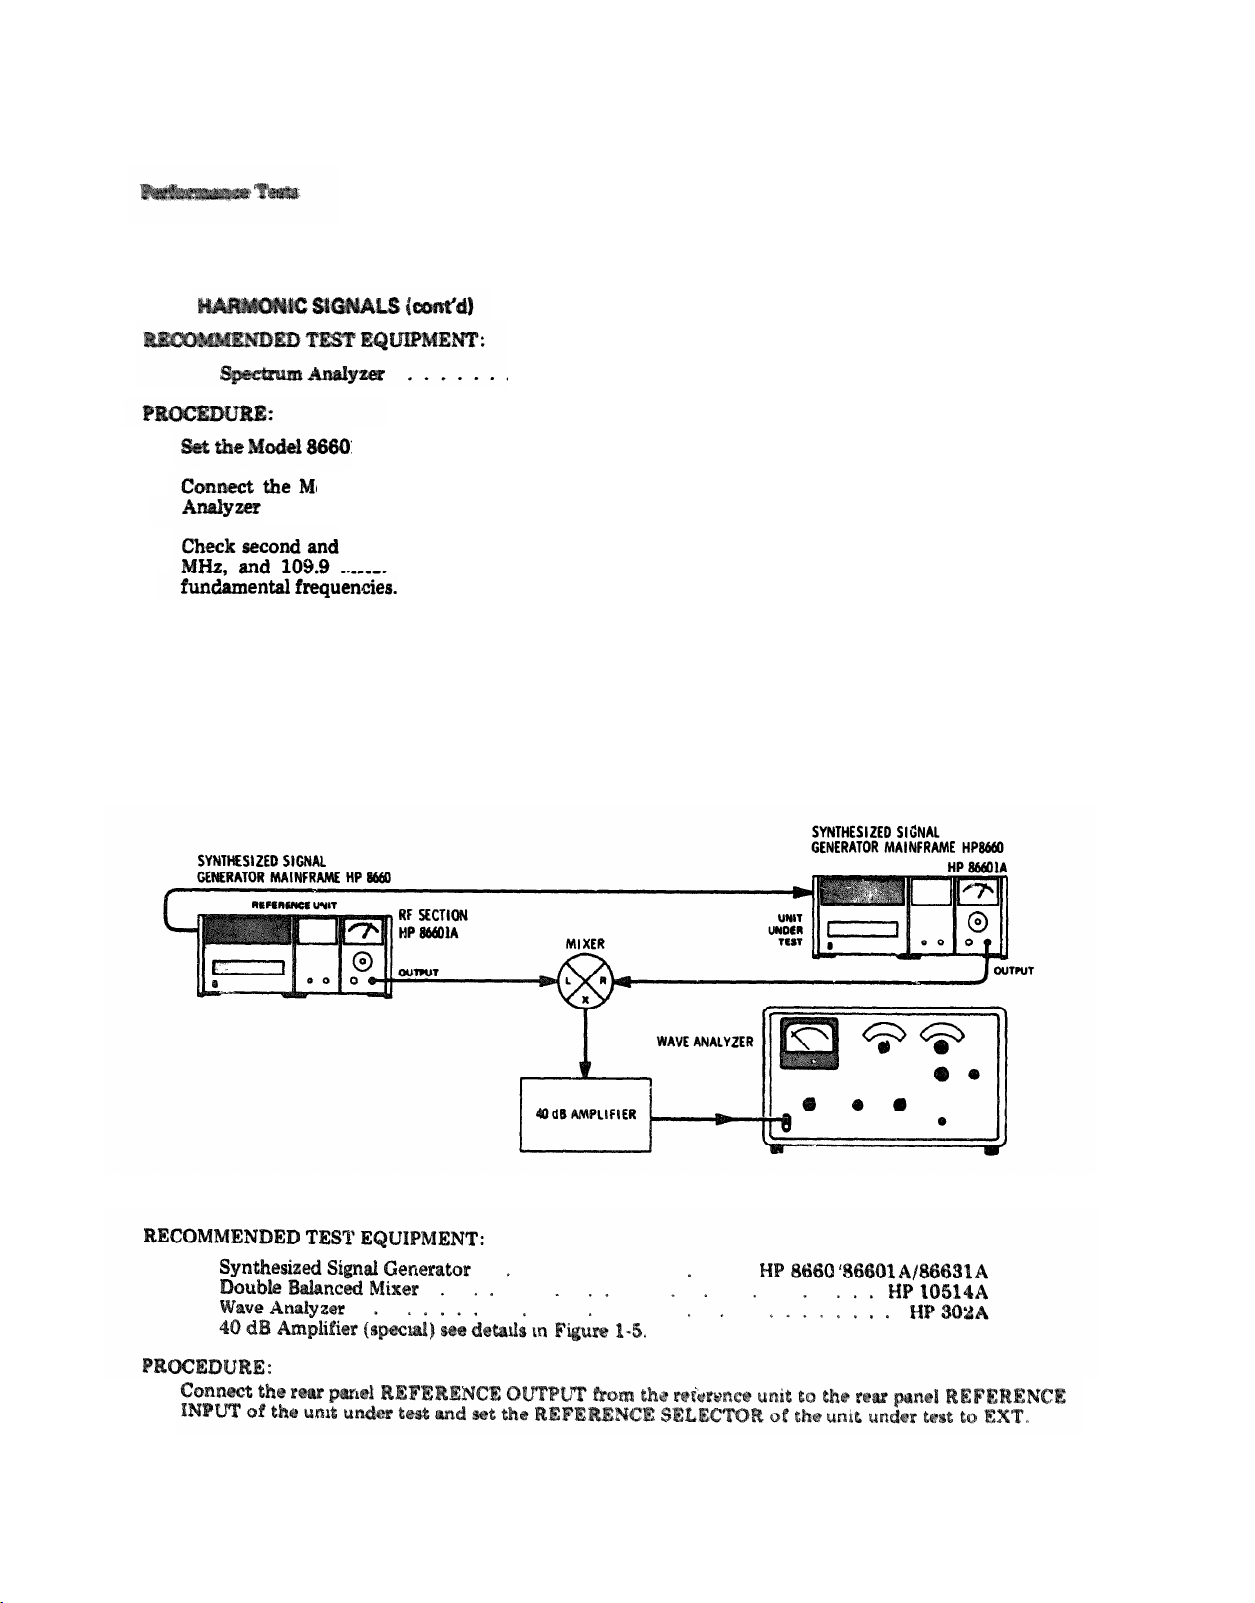
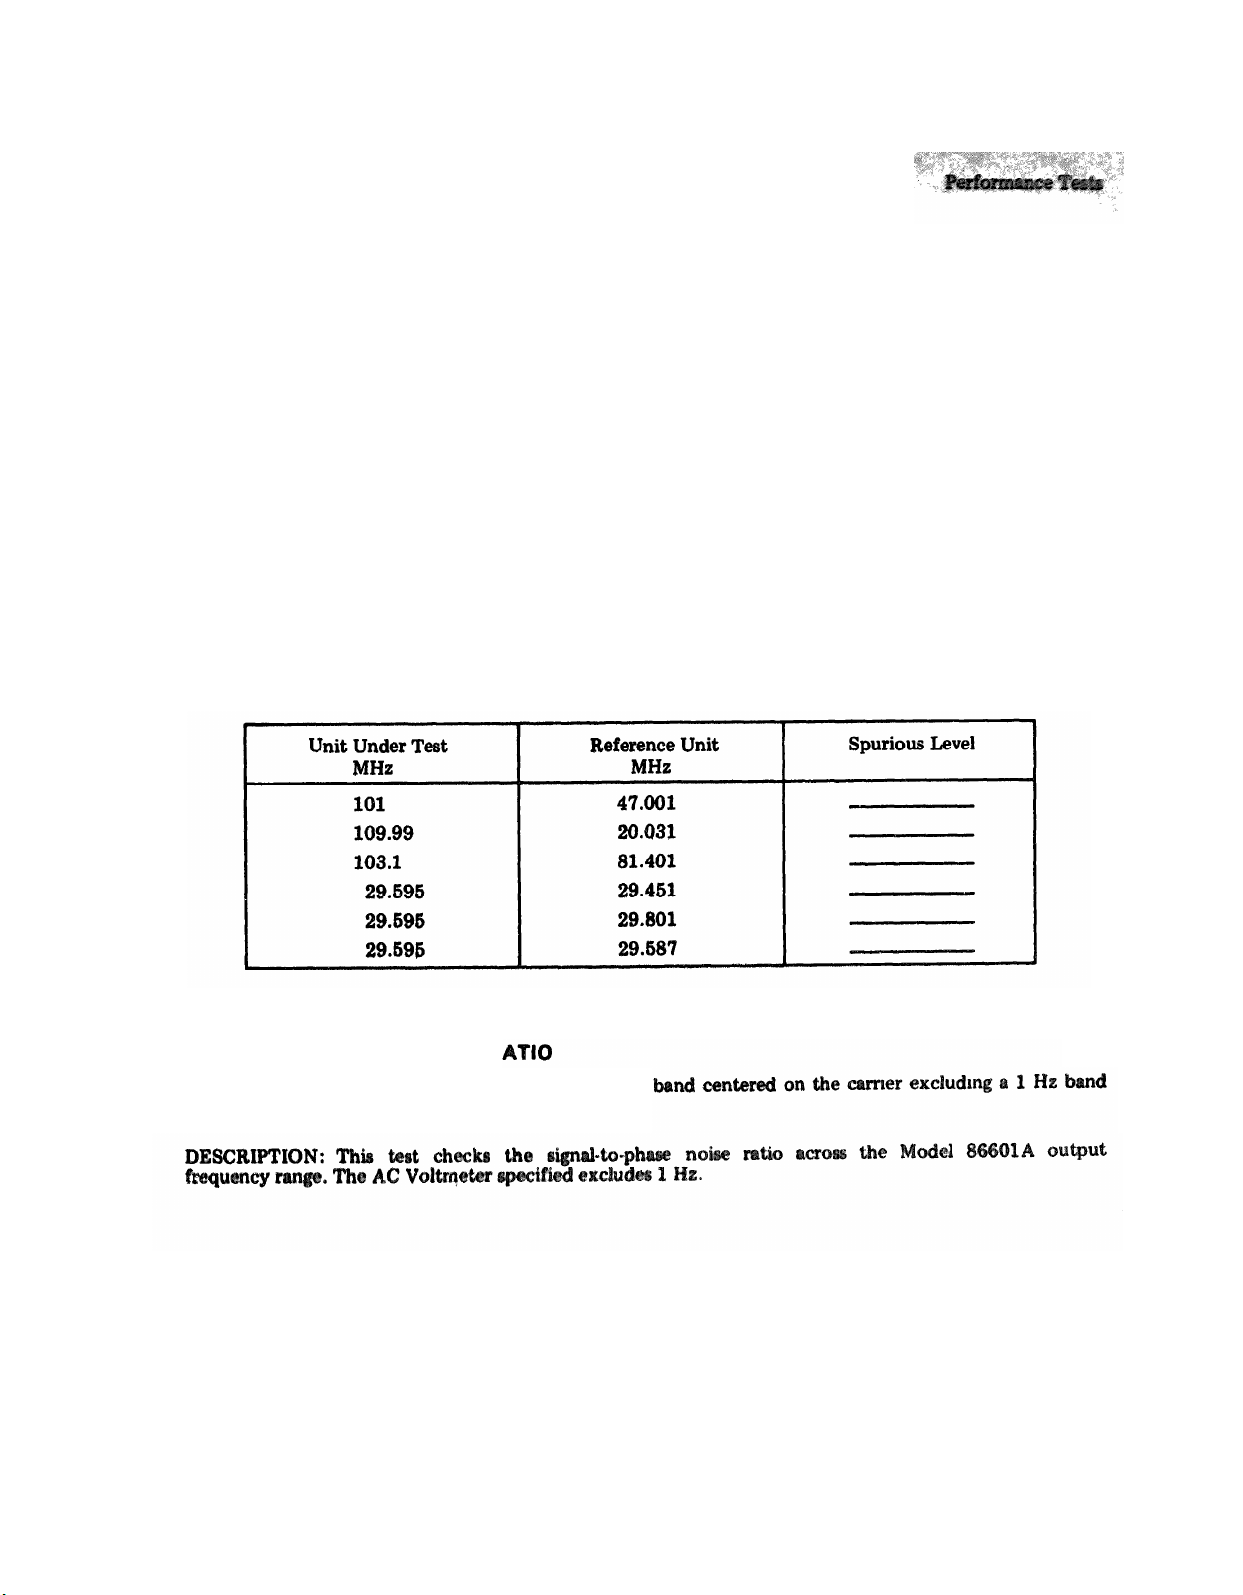
DESCRIPTION: This test checks for common spurious signals by mixing the signal from the unit under
test with a reference signal offset by 1 kHz. The Wave Analyzer measures common spurious signals
generated in the unit under test.
1.
4-6
Figure 4-6. Spurious Signal Test Setup
Page 22
Model 86601A
PERFORMANCE TESTS
4-15. SPURIOUS SIGNALS (cont’d)
2. Connect the equipment as shown in Figure 4-6.
3. Set the reference unit center frequency to 50.001 MHz and the output level to +13 dBm.
4. Set the center frequency of the unit under test to 50 MHz and the output level to -87 dBm.
5. Set the Wave Analyze; mode switch to NORMAL and scale value to RELATIVE.
6. Set the wave Analyzer to 1 kHz and adjust levels for a 0 dB reading on the scale.
7. Set the unit under test OUTPUT RANGE and VERNIER to -7 dBm.
8. Set the reference unit and the unit under test as shown in Table 4-1 and note that spurious levels are
lower than -80 dB (0 dB on Wave Analyzer scale).
9. Corrected reading is
-80 dB minus the Wave Analyzer meter reading.
Table 4-1. Spurious Signal Checks
4-16. SIGNAL-TO-PHASE NOISE R
SPECIFICATION: Lower than -50 dB in a 30 kHz
centered on the carrier.
4-7
Page 23
4-10. SIGNAL-TO-PHASE NOISE RATIO
Model 86601A
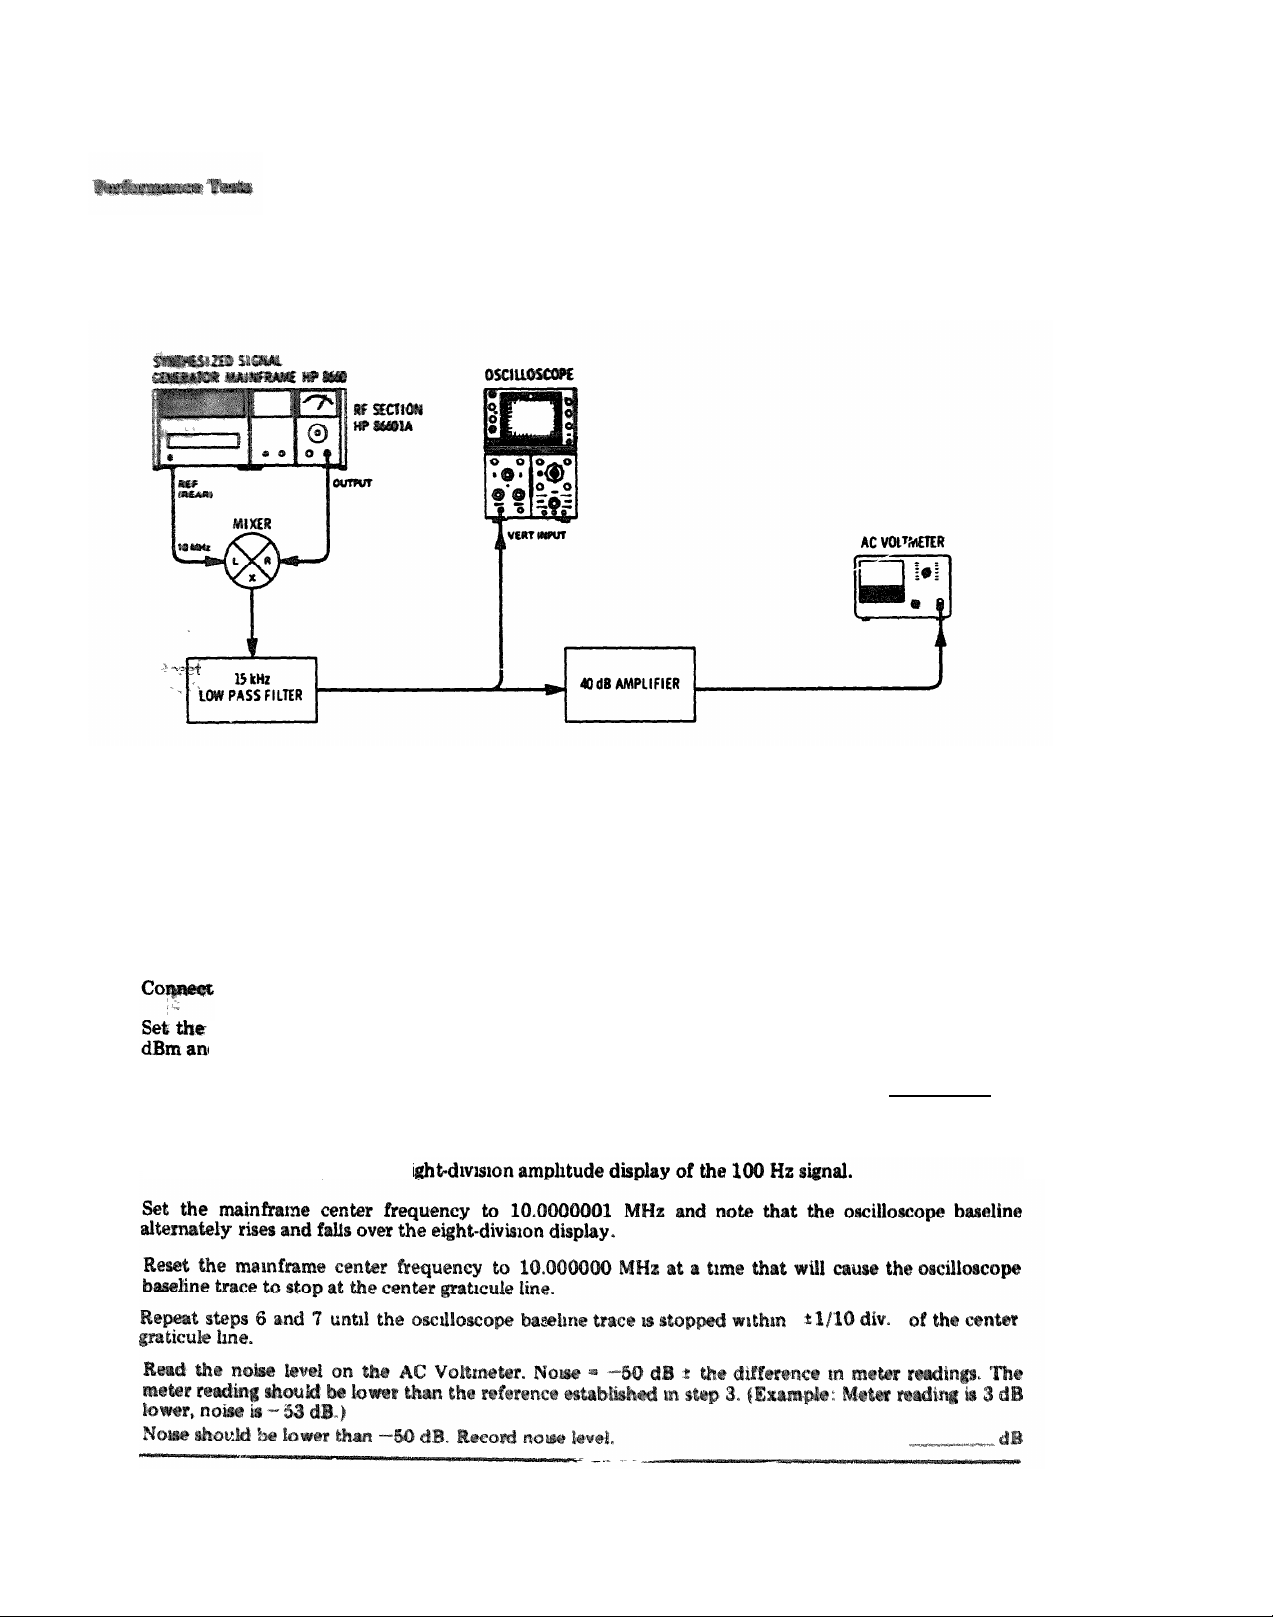
Figure 4-7. Signal-to-Phase Noise Test Setup
RECOMMENDED TEST EQUIPMENT:
Oscilloscope HP 180A/1801A/1821A
Double Balanced Mixer HP 10514A
AC Voltmeter HP 403A
40 dB Amplifier (special) see details in Figure 1-5.
Low Pass Filter (special) see details in Figure 1-3.
PROCEDURE:
1.
2.
the equipment as shown in Figure 4-7.
mainframe center frequency to 10.001 MHz. Set the Model 86601A OUTPUT RANGE to -60
d the VERNIER for a meter reading of +3 dBm.
3.
Set the RF Voltmeter Function Switch to 1 CPS-1 MC and record the reading.
4.
Set the mainframe center frequency to 10.000100 MHz and the OUTPUT RANGE to -10 dBm.
5.
Adjust the oscilloscope for an ei
6.
7.
8.
dB
9.
10.
4-8
Page 24
Model 86601A
PERFORMANCE TESTS
4-17. SIGNAL-TO
OISE RATIO
SPECIFICATION: Lower than -70 dB in a 30 kHz hand centered on the carrier excluding a 1 Hz
bandwidth centered on the carrier.
DESCRIPTION: This test checks AM noise across the Model 86601A frequency range. The AC voltmeter
specified excludes 1 Hz.
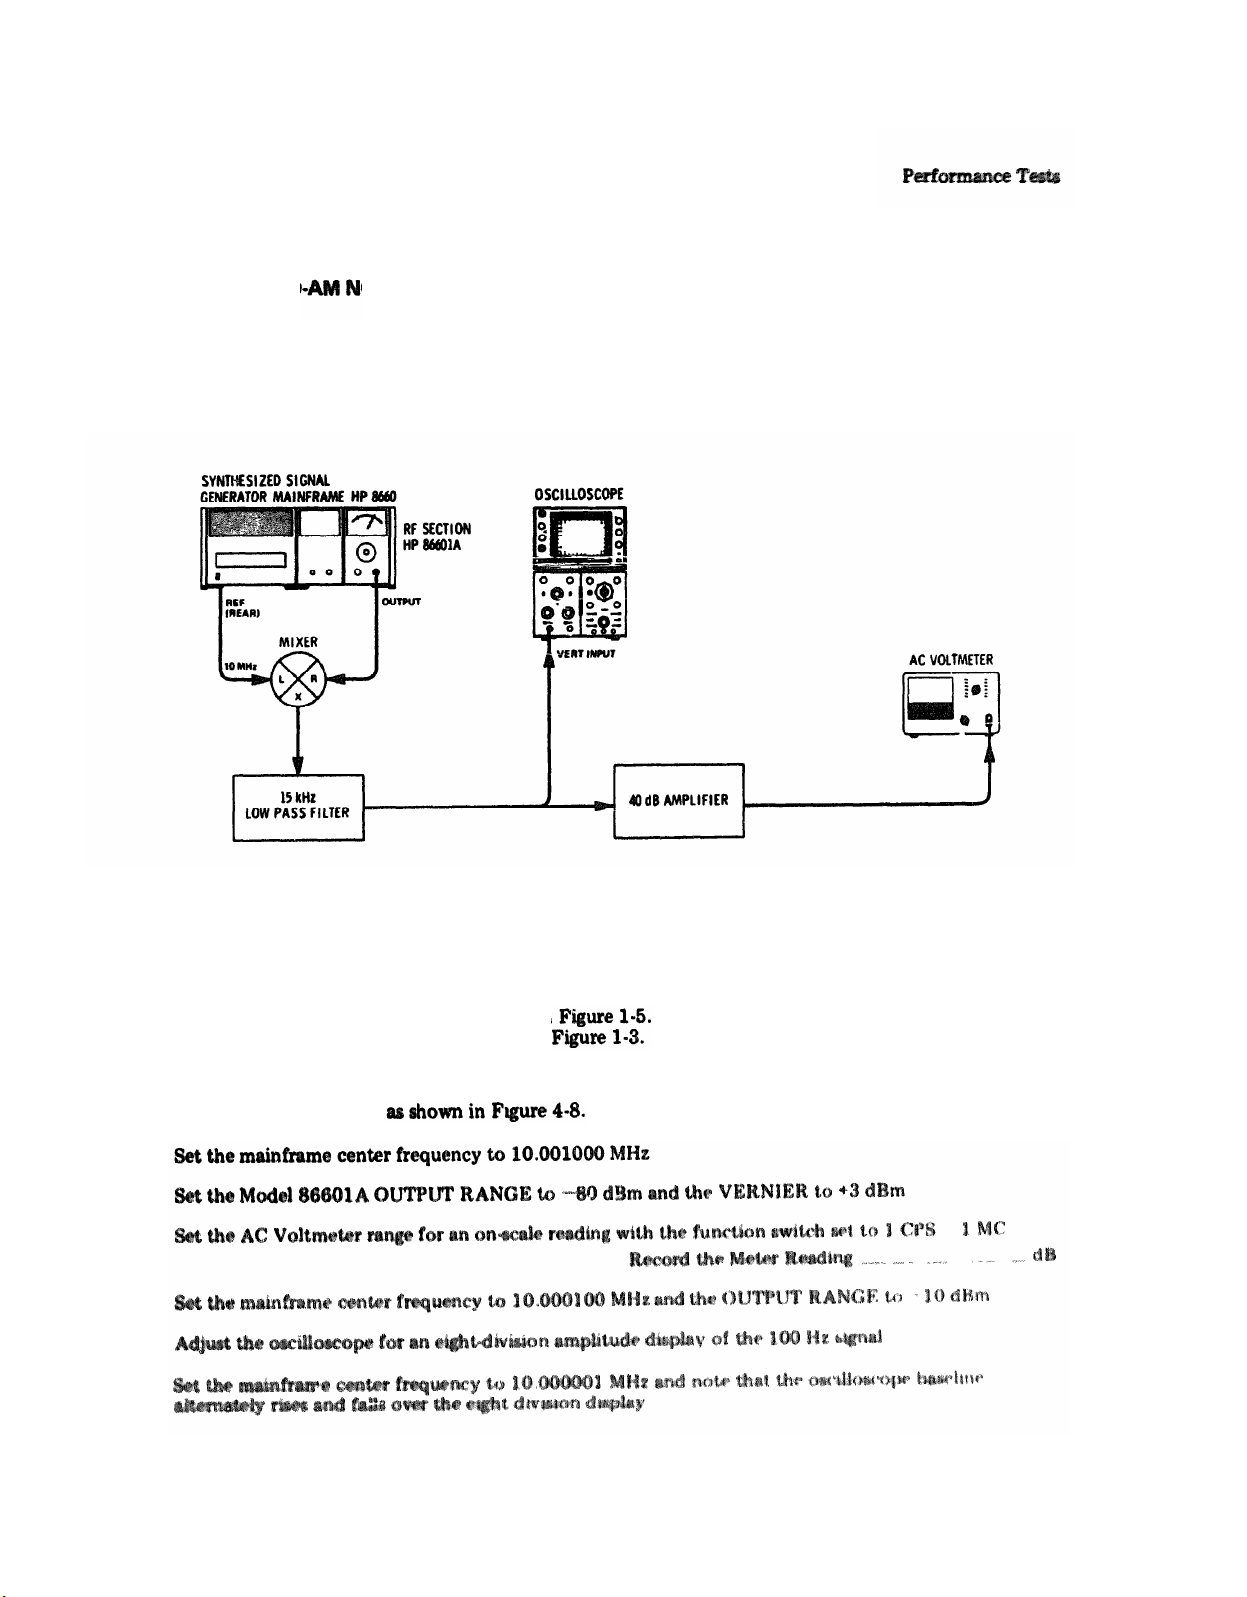
Figure 4-8. Signal-to-AM Noise Ratio Test Setup
RECOMMENDED TEST EQUIPMENT
Oscilloscope
Double Balanced Mixer HP10514A
AC Voltmeter
40 dB Amplifier (special); see details in
Low Pass Filter (special); see details in
PROCEDURE:
1.
Connect the equipment
2.
3.
4.
5.
6.
7.
HP 180A/1801A/1821A
HP 403A
4-9
Page 25
PERFORMANCE TESTS
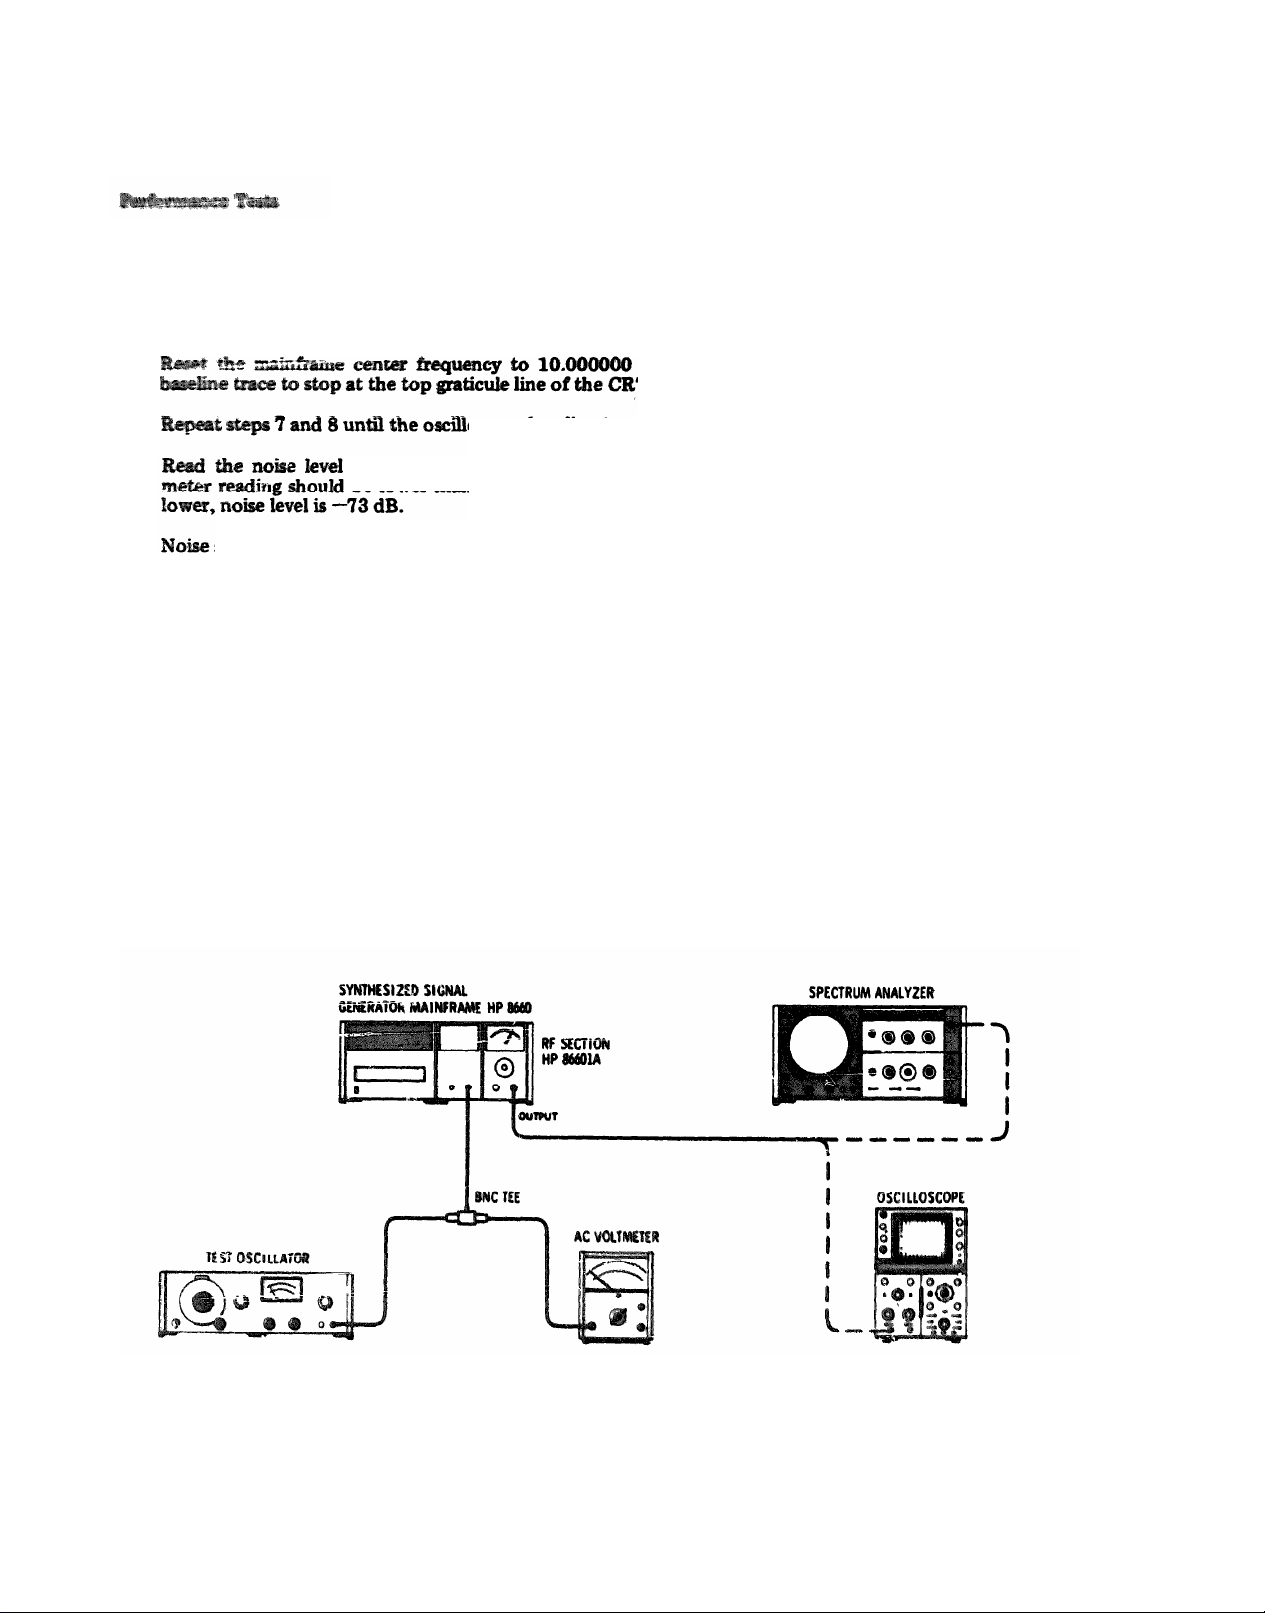
4-17. SIGNAL-TO-AM NOISE RATION (cont'd)
Model 86601A
8.
MHz at a time that will cause the oscilloscope
T.
9.
10.
11.
on the AC Voltmeter. Noise =
lower than the reference established in step 4. Example: Meter reading is 3 dB
be
should be lower than -70 dB.
oscope baseline trace is stopped at the top graticule line ±1/10 div.
-70 dB ± the difference in meter readings. The
Record Noise Level
4-18. RESIDUAL FM
SPECIFICATION: <1 Hz rms in 2 kHz bandwidth centered on the carrier.
DESCRIPTION: Residual FM is checked indirectly in the checks for signal-to-phase noise across the Model
86601A frequency range.
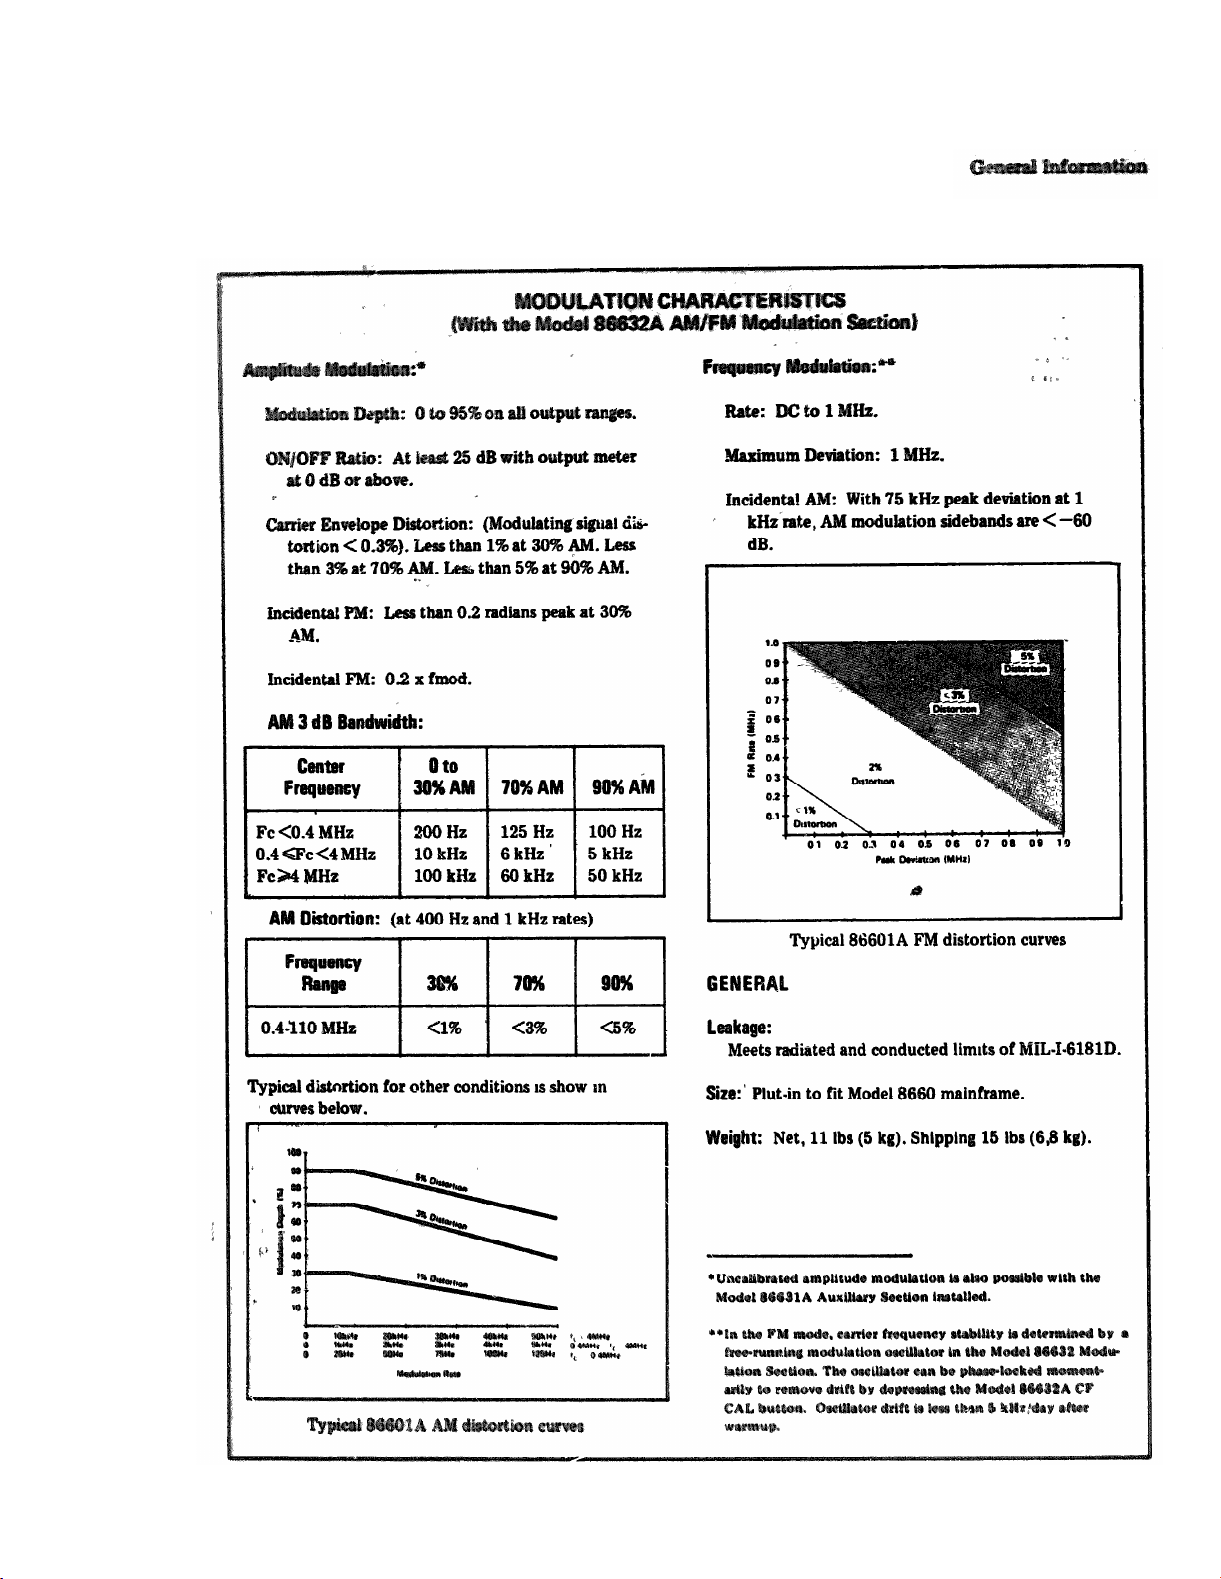
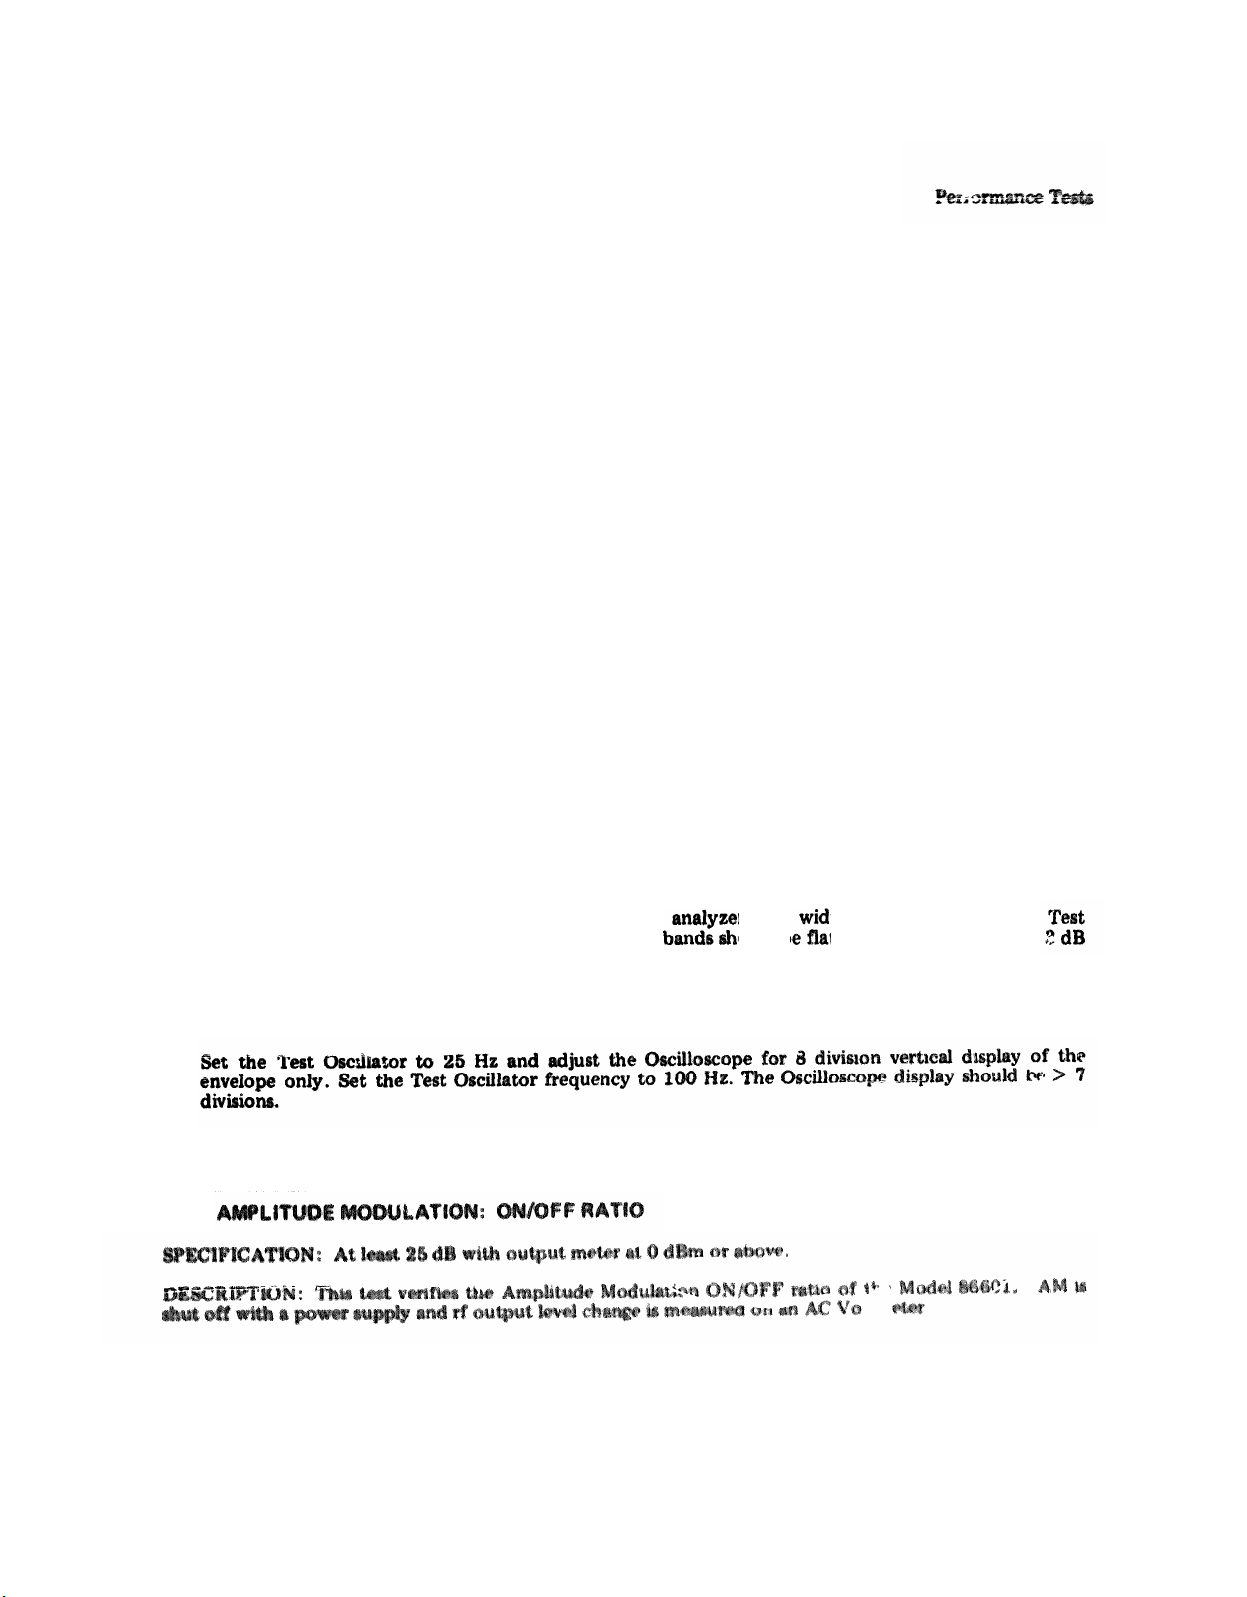
4-19. AMPLITUDE MODULATION
SPECIFICATION: 0 to 95% on all output ranges (with Model 86632A or 86631A Modulation Section in
place).
DESCRIPTION: This test checks AM frequency response with the mainframe center frequency set to 50
MHz, 3 MHz, and 300 kHz. AM rate is provided from a test oscillator and measured on a Spectrum
Analyzer and Oscilloscope.
dB
4-10
Figure 4-9. Amplitude Modulation Test Setup
Page 26
Model 86601A
PERFORMANCE TESTS
4-19. AMPLITUDE MODULATION (cont’d)
RECOMMENDED TEST EQUIPMENT:
Spectrum Analyzer
High Frequency dB Voltmeter
Oscilloscope
Test Oscillator
BNC Tee
HP 8553B/8552B/140S
HP 400 GL
HP 180A/1801A/1821A
HP 651B
UG 274 B/U
PROCEDURE:
1.
Connect the equipment as shown in Figure 4-9.
Set the Spectrum Analyzer as follows: INPUT ATTENUATION 30 dB, BANDWIDTH 1 kHz, SCAN
2.
WIDTH 10 kHZ, CENTER FREQUENCY 50 MHz, LOG-LINEAR 2 dB/Div, SCAN TIME 20 mSec/Div
and VIDEO FILTER to OFF,
3.
Set the mainframe center frequency to 50 MHz and the Model 86601A output level to +3 dBm.
4.
Set the Model 86631A AM switch to ON (if the Model 86632A is being used, set the MODE switch to
AM and the SOURCE switch to EXTERNAL AC and AM to 50%).
5.
Set the Test Oscillator output to 10 kHz at .5 Vrms as read on AC Voltmeter.
6.
Adjust the spectrum analyzer until the carrier is at the top graticule line. Amplitude Modulation should
be 50% ±5% with sidebands down -12 dB ±0.5 dB.
7.
Adjust the Test Oscillator frequency from 10 Hz to 50 kHz. The AM % should be flat ± 4 db from 10
Hz to 20 kHz and down 3 dB at about 50 kHz.
8.
Set the mainframe center frequency to 3 MHz and
Oscillator frequency from 10 Hz to 10 kHz. The side
r scan
ould b
th to 2 kHz. Adjust the
t ±.2 dB to 2 kHz; down
at about 5 kHz; down 8 dB at about 10 kHz.
Set the mainframe center
9.
frequency
to 300 kHz. Disconnect the rf OUTPUT from the Spectrum
Analyzer and connect it to the Oscilloscope.
10.
4-20.
4-11
Page 27
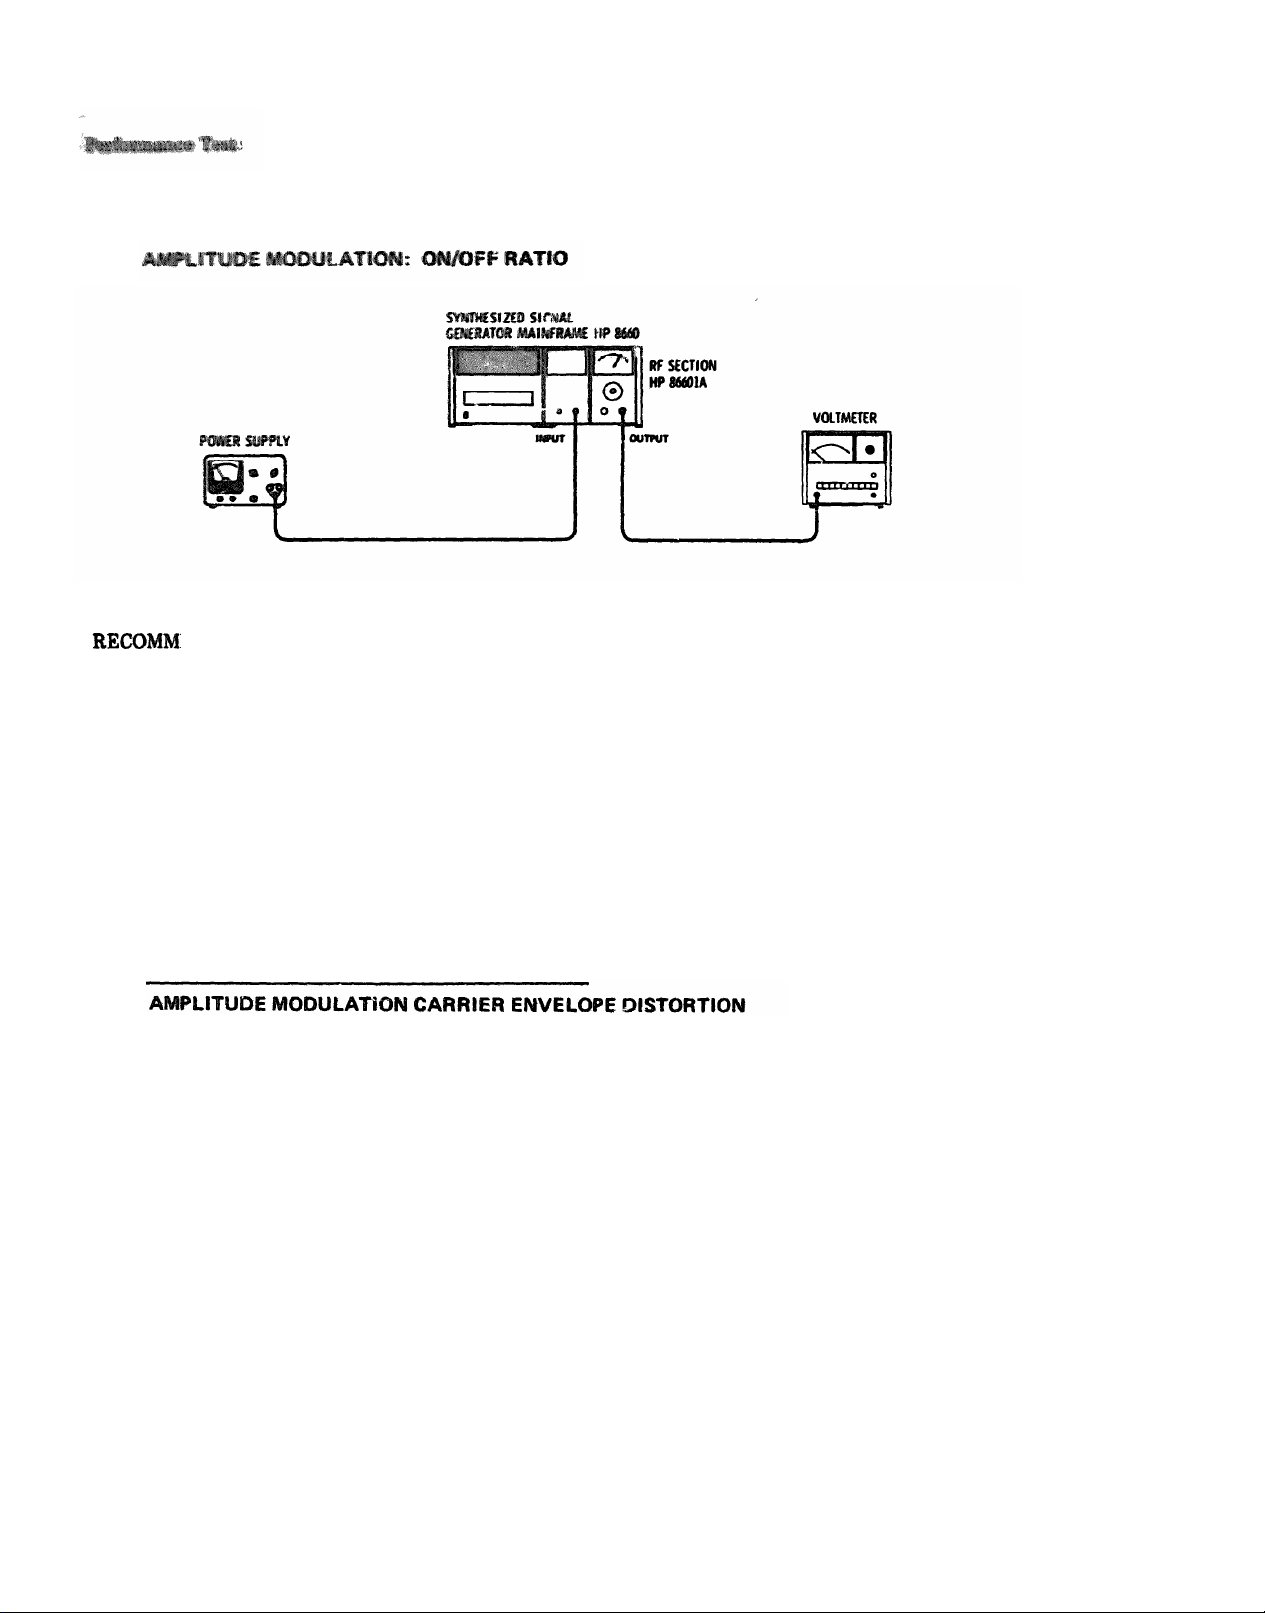
4-20.
Figure 4-10. Amplitude Modulation ON/OFF Ratio Test Setup
ENDED TEST EQUIPMENT:
Broadband Sampling Voltmeter
Power Supply
Model 86601A
PERFORMANCE TESTS
HP 8406A
HP 721A
PROCEDURE:
1.
Connect the equipment as shown in Figure 4-10 (with the Model 86631A AM switch off).
2.
Set the power supply to +4 Vdc.
3.
Set the mainframe center frequency to 50 MHz and output level of the Model 86601A to +13 dBm.
Set a reference point on the Voltmeter.
4.
Switch the Model 86631A AM switch to ON.
5.
The Model 86601A output level should drop to <-12 dBm. (25 dB ON/OFF ratio).
4-21.
SPECIFICATION: Envelope distortion should be less than 1% at 30% AM. Less than 3% at 70% AM. Less
than 5% at 90% AM.
DESCRIPTION:
Amplitude Modulation distortion is checked at 30%, 70% and 90%.
4-12
Page 28
Model 86601A
PERFORMANCE TESTS
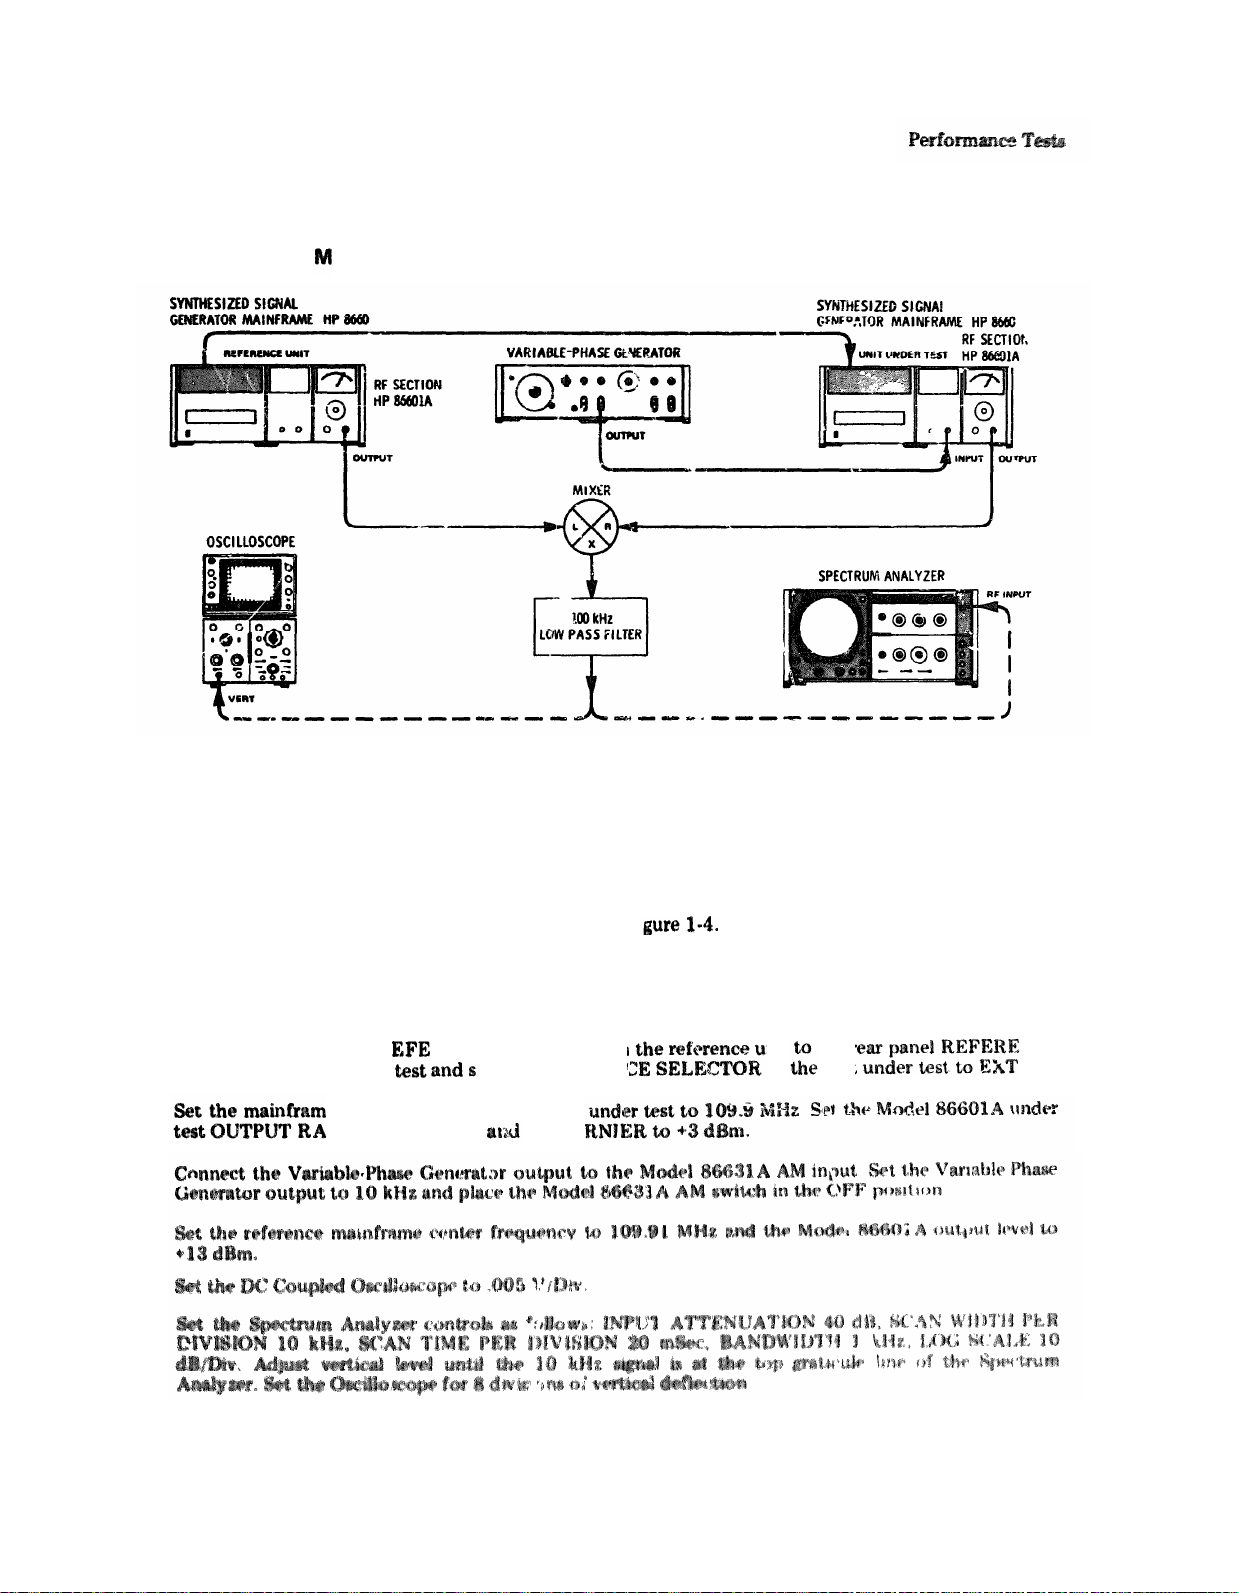
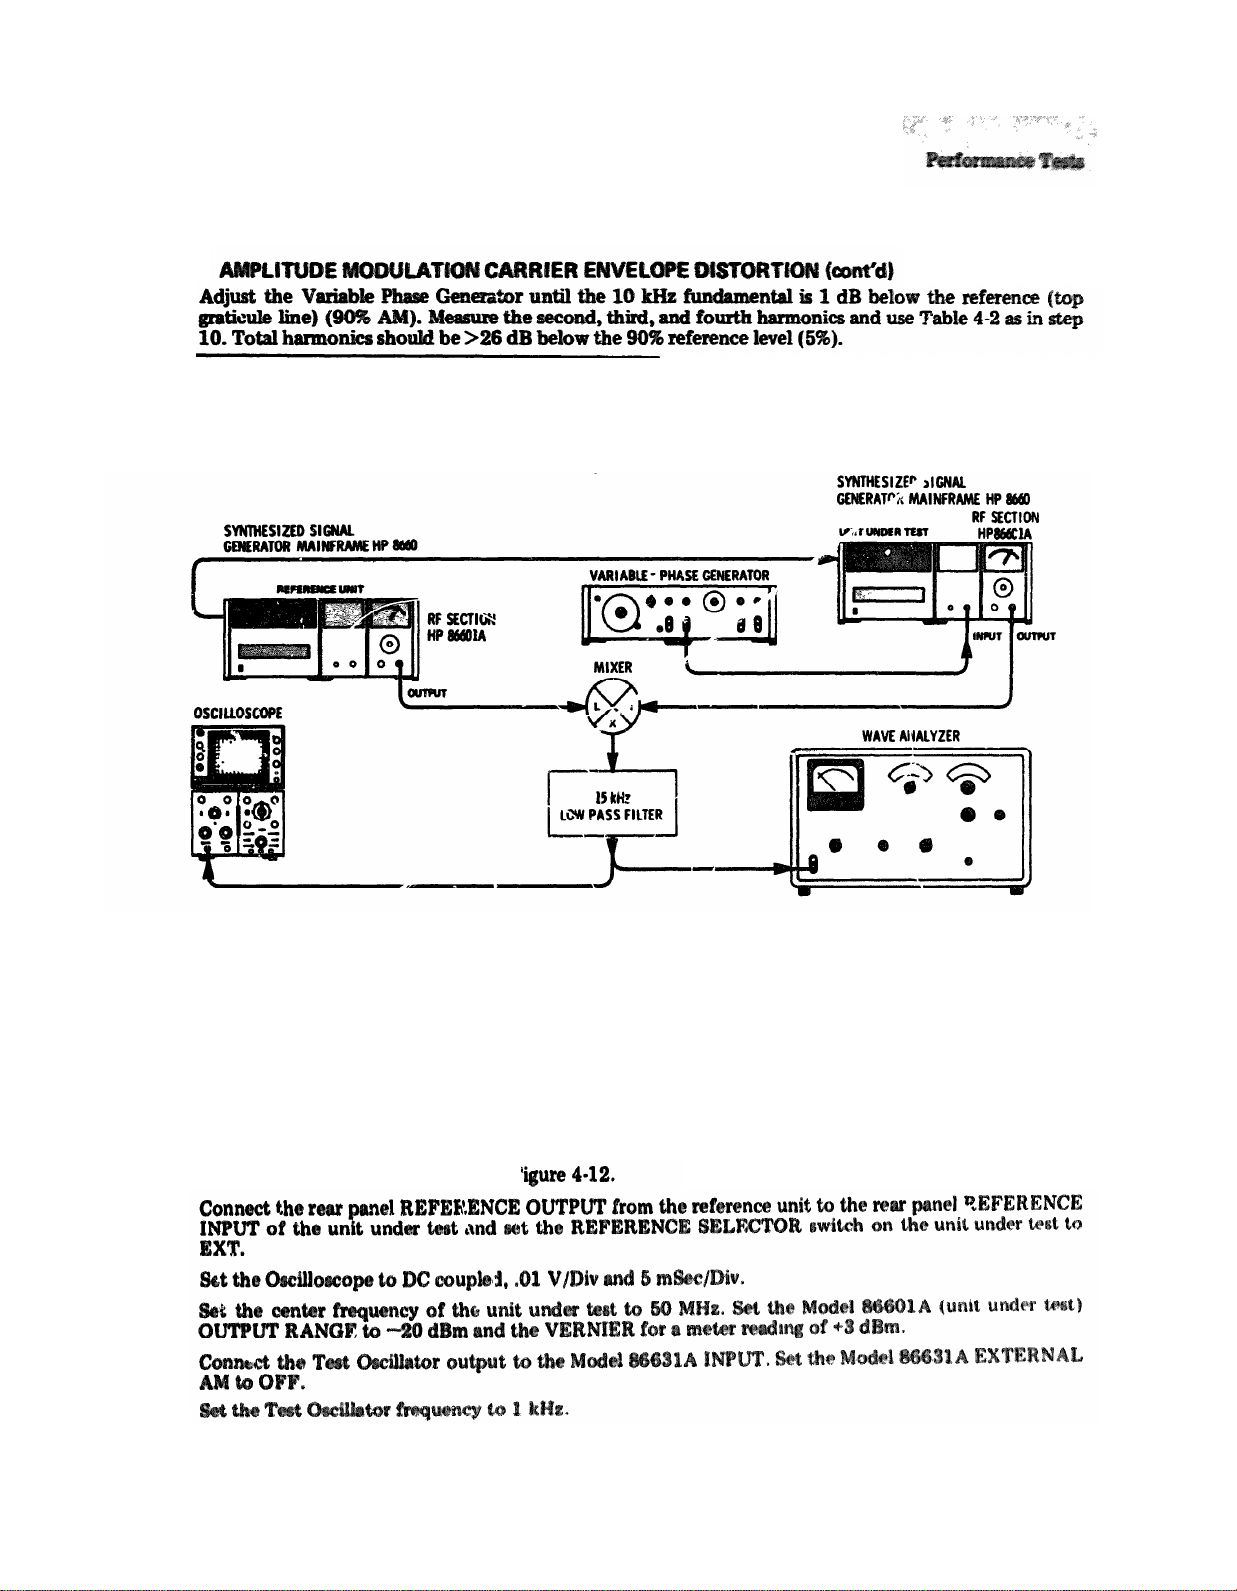
4-21. AMPLITUDE
ODULATION CARRIER ENVELOPE DISTORTION (cont’d)
Figure 4-11. Amplitude Modulation Carrier Envelope Distortion Test Setup
RECOMMENDED TEST EQUIPMENT’:
Double Balanced Mixer
Spectrum Analyzer
Synthesized Signal Generator HP 8660A/B/866C1A/86631A
Variable Phase Generator
Oscilloscope HP 180A/1801A/1821A
Low Pass Filter 100 kHz (special); see details in Fi
HP 10514A
HP 8553B/8552B/140S
PROCEDURE:
1.
Connect the equipment as shown in Figure 4-11.
2. Connect the rear panel R
INPUT of the unit under
3.
e center
RENCE OUTPUT from
et the REFEREN
frequency
NGE to --20 dBm
4.
5.
6.
7.
of time unit
the VE
nit
of
the r
unit
NCE
.
4-13
Page 29
Model 86601A
PERFORMANCE TESTS
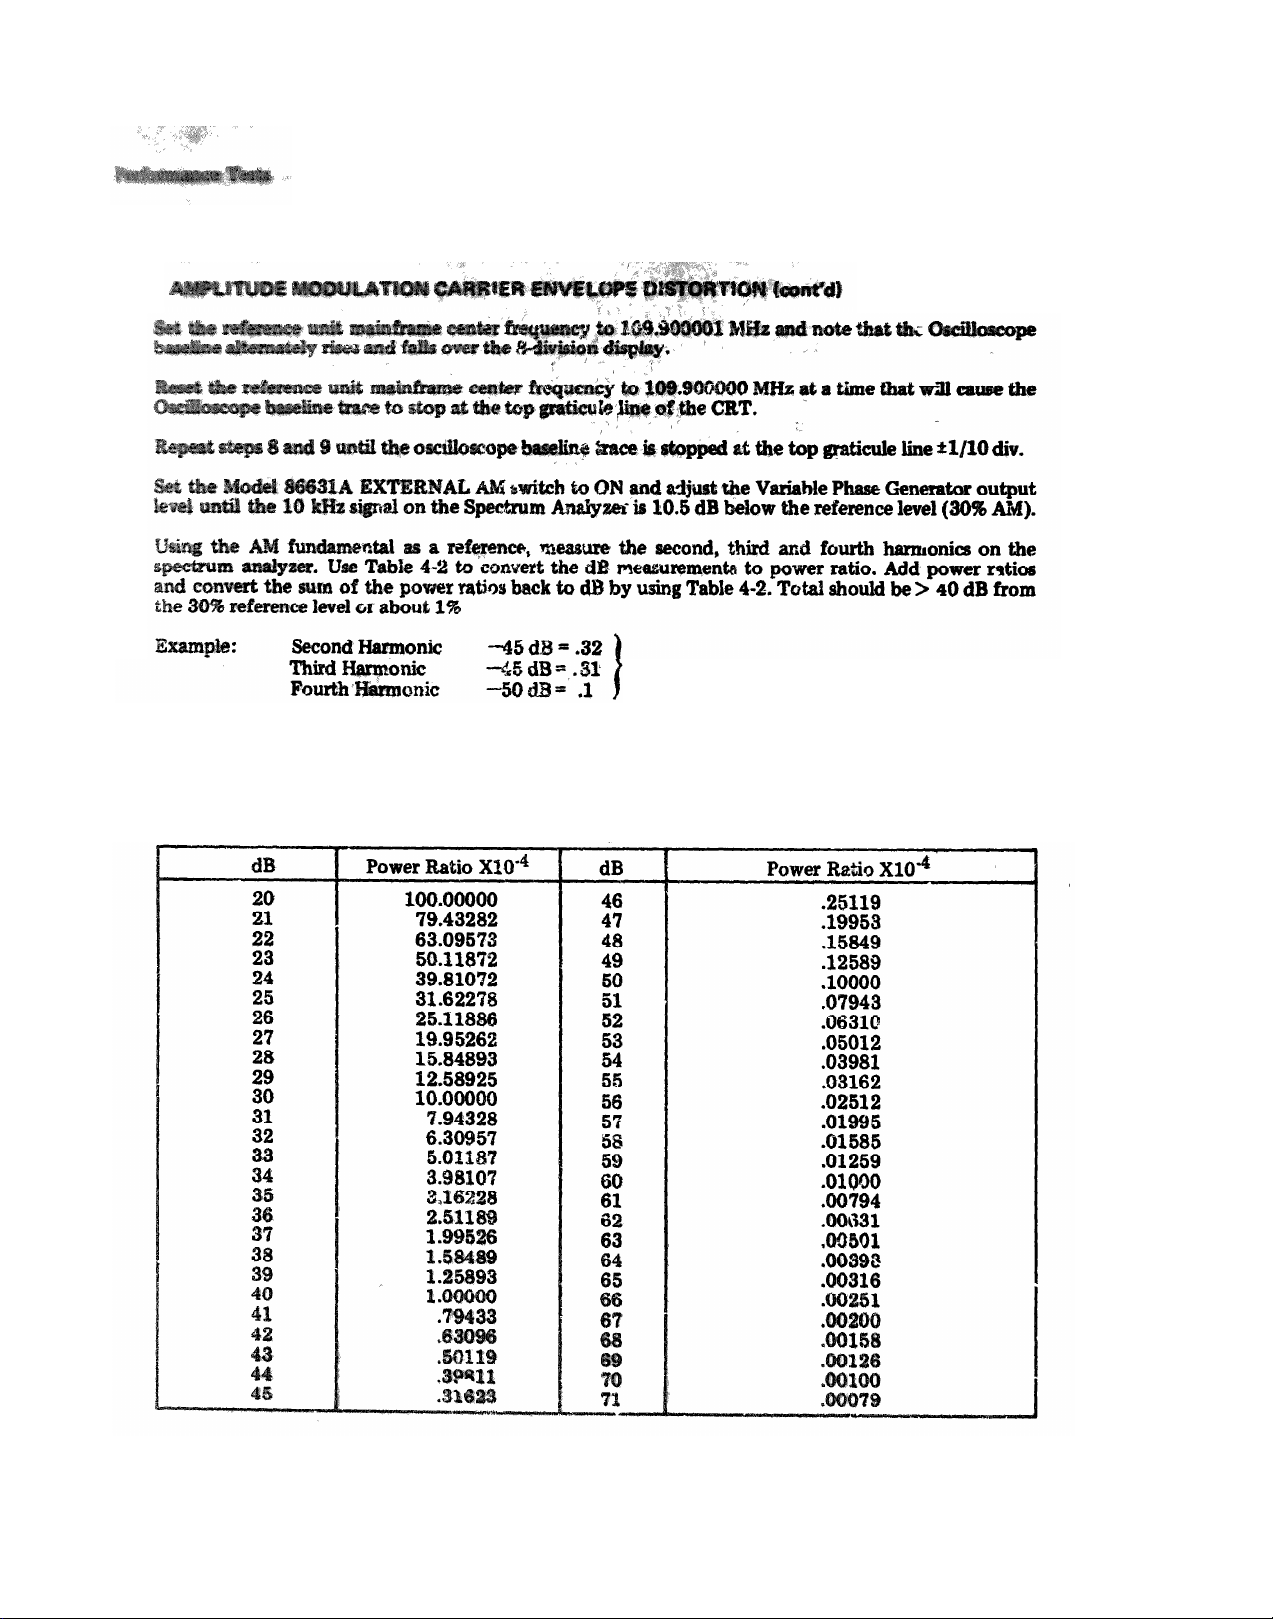
4-21.
8.
9.
10.
11.
12.
=.73 = -41.5 dB
13. Adjust the Variable Phase Generator until the 10 kHz fundamental is 3 dB below the reference (top
graticule line) (70% AM). Using the 10 kHz fundamental as a reference, measure the second,-third and
fourth harmonica and use Table 4-2 as in step 10. Total harmonics should be > 30 dB below the 70%
reference level (3%).
Table 4-2. Carrier Envelope Distortion Test
4-14
Page 30
Model 86601A
PERFORMANCE TESTS
4-21.
14.
4-22. INCIDENTAL PHASE MODULATION
SPECIFICATION: Less than 0.2 radians peak at 30% AM.
DESCRIPTION: This test checks the AM to PM ratio. AM is set to 30% Modulation with an external Test
Oscillator. The ratio is measured with a Wave Analyzer.
Figure 4-12. Incidental PM Test Setup
RECOMMENDED TEST EQUIPMENT:
Synthesized Signal Generator HP 8660A/B/86601A/86631A
Oscilloscope
Test Oscillator HP 651B
Wave Analyzer HP 302A
Double Balanced Mixer HP 10514A
15 kHz Low Pass Filter (special); see details in Figure 1-3.
Variable Phase Generator
PROCEDURE:
1. Connect the equipment as shown in F
2.
3.
4.
5.
6.
HP 180A/1801A/1821A
HP 203A
4-15
Page 31

4-22.
7.
8.
Model 86601A
PERFORMANCE TESTS
9.
10.
frequency to 50.000000 MHz at a time that will cause the
1 MHz and note
p graticule line of the CRT.
11.
12.
a 2.4 division deflection on the Oscilloscope (30% AM) with the Oscilloscope ac coupled. Reset
for
9 and 10 until the oscilloscope baseline trace is stopped at the top graticule line ±1/10 div.
e unit under test Model 86631A EXTERNAL AM switch to ON and adjust the Test Oscillator
pe to dc coupled.
13.
Set the Wave Analyzer near 1 kHz for a peak and set a convenient 0 dB reference in the relative mode
(this is the AM level).
14.
Switch the EXTERNAL AM switch on the Model 86631A to OFF.
15.
Repeat steps 9 and 10 until oscilloscope baseline trace is stopped at center graticule line ±1/10 div.
16.
Switch the Model 86631A EXTERNAL AM switch to ON and take a reading from the Wave Analyzer
for the PM level. The AM to PM ratio should be >5 dB.
4-23. FREQUENCY MODULATION
SPECIFICATION: Rate DC to 1 MHz. Maximum deviation 1 MHz.
DESCRIPTION: This test checks FM distortion and the 1 MHz maximum deviation FM deviation is
checked at 1 kHz rate. To check maximum deviation at the maximum rate requires special equipment.
4-16
Figure 4-13. Frequency Modulation Test Setup
Page 32

Model 86601A
PERFORMANCE TESTS
4-23. FREQUENCY MODULATION (cont'd)
PROCEDURE:
1. Connect the equipment as shown in Figure 4-13.
2. Set the Model 86632A MODE switch to FM X10 and the SOURCE switch to INTERNAL 1000. Set
the MODULATION LEVEL control for full scale meter deflection and depress the FM CF CAL.
3. Set the center frequency to 8.5 MHz and the Model 86601A output level to +13 dBm.
4. Calibrate the Frequency Meter/FM Discriminator.
5. Install a 20 kHz low pass filter in the Frequency Meter/FM Discriminator. (See the Service Manual for
the Frequency Meter/FM discriminator for details.)
6. Set the Frequency Meter/FM Discriminator for 1 V input sensitivity and 10 MHz range.
7. Set the Wave Analyzer near 1 kHz and peak the reading (absolute). The Wave Analyzer meter should
indicate 70.7 mVrms (1 MHz =
200 mV p-p or 70.7 mVrms). Set the Wave Analyzer to relative and
adjust for a 0 dB reading.
8. Set the Wave Analyzer near 2 kHz (second harmonic). Note the reading in dB on the Wave Analyzer
meter.
dB
9. Set the Wave Analyzer near 3 kHz (third harmonic). Note the reading in dB on the Wave Analyzer
meter.
dB
10. Use Table 4-2, page 4-14, to obtain power ratios for the levels recorded in steps 8 and 9, then use Table
4-2 to find the dB level corresponding to the sum of the two ratios. This should be down 34 dB from
the fundamental frequency level.
Record this level dB
4-24. FREQUENCY SWITCHING TIME
SPECIFICATION: Less than 5 milliseconds to be within 100 Hz of any new frequency selected. Less than
100 milliseconds to be within 5 Hz of any new frequency selected. Maximum stepping rate: 1 millisecond
per step.
DESCRIPTION: In this test the Synthesized Signal Generator is remotely programmed and the switching
time is detected by a computing counter. The frequencies used in this procedure were selected for
wont-case conditions.
4-17
Page 33

4-24.
Model 86601A
PERFORMANCE TESTS
Figure 4-14. Frequency Switching Time Test Setup
RECO
ENDED TEST EQUIPMENT:
DC Power Supply
Computing Counter
Marked Card Programmer
Oscilloscope
HP 721A
HP 5360A/5365A
HP 3260A/OPT 001
HP 180A/1801A/1822A
PROCEDURE:
1.
Connect the +5V from the DC Power Supply to pin 17 of the mating connector for J3 through a 1000
ohm resistor. Pin 17 (flag) of the Card Reader’s output connector is also used to trigger the main input
of the Oscilloscope.
2.
Interconnect the Marked Card Programmer with J3 on the rear panel of the Synthesized Signal
Generator.
3.
Connect the Oscilloscope DELAYED SWEEP OUTPUT (rear panel connector) through a BNC Tee
connector to the Oscilloscope vertical Channel A input and to the Ext. Time Measurement Input on
the rear panel of the Computing Counter.
4.
5.
6.
7.
8.
4-18
Page 34

Model 86601A
PERFORMANCE TESTS
4-24. FREQUENCY
9. Program the Synthesized Signal Generator to 30.000000 MHz. The frequency read on the Computing
Counter should be 30 MHz ± 100 Hz.
10. Program the Synthesized Signal Generator to 29.999999 MHz. The frequency read on the Computing
Counter should again be within ±100 Hz of the programmed frequency.
11. Set the Oscilloscope normal sweep to 10 mSec and the delay sweep to 1 uSec.
12. Set the Oscilloscope sweep mode to auto and the delay control for a delay spike at the center vertical
graticule line of the CRT.
13. Set the Oscilloscope main trigger to normal and the Computing Counter gate tune to 100 mSec.
14. Program the Synthesized Signal Generator to 30.000000 MHz. The frequency readout of the
Computing Counter should be within ±5 Hz of the programmed frequency.
15. Program the Synthesized Signal Generator to 29.999999 MHz. The frequency readout of the
Computing Counter should again be within ±5 Hz of the programmed frequency.
4-25. OUTPUT LEVEL SWITCHING TIME
SPECIFICATION: Any level change may be accomplished in less than 50 mSec. Any change to another
level on the same attenuator range may be accomplished in 5 mSec in the remote mode.
DESCRIPTION: This test checks amplitude switching speeds in the remote mode with center frequencies
of 100 kHz and 1 MHz. The Model 86601 rf output is detected and measured on an Oscilloscope.
Figure 4-15. Output Level Switching Time Test Setup
4-19
Page 35

4-25.
1.
Model 86601A
PERFORMANCE TESTS
2.
3.
ut to the channel A input of
Time/Div 5 mSec. Vertical Input DC Coupled, .5V/Div, Normal
ain
level about 11:00 o’clock.
4.
center frequency to 100 kHz. Program the Model 86601A attenuation to the
-5 dB, -9 dB. Switching time should be <5 mSec.
5.
6.
m attenuation to 0 dB, then to -20 dB. Switching time should be <50 mSec.
tests 4 and 5 with center frequency set to 1 MHz.
4-26. INCIDENTAL AM
SPECIFICATION: With 75 kHz peak deviation at a 1 kHz rate, AM modulation sidebands are down 60 dB
from the fundamental.
DESCRIPTION: This test measures AM modulation with the unit under test FM modulated at 75 kHz
peak deviation. A reference level is set on the Wave Analyzer with the two Synthesized Signal Generators
offset by 1 kHz. The unit under test is then programmed to produce a 1 kHz frequency modulated signal
with 75 kHz peak deviation.
4-20
Figure 4-16. Incidental AM Test Setup
Page 36

Model 86601A
PERFORMANCE TESTS
4-26. INCIDENTAL AM (cont'd)
1A
2A
HP180A/1801A/P821A
HP302A
i&& HP 10514A
15kHz Low Pass Filter (special): see details in Table 1-2.
PROCEDURE:
1.
Connect equipment as shown in Figure 4-16.
2.
Connect the rear panel REFERENCE OUTPUT from the reference unit to the rear panel REFERENCE
INPUT of the unit under test and set the REFERENCE SELECTOR of the unit under test to EXT.
Set the unit under test center frequency to 50 MHz and the output level to -7 dBm.
3.
4.
Set the reference unit center frequency to 50.061 MHz and the output level to +13 dBm.
5.
Set the wave Analyzer near 1 kHz and peak the meter, Set the Wave Analyzer meter level to 0 dB in
the relative mode. Set the Oscilloscope for 8-division deflection.
6.
Set the reference unit mainframe center frequency to 50.0000001 MHz and note that the Oscilloscope
baseline alternately rises and falls over the 8 division display.
7.
Reset the reference unit mainframe center frequency to 50.000000 MHz at a time that will cause the
Oscilloscope baseline trace to stop at the top graticule line of the CRT.
8.
Repeat steps 6 and 7 until the baseline stops on the top CRT graticule ±1/10 div.
9.
Set the Model 86632A Modulation Section to 1 kHz FM Xl and 75 kHz deviation (75% on the meter).
10. Note the Wave Analyzer reading. Should be >-60 dB down from the reference level.
Meter Readi
dB
4-21
Page 37

Table 4-3. Performance Test Record
Model 86601A
4-22
Page 38

Model 86601A
SECTION V
ADJUSTMENTS
5-1. INTRODUCTION
5-2. This section describes adjustments and checks
required to return the Model 86601A to peak
operating capability when repairs have been made.
Adjustment locations are identified pictorially on
Section VIII foldout service sheets referred to in
the individual tests.
5-3. If repairs to any filter have been made, it
should be necessary to adjust only the circuit in
which the component failure occurred.
5-4. If component failure occurs in any circuit
other than the logic circuits, it will be necessary to
recalibrate the RF output meter circuit (refer to
paragraph 5-14).
5-5. If component failure occurs in A3 or A9, the
AM input and AGC circuits must be readjusted
(refer to paragraph 5-15).
5-6. If component failure occurs in the A6 preamplifier or the A2 Power amplifier (other than
AGC), the harmonic levels should be readjusted
(refer to paragraph 5-16).
5-7. RECOMMENDED TEST EQUIPMENT
5-8. Each adjustment procedure in this section
contains a list of test equipment and accessories
required to perform the procedure. Each test setup
identifies test equipment and accessories by callouts.
5-10. SERVICE KIT
5-11. The HP 11678A Service Kit is an accessory
item av
le from Hewlett-Packard for use in
maintaining the Model 66601A RF Section.
5-12. Table 1-2 contains a detailed description of
the service kit. Any item in the kit may be ordered
separately.
NOTES
a. The RF Section adjustments should
be made with the Model 86601A
installed in the mainframe with the
cover removed whenever possible. It
will be necessary to remove the mainframe top cover and the top guide rail
for the Model 86601A. To make incircuit adjustments for the 480 MHz
Active bandpass filter or the dual
filter (A12), it will be necessary to
use the extender cable
(1167260001) which is part of the
service kit.
b. A modulation section or an auxiliary
t be installed in the main-
frame during these adjustments.
All tests in which a counter
c.
should be made
5-9. Minimum specifications for test equipment
used in the adjustment procedures are detailed in
Table 1-2. Because the Model 86601A is an ex-
nal reference
common source.
5-13. CHECKS AND ADJUSTMENTS
5-1
Page 39

5-14.
Model 86601A
ADJUSTMENTS
m is
Figure 5-1. RF Output Meter Calibration Setup
RECOMMENDED TEST EQUIPMENT:
Test Oscillator
Broadband Sampling voltmeter
BNC Tee Connector
50 ohm load
Extender Cable
Spectrum Analyzer HP 140/8552/8553
5-1
8-21 of Manual Ch
supplement.
ted at +3 and -7 dBm to ensure tracking across the
HP 651B
H 3406A
UG 274 B/U
HP 1250-0207
HP 11672-60001
PROCEDURE:
1.
Clean the Model 86601A meter face with anti-static
factured by Weston Instruments Inc. Newark, NJ.)
2.
Connect the equipment
3.
4.
5.
6.
5-2
(Recommended: STATNUL manu-
t the m
Page 40

Model 86601A
ADJUSTMENTS
5-14. RF OUTPUT METER CALIBRATION (Cont')
7. Connect the Test Oscillator output to the Model 86632A input (10 kHz, 1V, verify level with the AC
Voltmeter). Set the Model 86632A to AM, EXT, AC coupled and 50% modulation as indicated on the
Model 86632A meter.
8. Set the spectrum analyzer so that the 10 MHz center frequency is at the top graticule line. Verify that
the AM sidebands are -12 dB below the center frequency fundamental (50% modulation).
9. Adjust the Model 86601A VERNIER until the fundamental (10 MHz) is 10 dB below the reference
setting. Adjust A1R34 DET for 50% modulation (AM sidebands down -12 dBm from the
fundamental).
10. A9R32 and A2R34 interact. Repeat steps 5 through 9 until the modulation displayed on the spectrum
analyzer remains at 50%.
11. Disconnect the Test Oscillator and set the Model 86632A to OFF. Disconnect the spectrum analyzer
and connect the AC Voltmeter to the Model 86601A OUTPUT.
12. Set the 86601A to +13 dBm as measured by the voltmeter.
13. Adjust A9R32 as necessary for a Model 86601A meter reading of +3 dBm.
14. Turn the Model 86601A VERNIER control CCW until the AC
voltmeter reads +3 dBm (10 dB less
than step 12).
15. Adjust A9R34 for a Model 86601A meter reading of -7 dBm.
16. Repeat steps 11 through 15 until the Model 86601A meter tracks the AC voltmeter, (from +3 dBm to
-7 dBm ± 25 dBrn 86601A Meter).
5-3
Page 41

5-15.
Figure 5-2. Harmonic Distortion Adjustment Setup
RECOMMENDED TEST EQUIPMENT:
Model 86601A
ADJUSTMENTS
Spectrum Analyzer
HP 140/8554L/8552B
PROCEDURE:
1.
Connect the equipment as shown in Figure 5-3.
2.
Set the mainframe center frequency to 60 MHz and the Model 86601A output amplitude to 0 dBm.
3.
Set the Spectrum Analyzer controls as follows: CENTER FREQUENCY - 60 MHz, INPUT
ATTENUATION -
20 dB, LOG REP LEVEL - 0 dBm, BANDWIDTH - 100 kHz, SCAN WIDTH
PER DIVISION - 50 MHz, SCAN TIME PER DIVISION - 10 MILLISECONDS and LOG/LINEAR LOG.
4.
Adjust the preamplifier BIAS (A6R1) and the power amplifier BIAS (A2R6) until the second harmonic
(120 MHz) is more than 50 dB down from the fundamental frequency.
5.
Set the mainframe and the Spectrum Analyzer center frequency to 109 MHz.
6.
Adjust the power amplifier BIAS (A1R6) until the second harmonic (218 MHz) is more than 44 dB
down from the fun mental frequency.
7.
0 M to 10
monic
All
8.
5-4
Page 42

Model 86601A
ADJUSTMENTS
5-15. HARMONIC DISTORTION CHECKS AND ADJUSTMENTS (Cont’d)
Table 5-1. Harmonic Distortion Level Checks
5-16. AMPLITUDE MODULATION CALIBRATION
REFERENCE: Service Sheets 3 and 4.
DESCRIPTION: The AM input and AGC circuits
Modulation Section without recalibration.
properly
-in
5-5
Page 43

ADJUSTMENTS
Model 86601A
Figure 5-3.
Amplitude Modulation Calibration Setup
RECOMMENDED TEST EQUIPMENT:
Precision Attenuator
Test Oscillator
Spectrum Analyzer
High Frequency dB Voltmeter
BNC Tee Connector
HP 140/8553B/8552B
HP H38-355D
HP 651B
HP 400GL
UG 274B/U
PROCEDURE:
Using the 86631A Auxiliary Section. (If the Model 86632A Modulation Section is used, use step 2-a instead
of step 2.)
Connect the equipment as shown in Figure 5-2.
1.
Monitor the output amplitude of the Test Oscillator with the High Frequency dB Voltmeter. Set the
2.
Test Oscillator frequency to 1 kHz and the output amplitude to 0.5 volts rms with the Model 86631
EXTERNAL AM switch to ON.
2-a. Set the Model 86632A to AM mode; source 1 kHz, internal modulation level for 50% AM on the
86632A meter.
3.
Set the mainframe center frequency to 50 MHz, the Model 86601A output amplitude to +13 dBm and
the Precision Attenuator to 20 dB.
4.
5.
5-6
Page 44

Model 86601A
ADJUSTMENTS
5-17. A12 FILTER
REFERENCE:
DESCRIPTION: The bandpass filters in the A12 assembly are adjusted for minimum insertion loss and
maximum flatness over the specified bandwidth.
Figure 5-4. A12A1 Filter Adjustment Setup
RECOMMENDED TEST EQUIPMENT:
Tracking Generator
Spectrum Analyzer
RF Millivoltmeter
Electronic Counter
BNC Tee Connector
HP 140/8554L/8552B
HP 5245M/5253B
HP 8444A
HP 411A
UG 274B/U
PROCEDURE: 500 MHz Bandpass Filter A12A1
1. Remove the A12 Dual Filter assembly from the Model 86601A.
2. Connect the tracking Generator to the Spectrum Analyzer. (Refer to the Tracking Generator Operatin
and Service Manual for interconnections.)
3. Set the Spectrum Analyzer controls as follows: INPUT ATTENUATION - 20 dB, LOG/LINEAR - 10
dB LOG, LOG REF LEVEL - +10 dBm, SCAN WIDTH PER DIVISION -- 20 MHz, SCAN TIME PER
DIVISION - 10 MILLISECONDS and BANDWIDTH - 300 kHz.
4. Connect the Trackin Generator RF OUTPUT to the Counter with the Spectrum Analyzer in the
ZERO scan mode.
5.
ctrum Analyzer center frequency
to 500 MHz
6.
7.
8.
9.
10.
5-7
Page 45

5-17.
11.
Model 86601A
ADJUSTMENTS
Figure 5-5. Preliminary Adjustment Setup (450/460 Bandpass Filter)
Remove the A12 Dual Filter assembly from the Model 86601A.
1.
2.
Connect the Tracking Generator to the Spectrum Analyzer. (Refer to the Tracking Generator
Operating and Service Manual for interconnections.}
3.
Set the Spectrum Analyzer as follows: INPUT ATTENUATION - 20 dB, LOG/LINEAR - 10 dB
LOG, LOG REF LEVEL - 0 dBm, SCAN WIDTH PER DIVISION - 5 MHz, SCAN TIME PER
DIVISION - 5 MILLISECONDS and BANDWIDTH - 300 kHz.
4.
Connect the Tracking Generator RF OUTPUT to the Counter with the Spectrum Analyzer in the
ZERO scan mode.
5.
Set the Spectrum Analyzer center frequency to 455 MHz as displayed on the Counter and disconnect
the Counter.
6.
Set the Tracking Generator LEVEL to -14 dBm as a reference.
7.
Connect the equipment together as shown in Figure 5-5.
8.
Use a screwdriver to short the rotor of C2 to the casting. Adjust Cl for a maximum level on the
Voltmeter.
9.
Short C3 to the castin and adjust C2 for minimum readin on the Voltmeter.
10.
on the Voltmeter.
11.
12.
13.
14.
5-8
Page 46

Model 86601A
ADJUSTMENTS
5-17.
15.
16. Connect the equipment shown in Figure 5-4.
17. Change the Spectrum Analyzer scan mode from ZERO scan to SCAN WIDTH PER DIVISION.
18. Adjust Cl and C7 for minimum insertion loss and maximum flatness. (Insertion loss is approximately 5
dB.)
19. Adjust C2 through C6 for optimum flatness and minimum insertion loss.
20. Record the ripple, insertion loss and roll-off.
Ripple 2 dB maximum peak-to-peak dB
Insertion loss 6 dB maximum
Rolloff
55 dB down at 440 MHz
55 down at 470 MHz dB
5-18. 480 MHz ACTIVE FILTER CHECKS AND ADJUSTMENTS
REFERENCE: Service Sheet 2.
DESCRIPTION: The 480 MHz bandpass filter in the A4 assembly is adjusted for maximum
minimum insertion loss.
dB
- dB
flatness and
Figure 5-6. Active Filter Adjustment Setup
5-9
Page 47

5-19.
1.
Model 86601A
ADJUSTMENTS
2.
3.
4.
5.
6.
Set the Tracking Generator LEVEL to -14 dBm as a reference.
7.
Connect the equipment as shown in Figure 5-6.
8.
m Analyzer frequency to 480 MHz as indicated by the Electronic Counter.
Cl, 2, 3 and 4 for maximum output and maximum flatness across the bandwidth. At 480
tor RF OUTPUT to the Electronic Counter with the Spectrum Analyzer
INPUT ATTENUATION - 20 dB, LOG REF LEVEL
should be greater than or equal to 17 dB. The response curve should rolloff to more than 3
dB down at 477 and 483 MHz.
9.
Record the gain and rolloff.
(Refer to the Trac
.
2 MHz, SCAN TIME PER DIVISION - 10
Gain at 480 MHz
Rolloff at 477 MHz
Roiloff at 483 MHz
dB
dB
dB
5-10
Page 48

Model 86601A
SECTION VI
REPLACEABLE PARTS
6-1. INTR
ION
6-2. Table 6-1 provides correct stock numbers for
use when ordering assemblies on an exchange basis.
These factory-repaired assemblies are available-on
an exchange-for-credit basis at a considerable
savings cost.
6-3. Table 6-2 lists the meanings of the abbreviations and reference designations used in the table
of replaceable parts.
6-4. Table 6-3 lists 86601A replaceable parts in
alpha-numerical order of their reference designation.
6-5. Table 6-4 contains the names and addresses
that correspond to the manufacturers’ code num-
bers.
Table 6-1. Part Numbers for Assembly Exchange Orders
6-6. ORDERI
6-7.
6-8.
If the part
number does not have
a National Stock
through normal ordering channels using
the Hewlett-Packard part number.
6-9.
Refer to table 6-5 for part number
to NSN cross-reference.
6-1
Page 49

Table 6-2. Reference Designators and Abbreviations Used in Parts List
Model 86601A
6-2
Page 50

Model 86601A
Table 6-3. Replaceable Parts
6-3
Page 51

Table 6-3. Replaceable Parts
Model 86601A
6-4
Page 52

Model 86601A
Table 6-3. Replaceable Parts
6-5
Page 53

Table 6-3. Replaceable Parts
Model 86601A
6-6
Page 54

Model 86601A
Table 6-3. Replaceable Parts
6-7
Page 55

Table 6-3. Replaceable Parts
Model 86601A
6-8
Page 56

Model 86601A
Table 6-3. Replaceable Parts
6-9
Page 57

Table 6-3. Replaceable Parts
Model 86601A
6-10
Page 58

Model 86601A
Table 6-3. Replaceable Parts
6-11
Page 59

Table 6-3. Replaceable Parts
Model 86601A
6-12
Page 60

Model 86601A
Table 6-3. Replaceable Parts
6-13
Page 61

Table 6-3. Replaceable Parts
Model 86601A
6-14
Page 62

Model 86601A
Table 6-3. Replaceable Parts
Table 6-4.
Manufacturer’s Code List
6-15
Page 63

TM 11-6425-2837-14&P-6
PART NUMBER-NATIONAL STOCK NUMBER
TABLE 6-5
CROSS REFERENCE INDEX
NATIONAL
STOCK
NUMBER
5910-00-244-7171
5910-01-022-6482
5962-00-252-0225
5962-00-455-1814
5945-00-233-1542
5910-00-195-4107
5910-00-463-5949
5945-00-448-6876
5962-00-865-4625
5962-00-106-4287
5961-00-912-3099
5961-00-350-2205
5910-00-914-2605
5910-00-961-9591
5910-00-497-7598
5910-00-211-1611
5910-00-244-7164
5910-00-195-4107
5910-00-463-5949
5910-00-430-5685
5910-00-885-6540
5910-00-444-6724
5910-00-444-6725
5910-00-883-6281
5910-00-244-7171
5910-00-431-3956
5940-00-138-1326
5910-00-913-0802
5910-01-014-2874
5910-00-348-2617
NATIONAL
STOCK
NUMBER
5910-00-809-4701
5910-00-850-5355
5910-00-719-9907
5910-00-430-6016
5905-00-931-1066
5905-00-974-6075
5905-00-407-0052
5905-00-998-1814
5905-00-828-0388
5905-00-481-1357
5905-00-246-8634
5905-00-974-6081
5905-00-891-4215
5905-00-433-6904
5905-00-858-8927
5905-00-407-0053
5905-00-974-6082
5905-00-407-0075
5905-00-420-7136
5905-0-974-6080
5905-00-828-0377
5905-00-194-0341
5905-00-974-6083
5905-00-078-1548
5905-00-478-2244
5905-00-407-0107
5905-00-161-8921
5905-01-009-7560
5905-00-830-6677
5905-00-972-4907
6-16
5910-00-829-0245
5910-00-027-7069
5905-00-858-9105
5905-00-853-8190
Page 64

TABLE 6-5
PART NUMBER-NATIONAL STOCK NUMBER
CROSS REFERENCE INDEX
TM 11-6425-2837-14&P-6
NATIONAL
STOCK
NUMBER
5905-00-858-8826
5905-00-974-5709
5905-00-981-7475
5905-00-244-7189
5905-00-998-1906
5905-00-412-4036
5905-00-929-7774
5905-00-981-7529
5905-00-405-8091
5905-00-493-0738
5905-00-858-9417
5905-00-412-4037
5905-00-891-4219
5905-00-929-2529
5905-00-990-0303
5905-00-998-1792
NATIONAL
STOCK
NUMBER
5999-00-479-8176
5962-00-138-5248
5962-00-138-5250
5962-00-252-0225
5961-00-927-0845
5961-00-904-2540
5961-00-937-1409
5961-00-137-4608
5961-00-464-4049
5961-00-401-0507
5961-00-400-5973
5961-00-408-9807
5961-00-105-8867
5961-00-978-7468
5961-00-451-8685
5961-00-858-7372
5905-00-981-7530
5905-00-494-4628
5905-00-089-7577
5905-00-904-4412
5905-00-057-8480
5905-00-917-0580
5999-00-08-8444
5950-00-443-9518
5950-00-059-5920
5990-00-937-4420
5990-00-789-3794
5935-00-477-1147
5935-00-434-3040
5935-00-267-2973
5935-00-026-0952
5999-01-079-9981
5961-00-912-3099
5961-00-350-2205
5961-00-954-9182
5961-00-927-0845
5961-00-937-1409
5961-00-400-5973
5961-00-401-0507
5905-00-407-0077
5905-00-407-0078
5905-00-221-7472
5905-00-138-5086
5905-00-476-5797
5905-00-476-5718
5905-00-476-5796
5905-00-470-3420
5905-00-405-7709
6-17
Page 65

TM 11-6425-2837-14&P-6
TABLE 6-5
PART NUMBER-NATIONAL STOCK NUMBER
CROSS REFERENCE INDEX
NATIONAL
STOCK
NUMBER
5935-00-267-2973
5935-00-448-2236
5935-00-138-5209
5970-00-531-7134
5970-00-470-7622
5950-00-475-4996
5950-00-405-3735
5950-00-059-5920
5950-00-431-3216
5950-00-406-6419
6-18
Page 66

Model 86601A
SECTION VII
MANUAL CHANGES
7-1. INTRODUCTION changes listed opposite your instrument serial num-
ber. Perform these changes in the sequence listed.
7-2. This section contains information for adapt-
7-4. Refer to paragraph 7-8 for manual
ing this manual to instruments for which the con- changes pertaining to later aerial
tent does not apply directly. numbered instruments.
7-3. To adapt this manual to your instrument,
refer to Table 7-1 and make all of the manual
Table 7-1. Manual changes by Serial Number
7-5. MANUAL CHANGE INSTRUCT
7-6.
7-7.
Table 7-3.
CHANGE A
Page 8-19, Figure 8-26 (A10 assembly)
CHANGE B
Page 8-17, Figure 8-24 and Table 6-3 (A9 assembly)
CHANGE C
Table 6-3
7-1
Page 67

CHANGE C (Cont'd)
CHANGE D
Table 6-3
number to 1120-1561 (Option 001 1120-1563)
Page 8-17, Figure 8-24 and Table 6-3 (A3 assembly)
R4 to 0757-0442 R:FXD MET F:M 10.0 K OHM 1% 1/8 W.
Page 8-17, Figure 8-24 and Table 6-3 (A9 assembly)
A9R32 to 2100-2522 R:VARCERMET 10K OHM 10% LIN 1/2W.
CHANGE E
Page 8-13, Figure 8-17 (A5 assembly)
Move inductive bead A5A1Z1 from the Base of A5A1Q1 to the Base of A5A1Q2.
Model 86601A
CHANGE F
Page 8-13, Figure 8-17,
Table 6-1 and Table 6-3 (A5 assembly)
Change part number to 86601-60064 and exchange part number to 36601-60114.
Delete: A5J4, A5C3, A5A1C10, ASA1R10, A5A1K1.
Relabel the input to A5J1 CNTRL, change the wire color code to 80 and make the input symbol 4A.
Connect the lead from A5J1 to A1A5R9.
NOTE
strument has serial prefix 110A or 1150A do not make
s in your manual.
CHANGE G
Table 6-3
CHANGE H
Page 8-13, Figure 8-17 and Table 6-1 (A5 assembly)
7-2
Page 68

Model 86601A
CHANGE H (Cont'd)
Page 8-17, Figure 8-24 and Tab
Change part number to 8660
Refer to Figure 7-5 for schematic, Figure 7-6 for component locations and Table 7-2 for replaceable
number to 86601-60102.
Parts.
Page 8-17, Figure 8-24 and Table 6-1 (A3 assembly)
Change part number to 86601-60019 and exchange part number to 86601-60108.
Refer to Figure 7-7 for schematic, Figure 7-8 for component locations and Table 702 for replaceable
parts.
Page 8-13, Figure 8-17 and Table 6-1
Delete the A20 assembly 86601-60066.
CHANGE I
Page 8-13, Figure 8-17 and Table 6-3 (A4 assembly)
Change A4A1 and A4A2 components as follows:
C1 and C4 to 24 pF 0160-2266
C2 to .001 uF 0160-3456
R2 and R6 to 3830 ohms 0698-3153
R4 and R7 to 215 ohms 0698-3441
C5 and C7 to 1000 pF 0160-2327 Q1 and Q2 to 1854-0431
Delete the inductive bead, Z1, part number 9170-0029 from the base lead of A4A2Q2.
Page 5-2, Paragraph 5-14
Substitute the following procedure.
Figure 7-1. RF Output meter Calibration Setup
7-3
Page 69

CHANGE I (Cont'd)
Model 86601A
1.
1A
anti-static solution.
UL” manufactured by Weston Instruments Inc., Newark, NJ.)
2.
BNC Tee connector to the 86601A OUTPUT, the 50 ohm load and the
Broadband
ltmeter as shown in Figure 5-1.
3.
Set the OUTPUT RANGE switch to +10 dBm and the VERNIER full clockwise.
4.
Set the mainframe center frequency to 50 MHz.
5.
EF ADJ control (A9R2) for a +13.5 dBm reading on the Broadband Sampling Voltmeter
6. Adjust the VERNIER control counterclockwise to obtain a reading of +3 dBm on the Broadband
Sampling Voltmeter.
7.
Set the MTR ADJ Contro1 (A9R32) for a reading on the Model 86601A output meter of +13 dBm
8.
Adjust the VERNIER control counterclockwise for a reading on the Model 86601A output meter
-7 dBm.
9.
Set the DET control (A2R34) for a +3 dBm reading on the Broadband Sampling Voltmeter.
10. Repeat steps 5 through 9 until no further adjustment is necessary.
Table 7-2. Assembly-Change Cross Reference Index
7-4
Page 70

Model 86601A
Figure 7-2. Partial Logic Schematic
7-5
Page 71

Model 86601A
Figure 7-3. A5 Modulator Assembly 86601-60001
7-6
Page 72

Model 86601A
Figure 7-4. Modulator Assembly Component Locations
7-7
Page 73

Model 86601A
Figure 7-5. Reference Assembly
7-8
Page 74

Model 86601A
Figure 7-6. Reference Assembly Component Location
7-9
Page 75

Model 86601A
Figure 7-7. Feedback Amplifier
7-10
Page 76

Model 86601A
Figure 7-8. Feedback Amplifier Component Locations
7-11
Page 77

Model 86601A
7-8.
the manual to instruments containing
The manual changes given
imp
manual. Make all ERRATA corrections first and t
number related changes indicated in the table.
Page 1-2, Table 1-1:
“Change the heading “Spurious
Change the heading “Sign
Change the heading “Residual
Page 4-6, paragraph 4-15:
Change the first sentence of
t
AM modes) are at least 80
Page, paragraph 4-16:
Add the following to the SPECIFICATION
Page 4-10, paragraph 4-18:
Page 4-13, Figure 4-11:
Page 6-3, Table 6-3:
Page 6-5 and 6-6, Table 6-3:
Page 6-8, Table 6-3:
7-12
Page 78

Model 86601A
CHANGE 1
Page 6-8:
Page 8-21:
CHANGE 2
CHANGE 3
Page 6-5, Table 6-3:
28480, 0160-3875.
Add to A4A1 miscellaneous, 1200-0172, 2, INSULATOR XSTR TO-18, 28480, 1200-0172.
Add to A4A2 miscellaneous, 1200-0172, 2, INSULATOR XSTR TO-18, 28480, 1200-0172.
Page 6-6, Table 6-3:
Delete A5A1Z1
±5% 200 SVDC CER,
Page 6-8, Table 6-3:
A8R5, R6, R16, R16, R25 and R26 to 0683-0335, RESISTOR 3.3 5% .25W FC TC--400/+500, 01121,
CB33G5.
Page 8-13, Figure 8-13 (Service Sheet 2):
Page 8-21, Figure 8-28:
CHANGE 4
Page 6-1, Table 6-1:
Page 6-9, Table 6-3 and page 8-21, Figure 8-28:
A1C1, A4A1C4, A4A2C1, A4A2C4, A5A1C1, ABA1C4,
7-13
Page 79

Model 86601A
Table 6-3. Replaceable Parts (P/O Errata; Page 1 of 2)
7-14
Page 80

Model 86601A
Table 6-3. Replaceable Parts (P/O Errata; Page 2 of 2)
7-15
Page 81

Model 86601A
Table 6-3. Replaceable Parts (P/O Change 1)
7-15
Page 82

Model 86601A
Figure 8-27. Attenuator Driver Component Locations (P/O Change 1)
7-17
Page 83

Model 86601A
Figure 8-28. Attenuator Driver Assembly (P/O Change 1)
7-18
Page 84

Model 86601A
CHANGE 5
Page 6-8, Table 6-3 and page 8-21, Figure 8-28 (Service Sheet 6):
R30, R39 and R40.
CHANGE 8
Page 5-1:
components are identified on the schematics
y
an asterisk which follows the reference desig-
nator. The normal value of the components are shown. The
Page 5-1:
7-19
Page 85

Model 86601A
Add the following adjustment procedure.
5-19. MODULATOR ASSEMBLY ADJUSTMENT
REFERENCE:
Service Sheet 2.
DESCRIPTION: The fixed dynamic range of the modulator is set so the gain extremes extend beyond
specified limits. The gain extremes are set by selecting resistors with a specific control
voltage input to the modulators.
Figure 5-7. Modulator Assembly Adjustment Test Setup.
7-20
1.
2.
3.
4.
5.
6.
Page 86

Model 86601A
CHANGE 6 (Cont'd)
Set the power supply vol
7.
8.
t the equipment as shown in Figure 5-7.
9.
10.
to +5.0 WC.
t is
the
7-21
Page 87

Model 86601A
CHANGE 6 (Cont'd)
Page 6-5 and 6-6, Table 6-3:
Page 8-13, Figure 8-17 (Service Sheet 2):
Page 8-15, Figure 8-20 (Service Sheet 3):
7-22
Page 88

Model 86601A
Table 6-3. Replaceable Parts (P/O Change 6; 1 of 2)
7-23
Page 89

Model 86601A
Table 6-3. Replaceable Part (P/O Change 6; 2 of 2)
7-24
Page 90

Model 86601A
Figure 6-3.
7-25
Page 91

Model 86601A
Figure 8-1. Model 86601A Simplified Block Diagram
8-0
Page 92

Model 86601A
SECTION VIII
SERVICE
8-1. INTRODUCTION
8-2.
functioning properly.
8-3. PRINCIPLES OF OPERATION
8-4. Figure 8-1, Simplified Block Diagram, and the
following discussion illustrate the basic principles
of the Model 86601A. More detailed information
about principles of operation of the Model 86601A
may be found in the text for Service Sheet 1. In
addition, detailed information to the circuit level is
provided on the individual service sheets.
8-5. The Model 86601A RF Section has no
internal oscillators. The output frequency is
developed by mixing and filtering the precise
digitally controlled rf inputs from the mainframe.
The inputs from the mainframe are:
a.
A 500 MHz signal from the reference
section.
b. A 20 MHz signal from the reference
section which is coupled through the Modulation
Section.
II where it is mixed with the 20 to 30 MHz signal
from the mainframe SL1 Loop to provide a 450 to
460 MHz output. The output of Mixer II is filtered
and amplified, and in the AM mode, modulated
before it is coupled to Mixer III. In Mixer III the
450 to 460 MHz signal is mixed with the 350 to
450 MHz signal to produce the final output
frequency which is between. .01 and 100.999999
MHz (.01 to 109.9999 MHz when option 004
mainframe is used).
8-7. The output of Mixer III is coupled through
two 120 MHz low pass filters and a pre-amplifier to
the power amplifier.
8-8. The power amplifier assembly contains an
Automatic Gain Control circuit which controls a
feedback amplifier in the leveling loop. Code 1 and
Code 2 inputs from the mainframe DCU operate an
electronic band switch to aid in leveling the rf
output across the output range.
8-9. Three attenuators are used to control the
output level of the Model 86601A. These
attenuators function as follows:
a.
In the local mode a 150 dB programmable
attenuator, OUTPUT RANGE, controls the output
level from +10 dBm to -140 dBm in 10 dB steps.
A VERNIER control adds the capability of setting
the output level to +13 dBm and to other points
between the 10 dB steps.
NOTE
In the FM mode the 20 MHz signal is
generated in the tion tion.
b. In the remote mode the 150 dB
remotely controlled
s (OUTPUT RANGE
ive. A1 dB per step
the Model 86601A is
t the output level
e 150 dB attenuator.
8-10.0 RECOMMENDED TEST EQUIPMENT
8-11.
8-12. TROUBLESHOOTING
8-13.
8-1
Page 93

Model 86601A
Figure 8-2. Diagram of Module Exchange Program
8-3
Page 94

Model 86601A
Service
SECTION VIII
SERVICE
8-1. INTRODUCTION
8-2. This section provides instructions for testing,
troubleshooting and repairing the Hewlett-Packard
Model 86601A RF Section.
Information
throughout this section is based on the assumption
that the Model 86601A is interconnected with a
Model 8660 Synthesized Signal Generator that is
functioning properly.
8-3. PRINCIPLES OF OPERATION
8-4. Figure 8-1, Simplified Block Diagram, and the
following discussion illustrate the basic principles
of the Model 86601A. More detailed information
about principles of operation of the Model 86601A
may be found in the text for Service Sheet 1. In
addition, detailed information to the circuit level is
provided on the individual service sheets.
8-5. The Model 86601A RF Section has no
II where it is mixed with the 20 to 30 MHz signal
from the mainframe SL1 Loop to provide a 450 to
460 MHz output. The output of Mixer II is filtered
and amplified, and in the AM mode, modulated
before it is coupled to Mixer III. In Mixer III the
450 to 460 MHz signal is mixed with the 350 to
450 MHz signal to produce the final output
frequency which is between. .01 and 109.999999
MHz (01 to 109.9999 MHz when option 004
mainframe is used).
8-7. The output of Mixer III is coupled through
two 120 MHz low pass filters and a pre-amplifier to
the power amplifier.
8-8. The power amplifier assembly contains an
Automatic Gain Control circuit which controls a
feedback amplifier in the leveling loop. Code 1 and
Code 2 inputs from the mainframe DCU operate an
electronic band switch to aid in levelin
output across the output range.
8-9. Three attenuators are used to control the
output level of the Model 86601A. These
nuators function as follows:
8-6.
8-10. RECOMMENDED TEST EQUIPMENT
8-11.
8-12. TROUBLESHOOTING
8-13.
8-1
Page 95

Service
Model 86601A
8-14. The first maintenance level is designed to
utilize the Hewlett-Packard Module Exchange
Program. A troubleshooting tree enables a
relatively inexperienced technician to isolate the
cause of a malfunction to a circuit board or
assembly. A factory-repaired replacement for the
defective circuit board or assembly may be ordered
through the nearest HP Sales and Service office
using the special part numbers listed in Table 6-1.
Refer to paragraph 8-18 and to figure 8-2 for
additional information relative to the Module
Exchange Program.
8-15. The second maintenance level involves
repairing the instrument to the component level.
The troubleshooting tree, in addition to aiding in
the detection of faulty circuit boards or assemblies,
also refers the technician to the appropriate service
sheets to be used if repairs are to be accomplished
to the component level. Circuit descriptions and
test procedures for this maintenance level are
located on the page facing the schematic diagram
of the circuit to be repaired.
8-16. If the cause of a malfunction is found and
remedied in any circuit contianin
adjustable
components, the applicable adjustment procedure
in Section V of this manual should be performed.
NOTE
Do not send a defective module to the HP
office until the replacement module is
received.
8-22. Voltage Requirements. All power required to
operate the Model 86601A is provided by the main-
frame.
8-23. Servicing Aids on
Prin
Circuit Boards.
Servicing aids on printed circuit boards include
test points, transistor and integrated circuit reference designations, adjustment callouts and assembly stock numbers.
8-24. Circuit Board Extenders. Circuit board extenders are provided with the mainframe. These
extender boards enable the technician to extend
plug-in boards clear of the assembly to provide
easy access to components and test points. See
Figure 8-3 for a typical example of extender board
Use.
8-25.
otes. Table 8-1, Schematic
ovides information relative
ls
and values shown on the schematic
8-17. REPAIR
8-18. Module Exchange.
8-19.
8-20.
8-21.
8-26. Part Location Aids.
8-27.
8-28.
8-2
Page 96

Model 86601A
Figure 8-2. Diagram of Module Exchange Program
8-3
Page 97

Model 86601A
8-4
Figure 8-3.
Page 98

Model 86601A
Service
Table 8-1. Schematic Diagram Notes
Inductance is in microhenries, Resistance is in ohms and Capacitance IS in microfarads unless
otherwise noted.
part of
Screwdriver Adjustment
Encloses Front Panel
designations
Panel Control
Encloses Rear Panel
designations
Circuit assembly borderline
Other assembly borderline
Wiper moves toward CW with clockwise rotation of control as viewed from shaft or knob.
Numbers in stars on circuit assemblies show locations of test points
Encloses WIPE color
8-5
Page 99

Model 86601A
8-6
Figure 8-4.
Page 100

Model 86601A
Table 8-2. Assembly Locations
Figure 8-5.
 Loading...