

Page 1

user guide
hp StorageWorks
web tools version 3.1.x/4.1.x
Product Version: 3.1.x/4.1.x
Third Edition (June 2003)
Part Number: AA–RS25C–TE
This user guide provides information to help you install and understand Web Tools.
Page 2

© Copyright 1999-2003 Hewlett-Packard Development Company, L.P.
Hewlett-Packard Company makes no warranty of any kind with regard to this material, including, but not limited to,
the implied warranties of merchantability and fitness for a particular purpose. Hewlett-Packard shall not be liable for
errors contained herein or for incidental or consequential damages in connection with the furnishing, performance,
or use of this material.
This document contains proprietary information, which is protected by copyright. No part of this document may be
photocopied, reproduced, or translated into another language without the prior written consent of Hewlett-Packard.
The information contained in this document is subject to change without notice.
BROCADE, the Brocade B weave logo, Brocade: the Intelligent Platform for Networking Storage, SilkWorm, and
SilkWorm Express, are trademarks or registered trademarks of Brocade Communications Systems, Inc. or its
subsidiaries in the United States and/or in other countries.All other product names mentioned herein may be
trademarks of their respective companies.
Microsoft®, MS Windows®, Windows®, and Windows NT® are U.S. registered trademarks of Microsoft
Corporation.
UNIX® is a registered trademark of The Open Group.
Hewlett-Packard Company shall not be liable for technical or editorial errors or omissions contained herein. The
information is provided “as is” without warranty of any kind and is subject to change without notice. The warranties
for Hewlett-Packard Company products are set forth in the express limited warranty statements for such products.
Nothing herein should be construed as constituting an additional warranty.
Printed in the U.S.A.
Web Tools Version 3.1.x/4.1.x User Guide
Third Edition (June 2003)
Part Number: AA–RS25C–TE
Page 3

contents
About this Guide. . . . . . . . . . . . . . . . . . . . . . . . . . . . . . . . . . . . . . . . . . . . . . . . . . .17
Overview. . . . . . . . . . . . . . . . . . . . . . . . . . . . . . . . . . . . . . . . . . . . . . . . . . . . . . . . . . . . . . . . . 18
Intended Audience . . . . . . . . . . . . . . . . . . . . . . . . . . . . . . . . . . . . . . . . . . . . . . . . . . . . . . 18
Related Documentation . . . . . . . . . . . . . . . . . . . . . . . . . . . . . . . . . . . . . . . . . . . . . . . . . . 18
Conventions . . . . . . . . . . . . . . . . . . . . . . . . . . . . . . . . . . . . . . . . . . . . . . . . . . . . . . . . . . . . . . 19
Document Conventions . . . . . . . . . . . . . . . . . . . . . . . . . . . . . . . . . . . . . . . . . . . . . . . . . . 19
Text Symbols . . . . . . . . . . . . . . . . . . . . . . . . . . . . . . . . . . . . . . . . . . . . . . . . . . . . . . . . . . 19
Getting Help . . . . . . . . . . . . . . . . . . . . . . . . . . . . . . . . . . . . . . . . . . . . . . . . . . . . . . . . . . . . . . 21
HP Technical Support . . . . . . . . . . . . . . . . . . . . . . . . . . . . . . . . . . . . . . . . . . . . . . . . . . . 21
HP Storage Website . . . . . . . . . . . . . . . . . . . . . . . . . . . . . . . . . . . . . . . . . . . . . . . . . . . . . 21
HP Authorized Reseller . . . . . . . . . . . . . . . . . . . . . . . . . . . . . . . . . . . . . . . . . . . . . . . . . . 21
1 Introducing HP Web Tools . . . . . . . . . . . . . . . . . . . . . . . . . . . . . . . . . . . . . . . . . . . .23
Overview. . . . . . . . . . . . . . . . . . . . . . . . . . . . . . . . . . . . . . . . . . . . . . . . . . . . . . . . . . . . . . . . . 24
Advantages of Web Tools . . . . . . . . . . . . . . . . . . . . . . . . . . . . . . . . . . . . . . . . . . . . . . . . 24
Capabilities of Web Tools . . . . . . . . . . . . . . . . . . . . . . . . . . . . . . . . . . . . . . . . . . . . . . . . 24
Web Tools Main Views . . . . . . . . . . . . . . . . . . . . . . . . . . . . . . . . . . . . . . . . . . . . . . . . . . . . . 27
Fabric Tree . . . . . . . . . . . . . . . . . . . . . . . . . . . . . . . . . . . . . . . . . . . . . . . . . . . . . . . . . . . . 28
Fabric Management Toolbar . . . . . . . . . . . . . . . . . . . . . . . . . . . . . . . . . . . . . . . . . . . . . . 29
Switch View. . . . . . . . . . . . . . . . . . . . . . . . . . . . . . . . . . . . . . . . . . . . . . . . . . . . . . . . . . . 30
Port Information View . . . . . . . . . . . . . . . . . . . . . . . . . . . . . . . . . . . . . . . . . . . . . . . . . . . 33
Web Tools in Secure Mode . . . . . . . . . . . . . . . . . . . . . . . . . . . . . . . . . . . . . . . . . . . . . . . . . . 34
Web Tools Access and the HTTP_POLICY . . . . . . . . . . . . . . . . . . . . . . . . . . . . . . . . . . 34
Primary FCS Only Functionality . . . . . . . . . . . . . . . . . . . . . . . . . . . . . . . . . . . . . . . . . . . 34
Disabled Functionality . . . . . . . . . . . . . . . . . . . . . . . . . . . . . . . . . . . . . . . . . . . . . . . . . . . 34
Contents
2 Installation . . . . . . . . . . . . . . . . . . . . . . . . . . . . . . . . . . . . . . . . . . . . . . . . . . . . . . .35
Requirements . . . . . . . . . . . . . . . . . . . . . . . . . . . . . . . . . . . . . . . . . . . . . . . . . . . . . . . . . . . . . 36
Switch Requirements . . . . . . . . . . . . . . . . . . . . . . . . . . . . . . . . . . . . . . . . . . . . . . . . . . . . 36
Workstation Requirements. . . . . . . . . . . . . . . . . . . . . . . . . . . . . . . . . . . . . . . . . . . . . . . . 36
3Web Tools Version 3.1.x/4.1.x User Guide
Page 4

Contents
Web Browser Requirements . . . . . . . . . . . . . . . . . . . . . . . . . . . . . . . . . . . . . . . . . . . 36
Java Plug-in and JRE Requirements . . . . . . . . . . . . . . . . . . . . . . . . . . . . . . . . . . . . . 37
Installing Prerequisite Software on a Workstation. . . . . . . . . . . . . . . . . . . . . . . . . . . . . . . . . 38
Installing a Web Browser. . . . . . . . . . . . . . . . . . . . . . . . . . . . . . . . . . . . . . . . . . . . . . . . . 38
Configuring the Web Browser . . . . . . . . . . . . . . . . . . . . . . . . . . . . . . . . . . . . . . . . . . . . . 38
Configuring Netscape Communicator. . . . . . . . . . . . . . . . . . . . . . . . . . . . . . . . . . . . 38
Configuring Internet Explorer . . . . . . . . . . . . . . . . . . . . . . . . . . . . . . . . . . . . . . . . . . 39
Installing the Java Plug-in on the Workstation . . . . . . . . . . . . . . . . . . . . . . . . . . . . . . . . 39
Installing the Java Plug-in on Solaris . . . . . . . . . . . . . . . . . . . . . . . . . . . . . . . . . . . . 39
Installing a Java Patch on Solaris . . . . . . . . . . . . . . . . . . . . . . . . . . . . . . . . . . . . 40
Installing the Java Plug-in on Windows XP, 2000, or NT . . . . . . . . . . . . . . . . . . . . 40
Licensing Web Tools on the Switch. . . . . . . . . . . . . . . . . . . . . . . . . . . . . . . . . . . . . . . . . . . . 41
Installing a Web Tools License Through Telnet . . . . . . . . . . . . . . . . . . . . . . . . . . . . . . . 41
Installing Web Tools Through the Web. . . . . . . . . . . . . . . . . . . . . . . . . . . . . . . . . . . . . . 42
To Install additional Licenses Through the Web. . . . . . . . . . . . . . . . . . . . . . . . . . . . 42
Launching HP Web Tools . . . . . . . . . . . . . . . . . . . . . . . . . . . . . . . . . . . . . . . . . . . . . . . . . . . 43
3 Switch Explorer View . . . . . . . . . . . . . . . . . . . . . . . . . . . . . . . . . . . . . . . . . . . . . . .45
About the Switch Explorer View . . . . . . . . . . . . . . . . . . . . . . . . . . . . . . . . . . . . . . . . . . . . . . 46
Fabric Tree . . . . . . . . . . . . . . . . . . . . . . . . . . . . . . . . . . . . . . . . . . . . . . . . . . . . . . . . . . . . . . . 48
Fabric Toolbar . . . . . . . . . . . . . . . . . . . . . . . . . . . . . . . . . . . . . . . . . . . . . . . . . . . . . . . . . 49
Switch Graphic . . . . . . . . . . . . . . . . . . . . . . . . . . . . . . . . . . . . . . . . . . . . . . . . . . . . . . . . . . . . 51
Switch Graphic Buttons . . . . . . . . . . . . . . . . . . . . . . . . . . . . . . . . . . . . . . . . . . . . . . . . . . . . . 54
Switch Information Window . . . . . . . . . . . . . . . . . . . . . . . . . . . . . . . . . . . . . . . . . . . . . . . . . 57
Status Legend. . . . . . . . . . . . . . . . . . . . . . . . . . . . . . . . . . . . . . . . . . . . . . . . . . . . . . . . . . 58
Refresh Rates in Web Tools . . . . . . . . . . . . . . . . . . . . . . . . . . . . . . . . . . . . . . . . . . . . . . . . . . 59
Accessing the Switch Explorer. . . . . . . . . . . . . . . . . . . . . . . . . . . . . . . . . . . . . . . . . . . . . . . . 60
4 Switch Management . . . . . . . . . . . . . . . . . . . . . . . . . . . . . . . . . . . . . . . . . . . . . . . .61
About Switch Management . . . . . . . . . . . . . . . . . . . . . . . . . . . . . . . . . . . . . . . . . . . . . . . . . . 62
Switch Explorer for the Core Switch 2/64. . . . . . . . . . . . . . . . . . . . . . . . . . . . . . . . . . . . 62
Switch Explorer for SAN Switch 2/32. . . . . . . . . . . . . . . . . . . . . . . . . . . . . . . . . . . . . . . 63
Switch Information Field Descriptions . . . . . . . . . . . . . . . . . . . . . . . . . . . . . . . . . . . . . . 64
About the Switch Status Button . . . . . . . . . . . . . . . . . . . . . . . . . . . . . . . . . . . . . . . . . . . . . . . 65
Switch Status Example. . . . . . . . . . . . . . . . . . . . . . . . . . . . . . . . . . . . . . . . . . . . . . . . . . . 65
Using the Switch Status Button . . . . . . . . . . . . . . . . . . . . . . . . . . . . . . . . . . . . . . . . . . . . . . . 66
About the Switch Events Button. . . . . . . . . . . . . . . . . . . . . . . . . . . . . . . . . . . . . . . . . . . . . . . 67
Switch Events Example . . . . . . . . . . . . . . . . . . . . . . . . . . . . . . . . . . . . . . . . . . . . . . . . . . 67
Switch Events Field Descriptions . . . . . . . . . . . . . . . . . . . . . . . . . . . . . . . . . . . . . . . . . . 67
4 Web Tools Version 3.1.x/4.1.x User Guide
Page 5

Contents
Accessing the Switch Events Report . . . . . . . . . . . . . . . . . . . . . . . . . . . . . . . . . . . . . . . . . . . 69
About the Admin Button . . . . . . . . . . . . . . . . . . . . . . . . . . . . . . . . . . . . . . . . . . . . . . . . . . . . 70
About the Telnet Button . . . . . . . . . . . . . . . . . . . . . . . . . . . . . . . . . . . . . . . . . . . . . . . . . . . . . 71
Telnet and Security . . . . . . . . . . . . . . . . . . . . . . . . . . . . . . . . . . . . . . . . . . . . . . . . . . . . . 71
Telnet Example . . . . . . . . . . . . . . . . . . . . . . . . . . . . . . . . . . . . . . . . . . . . . . . . . . . . . . . . 71
Telnet Descriptions . . . . . . . . . . . . . . . . . . . . . . . . . . . . . . . . . . . . . . . . . . . . . . . . . . . . . 72
Accessing Telnet Through Web Tools . . . . . . . . . . . . . . . . . . . . . . . . . . . . . . . . . . . . . . . . . . 74
About the Performance Monitor Button. . . . . . . . . . . . . . . . . . . . . . . . . . . . . . . . . . . . . . . . . 75
About the Beacon Button . . . . . . . . . . . . . . . . . . . . . . . . . . . . . . . . . . . . . . . . . . . . . . . . . . . . 76
Beacon Button—Physically Locating a Switch in a Fabric . . . . . . . . . . . . . . . . . . . . . . . . . . 77
About the Switch Info Button. . . . . . . . . . . . . . . . . . . . . . . . . . . . . . . . . . . . . . . . . . . . . . . . . 78
Accessing Switch Information . . . . . . . . . . . . . . . . . . . . . . . . . . . . . . . . . . . . . . . . . . . . . . . . 79
About the Fabric Watch Button . . . . . . . . . . . . . . . . . . . . . . . . . . . . . . . . . . . . . . . . . . . . . . . 80
About the Fan Button . . . . . . . . . . . . . . . . . . . . . . . . . . . . . . . . . . . . . . . . . . . . . . . . . . . . . . . 81
About the Temp Button . . . . . . . . . . . . . . . . . . . . . . . . . . . . . . . . . . . . . . . . . . . . . . . . . . . . . 82
About the Power Button . . . . . . . . . . . . . . . . . . . . . . . . . . . . . . . . . . . . . . . . . . . . . . . . . . . . . 83
About HA Admin . . . . . . . . . . . . . . . . . . . . . . . . . . . . . . . . . . . . . . . . . . . . . . . . . . . . . . . . . . 84
HA Admin Example. . . . . . . . . . . . . . . . . . . . . . . . . . . . . . . . . . . . . . . . . . . . . . . . . . . . . 84
HA Admin Field Descriptions . . . . . . . . . . . . . . . . . . . . . . . . . . . . . . . . . . . . . . . . . . . . . 85
Service Tab Field Descriptions . . . . . . . . . . . . . . . . . . . . . . . . . . . . . . . . . . . . . . . . . 86
CP Tab Field Descriptions. . . . . . . . . . . . . . . . . . . . . . . . . . . . . . . . . . . . . . . . . . . . . 87
Using HA Admin . . . . . . . . . . . . . . . . . . . . . . . . . . . . . . . . . . . . . . . . . . . . . . . . . . . . . . . . . . 89
Accessing the HA Admin Interface . . . . . . . . . . . . . . . . . . . . . . . . . . . . . . . . . . . . . . . . . 89
Synchronizing Services on the CP. . . . . . . . . . . . . . . . . . . . . . . . . . . . . . . . . . . . . . . . . . 89
Initiating a CP Failover . . . . . . . . . . . . . . . . . . . . . . . . . . . . . . . . . . . . . . . . . . . . . . . . . . 90
5 Switch Admin Window . . . . . . . . . . . . . . . . . . . . . . . . . . . . . . . . . . . . . . . . . . . . . .91
About the Switch Admin Window . . . . . . . . . . . . . . . . . . . . . . . . . . . . . . . . . . . . . . . . . . . . . 92
Switch Admin Window . . . . . . . . . . . . . . . . . . . . . . . . . . . . . . . . . . . . . . . . . . . . . . . . . . 92
Switch Admin Window Field Descriptions . . . . . . . . . . . . . . . . . . . . . . . . . . . . . . . . . . . 92
Accessing the Switch Admin Window. . . . . . . . . . . . . . . . . . . . . . . . . . . . . . . . . . . . . . . . . . 94
About the Switch Information Tab. . . . . . . . . . . . . . . . . . . . . . . . . . . . . . . . . . . . . . . . . . . . . 95
Switch Information Tab Example . . . . . . . . . . . . . . . . . . . . . . . . . . . . . . . . . . . . . . . . . . 95
Switch Information Field Descriptions . . . . . . . . . . . . . . . . . . . . . . . . . . . . . . . . . . . . . . 96
Using the Switch Information Tab . . . . . . . . . . . . . . . . . . . . . . . . . . . . . . . . . . . . . . . . . . . . . 97
Enabling/Disabling a Switch . . . . . . . . . . . . . . . . . . . . . . . . . . . . . . . . . . . . . . . . . . . . . . 97
Viewing/Printing a Switch Report . . . . . . . . . . . . . . . . . . . . . . . . . . . . . . . . . . . . . . . . . . 97
About the Network Config Tab . . . . . . . . . . . . . . . . . . . . . . . . . . . . . . . . . . . . . . . . . . . . . . . 98
Syslog IP . . . . . . . . . . . . . . . . . . . . . . . . . . . . . . . . . . . . . . . . . . . . . . . . . . . . . . . . . . 98
5Web Tools Version 3.1.x/4.1.x User Guide
Page 6

Contents
Switch Identification . . . . . . . . . . . . . . . . . . . . . . . . . . . . . . . . . . . . . . . . . . . . . . . . . 98
Network Config Tab Example . . . . . . . . . . . . . . . . . . . . . . . . . . . . . . . . . . . . . . . . . . . . . 98
Network Config Field Descriptions . . . . . . . . . . . . . . . . . . . . . . . . . . . . . . . . . . . . . . . . 100
Using the Network Config Tab. . . . . . . . . . . . . . . . . . . . . . . . . . . . . . . . . . . . . . . . . . . . . . . 102
Configuring an Ethernet IP or FC IP Address . . . . . . . . . . . . . . . . . . . . . . . . . . . . . . . . 102
Configuring a Syslog IP Address. . . . . . . . . . . . . . . . . . . . . . . . . . . . . . . . . . . . . . . . . . 102
About the Upload/Download Tab. . . . . . . . . . . . . . . . . . . . . . . . . . . . . . . . . . . . . . . . . . . . . 103
Upload/Download Tab Example . . . . . . . . . . . . . . . . . . . . . . . . . . . . . . . . . . . . . . . . . . 103
Upload/Download Field Descriptions . . . . . . . . . . . . . . . . . . . . . . . . . . . . . . . . . . . . . . 104
Using the Upload/Download Tab . . . . . . . . . . . . . . . . . . . . . . . . . . . . . . . . . . . . . . . . . . . . . 106
Performing a Firmware Download. . . . . . . . . . . . . . . . . . . . . . . . . . . . . . . . . . . . . . . . . 106
Backing Up a Firmware Config File . . . . . . . . . . . . . . . . . . . . . . . . . . . . . . . . . . . . . . . 106
Performing a Config Download to Switch. . . . . . . . . . . . . . . . . . . . . . . . . . . . . . . . . . . 106
About the SNMP Tab . . . . . . . . . . . . . . . . . . . . . . . . . . . . . . . . . . . . . . . . . . . . . . . . . . . . . . 108
Security . . . . . . . . . . . . . . . . . . . . . . . . . . . . . . . . . . . . . . . . . . . . . . . . . . . . . . . . . . 108
SNMP Tab Example . . . . . . . . . . . . . . . . . . . . . . . . . . . . . . . . . . . . . . . . . . . . . . . . . . . 108
SNMP Field Descriptions . . . . . . . . . . . . . . . . . . . . . . . . . . . . . . . . . . . . . . . . . . . . . . . 109
Using the SNMP Tab to Set Trap Levels . . . . . . . . . . . . . . . . . . . . . . . . . . . . . . . . . . . . . . . 111
About the License Admin Tab . . . . . . . . . . . . . . . . . . . . . . . . . . . . . . . . . . . . . . . . . . . . . . . 112
License Admin Tab Example. . . . . . . . . . . . . . . . . . . . . . . . . . . . . . . . . . . . . . . . . . . . . 112
License Admin Field Description . . . . . . . . . . . . . . . . . . . . . . . . . . . . . . . . . . . . . . . . . 112
Using the License Admin Tab . . . . . . . . . . . . . . . . . . . . . . . . . . . . . . . . . . . . . . . . . . . . . . . 114
Add a License to a Switch . . . . . . . . . . . . . . . . . . . . . . . . . . . . . . . . . . . . . . . . . . . . . . . 114
Remove a License From a Switch . . . . . . . . . . . . . . . . . . . . . . . . . . . . . . . . . . . . . . . . . 114
About the Port Setting Tab . . . . . . . . . . . . . . . . . . . . . . . . . . . . . . . . . . . . . . . . . . . . . . . . . . 115
Port Settings Tab Example. . . . . . . . . . . . . . . . . . . . . . . . . . . . . . . . . . . . . . . . . . . . . . . 115
Port Settings Field Descriptions. . . . . . . . . . . . . . . . . . . . . . . . . . . . . . . . . . . . . . . . . . . 117
Using the Port Setting Tab . . . . . . . . . . . . . . . . . . . . . . . . . . . . . . . . . . . . . . . . . . . . . . . . . . 118
Enabling or Disabling a Port . . . . . . . . . . . . . . . . . . . . . . . . . . . . . . . . . . . . . . . . . . . . . 118
Enabling Trunking on a Port . . . . . . . . . . . . . . . . . . . . . . . . . . . . . . . . . . . . . . . . . . . . . 118
Configuring Port Speed . . . . . . . . . . . . . . . . . . . . . . . . . . . . . . . . . . . . . . . . . . . . . . . . . 118
Assigning a Name to a Port . . . . . . . . . . . . . . . . . . . . . . . . . . . . . . . . . . . . . . . . . . . . . . 119
Disabling a Port over Reboots . . . . . . . . . . . . . . . . . . . . . . . . . . . . . . . . . . . . . . . . . . . . 119
About the Configure Tab . . . . . . . . . . . . . . . . . . . . . . . . . . . . . . . . . . . . . . . . . . . . . . . . . . . 120
Configure (Fabric) Tab Example . . . . . . . . . . . . . . . . . . . . . . . . . . . . . . . . . . . . . . . . . . 120
Configure (Fabric) Field Descriptions . . . . . . . . . . . . . . . . . . . . . . . . . . . . . . . . . . . . . . 122
Virtual Channels. . . . . . . . . . . . . . . . . . . . . . . . . . . . . . . . . . . . . . . . . . . . . . . . . . . . . . . 123
Configure (Virtual Channel) Tab Example . . . . . . . . . . . . . . . . . . . . . . . . . . . . . . . . . . 124
6 Web Tools Version 3.1.x/4.1.x User Guide
Page 7

Contents
Configure (Virtual Channel) Field Descriptions . . . . . . . . . . . . . . . . . . . . . . . . . . . . . . 125
Configure (Arbitrated Loop) Tab Example . . . . . . . . . . . . . . . . . . . . . . . . . . . . . . . . . . 126
Configure (Arbitrated Loop) Field Descriptions . . . . . . . . . . . . . . . . . . . . . . . . . . . . . . 127
Configure (System) Tab Example . . . . . . . . . . . . . . . . . . . . . . . . . . . . . . . . . . . . . . . . . 128
Configure (System) Field Descriptions . . . . . . . . . . . . . . . . . . . . . . . . . . . . . . . . . . . . . 129
Using the Configure Tab to Configure FAN Frame Notification Parameters . . . . . . . . . . . 130
About the Routing Tab . . . . . . . . . . . . . . . . . . . . . . . . . . . . . . . . . . . . . . . . . . . . . . . . . . . . . 131
Navigation Tree. . . . . . . . . . . . . . . . . . . . . . . . . . . . . . . . . . . . . . . . . . . . . . . . . . . . 131
Dynamic Load Sharing . . . . . . . . . . . . . . . . . . . . . . . . . . . . . . . . . . . . . . . . . . . . . . 131
In-Order Delivery . . . . . . . . . . . . . . . . . . . . . . . . . . . . . . . . . . . . . . . . . . . . . . . . . . 131
Routing (FSPF Route) Tab Example . . . . . . . . . . . . . . . . . . . . . . . . . . . . . . . . . . . . . . . 132
Routing Field Descriptions . . . . . . . . . . . . . . . . . . . . . . . . . . . . . . . . . . . . . . . . . . . . . . 133
Routing (FSPF Route) Field Descriptions . . . . . . . . . . . . . . . . . . . . . . . . . . . . . . . . . . . 133
Routing (Static Route) Tab Example. . . . . . . . . . . . . . . . . . . . . . . . . . . . . . . . . . . . . . . 135
Routing (Static Route) Field Descriptions. . . . . . . . . . . . . . . . . . . . . . . . . . . . . . . . . . . 136
Routing (Link Cost) Tab Example. . . . . . . . . . . . . . . . . . . . . . . . . . . . . . . . . . . . . . . . . 137
Routing (Link Cost) Field Descriptions. . . . . . . . . . . . . . . . . . . . . . . . . . . . . . . . . . . . . 138
Using the Routing Tab . . . . . . . . . . . . . . . . . . . . . . . . . . . . . . . . . . . . . . . . . . . . . . . . . . . . . 139
Viewing FSPF Routing . . . . . . . . . . . . . . . . . . . . . . . . . . . . . . . . . . . . . . . . . . . . . . . . . 139
Setting up a Static Route . . . . . . . . . . . . . . . . . . . . . . . . . . . . . . . . . . . . . . . . . . . . . . . . 139
Enabling/Disabling Dynamic Load Sharing . . . . . . . . . . . . . . . . . . . . . . . . . . . . . . . . . 140
Enabling/Disabling In-Order Delivery. . . . . . . . . . . . . . . . . . . . . . . . . . . . . . . . . . . . . . 140
Configuring Link Cost . . . . . . . . . . . . . . . . . . . . . . . . . . . . . . . . . . . . . . . . . . . . . . . . . . 140
About the Extended Fabric Tab . . . . . . . . . . . . . . . . . . . . . . . . . . . . . . . . . . . . . . . . . . . . . . 142
VCXLT Initiation . . . . . . . . . . . . . . . . . . . . . . . . . . . . . . . . . . . . . . . . . . . . . . . . . . 142
Port Speed . . . . . . . . . . . . . . . . . . . . . . . . . . . . . . . . . . . . . . . . . . . . . . . . . . . . . . . . 142
Long Distance Settings . . . . . . . . . . . . . . . . . . . . . . . . . . . . . . . . . . . . . . . . . . . . . . 142
Extended Fabric Tab Example. . . . . . . . . . . . . . . . . . . . . . . . . . . . . . . . . . . . . . . . . . . . 143
Extended Fabric Field Descriptions. . . . . . . . . . . . . . . . . . . . . . . . . . . . . . . . . . . . . . . . 143
Using the Extended Fabric Tab to Configure a Port For Long-Distance . . . . . . . . . . . . . . . 145
About the Trunk Information Tab . . . . . . . . . . . . . . . . . . . . . . . . . . . . . . . . . . . . . . . . . . . . 146
Trunk Information Tab Example . . . . . . . . . . . . . . . . . . . . . . . . . . . . . . . . . . . . . . . . . . 146
Trunk Information Field Descriptions . . . . . . . . . . . . . . . . . . . . . . . . . . . . . . . . . . . . . . 147
Using the Trunk Information Tab. . . . . . . . . . . . . . . . . . . . . . . . . . . . . . . . . . . . . . . . . . . . . 148
Accessing the Trunk Information Tab . . . . . . . . . . . . . . . . . . . . . . . . . . . . . . . . . . . . . . 148
6 Performance Monitoring . . . . . . . . . . . . . . . . . . . . . . . . . . . . . . . . . . . . . . . . . . . .149
About Performance Monitor. . . . . . . . . . . . . . . . . . . . . . . . . . . . . . . . . . . . . . . . . . . . . . . . . 150
Port Throughput. . . . . . . . . . . . . . . . . . . . . . . . . . . . . . . . . . . . . . . . . . . . . . . . . . . . 150
7Web Tools Version 3.1.x/4.1.x User Guide
Page 8

Contents
Switch Throughput . . . . . . . . . . . . . . . . . . . . . . . . . . . . . . . . . . . . . . . . . . . . . . . . . 150
Basic Monitoring. . . . . . . . . . . . . . . . . . . . . . . . . . . . . . . . . . . . . . . . . . . . . . . . . . . 150
Advanced Monitoring . . . . . . . . . . . . . . . . . . . . . . . . . . . . . . . . . . . . . . . . . . . . . . . 150
Features . . . . . . . . . . . . . . . . . . . . . . . . . . . . . . . . . . . . . . . . . . . . . . . . . . . . . . . . . . 150
Performance Monitor Example . . . . . . . . . . . . . . . . . . . . . . . . . . . . . . . . . . . . . . . . . . . 152
Using the Performance Monitor . . . . . . . . . . . . . . . . . . . . . . . . . . . . . . . . . . . . . . . . . . . . . . 153
About the Actions Menu. . . . . . . . . . . . . . . . . . . . . . . . . . . . . . . . . . . . . . . . . . . . . . . . . . . . 154
Actions Menu Example . . . . . . . . . . . . . . . . . . . . . . . . . . . . . . . . . . . . . . . . . . . . . . . . . 154
Actions Menu Descriptions . . . . . . . . . . . . . . . . . . . . . . . . . . . . . . . . . . . . . . . . . . . . . . 154
Display Canvas Configurations Example . . . . . . . . . . . . . . . . . . . . . . . . . . . . . . . . . . . 155
Display Canvas Configuration Descriptions . . . . . . . . . . . . . . . . . . . . . . . . . . . . . . . . . 156
Save Canvas Configuration Example. . . . . . . . . . . . . . . . . . . . . . . . . . . . . . . . . . . . . . . 157
Save Canvas Configuration Descriptions. . . . . . . . . . . . . . . . . . . . . . . . . . . . . . . . . . . . 157
Display Resource Usage Example . . . . . . . . . . . . . . . . . . . . . . . . . . . . . . . . . . . . . . . . . 158
Display Resource Usage Descriptions . . . . . . . . . . . . . . . . . . . . . . . . . . . . . . . . . . . . . . 159
Print All Graphs . . . . . . . . . . . . . . . . . . . . . . . . . . . . . . . . . . . . . . . . . . . . . . . . . . . . . . . 160
Using the Actions Menu. . . . . . . . . . . . . . . . . . . . . . . . . . . . . . . . . . . . . . . . . . . . . . . . . . . . 161
Adding a Graph to a Canvas . . . . . . . . . . . . . . . . . . . . . . . . . . . . . . . . . . . . . . . . . . . . . 161
Changing an Existing Graph . . . . . . . . . . . . . . . . . . . . . . . . . . . . . . . . . . . . . . . . . . . . . 161
Printing Graphs . . . . . . . . . . . . . . . . . . . . . . . . . . . . . . . . . . . . . . . . . . . . . . . . . . . . . . . 162
About the Performance Graphs Menu . . . . . . . . . . . . . . . . . . . . . . . . . . . . . . . . . . . . . . . . . 163
About Basic Monitoring . . . . . . . . . . . . . . . . . . . . . . . . . . . . . . . . . . . . . . . . . . . . . . . . . . . . 164
Basic Monitoring Example . . . . . . . . . . . . . . . . . . . . . . . . . . . . . . . . . . . . . . . . . . . . . . 164
Basic Monitoring Descriptions . . . . . . . . . . . . . . . . . . . . . . . . . . . . . . . . . . . . . . . . . . . 165
Using Basic Performance Monitoring . . . . . . . . . . . . . . . . . . . . . . . . . . . . . . . . . . . . . . . . . 167
Creating a Port Throughput Graph. . . . . . . . . . . . . . . . . . . . . . . . . . . . . . . . . . . . . . . . . 167
Creating a Snapshot of Port Errors. . . . . . . . . . . . . . . . . . . . . . . . . . . . . . . . . . . . . . . . . 167
About Advanced Monitoring (Optional) . . . . . . . . . . . . . . . . . . . . . . . . . . . . . . . . . . . . . . . 168
Advanced Monitoring Example. . . . . . . . . . . . . . . . . . . . . . . . . . . . . . . . . . . . . . . . . . . 168
Advanced Monitoring Descriptions. . . . . . . . . . . . . . . . . . . . . . . . . . . . . . . . . . . . . . . . 168
Using Advanced Performance Monitoring. . . . . . . . . . . . . . . . . . . . . . . . . . . . . . . . . . . . . . 170
Creating an SID/DID Performance Graph. . . . . . . . . . . . . . . . . . . . . . . . . . . . . . . . . . . 170
Creating an SCSI vs. IP Traffic Graph. . . . . . . . . . . . . . . . . . . . . . . . . . . . . . . . . . . . . . 170
7 Fabric Watch . . . . . . . . . . . . . . . . . . . . . . . . . . . . . . . . . . . . . . . . . . . . . . . . . . . .171
About Fabric Watch . . . . . . . . . . . . . . . . . . . . . . . . . . . . . . . . . . . . . . . . . . . . . . . . . . . . . . . 172
Accessing Fabric Watch . . . . . . . . . . . . . . . . . . . . . . . . . . . . . . . . . . . . . . . . . . . . . . . . . . . . 173
About the Alarm Notification Tab . . . . . . . . . . . . . . . . . . . . . . . . . . . . . . . . . . . . . . . . . . . . 174
Alarm Notification Tab Example. . . . . . . . . . . . . . . . . . . . . . . . . . . . . . . . . . . . . . . . . . 174
8 Web Tools Version 3.1.x/4.1.x User Guide
Page 9

Contents
Alarm Notification Field Descriptions. . . . . . . . . . . . . . . . . . . . . . . . . . . . . . . . . . . . . . 175
Using the Alarm Notification Tab . . . . . . . . . . . . . . . . . . . . . . . . . . . . . . . . . . . . . . . . . . . . 176
About the Threshold Configuration Tab. . . . . . . . . . . . . . . . . . . . . . . . . . . . . . . . . . . . . . . . 177
Threshold Configuration Tab Example . . . . . . . . . . . . . . . . . . . . . . . . . . . . . . . . . . . . . 177
Threshold Notification Fields Descriptions . . . . . . . . . . . . . . . . . . . . . . . . . . . . . . . . . . 178
Using the Threshold Configuration Tab. . . . . . . . . . . . . . . . . . . . . . . . . . . . . . . . . . . . . . . . 181
Configuring Boundary and Alarm Settings . . . . . . . . . . . . . . . . . . . . . . . . . . . . . . . . . . 181
Enable/Disable Alarm Configurations. . . . . . . . . . . . . . . . . . . . . . . . . . . . . . . . . . . . . . 181
Setting the Behavior Type of an Alarm . . . . . . . . . . . . . . . . . . . . . . . . . . . . . . . . . . . . . 182
View an Alarm Configuration Report . . . . . . . . . . . . . . . . . . . . . . . . . . . . . . . . . . . . . . 182
About the Email Configuration Tab . . . . . . . . . . . . . . . . . . . . . . . . . . . . . . . . . . . . . . . . . . . 183
Email Configuration Tab Example . . . . . . . . . . . . . . . . . . . . . . . . . . . . . . . . . . . . . . . . 183
Email Configuration Field Descriptions . . . . . . . . . . . . . . . . . . . . . . . . . . . . . . . . . . . . 184
Using the Email Configuration Tab . . . . . . . . . . . . . . . . . . . . . . . . . . . . . . . . . . . . . . . . . . . 185
8 Fabric Management . . . . . . . . . . . . . . . . . . . . . . . . . . . . . . . . . . . . . . . . . . . . . . .187
About Fabric Management . . . . . . . . . . . . . . . . . . . . . . . . . . . . . . . . . . . . . . . . . . . . . . . . . . 188
Fabric Toolbar Example. . . . . . . . . . . . . . . . . . . . . . . . . . . . . . . . . . . . . . . . . . . . . . . . . 188
Fabric Toolbar Descriptions. . . . . . . . . . . . . . . . . . . . . . . . . . . . . . . . . . . . . . . . . . . . . . 188
Using Fabric Management . . . . . . . . . . . . . . . . . . . . . . . . . . . . . . . . . . . . . . . . . . . . . . . . . . 189
About Fabric Events . . . . . . . . . . . . . . . . . . . . . . . . . . . . . . . . . . . . . . . . . . . . . . . . . . . . . . . 190
Fabric Events Example . . . . . . . . . . . . . . . . . . . . . . . . . . . . . . . . . . . . . . . . . . . . . . . . . 190
Fabric Events Descriptions . . . . . . . . . . . . . . . . . . . . . . . . . . . . . . . . . . . . . . . . . . . . . . 190
Accessing Fabric Events . . . . . . . . . . . . . . . . . . . . . . . . . . . . . . . . . . . . . . . . . . . . . . . . 191
About the Fabric Topology. . . . . . . . . . . . . . . . . . . . . . . . . . . . . . . . . . . . . . . . . . . . . . . . . . 192
Fabric Topology Example . . . . . . . . . . . . . . . . . . . . . . . . . . . . . . . . . . . . . . . . . . . . . . . 192
Fabric Topology Descriptions . . . . . . . . . . . . . . . . . . . . . . . . . . . . . . . . . . . . . . . . . . . . 193
Printing a Fabric Topology Report . . . . . . . . . . . . . . . . . . . . . . . . . . . . . . . . . . . . . . . . 193
About the Name Server . . . . . . . . . . . . . . . . . . . . . . . . . . . . . . . . . . . . . . . . . . . . . . . . . . . . 195
Name Server Example . . . . . . . . . . . . . . . . . . . . . . . . . . . . . . . . . . . . . . . . . . . . . . . . . . 195
Name Server Field Descriptions . . . . . . . . . . . . . . . . . . . . . . . . . . . . . . . . . . . . . . . . . . 195
Viewing the Name Server . . . . . . . . . . . . . . . . . . . . . . . . . . . . . . . . . . . . . . . . . . . . . . . 197
About Zoning . . . . . . . . . . . . . . . . . . . . . . . . . . . . . . . . . . . . . . . . . . . . . . . . . . . . . . . . . . . . 198
9 Zone Administration . . . . . . . . . . . . . . . . . . . . . . . . . . . . . . . . . . . . . . . . . . . . . . .199
About Zone Administration . . . . . . . . . . . . . . . . . . . . . . . . . . . . . . . . . . . . . . . . . . . . . . . . . 200
Alias Description . . . . . . . . . . . . . . . . . . . . . . . . . . . . . . . . . . . . . . . . . . . . . . . . . . . . . . 200
Zone Description . . . . . . . . . . . . . . . . . . . . . . . . . . . . . . . . . . . . . . . . . . . . . . . . . . . . . . 200
Configuration Description . . . . . . . . . . . . . . . . . . . . . . . . . . . . . . . . . . . . . . . . . . . . . . . 200
9Web Tools Version 3.1.x/4.1.x User Guide
Page 10

Contents
Sample Configuration . . . . . . . . . . . . . . . . . . . . . . . . . . . . . . . . . . . . . . . . . . . . . . . . . . 201
Zoning Schemes. . . . . . . . . . . . . . . . . . . . . . . . . . . . . . . . . . . . . . . . . . . . . . . . . . . . . . . 201
Security . . . . . . . . . . . . . . . . . . . . . . . . . . . . . . . . . . . . . . . . . . . . . . . . . . . . . . . . . . . . . 201
Zoning Methods . . . . . . . . . . . . . . . . . . . . . . . . . . . . . . . . . . . . . . . . . . . . . . . . . . . . . . . 202
Selecting the Zoning Method . . . . . . . . . . . . . . . . . . . . . . . . . . . . . . . . . . . . . . . . . 202
Zoning Method and Tabs Available . . . . . . . . . . . . . . . . . . . . . . . . . . . . . . . . . . . . 202
Zoning Method and Hard or Soft Zoning Enforcement . . . . . . . . . . . . . . . . . . . . . 203
Using the Zone Administration Window . . . . . . . . . . . . . . . . . . . . . . . . . . . . . . . . . . . . . . . 204
Accessing the Zone Administration Window . . . . . . . . . . . . . . . . . . . . . . . . . . . . . . . . 204
Viewing the Enabled Zone Configuration . . . . . . . . . . . . . . . . . . . . . . . . . . . . . . . . . . . 204
About the File Menu. . . . . . . . . . . . . . . . . . . . . . . . . . . . . . . . . . . . . . . . . . . . . . . . . . . . . . . 205
Using the File Menu . . . . . . . . . . . . . . . . . . . . . . . . . . . . . . . . . . . . . . . . . . . . . . . . . . . . . . . 206
About the Edit Menu . . . . . . . . . . . . . . . . . . . . . . . . . . . . . . . . . . . . . . . . . . . . . . . . . . . . . . 207
Using the Edit Menu. . . . . . . . . . . . . . . . . . . . . . . . . . . . . . . . . . . . . . . . . . . . . . . . . . . . . . . 208
Adding a WWN in the Zoning Database . . . . . . . . . . . . . . . . . . . . . . . . . . . . . . . . . . . . 208
Deleting a WWN in the Zoning Database . . . . . . . . . . . . . . . . . . . . . . . . . . . . . . . . . . . 208
Replacing a WWN in the Zoning Database . . . . . . . . . . . . . . . . . . . . . . . . . . . . . . . . . . 209
Searching For a Zone Member. . . . . . . . . . . . . . . . . . . . . . . . . . . . . . . . . . . . . . . . . . . . 209
About the View Menu . . . . . . . . . . . . . . . . . . . . . . . . . . . . . . . . . . . . . . . . . . . . . . . . . . . . . 210
Using the View Menu. . . . . . . . . . . . . . . . . . . . . . . . . . . . . . . . . . . . . . . . . . . . . . . . . . . . . . 211
Select a Zoning Method . . . . . . . . . . . . . . . . . . . . . . . . . . . . . . . . . . . . . . . . . . . . . . . . . 211
Refresh Zoning. . . . . . . . . . . . . . . . . . . . . . . . . . . . . . . . . . . . . . . . . . . . . . . . . . . . . . . . 211
Refresh the Fabric . . . . . . . . . . . . . . . . . . . . . . . . . . . . . . . . . . . . . . . . . . . . . . . . . . . . . 212
About the Actions Menu. . . . . . . . . . . . . . . . . . . . . . . . . . . . . . . . . . . . . . . . . . . . . . . . . . . . 213
Enable a Config Option . . . . . . . . . . . . . . . . . . . . . . . . . . . . . . . . . . . . . . . . . . . . . . 213
Disable Zoning Option . . . . . . . . . . . . . . . . . . . . . . . . . . . . . . . . . . . . . . . . . . . . . . 213
Using the Actions Menu. . . . . . . . . . . . . . . . . . . . . . . . . . . . . . . . . . . . . . . . . . . . . . . . . . . . 214
Enabling a Configuration. . . . . . . . . . . . . . . . . . . . . . . . . . . . . . . . . . . . . . . . . . . . . . . . 214
Disabling Zoning . . . . . . . . . . . . . . . . . . . . . . . . . . . . . . . . . . . . . . . . . . . . . . . . . . . . . . 215
Saving Changes to an Existing Configuration . . . . . . . . . . . . . . . . . . . . . . . . . . . . . . . . 215
Clearing the Zoning Database . . . . . . . . . . . . . . . . . . . . . . . . . . . . . . . . . . . . . . . . . . . . 215
About the Alias Tab . . . . . . . . . . . . . . . . . . . . . . . . . . . . . . . . . . . . . . . . . . . . . . . . . . . . . . . 217
Alias Tab Example. . . . . . . . . . . . . . . . . . . . . . . . . . . . . . . . . . . . . . . . . . . . . . . . . . . . . 217
Alias Tab Descriptions. . . . . . . . . . . . . . . . . . . . . . . . . . . . . . . . . . . . . . . . . . . . . . . . . . 218
Using the Alias Tab . . . . . . . . . . . . . . . . . . . . . . . . . . . . . . . . . . . . . . . . . . . . . . . . . . . . . . . 220
Creating an Alias . . . . . . . . . . . . . . . . . . . . . . . . . . . . . . . . . . . . . . . . . . . . . . . . . . . . . . 220
Modifying the Members of an Alias . . . . . . . . . . . . . . . . . . . . . . . . . . . . . . . . . . . . . . . 221
Deleting an Alias . . . . . . . . . . . . . . . . . . . . . . . . . . . . . . . . . . . . . . . . . . . . . . . . . . . . . . 221
10 Web Tools Version 3.1.x/4.1.x User Guide
Page 11

Contents
Renaming an Alias. . . . . . . . . . . . . . . . . . . . . . . . . . . . . . . . . . . . . . . . . . . . . . . . . . . . . 221
About the Zone Tab . . . . . . . . . . . . . . . . . . . . . . . . . . . . . . . . . . . . . . . . . . . . . . . . . . . . . . . 223
Zone Tab Example. . . . . . . . . . . . . . . . . . . . . . . . . . . . . . . . . . . . . . . . . . . . . . . . . . . . . 223
Zone Tab Descriptions. . . . . . . . . . . . . . . . . . . . . . . . . . . . . . . . . . . . . . . . . . . . . . . . . . 223
Using the Zone Tab . . . . . . . . . . . . . . . . . . . . . . . . . . . . . . . . . . . . . . . . . . . . . . . . . . . . . . . 226
Creating a Zone . . . . . . . . . . . . . . . . . . . . . . . . . . . . . . . . . . . . . . . . . . . . . . . . . . . . . . . 226
Modifying the Members of a Zone . . . . . . . . . . . . . . . . . . . . . . . . . . . . . . . . . . . . . . . . 227
Deleting an Zone . . . . . . . . . . . . . . . . . . . . . . . . . . . . . . . . . . . . . . . . . . . . . . . . . . . . . . 227
Renaming a Zone . . . . . . . . . . . . . . . . . . . . . . . . . . . . . . . . . . . . . . . . . . . . . . . . . . . . . . 227
About the QuickLoop Tab . . . . . . . . . . . . . . . . . . . . . . . . . . . . . . . . . . . . . . . . . . . . . . . . . . 229
QuickLoop Tab Example. . . . . . . . . . . . . . . . . . . . . . . . . . . . . . . . . . . . . . . . . . . . . . . . 229
QuickLoop Tab Descriptions. . . . . . . . . . . . . . . . . . . . . . . . . . . . . . . . . . . . . . . . . . . . . 229
Using the QuickLoop Tab . . . . . . . . . . . . . . . . . . . . . . . . . . . . . . . . . . . . . . . . . . . . . . . . . . 231
Creating a QuickLoop . . . . . . . . . . . . . . . . . . . . . . . . . . . . . . . . . . . . . . . . . . . . . . . . . . 231
Modifying the Members of a QuickLoop . . . . . . . . . . . . . . . . . . . . . . . . . . . . . . . . . . . 232
Deleting an QuickLoop . . . . . . . . . . . . . . . . . . . . . . . . . . . . . . . . . . . . . . . . . . . . . . . . . 232
Renaming a QuickLoop . . . . . . . . . . . . . . . . . . . . . . . . . . . . . . . . . . . . . . . . . . . . . . . . . 233
About the Fabric Assist Tab . . . . . . . . . . . . . . . . . . . . . . . . . . . . . . . . . . . . . . . . . . . . . . . . . 234
Fabric Assist Example . . . . . . . . . . . . . . . . . . . . . . . . . . . . . . . . . . . . . . . . . . . . . . . . . . 234
Fabric Assist Descriptions . . . . . . . . . . . . . . . . . . . . . . . . . . . . . . . . . . . . . . . . . . . . . . . 235
Using the Fabric Assist Tab . . . . . . . . . . . . . . . . . . . . . . . . . . . . . . . . . . . . . . . . . . . . . . . . . 237
Creating a Fabric Assist Zone . . . . . . . . . . . . . . . . . . . . . . . . . . . . . . . . . . . . . . . . . . . . 237
Modifying the Members of a Fabric Assist Zone . . . . . . . . . . . . . . . . . . . . . . . . . . . . . 237
Deleting an Fabric Assist Zone . . . . . . . . . . . . . . . . . . . . . . . . . . . . . . . . . . . . . . . . . . . 238
Renaming a Fabric Assist Zone . . . . . . . . . . . . . . . . . . . . . . . . . . . . . . . . . . . . . . . . . . . 238
About the Config Tab. . . . . . . . . . . . . . . . . . . . . . . . . . . . . . . . . . . . . . . . . . . . . . . . . . . . . . 240
Config Tab Example . . . . . . . . . . . . . . . . . . . . . . . . . . . . . . . . . . . . . . . . . . . . . . . . . . . 240
Config Tab Descriptions . . . . . . . . . . . . . . . . . . . . . . . . . . . . . . . . . . . . . . . . . . . . . . . . 240
Using the Config Tab . . . . . . . . . . . . . . . . . . . . . . . . . . . . . . . . . . . . . . . . . . . . . . . . . . . . . . 243
Creating a Configuration . . . . . . . . . . . . . . . . . . . . . . . . . . . . . . . . . . . . . . . . . . . . . . . . 243
Modifying the Members of a Config . . . . . . . . . . . . . . . . . . . . . . . . . . . . . . . . . . . . . . . 244
Deleting a Config. . . . . . . . . . . . . . . . . . . . . . . . . . . . . . . . . . . . . . . . . . . . . . . . . . . . . . 245
Renaming a Config . . . . . . . . . . . . . . . . . . . . . . . . . . . . . . . . . . . . . . . . . . . . . . . . . . . . 245
Creating a Configuration Analysis Report. . . . . . . . . . . . . . . . . . . . . . . . . . . . . . . . . . . 246
10 Port Management . . . . . . . . . . . . . . . . . . . . . . . . . . . . . . . . . . . . . . . . . . . . . . . . .249
About Port Management. . . . . . . . . . . . . . . . . . . . . . . . . . . . . . . . . . . . . . . . . . . . . . . . . . . . 250
Using Port Management . . . . . . . . . . . . . . . . . . . . . . . . . . . . . . . . . . . . . . . . . . . . . . . . . . . . 251
Enabling or Disabling a Port . . . . . . . . . . . . . . . . . . . . . . . . . . . . . . . . . . . . . . . . . . . . . 251
11Web Tools Version 3.1.x/4.1.x User Guide
Page 12

Contents
Enabling Trunking on a Port . . . . . . . . . . . . . . . . . . . . . . . . . . . . . . . . . . . . . . . . . . . . . 251
Configuring Port Speed . . . . . . . . . . . . . . . . . . . . . . . . . . . . . . . . . . . . . . . . . . . . . . . . . 252
Assigning a Name to a Port . . . . . . . . . . . . . . . . . . . . . . . . . . . . . . . . . . . . . . . . . . . . . . 252
About the Port Graphic. . . . . . . . . . . . . . . . . . . . . . . . . . . . . . . . . . . . . . . . . . . . . . . . . . . . . 253
Port Graphic Example . . . . . . . . . . . . . . . . . . . . . . . . . . . . . . . . . . . . . . . . . . . . . . . . . . 253
Using the Port Graphic . . . . . . . . . . . . . . . . . . . . . . . . . . . . . . . . . . . . . . . . . . . . . . . . . . . . . 254
About the Port Information View. . . . . . . . . . . . . . . . . . . . . . . . . . . . . . . . . . . . . . . . . . . . . 255
PortStats Tab Example. . . . . . . . . . . . . . . . . . . . . . . . . . . . . . . . . . . . . . . . . . . . . . . . . . 255
PortStats Tab Descriptions. . . . . . . . . . . . . . . . . . . . . . . . . . . . . . . . . . . . . . . . . . . . . . . 256
SFP Tab Example. . . . . . . . . . . . . . . . . . . . . . . . . . . . . . . . . . . . . . . . . . . . . . . . . . . . . . 258
SFP Tab Descriptions. . . . . . . . . . . . . . . . . . . . . . . . . . . . . . . . . . . . . . . . . . . . . . . . . . . 258
Loop Tab Example. . . . . . . . . . . . . . . . . . . . . . . . . . . . . . . . . . . . . . . . . . . . . . . . . . . . . 260
Loop Tab Descriptions. . . . . . . . . . . . . . . . . . . . . . . . . . . . . . . . . . . . . . . . . . . . . . . . . . 261
11 Troubleshooting Web Tools . . . . . . . . . . . . . . . . . . . . . . . . . . . . . . . . . . . . . . . . . .263
Web Tools Limitations . . . . . . . . . . . . . . . . . . . . . . . . . . . . . . . . . . . . . . . . . . . . . . . . . . . . . 264
Core Switch 2/64 in Web Tools. . . . . . . . . . . . . . . . . . . . . . . . . . . . . . . . . . . . . . . . . . . 264
Zoning in Web Tools . . . . . . . . . . . . . . . . . . . . . . . . . . . . . . . . . . . . . . . . . . . . . . . . . . . 264
Refresh Limitations in Web Tools. . . . . . . . . . . . . . . . . . . . . . . . . . . . . . . . . . . . . . . . . 265
Telnet Button and Web Tools . . . . . . . . . . . . . . . . . . . . . . . . . . . . . . . . . . . . . . . . . . . . 266
Web Tools and Windows. . . . . . . . . . . . . . . . . . . . . . . . . . . . . . . . . . . . . . . . . . . . . . . . 266
Web Tools and Netscape on Solaris . . . . . . . . . . . . . . . . . . . . . . . . . . . . . . . . . . . . 267
Web Tools and the JRE . . . . . . . . . . . . . . . . . . . . . . . . . . . . . . . . . . . . . . . . . . . . . . 268
Web Tools and Firmware Download . . . . . . . . . . . . . . . . . . . . . . . . . . . . . . . . . . . . . . . . . . 269
Glossary. . . . . . . . . . . . . . . . . . . . . . . . . . . . . . . . . . . . . . . . . . . . . . . . . . . . . . . .271
Index . . . . . . . . . . . . . . . . . . . . . . . . . . . . . . . . . . . . . . . . . . . . . . . . . . . . . . . . . .303
Figures
1 Web Tools Switch Explorer View for a Core Switch 2/64 . . . . . . . . . . . . . . . . . . . . . . . 28
2 Fabric Tree . . . . . . . . . . . . . . . . . . . . . . . . . . . . . . . . . . . . . . . . . . . . . . . . . . . . . . . . . . . . 29
3 Fabric Management Toolbar . . . . . . . . . . . . . . . . . . . . . . . . . . . . . . . . . . . . . . . . . . . . . . 29
4 Switch View. . . . . . . . . . . . . . . . . . . . . . . . . . . . . . . . . . . . . . . . . . . . . . . . . . . . . . . . . . . 31
5 Port Information View . . . . . . . . . . . . . . . . . . . . . . . . . . . . . . . . . . . . . . . . . . . . . . . . . . . 33
6 Switch Explorer for a Core Switch 2/64 . . . . . . . . . . . . . . . . . . . . . . . . . . . . . . . . . . . . . 47
7 List of Switches in the Fabric Tree View. . . . . . . . . . . . . . . . . . . . . . . . . . . . . . . . . . . . . 48
8 Fabric Toolbar . . . . . . . . . . . . . . . . . . . . . . . . . . . . . . . . . . . . . . . . . . . . . . . . . . . . . . . . . 49
9 Example Switch View for a Core Switch 2/64 . . . . . . . . . . . . . . . . . . . . . . . . . . . . . . . . 52
12 Web Tools Version 3.1.x/4.1.x User Guide
Page 13

Contents
10 Example Switch View for a SAN Switch 2/32 . . . . . . . . . . . . . . . . . . . . . . . . . . . . . . . . 53
11 Example of the Switch Explorer for the Core Switch 2/64 . . . . . . . . . . . . . . . . . . . . . . . 62
12 Example of the Switch Explorer for the SAN Switch 2/32 . . . . . . . . . . . . . . . . . . . . . . . 63
13 Switch Status Window . . . . . . . . . . . . . . . . . . . . . . . . . . . . . . . . . . . . . . . . . . . . . . . . . . . 65
14 Switch Events Window . . . . . . . . . . . . . . . . . . . . . . . . . . . . . . . . . . . . . . . . . . . . . . . . . . 67
15 Telnet Disabled Banner when in Secure Mode . . . . . . . . . . . . . . . . . . . . . . . . . . . . . . . . 71
16 Telnet Sample Window . . . . . . . . . . . . . . . . . . . . . . . . . . . . . . . . . . . . . . . . . . . . . . . . . . 72
17 HA Admin Window. . . . . . . . . . . . . . . . . . . . . . . . . . . . . . . . . . . . . . . . . . . . . . . . . . . . . 85
18 Switch Information Tab of the Switch Admin Window . . . . . . . . . . . . . . . . . . . . . . . . . 95
19 Network Configuration Tab of the Switch Admin Window . . . . . . . . . . . . . . . . . . . . . . 99
20 Advanced IP Configuration Window (Core Switch 2/64 only). . . . . . . . . . . . . . . . . . . 100
21 Upload/Download Tab of the Switch Admin Window . . . . . . . . . . . . . . . . . . . . . . . . . 104
22 SNMP Tab of the Switch Admin Window . . . . . . . . . . . . . . . . . . . . . . . . . . . . . . . . . . 109
23 License Admin Tab of the Switch Admin Window. . . . . . . . . . . . . . . . . . . . . . . . . . . . 112
24 Port Settings Tab of the Switch Admin Window. . . . . . . . . . . . . . . . . . . . . . . . . . . . . . 116
25 Configure (Fabric) Tab of the Switch Admin Window . . . . . . . . . . . . . . . . . . . . . . . . . 121
26 Configure (Virtual Channel) Tab of the Switch Admin Window . . . . . . . . . . . . . . . . . 124
27 Configure (Arbitrated Loop) Tab of the Switch Admin Window . . . . . . . . . . . . . . . . . 126
28 Configure (System) Tab of the Switch Admin Window . . . . . . . . . . . . . . . . . . . . . . . . 128
29 Routing (FSPF Route) Tab of the Switch Admin Window . . . . . . . . . . . . . . . . . . . . . . 132
30 Routing (Static Route) Tab of the Switch Admin Window. . . . . . . . . . . . . . . . . . . . . . 135
31 Routing (Link Cost) Tab of the Switch Admin Window. . . . . . . . . . . . . . . . . . . . . . . . 137
32 Extended Fabric Tab of the Switch Admin Window. . . . . . . . . . . . . . . . . . . . . . . . . . . 143
33 Trunk Information Tab of the Switch Admin Window . . . . . . . . . . . . . . . . . . . . . . . . . 146
34 Performance Monitor Window . . . . . . . . . . . . . . . . . . . . . . . . . . . . . . . . . . . . . . . . . . . 152
35 Performance Monitor Actions Menu . . . . . . . . . . . . . . . . . . . . . . . . . . . . . . . . . . . . . . . 154
36 Display Canvas Configuration Example . . . . . . . . . . . . . . . . . . . . . . . . . . . . . . . . . . . . 156
37 Save Canvas Configuration Example. . . . . . . . . . . . . . . . . . . . . . . . . . . . . . . . . . . . . . . 157
38 Display Resource Usage Example for Core Switch 2/64. . . . . . . . . . . . . . . . . . . . . . . . 159
39 Port Throughput Setup Example on a Core Switch 2/64 . . . . . . . . . . . . . . . . . . . . . . . . 164
40 SCSI Write on a LUN Per Port Setup Example on a SAN Switch 2/32 . . . . . . . . . . . . 168
41 Alarm Notification Tab of Fabric Watch. . . . . . . . . . . . . . . . . . . . . . . . . . . . . . . . . . . . 174
42 Threshold Configuration Area Configuration Tab. . . . . . . . . . . . . . . . . . . . . . . . . . . . . 177
43 Email Configuration Tab . . . . . . . . . . . . . . . . . . . . . . . . . . . . . . . . . . . . . . . . . . . . . . . . 183
44 Fabric Management Toolbar . . . . . . . . . . . . . . . . . . . . . . . . . . . . . . . . . . . . . . . . . . . . . 188
45 The Fabric Events Window . . . . . . . . . . . . . . . . . . . . . . . . . . . . . . . . . . . . . . . . . . . . . . 190
46 Fabric Topology Window . . . . . . . . . . . . . . . . . . . . . . . . . . . . . . . . . . . . . . . . . . . . . . . 192
47 Name Server Table Window . . . . . . . . . . . . . . . . . . . . . . . . . . . . . . . . . . . . . . . . . . . . . 195
13Web Tools Version 3.1.x/4.1.x User Guide
Page 14

Contents
48 View drop-down Menu of the Zone Administration Window. . . . . . . . . . . . . . . . . . . . 202
49 Zoning Configuration summary. . . . . . . . . . . . . . . . . . . . . . . . . . . . . . . . . . . . . . . . . . . 206
50 Enable Config Dialog Box. . . . . . . . . . . . . . . . . . . . . . . . . . . . . . . . . . . . . . . . . . . . . . . 214
51 Alias Tab in the Zone Administration Window. . . . . . . . . . . . . . . . . . . . . . . . . . . . . . . 217
52 Zone Tab in the Zone Administration Window . . . . . . . . . . . . . . . . . . . . . . . . . . . . . . . 223
53 QuickLoop Tab in the Zone Administration Window. . . . . . . . . . . . . . . . . . . . . . . . . . 229
54 Fabric Assist Tab in the Zone Administration Window . . . . . . . . . . . . . . . . . . . . . . . . 234
55 Config tab in the Zone Administration window . . . . . . . . . . . . . . . . . . . . . . . . . . . . . . 240
56 Analyze Config Report Example . . . . . . . . . . . . . . . . . . . . . . . . . . . . . . . . . . . . . . . . . . 246
57 Example port graphics (located within the Switch Graphic) . . . . . . . . . . . . . . . . . . . . . 253
58 PortStats tab of the Port Information window . . . . . . . . . . . . . . . . . . . . . . . . . . . . . . . . 256
59 SFP Tab of the Port Information Window. . . . . . . . . . . . . . . . . . . . . . . . . . . . . . . . . . . 258
60 Loop Tab of the Port Information Window . . . . . . . . . . . . . . . . . . . . . . . . . . . . . . . . . . 261
Tables
1 Document Conventions . . . . . . . . . . . . . . . . . . . . . . . . . . . . . . . . . . . . . . . . . . . . . . . . . . 19
2 Fabric Management Tasks . . . . . . . . . . . . . . . . . . . . . . . . . . . . . . . . . . . . . . . . . . . . . . . . 25
3 Switch Management Tasks . . . . . . . . . . . . . . . . . . . . . . . . . . . . . . . . . . . . . . . . . . . . . . . 25
4 Port Management Tasks. . . . . . . . . . . . . . . . . . . . . . . . . . . . . . . . . . . . . . . . . . . . . . . . . . 26
5 Fabric Tree Field Descriptions. . . . . . . . . . . . . . . . . . . . . . . . . . . . . . . . . . . . . . . . . . . . . 49
6 Fabric Toolbar Buttons . . . . . . . . . . . . . . . . . . . . . . . . . . . . . . . . . . . . . . . . . . . . . . . . . . 50
7 Switch Panel Buttons . . . . . . . . . . . . . . . . . . . . . . . . . . . . . . . . . . . . . . . . . . . . . . . . . . . . 54
8 Switch Information Window . . . . . . . . . . . . . . . . . . . . . . . . . . . . . . . . . . . . . . . . . . . . . . 57
9 Polling Rate in the Switch Explorer Window . . . . . . . . . . . . . . . . . . . . . . . . . . . . . . . . . 59
10 Switch Information View. . . . . . . . . . . . . . . . . . . . . . . . . . . . . . . . . . . . . . . . . . . . . . . . . 64
11 Switch Events Field Descriptions . . . . . . . . . . . . . . . . . . . . . . . . . . . . . . . . . . . . . . . . . . 67
12 Telnet Window Field Descriptions . . . . . . . . . . . . . . . . . . . . . . . . . . . . . . . . . . . . . . . . . 72
13 Info Button Fields Descriptions . . . . . . . . . . . . . . . . . . . . . . . . . . . . . . . . . . . . . . . . . . . . 78
14 HA Admin Common Field and Button Descriptions. . . . . . . . . . . . . . . . . . . . . . . . . . . . 86
15 HA Admin Service Tab Field Descriptions . . . . . . . . . . . . . . . . . . . . . . . . . . . . . . . . . . . 86
16 HA Admin CP Tab Field Descriptions . . . . . . . . . . . . . . . . . . . . . . . . . . . . . . . . . . . . . . 88
17 Switch Admin Window Field Descriptions . . . . . . . . . . . . . . . . . . . . . . . . . . . . . . . . . . . 92
18 Switch Information Field Descriptions . . . . . . . . . . . . . . . . . . . . . . . . . . . . . . . . . . . . . . 96
19 Network Config Field Descriptions . . . . . . . . . . . . . . . . . . . . . . . . . . . . . . . . . . . . . . . . 100
20 Upload/Download Field Descriptions . . . . . . . . . . . . . . . . . . . . . . . . . . . . . . . . . . . . . . 105
21 SNMP Field Descriptions . . . . . . . . . . . . . . . . . . . . . . . . . . . . . . . . . . . . . . . . . . . . . . . 110
22 License Admin Field Descriptions. . . . . . . . . . . . . . . . . . . . . . . . . . . . . . . . . . . . . . . . . 113
23 Port Setting Field Descriptions . . . . . . . . . . . . . . . . . . . . . . . . . . . . . . . . . . . . . . . . . . . 117
14 Web Tools Version 3.1.x/4.1.x User Guide
Page 15

Contents
24 Configure (Fabric) Field Descriptions . . . . . . . . . . . . . . . . . . . . . . . . . . . . . . . . . . . . . . 122
25 VC Parameters Default Settings. . . . . . . . . . . . . . . . . . . . . . . . . . . . . . . . . . . . . . . . . . . 123
26 Virtual Channel Field Descriptions . . . . . . . . . . . . . . . . . . . . . . . . . . . . . . . . . . . . . . . . 125
27 Configure (Arbitrated Loop) Field Descriptions . . . . . . . . . . . . . . . . . . . . . . . . . . . . . . 127
28 Configure (System) Field Descriptions . . . . . . . . . . . . . . . . . . . . . . . . . . . . . . . . . . . . . 129
29 Routing Field Descriptions . . . . . . . . . . . . . . . . . . . . . . . . . . . . . . . . . . . . . . . . . . . . . . 133
30 Routing (FSPF Route) Field Descriptions . . . . . . . . . . . . . . . . . . . . . . . . . . . . . . . . . . . 133
31 Routing (Static Route) Field Descriptions. . . . . . . . . . . . . . . . . . . . . . . . . . . . . . . . . . . 136
32 Routing (Link Cost) Field Descriptions. . . . . . . . . . . . . . . . . . . . . . . . . . . . . . . . . . . . . 138
33 Extended Fabric Field Descriptions. . . . . . . . . . . . . . . . . . . . . . . . . . . . . . . . . . . . . . . . 144
34 Trunk Information Field Descriptions . . . . . . . . . . . . . . . . . . . . . . . . . . . . . . . . . . . . . . 147
35 Actions Menu Options Descriptions . . . . . . . . . . . . . . . . . . . . . . . . . . . . . . . . . . . . . . . 155
36 Display Canvas Configuration. . . . . . . . . . . . . . . . . . . . . . . . . . . . . . . . . . . . . . . . . . . . 156
37 Save Canvas Configuration Descriptions. . . . . . . . . . . . . . . . . . . . . . . . . . . . . . . . . . . . 158
38 Display Resource Usage . . . . . . . . . . . . . . . . . . . . . . . . . . . . . . . . . . . . . . . . . . . . . . . . 160
39 Basic Monitoring Graph Descriptions . . . . . . . . . . . . . . . . . . . . . . . . . . . . . . . . . . . . . . 165
40 Advanced Monitoring Graph Descriptions . . . . . . . . . . . . . . . . . . . . . . . . . . . . . . . . . . 169
41 Alarm Notification Field Descriptions. . . . . . . . . . . . . . . . . . . . . . . . . . . . . . . . . . . . . . 175
42 Threshold Configuration Area Configuration Field Descriptions . . . . . . . . . . . . . . . . . 178
43 Threshold Configuration Element Configuration Field Descriptions . . . . . . . . . . . . . . 179
44 Threshold Configuration Report Field Descriptions . . . . . . . . . . . . . . . . . . . . . . . . . . . 179
45 Email Configuration Field Descriptions . . . . . . . . . . . . . . . . . . . . . . . . . . . . . . . . . . . . 184
46 Fabric Toolbar Descriptions. . . . . . . . . . . . . . . . . . . . . . . . . . . . . . . . . . . . . . . . . . . . . . 188
47 Fabric Events Description of Fields. . . . . . . . . . . . . . . . . . . . . . . . . . . . . . . . . . . . . . . . 191
48 Fabric Topology Description of Fields . . . . . . . . . . . . . . . . . . . . . . . . . . . . . . . . . . . . . 193
49 Name Server Description of Fields and Buttons . . . . . . . . . . . . . . . . . . . . . . . . . . . . . . 196
50 Name Server Description of Columns . . . . . . . . . . . . . . . . . . . . . . . . . . . . . . . . . . . . . . 196
51 Sample Zoning Database . . . . . . . . . . . . . . . . . . . . . . . . . . . . . . . . . . . . . . . . . . . . . . . . 201
52 Zone Methods and Tabs Available . . . . . . . . . . . . . . . . . . . . . . . . . . . . . . . . . . . . . . . . 203
53 File Menu Options . . . . . . . . . . . . . . . . . . . . . . . . . . . . . . . . . . . . . . . . . . . . . . . . . . . . . 205
54 Edit Menu Options. . . . . . . . . . . . . . . . . . . . . . . . . . . . . . . . . . . . . . . . . . . . . . . . . . . . . 207
55 View Menu Options . . . . . . . . . . . . . . . . . . . . . . . . . . . . . . . . . . . . . . . . . . . . . . . . . . . . 210
56 Actions Menu Options . . . . . . . . . . . . . . . . . . . . . . . . . . . . . . . . . . . . . . . . . . . . . . . . . . 213
57 Alias Tab Field Descriptions . . . . . . . . . . . . . . . . . . . . . . . . . . . . . . . . . . . . . . . . . . . . . 218
58 Zone Tab Field Descriptions . . . . . . . . . . . . . . . . . . . . . . . . . . . . . . . . . . . . . . . . . . . . . 224
59 QuickLoop Tab Field Descriptions . . . . . . . . . . . . . . . . . . . . . . . . . . . . . . . . . . . . . . . . 230
60 Fabric Assist Fields Descriptions. . . . . . . . . . . . . . . . . . . . . . . . . . . . . . . . . . . . . . . . . . 235
61 Config Tab Field Descriptions. . . . . . . . . . . . . . . . . . . . . . . . . . . . . . . . . . . . . . . . . . . . 241
15Web Tools Version 3.1.x/4.1.x User Guide
Page 16

Contents
62 Port Information Window . . . . . . . . . . . . . . . . . . . . . . . . . . . . . . . . . . . . . . . . . . . . . . . 255
63 Port Information Window PortStats Tab Field Descriptions. . . . . . . . . . . . . . . . . . . . . 256
64 Port Information Window SFP Tab Field Descriptions. . . . . . . . . . . . . . . . . . . . . . . . . 258
65 Port Information Window Loop Tab Field Descriptions. . . . . . . . . . . . . . . . . . . . . . . . 261
16 Web Tools Version 3.1.x/4.1.x User Guide
Page 17

about this
guide
This user guide provides information to help you:
■ Understand Web Tools
■ Configure and use Web Tools Fabric View
■ Configure and use Web Tools Port View
■ Contact technical support for additional assistance
About this Guide
About this Guide
“About this Guide” topics include:
■ Overview, page 18
■ Conventions, page 19
■ Getting Help, page 21
17Web Tools Version 3.1.x/4.1.x User Guide
Page 18

About this Guide
Overview
This section covers the following topics:
■ Intended Audience
■ Related Documentation
Intended Audience
This book is intended for use by system administrators who are experienced with
the following:
■ HP StorageWorks Fibre Channel SAN switches
■ Fabric Operating System V3.1.x or later
Related Documentation
For a list of related documents included with this product, see the Related
Documents section of the Release Notes that came with your switch.
For the latest information, documentation, and firmware releases, please visit the
following StorageWorks website:
prodserv/storage.html
http://www.hp.com/country/us/eng/
For information about Fibre Channel standards, visit the Fibre Channel
Association website, located at:
18 Web Tools Version 3.1.x/4.1.x User Guide
http://www.fibrech annel.org
.
Page 19
Conventions
Conventions consist of the following:
■ Document Conventions
■ Text Symbols
Document Conventions
The document conventions included in Tabl e 1 apply in most cases.
Table 1: Document Conventions
Cross-reference links Blue text: Figure 1
Key and field names, menu items,
buttons, and dialog box titles
File names, application names, and text
emphasis
User input, command and directory
names, and system responses (output
and messages)
Variables <monospace, italic font>
Website addresses Blue, underlined sans serif font text:
About this Guide
Element Convention
Bold
Italics
Monospace font
COMMAND NAMES are uppercase
monospace font unless they are
case-sensitive
http://www.hp.com
Text Symbols
The following symbols may be found in the text of this guide. They have the
following meanings.
WARNING: Text set off in this manner indicates that failure to follow
directions in the warning could result in bodily harm or death.
Caution: Text set off in this manner indicates that failure to follow directions
could result in damage to equipment or data.
Web Tools Version 3.1.x/4.1.x User Guide
19
Page 20

About this Guide
Note: Text set off in this manner presents commentary, sidelights, or interesting points
of information.
20 Web Tools Version 3.1.x/4.1.x User Guide
Page 21

Getting Help
If you still have a question after reading this guide, contact an HP authorized
service provider or access our website:
HP Technical Support
Telephone numbers for worldwide technical support are listed on the following
HP website:
of origin.
Note: For continuous quality improvement, calls may be recorded or monitored.
Be sure to have the following information available before calling:
■ Technical support registration number (if applicable)
■ Product serial numbers
■ Product model names and numbers
■ Applicable error messages
http://www .hp.com
http://www.hp.com/support/
About this Guide
.
. From this website, select the country
■ Operating system type and revision level
■ Detailed, specific questions
HP Storage Website
The HP website has the latest information on this product, as well as the latest
drivers. Access storage at:
storage.html
. From this website, select the appropriate product or solution.
HP Authorized Reseller
For the name of your nearest HP authorized reseller:
■ In the United States, call 1-800-345-1518
■ In Canada, call 1-800-263-5868
■ Elsewhere, see the HP website for locations and telephone numbers:
http://www .hp.com
Web Tools Version 3.1.x/4.1.x User Guide
http://www.hp.com/country/us/eng/prodserv/
.
21
Page 22

About this Guide
22 Web Tools Version 3.1.x/4.1.x User Guide
Page 23

Introducing HP Web Tools
This chapter provides the following information:
■ Overview, page 24
■ Web Tools Main Views, page 27
■ Web Tools in Secure Mode, page 34
1
23Web Tools Version 3.1.x/4.1.x User Guide
Page 24

Introducing HP Web Tools
Overview
Web Tools provides a graphical interface that enables an administrator to monitor
and manage entire fabrics and individual switches and ports from a standard
workstation.
Advantages of Web Tools
Web Tools is an excellent partner to the traditional Fabric OS CLI commands, and
in many ways can provide faster and more effective results than can be achieved
strictly through a Command Line Interface.
The following are some of the features that make Web Tools an important part of
the switch management and administration process:
■ Web Tools can be used from a standard workstation and provides the user the
advantage of being “virtually” in front of any fabric, switch, or port.
■ Web Tools makes zoning a simple “click and drag” process, rather than
having to tediously type out IP addresses and port numbers to put in a
configuration.
■ Web Tools provides the “Performance Monitor” feature. This feature allows
you to view the status and traffic of a switch or port in seconds by easily
creating a variety of effective graphs.
■ Web Tools is easy and intuitive to use.
■ Web Tools supports Secure Fabric OS. For more information, see the HP
StorageWorks Secure Fabric OS Version 1.0 User Guide.
Capabilities of Web Tools
Web Tools provides the following information and capabilities:
■ Monitoring and managing the entire fabric. See “Fabric Management” on
page 187.
■ Monitoring and managing individual switches. See “Switch Management” on
page 61.
■ Monitoring and managing individual ports. See “Port Management” on
page 249.
When monitoring and managing the entire fabric, Web Tools allows you to
perform the functions shown in Tabl e 2.
24 Web Tools Version 3.1.x/4.1.x User Guide
Page 25
Introducing HP Web Tools
Table 2: Fabric Management Tasks
Task Page Number
View the status of all the switches in the
fabric.
Access event logs for entire fabric. See “About Fabric Events
Set-up and manage Zoning functions. See “Zone Administration” on
Access to the Name Server Table. See “About the Name Server” on
Access Telnet functions. See “About the Telnet Button” on
View the Topology information for the
fabric.
Utilize switch beaconing for rapid
identification of a single switch in large
fabric environments.
Create and zone QuickLoops (optionally
licensed).
See “Fabric Management” on
page 187.
”
on
page 190.
page 199.
page 195.
page 71.
See “About the Fabric Topology” on
page 192.
See “About the Beacon Button” on
page 76.
See “Loop Tab Example” on page 260,
“Using the Network Config Tab” on
page 102, or “About Zone
Administration” on page 200.
When monitoring and managing individual switches, Web Tools allows you to
perform the shown in Tab le 3.
Table 3: Switch Management Tasks
Task Page Number
View summary information about each
switch.
View event logs for individual switches. See “About the Switch Events Button” on
Perform switch configuration and
administration.
See “About the Switch Info Button” on
page 78.
page 67.
See “Switch Admin Window” on
page 92 and “About the Switch
Information Tab” on page 95.
25Web Tools Version 3.1.x/4.1.x User Guide
Page 26
Introducing HP Web Tools
Table 3: Switch Management Tasks (Continued)
Monitor switch and port performance. See “Performance Monitoring” on
Utilize the ability to upgrade Fabric OS
and license key administration.
Utilize report capability for switch
configuration information.
When monitoring and managing individual ports, Web Tools allows you to
perform the shown in Tab le 4.
Table 4: Port Management Tasks
View the port status. See “Using the Port Graphic” on
View information about SFP Serial IDs. See “SFP Tab Example” on page 258.
View and manage loop information. See “Loop Tab Example” on page 260,
View port performance, including frame
counts (frames in, frames out) and error
counts.
Task Page Number
page 149.
See “About the License Admin Tab” on
page 149.
See “About the Switch Information Tab”
on page 95.
Task Page Number
page 254.
“Using the Network Config Tab” on
page 102, or “Zone Tab Field
Descriptions” on page 224.
See “Performance Monitoring” on
page 149.
26 Web Tools Version 3.1.x/4.1.x User Guide
Page 27

Web Tools Main Views
Web Tools provides access to and information about a fabric through a number of
separate windows, called “views,” making it possible to manage and monitor
several aspects of a fabric at the same time.
The Web Tools window is divided into two frames. The main views available
through Web Tools are:
■ Fabric Tree which displays a list of all the switches in the fabric.
■ Switch View which displays a interactive graphical representation of the
switch, along with a synopsis of information about the switch including
information such as: Switch Status, Switch Name, Fabric OS Version,
Domain ID, IP address, WWN, and current zone configuration.
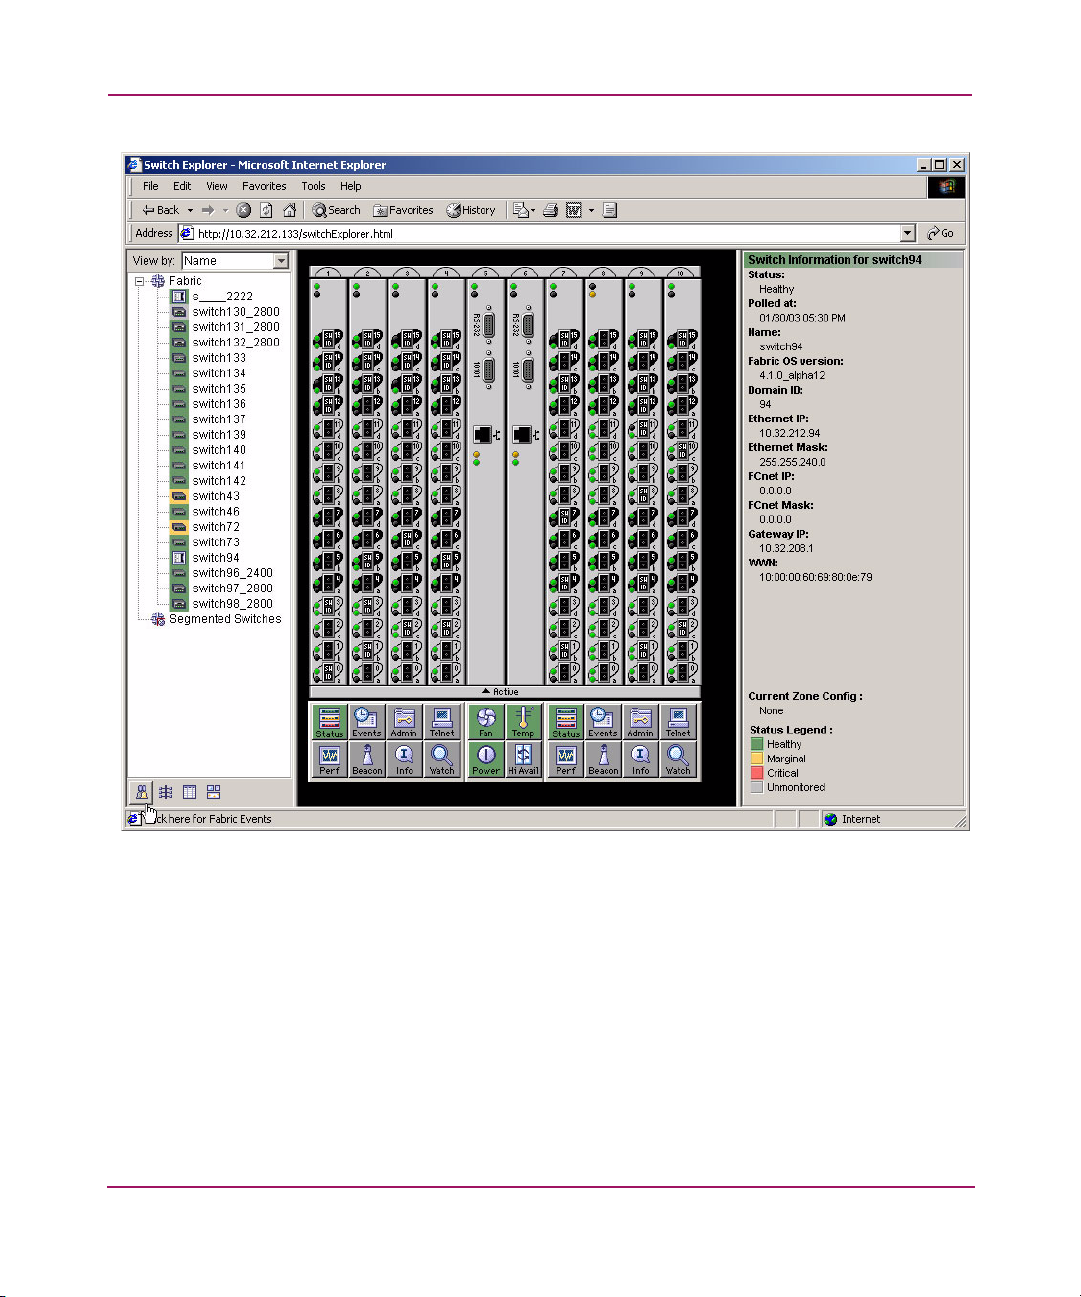
An example of the Web Tools Switch Explorer View for a Core Switch 2/64 is
displayed in Figure 1.
Introducing HP Web Tools
27Web Tools Version 3.1.x/4.1.x User Guide
Page 28
Introducing HP Web Tools
Figure 1: Web Tools Switch Explorer View for a Core Switch 2/64
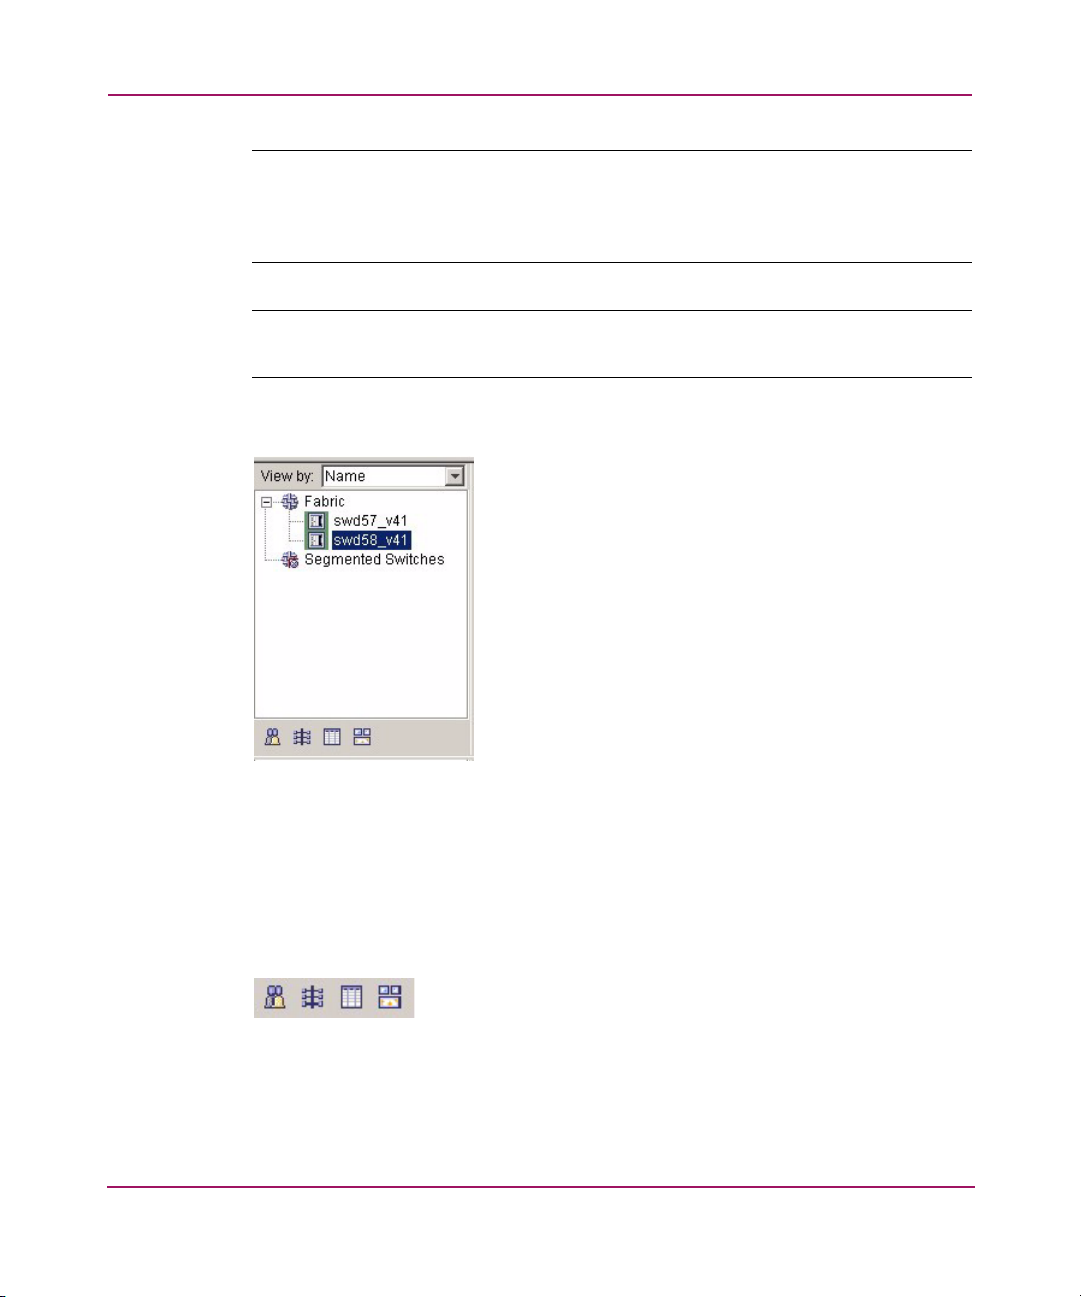
Fabric Tree
The Fabric Tree is the left window of the Switch Explorer and displays:
■ A list of all the switches in the fabric. You can use the drop-down menu to
view these switches by Switch Name, IP address, or WWN. The background
color displays the current status of the switch.
■ A Fabric Admin toolbar which provides access to fabric level administration
functionality including: Fabric Events, Topology, Name Server, and Zoning
Admin.
28 Web Tools Version 3.1.x/4.1.x User Guide
Page 29
Introducing HP Web Tools
Note: The Switch View status is updated approximately once every 15 seconds. The
Fabric Tree status is updated approximately every 30 seconds. However, the initial
display of the Switch Explorer may take from 30 to 60 seconds after the switch is
booted.
Note: For all status displays that are based on errors per time interval, errors will not
cause the status to change to faulty until the entire sample interval has passed.
An example of the Fabric Tree is displayed in Figure 2.
Figure 2: Fabric Tree
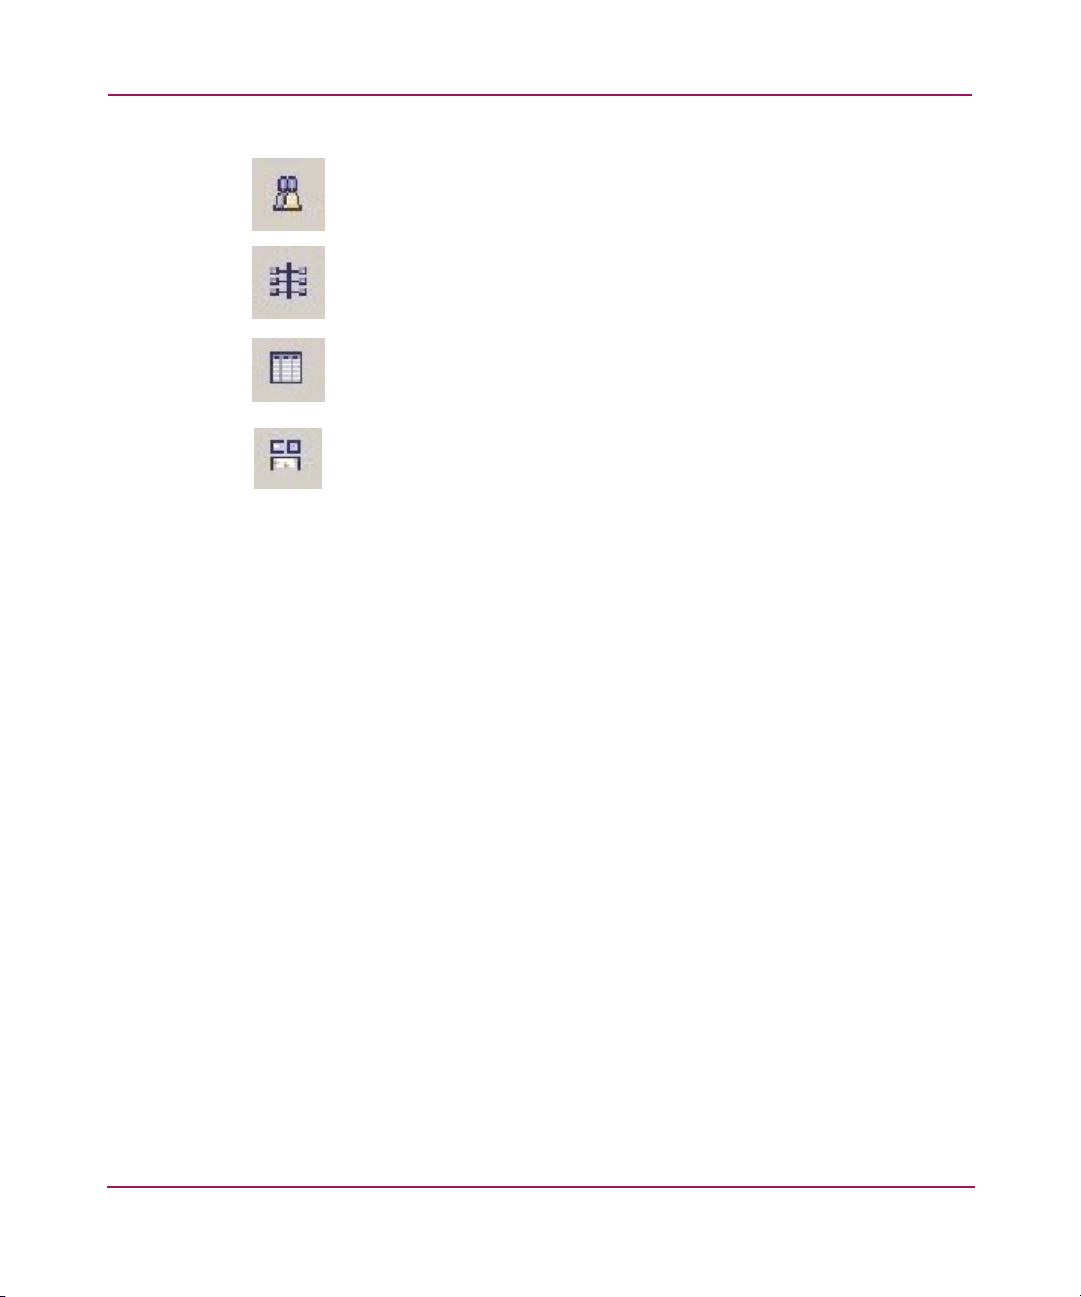
Fabric Management Toolbar
The Fabric Management toolbar enables you to access fabric-wide administration
tasks quickly and easily. An example of the Fabric Management Toolbar is shown
in Figure 3.
Figure 3: Fabric Management Toolbar
The following options are available through the Fabric Management toolbar:
29Web Tools Version 3.1.x/4.1.x User Guide
Page 30
Introducing HP Web Tools
Switch View
This view displays a graphical representation for the selected switch, including a
real-time view of switch status. This view is accessed by selecting a switch icon
on Fabric Tree. The Switch View is also the launch point for the Switch Events
View, Telnet Interface, Fabric Watch View, Administrative Interface, Performance
View, and Port Information View. It includes buttons that display the status of the
switch fans, temperature monitors, switch info, power supply, and beacon.
Fabric Events
Topology (fabric-wide)
Name Server (fabric-wide)
Zone Admin (displays current zone configuration)
An example of the Switch View is shown in Figure 4.
30 Web Tools Version 3.1.x/4.1.x User Guide
Page 31

Introducing HP Web Tools
Figure 4: Switch View
For information about the functions that are accessible through the Switch View,
see “About Switch Management” on page 62.
The Switch Management View displays the following options:
■ Status of the switch. See “About the Switch Status Button” on page 65.
■ Switch Event. See “About the Switch Events Button” on page 67.
■ Administrative management. See “About the Admin Button” on page 70.
■ Telnet access. See “About the Telnet Button” on page 71.
31Web Tools Version 3.1.x/4.1.x User Guide
Page 32

Introducing HP Web Tools
■ Performance Monitoring of the switches. See “About Performance Monitor”
■ Beaconing switches. See “About the Beacon Button” on page 76.
■ Information on the switch. See “About the Switch Info Button” on page 78.
■ Fabric Watch (alarm settings). See “About Fabric Watch” on page 172.
■ Fan status. See “About the Fan Button” on page 81.
■ Temperature of the switch. See “About the Temp Button” on page 82.
■ Power status. See “About the Power Button” on page 83.
■ Hi Availability. See “About HA Admin” on page 84.
on page 150.
32 Web Tools Version 3.1.x/4.1.x User Guide
Page 33
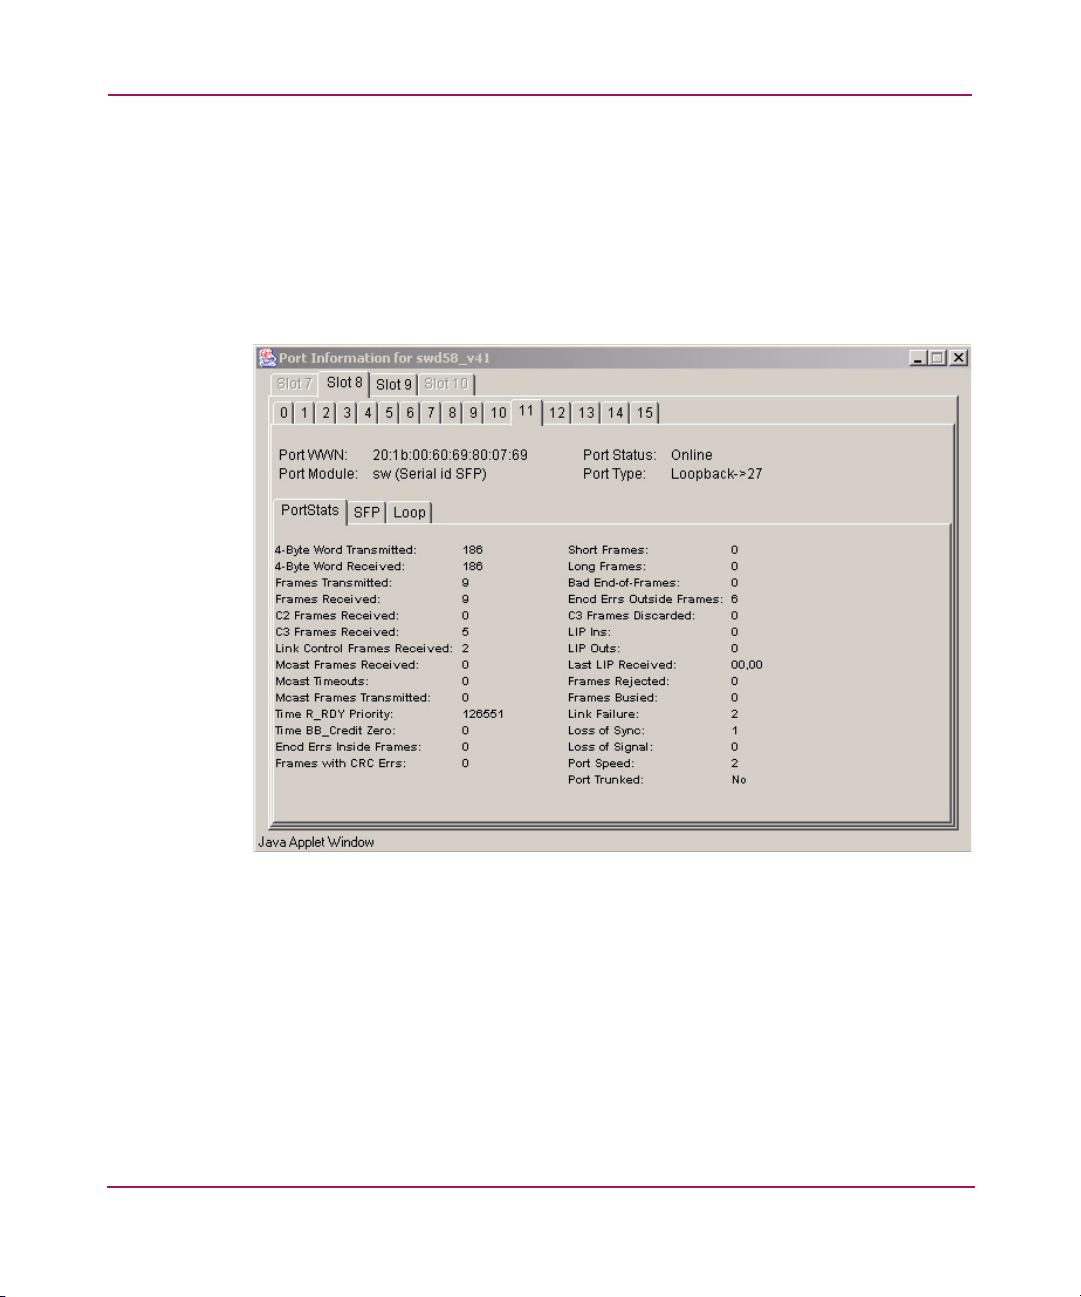
Port Information View
Access information for a port by clicking on any of the ports in the Switch View.
This view displays statistics and status for the selected port, SFP, or loop.
For information about the functions that are accessible through the Port View, see
“Port Management” on page 249.
An example of the Port Information View is shown in Figure 5.
Introducing HP Web Tools
Figure 5: Port Information View
33Web Tools Version 3.1.x/4.1.x User Guide
Page 34

Introducing HP Web Tools
Web Tools in Secure Mode
The Security feature may change your ability to access Web Tools functionality
when Secure Mode is enabled. For more information on the Security feature see
the HP StorageWorks Secure Fabric OS Version 1.0 User Guide.
Web Tools Access and the HTTP_POLICY
When Secure Mode is enabled, access to the Web Tools interface is controlled by
the HTTP_POLICY. If Secure Mode is enabled and an HTTP_POLICY has been
defined, your workstation IP address must be included in this policy or you will
not have access to Web Tools for any switch in the fabric. If your workstation IP is
not included in this policy, the interface disabled page will display when you
attempt to access a switch.
Primary FCS Only Functionality
The following Web Tools functionality is reserved for the Primary Fabric
Configuration Server (FCS) when Secure Mode is enabled:
■ Zoning Administration is only allowed from the Primary FCS switch when
Secure Mode is enabled. For all other switches in a secure fabric, the Zoning
Button is disabled.
■ SNMP Access Control Lists and the SNMP Community Strings can only be
modified from the Primary FCS switch when Secure Mode is enabled. For
Non-FCS switches, you can view the SNMP Community Strings but they are
read only, and the SNMP Access Control Lists are not displayed.
Disabled Functionality
Telnet access to a switch and the Telnet Button in Web Tools are both disabled
when Secure Mode is enabled for a fabric. You must use sectelnet or SSH to
access the Fabric OS command line interface in a secure fabric. These capabilities
are not accessible from Web Tools.
34 Web Tools Version 3.1.x/4.1.x User Guide
Page 35

Installation
This chapter provides the following information:
■ Requirements, page 36
■ Installing Prerequisite Software on a Workstation, page 38
■ Licensing Web Tools on the Switch, page 41
■ Launching HP Web Tools, page 43
2
35Web Tools Version 3.1.x/4.1.x User Guide
Page 36

Installation
Requirements
The workstation and the switch must meet both specific requirements for the
correct installation and operation of HP Web Tools.
Switch Requirements
HP Web Tools 3.1 can be used to manage Switches that are running V3.1
firmware, including HP StorageWorks SAN switches 2/8, 2/8-EL, and 2/16.
Workstation Requirements
The following items are required for the operation of HP Web Tools:
One of the following operating systems:
■ Sun Solaris 2.7 or 2.8
■ Windows 2000, or Windows XP
■ Windows NT 4.0
Adequate RAM (required for Windows operating systems only):
■ 128 MB or more of RAM for fabrics consisting of 10 switches or less
■ 256 MB or more of RAM for fabrics consisting of 15 switches or less
■ 512 MB or more of RAM for fabrics consisting of more than 15 switches
Adequate RAM for video display:
■ Minimum 8MB of video RAM is recommended
Web Browser Requirements
One of the following web browsers is required:
■ Microsoft Internet Explorer 5.5 (Service Pack 2 is recommended) or later.
■ Netscape 4.77 for Solaris
The browser must be configured to work with HP Web Tools. For information
about how to do this, see “Configuring the Web Browser” on page 38.
Note: Due to decreasing customer demand and an increasing number of significant
technical incompatibilities, the combination of the Netscape browser running on the
Windows operating system is no longer supported for use with HP Web Tools.
36 Web Tools Version 3.1.x/4.1.x User Guide
Page 37

Java Plug-in and JRE Requirements
The correct version of the Java Plug-in for your operating system:
■ For Windows XP, NT, or 2000 Java Plug-in version v1.3.1_04 or later. Java
Runtime Environment v1.3.1_04 is recommended for best results.
■ For Solaris: Java Plug-in version v1.3.1_04 for Solaris, including the Java
Plug-in patch created by Sun for Solaris. Java Runtime Environment
v1.3.1_04 is recommended for best results.
Installation
37Web Tools Version 3.1.x/4.1.x User Guide
Page 38

Installation
Installing Prerequisite Software on a Workstation
Perform the following steps before you use HP Web Tools to manage your fabric:
■ Install one of the supported web browsers on a workstation, if not already
installed.
■ Configure the web browser for use with HP Web Tools.
■ Install the required Java Plug-in on the workstation, if not already installed.
For some workstations, when you first access the switch using Web Tools, the
operating system will automatically load the required Java Plug-in and JRE.
■ Install an HP Web Tools license on each switch to be managed from HP Web
Tool s.
Installing a Web Browser
If not already installed, install one of the following browsers:
■ Internet Explorer 5.5 (with Service Pack 2 is highly recommended)
■ Netscape 4.77 for Solaris
Configuring the Web Browser
Specific browser settings are required for the correct operation of HP Web Tools
with Netscape Communicator (not supported) or Internet Explorer.
Configuring Netscape Communicator
Note: Due to decreasing customer demand and an increasing number of significant
technical incompatibilities, the combination of the Netscape browser running on the
Windows operating system is no longer supported for use with HP Web Tools.
Some browsers use local cache copies of .jar files and/or image files to improve
performance (depending on the options selected in browser), which can cause
incorrect display in HP Web Tools. The web browser cache must be cleared before
invoking Web Tools.
To remove cached files from Netscape Communicator:
1. Select Edit > Preferences.
2. Click Advanced in the Category box to expand it, then click Cache.
38 Web Tools Version 3.1.x/4.1.x User Guide
Page 39

3. On the Cache panel, click Clear Memory Cache.
4. Click OK.
5. Exit and relaunch the browser.
Configuring Internet Explorer
Correct operation of HP Web Tools with Internet Explorer requires specifying the
appropriate settings for browser refresh frequency and process model. Browser
pages should be refreshed frequently to ensure the correct operation of Web Tools.
To set the refresh frequency:
1. Select Internet Options from the To ol s menu.
2. Select the General tab and click Settings (under “Temporary Internet Files”).
3. Under “Check for newer versions of stored pages,” select “Every visit to the
page.”
Installing the Java Plug-in on the Workstation
A Java Plug-in must be installed on the workstation for the correct operation of
HP Web Tools. The required version depends on the operating system.
Installation
Installing the Java Plug-in on Solaris
Solaris workstations require both the Java Plug-in version 1.3.1_04 for Solaris and
the patch created by Sun Microsystems for use with the Java Plug-in on Solaris.
To install the Java Plug-in on Solaris:
1. Locate the Java Plug-in on the internet, such as at the Sun Microsystems
website.
2. Follow the instructions to install the JRE.
3. Open the .cshrc file and set the path to the Java Plug-in executable file. For
example:
— If the JRE is installed on /opt/j2re1.4.1_01
— If Netscape is installed on /usr/local/communicator/ver_4.77
39Web Tools Version 3.1.x/4.1.x User Guide
Page 40

Installation
For the Bourne shell, type the following:
NPX_PLUGIN_PATH=/opt/j2re1.4.1_01/plugin/sparc/ns4:/usr/local/communicator/ve
r_4.77/plugins
export NPX_PLUGIN_PATH
For the C shell, type the following:
setenv NPX_PLUGIN_PATH
/opt/j2re1.4.1_01/plugin/sparc/ns4:/usr/local/communicator/ver_4.77/plugins
Installing a Java Patch on Solaris
To install the patch on Solaris:
1. Go to the website at http://access1.sun.com
your current version of the JRE.
2. Follow the link to download the patch, and exit the browser when done.
3. Install the patch and reboot the system.
4. Relaunch the browser and enter the IP Address of the switch.
Installing the Java Plug-in on Windows XP, 2000, or NT
To determine the version of the Java Plug-in installed on Windows XP, NT, or
2000, and install if necessary:
1. Access the Start Menu > Settings > Control Panel > Java Plug-in version.
The Java Plug-in Control Panel is displayed.
2. Select the About tab.
3. Determine whether the correct Java Plug-in version is installed, and install if
necessary:
— If the correct version is installed, HP Web Tools is ready to use.
— If no Java Plug-in is installed, point the browser towards a switch running
Fabric OS v4.x, follow the link to the Sun Microsystems website,
download the correct Java Plug-in, then double-click the downloaded file
to install the plug-in.
— If an outdated version is currently installed, uninstall it, relaunch the
browser, and enter the address of a switch running Fabric OS v4.0 or later.
Web Tools will guide you through the steps to download the proper Java
Plug-in.
, and search for any patches for
40 Web Tools Version 3.1.x/4.1.x User Guide
Page 41

Licensing Web Tools on the Switch
An HP Web Tools license can be installed either through Telnet or over the web.
To determine whether a license is already installed on a switch, follow the
instructions provided under “Launching HP Web Tools” on page 43. If a license is
not installed, contact your switch supplier to obtain a license key.
Installing a Web Tools License Through Telnet
To install an HP Web Tools license through Telnet:
1. Log onto the switch by Telnet (See the HP StorageWorks Fabric Operating
System Procedures Version 3.1.x/4.1.x User Guide for more information),
using an account that has administrative privileges.
2. To determine whether an HP Web Tools license is already installed on the
switch, type licenseshow on the Telnet command line.
A list displays, showing all the licenses currently installed on the switch.
switch:admin> licenseshow
1A1AaAaaaAAAA1a:
Zoning license
SES license
QuickLoop license
If the HP Web Tools license is not included in the list or is incorrect, continue
with step [3].
3. Enter the following on the command line:
licenseadd “key”
where “key” is the license key. The license key value is case-sensitive, and must
be entered exactly as given.
Installation
4. Verify the license was added by entering the following on the command line:
licenseshow
If the HP Web Tools license is listed, the feature is available. If the license is not
listed, repeat step [3].
Note: The Java Plug-in must also be installed on the client machine to access HP Web
Tools.
41Web Tools Version 3.1.x/4.1.x User Guide
Page 42

Installation
Installing Web Tools Through the Web
Launching HP Web Tools from any non-licensed switch will automatically
display the license dialog box. If the fabric already contains at least one licensed
switch, you can use HP Web Tools to view and license other switches from the
licensed switch.
To install the first license through the web:
1. Launch the web browser and enter the IP address of the switch in the
Location/Address field.
For example:
http://123.123.123.123
2. Press Enter. If a license is already installed on the switch, HP Web Tools
launches. If no license is installed, a license dialog displays. You will need to
login as an admin user to gain access to the Licensing Screen.
3. If the license dialog displays, follow the instructions provided.
To Install additional Licenses Through the Web
To install additional licenses through the web:
1. Launch the web browser and enter the IP address of the licensed switch in the
Location/Address field. For example:
http://123.123.123.123
2. Press Enter. HP Web Tools opens, displaying the Switch Explorer.
3. Click the icon for the switch you want to license. A licensing window
displays.
4. Follow the instructions provided.
42 Web Tools Version 3.1.x/4.1.x User Guide
Page 43

Launching HP Web Tools
You can launch HP Web Tools once the license is installed on the switch and the
Java Plug-in and web browser are installed and configured on the client
workstation.
To launch HP Web Tools:
1. Launch the web browser and enter the IP address of the licensed switch in the
Location/Address field. For example:
http://123.123.123.123
2. Press Enter. HP Web Tools opens, displaying the Switch Explorer.
Installation
43Web Tools Version 3.1.x/4.1.x User Guide
Page 44

Installation
44 Web Tools Version 3.1.x/4.1.x User Guide
Page 45

Switch Explorer View
This chapter provides the following information:
■ About the Switch Explorer View, page 46
■ Fabric Tree, page 48
■ Switch Graphic, page 51
■ Switch Graphic Buttons, page 54
■ Switch Information Window, page 57
■ Refresh Rates in Web Tools, page 59
■ Accessing the Switch Explorer, page 60
3
45Web Tools Version 3.1.x/4.1.x User Guide
Page 46

Switch Explorer View
About the Switch Explorer View
The Switch Explorer View is the first web page that displays when you connect to
a switch. The Switch Explorer includes:
■ Fabric Tree, displaying a navigation menu of icons for all the switches in the
fabric.
■ Fabric Management icons, for easy access to fabric-level administration
tasks.
■ Switch View, displaying real time information about the selected switch.
■ Switch Information page, displaying a synopsis of useful information about
the selected switch.
■ Port Status information, displaying real time information about the port
including status lights, and in-use lights.
Every switch in the fabric, including any unlicensed switches, is represented by a
switch icon in the Fabric Tree. However, only switches with a Web Tools license
can be managed from Web Tools. To add a license for an unlicensed switch, click
the corresponding switch icon in Fabric Tree, and a license window automatically
displays.
An example of the Switch Explorer is shown in Figure 6.
46 Web Tools Version 3.1.x/4.1.x User Guide
Page 47

Switch Explorer View
Figure 6: Switch Explorer for a Core Switch 2/64
47Web Tools Version 3.1.x/4.1.x User Guide
Page 48

Switch Explorer View
Fabric Tree
The Fabric Tree displays a list of all the switches in the fabric. When you select a
switch from this view it is displayed in the Switch View. You can display switches
in the Fabric Tree list by Name, IP address, or WWN. An example of the Fabric
Tree is shown in Figure 7.
Figure 7: List of Switches in the Fabric Tree View
The fields available in the Fabric Tree are described in Tabl e 5.
48 Web Tools Version 3.1.x/4.1.x User Guide
Page 49
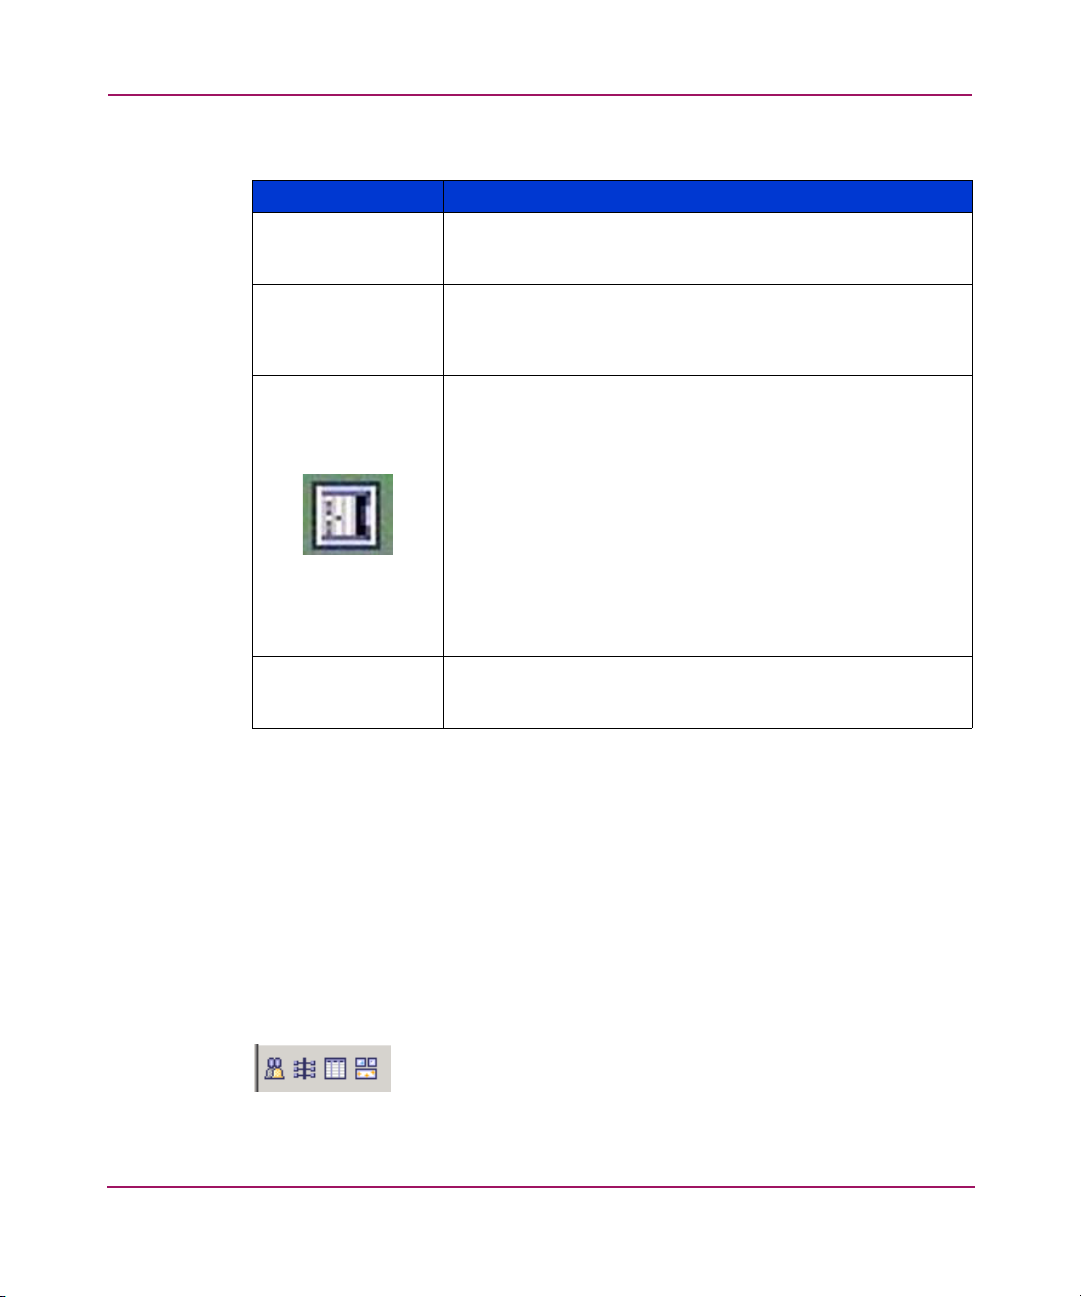
Switch Explorer View
Table 5: Fabric Tree Field Descriptions
Field Description
View by: Select the
View by
drop-down menu to change the way
switches are displayed in the tree. Select one of the following
options: Name, IP, or WWN.
Fabric This is a navigation menu that displays all the switches in the
fabric. Click the “+” sign to display switches within the fabric.
To collapse a list of switches that is already open, click the “-”
sign.
Switch Icon The switches can be listed by Name, IP address, or WWN
depending on what display you choose in the
View by
drop-down menu. When you select a switch from this list it is
displayed in the Switch View.
The background color indicates the switch status. Each color
indicates a different operational state:
■ Green - Healthy
■ Yellow - Marginal (mix of good and faulty readings)
■ Red - Down (more than two faulty readings)
■ Gray - Unknown or unmonitored
Each switch type has its own icon.
Segmented Switches Displays switches that have lost Fibre Channel connectivity
(that is, are segmented from the fabric). These switches can
still be administered if the IP connection is valid.
Fabric Toolbar
The Fabric Toolbar is located at the bottom left corner of the Switch Explorer. Use
the Fabric Toolbar to access Fabric Management tools:
■ Fabric Events
■ Fabric Topology
■ Name Server
■ Zone Admin
An example of the Fabric Toolbar is displayed in Figure 8.
Figure 8: Fabric Toolbar
49Web Tools Version 3.1.x/4.1.x User Guide
Page 50

Switch Explorer View
The Fabric Toolbar buttons are described in Tabl e 6.
Table 6: Fabric Toolbar Buttons
Button Description
Fabric Events The Fabric Events View provides a running log of events in
the fabric. Select to open Fabric Events View (for additional
information, see “About Fabric Events” on page 190).
Fabric Topology The Fabric Topology View summarizes the physical
configuration of the fabric from the perspective of the “local
domain” (the domain of the selected switch). Select to open
the Fabric Topology View (for additional information, see
“About the Fabric Topology” on page 192).
Name Server The Name Server Table View provides the name server
entries listed in the Simple Name Server database. Click to
open Name Server Table View (for additional information,
see “About the Name Server” on page 195).
Zone Admin Select to open the Zone Administration View. This button is
available only if a Zoning license is installed (for additional
information, see “About Zone Administration” on
page 200). If the Zoning license is installed but Zoning is not
implemented this button is grayed out.
Note: When Security is enabled, Zone Admin can only be
performed from the Primary FCS switch. For all other switches
this button is grayed out.
For more information, see “Fabric Management” on page 187.
50 Web Tools Version 3.1.x/4.1.x User Guide
Page 51

Switch Graphic
The Switch View graphic is an interactive display of the particular switch you
have selected from the Fabric Tree. The Web Tools interface replicates in
real-time the switch you have selected. The displays in Web Tools correspond to
the front of the actual switch and its various switch and port LEDs.
Ports that are in use are displayed as well as unused ports. You can click on a port
in this window to open a dialog box that displays information about that port.
For the Core Switch 2/64, blades are displayed or slot spacers corresponding to
the actual switch. The Active Control Processor (CP) is highlighted with an arrow
at the bottom of the CP card display.
An example of the Switch Graphic for a Core Switch 2/64 is shown in Figure 9.
Switch Explorer View
51Web Tools Version 3.1.x/4.1.x User Guide
Page 52

Switch Explorer View
Figure 9: Example Switch View for a Core Switch 2/64
52 Web Tools Version 3.1.x/4.1.x User Guide
Page 53
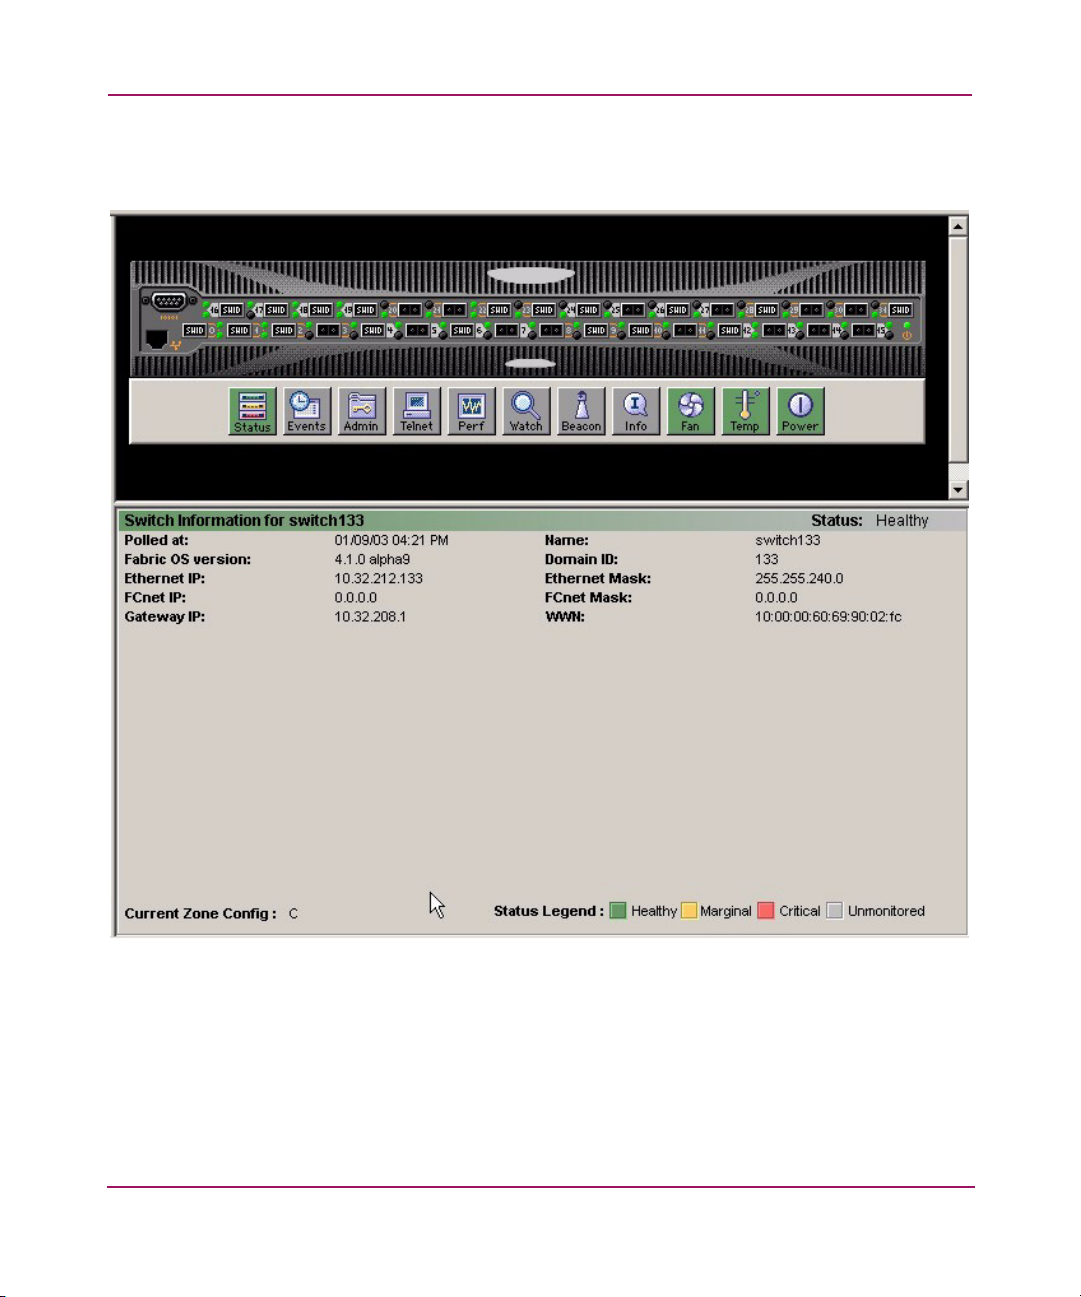
Switch Explorer View
An example of the Switch Graphic representation for a SAN Switch 2/32 is shown
in Figure 10.
Figure 10: Example Switch View for a SAN Switch 2/32
53Web Tools Version 3.1.x/4.1.x User Guide
Page 54

Switch Explorer View
Switch Graphic Buttons
There are a number of buttons beneath the Switch Graphic which enable you to
access various configuration and monitoring functions for the switch. Some of
these buttons may require a license key to activate. If the appropriate license key is
not installed for a particular feature, that button may not appear in the Switch
Graphic display. The buttons available from the Switch Graphic are described in
Tabl e 7.
Table 7: Switch Panel Buttons
Switch Panel
Button
Status: Healthy Select to open Switch Status View, which displays the overall
Events Select to open Switch Events View to display the switch events
Description
status of the selected switch (for information about this view,
see “Using the Switch Status Button” on page 66). The
background color indicates the switch status. Each color
indicates a different operational state:
■ Green - Healthy
■ Yellow - Marginal (mix of good and faulty readings)
■ Red - Down (more than two faulty readings)
■ Gray - Unknown or unmonitored
If no data is available from a switch, the most recent
background color remains displayed.
log (for information about this view, see “About the Switch
Events Button” on page 67).
Admin Select to open Switch Administration View (for information
about this view, see “Switch Admin Window” on page 91).
Telnet Select to launch the Fabric OS command line interface for the
switch (for information about this view, see “About the Telnet
Button” on page 71).
54 Web Tools Version 3.1.x/4.1.x User Guide
Page 55

Switch Explorer View
Table 7: Switch Panel Buttons (Continued)
Switch Panel
Button
Performance
Monitor
Optional Software. Select to launch the Performance Monitor.
For more information, see “About Performance Monitor” on
Description
page 150.
Fabric Watch Optional Software. Select to open the Fabric Watch View (for
information about this view, see “Fabric Watch” on
page 171).
Beacon Select to toggle a beacon on a switch. For more information,
see “About the Beacon Button” on page 76.
Info Select to display information for the chosen switch. For more
information, see “About the Switch Info Button” on page 78.
Fan Select to display fan status information for the chosen switch.
For more information, see “About the Fan Button” on
page 81. The background color indicates the fan status.
Each color indicates a different operational state:
■ Green - Healthy
■ Yellow - Marginal
■ Red - Down
■ Gray - Unknown or unmonitored
If no data is available from a switch, the most recent
background color remains displayed.
55Web Tools Version 3.1.x/4.1.x User Guide
Page 56
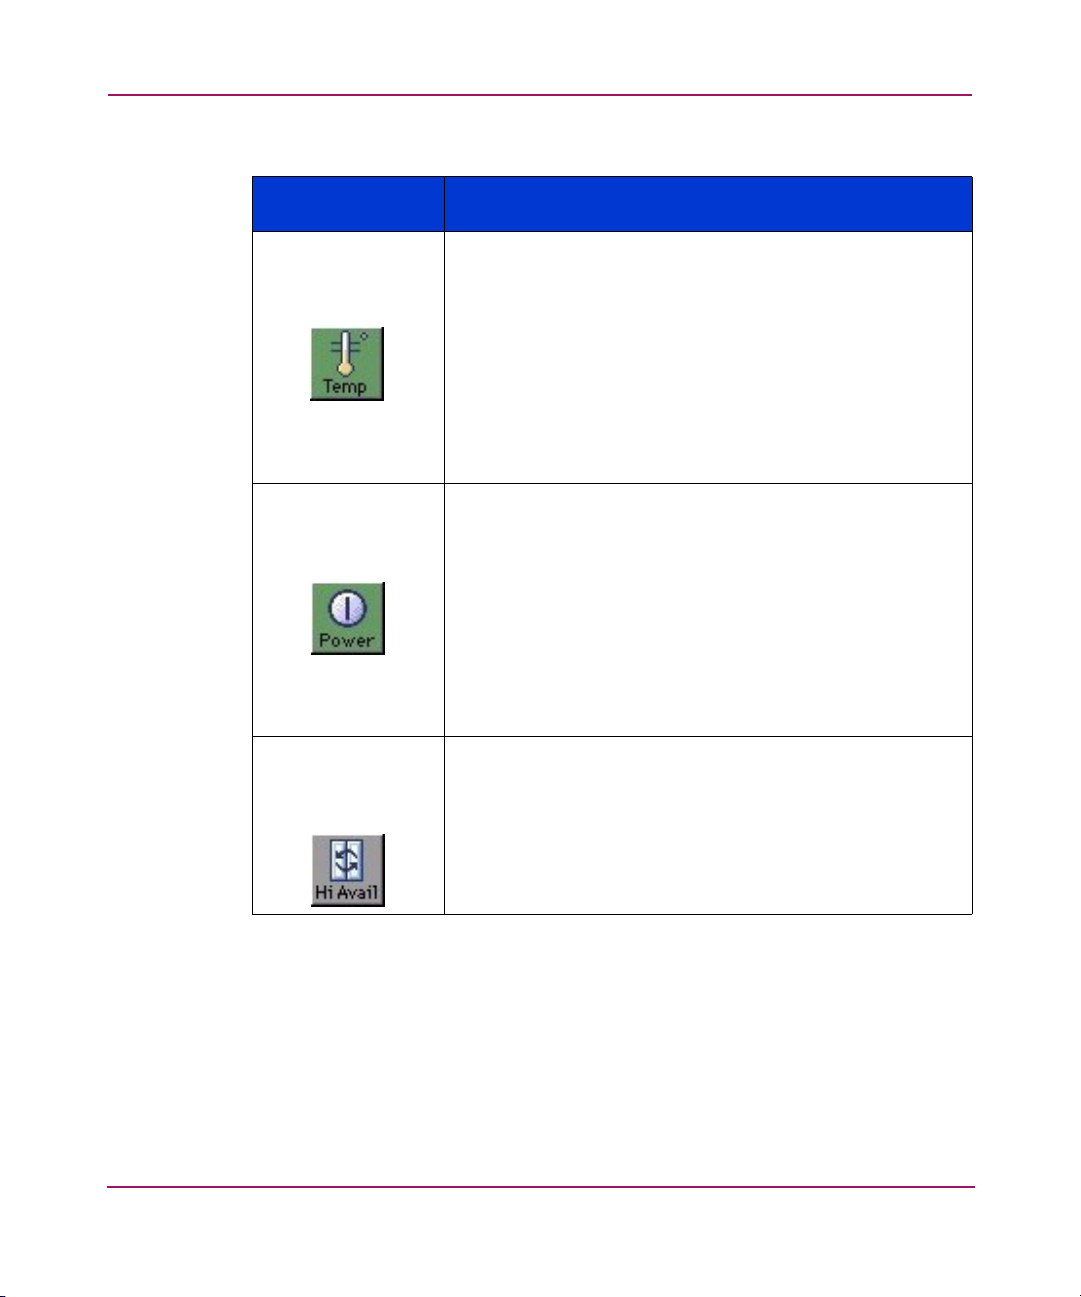
Switch Explorer View
Table 7: Switch Panel Buttons (Continued)
Switch Panel
Button
Description
Temperature Select to display the temperature status of the chosen switch.
For more information, see “About the Temp Button” on
page 82.The background color indicates the temperature
status. Each color indicates a different operational state:
■ Green - Healthy
■ Yellow - Marginal
■ Red - Down
■ Gray - Unknown or unmonitored
If no data is available from a switch, the most recent
background color remains displayed.
Power Select to display the power status of the selected switch. For
more information, see “About the Power Button” on page 83.
The background color indicates the power status. Each color
indicates a different operational state:
■ Green - Healthy
■ Yellow - Marginal
■ Red - Down
■ Gray - Unknown or unmonitored
If no data is available from a switch, the most recent
background color remains displayed.
Hi Avail Select to display the Hi-Availability window. The Hi
Availability feature enables you to perform CP failover
without disrupting traffic on the switch. Hi Availability
requires that you maintain synchronization of services on
each CP.
56 Web Tools Version 3.1.x/4.1.x User Guide
Page 57
Switch Information Window
Tabl e 8 describes the fields displayed in the Switch Information window, which is
located beside or beneath the switch icon (depending on switch type). Depending
on the switch type the order of fields displayed may change.
Table 8: Switch Information Window
Field Description
Switch Information
for <
switch name
Status Displays the status of the switch being displayed. Valid values
Polled at: Displays the time of the last status check, or if currently
Name: Displays the name of the switch.
Fabric OS version: Displays the Fabric OS version currently installed on the
Domain ID: Displays the Domain ID number that uniquely identifies the
Ethernet IP: Displays the Ethernet IP address.
Ethernet Mask: Displays the Ethernet subnetmask.
FCnet IP: Displays the Fibre Channel IP address.
FCnet Mask: Displays the Fibre Channel subnetmask.
Gateway IP: Displays the Gateway IP address.
WWN: Displays the unique numeric identifier for the switch;
Current Zone
Config:
Displays the name of the switch being displayed. To change
>
the name of the switch, see “About the Switch Information
Tab” on page 95.
are:
■ Healthy
■ Marginal
■ Down
unavailable, the time of the last successful status check.
switch.
switch within the fabric.
assigned by manufacturer.
Displays the name of the currently enabled Zone
Configuration. If no Zone Configuration is currently enabled,
the field displays as none.
Switch Explorer View
57Web Tools Version 3.1.x/4.1.x User Guide
Page 58

Switch Explorer View
Status Legend
The Status Legend defines the meaning of colors visible in the background of the
various icons in the Switch Explorer.
Each color indicates a different operational state:
■ Green - Healthy
■ Yellow - Marginal (mix of good and faulty readings)
■ Red - Down (more than two faulty readings)
■ Gray - Unknown or unmonitored
■ Dark Gray - monitoring is being initiated.
If no data is available from a switch, the status is unmonitored and the switch
displays as gray.
Note: For all status displays that are based on errors per time interval, any errors will
cause the status to show faulty until the entire sample interval has passed.
58 Web Tools Version 3.1.x/4.1.x User Guide
Page 59

Refresh Rates in Web Tools
Different areas of Web Tools refresh at different rates. Tab le 9 lists the polling
rates for the various panels in Web Tools.
Table 9: Polling Rate in the Switch Explorer Window
Switch Explorer
Area
Fabric Tree 15 seconds.
Unreachable
Switches in the
Fabric Tree
Switch View 15 seconds during normal operation. From 30 to 60 seconds
Switch Information
Panel
Name Server 15 seconds.
Zone Database 15 seconds.
Fabric Watch 15 seconds.
Performance
Monitor
2 minutes.
during initialization.
15 seconds.
The Performance Monitor polling rate is user defined.
Switch Explorer View
Polling Rate
59Web Tools Version 3.1.x/4.1.x User Guide
Page 60

Switch Explorer View
Accessing the Switch Explorer
To access the Switch Explorer, perform the following steps:
1. Launch Web Tools.
The Switch Explorer appears.
2. Click the “+” sign in the Navigation tree to view nested switches.
3. Click on the desired switch from the Fabric Tree.
The selected switch appears in the Switch Graphic view.
60 Web Tools Version 3.1.x/4.1.x User Guide
Page 61

Switch Management
This chapter provides the following information:
■ About Switch Management, page 62
■ About the Switch Status Button, page 65
■ About the Switch Events Button, page 67
■ About the Admin Button, page 70
■ About the Telnet Button, page 71
■ About the Performance Monitor Button, page 75
■ About the Beacon Button, page 76
■ About the Switch Info Button, page 78
■ About the Fabric Watch Button, page 80
■ About the Fan Button, page 81
■ About the Temp Button, page 82
■ About the Power Button, page 83
■ About HA Admin, page 84
4
61Web Tools Version 3.1.x/4.1.x User Guide
Page 62

Switch Management
About Switch Management
Switch Management is made up of the Switch Graphic area and the Switch
Information area; it is referred to as the Switch View.
Switch Explorer for the Core Switch 2/64
An example of the Switch Explorer for the Core Switch 2/64 is displayed in
Figure 11.
Figure 11: Example of the Switch Explorer for the Core Switch 2/64
62 Web Tools Version 3.1.x/4.1.x User Guide
Page 63

Note: The Active CP in the Core Switch 2/64 is labeled with a small arrow at the
bottom of the CP display.
Switch Explorer for SAN Switch 2/32
An example of the Switch Explorer for the SAN Switch 2/32 is displayed in
Figure 12.
Switch Management
Figure 12: Example of the Switch Explorer for the SAN Switch 2/32
63Web Tools Version 3.1.x/4.1.x User Guide
Page 64

Switch Management
Switch Information Field Descriptions
The Switch Information window is located beneath or beside the graphic
representation of the switch depending on the switch type (see Figure 11 or
Figure 12). Use the Switch Summary window to easily glance at vital switch
information. The fields displayed in the Switch Information view are described in
Tabl e 10.
Table 10: Switch Information View
Field Description
Switch Information
for <
switchname
Status Displays the status of the switch. Valid values are:
Polled At Displays the last date and last time the switch was polled for
Fabric OS version Displays the version of Fabric OS that is installed on the
Ethernet IP Displays the Ethernet IP address.
FCNet IP Displays the Fibre Channel IP address.
Gateway IP Displays the Gateway IP address.
Name Displays the name of the switch.
Domain ID Displays the Domain ID within the switch (a unique number
Ethernet Mask Displays the Ethernet subnet mask address, if one exists.
FCNet Mask Displays the Fibre Channel subnet mask address, if one
WWN Displays the World Wide Name of the switch.
Displays the name of the switch in the upper-left corner of the
>
window area.
■ Healthy
■ Marginal
■ Down
information.
switch.
that identifies the switch to the fabric and is used in routing
frames).
exists.
Further information about the switch can be located by selecting the Info button
(see “About the Fan Button” on page 81).
64 Web Tools Version 3.1.x/4.1.x User Guide
Page 65
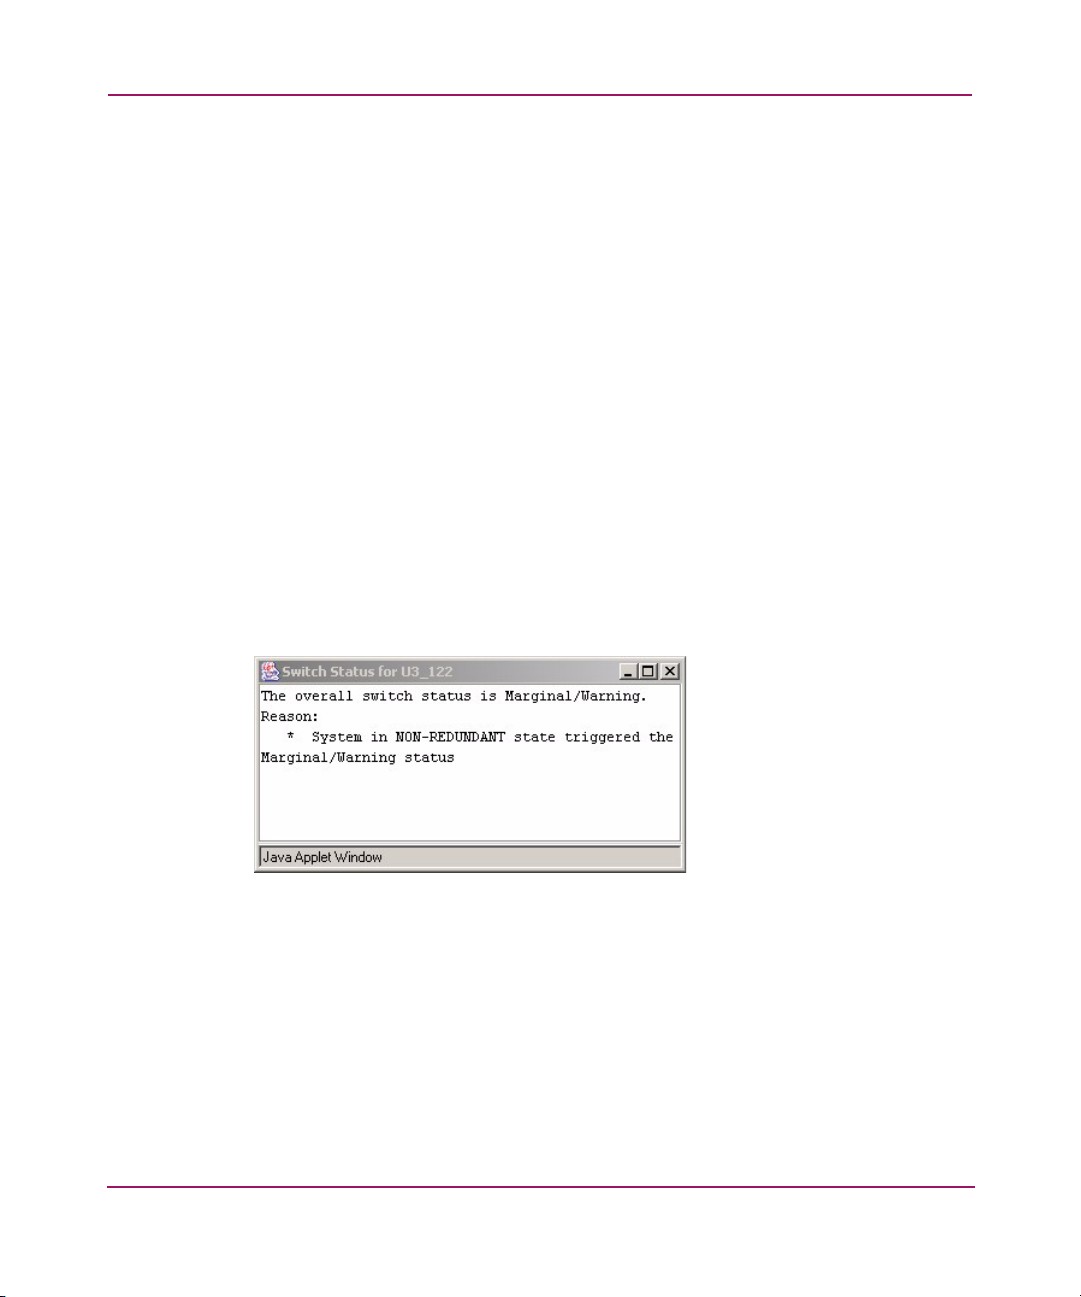
About the Switch Status Button
View or click the status button (see “Switch Graphic Buttons” on page 54) to
display the switch’s operational state. The background color of the button displays
the real-time status of the switch. See the list below for the meaning of the
background colors.
■ Green Healthy
■ Yellow Marginal (mix of good and faulty readings)
■ Red Down (more than two faulty readings)
■ Gray Unknown or unmonitored
If no data is available from a switch, the most recent background color remains
displayed.
For all statuses that are based on errors per time interval, any errors will cause the
status to show faulty until the entire sample interval has passed.
Switch Status Example
An example of the Switch Status window is displayed in Figure 13.
Switch Management
Figure 13: Switch Status Window
This window displays the status of the switch. If the switch is marginal or critical,
information on the trigger that caused that status is displayed.
65Web Tools Version 3.1.x/4.1.x User Guide
Page 66

Switch Management
Using the Switch Status Button
To check the physical health of a switch, perform the following procedure.
1. Launch Web Tools.
2. View the background color (which shows the status) of the desired switch in
the Fabric Tree.
For further information, continue to the next step.
3. Click on the desired switch in the Fabric Tree.
The Switch View displays for that switch.
4. View the background color of the Status button. See the “Status Legend” on
page 58.
5. Click the Status button to view a written description of the health status.
66 Web Tools Version 3.1.x/4.1.x User Guide
Page 67

About the Switch Events Button
The Switch Events button (see “Switch Graphic Buttons” on page 54) in the
Switch View displays a running log of events for the selected switch.
Switch Events Example
An example of the Switch Events window is shown in Figure 14.
Switch Management
Figure 14: Switch Events Window
Switch Events Field Descriptions
The Switch Events fields are described in Table 11 .
Table 11: Switch Events Field Descriptions
Field Description
Switch Displays the name of the switch, if one has been assigned.
Number Displays the order of the event.
Time Displays the time the event occurred.
67Web Tools Version 3.1.x/4.1.x User Guide
Page 68
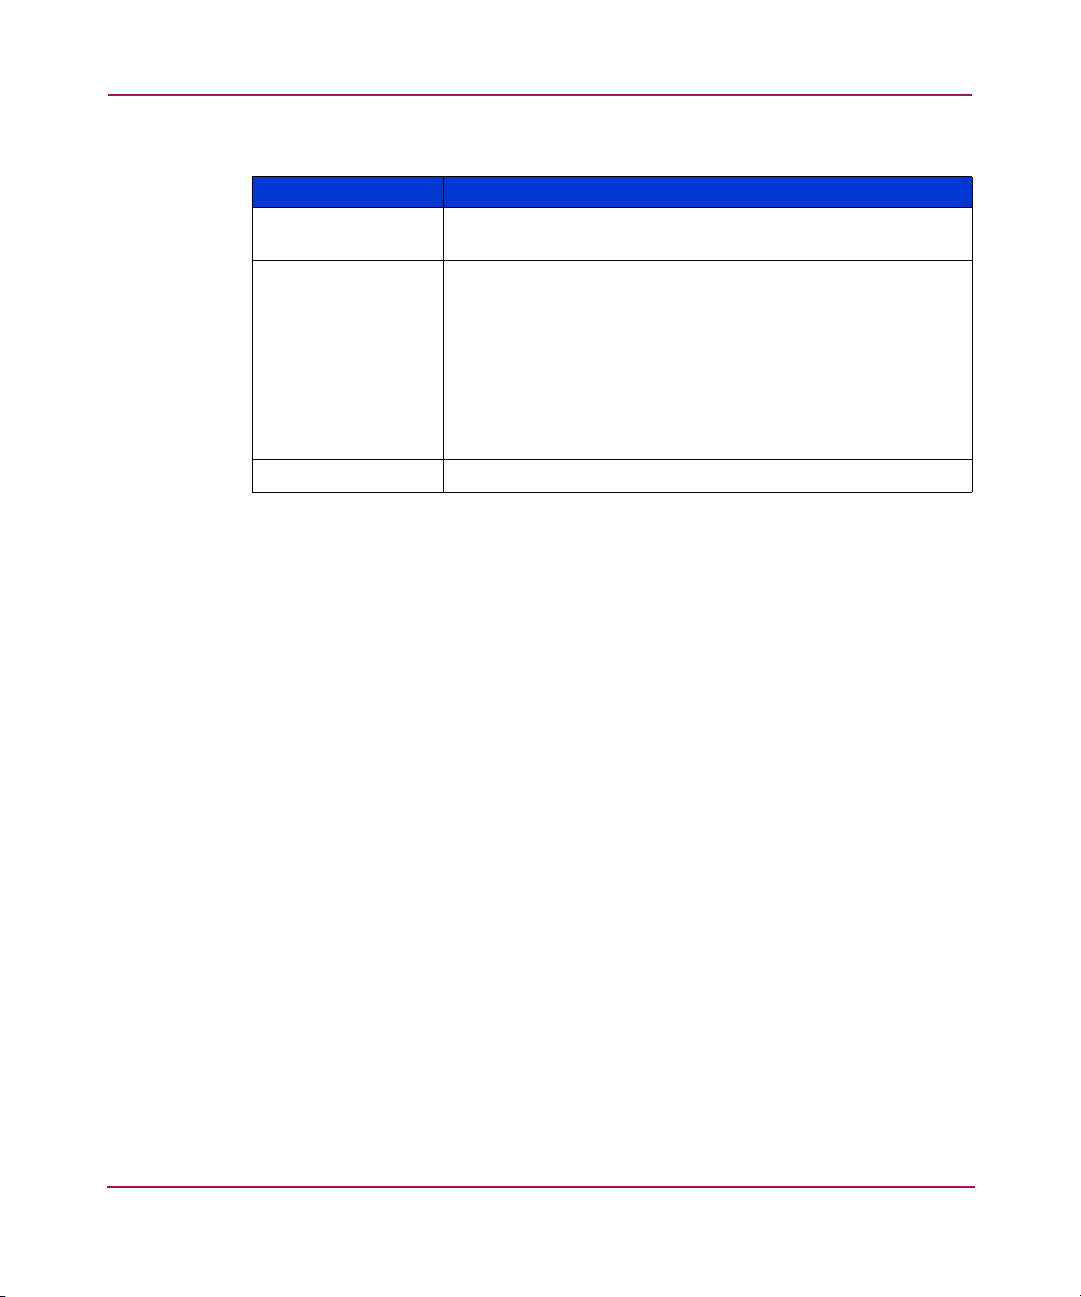
Switch Management
Table 11: Switch Events Field Descriptions (Continued)
Field Description
Count Displays the number of back-to-back occurrences of the same
event.
Level Displays the severity level of the event:
■ 0 panic (switch reboots)
■ 1critical
■ 2error
■ 3warning
■ 4information
■ 5debug
Message Displays a description of the event.
68 Web Tools Version 3.1.x/4.1.x User Guide
Page 69

Accessing the Switch Events Report
Perform the following steps to access the switch events report.
1. Launch Web Tools.
2. Select the desired switch from the Fabric Tree.
The Switch View displays.
3. Select the Switch Events button from the Switch View.
A Switch Events Report appears.
4. View the switch events and messages.
Switch Management
69Web Tools Version 3.1.x/4.1.x User Guide
Page 70

Switch Management
About the Admin Button
Use the Admin button (see “Switch Graphic Buttons” on page 54) of the Switch
View to access the switch administration functionality. For example:
■ Switch parameter configuration
■ Network configuration
■ Extended Fabric configuration
■ Routing
■ Firmware Download
■ Trunking
For complete information regarding the Admin View, see the “Switch Admin
Window” on
page 91.
70 Web Tools Version 3.1.x/4.1.x User Guide
Page 71

About the Telnet Button
Use the Tel ne t button (see “Switch Graphic Buttons” on page 54) from the Switch
View to access the switch using telnet. You must have administrative privileges to
access the telnet option. For information regarding controlling the switch through
the Fabric OS command line, see the HP StorageWorks Fabric OS Version
3.1.x/4.1.x Reference Guide.
Telnet and Security
If secure mode is enabled on the fabric, standard telnet access to switches is
disabled. You must use the Secure Telnet Application (sectelnet.exe) or SSH to
access the switch. For more information refer to the HP StorageWorks Secure
Fabric OS Version 1.0 User Guide for more information.
The following message is displayed if you attempt to open a telnet window from
Web Tools when secure mode is enabled.
Switch Management
Figure 15: Telnet Disabled Banner when in Secure Mode
Telnet Example
A sample telnet session window is displayed in Figure 16.
71Web Tools Version 3.1.x/4.1.x User Guide
Page 72

Switch Management
Figure 16: Telnet Sample Window
Telnet Descriptions
The sample Telnet fields are described in Tab le 12 .
Table 12: Telnet Window Field Descriptions
Field Descriptions
Fabric OS (tm) Displays the current Fabric OS version that is currently
login: Displays prompt. Enter Admin level User Name.
72 Web Tools Version 3.1.x/4.1.x User Guide
installed on the switch.
Page 73

Switch Management
Table 12: Telnet Window Field Descriptions (Continued)
Field Descriptions
Password: Displays prompt. Enter Admin level password.
switch:admin > Displays the switch name and login level prompt after a
successful login. Enter desired Fabric OS command.
Sample Command The sample commands used in Figure 16 are
secmodeshow and configshow. The output displays
information about the current switch and configuration. See
the
HP StorageWorks Fabric OS Version 3.1.x/4.1.x
Reference Guide
for more information about the Fabric OS
command line interface.
73Web Tools Version 3.1.x/4.1.x User Guide
Page 74

Switch Management
Accessing Telnet Through Web Tools
To access telnet through Web Tools, perform the following steps.
1. Launch Web Tools.
2. Select the desired switch from the Fabric Tree.
The Switch View displays.
3. Select the Tel ne t button from the Switch graphic.
The Telnet window appears.
4. Enter an Admin level user name and password.
5. Type the exit command to close the telnet session.
74 Web Tools Version 3.1.x/4.1.x User Guide
Page 75

About the Performance Monitor Button
Use the Performance Monitor button (see “Switch Graphic Buttons” on page 54)
to graphically display throughput (megabytes per second) for each port and for the
entire switch.
For complete information about the Performance Monitor, see “About
Performance Monitor” on page 150 in this document, or the HP StorageWorks
Advanced Performance Monitoring Version 3.1.x/4.1.x User Guide.
Switch Management
75Web Tools Version 3.1.x/4.1.x User Guide
Page 76

Switch Management
About the Beacon Button
Use the Beacon button (see “Switch Graphic Buttons” on page 54) of the Switch
View to physically locate a switch in a fabric. The beaconing function helps to
physically locate a switch by sending a signal to the specified switch, resulting in
an LED light pattern running back and forth along the switch. To perform
beaconing, see “About the Switch Info Button” on page 78.
76 Web Tools Version 3.1.x/4.1.x User Guide
Page 77

Switch Management
Beacon Button—Physically Locating a Switch in a Fabric
To physically locate a switch in a fabric, use the Beacon button as described in the
following steps.
1. Launch Web Tools by entering the IP address of the switch you wish to locate.
2. Highlight the switch in the Fabric Tree.
The selected switch appears in the Switch View.
3. Select the Beacon button on the switch View.
The LED lights on the selected switch light up and run back and forth across
the switch.
4. Look at the physical switches in your installation to locate the desired switch.
77Web Tools Version 3.1.x/4.1.x User Guide
Page 78

Switch Management
About the Switch Info Button
Use the Switch Info button (see “Switch Graphic Buttons” on page 54) of the
Switch View to display fundamental switch information such as the WWN, State,
and Ethernet IP address.
The Switch Info button fields are described in Ta bl e 13.
Table 13: Info Button Fields Descriptions
Field Description
WWN Displays the World Wide Name of the switch.
Domain ID Displays the Domain ID of the switch (a unique number that
identifies the switch to the fabric and is used in routing
frames).
Role Displays whether the switch is a Principal or Subordinate
switch in the fabric.
State Displays the state of the switch, whether online or offline.
Firmware Displays the current version of firmware loaded on the switch.
Manufacturer
Serial #
Supplier Serial # Displays the supplier serial number of the switch, if
Ether IP Displays the Ethernet IP address.
Ether NM Displays the Ethernet Mask
FC IP Displays the Fibre Channel IP address, if one exists.
FC NM Displays the Fibre Channel Mask, if one exists.
Gateway Displays the Gateway address of the switch.
License ID Displays the License ID of the switch. The license ID number is
Displays the manufacturer serial number of the switch.
applicable.
required to get license keys for the switch.
78 Web Tools Version 3.1.x/4.1.x User Guide
Page 79

Accessing Switch Information
Access switch information by performing the following steps.
1. Launch Web Tools by entering the IP address of the switch you wish to locate.
2. Highlight the switch in the Fabric Tree.
The selected switch appears in the Switch View.
3. View the information listed below the graphic representation of the switch.
Switch Management
79Web Tools Version 3.1.x/4.1.x User Guide
Page 80

Switch Management
About the Fabric Watch Button
The Fabric Watch button only appears when the optional license is installed on
the switch.
For more information, see “Fabric Watch” on
page 171.
80 Web Tools Version 3.1.x/4.1.x User Guide
Page 81

About the Fan Button
The background color of the Fan button indicates the overall status of the fans
(see “Switch Graphic Buttons” on page 54):
■ Green Healthy
■ Yellow Marginal (mix of good and faulty readings)
■ Red Down (more than two faulty readings)
■ Gray Unknown or unmonitored
Switch Management
For more information regarding Fan information,
guide supplied with your specific switch (the installation guide is also available on the
V3.1.x or V4.1.x Software CD).
.
refer to the switch installation
81Web Tools Version 3.1.x/4.1.x User Guide
Page 82

Switch Management
About the Temp Button
The background color of the Te mp button (see “Switch Graphic Buttons” on
page 54) indicates the overall temperature status:
■ Green Healthy
■ Yellow Marginal (mix of good and faulty readings)
■ Red Down (more than two faulty readings)
■ Gray Unknown or unmonitored
For more information regarding Temp information,
guide supplied with your specific switch (the installation guide is also available on the
V3.1.x or V4.1.x Software CD)
refer to the switch installation
.
82 Web Tools Version 3.1.x/4.1.x User Guide
Page 83

About the Power Button
The background color of the Power button indicates the overall status of the power
(see “Switch Graphic Buttons” on page 54):
■ Green Healthy
■ Yellow Marginal (mix of good and faulty readings)
■ Red Down (more than two faulty readings)
■ Gray Unknown or unmonitored
Switch Management
For more information regarding power source information,
installation guide supplied with your specific switch (the installation guide is also
available on the V3.1.x or V4.1.x Software CD)
.
refer to the switch
83Web Tools Version 3.1.x/4.1.x User Guide
Page 84

Switch Management
About HA Admin
The HA Admin window displays information about the status of high availability
(HA) on the Core Switch 2/64 and each CP. It also enables you to perform tasks
such as HA Failover or Synchronize Services on the CPs. The HA Admin window
contains the following information:
■ HA Admin Common Field and Button Descriptions, page 86
■ Service Tab Field Descriptions, page 86
■ HA Admin CP Tab Field Descriptions, page 88
HA Admin Example
An example of the HA Admin window is shown in Figure 17.
84 Web Tools Version 3.1.x/4.1.x User Guide
Page 85

Switch Management
Figure 17: HA Admin Window
HA Admin Field Descriptions
The common fields available in the HA Admin window are described in Table 14.
85Web Tools Version 3.1.x/4.1.x User Guide
Page 86

Switch Management
Table 14: HA Admin Common Field and Button Descriptions
Field Description
Chassis Displays the switch type.
HA Summary Displays the HA summary status. Valid values can be:
Synchronize
Services Button
Initiate Failover
Button
Close Button Click this button to close the HA Admin page.
Refresh Button Click this button to refresh the information on this page.
Service Tab Field Descriptions
■ Non-Disruptive Failover Ready
■ Disruptive Failover Ready
■ No Failover
Action Buttons
Click this button to begin a synchronization of services on
both CPs. Once the services of both CPs are synchronized
and there is full redundancy then a non-disruptive failover
can be initiated.
Click this button to initiate a failover from the active CP to the
standby CP.
The fields available in the Service Tab view are described in Tab le 15 .
Table 15: HA Admin Service Tab Field Descriptions
Field Description
Logical Switch
selection window
Active Service Displays information for the Active Service. Depending on
Role Indicates if the Service is Active or Standby.
86 Web Tools Version 3.1.x/4.1.x User Guide
This window enables you to select the RightSwitch service
view or the LeftSwitch service view. In the Core Switch 2/64
chassis, logical switch 0 is the leftswitch, and logical switch 1
is the rightswitch as seen from the cable side of the switch.
When you select a Switch Service view, the Service status for
that switch is displayed.
which service you selected in the Logical Switch window and
the current configuration of the CPs, valid values can be:
■ RightSwitchCP0
■ RightSwitchCP1
■ LeftSwitchCP0
■ LeftSwitchCP1
Page 87
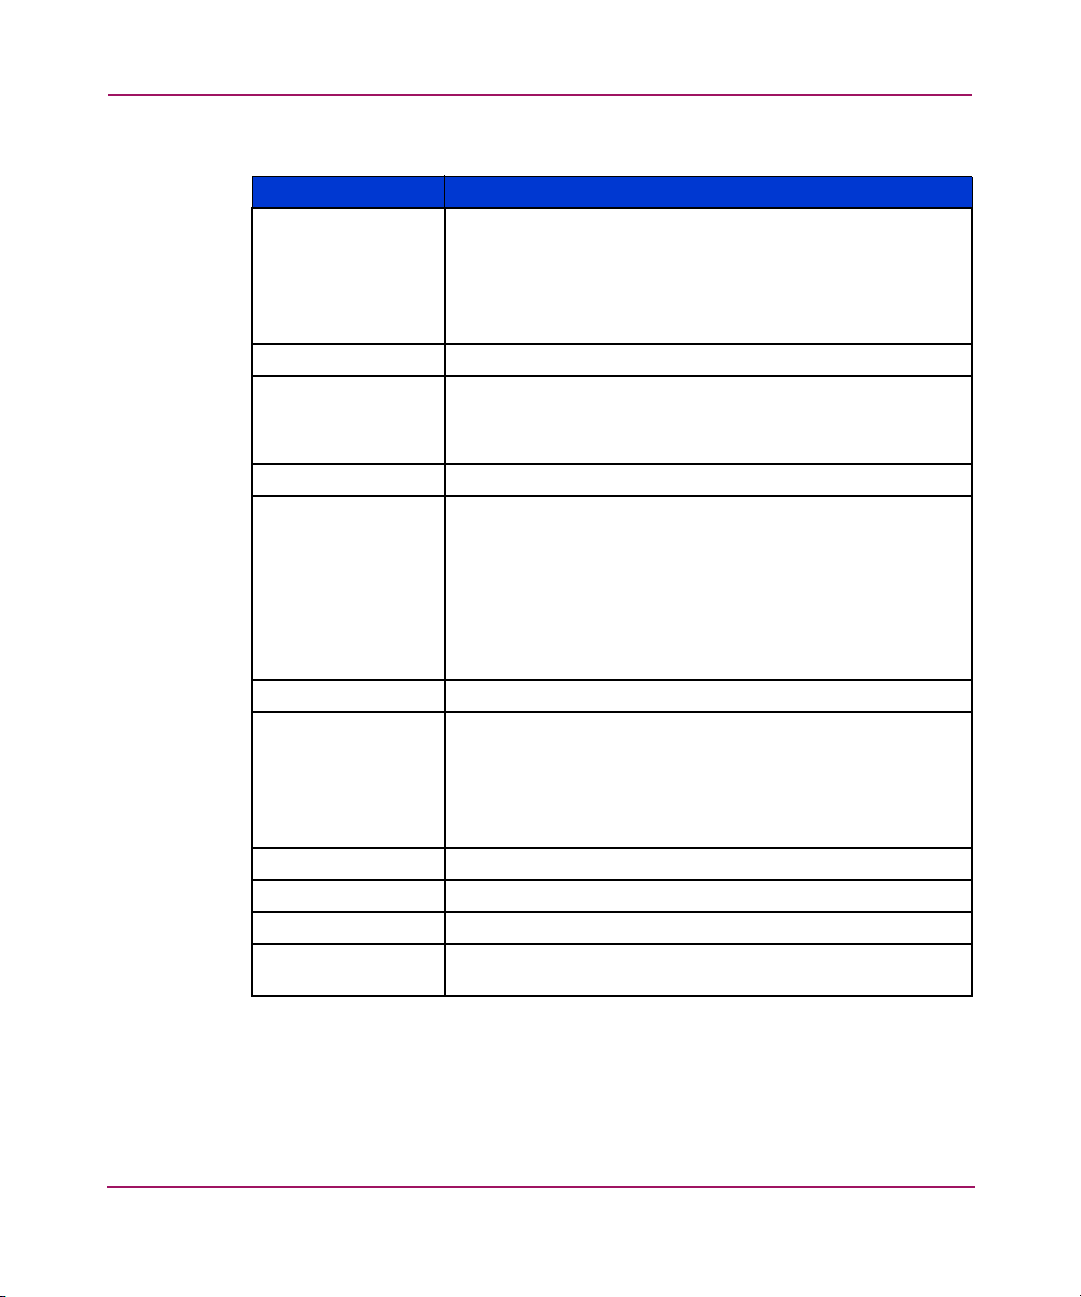
Switch Management
Table 15: HA Admin Service Tab Field Descriptions (Continued)
Field Description
Status Displays the status of the Active Service. Valid values for the
Active Service are:
■ Non-Disruptive Failover Ready
■ Disruptive Failover Ready
■ No Failover
Location Displays the location of the Active CP as CP0 or CP1.
Event Displays the last event. Valid values for this field are:
■ Failover
■ Arbitration
Event Time Displays the day, date, hour, and year of the last event.
Standby Service Displays information for the Standby Service. Depending on
which switch you selected in the Logical Switch window and
the current configuration of the CPs, valid values can be:
■ RightSwitchCP0
■ RightSwitchCP1
■ LeftSwitchCP0
■ LeftSwitchCP1
Role Indicates if the Service is Active or Standby.
Status Displays the status of the Standby Service. Valid values for
the Standby Service are:
■ Non-Disruptive Failover Ready
■ Disruptive Failover Ready
■ No Failover
Details Button Displays whether the CP services are in sync.
Location Displays the location of the Standby CP as CP0 or CP1.
Last Sync Time Displays day, date, hour, and year of the last in-sync time.
Last Out of Sync
Displays day, date, hour, and year of last out-of-sync time.
Time
CP Tab Field Descriptions
The fields available in the CP Tab view are described in Tab le 16 .
87Web Tools Version 3.1.x/4.1.x User Guide
Page 88

Switch Management
Table 16: HA Admin CP Tab Field Descriptions
Field Description
Active CP
(CP0 or CP1)
Displays information for the Active CP. The top CP in this view
is always the Active CP. Depending on the current
configuration of the CPs this can be:
■ CP0
■ CP1
Role Displays the Role of the selected CP as the Active or Standby.
Status Displays the status of the Active CP. Valid values for the
Active CP are:
■ Healthy
■ Faulty
Slot Displays the slot of the Active CP as slot 5 or slot 6.
Event Displays the last event. Valid values for this field are:
■ Failover
■ Arbitration
Event Time Displays the day, date, hour, and year of the last event.
Standby CP
(CP0 or CP1)
Displays information for the Standby CP. Depending on the
current configuration of the CPs this can be:
■ CP0
■ CP1
Role Displays the Role of the selected CP as the Active or Standby.
Status Displays the status of the Standby CP. Valid values for the
Standby CP are:
■ Healthy
■ Faulty
Details Button Displays the status of faulty devices.
Slot Displays the slot of the Active CP as slot 5 or slot 6.
88 Web Tools Version 3.1.x/4.1.x User Guide
Page 89

Using HA Admin
The following sections show how to access the HA Admin interface, how to use it
to synchronize services on the CP, and how to initiate a CP failover.
Accessing the HA Admin Interface
Perform the following steps to access the HA Admin interface.
1. Launch the web browser.
2. Enter the IP address in the Location/Address field and press Enter.
Example:
http://123.123.123.123
Web Tools launches, displaying Fabric Tree.
3. Click a switch in the Fabric Tree.
The Switch graphic appears.
4. Click the Hi Avail icon on the switch panel.
The HA Admin window appears as shown in Figure 17.
Switch Management
Synchronizing Services on the CP
A non-disruptive CP Failover is only possible when all the services have been
synchronized. To synchronize the services perform the following:
1. Launch the web browser.
2. Enter the IP address in the Location/Address field and press Enter.
Example:
http://123.123.123.123
Web Tools launches, displaying Switch Explorer View.
3. Click a switch in the Fabric Tree.
The Switch graphic appears.
4. Click the Hi Avail icon on the switch panel.
The HA Admin window appears as shown in Figure 17.
5. Verify that HA Summary field displays Non-Disruptive Failover Ready.
89Web Tools Version 3.1.x/4.1.x User Guide
Page 90

Switch Management
If the HA Summary field displays Disruptive Failover Ready, click the
Synchronize Services Button and wait for the CPs to complete a
synchronization of services, so that a Non-Disruptive Failover is ready.
Once the HA Summary field displays Non-Disruptive Failover Ready a
failover can be initiated without disrupting frame traffic on the fabric.
Initiating a CP Failover
Perform the following steps to initiate a CP failover.
1. Launch the web browser.
2. Enter the IP address in the Location/Address field and press Enter.
Example:
http://123.123.123.123
Web Tools launches, displaying Switch Explorer view.
3. Click a switch in the Fabric Tree.
The Switch graphic appears.
4. Click the Hi Avail icon on the switch panel.
The HA Admin window appears as shown in Figure 17.
5. Verify that HA Summary field displays Non-Disruptive Failover Ready or
Disruptive Failover Ready. See “Synchronizing Services on the CP” on
page 89 for more information.
6. Click the Initiate Failover button. A non-disruptive failover may take a few
minutes to complete. You may lose connection to the switch for a few minutes
during the Failover. Web Tools will automatically resume the connection after
the failover.
90 Web Tools Version 3.1.x/4.1.x User Guide
Page 91

Switch Admin Window
This chapter provides the following information:
■ About the Switch Admin Window, page 92
■ Accessing the Switch Admin Window, page 94
5
91Web Tools Version 3.1.x/4.1.x User Guide
Page 92

Switch Admin Window
About the Switch Admin Window
The Switch Admin Window can be entered with User level access, but certain
areas require Admin level access. Use the Switch Admin Window to access the
following tabs:
■ About the Switch Information Tab, page 95
■ About the Network Config Tab, page 98
■ About the Upload/Download Tab, page 103
■ About the SNMP Tab, page 108
■ About the License Admin Tab, page 112
■ About the Port Setting Tab, page 115
■ About the Configure Tab, page 120
■ About the Routing Tab, page 131
■ About the Extended Fabric Tab, page 142
■ About the Trunk Information Tab, page 146
Switch Admin Window
For examples of the Switch Admin Window tabs, see each specific tab; for
example: “About the Switch Information Tab” on
page 95.
Switch Admin Window Field Descriptions
The common buttons that appear on most of the tabs in the Switch Admin
Window are described in Tab le 1 7.
Table 17: Switch Admin Window Field Descriptions
Field Description
SwitchName Displays the Switch name.
Domain ID Displays the switch Domain ID.
WWN Displays the switch WWN.
Date Displays the current day, date and time.
Apply Click this button to save any changes made to this tab and
remain in the current tab. Additional changes can be made
and the Apply button clicked when making changes
incrementally.
92 Web Tools Version 3.1.x/4.1.x User Guide
Page 93

Switch Admin Window
Table 17: Switch Admin Window Field Descriptions (Continued)
Field Description
Close Click this button to exit the Admin Interface. If changes have
been made and not committed by clicking the Apply button,
a dialog box is presented. It allows the changes to be
committed or deleted.
Reset Click this button to reset the field values to the last set of
committed changes. If the Apply button has not been pressed
on this tab, the parameters are returned to the original values
the tab contained when it was initially displayed.
Refresh Click this button to receive the latest switch information.
Switch Commit
Messages
Refers to the small window at the bottom of each tab.
Displays a log regarding recent switch admin commit
changes.
Status Message Appears in the bottom left corner of the tab; displays the type
of administrative interface being viewed.
Status Icon Appears in the bottom right corner of the tab; refers to the
status of the switch. A green square means the switch is
enabled; a red square means the switch is disabled.
93Web Tools Version 3.1.x/4.1.x User Guide
Page 94

Switch Admin Window
Accessing the Switch Admin Window
Use the following steps to access the Switch Admin window.
1. Launch Web Tools by entering the desired IP address in a browser window.
The Switch Explorer appears.
2. Select a switch from the Fabric Tree.
The selected switch appears in the Switch View.
3. Select the Admin icon from the switch graphic. See “Switch Graphic Buttons”
on page 54.
The login dialog box appears.
4. Enter the admin user name and password.
5. Select the desired tab.
For reference information on the specific tabs, see the About and Using
sections of this chapter.
94 Web Tools Version 3.1.x/4.1.x User Guide
Page 95

About the Switch Information Tab
Use the Switch Information tab to manage basic switch setup for items such as
switch name, switch domain ID and enabling and disabling the switch. For
additional Switch Setting information, see “Using the Network Config Tab” on
page 102.
Switch Information Tab Example
An example of the Switch Information tab is shown in Figure 18.
Switch Admin Window
Figure 18: Switch Information Tab of the Switch Admin Window
95Web Tools Version 3.1.x/4.1.x User Guide
Page 96
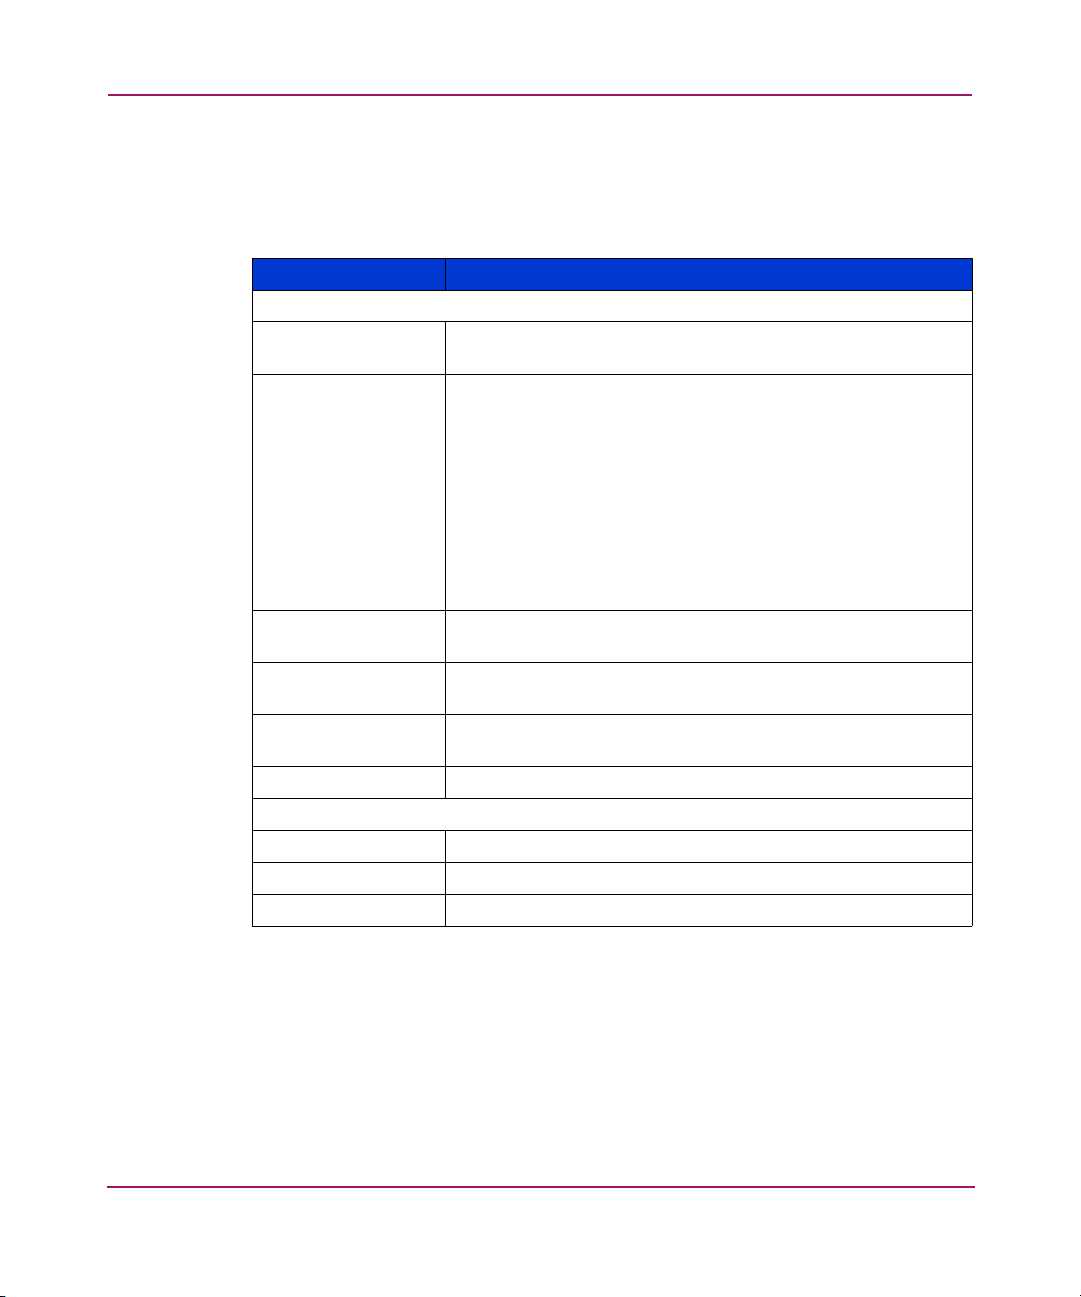
Switch Admin Window
Switch Information Field Descriptions
The Switch Information fields are described in Table 18 .
Table 18: Switch Information Field Descriptions
Field Description
Name Display or modify the current switch name. The switch name
Domain ID Displays or sets switch domain ID. Domain IDs must be
Manufacturers
Serial #
Supplier Serial # Displays the Supplier serial number of the switch, if
Switch Status
Enable / Disable
View Report Click this button to view a report of the selected switch.
DNS Server 1 Display or modify the first DNS Server name.
DNS Server 2 Display or modify the second DNS Server name.
Domain Name Display or modify the Domain name of the DNS Server.
can be from 1 to 15 characters in length.
unique within a fabric. Domain ID can only be modified
when the switch is disabled. The switch must be disabled to
change domain ID.
To change domain ID, enter new domain ID in this field.
■ Use a number from 1 to 239 for normal operating mode
(FCSW compatible)
■ Use a number from 0 to 31 for VC encoded address
format mode (backward compatible to StorageWorks
Fibre Channel Switches 8 and 16).
Displays the Manufacturer serial number of the switch (Read
only).
applicable (Read only).
Select the Enable radio button to enable the switch, or the
Disable radio button to disable the switch.
Email Configuration
Name and ID
96 Web Tools Version 3.1.x/4.1.x User Guide
Page 97

Using the Switch Information Tab
The following sections show how to use the Switch Information tab to
enable/disable a switch, and to view/print a switch report.
Enabling/Disabling a Switch
Use the following procedure to enable/disable a switch.
1. Access the Switch Admin Window (see “About the Switch Admin Window”
on page 92).
2. Enter the admin user name and password.
3. Select the Switch Information tab.
4. Under the Select the (Switch Status) Enable radio button to enable the switch;
or, select the (Switch Status) Disable radio button to disable the switch.
5. Click the Apply button.
Viewing/Printing a Switch Report
Use the following procedure to view/print a switch report.
1. Access the Switch Admin Window (see “About the Switch Admin Window”
on page 92).
2. Enter the admin user name and password.
Switch Admin Window
3. Select the Switch Information tab.
4. Click the View Report button.
A switch report appears.
5. View or print the report using your browser or the Print Screen option of your
computer.
97Web Tools Version 3.1.x/4.1.x User Guide
Page 98

Switch Admin Window
About the Network Config Tab
Use the Network Config tab of the Administrative interface to manage the IP
networking functionality of the switch.
For more detailed information regarding network configuration, see the HP
StorageWorks Fabric Operating System Procedures Version 3.1.x/4.1.x User
Guide or configure command in the HP StorageWorks Fabric OS Version
3.1.x/4.1.x Reference Guide.
Syslog IP
Syslog IP represents the IP address of the server that is running the Syslog
process. The Syslog daemon reads and forwards system messages to the
appropriate log files and/or users, depending on the system configuration. When
one or more IP addresses are configured, the switch forwards all error log entries
to the syslogs on the specified servers. Up to six servers are supported. See the HP
StorageWorks Fabric Operating System Procedures Version 3.1.x/4.1.x User
Guide for more information on configuring the Syslog daemon.
Switch Identification
If both the Fibre Channel IP and Ethernet IP are present, the switch is identified by
the Fibre Channel IP.
Network Config Tab Example
An example of the Network Config tab is shown in Figure 19.
98 Web Tools Version 3.1.x/4.1.x User Guide
Page 99

Switch Admin Window
Figure 19: Network Configuration Tab of the Switch Admin Window
An example of the Advanced IP Configuration window (Core Switch 2/64 only) is
shown in Figure 20.
99Web Tools Version 3.1.x/4.1.x User Guide
Page 100

Switch Admin Window
Figure 20: Advanced IP Configuration Window (Core Switch 2/64 only)
Network Config Field Descriptions
The Network Config fields are described in Tab le 19.
Table 19: Network Config Field Descriptions
Field Description
Ethernet IP Displays the Ethernet IP address.
Ethernet Mask Displays the Ethernet SubnetMask address.
Gateway IP Displays the Gateway IP address.
Fibre Channel Net IPDisplays the Fibre Channel IP address, if one exists.
Fibre Channel
NetMask
Advanced Button Displays the Advanced IP Configuration window (Figure 20).
Syslog IP window Displays the currently configured syslog recipients. See the
Displays the Fibre Channel subnet mask address, if one
exists.
This window displays the IP information configured for each
network element (CP1, CP1, Logical Switch 0, and Logical
Switch 1) in the Core Switch 2/64. This window is read-only
and is only available for the Core Switch 2/64.
Syslog IPs
HP StorageWorks Fabric Operating System Procedures
Version 3.1.x/4.1.x User Guide
configuring the Syslog daemon.
Syslog IP Field Enter any valid IP for a host and click the Add button to
configure that IP as a recipient of syslog messages.
100 Web Tools Version 3.1.x/4.1.x User Guide
for more information about
 Loading...