

Page 1

User’s Reference
Publication Number 16534-97009
February 1999
For Safety Information, Warranties, and Regulatory
Information, see the pages behind the Index
Copyright Hewlett-Packard Company 1991 – 1999
All Rights Reserved
HP 16533A 1-GSa/s and
HP 16534A 2-GSa/s Digitizing
Oscilloscope
Page 2

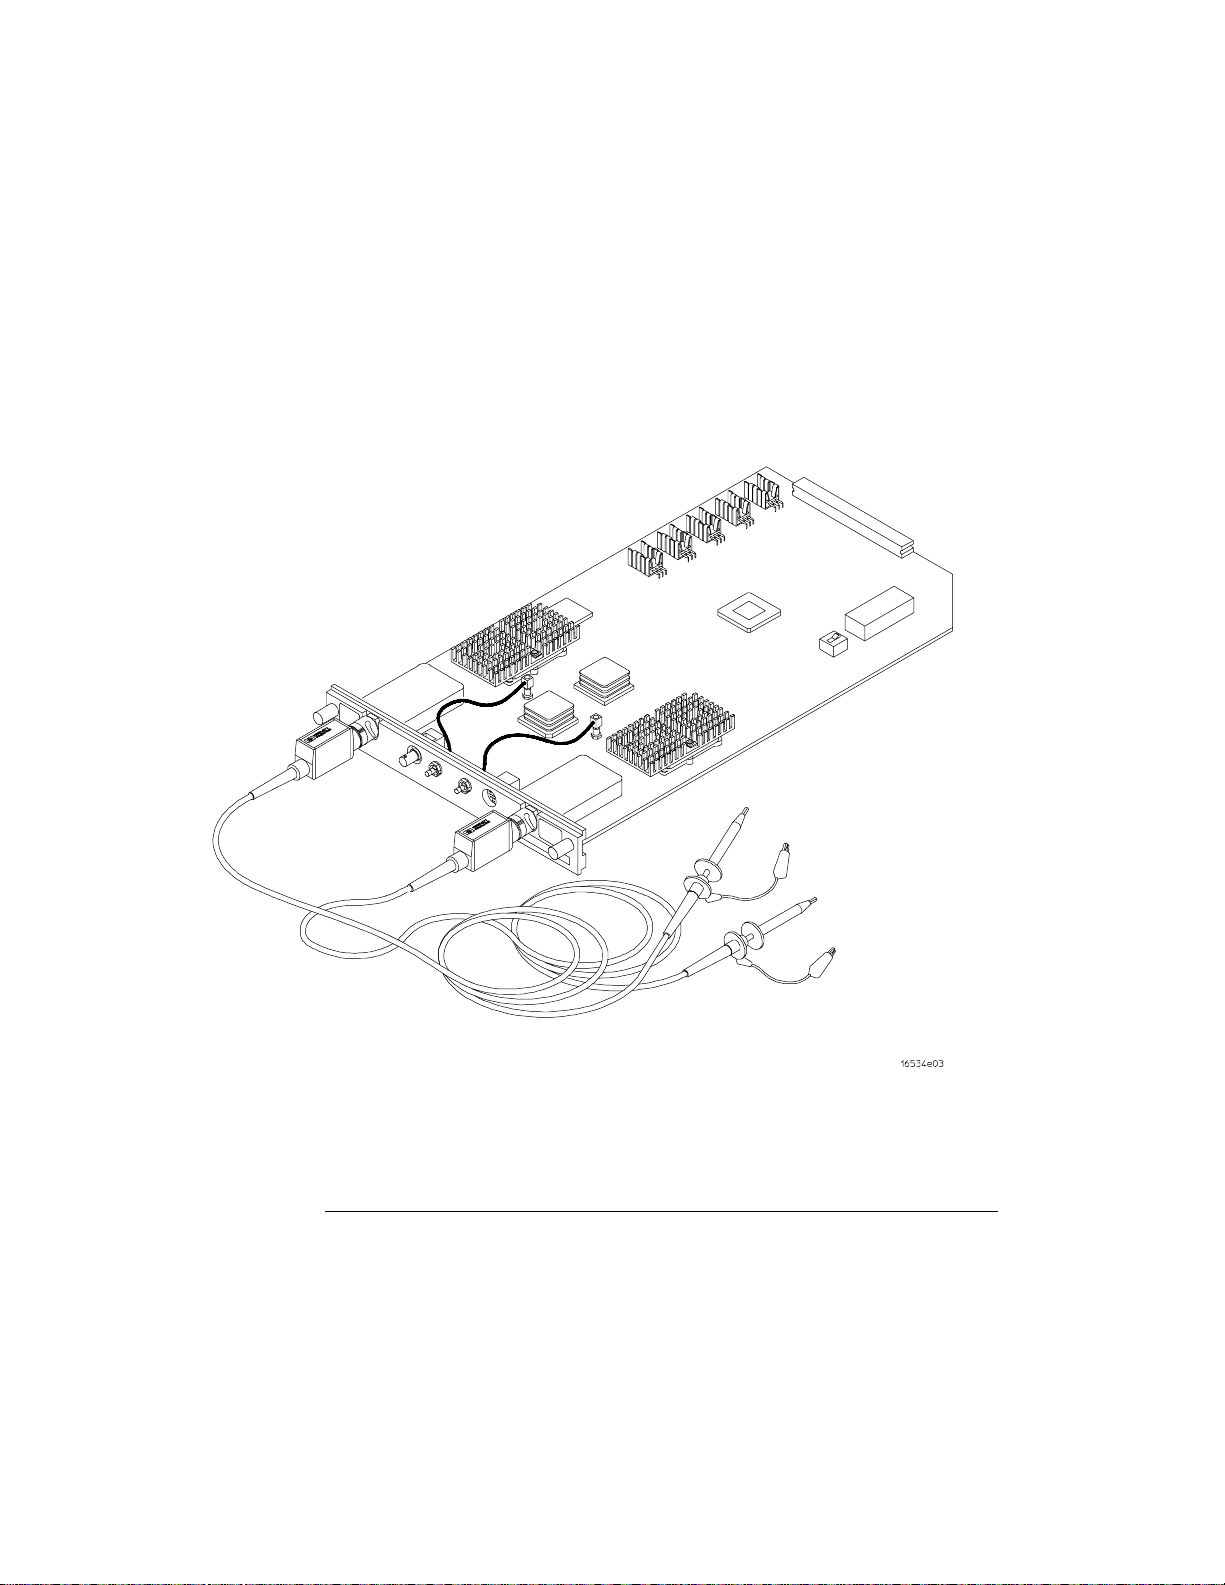
The HP 16533/34A Digitizing Oscilloscope
The HP 16533/34A is a digitizing oscilloscope module for the HP
16500B/C logic analysis system. With a bandwidth of up to 500 MHz
and a sampling rate up to 2 GSa/s, you can make accurate
measurements on high speed digital circuits with rise times as fast as
1.5 ns.
When configured with other measurement modules in the
HP 16500B/C logic analysis system, cross-domain measurements are
time-correlated and displayed together on the same screen.
Memory depth of 32 KBytes per channel allows the HP 16533/34A to
capture a sufficiently long analog record prior to trigger. A long
record allows adequate time resolution to identify errors confidently.
Configuration
Either model can be used as a single-card module or in a multi-card
module configuration. For each card configured into a multi-card
module, you gain two signal inputs up to a maximum of eight channels
(four-card module).
ii
Page 3
Compatibility
If you are upgrading from the HP 16532A, the following compatibility
issues should be noted:
If an HP 16532A file is loaded into an HP 16533/34A, the
•
HP 16533/34A will set up identically. However, the HP 16532A data
will not be read or displayed.
The HP 16532A cannot load files that were stored from an
•
HP 16533/34A.
You cannot mix HP 16532A and HP 16533/34A cards in a multi-card
•
module.
The HP 16533/34A Os ci ll oscope
iii
Page 4

In This Book
This book provides a detailed description of the features of the HP
16533/34A digitizing oscilloscope modules. It identifies the different menus
available on the oscilloscope, and shows what options are available in the
menus. It then explains what each of these options mean and what they do.
The book is divided into the following chapters:
Chapter 1 describes the options for running and stopping the oscilloscope
and explains single and repetitive modes of operation.
Chapter 2 describes the Autoscale function—what is does, what trigger it
selects to trigger on, and what fields and menus are affected by the
algorithm.
Chapter 3 describes the Channel menu options—input identification, vertical
sensitivity and position, probe attenuation factor, coupling field selection,
and preset values.
Chapter 4 describes time base functions—sweep speed, horizontal position,
pan and zoom, and sample period display.
Chapter 5 describes time marker functions—both manual and automatic. It
describes the capabilities of both manual and automatic time markers and
the fields available in each, then describes the function of each of these
fields. It also decribes voltage markers, the fields available to them, and the
function of each of these fields.
Chapter 6 describes trigger options available—immediate, pattern, and edge.
It describes their use, configurations available, and the fields controlling
each option.
Chapter 7 describes the display options—normal, average, and accumulate.
It then explains when each is used, and what the results are when each is
used.
Chapter 8 describes the Auto-Measure feature and explains the algorithm for
each of the nine automatic measurements taken. The measurements taken
using this feature are: frequency, period, peak-to-peak voltage, positive pulse
width, negative pulse width, rise time, fall time, preshoot, and overshoot.
iv
Page 5
1
Run/Stop Options
Chapter 9 describes the Waveform
Selection menu. This menu lets you
select the following modes of operation:
single channel, overlay,
Chan + Chan, or Chan−Chan. It also
allows you to insert, replace, or delete
channels from the display.
Chapter 10 gives you the specifications
and characteristics for the oscilloscope.
Chapter 11 describes the module
installation and bench service procedures.
The Index is an alphanumeric listing of
the subject matter contained in this book.
The Glossary defines some of the
common terms you will find throughout
this book.
2
3
4
5
6
7
8
The Waveform S election Menu
9
10
Autoscale
The Channel M enu
Time Base F unctions
The Marker Menu
The Trigger Menu
The Display Menu
The Auto-Meas ure Menu
Specifications and
Characteristics
11
Installation and Operator’ s
Service
Index
Glossary
v
Page 6

vi
Page 7

Contents
1 Run/Stop Options
Run/Stop Options 1–2
Autoscale Run 1–3
Run Field 1–3
Stop Field 1–4
2 Autoscale
Autoscale Field Options 2–3
Autoscale Algorithm 2–4
Menus and Fields Changed by the Autoscale Algorithm 2–6
3 The Channel Menu
Input Field 3–4
V/Div Field 3–5
Offset Field 3–6
Probe Field 3–7
Coupling Field 3–7
Preset Field 3–8
4 Time Base Functions
s/Div Field 4–3
Delay Field 4–5
Sample Period Field 4–8
5The Marker Menu
Manual Time Markers Options 5–5
Tx to To Field 5–6
Trig to X Field 5–7
Trig to O Field 5–8
Channel Label Field 5–8
T Marker Value Display 5–9
Contents–1
Page 8

Contents
Automatic Time Marker Options 5–10
Done Field 5–11
Set on Field 5–11
Type Field 5–11
at Level Field 5–12
Slope Field 5–13
Occur Field 5–13
Statistics Field 5–14
Run Until Time X-O Field 5–15
Manual/Automatic Time Markers Option 5–17
Setting the Manual/Automatic Time Markers Option 5–17
Voltage Markers Options 5–18
Va On Field 5–19
Va Volts Field 5–19
Vb On Field 5–20
Vb Volts Field 5–20
Va to Vb Field 5–21
Center Screen Field 5–21
V Marker Value Display 5–22
6 The Trigger Menu
Trigger Marker 6–4
Edge Trigger Mode 6–5
Source Field 6–6
Level Field 6–7
Slope Field 6–9
Count Field 6–9
Auto-Trig Field 6–10
Pattern Trigger Mode 6–11
Channel/Pattern Field 6–12
Contents–2
Page 9

When Field 6–13
Count Field 6–16
Auto-Trig Field 6–17
Immediate Trigger Mode 6–18
Intermodule Measurements 6–19
7The Display Menu
Mode Field 7–4
Connect Dots Field 7–6
Grid Field 7–7
Acquisition Time Field 7–8
Display Options Field 7–8
Contents
8 The Auto-Measure Menu
Automatic-Measurement Fields 8–4
Input Field 8–4
Automatic Measurements Display 8–4
Automatic Measurement Prerequisites 8–5
Measurement Setup Requirements 8–5
Criteria Used for Making Automatic Measurements 8–6
Automatic Measurement Algorithms 8–7
Top and Base Voltages 8–7
Measurement Algorithms 8–8
9 The Waveform Selection Menu
Module Field 9–4
Channel Mode Field 9–5
Action Field 9–9
Delete All Field 9–10
Contents–3
Page 10

Contents
Delete Field 9–10
Labels Field 9–10
Waveform Size Field 9–11
Done Field 9–11
10 Specifications and Characteristics
Operating System 10–3
Specifications 10–3
Characteristics 10–4
Supplemental Characteristics 10–6
11 Installation and Operator’s Service
To inspect the module 11–3
To prepare the mainframe 11–3
To install the module 11–5
To configure the HP 16533/34A module 11–6
To reconfigure a multi-card module into single-card modules 11–8
To turn on the system 11–8
To test the module 11–8
To clean the module 11–8
Calibrating and Adjusting 11–9
Calibration frequency 11–9
Multi-card oscilloscope calibration 11–9
To calibrate the oscilloscope 11–10
Set up the equipment 11–10
Self Cal menu calibrations 11–12
Protect the operational accuracy calibration factors 11–15
Index
Glossary
Contents–4
Page 11

1
Run/Stop Options
Page 12

Run/Stop Options
When you first turn on the Logic Analysis System, all of the modules
installed in the mainframe are inactive (that is, not running). Making
the module inactive at system start-up prevents any unwanted
interaction between the modules.
This chapter describes how to manually start the oscilloscope
running. You can cause the oscilloscope to run automatically in an
intermodule measurement setup. For information on intermodule
measurements, refer to the "Intermodule Measurements" chapter in
the HP 16500B/16501A Logic Analysis System User’s Reference or
the "Correlating Measurements" chapter in the HP 16500C/16501A
Logic Analysis System User’s Reference.
Manually running or stopping the oscilloscope is controlled by the
Run/Stop field. All of the run and stop options are explained in this
chapter. The Run/Stop field is in the upper-right corner of all
oscilloscope menus.
Remember, when the Run/Stop field displays Run, the oscilloscope is
stopped. You touch the Run field to start the oscilloscope running.
Likewise, when the Run/Stop field displays Stop, the oscilloscope is
running. You touch the Stop field to stop the oscilloscope. In short,
the Run/Stop field displays your next option—not the action taking
place.
1-2
Page 13

Run/Stop Options
Autoscale R un
Autoscale Run
You can use the autoscale feature to cause the oscilloscope to run. You may
want to use this method when you have changed one or more of the signal
input parameters and want to get back to a basic screen presentation of your
waveform. Touch the Autoscale field on the screen, then select Continue
from the pop-up menu. When autoscaling is complete, the oscilloscope
automatically starts running. It will run in the mode (single or repetitive)
that was last selected using the Run field menu options. If no run mode is
selected prior to selecting autoscale, the run mode defaults to single mode.
Run Field
When the green Run field is displayed, the oscilloscope is stopped. Touching
the Run field, then removing your finger from the screen, starts the
oscilloscope running. The oscilloscope runs using the parameters that are
currently set. Additionally, it runs in the mode (single or repetitive) that was
last selected. If no run mode is selected prior to selecting a run, the run
mode defaults to single mode.
When you touch and hold your finger on the Run field, a pop-up menu
appears. The pop-up contains the selections Single, Repetitive, and Cancel.
To select one of the options, slide your finger down the screen until it is over
the option you want to select, then remove your finger from the screen.
These options are described in the following paragraphs.
Single Mode Option
When the system is turned on, the oscilloscope defaults to the Single mode.
Single-mode acquisition fills acquisition memory once with 32768 samples of
the input waveform, automatically stops running, then displays the contents
of acquisition memory. Each 32768-sample waveform record is acquired in a
single acquisition.
1-3
Page 14

Run/Stop Options
Stop Field
To start the oscilloscope running in the single-mode after it has been running
in repetitive mode, touch the green Run field. Slide your finger down to the
Single field in the pop-up until the Single field turns white, then remove your
finger from the screen. This starts the oscilloscope running in the Single
mode. When single-shot acquisition is in process, the Run/Stop field will
display Stop. When the acquisition is complete, the field display changes to
Run. In Single mode, the oscilloscope makes a single acquisition and
displays the results. The oscilloscope then waits until the Run field is
touched again before making another acquisition.
Repetitive Mode Option
Repetitive mode acquisition fills acquisition memory with 32768 samples of
the input waveform on continuing acquisitions. The display is updated each
time a new acquisition is made. Repetitive mode continues acquiring data in
this manner until you touch the Stop field. As in single mode, each
32768-sample waveform record is acquired in a single acquisition.
To start the oscilloscope running in the repetitive mode after it has been
running in single mode, touch the green Run field. Slide your finger down to
the Repetitive field in the pop-up until the Repetitive field turns white, then
remove your finger from the screen. This starts the oscilloscope running in
the Repetitive mode. While the real-time repetitive acquisitions are being
made, the Run/Stop field will display Stop. When you want to stop making
repetitive acquisitions, touch the Stop field. To resume making repetitive
acquisitions, touch the Run field again.
Cancel Option
If you select the Cancel field in the pop-up, the oscilloscope returns to the
state it was in before the Run field was touched. That is, it is stopped in
either single or repetitive mode, whichever mode was selected last.
Stop Field
When the red Stop field is displayed, the oscilloscope is running. Touch the
Stop field to cause the oscilloscope to stop running.
1-4
Page 15

2
Autoscale
Page 16

Autoscale
Autoscale is an algorithm built into the oscilloscope that automatically
optimizes the display of one or more waveforms. When you touch the
Autoscale field and select Continue, the autoscale algorithm starts,
and the screen displays the advisory message "Autoscale is in
progress."
This chapter discusses how the autoscale algorithm works. It also
discusses what fields are affected by the autoscale algorithm.
2-2
Page 17

Autoscale
Autoscale Field Options
Autoscale Field Options
The Autoscale field is displayed in the top row of menu fields on every
oscilloscope menu.
When you touch the Autoscale field, a pop-up appears that allows you to
cancel or continue the autoscale.
Cancel
If you accidentally touch the Autoscale field, you can touch the Cancel field
in the pop-up menu to cancel the autoscale process. The cancel feature
keeps you from inadvertently changing your oscilloscope setup.
Continue
When you touch the Continue field, the autoscale algorithm starts, and the
screen displays the advisory message "Autoscale is in progress." Once the
autoscale operation begins, it cannot be canceled.
2-3
Page 18

Autoscale
Autoscale Algorit h m
Autoscale Algorithm
This section describes what the autoscale algorithm does when a signal, or
signals, is present at the oscilloscope inputs. It also describes what occurs
when signals are not present at the oscilloscope inputs.
What the Autoscale Algorithm Does When a Signal is Found
The autoscale algorithm first checks all input channels to determine whether
or not there are any signals present. The vertical scaling is then set as
required for each channel. Next the time base is scaled for a single input
channel. Finally, the trigger channel is selected and the waveforms are
displayed.
Finding the Vertical Settings
input channels to determine whether or not there are any signals
present. Starting at the lowest numbered channel in the oscilloscope
module, the autoscale algorithm checks for activity on that channel. It
then sets the vertical scaling (V/Div and offset) appropriate to that input
signal. This process is repeated for each input channel. If no activity is
found on an input channel, the original (pre-autoscale) vertical settings
are restored.
When all input signals have been vertically scaled, the time base settings
(s/Div and delay) are scaled. The time base settings are determined based
on the input signal for a single channel.
Finding the Time Base Settings
delay) are determined based on the input signal of the lowest numbered
input channel that has been determined to have a signal present.
For example, if signals are present on both channel 1 and channel 2 inputs,
the autoscale algorithm selects the signal on channel 1 input as the time base
scaling source. Similarly, if a signal is present only on the channel 4 input,
then the channel 4 input is selected as the time base scaling source.
The time base is scaled so that between two and five complete cycles of the
source input signal can be seen on the screen. If signals of significantly
different frequencies are probed by the oscilloscope, and the time base
scaling is based on a slow signal, you should be aware of the possibility that
the faster signals may be under-sampled and incorrectly displayed on the
screen.
The autoscale algorithm first checks all
The time base settings (s/Div and
2-4
Page 19

Autoscale
Autoscale Al gorithm
Displaying the Waveform
the oscilloscope automatically starts running, and displays waveforms
for the inputs that have been selected. The run mode (single or
repetitive) that was selected prior to running autoscale is the run mode
executed when autoscale is completed. If a run mode has not been
selected prior to running autoscale, the single mode run is executed.
The channel and time base fields are updated (if necessary) to reflect any
changes made by the autoscale algorithm. The trigger settings are also
changed by the autoscale algorithm and an edge mode trigger with channel 1
or channel 2 is selected. The trigger source is set to channel 1 or channel 2.
Even if the scaling is based on a higher-numbered channel, it will not be
used as the trigger source. Instead, the trigger source will default to channel
1.
The trigger point on the waveform is determined by the trigger level set by
the autoscale algorithm. The trigger point is displayed as a dotted vertical
red line at the center of the screen when Delay is set to 0 s.
What the Autoscale Algorithm Does When a Signal Cannot be Found
When a signal cannot be found on any of the vertical inputs, the oscilloscope
displays the advisory messages "No signal found" and "Original setup
restored." The autoscale algorithm toggles the Auto-Trig field to On, which
places the oscilloscope in the automatic trigger mode. The oscilloscope
then displays the message "Auto triggered." The automatic trigger mode
allows the oscilloscope to sweep automatically and to display a baseline
anytime a trigger signal is not present.
When the autoscale algorithm is complete,
2-5
Page 20

Autoscale
Menus and Fi elds Changed by the Autoscale Algorithm
Menus and Fields Changed by the Autoscale Algorithm
The following table shows the menus and their fields that are changed
by the autoscale algorithm.
Settings Changed by Autoscale
Menu Field Autoscale Act i on
Channel V/Div
Offset
Trigger Mode
Source
Level
Slope
Count
Auto-Trig
All Applicable s/Div
Delay
Scaled - depending on amplitude of input signal.
Scaled - depending on offset of input s ig nal .
Defaults to Edge.
Either channel 1 or cha nnel 2. If no i nput signal exists for channel 1 or channel 2, it
defaults to cha nnel 1.
Scaled - depending on amplitude of lowest numbered input with signal present.
Defaults to Positive.
Defaults to 1.
Defaults to On.
Scaled - depending on frequency of lowest numbered inpu t wi th signal present .
Defaults to 0 s.
2-6
Page 21

3
The Channel Menu
Page 22

The Channel Menu
The Channel menu lets you select the channel input for the module.
It lets you select values that control the vertical sensitivity, offset,
probe attenuation factor, input impedance, and coupling of the input
channel shown in the Input field. The Channel menu also gives you
preset vertical sensitivity, offset, and trigger level values for ECL and
TTL logic levels.
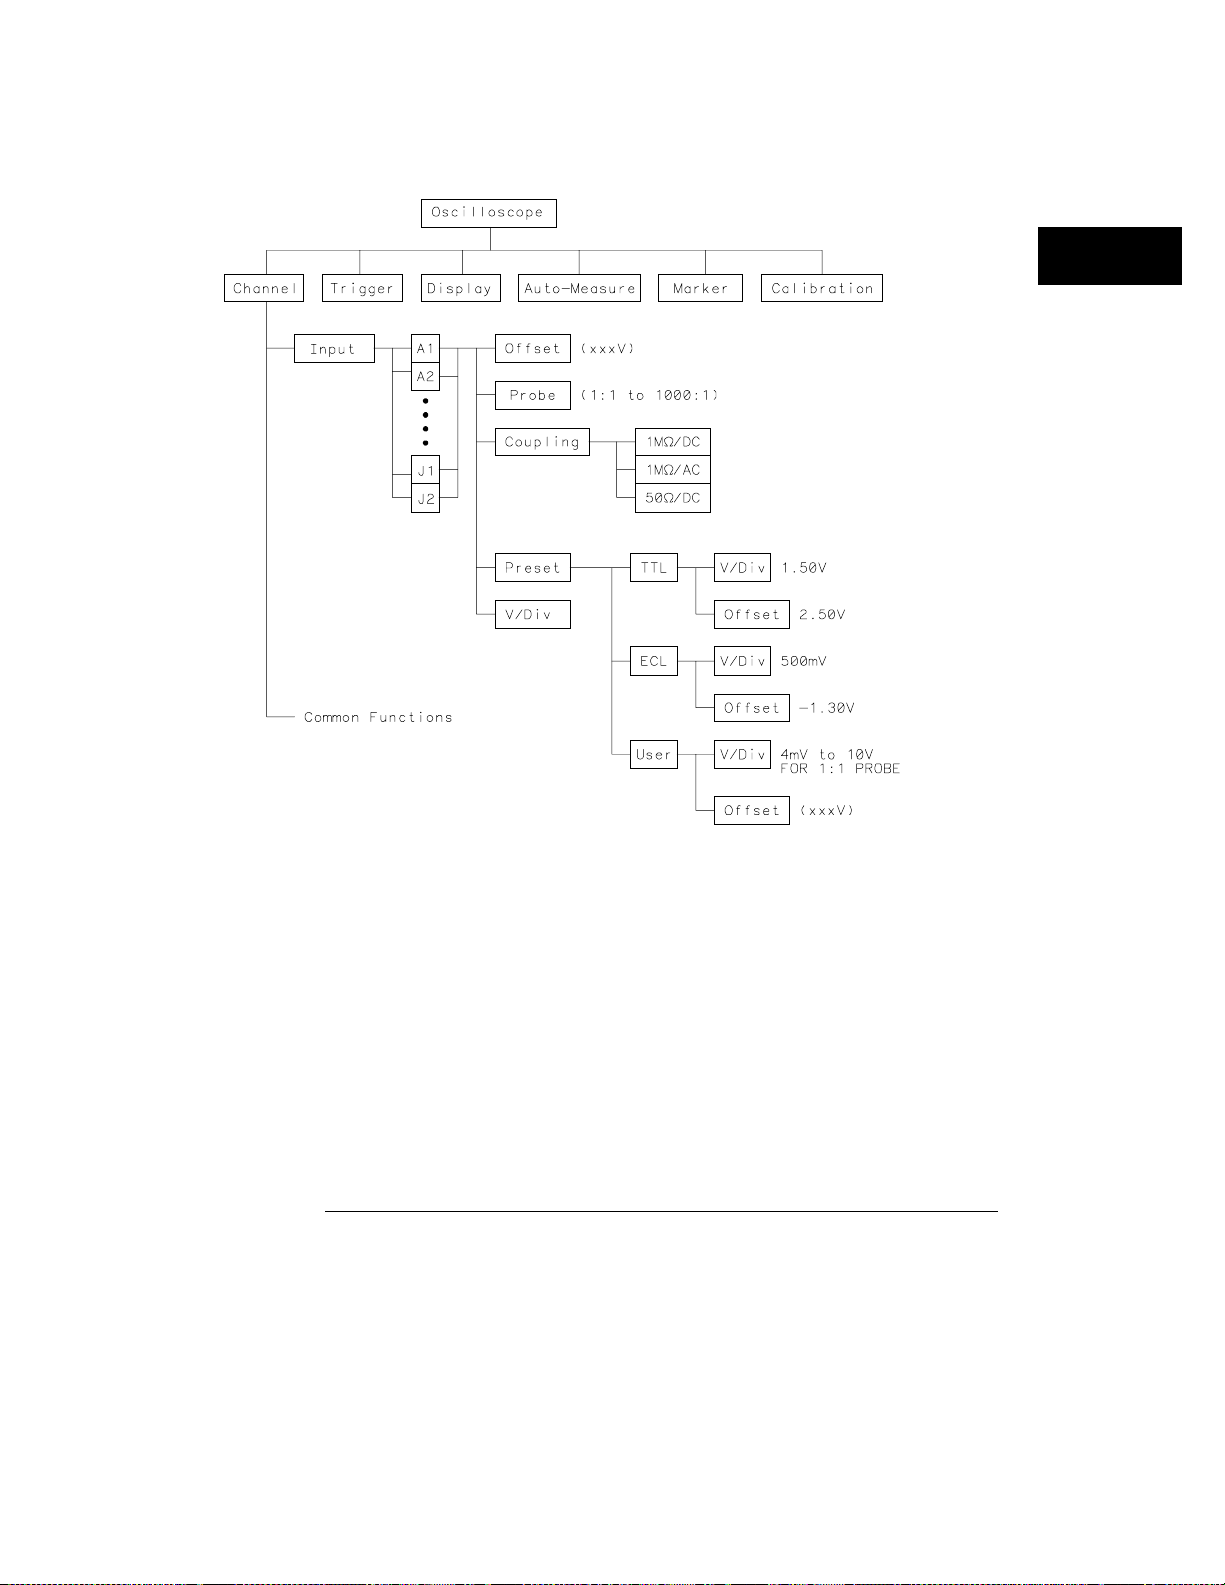
Channel Menu Map
The menu map on the next page illustrates all fields and the available
options for the Channel menu. The menu map will help you get an
overview as well as provide you with a quick reference of what the
Channel menu contains.
3-2
Page 23
The Channel Menu
Channel Field Menu Map
3-3
Page 24

The Channel Menu
Input Field
Input Field
You use the Input field to select the input source for the channel parameters
displayed on the Channel menu. Each channel may be set independent of all
other channels.
Input Identification
When you touch the Input field, a pop-up menu appears that shows the input
channels for the module. The input channels are shown as a letter/number
combination: A1, for example. The letter A identifies the slot number in the
mainframe which contains the card. The number 1 identifies the input
connector on the rear of the card. For a two-card oscilloscope module, A1
identifies the card location as slot A and the input location as
Likewise, A2 identifies the card location as slot A and the input location as
channel
For oscilloscope modules installed in an HP 16500B/C Logic Analysis System
mainframe, two inputs are available for each card.
At system turn on, the Input field defaults to the lowest lettered and
numbered input for the module selected. For example, if a module is
installed in slot A, the Input field will display A1.
2.
channel
1.
3-4
Page 25

The Channel Menu
V/Div Field
V/Div Field
You use the V/Div field to set the vertical sensitivity for the waveform on the
screen. It is set for the channel displayed in the Input field. Vertical
sensitivity determines the vertical size of a waveform displayed on the
screen and it is measured in volts per division. Each waveform display area
is divided into four vertical divisions. The divisions are marked by small
tan-colored tick marks at the left and right sides of the waveform display
area.
When you select the V/Div field, you can change the vertical sensitivity by
turning the knob. Turning the knob clockwise causes the waveform to
expand vertically in both directions from the center of the display. Turning
the knob counterclockwise causes the waveform to compress vertically in
both directions toward the center of the display. As you turn the knob, the
vertical sensitivity changes in a 1-2-4 sequence from 4 mV/Div to 10 V/Div
(1:1 probe).
Vertical sensitivity can also be entered from the pop-up keypad. The keypad
appears when you touch the V/Div field when the field is light blue. Any
valid value from 4 mV/Div to 10 V/Div (1:1 probe) can be entered from the
keypad. The vertical sensitivity value is set to the two most significant digits
of the value entered. For example, if you enter a value of 154 mV, the value
is rounded to 150 mV.
If acquisitions have been stopped (either by touching the Stop field or by a
completed measurement), vertical sensitivity changes will not be reflected
on the waveform until Run is touched and the next acquisition is displayed.
Changes to V/Div during a repetitive run will be seen on the next displayed
acquisition because the hardware is reprogrammed between acquisitions.
The default value for the V/Div field is 1.5 V (TTL preset value).
3-5
Page 26

The Channel Menu
Offset Field
Offset Field
You use the Offset field to set the vertical position of the waveform on the
screen. It is set for the channel currently displayed in the Input field.
Vertical position determines the vertical placement of the waveform. Offset
is measured in volts. Each waveform display area is divided into four
vertical divisions. The divisions are marked by small tan-colored tick marks
at the left and right sides of the waveform display area.
Offset is the voltage represented at the center vertical tick mark in the
waveform display. It is a dc voltage that is added to or subtracted from the
input signal so that the waveform can be centered on the waveform display.
Offset range and resolution are dependent on vertical sensitivity (V/Div) as
shown in the table below. The table values are based on a 1:1 probe setting.
Offset Range and Resolution
V/Div Setting Offset Range Offset Resolution
4 mV - 100 mV/Div
>100 mV - 500mV/Div
>500mV - 2. 5 V / D i v
>2. 5 V - 10 V/Div
±
2 V 1 mV
±
10 V 1 mV
±
50 V 1 mV
±
250 V 2 mV
When you select the Offset field, the offset value of the channel currently
displayed in the Input field can be changed by turning the knob. As you turn
the knob, the value in the Offset field changes, and the position of the
waveform moves up or down on the waveform display. Offset works similar
to the vertical position control of an analog oscilloscope, but offset is
calibrated.
Any valid offset value can also be entered from the keypad. The keypad will
appear when you touch the Offset field when the field is light blue. The
default value for the Offset field is 2.5 V (TTL preset value).
If acquisitions have been stopped (either by touching the Stop field or by a
completed measurement), offset changes will not be reflected on the
waveform until Run is touched and the next acquisition is displayed.
Changes to Offset during a repetitive run will be seen on the next displayed
acquisition because the hardware is reprogrammed between acquisitions.
3-6
Page 27

The Channel Menu
Probe Field
Probe Field
You use the Probe field to set the probe attenuation factor for the input
channel currently displayed in the Input field.
Probe Attenuation Factor
The probe attenuation factor can be set from 1:1 to 1000:1 in increments of
one. When you select the Probe field, the probe attenuation factor can be
changed by turning the knob or by entering a value from the pop-up keypad.
When you select a probe attenuation factor, the actual sensitivity at the input
does not change. The voltage values shown on the display (V/div, offset,
trigger level) are automatically adjusted to reflect the attenuation factor.
The marker and automatic measurement voltage values change when Run is
touched and the next acquisition is displayed
The default value for the Probe field is 10:1 for 10:1 divider probes.
CAUTION
Coupling Field
You use the Coupling field to set the input impedance for the channel
currently displayed in the Input field.
Coupling Field Selections
When you touch the Coupling field, a pop-up appears that shows the input
impedance values available for selection. The selectable values are as
follows:
1MΩ / DC
•
1MΩ / AC
•
50Ω / DC.
•
The default value for the Coupling field is 1MΩ / DC.
The maximum input voltage for the 50Ω / DC Coupling field selection is 5
Vrms.
3-7
Page 28

The Channel Menu
Preset Field
Preset Field
When you touch the Preset field, a pop-up menu appears. TTL, ECL, and
User are the options available. The Preset field automatically sets offset,
V/div, and trigger level values to properly display TTL and ECL logic levels.
Trigger level is in the Trigger menu and can be changed only when edge
trigger is the selected trigger mode.
Preset Field Values
When you select TTL or ECL, the parameters are preset to the values shown
in the following table:
Preset Values
Parameter ECL TTL
V/Div
Offset
Trigger Level
500 mV 1.5 V
-1.300 V 2.5 V
-1.300 V 1.620 V
When any of the ECL or TTL preset values are changed from the preset
values listed above, the Preset field will change to User and the new values
become the new User values. The User values remain the same until you
manually change the User values or you change the ECL or TTL preset
values while in ECL or TTL Preset.
The default value for the Preset field is TTL.
3-8
Page 29

4
Time Base Functions
Page 30

Time Base Functions
The s/Div and Delay time base fields control the horizontal display on
the oscilloscope. There are three rows of fields displayed on the
oscilloscope. The s/Div and Delay fields are located in the bottom row
of fields. These two fields are displayed on all of the oscilloscope
menus, except for the Calibration menu.
When the s/Div is changed in a multi-card module, all channels are
sampled according to the new timebase setting. When the Delay field
is changed in a multi-card module, all channels are delayed according
to the new delay setting.
4-2
Page 31

Time Base Functions
s/Div Field
s/Div Field
The s/Div field allows you to set the sweep speed (time scale) on the
horizontal axis of the display. Sweep speed is measured in seconds per
division.
Selecting Sweep Speed
The waveform display is divided into 10 horizontal divisions. The divisions
are marked by small tan-colored tick marks at the top and bottom of the
waveform display area.
If you have a multi-card oscilloscope configuration, the s/Div field is set on
the master card. All other cards in the multi-card module will use the same
s/Div setting as the master card.
When you select the s/Div field, you can change the sweep speed for the next
acquisition by turning the knob. Turning the knob clockwise a small amount
expands the displayed waveform horizontally in both directions from the
center of the display. Turning the knob counter-clockwise a small amount
compresses the displayed waveform horizontally in both directions toward
the center of the display. As you turn the knob, the sweep speed changes in
a 1-2-5 sequence (10.0 ns, 20.0 ns, 50.0 ns, etc.) from 1 ns/div to 5 s/div
(HP 16533A) and 500 ps/div to 5 s/div (HP 16534A).
Sweep speed can also be entered from the pop-up keypad. The keypad
appears when you touch the light-blue s/Div field. Any value from 500 ps/div
to 5 s/div (HP 16534) and 1ns to 5s/div (HP 16533) can be entered from the
keypad. Sweep speed values are rounded and then truncated to the three
most significant digits. For example, if you enter a value of 15.45 ns, the
value is rounded and then truncated to 15.5 ns.
4-3
Page 32

Time Base Functions
s/Div Field
At sweep speeds of 100 ms/div and slower, the time to acquire the 32768
sample points for acquisition memory is greater than 1 second. At these
sweep speeds the screen displays the message "Waiting for Prestore" when
acquiring the sample points prior to the trigger. It displays the message
"Waiting for Poststore" when acquiring the sample points after the trigger.
These messages advise you that the oscilloscope is still actively acquiring
data. Acquisition time and sample rate, as they compare to sweep time, are
shown in the table at the end of this chapter.
The default value for the s/Div field is 500 ns.
Zooming (Acquisition Stopped)
When acquisitions are stopped, the oscilloscope displays the sample points
stored in acquisition memory on the screen. When you change the sweep
speed, the new screen display is a different presentation of the data retained
in acquisition memory when acquisitions were stopped. Presenting the same
data in a different form (zooming) is normally used on a waveform acquired
in Single mode.
Zooming while in repetitive mode will change the sample rate and the
display because the hardware is reprogrammed between acquisitions in
response to the new timebase settings. Zooming is done by adjusting the
value in the s/Div field. It causes the waveform to either expand horizontally
(decrease sweep time value) or compress horizontally (increase sweep time
value).
When used in conjunction with panning (see "Delay Field"), zooming is very
useful in displaying waveforms.
4-4
Page 33

Time Base Functions
Delay Field
Delay Field
The Delay field allows you to set the horizontal position of the displayed
waveform in relation to the trigger. Delay time is measured in seconds.
Setting Horizontal Position
Delay time zero is always at the trigger point of the waveform. A delay time
value is the time difference measured from before or after the trigger point
on the waveform (delay time zero), to the center point of the screen. In
other words, delay time is always measured from the trigger point on the
waveform to the center of the screen. The vertical dotted red line on the
screen is the trigger point. When delay time is zero, the trigger point will be
at the center of the screen.
If you have a multi-card oscilloscope configuration, the Delay field is set on
the master card. All other cards in the multi-card module will use the same
Delay setting as the master card.
When you select the Delay field, delay time can be changed by turning the
knob. Remember that the trigger point is always delay time zero and is
marked by the vertical dotted red line. When you set the delay such that the
trigger point is on the right side of the screen, delay time is negative. What
you will see at the center of the screen will be the result of samples taken
before the trigger point. They have occurred in what is referred to as
negative time.
4-5
Page 34

Time Base Functions
Delay Field
When you set the delay such that the trigger point is on the left side of the
screen, delay time is positive. What you will see at the center of the screen
will be the result of samples taken after the trigger point. They have
occurred in what is referred to as positive time.
Delay time resolution is equal to 2% of the sweep speed setting when using
the knob. When using the pop-up keypad, resolution is 10 ps at sweep
speeds of 99.99 ns/div and faster, and can be set to 5-digit resolution at
sweep speeds of 100 ns/div and slower.
When run mode is set to Repetitive, the valid Delay range is:
Pre-trigger delay range = 16384 × sample period
Post-trigger delay range is equal to the following:
Time/Div Setting Available Delay
100 ms to 5 s/div 2.5 ks
1 us 50 ms/div 33,500 x (s/div)
1 ns to 500 ns/div 32.7 ms (HP 16533A)
500 ps to 200 us/div 16.3 ms (HP 16534A)
Pre- and post-trigger delay time ranges, as they compare with sweep speeds,
are shown in the table at the end of this chapter.
The default value for the Delay field is 0 s.
4-6
Page 35

Time Base Functions
Delay Field
Panning (Acquisition Stopped)
When acquisitions are stopped, the Delay field can be used to control what
portion of acquisition memory will be displayed on screen. Acquisition
memory is comprised of the following sections:
Pre-trigger delay range = delay time setting − (16384 × sample
period)
Post-trigger delay range = delay time setting + (16384 × sample
period)
This shows that one-half of the data stored in acquisition memory was stored
before the delay time setting and one-half of the data in memory was stored
after the delay time setting. Panning allows you to view the entire waveform
record by adjusting the Delay field. Normally, using the delay function to
view all of the acquired waveform (panning) is done on a waveform acquired
in Single (single-shot) mode.
Using the Center Screen field that appears in the Marker Menu (refer to
chapter 5) is another way to shift/pan the display to center it on specific time
markers.
4-7
Page 36

Time Base Functions
Sample Period Field
Sample Period Field
Any time the Time and Voltage Markers field are both Off, the sample period
of the acquired waveform is displayed in the bottom row of the menu fields.
Sample period is the time period between acquired sample points and is the
inverse of sample rate (digitizing rate). Sample period is a function of sweep
speed and can only be changed by changing the s/Div field. Sample period
and sample rates, as they compare with sweep speed, are shown in the
Sample Period tables on page 4-10 and 4-12.
There are two fields to the right of the Sample Period field which pertain to
the sample rate. These fields are the Data acquired at field and the Next
acquisition field.
Data acquired at Field
When acquisitions are stopped, the Data acquired at field shows the sample
rate at which the last acquisition was taken. When the s/Div field is
light-blue, you can turn the knob to change the time base setting.
During a repetitive run, the Data acquired at field and the Next acquisition
field will display the same value on the first acquisition following a s/Div
setting change. This happens because the hardware is reprogrammed
between acquisitions in response to the new time base setting.
Next acquisition Field
When you change the time base setting (see above paragraph), the value in
the Next acquisition field changes to reflect the sample rate at which the
next acquisition will be taken if the Run field is touched.
During a repetitive run, the Data acquired at field and the Next acquisition
field will display the same value on the first acquisition following a s/Div
setting change. This happens because the hardware is reprogrammed
between acquisitions in response to the new time base setting.
4-8
Page 37

Time Base Functions
Sample Period F ield
Sample Period Value Display
Any time the markers (either voltage and/or time) are turned on, the current
marker settings may be displayed on the channel, trigger, display and
auto-measure menus by using the Display Options field located to the right
of the time base Delay field. The Display Options field is also used to access
the channel labeling field. Refer to the Display Menu chapter for channel
labeling details. Refer to the Marker Menu chapter for further details about
the Marker Value display.
On the marker menu, if time markers are turned off, the Sample Period
display will appear on the marker menu. If time markers are selected as
either On or Auto, the Sample Period display is not visible on the Marker
menu.
The Display Options field never appears on the Marker menu.
4-9
Page 38

Time Base Functions
Sample Period Field
HP 16534A Sample Period Table
s/Div Sample
Rate
5 s
2 s
1 s
500 ms
200 ms
100 ms
50 ms
20 ms
10 ms
5 ms
2 ms
1 ms
500 µs
200 µs
100 µs
50 µs
20 µs
10 µs
5 µs
2 µs
1 µs
500 ns
200 ns
100 ns
50 ns
100 Sa/s
250 Sa/s
500 Sa/s
1 KSa/s
2.5 KSa/s
5 KSa/s
10 KSa/s
25 KSa/s
50 KSa/s
100 KSa/ s
250 KSa/ s
500 KSa/ s
1 MSa/s
2.5 MSa/s
5 MSa/s
10 MSa/s
25 MSa/s
50 MSa/s
100 MSa/s
250 MSa/s
500 MSa/s
1 GSa/s
2 GSa/s
2 GSa/s
2 GSa/s
Sample
Period
10 ms
4 ms
2 ms
1 ms
400 µs
200 µs
100 µs
40 µs
20 µs
10 µs
4 µs
2 µs
1 µs
400 ns
200 ns
100 ns
40 ns
20 ns
10 ns
4 ns
2 ns
1 ns
500 ps
500 ps
500 ps
Trace
Length
327.68 s
131.07 s
65.536 s
32.768 s
13.107 s
6.553 s
3.276 s
1.310 s
655.36 m s
327.68 m s
131.07 m s
65.536 ms
32.768 ms
13.107 ms
6.553 m s
3.276 m s
1.310 m s
655.36 µs
327.68 µs
131.07 µs
65.536 µs
32.768 µs
16.384 µs
16.384 µs
16.384 µs
Percent on
Screen
15%
15%
15%
15%
15%
15%
15%
15%
15%
15%
15%
15%
15%
15%
15%
15%
15%
15%
15%
15%
15%
15%
12%
6%
3%
20 ns
10 ns
5 ns
2 ns
1 ns
500 ps
Notes:
2 GSa/s
2 GSa/s
2 GSa/s
2 GSa/s
2 GSa/s
2 GSa/s
Sa/s = Samples per second.
Trace length = 32768 x sample rate.
Percent on screen = The percentage of the total acquired s am pl es that are seen on screen when the
acquired data is dis pl ayed. It is defined as (1 0 x s/div)/trace length.
500 ps
500 ps
500 ps
500 ps
500 ps
500 ps
16.384 µs
16.384 µs
16.384 µs
16.384 µs
16.384 µs
16.384 µs
1%
1%
1%
1%
1%
1%
4-10
Page 39

HP 16534A Delay Table
Time Base Functions
Sample Period F ield
s/Div
5 s
2 s
1 s
500 ms
200 ms
100 ms
50 ms
20 ms
10 ms
5 ms
2 ms
1 ms
500 µs
200 µs
100 µs
50 µs
20 µs
10 µs
5 µs
2 µs
1 µs
500 ns
200 ns
100 ns
50 ns
Sample
Period
10 ms
4 ms
2 ms
1 ms
400 µs
200 µs
100 µs
40 µs
20 µs
10 µs
4 µs
2 µs
1 µs
400 ns
200 ns
100 ns
40 ns
20 ns
10 ns
4 ns
2 ns
1 ns
500 ps
500 ps
500 ps
*Max. Negative
Delay
at Acquisition
−
163 s
−
65.5 s
−
32.7 s
−
16.3 s
−
6.55 s
−
3.27 s
−
1.63 s
−
655 ms
−
327 ms
−
163 ms
−
65.5 ms
−
32.7 ms
−
16.3 ms
−
6.55 ms
−
3.27 ms
−
1.63 ms
−
655 µs
−
327 µs
−
163 µs
−
65.5 µs
−
32.7 µs
−
16.3 µs
−
8.19 µs
−
8.19 µs
-8.19 µs
**Max. Positive
Delay
at Acquisition
2.5 Ks
2.5 Ks
2.5 Ks
2.5 Ks
2.5 Ks
2.5 Ks
1675 s
670 s
335 s
167 s
67.0 s
33.5 s
16.7 s
6.70 s
3.35 s
1.67 s
670 ms
335 ms
167 ms
67.0 ms
33.5 ms
16.7 ms
8.35 ms
8.35 ms
8.35 ms
Max. Negative
Delay
−
2.5 Ks
−
2.5 Ks
−
2.5 Ks
−
2.5 Ks
−
2.5 Ks
−
2.5 Ks
−
2.5 Ks
−
2.5 Ks
−
2.5 Ks
−
2.5 Ks
−
2.5 Ks
−
2.5 Ks
−
2.5 Ks
−
2.5 Ks
−
2.5 Ks
−
2.5 Ks
−
2.5 Ks
−
2.5 Ks
−
2.5 Ks
−
2.5 Ks
−
2.5 Ks
−
2.5 Ks
−
2.5 Ks
−
2.5 Ks
−
2.5 Ks
Max. Positive
Delay
2.5 Ks
2.5 Ks
2.5 Ks
2.5 Ks
2.5 Ks
2.5 Ks
2.5 Ks
2.5 Ks
2.5 Ks
2.5 Ks
2.5 Ks
2.5 Ks
2.5 Ks
2.5 Ks
2.5 Ks
2.5 Ks
2.5 Ks
2.5 Ks
2.5 Ks
2.5 Ks
2.5 Ks
2.5 Ks
2.5 Ks
2.5 Ks
2.5 Ks
−
20 ns
10 ns
5 ns
2 ns
1 ns
500 ps
Notes: "at Acqui si t ion" = the maximum del ay (positive or negative) allowed when you sele ct RU N .
500 ps
500 ps
500 ps
500 ps
500 ps
500 ps
*Maximum negative delay at acquisition = −(16384 × sample period).
**Maxi m um positive delay at acquisition = (2
-8.19 µs
-8.19 µs
-8.19 µs
-8.19 µs
-8.19 µs
−
8.19 µs
8.35 ms
8.35 ms
8.35 ms
8.35 ms
8.35 ms
8.35 ms
24
× sample period) with a maximum of 2.5 Ks.
2.5 Ks
−
2.5 Ks
−
2.5 Ks
−
2.5 Ks
−
2.5 Ks
−
2.5 Ks
2.5 Ks
2.5 Ks
2.5 Ks
2.5 Ks
2.5 Ks
2.5 Ks
4-11
Page 40

Time Base Functions
Sample Period Field
HP 16533A Sample Period Table
s/Div Sample
Rate
5 s
2 s
1 s
500 ms
200 ms
100 ms
50 ms
20 ms
10 ms
5 ms
2 ms
1 ms
500 µs
200 µs
100 µs
50 µs
20 µs
10 µs
5 µs
2 µs
1 µs
500 ns
200 ns
100 ns
50 ns
100 Sa/s
250 Sa/s
500 Sa/s
1 KSa/s
2.5 KSa/s
5 KSa/s
10 KSa/s
25 KSa/s
50 KSa/s
100 KSa/ s
250 KSa/ s
500 KSa/ s
1 MSa/s
2.5 MSa/s
5 MSa/s
10 MSa/s
25 MSa/s
50 MSa/s
100 MSa/s
250 MSa/s
500 MSa/s
1 GSa/s
1 GSa/s
1 GSa/s
1 GSa/s
Sample
Period
10 ms
4 ms
2 ms
1 ms
400 µs
200 µs
100 µs
40 µs
20 µs
10 µs
4 µs
2 µs
1 µs
400 ns
200 ns
100 ns
40 ns
20 ns
10 ns
4 ns
2 ns
1 ns
1 ns
1 ns
1 ns
Trace
Length
327.68 s
131.07 s
65.536 s
32.768 s
13.107 s
6.553 s
3.276 s
1.310 s
655.36 m s
327.68 m s
131.07 m s
65.536 ms
32.768 ms
13.107 ms
6.553 m s
3.276 m s
1.310 m s
655.36 µs
327.68 µs
131.07 µs
65.536 µs
32.768 µs
32.768 µs
32.768 µs
32.768 µs
Percent on
Screen
15%
15%
15%
15%
15%
15%
15%
15%
15%
15%
15%
15%
15%
15%
15%
15%
15%
15%
15%
15%
15%
15%
6%
3%
1%
20 ns
10 ns
5 ns
2 ns
1 ns
Notes:
1 GSa/s
1 GSa/s
1 GSa/s
1 GSa/s
1 GSa/s
Sa/s = Samples per second.
Trace length = 32768 x sample rate.
Percent on screen = The percentage of the total acquired s am pl es that are seen on screen when the
acquired data is displayed.
1 ns
1 ns
1 ns
1 ns
1 ns
32.768 µs
32.768 µs
32.768 µs
32.768 µs
32.768 µs
<1%
<1%
<1%
<1%
<1%
4-12
Page 41

HP 16533A Delay Table
Time Base Functions
Sample Period F ield
s/Div
5 s
2 s
1 s
500 ms
200 ms
100 ms
50 ms
20 ms
10 ms
5 ms
2 ms
1 ms
500 µs
200 µs
100 µs
50 µs
20 µs
10 µs
5 µs
2 µs
1 µs
500 ns
200 ns
100 ns
50 ns
Sample
Period
10 ms
4 ms
2 ms
1 ms
400 µs
200 µs
100 µs
40 µs
20 µs
10 µs
4 µs
2 µs
1 µs
400 ns
200 ns
100 ns
40 ns
20 ns
10 ns
4 ns
2 ns
1 ns
1 ns
1 ns
1 ns
*Max. Negative
Delay
at Acquisition
−
163 s
−
65.5 s
−
32.7 s
−
16.3 s
−
6.55 s
−
3.27 s
−
1.63 s
−
655 ms
−
327 ms
−
163 ms
−
65.5 ms
−
32.7 ms
−
16.3 ms
−
6.55 ms
−
3.27 ms
−
1.63 ms
−
655 µs
−
327 µs
−
163 µs
−
65.5 µs
−
32.7 µs
−
16.3 µs
−
16.3 µs
−
16.3 µs
−
16.3 µs
**Max. Positive
Delay
at Acquisition
2.5 Ks
2.5 Ks
2.5 Ks
2.5 Ks
2.5 Ks
2.5 Ks
1675 s
670 s
335 s
167 s
67.0 s
33.5 s
16.7 s
6.70 s
3.35 s
1.67 s
670 ms
335 ms
167 ms
67.0 ms
33.5 ms
16.7 ms
16.7 ms
16.7 ms
16.7 ms
Max. Negative
Delay
−
2.5 Ks
−
2.5 Ks
−
2.5 Ks
−
2.5 Ks
−
2.5 Ks
−
2.5 Ks
−
2.5 Ks
−
2.5 Ks
−
2.5 Ks
−
2.5 Ks
−
2.5 Ks
−
2.5 Ks
−
2.5 Ks
−
2.5 Ks
−
2.5 Ks
−
2.5 Ks
−
2.5 Ks
−
2.5 Ks
−
2.5 Ks
−
2.5 Ks
−
2.5 Ks
−
2.5 Ks
−
2.5 Ks
−
2.5 Ks
−
2.5 Ks
Max. Positive
Delay
2.5 Ks
2.5 Ks
2.5 Ks
2.5 Ks
2.5 Ks
2.5 Ks
2.5 Ks
2.5 Ks
2.5 Ks
2.5 Ks
2.5 Ks
2.5 Ks
2.5 Ks
2.5 Ks
2.5 Ks
2.5 Ks
2.5 Ks
2.5 Ks
2.5 Ks
2.5 Ks
2.5 Ks
2.5 Ks
2.5 Ks
2.5 Ks
2.5 Ks
−
−
20 ns
10 ns
5 ns
2 ns
1 ns
Notes: "at Acqui si t ion" = the maximum del ay (positive or negative) allowed when you sele ct RU N .
1 ns
1 ns
1 ns
1 ns
1 ns
*Maximum negative delay at acquisition = −(16384 x sample period).
**Maxi m um positive delay at acquisition = (2
16.3 µs
−
16.3 µs
−
16.3 µs
−
16.3 µs
−
16.3 µs
16.7 ms
16.7 ms
16.7 ms
16.7 ms
16.7 ms
24
x sample period) with a maximum of 2.5 Ks.
2.5 Ks
−
2.5 Ks
−
2.5 Ks
−
2.5 Ks
−
2.5 Ks
2.5 Ks
2.5 Ks
2.5 Ks
2.5 Ks
2.5 Ks
4-13
Page 42

4-14
Page 43

5
The Marker Menu
Page 44

The Marker Menu
The oscilloscope has two sets of markers that allow you to make time
and voltage measurements. These measurements can be made either
manually (voltage and time markers) or automatically (time markers
only). The markers are accessed when you touch the Markers choice
on the oscilloscope menu pop-up.
The default selection for both the time and voltage Marker fields is
Off.
Markers Menu Map
The menu map on the next page illustrates all fields and the available
options in the Markers menu. The menu map will help you get an
overview as well as provide you with a quick reference of what the
Marker menu contains.
5-2
Page 45

The Marker Menu
Markers Fiel d M enu Map
5-3
Page 46

The Marker Menu
Markers Fiel d M enu Map (Continu ed)
5-4
Page 47

Manual Time Markers Options
When you touch the T Markers field on the display, a pop-up menu
appears. When you touch the On field in the pop-up to turn
T Markers On, you can manually move the Tx and To markers to make
time measurements.
When you touch the On field in the T Markers menu, three new fields
appear to the right of the T Markers field: Tx to To, Trig to X, and Trig
to O fields. These fields allow you to position the Tx marker and the
To marker by entering time values for these markers. When time
markers are turned on and voltage markers are turned off, the channel
label field displays voltage values for the Tx and To markers except
for waveforms where Overlay mode has been selected in the
Waveform Selection menu.
5-5
Page 48

The Marker Menu
Tx to To Field
Tx to To Field
The Tx to To field displays the time difference (delta time) between the Tx
marker and the To marker. When you select the Tx to To field, turning the
knob moves both the Tx and To markers across the display without
changing the value in the Tx to To field. However, the values in the Trig to X
and Trig to O fields will change to reflect the movement of the Tx and To
markers.
You can change the value in the Tx to To field by changing the Trig to X or
Trig to O values, or by changing the Tx to To value from the pop-up keypad.
The keypad appears when you touch the Tx to To field when the field is light
blue.
When you change the time value of Tx to To by using the keypad, the
difference between the new value and old value is divided in half. Each half
is then either added to or subtracted from the Tx marker while the other half
is either added to or subtracted from the To marker, depending on one of
four possibilities.
If the Tx marker is to the left of the To marker and you are increasing the
•
time between markers, subtract one half from the Tx marker value and
add the other half to the To marker value.
If the Tx marker is to the left of the To marker and you are decreasing the
•
time between markers, add one half to the Tx marker value and subtract
the other half from the To marker value.
If the To marker is to the left of the Tx marker and you are increasing the
•
time between markers, subtract one half from the To marker value and
add the other half to the Tx marker value.
If the To marker is to the left of the Tx marker and you are decreasing the
•
time between markers, add one half to the To marker value and subtract
the other half from the To marker value.
5-6
Page 49

The Marker Menu
Trig to X Field
Example
The Tx marker is to the left of the To marker
The Tx to To marker is originally set to 352 µs
The Trig to X field is originally 8 µs
The Trig to O field is originally 360 µs
Then, using the keypad, decrease the value of Tx to To to 200 µs. The
difference between the original value (352) and the new value (200) is 152.
Half that value is 76. Adding 76 to the old Trig to X value (76 + 8) = 84.
Subtracting 76 from the old Trig to O value (360 - 76) = 284.
Trig to X Field
The Tx marker is shown on the waveform display as a vertical dashed green
line. The border around the Trig to X field is also green so that you can
correlate the value in that field to the green Tx marker. The time displayed
in the Trig to X field is measured from the trigger point to the Tx marker.
The trigger point is shown as a vertical dotted red line at the center of the
waveform display when Delay equals zero. The trigger point is always time 0.
When you select the Trig to X field, you can change the time value by turning
the knob or by entering a time value from the pop-up keypad. The keypad
appears when you touch the Trig to X field when the field is light blue.
Resolution for Trig to X time values is 2% of the sweep speed setting. The
default value for the Trig to X field is 0 s.
5-7
Page 50

The Marker Menu
Trig to O Fiel d
Trig to O Field
The To marker is shown on the waveform display as a vertical dashed yellow
line. The border around the Trig to O field is also yellow so that you can
correlate the value in that field to the yellow To marker. The time displayed
in the Trig to O field is measured from the trigger point to the To marker.
When you select the Trig to O field, you can change the time value by turning
the knob or by entering a time value from the pop-up keypad. The keypad
appears when you touch the Trig to O field when the field is light blue.
Resolution for Trig to O time values is 2% of the sweep speed setting. The
default value for the Trig to O field is 0 s.
Channel Label Field
The channel label field is the dark blue field to the left of the waveform
display. When you turn time markers on with voltage markers off, the
voltage values where the Tx and To markers intersect each waveform are
displayed under each channel label.
When you touch the Trig to X field and turn the knob, the Tx marker (green)
will move across the display. As you move the marker, the time value in the
Trig to X field changes. A negative time value indicates the marker is placed
before the trigger point, and a positive time value indicates the marker is
placed after the trigger point.
As you turn the knob when either the Trig to X or Trig to O field is selected,
the time value in the Tx to To field also changes, showing the time difference
between the Tx and To markers. If the time displayed in the Tx to To field is
negative, the To marker is to the left of the Tx marker.
5-8
Page 51

The Marker Menu
T Marker Valu e Display
As you move the Tx marker from a low portion on the waveform to a high
portion, the X voltage value under the input label in the channel label field
also changes.
When you touch the Trig to O field and turn the knob, the To marker
(yellow) will move, and the time and voltage values will change just as they
did for the Tx marker.
When you touch the Tx to To field and turn the knob, the Tx and To markers
will move in unison and maintain the preset Tx to To time value.
You can also change the Tx to To, Trig to X, and Trig to O fields with the
pop-up keypad. Refer to the earlier paragraph entitled "Tx to To Field" for a
description and results of keypad entries in the Tx to To field.
T Marker Value Display
Any time the markers (either voltage and/or time) are turned on, the current
marker settings may be displayed on the channel, trigger, display and
auto-measure menus by using the Display Options field located to the right
of the time base Delay field. The Display Options field provides a pop-up
menu that allows you to either select to set channel labels or to view the
Sample Period display or the Marker Value display.
The Marker Value display consists of two blocks. One contains settings for
the voltage markers, the second contains settings for the time markers. If
only one set of markers is turned on, only one of the two blocks will appear
on the screen.
On the Marker menu, if time markers are turned off, the Sample Period
display will appear on the marker menu. If time markers are selected as
either On or Auto, the Sample Period display is not visible on the Marker
menu.
The Display Options field never appears on the Marker menu.
5-9
Page 52

Automatic Time Marker Options
When you touch the T Markers field a pop-up menu appears. When
you touch the Auto field in the pop-up, a pop-up menu for automatic
time marker measurements is displayed.
The automatic time marker measurements are made by setting the
time markers to levels that are either a percentage of the top-to-base
voltage value of a waveform or that specify voltage levels. The
top-to-base voltage value of a waveform is typically not the same as
the peak-to-peak voltage value. The oscilloscope determines the top
and base voltages by finding the flattest portions of the top and
bottom of the waveform. The top and base values do not typically
include preshoot or overshoot of the waveform. The peak-to-peak
voltage is the difference between the minimum and maximum voltages
found on the waveform.
If the signal is clipped, the time markers will not be automatically
placed.
When searching for the marker patterns, the search will occur only on
that part of the waveform that is displayed, not the entire stored
waveform.
The default Auto markers pop-up menu options are discussed in the
following paragraphs.
5-10
Page 53

The Marker Menu
Done Field
Done Field
You touch the Done field when you are done entering data in the
auto-markers pop-up and want to return to the waveform display.
Set on Field
The Set on field assigns an input waveform to the Tx or To marker, or allows
the marker to be set manually (with the MANUAL selection in the pop-up).
When you touch the Set on field, a pop-up appears showing all waveform
sources available.
What is displayed on the pop-up depends on how many oscilloscope boards
are installed in the mainframe and in which slots they are installed.
The default selection for the Set on field is the lowest letter and number
combination. For example, if oscilloscope boards are installed in mainframe
slots C and D, the Set on field will default to C1 for both the Tx and To
markers.
Type Field
The Type field selects the units in which an automatic time marker level will
be specified. The automatic time marker can have a level expressed as either
a percentage of the waveform top-base voltage (Percent) or as an absolute
voltage level (Absolute).
The default selection is Percent.
5-11
Page 54

The Marker Menu
at Level Fie ld
at Level Field
When the marker Type is Percent, the at Level field sets the Tx or To marker
to a percentage level (from 10% to 90%) of the top-base voltage on the
waveform selected by the Set on field. When you select the at Level field,
you can change the percentage by turning the knob or by entering a value
from the pop-up keypad. The keypad appears when you touch the at Level
field when the field is light blue. You can enter any percentage from 10% to
90% in increments of 1%.
The default value for the at Level field is 50%.
When the marker Type is Absolute, the at Level field sets the Tx or To
marker to the specific voltage level. The allowable voltage range that can be
selected is the vertical range for the selected channel (that is: offset ± 2
times V/div). You can change the voltage level by either turning the knob or
by entering a value from the pop-up keypad. The keypad appears when you
touch the at Level field when the field is light blue. You can enter any
voltage from -12V to 4V in increments of 30mV.
The power up default value for at Level field is the selected channel offset
value. If the vertical range parameters (for example: v/div, offset, probe
factor) of a channel are changed such that the current at Level voltage is no
longer valid, the at Level voltage will track the limit of the vertical range.
5-12
Page 55

The Marker Menu
Slope Field
Slope Field
The Slope field sets the Tx or To marker on either the positive or negative
edge of the selected occurrence of a waveform. When you touch the Slope
field, the slope toggles between Positive and Negative.
The default selection for the Slope field is Positive.
Occur Field
The Occur field sets the Tx or To marker on a specific occurrence of a
displayed edge on the waveform. You can define the edge to be displayed all
the way from the 1st edge up to the 100th edge. The count of edge
occurrences is made starting with the first edge displayed on the screen.
Auto-marker measurements are made with data that is displayed on the
screen. Make sure the data of interest is fully displayed on the screen.
When the Occur field is selected, you can change the occurrence by turning
the knob or by entering a new value from the pop-up keypad. The keypad
appears when you touch the Occur field when the field is light blue. Any
number from 1 to 100 in increments of 1 can be entered.
The default value for the Occur field is 1.
5-13
Page 56

The Marker Menu
Statistics Field
Statistics Field
The Statistics field allows you to make minimum, maximum, and mean time
interval measurements from marker Tx to marker To. When you touch the
Statistics field, it toggles between On and Off. The default selection for the
Statistics field is On.
On
When Statistics is set to On, Min X-O, Max X-O, and Mean X-O appear
together in a tan-colored field to the right of the T Markers field on the
marker menu.
When Statistics is set to On, the minimum, maximum, and mean (average)
Tx to To marker time interval data is accumulated and displayed until one of
the following happens:
Auto is deselected as the T Marker option.
•
Auto-marker parameters are changed.
•
Statistics is set to Off.
•
Run Repetitive mode is stopped.
•
Off
When Statistics is set to Off, the Tx to To, Trig to X, and Trig to O fields
appear next to the Markers field on the Marker menu.
The marker statistics (minimum, maximum, and mean) are reset to zero only
when you touch the Done field on the auto-markers pop-up after making a
change to one of the auto-marker placement specification fields (Set On,
Type, Level, Slope, or Occur).
Other oscilloscope menu changes do not reset marker statistics, but may
have an impact on the values computed for the marker statistics.
5-14
Page 57

The Marker Menu
Run Until Time X-O Field
Run Until Time X-O Field
This field allows you to set up a stop condition for the time interval between
the Tx marker and To marker. When the stop condition is met, the
oscilloscope stops making acquisitions and displays the message "Stop
condition satisfied." You define the stop conditions with selections you
make after you touch the Run Until Time X-O field. The default selection for
this field is Off.
The Run Until Time X-O feature is only valid if the Run field is set to
Repetitive.
Less Than Field
When you select this field from the pop-up, a time value field appears next to
the Run Until Time X-O Less Than field. The time value field default value is
0 s.
When you select the time value field, you can enter the time by turning the
knob or by entering a value from the pop-up keypad. The keypad appears
when you touch the time value field when the field is light blue. For keypad
entries, resolution is 10 ps at times up to ±99.99 ns and can be set to 5-digit
resolution for other times up to ±100 Ms. Positive times are used when the
Tx marker is displayed before the To marker, and negative times are used
when the To marker is displayed before the Tx marker.
When you select Less Than, the oscilloscope runs until the Tx-To time
interval is less than the value entered for the Less Than time field. When the
condition is met, the oscilloscope stops making acquisitions and displays the
message "Stop condition satisfied."
5-15
Page 58

The Marker Menu
Run Until Time X-O Field
Greater Than Field
When you select this field from the pop-up, a time value field appears next to
the Run Until Time X-O Greater Than field. The time value field default value
is 0 s. When you select the time value field, you can enter the time in the
same manner as for the Less Than field.
When you select Greater Than, the oscilloscope runs until the Tx-To time
interval is greater than the value entered for the Greater Than time field.
When the condition is met, the oscilloscope stops making acquisitions and
displays the message "Stop condition satisfied."
In Range Field
When you select this field from the pop-up, two time value fields appear next
to the Run Until Time X-O In Range field. You need to enter the time range
values for the stop condition in these two time fields. Select each time value
field, in turn, and enter the time value in the same manner as for the Less
Than field.
When you select In Range, the oscilloscope runs until the Tx-To time interval
is in the range of the time values entered for the In Range time fields. When
the condition is met, the oscilloscope stops making acquisitions and displays
the message "Stop condition satisfied."
Not In Range Field
When you select this field from the pop-up, two time value fields appear next
to the Run Until Time X-O Not In Range field. You need to enter the time
range values for the stop condition in these two time fields. Select each time
value field, in turn, and enter the time values in the same manner as for the
Less Than field.
When Not In Range is selected, the oscilloscope runs until the Tx-To time
interval is not in the range of the time values entered for the Not In Range
time fields. When the condition is met, the oscilloscope stops acquisitions
and displays the message "Stop condition satisfied."
5-16
Page 59

Manual/Automatic Time Markers Option
The manual/automatic combination allows you to have one marker set
to automatic mode and one marker set to be controlled manually with
the knob.
Setting the Manual/Automatic Time Markers Option
To set the manual/automatic option you touch the T Markers field and select
the Auto field from the pop-up. You then touch the Set on field for either the
Tx or To marker, and then select MANUAL from the pop-up menu.
When you touch Done in the auto-markers pop-up menu, you return to the
waveform display. Now when you touch the T Markers field again and
select On from the pop-up menu, the marker you selected with the MANUAL
field is set to the manual mode and the other marker is set to fall on the
parameters you set while in the automatic mode.
Example
While in Auto markers mode set the conditions to:
Tx>: X1, positive slope, occur 1
To>: MANUAL
Now set the T Marker Mode to On and Run Repetitively. You can now
control the To marker with the knob, but the Tx marker is controlled by the
setup you made in Auto Markers (that is, it will fall on the leading edge of
the first displayed positive pulse).
If you move the Tx marker, it will default to MANUAL mode and will no
longer be set automatically.
5-17
Page 60

Voltage Markers Options
When you touch the V Markers field on the display, a pop-up menu
appears. When you touch the On field in the pop-up to turn Voltage
Markers On, you can manually move the Va and Vb markers to make
voltage measurements.
When you touch the On field in the V Markers menu, five new fields
appear to the right of the V Markers field: Va On, Va Volts, Vb On, Vb
Volts, and Va to Vb fields. These fields allow you to position the Va
marker and the Vb marker by entering channel numbers and voltage
levels for these markers.
If you turn the voltage markers on while the time markers are also
turned on, the voltage levels that correspond to the time marker
waveform crossings will be deleted from the channel label field. If you
turn the voltage markers off while the time markers are turned on, the
voltage levels that correspond to the time marker waveform crossings
will appear in the channel label field.
When the oscilloscope is in Overlay mode, the Vo ltage Markers options are not
available.
5-18
Page 61

The Marker Menu
Va On Field
Va On Field
The Va marker is shown on the waveform display as a horizontal dashed
green line. The border around the Va On field is also green so you can more
easily correlate the value in this field to the green Va marker.
When you select the Va On field, you are able to assign the Va marker to one
of the oscilloscope acquisition channels. A pop-up menu appears that lists
all possible channels for assignment of the Va marker. The default channel
is the lowest numbered channel in the oscilloscope.
The channel selected for assignment to the Va marker does not have to be
displayed in the waveform area. If the selected waveform is not in the
waveform area of the screen, the Va marker will not be displayed. If there
are multiple occurrences of the selected waveform in the waveform area of
the screen, only the uppermost occurrence of the waveform will display the
Va marker.
Overlay and waveform math traces cannot be selected for voltage marker
placement.
Va Volts Field
The Va marker is shown on the waveform display as a horizontal dashed
green line. The border around the Va Volts field is also green so you can
more easily correlate the value in this field to the green Va marker.
The voltage displayed in the Va Volts field is measured relative to the
zero-volt reference for this channel.
When you select the Va Volts field, you can change the voltage value by
turning the knob or by entering a voltage value from the pop-up keypad. The
keypad appears when you touch the Va Volts field when the field is light blue.
The range of voltage levels for the Va Volts field is ±2 times maximum range
for the selected channel. The maximum range value is affected by the probe
factor and v/div settings.
5-19
Page 62

The Marker Menu
Vb On Field
Vb On Field
The Vb marker is shown on the waveform display as a horizontal dashed
yellow line. The border around the Vb On field is also yellow so you can
more easily correlate the value in this field to the yellow Vb marker.
When you select the Vb On field, you are able to assign the Vb marker to one
of the oscilloscope acquisition channels. A pop-up menu appears that lists
all possible channels for assignment of the Vb marker. The default channel
is the lowest numbered channel in the oscilloscope.
The channel selected for assignment to the Vb marker does not have to be
displayed in the waveform area. If the selected waveform is not in the
waveform area of the screen, the Vb marker will not be displayed. If there
are multiple occurrences of the selected waveform in the waveform area of
the screen, only the uppermost occurrence of the waveform will display the
Vb marker.
Overlay and waveform math traces cannot be selected for voltage marker
placement.
Vb Volts Field
The Vb marker is shown on the waveform display as a horizontal dashed
yellow line. The border around the Vb Volts field is also yellow so you can
more easily correlate the value in this field to the yellow Vb marker.
The voltage displayed in the Vb Volts field is measured relative to the 0V
reference for this channel.
When you select the Vb Volts field, you can change the voltage value by
turning the knob or by entering a voltage value from the pop-up keypad. The
keypad appears when you touch the Vb Volts field when the field is light
blue.
The range of voltage levels for the Vb Volts field is ±2 times maximum range
for the selected channel. The maximum range value is affected by the probe
factor and V/div settings.
5-20
Page 63

The Marker Menu
Va to Vb Field
Va to Vb Field
This field displays the difference between the Va and Vb markers. This value
is dependent on channel selections and represents Vb minus Va.
Center Screen Field
The Center Screen field appears on the right side of the Marker menu. The
Center Screen field is used to modify the horizontal (time base) position of
the waveform display.
When you select the Center Screen field, a pop-up menu appears that lets
you chose a time marker for use as the center point of the display. You also
have the option of canceling the center screen function.
If time markers are turned off, the only marker choice available on the
Center screen pop-up will be the trigger marker. If time markers are turned
on, the Tx and To markers will also appear in the Center Screen pop-up
menu. If the auto time markers are enabled, only the trigger marker appears
in the Center Screen pop-up menu.
Selecting one of the possible time markers for centering the waveform data
will cause the time base delay value to be changed such that the selected
marker is positioned at the center of the screen. All acquisition channels are
shifted when the trace data is centered. The time base delay field value will
be updated when the centering operation is performed.
5-21
Page 64

The Marker Menu
V Marker Value Display
V Marker Value Display
Any time the markers (either voltage and/or time) are turned on, the current
marker settings may be displayed on the channel, trigger, display and
auto-measure menus by using the Display Options field located to the right
of the time base Delay field. The Display Options field provides a pop-up
menu that allows you to select to set channel labels or to view the Sample
Period display or the Marker Value display.
The Marker Value display consists of two blocks. One contains settings for
the voltage markers, the second contains settings for the time markers. If
only one set of markers is turned on, only one of the two blocks will appear
on the screen.
On the marker menu, if time markers are turned off, the Sample Period
display will appear on the Marker menu. If time markers are selected as
either On or Auto, the Sample Period display is not visible on the Marker
menu.
The Display Options field never appears on the Marker menu.
5-22
Page 65

6
The Trigger Menu
Page 66

The Trigger Menu
When you are set up in a multi-card configuration, only the master
card input channels are recognized as the trigger source. The
oscilloscope will not trigger on inputs from the other cards in a
multi-card setup.
This chapter discusses how triggering works in a single card
configuration or in the master card in a multi-card configuration.
You access the trigger options through the Mode field which is located
at the leftmost position of the middle row of fields in the Trigger
menu. The Mode field allows you to select the method you want to
use to trigger the oscilloscope for a particular application. When you
touch the Mode field, a pop-up menu appears, showing the three
modes that are available:
• Edge
• Pattern
• Immediate
This chapter explains what the trigger marker is, how to access the
different trigger modes, and what each trigger mode does.
The default selection for the Trigger field is Edge.
Trigger Menu Map
The menu map on the next page illustrates all fields and the available
options in the Trigger menu. The menu map will help you get an
overview as well as provide you with a quick reference of what the
Trigger menu contains.
6-2
Page 67

The Trigger Menu
Trigger Field Menu Map
6-3
Page 68

Trigger Marker
The trigger marker is the dotted vertical red line at the center of the
waveform display. The point where the waveform from the trigger
source crosses the trigger marker is called the trigger point. The
trigger point always represents a delay time of zero seconds.
If you set delay time to greater than ±5 times the sweep speed, the
trigger marker will move off the screen.
6-4
Page 69

Edge Trigger Mode
When you are set up in a multi-card configuration, only the master
card input channels are recognized as the trigger source. The master
card is the card at the top of the module. The oscilloscope will not
edge trigger on inputs from the other cards in a multi-card setup.
This section discusses how edge triggering works in a single-card
module or in the master card in a multi-card configuration.
Edge triggering is the type of triggering found in all oscilloscopes. In
the edge trigger mode, the oscilloscope triggers at a specified voltage
level on a rising or falling edge of one of the input channels or the
external trigger input. In this mode you can specify which input is the
trigger source, set a trigger level voltage (except for Ext, which is set
to −1.3 V), and specify which edge to trigger on.
When you touch the Mode field, Edge can be selected from the
pop-up menu. Menu selections for the edge trigger mode are
discussed in the following paragraphs.
6-5
Page 70

The Trigger Menu
Source Field
Source Field
When you touch the Source field, a pop-up menu appears showing the inputs
available as the trigger source. You can set the trigger source to be any one
of the input signals of the master card. The source can be input X1, X2, or
Ext, where X equals the oscilloscope slot letter and Ext equals an ECL-level
external trigger.
When you have two or more HP 16533/34A modules connected together, you
can only specify the channels on the master HP 16533/34A module as the
trigger source.
At power-up, the default channel input selection for the Source field is
channel 1.
6-6
Page 71

The Trigger Menu
Level Field
Level Field
The Level field shows the trigger level voltage value. When the voltage value
on the trigger source equals the trigger level, the oscilloscope triggers. The
point at which the oscilloscope triggers is called the trigger point (see the
illustration below). The trigger point is shown on the screen as a vertical
dotted red line, called the trigger marker. At zero delay time, the trigger
marker is located at the horizontal center of the screen. At delay time T
trigger point is offset left (positive delay) or right (negative delay) from the
horizontal center of the screen by time T
.
d
When you change the trigger level voltage value, the waveform moves
horizontally on the display to maintain the trigger point. (That is, the point
where the waveform voltage value equals the trigger point voltage value.)
This is illustrated below.
, the
d
6-7
Page 72

The Trigger Menu
Level Field
If the trigger point voltage level is set above or below the waveform
amplitude, the trigger point cannot be found. If Auto-Trig is set to On, this
causes the waveform display to become unsynchronized and to "float" on the
display. If Auto-Trig is set to Off, the message "Waiting for trigger" is
displayed.
The trigger point voltage can be set, either by the autoscale function, or by a
voltage value set into the Level field. When you touch the Level field and
turn it light blue, you can change the value of the trigger level voltage by
turning the knob.
The trigger level can be set to any voltage value contained within the
waveform display window, in increments of 0.05% of full scale vertical
voltage range (V/Div × 4 divisions = full scale). For example, if full scale
voltage range were 400 mV, trigger level would be set in increments of 2 mV
(V/Div = 100 mV × 4 × 0.005 = 2 mV).
Trigger level values can also be entered with the pop-up keypad. The keypad
appears when you select the Level field when the field is white (already
selected once). You can enter any value, in 0.05% increments of full scale
vertical voltage range. Values entered that are not in this range will be
rounded to the nearest 0.05% increment.
Since the trigger level range is limited by the voltage values displayed in the
waveform window, the voltage window limits can be easily determined.
Turn the knob in both directions until the Level field reads minimum and
maximum voltage. These voltage values are the limits of the waveform
window. However, if the level is set at the edge of a window and offset for
that channel is changed, the trigger level will track that change, thereby
changing the window limits.
If the trigger source channel (except EXT) is displayed in the waveform area
of the screen, the trigger level marker will appear on the screen as a
horizontal dashed red line. The trigger level marker will move up and down
on the screen as the trigger level voltage is changed.
If the trigger source channel is not in the waveform area of the screen, the
trigger level marker will not be displayed.
If there are multiple occurrences of the trigger source waveform in the
waveform area of the screen, only the uppermost occurrence of the trigger
source waveform will display the trigger source marker.
The trigger level marker will only appear when the trigger menu is selected.
The default value for the Level field is 1.620 V (TTL preset value).
6-8
Page 73

The Trigger Menu
Slope Field
Slope Field
You can set the trigger slope to trigger on either the positive or negative edge
of the trigger source waveform. When you touch the Slope field, the field
toggles between Positive and Negative.
The default selection for the Slope field is Positive.
Count Field
In edge trigger mode, you can define a positive or negative edge and the
trigger level as a trigger qualifier. When the oscilloscope detects the trigger
qualifier, it will trigger at a user-specified number of edges (Count field) on
the waveform.
The Count field defines the number of trigger events that must occur after
the first trigger qualifier before the oscilloscope will trigger and acquire a
waveform.
Count can be set to any integer from 1 to 32,000. When the Count field is
selected, the trigger events count can be changed by turning the knob or by
entering a value from the pop-up keypad.
This type of triggering is commonly referred to as "events triggering" or
"delay-by-events triggering". It is very useful when trying to trigger on a
specific pulse in a burst of pulses, with a long time delay, before the next
burst occurs.
The default value for the Count field is 1.
6-9
Page 74

The Trigger Menu
Auto-Trig Field
Auto-Trig Field
The Auto-Trig field allows you to specify whether or not the acquisitions
should wait for the specified trigger condition to occur. When you touch the
Auto-Trig field, the field toggles between On and Off. The On and Off fields
are discussed below.
The default selection for the Auto-Trig field is On.
On
When you set auto-trigger to On, the oscilloscope waits approximately 50 ms
(20-Hz rate) for a trigger to occur. If a trigger does not occur within that
time, the current contents of acquisition memory are displayed. The
message "Auto triggered" is displayed if one of the following conditions
occurs:
No signal is on the input. In this case, the oscilloscope will display a
•
baseline.
There is a signal but the specified trigger condition has not been met. In
•
this case, the waveform display will not be synchronized to a trigger point.
Off
When you set auto-trigger to Off, the oscilloscope waits until a trigger is
received before the waveform display is updated. If a trigger does not occur,
the screen is not updated and the message "Waiting for Trigger" is displayed.
Use this mode when:
The trigger source signal has less than a 20-Hz repetition rate.
•
The trigger events counter (refer to Count field, below) is set so that the
•
number of trigger events would not occur before approximately 50 ms.
When you want to trigger on a specific event only.
•
6-10
Page 75

Pattern Trigger Mode
When you are set up in a multi-card configuration, only the master
card input channels are recognized as the trigger source. The
oscilloscope will not pattern trigger on inputs from the other cards in
a multi-card setup.
This chapter discusses how pattern triggering works in a single-card
module or in the master card in a multi-card module.
Pattern trigger mode allows you to trigger the oscilloscope upon
entering or exiting a specified pattern of the trigger channels and the
external trigger input or by specifying a pattern duration or range.
When you have two or more HP 16533/34A modules connected
together, you can only specify the channels on the master
HP 16533/34A module as the trigger source.
When you touch the Mode field, Pattern can be selected from the
pop-up menu.
6-11
Page 76

The Trigger Menu
Channel/Pattern Field
Channel/Pattern Field
The Channel/Pattern field is located next to the Mode field. It allows you to
enter a pattern for the combination of the input channels and the ECL
external trigger.
Channel
The Channel row lists the inputs available on the oscilloscope module being
used. Channels are numbered 1, 2, and Ex. Ex is for the ECL external
trigger.
Pattern
Each entry in the pattern shown in the Pattern row shows the trigger
condition of the input above it in the Channel row.
You must set the trigger level for each input you want to use in the pattern.
You set the trigger levels using the knob or keypad to set the value in the
Level field in the Edge trigger mode. Setting these levels sets the threshold of
each input for high and low levels in the pattern. The trigger level marker
does not appear when Pattern mode triggering is selected.
The pattern for each input may be specified as high (H), low (L), or "don’t
care" (X). H, L, and X conditions are as follows:
−
H
the voltage value of this input channel must be greater than the edge
•
trigger level of this input.
−
L
the voltage level of this input channel must be less than the edge
•
trigger level of this input.
−
X
is a "don’t care" condition. The "don’t care" means the associated
•
input channel will not be used in the pattern for the trigger qualifier. It
does not equate to "trigger on anything."
The default condition for all patterns is X, "don’t care." To change the
pattern, touch the Channel/Pattern field. A pop-up keypad will appear which
allows you to assign the pattern conditions.
6-12
Page 77

The Trigger Menu
When Field
To enter a pattern, touch either X, L, or H on the pop-up keypad. The entries
you make appear at the top of the pop-up keypad as they are entered. If you
make a mistake, turn the knob to move the highlight to the entry to be
corrected and select the correct entry, or touch CLEAR to change all entries
back to X and enter the correct values. If the pattern is correct, touch
DONE.
A pattern of XXX says to us e NO channels to find the tr igger. It does not equate
to Immediate Mode when Aut o-Trig is set to Off. This ev ent will never occur in
the hardware. Do not confuse XXX with "don’t care, trig ger on anything."
When Field
When you touch this field, a pop-up menu appears that lets you specify the
trigger When condition.
Pattern Trigger When Condition Pop-up Menu
The Pattern When pop-up menu is used to specify the trigger when condition
for pattern triggering. Once a selection has been made, you touch the Done
field to exit the pop-up menu and return to the trigger menu. The trigger
condition selected will now appear in the When field.
The default selection for the When field is When Entered.
When Entered
the first transition that makes the pattern specification true for every
input used in the pattern trigger specification. If the count set in the
Count field is more than 1, the pattern must be true for the number of
times set in the count field.
When Exited
first transition that causes the pattern specification to be false for every
input used in the pattern trigger specification. If the count set in the
Count field is more than 1, the pattern must be true for the number of
times set in the count field before turning false.
When this field is active, the oscilloscope triggers on
When this field is active, the oscilloscope triggers on the
6-13
Page 78

The Trigger Menu
When Field
Example
Present >
transition that causes the pattern specification to be false for every input
used in the pattern trigger specification if the specified pattern has been
true for the time duration specified. If the pattern specification becomes
false before the specified duration time has elapsed, the search for a
trigger condition starts again. If the pattern specification remains true
longer than the specified duration time, the trigger point will be the
point at which the pattern specification becomes false.
The pattern duration time can be any value between 20 ns and 160 ms in
10 ns steps.
If the count set in the Count field is one, the trigger event will be the first
pattern event that meets both the pattern specification and the duration
specification. If the count is greater than one, only the first pattern event
must meet the duration specification. Once the pattern duration
specification has been met, subsequent pattern events that meet the pattern
specification can be of any duration and each such pattern event will
contribute to meeting the count specification.
With a pattern specification of HXX, a duration specification of >100 ns, and
a count of 3; a pulse string with pulse widths 80 ns, 150 ns, 50 ns, 75 ns, 20
ns, 200 ns would trigger on the trailing edge of the 75 ns pulse. In this
example, the 150 ns pulse meets the duration specification and is count 1,
the 50 ns pulse is count 2, and the 75 ns pulse is count 3.
When this field is active, the scope triggers on the first
Present <
transition that causes the pattern specification to be false for every input
used in the pattern trigger specification if the specified pattern has been
true for less than the time duration specified. If the pattern specification
remains true after the specified duration time has elapsed, the search for
a trigger condition starts again the next time the pattern specification
becomes true. If the pattern specification becomes false before the
specified duration time, the trigger point will be the point at which the
pattern specification becomes false.
The pattern duration time can be any value between 20 ns and 160 ms in
10 ns steps.
6-14
When this field is active, the scope triggers on the first
Page 79

The Trigger Menu
When Field
If the count set in the Count field is one, the trigger event will be the first
pattern event that meets both the pattern specification and the duration
specification. If the count is greater than one, only the first pattern event
must meet the duration specification. Once the pattern duration
specification has been met, subsequent pattern events that meet the pattern
specification can be of any duration and each such pattern event will
contribute to meeting the count specification.
Example
With a pattern specification of HXX, a duration specification of <100 ns, and
a count of 3; a pulse string with pulse widths 200 ns, 80 ns, 150 ns, 50 ns,
75 ns, 20 ns would trigger on the trailing edge of the 50 ns pulse. In this
example, the 80 ns pulse meets the duration specification and is count 1, the
150 ns pulse is count 2, and the 50 ns pulse is count 3.
Range
that causes the pattern specification to be false for every input used in
the pattern trigger specification if the specified pattern has been true for
greater than the first time value and less than the second time value that
make up the pattern duration range.
If the pattern specification remains true for longer than the maximum
duration range limit or becomes false before the minimum duration range
limit, the search for a trigger condition starts again the next time the pattern
specification becomes true. If the pattern specification becomes false within
the specified duration time range, the trigger point will be the point at which
the pattern specification becomes false.
The minimum pattern duration time can be any value between 20 ns and
160 ms in 10 ns steps. The maximum pattern duration time must be at least
10 ns greater than the minimum time value.
If the count set in the Count field is one, the trigger event will be the first
pattern event that meets both the pattern specification and the duration
specification. If the count is greater than one, only the first pattern event
must meet the duration specification. Once the pattern duration
specification has been met, subsequent pattern events that meet the pattern
specification can be of any duration and each such pattern event will
contribute to meeting the count specification.
When this field is active, the scope triggers on the first transition
6-15
Page 80

The Trigger Menu
Count Field
Example
With a pattern specification of HXX, a duration specification of >60 ns and
<100 ns, and a count of 3; a pulse string with pulse widths 200 ns, 80 ns, 150
ns, 50 ns, 75 ns, 20 ns would trigger on the trailing edge of the 50 ns pulse. In
this example, the 80 ns pulse meets the duration specification and is count 1,
the 150 ns pulse is count 2, and the 50 ns pulse is count 3.
Count Field
In pattern trigger mode, you can define a pattern as a trigger qualifier. When
the oscilloscope detects the trigger qualifier, it will trigger when a
user-specified number of patterns have occurred (Count field) on all inputs.
The Count field defines the number of events that must occur after the first
trigger qualifier before the oscilloscope will trigger and acquire a waveform.
Count can be set to any integer from 1 to 32,000. When the Count field is
selected, the events count can be changed by turning the knob or by entering
a value from the pop-up keypad.
The default value for the Count field is 1.
6-16
Page 81

The Trigger Menu
Auto-Trig Field
Auto-Trig Field
The Auto-Trig field allows you to specify whether or not the acquisitions
should wait for the specified pattern condition to occur. When you touch
the Auto-Trig field, the field toggles between On and Off.
On
When you set auto-trigger to On, the oscilloscope waits for approximately 50
ms (20 Hz rate) for a trigger to occur. If a trigger does not occur within that
time, the current contents of acquisition memory are displayed. The
message "Auto triggered" is displayed if one of the following conditions
occurs:
If no signal is on the input. In this case, the oscilloscope will display a
•
baseline.
If there is a signal but the specified pattern condition has not been met.
•
In this case, the waveform display is not synchronized to a trigger point.
Off
When you set auto-trigger to Off, the oscilloscope waits until a trigger is
received before the waveform display is updated. If a trigger does not occur,
the screen is not updated and the message "Waiting for Trigger" is displayed.
Use this mode when:
The trigger source signal has less than a 20-Hz repetition rate.
•
The trigger events counter (refer to Count field, below) is set so that the
•
number of trigger pattern events would not occur before approximately
50 ms.
When you want to trigger on a specific event only.
•
When using pattern duration triggering and the events that meet the
•
duration specification occur infrequently.
The default selection for the Auto-Trig field is On.
6-17
Page 82

Immediate Trigger Mode
When you are set up in a multi-card configuration, only the master
card input channels are recognized as the trigger source. The
oscilloscope will not trigger on inputs from the other cards in a
multi-card module.
This section discusses how immediate triggering works in a
single-card module or in the master card in a multi-card module.
Immediate trigger mode causes the oscilloscope to trigger by itself.
When you touch the Mode field, Immediate can be selected from the
pop-up menu.
Immediate trigger mode can be used for dual timebase (intermodule)
applications where, for instance, one oscilloscope module arms
another oscilloscope module, or another module (such as a logic
analyzer) arms the oscilloscope.
This mode is very similar to Auto-Trig On, but immediate mode does
not wait for a specified event to occur.
6-18
Page 83

Intermodule Measurements
If you set the oscilloscope module to Group Run in the Intermodule
module menu, the oscilloscope waits until it is armed by the input port
or by another module before it begins to search for its own trigger
condition. By using the Group Run option you can time-correlate the
measurements from various modules (for example, the oscilloscope
and a timing analyzer) and display data from several modules on one
display.
If you set the oscilloscope module to Independent in the Intermodule
Menu, the oscilloscope will be in the free-run mode and the waveform
display will not be synchronized with the other measurement modules
in your system.
Pattern duration trigger cannot be used when the oscilloscope is
armed by another module or by BNC PORT IN as set up on the IMB
menu.
More information about intermodule applications can be found in the
HP 16500/16501A Logic Analysis System User’s Reference and the
HP 16500/16501A User’s Guide.
6-19
Page 84

6-20
Page 85

7
The Display Menu
Page 86

The Display Menu
The Display options control how the oscilloscope acquires and
displays waveforms. You can cause the oscilloscope to acquire and
display the waveforms in one of the following modes:
• Normal
• Average
• Accumulate
The Display options also control the connect-the-dots display and grid
display features.
Display Menu Map
The menu map on the next page illustrates all fields and the available
options in the Display menu. The menu map will help you get an
overview as well as provide you with a quick reference of what the
Display menu contains.
7-2
Page 87

Display Fi eld Menu Map
The Displa y Menu
7-3
Page 88

The Displa y Menu
Mode Field
Mode Field
The Mode field determines how waveform information is acquired and
displayed. When you touch the Mode field, a pop-up menu appears. You can
select Normal, Average, or Accumulate from the pop-up. The default
selection for the Mode field is Normal.
Normal Mode
In Normal mode, the oscilloscope acquires waveform data and displays the
waveform acquired from that data. When the oscilloscope makes a new
acquisition, it erases the previously acquired waveform from the display, and
displays the newly acquired waveform. This is an on-going process for as
long as the oscilloscope is running repetitively, or whenever you make a
single mode run. That is; acquire data, erase display, display new data,
acquire data, erase display, display new data, etc.
Average Mode
In Average mode, the oscilloscope averages the most recently acquired data
points on a waveform with previously acquired data. Averaging helps
eliminate random noise from your displayed waveforms.
When you select Average mode, a new field appears next to the Mode field
which allows you to select the number of waveform acquisitions to average.
When you touch the Average # field, the field will turn a light-blue color.
When the field is light blue, you can change the number in the field by
turning the knob. The number of averages can be set to 2, 4, 8, 16, 32, 64,
128, or 256. The default value for the Average # field is 8.
You can also change the value in the Average # field with the pop-up keypad.
The keypad appears when you touch the Average # field when that field is
light blue. The numbers you can enter are the same as with the knob (any
power of two from 2 to 256). Any value entered from the keypad that is not
a power of two will be rounded to the nearest power of two (from the
choices available).
7-4
Page 89

The Displa y Menu
Mode Field
As an example of average mode usage, assume the Average # field is set to
16 and the Run mode is set to Repetitive. When you touch the Run field, the
oscilloscope starts acquiring waveform data and averaging it. After the
initial 16 waveforms are acquired, the oscilloscope momentarily displays the
advisory message "Number of averages has been met." Once the initial 16
waveforms are acquired, all new data is weighed at 1/N and is averaged with
the previous data. All data is retained.
If you set the Run mode to Single, acquisitions are not made until you touch
the Run field. If Average # is set to 16, as in the previous example, the
"Number of averages has been met" message will not be displayed until you
have touched the Run field 16 times.
If you bring a waveform that is being averaged in the oscilloscope into the
waveform display of another time correlated module, such as another
oscilloscope or a timing analyzer, the waveform will not continue to average.
Only the most recent acquisition, not the average trace data, will appear on
the screen. To view an averaged mode trace with other time correlated
waveforms, bring those other waveforms into the display of the oscilloscope
that is setup for average mode (only oscilloscope signals acquired by that
oscilloscope will be averaged on the display).
Panning or zooming an averaged waveform causes the waveform to redraw
with only the most recent acquisition on the display.
Accumulate Mode
In Accumulate mode, the oscilloscope accumulates all waveform
acquisitions and displays them on the screen without erasing the previously
acquired waveforms. This is similar to infinite persistence on an analog
storage oscilloscope. These acquisitions will stay on the display until Mode
is changed, or until the waveform is adjusted by a control that causes the
display to change, such as s/Div, Delay, or Connect Dots from On to Off.
When in Accumulate mode, the operation of the display grid follows special
rules when turned on or off (refer to the Grid Field paragraph later in this
chapter).
The waveform s t hat are generated i n Accumulate mode cannot be stored to file
or printed directly; on ly t he latest waveform will be saved or printed. If your
HP 16500 system has LAN capability, the accumulated waveforms can be
accessed by FTPing to the /system/graphics directory. The accumulated data is
in all of the th ree graphics files.
7-5
Page 90

The Displa y Menu
Connect Dots Field
Connect Dots Field
The oscilloscope display can optionally be enhanced to show a better
picture of a waveform. This is done by using the Connect Dots On or
Connect Dots Off feature of the display. The default setting for the Connect
Dots field is Off.
If an edge is fast enough (relative to the sample rate), the signal may begin to
look like dots scattered around the display. This is because each sample is
displayed as a single dot.
To give you a better idea of what the waveform looks like, the oscilloscope
has a feature that connects the sample dots together. Touching the Connect
Dots field will toggle the field between On and Off.
On
With Connect Dots On, each displayed sample is connected to the adjacent
sample. The waveform displayed with Connect Dots set to On is better
defined and easier to see.
Off
With Connect Dots Off, each sample is displayed separately; that is, it is not
connected to the adjacent sample. The waveform displayed with Connect
Dots set to Off is the default mode of operation.
7-6
Page 91

The Displa y Menu
Grid Field
Grid Field
The oscilloscope display can optionally be divided into horizontal and
vertical grids by using the Grid On or Grid Off feature of the display.
Touching the Grid field will toggle the field between On and Off. The default
setting for the Grid field is Off.
On
Touching the Grid field when it reads Off will toggle the field to On, and will
cause the screen to display a horizontal and vertical grid pattern.
In either Normal or Average modes, the grid can be turned On when the
oscilloscope is not currently running and the grid will appear on screen
immediately. If the oscilloscope is currently acquiring data, the grid will be
drawn when the acquisition is completed. In Accumulate mode, the grid can
be turned on at any time, but it will not be drawn until the next acquisition is
completed or some change is made to the display screen that would cause
the display to be erased and redrawn (that is: s/div, etc).
Off
Touching the Grid field when it reads On will toggle the field to Off, and will
remove the grid pattern from the screen.
In either Normal or Average modes, the grid can be turned Off when the
oscilloscope is not currently running and the grid will be erased from the
screen immediately. If the scope is currently acquiring data, the grid will be
erased when the current acquisition is completed. In Accumulate mode, the
grid can be turned off at any time, but it will not be erased from the screen
until some change is made to the display screen that would cause the display
to be erased and redrawn (that is: s/div, etc).
7-7
Page 92

The Displa y Menu
Acquisition Time Field
Acquisition Time Field
The Acquisition Time field time stamps each data acquisition. It is
controlled by the real time system clock which is set up in the System Utility
Menu. The real time clock cannot be modified from the Display menu.
Refer to the
HP 16500 User’s Reference
The Acquisition Time field will be blank at system power-up. It will show
the date and time of any acquisition when you touch the Run field and make
the first data acquisition. The Acquisition Time field is displayed to the right
of the Grid field once data has been acquired.
for details for setting the real time clock.
Display Options Field
The Display Options field allows you to display either sample period
information or marker value information on the oscilloscope menus. It is
also the means by which you access the scope channel labeling menu.
The Display Options field appears on the Channel, Trigger, Display and
Auto-Measure menus. The number of selections that appear when you touch
the Display Options field will vary depending on whether or not any of the
markers are enabled. If no markers are enabled, the oscilloscope menus will
always display sample period information and touching the Display Options
field will yield a single possible selection, Set Channel Labels. If either
voltage or time markers are enabled, touching the Display Options field will
reveal three possible selections, Set Channel Labels, Display Sample Period,
and Display Marker Values.
Set Channel Labels
Selecting Set Channel Labels from the Display Options pop-up will take you
to the Scope Channel Labels menu. This menu allows you to assign labels to
each of the oscilloscope channels. These labels will subsequently appear in
the channel label area to the left of the waveform display area. The
oscilloscope channel labels appear on single trace waveforms only. The
default scope labels are used for overlay and waveform math displays.
7-8
Page 93

The Displa y Menu
Display Options Field
To specify a Scope Channel Label, touch the field corresponding to the
oscilloscope input you wish to label. The default Scope Channel Labels are
the cardslot and input number you see elsewhere on the oscilloscope menus.
When you touch one of the channel label fields, an alpha-numeric keypad
will appear on screen. If you need to change a character in the Scope
Channel Label, you can use the knob to move the cursor to the desired
position. Scope Channel Labels are limited to five characters in length. The
Clear field will erase the entire label. When you are finished specifying the
label, touch Done to exit the keypad.
When all channels have been labeled, touch the Done field to return to the
oscilloscope menu. Any oscilloscope channels you don’t label will retain
their default label (cardslot and input number). To erase all scope channel
labels for the oscilloscope, and return to the default oscilloscope channel
labels, simply touch the Default field on the Scope Channel Labels menu.
Display Sample Period
Selecting the Display Sample Period option will cause the sample period
information (see Sample Period Display in the Time Base Functions chapter)
to be displayed on the scope menus. Sample period information is the
default display option and is always displayed when markers are turned off.
Display Marker Values
Selecting the Display Marker Values option will cause the marker value
information (see Marker Value Display in the Marker Options chapter) to be
displayed on the oscilloscope menus. Marker values can only be selected
when at least one of the markers have been enabled.
7-9
Page 94

7-10
Page 95

8
The Auto-Measure Menu
Page 96

The Auto-Measure Menu
One of the primary features of the oscilloscope is its ability to make
parametric measurements on displayed waveforms. This chapter
provides details on how automatic measurements are performed and
gives some tips on how to improve automatic measurement results.
You access the Auto-Measure menu by touching the menu field (top
row, second from the left), then by selecting Auto-Measure from the
pop-up menu that appears.
There are nine automatic measurements available in the automatic
measurement menu:
• Period
• Risetime
• Falltime
• Frequency
• +Width
• -Width
• Vp_p
• Preshoot
• Overshoot
Auto-Measure Menu Map
The menu map on the next page illustrates all fields and the available
options in the Auto-Measure menu. The menu map will help you get
an overview as well as provide you with a quick reference of what the
Auto-Measure menu contains.
8-2
Page 97
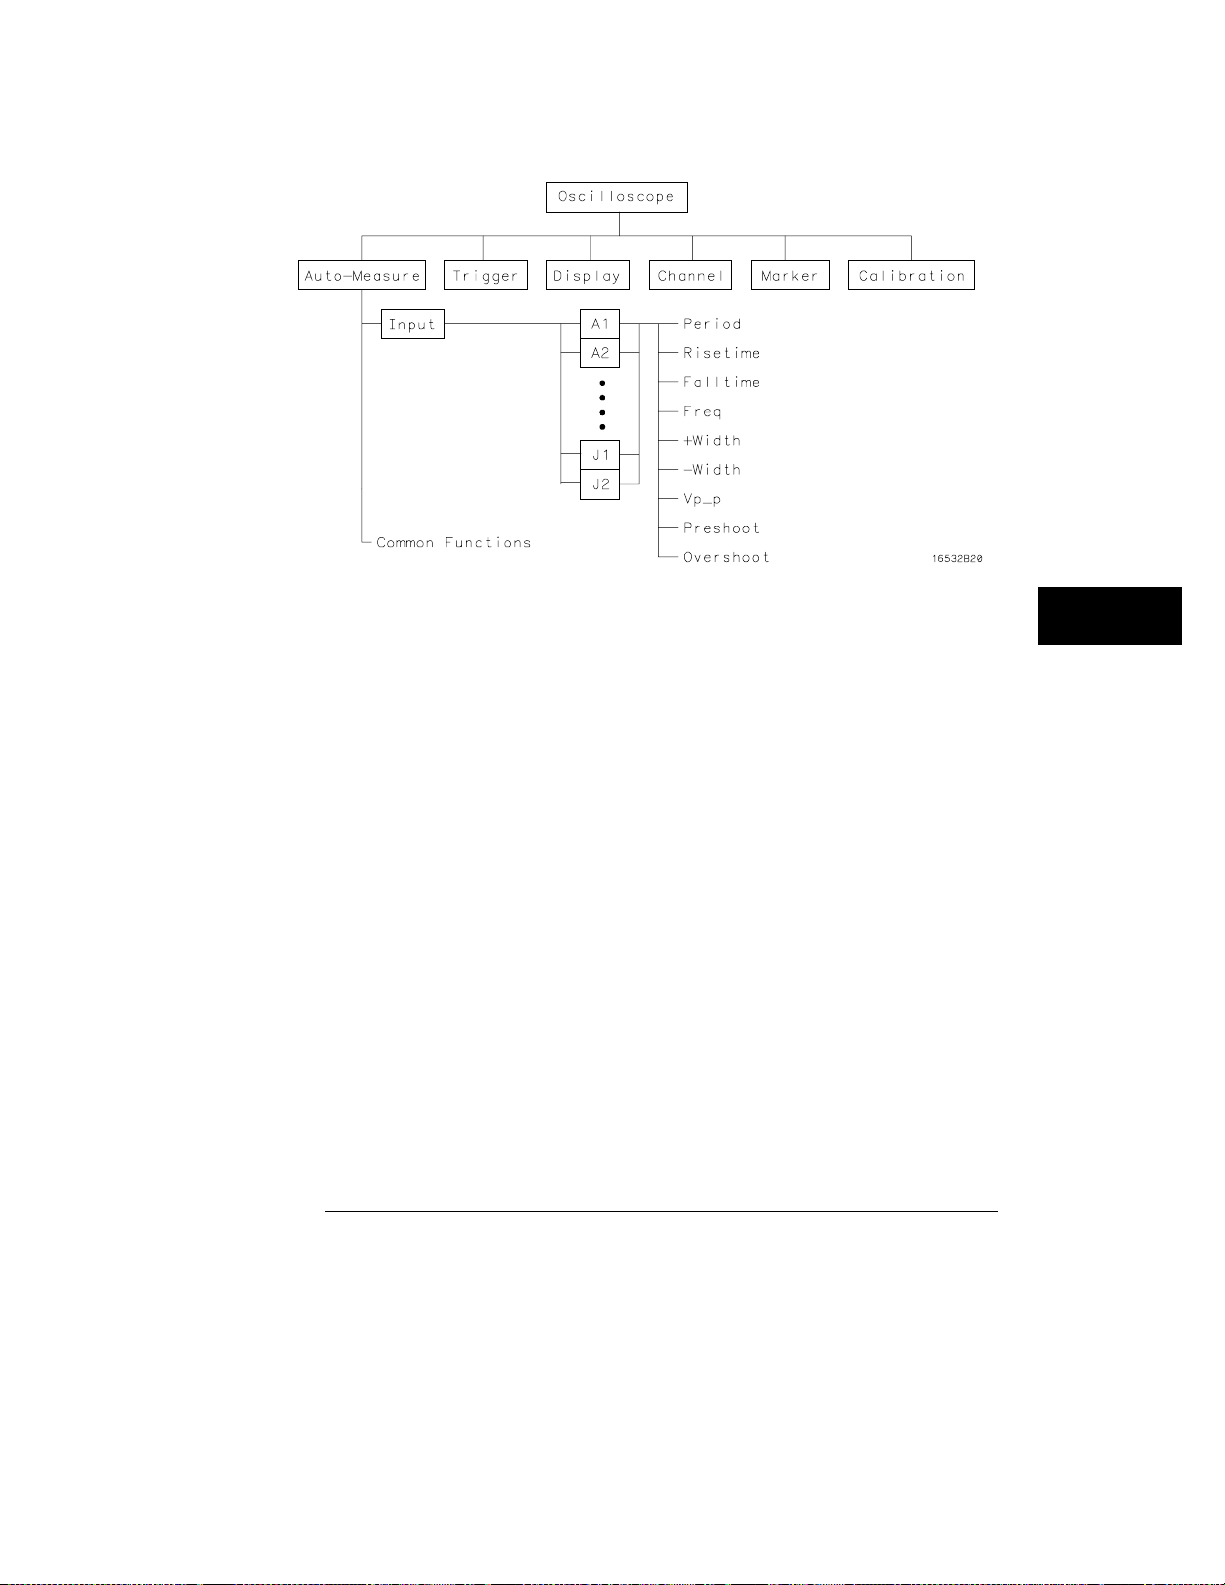
Auto-Meas ure Menu Map
The Auto-Measure Menu
8-3
Page 98

Automatic-Measurement Fields
There are two Automatic-Measurement fields. They are the Input
field and the actual automatic measurement display. These fields are
discussed in the following paragraphs.
Input Field
The Input field allows you to select the source of the waveform to be
measured. When you touch this field, a pop-up menu appears showing the
input sources. Be sure the proper source is selected for the input used. The
options displayed in the Input pop-up menu are dependent upon how many
cards are part of the oscilloscope module and in which slots they are
installed.
The default selection for the Input field is the lowest lettered and numbered
input channel of the module.
See Also
Automatic Measurements Display
The tan-colored field in the middle row of the menu is called the automatic
measurements display. This display shows the nine automatic
measurements that you can make. The measurements that this display
shows are:
Period +Width
Risetime
Falltime Vp_p
Freq Preshoot
"Automatic Measurement Algorithms" at the end of this chapter for an
explanation of each of these fields.
8-4
−
Width
Overshoot
Page 99

Automatic Measurement Prerequisites
This section gives you some helpful pointers to help you make
automatic measurements easier.
Measurement Setup Requirements
Measurements typically should be made at the fastest possible sweep speed
in order to obtain the most accurate measurement possible. You can only
make automatic measurements with data that is currently being displayed in
the waveform display area. Keep the following in mind when making
measurements:
At least one full cycle of the waveform, with at least two like edges, must
•
be displayed for Period and Freq measurements.
A complete positive pulse must be displayed to make a +Width
•
measurement.
A complete negative pulse must be displayed to make a −Width
•
measurement.
The leading (rising) edge of the waveform must be displayed for Risetime,
•
and rising edge Preshoot and Overshoot measurements.
The trailing (falling) edge of the waveform must be displayed for Falltime,
•
and falling edge Preshoot and Overshoot measurements.
Risetime, Falltime, Preshoot, and Overshoot measurements will be more
•
accurate if you expand the edge of the waveform by selecting a faster
sweep speed.
If the signal is clipped, the automatic measurements cannot be made.
•
8-5
Page 100

The Auto-Measure Menu
Criteria Used for Making Aut om atic Measurements
Criteria Used for Making Automatic Measurements
If more than one waveform, edge, or pulse is displayed, the measurements
are made on the first (leftmost) portion of the displayed waveform that can
be used. When any of the defined measurements are requested, the
oscilloscope first determines the top (100%) and base (0%) voltages of the
waveform. From this information, it can determine the other important
voltage values (10% voltage, 90% voltage, and 50% voltage) required to make
the measurements. The 10% and 90% voltage values are used in the rise time
and fall time measurements. The 50% voltage value is used for measuring
frequency, period, and pulse width.
8-6
 Loading...