

Page 1

HP 1:10Gb Ethernet BL-c Switch for c-Class
BladeSystem
Browser-based Interface Reference Guide
Part number: 445880-001
First edition: April 2007
Page 2

Legal notices
© 2007 Hewlett-Packard Development Company, L.P.
The information contained herein is subject to change without notice. The only warranties for HP products and services are set
forth in the express warranty statements accompanying such products and services. Nothing herein should be construed as
constituting an additional warranty. HP shall not be liable for technical or editorial errors or omissions contained herein.
Microsoft®, Windows®, and Windows NT® are U.S. registered trademarks of Microsoft Corporation.
SunOS™ and Solaris™ are trademarks of Sun Microsystems, Inc. in the U.S. and other countries.
Cisco® is a registered trademark of Cisco Systems, Inc. and/or its affiliates in the U.S. and certain other countries.
2
Page 3

Contents
Contents
Getting started
Introduction........................................................................................................................................... 8
Additional references ............................................................................................................................. 8
Features................................................................................................................................................ 8
Requirements......................................................................................................................................... 8
Switch setup.......................................................................................................................................... 9
Configuring IP interfaces .................................................................................................................... 9
Enabling or disabling BBI access......................................................................................................... 9
Web browser setup................................................................................................................................ 9
Starting the BBI.................................................................................................................................... 10
Browser-based interface basics
Introduction......................................................................................................................................... 13
Toolbar............................................................................................................................................... 13
Context buttons............................................................................................................................... 14
Commands..................................................................................................................................... 14
Navigation window ............................................................................................................................. 15
Forms window..................................................................................................................................... 15
Dashboard
Introduction......................................................................................................................................... 16
Steps for displaying dashboards ............................................................................................................ 16
Switch Dashboard................................................................................................................................ 20
User Access Dashboard........................................................................................................................ 22
RADIUS Dashboard.............................................................................................................................. 23
TACACS+ Dashboard .......................................................................................................................... 24
NTP Dashboard................................................................................................................................... 26
Switch Image and Configuration Management Dashboard........................................................................ 27
Management Network Definition Dashboard........................................................................................... 28
SFP Information.................................................................................................................................... 29
Switch Ports Dashboard ........................................................................................................................ 30
802.1x System Information ................................................................................................................... 31
Switch Ports 802.1x Dashboard........................................................................................................ 32
Port 802.1x Dashboard Operations .................................................................................................. 33
Forwarding Database Information.......................................................................................................... 35
VLANs Dashboard ............................................................................................................................... 36
Switch Spanning Tree Groups Information............................................................................................... 38
Switch Spanning Tree Group Information ........................................................................................... 40
Switch Spanning Tree Port Information............................................................................................... 41
Switch Trunk Groups Dashboard............................................................................................................ 42
Trunk Hash Dashboard ......................................................................................................................... 43
LACP Dashboard ................................................................................................................................. 44
LACP Port Dashboard........................................................................................................................... 45
Uplink Fast General Information............................................................................................................. 46
3
Page 4

Contents
RMON History Group Information.......................................................................................................... 47
RMON Alarm Group Information........................................................................................................... 48
RMON Event Group Information............................................................................................................ 50
IP Interfaces Dashboard ........................................................................................................................ 51
Route Table Information ........................................................................................................................ 52
ARP Cache Information......................................................................................................................... 54
Network Filters Dashboard.................................................................................................................... 56
Route Map Dashboard ......................................................................................................................... 57
Route Map Dashboard ......................................................................................................................... 58
Default Gateways Dashboard................................................................................................................ 59
IGMP Snooping Dashboard .................................................................................................................. 60
IGMP Multicast Groups.................................................................................................................... 61
IGMP Multicast Routers .................................................................................................................... 61
IGMP Filters Dashboard........................................................................................................................ 62
IGMP Static Multicast Router Configuration ............................................................................................. 63
OSPF General Dashboard..................................................................................................................... 64
OSPF Areas Dashboard........................................................................................................................ 65
OSPF Summary Ranges Dashboard........................................................................................................ 65
OSPF IP Interfaces Dashboard ............................................................................................................... 66
OSPF Virtual Links Dashboard ............................................................................................................... 67
OSPF Routes........................................................................................................................................ 68
RIP General Information........................................................................................................................ 68
RIP Interfaces Dashboard ...................................................................................................................... 69
Virtual Router Group Operation ............................................................................................................. 70
Virtual Routers Dashboard..................................................................................................................... 71
Virtual Router Operation .................................................................................................................. 72
Domain Name System Dashboard ......................................................................................................... 72
Bootstrap Protocol Relay Dashboard....................................................................................................... 73
IP Routing Dashboard........................................................................................................................... 73
802.1p Priority to CoS Dashboard......................................................................................................... 74
802.1p CoS Weight Dashboard............................................................................................................ 74
802.1p Switch Ports Priority Table Dashboard......................................................................................... 75
802.1p Number of CoS Dashboard....................................................................................................... 75
ACL Dashboard................................................................................................................................... 76
Access Control List Dashboard............................................................................................................... 77
ACL Groups Dashboard Table............................................................................................................... 77
Access Control List Group Dashboard..................................................................................................... 78
Uplink Failure Detection Dashboard ....................................................................................................... 78
Viewing statistics
Introduction......................................................................................................................................... 80
Steps for displaying statistics ................................................................................................................. 80
Management Processor Statistics............................................................................................................ 82
TCP/IP Statistics (IF and IP Statistics)....................................................................................................... 83
TCP/IP Statistics (ICMP and TCP Statistics)............................................................................................... 85
UDP/SNMP Statistics............................................................................................................................ 88
CPU Utilization .................................................................................................................................... 91
FDB Statistics....................................................................................................................................... 92
4
Page 5

Contents
Network Time Protocol Statistics............................................................................................................. 93
Switch Ports Statistics Summary.............................................................................................................. 94
Port Statistics .................................................................................................................................. 95
Bridging (“dot1”) Statistics ............................................................................................................... 96
Interface (“if”) Statistics - Input........................................................................................................... 96
Interface (“if”) Statistics - Output........................................................................................................ 97
Ethernet (“dot3”) Statistics ................................................................................................................ 98
GEA IP Statistics.............................................................................................................................. 99
Switch Ports 802.1x Statistics .............................................................................................................. 100
Port 802.1x Statistics.......................................................................................................................... 101
FDB Statistics..................................................................................................................................... 103
LACP Statistics .............................................................................................................................. 104
IP Statistics ........................................................................................................................................ 105
IP Routing Management Statistics ......................................................................................................... 106
IP Routing Management Statistics (part 2)......................................................................................... 108
ARP Statistics..................................................................................................................................... 111
IGMP VLAN Snooping Statistics Summary............................................................................................. 112
VLAN - IGMP Snooping Statistics .................................................................................................... 113
OSPF General Statistics ...................................................................................................................... 115
OSPF Areas Statistics.......................................................................................................................... 118
OSPF Area Statistics...................................................................................................................... 119
OSPF IP Interfaces Statistics ................................................................................................................. 122
OSPF IP Interface Statistics ............................................................................................................. 123
RIP Statistics ...................................................................................................................................... 126
Virtual Router Redundancy Protocol Statistics ......................................................................................... 126
Domain Name System Statistics ........................................................................................................... 127
IP Routing Management Statistics (part one)........................................................................................... 128
IP Routing Management Statistics (part 2)......................................................................................... 130
Access Control Lists Statistics ...............................................................................................................133
ACL Statistics..................................................................................................................................... 134
Uplink Failure Detection Statistics ......................................................................................................... 134
Configuring the switch
Introduction....................................................................................................................................... 136
Configuration steps ............................................................................................................................ 136
Input error checking ...................................................................................................................... 138
Switch Management Processor Configuration ........................................................................................ 139
Basic system configuration ............................................................................................................. 139
SNMP controls.............................................................................................................................. 141
Switch Management Processor Configuration buttons ........................................................................ 142
User Configuration Table .................................................................................................................... 143
User Access Control Configuration....................................................................................................... 144
Switch RADIUS Configuration.............................................................................................................. 145
Switch TACACS+ Configuration .......................................................................................................... 147
NTP Configuration ............................................................................................................................. 149
Syslog and Trap Feature Configuration................................................................................................. 150
Switch Image and Configuration Management ...................................................................................... 152
Downloading new software to your switch ....................................................................................... 153
Configuration ............................................................................................................................... 153
Switch Image and Configuration Management controls...................................................................... 153
5
Page 6

Contents
Switch Image and Configuration Management buttons....................................................................... 155
Management Network Definition Configuration ................................................................................ 156
Switch Ports Configuration .................................................................................................................. 157
Switch Port Configuration............................................................................................................... 158
Switch Port ACL Configuration........................................................................................................ 161
Port-Based Port Mirroring Configuration ................................................................................................ 162
Monitoring Port Configuration......................................................................................................... 163
Port Mirroring Configuration for Port................................................................................................ 163
802.1x General Configuration ............................................................................................................ 164
802.1x Switch Ports Configuration.................................................................................................. 164
802.1x Port Configuration ............................................................................................................. 165
FDB Configuration.............................................................................................................................. 166
Static FDB Configuration (part one) ................................................................................................. 167
Static FDB Configuration (part two).................................................................................................. 167
VLANs Configuration.......................................................................................................................... 168
VLAN Configuration ...................................................................................................................... 169
Switch Spanning Tree Groups Configuration ......................................................................................... 170
Switch Spanning Tree Group Configuration...................................................................................... 172
Switch Spanning Tree Group Port Configuration ............................................................................... 174
MSTP/RSTP General Configuration ...................................................................................................... 175
Common Internal Spanning Tree Bridge Configuration....................................................................... 177
Ports Common Internal Spanning Tree Configuration ......................................................................... 178
Common Internal Spanning Tree Port Configuration........................................................................... 179
Trunk Groups Configuration ................................................................................................................ 180
Switch Trunk Group Configuration................................................................................................... 181
Trunk Hash Configuration............................................................................................................... 182
LACP Configuration....................................................................................................................... 183
LACP Port Configuration................................................................................................................. 184
Uplink Fast General Configuration .................................................................................................. 185
RMON History Configuration Table...................................................................................................... 186
RMON History Configuration ......................................................................................................... 187
RMON Alarm Configuration Table....................................................................................................... 188
RMON Alarm Configuration........................................................................................................... 189
RMON Event Configuration Table........................................................................................................ 191
RMON Event Configuration............................................................................................................ 192
IP Interfaces Configuration .................................................................................................................. 193
IP Interface Configuration............................................................................................................... 194
IP Static Routes Configuration .............................................................................................................. 195
IP Static Route Configuration........................................................................................................... 196
Static ARP Configuration..................................................................................................................... 197
IP Static ARP Configuration............................................................................................................. 197
Network Filters Configuration .............................................................................................................. 198
Network Filter Configuration........................................................................................................... 199
Route Maps Configuration................................................................................................................... 200
Route Map Configuration............................................................................................................... 201
Route Map Access List Configuration ............................................................................................... 202
Default Gateways Configuration .......................................................................................................... 203
Default Gateway Configuration ........................................................................................................... 204
IGMP Snooping Configuration............................................................................................................. 205
IGMP Filters Configuration ............................................................................................................. 207
IGMP Filter Configuration............................................................................................................... 208
6
Page 7

Contents
IGMP Filtering Port Configuration.................................................................................................... 209
IGMP Filtering - Port Configuration .................................................................................................. 209
IGMP Static Multicast Router Configuration....................................................................................... 210
Static Multicast Router Configuration for Port .................................................................................... 211
OSPF General Configuration............................................................................................................... 212
OSPF MD5 Key Configuration ........................................................................................................ 213
OSPF Areas Configuration .................................................................................................................. 213
OSPF Area Configuration............................................................................................................... 214
OSPF Summary Ranges Configuration .................................................................................................. 215
OSPF Summary Range Configuration............................................................................................... 216
OSPF Interfaces Configuration ............................................................................................................. 217
OSPF Interface Configuration ......................................................................................................... 218
OSPF Virtual Links Configuration.......................................................................................................... 219
OSPF Virtual Link Configuration ...................................................................................................... 220
OSPF Hosts Configuration................................................................................................................... 221
OSPF Host Configuration ............................................................................................................... 222
OSPF Route Redistribution Configuration............................................................................................... 223
RIP Interfaces Configuration................................................................................................................. 224
RIP Interface Configuration ............................................................................................................. 225
RIP Route Redistribution Configuration.............................................................................................. 226
RIP General Configuration.............................................................................................................. 227
Virtual Routers Configuration ............................................................................................................... 228
Virtual Router Configuration ........................................................................................................... 229
VRRP Interfaces Configuration.............................................................................................................. 231
VRRP Interface Configuration .......................................................................................................... 232
VRRP General Configuration................................................................................................................ 233
Domain Name System Configuration.................................................................................................... 235
Bootstrap Protocol Relay Configuration ................................................................................................. 236
IP Routing General Configuration......................................................................................................... 236
QoS Priority CoS Configuration ........................................................................................................... 237
QoS Priority CoS Queue Configuration............................................................................................238
QoS CoS Weight Configuration .......................................................................................................... 238
QoS CoS Queue Configuration ...................................................................................................... 239
QoS Switch Ports Priority Configuration ........................................................................................... 239
QoS Switch Port Configuration ....................................................................................................... 240
QoS Number of CoS Configuration.................................................................................................240
ACL Configuration ............................................................................................................................. 241
Access Control List Configuration .................................................................................................... 243
ACL Metering Configuration................................................................................................................ 245
ACL Re-Mark Configuration............................................................................................................ 246
ACL Groups Configuration.................................................................................................................. 247
Access Control Group Configuration ............................................................................................... 248
Uplink Failure Detection Configuration.................................................................................................. 249
Failure Detection Pair Configuration ................................................................................................ 250
7
Page 8

Getting started
Getting started
Introduction
The HP 1:10Gb Ethernet BL-c Switch software lets you use your Web browser to access switch information
and statistics and perform switch configuration via the Internet. This guide provides a reference to the
browser-based interface (BBI) for the HP 1:10GbE switch.
This chapter briefly describes the software features and requirements for the BBI and explains how to
access the BBI start page.
Additional references
Additional information about installing and configuring the switch is available in the following guides,
which are available at http://www.hp.com/go/bladesystem/documentation
• HP 1:10Gb Ethernet BL-c Switch User Guide
• HP 1:10Gb Ethernet BL-c Switch Application Guide
• HP 1:10Gb Ethernet BL-c Switch Command Reference
• HP 1:10Gb Ethernet BL-c Switch ISCLI Reference
• HP 1:10Gb Ethernet BL-c Switch Quick Setup Instructions
Features
The network administrator can access all switch configuration and monitoring functions through the BBI, a
Web-based switch management interface. The BBI has the following features:
• Most of the same configuration and monitoring functions as the command line interface
• Intuitive and easy-to-use interface structure
• Nothing to install; the BBI is part of the switch software
• Two default levels of password protection
• Can be upgraded as future software releases are available
Requirements
.
To use the browser-based interface, you need the following:
• HP 1:10GbE switch
• Installed switch software
• PC or workstation with network access to the switch
• Frame-capable Web-browser software, such as the following:
○ Netscape Navigator 4.7x or higher
○ Internet Explorer 6.0x or higher
• JavaScript enabled in your Web browser
8
Page 9

Getting started
Switch setup
Before you can access the BBI, minimal configuration is required on the switch.
Configuring IP interfaces
At least one IP interface must be configured on the switch. This is usually done from the command line
interface during first-time switch set up. Each IP interface address provides a point of access for switch
management.
For more information about configuring an IP interface for management access, see the “Using the
command line interface” section in the “Accessing the switch” chapter of the HP 1:10Gb Ethernet BL-c
Switch Application Guide.
Enabling or disabling BBI access
By default, BBI access is enabled. If you need to disable or re-enable access, use the following command
from the command line interface:
>> Main# /cfg/sys/access/http <disable|enable (or just d|e)>
By default, secure BBI access is disabled. If you need to enable access, use the following command from
the command line interface:
>> Main# /cfg/sys/access/https/access <disable|enable (or just d|e)>
The default TCP port to use for BBI access is port 80. To change the port number, use the following
command:
>> Main# /cfg/sys/access/wport <TCP port number>
For more information on accessing and configuring the switch through the command line interface, see
the HP 1:10Gb Ethernet BL-c Switch Command Reference.
Web browser setup
Most modern Web browsers work with frames and JavaScript by default, and require no additional set
up. However, you should check your Web browser’s features and configuration to be sure frames and
JavaScript are enabled.
NOTE: JavaScript is not the same as Java™. Be sure that JavaScript is enabled in your Web
browser.
9
Page 10
Getting started
Starting the BBI
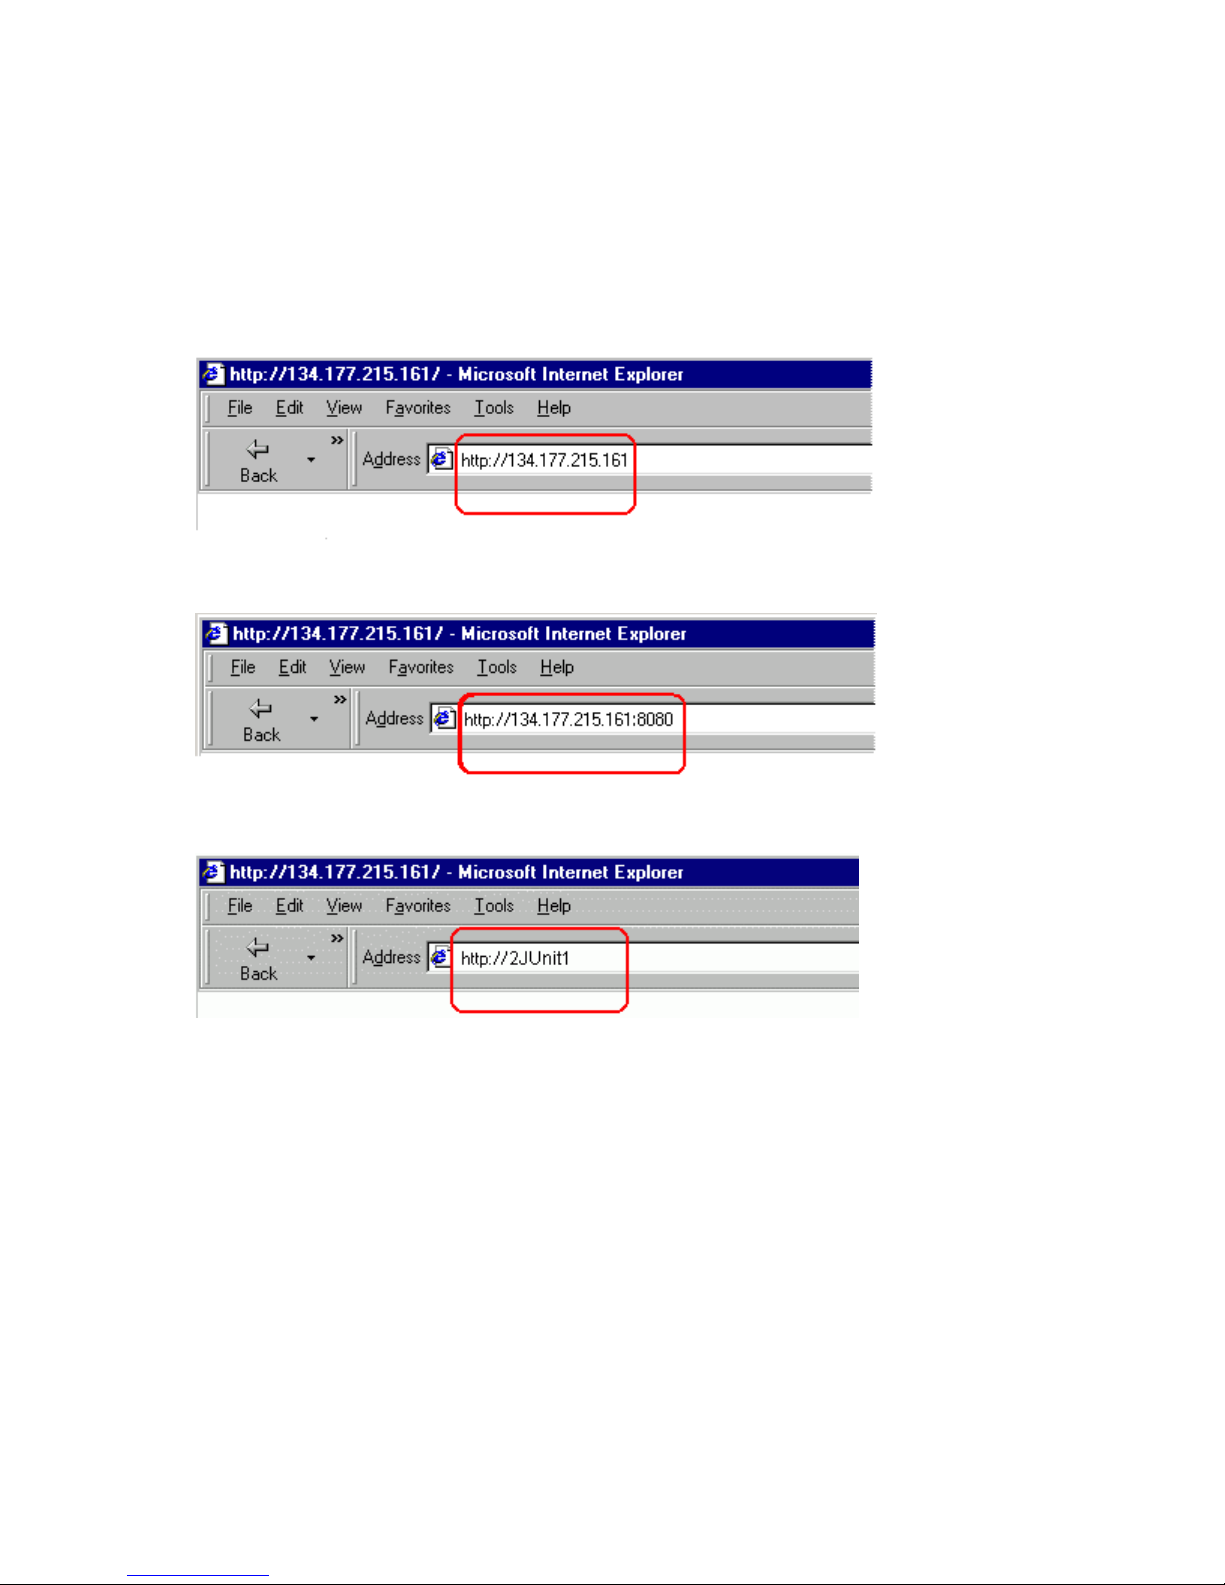
When the switch and browser setup is complete, follow these steps to launch the BBI:
1. Start your Web browser.
2. Enter the switch IP interface address in the Web browser Uniform Resource Locator (URL) field.
For example, if the switch IP interface has a network IP address of 134.177.215.161, using Internet
Explorer, you could enter the following (for secure BBI access, use https://).
If you do not use the default TCP port number (80) for BBI access, you can include the port number
when you enter the IP address:
If the switch IP interface address has a name on your local domain name server, you can enter the
name instead. Using Internet Explorer, you can enter the following:
10
Page 11
Getting started
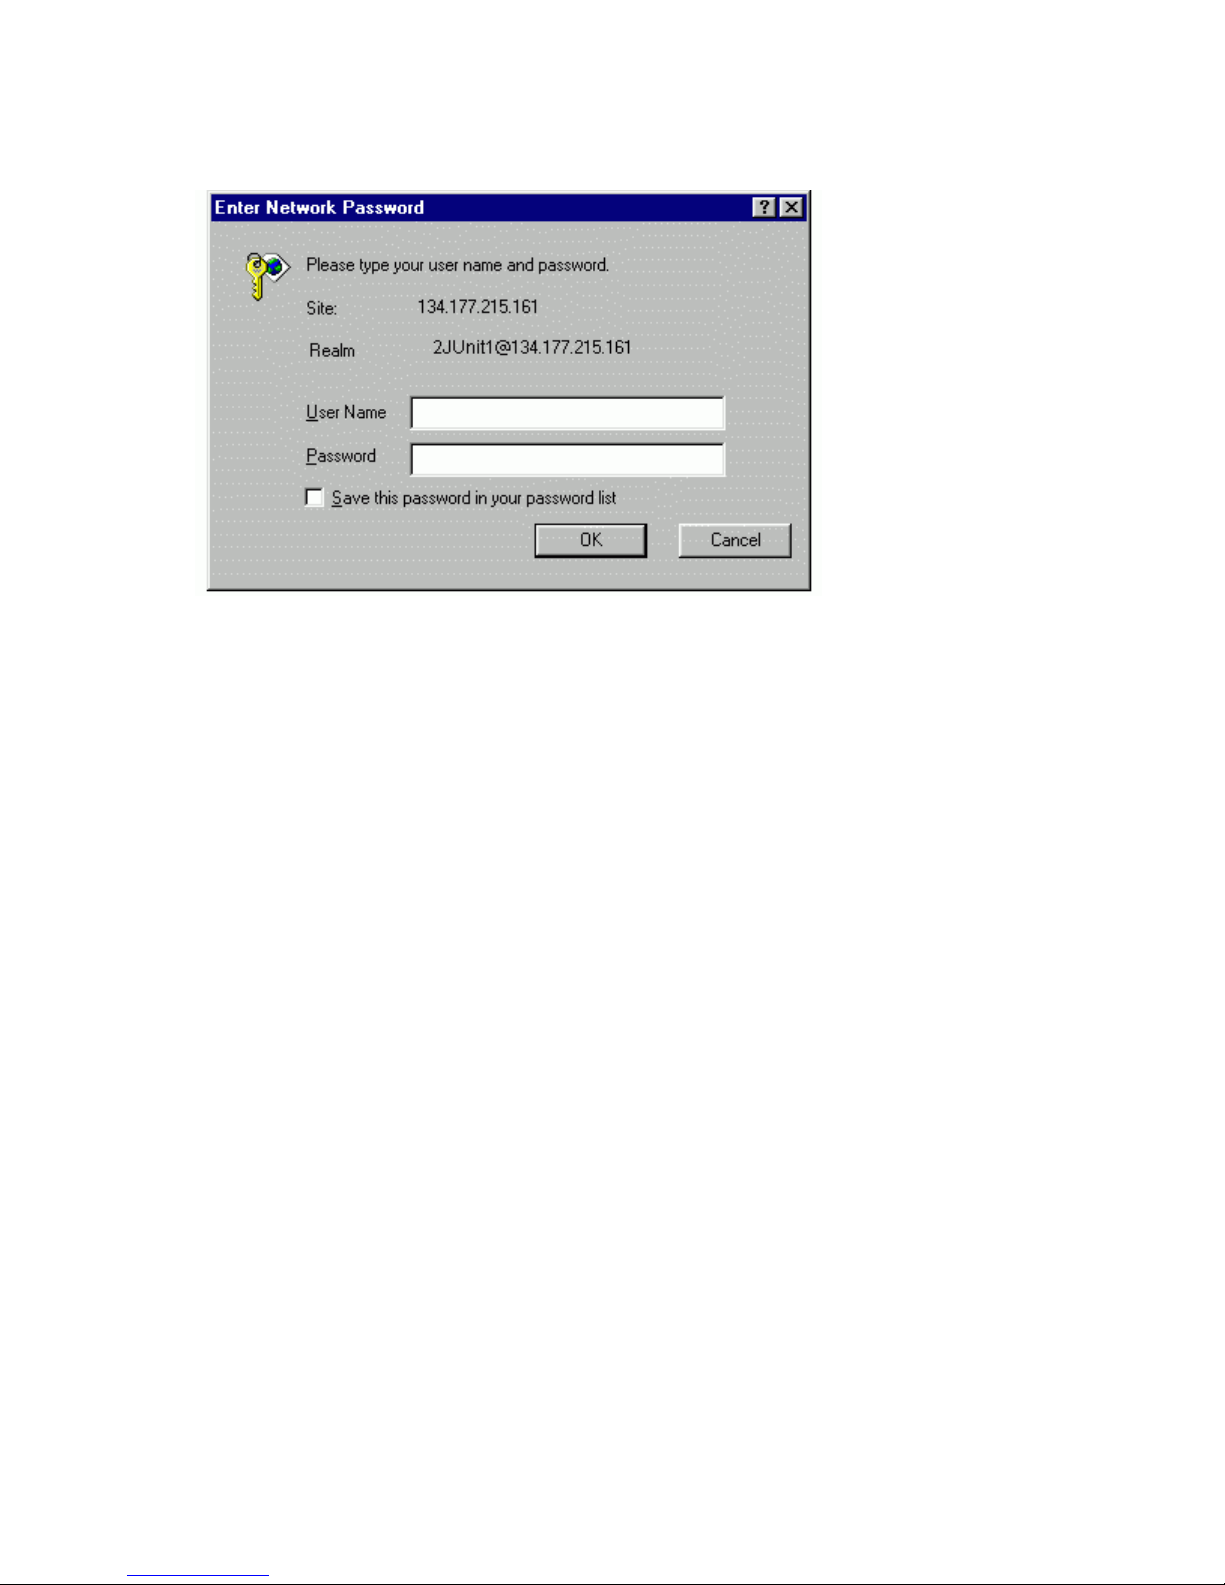
3. Log in to the switch.
If your switch and browser are properly configured, you will be asked to enter a password.
Enter the account name and password for the switch.
For more password information, see the HP 1:10Gb Ethernet BL-c Switch Command Reference
Guide.
11
Page 12
Getting started
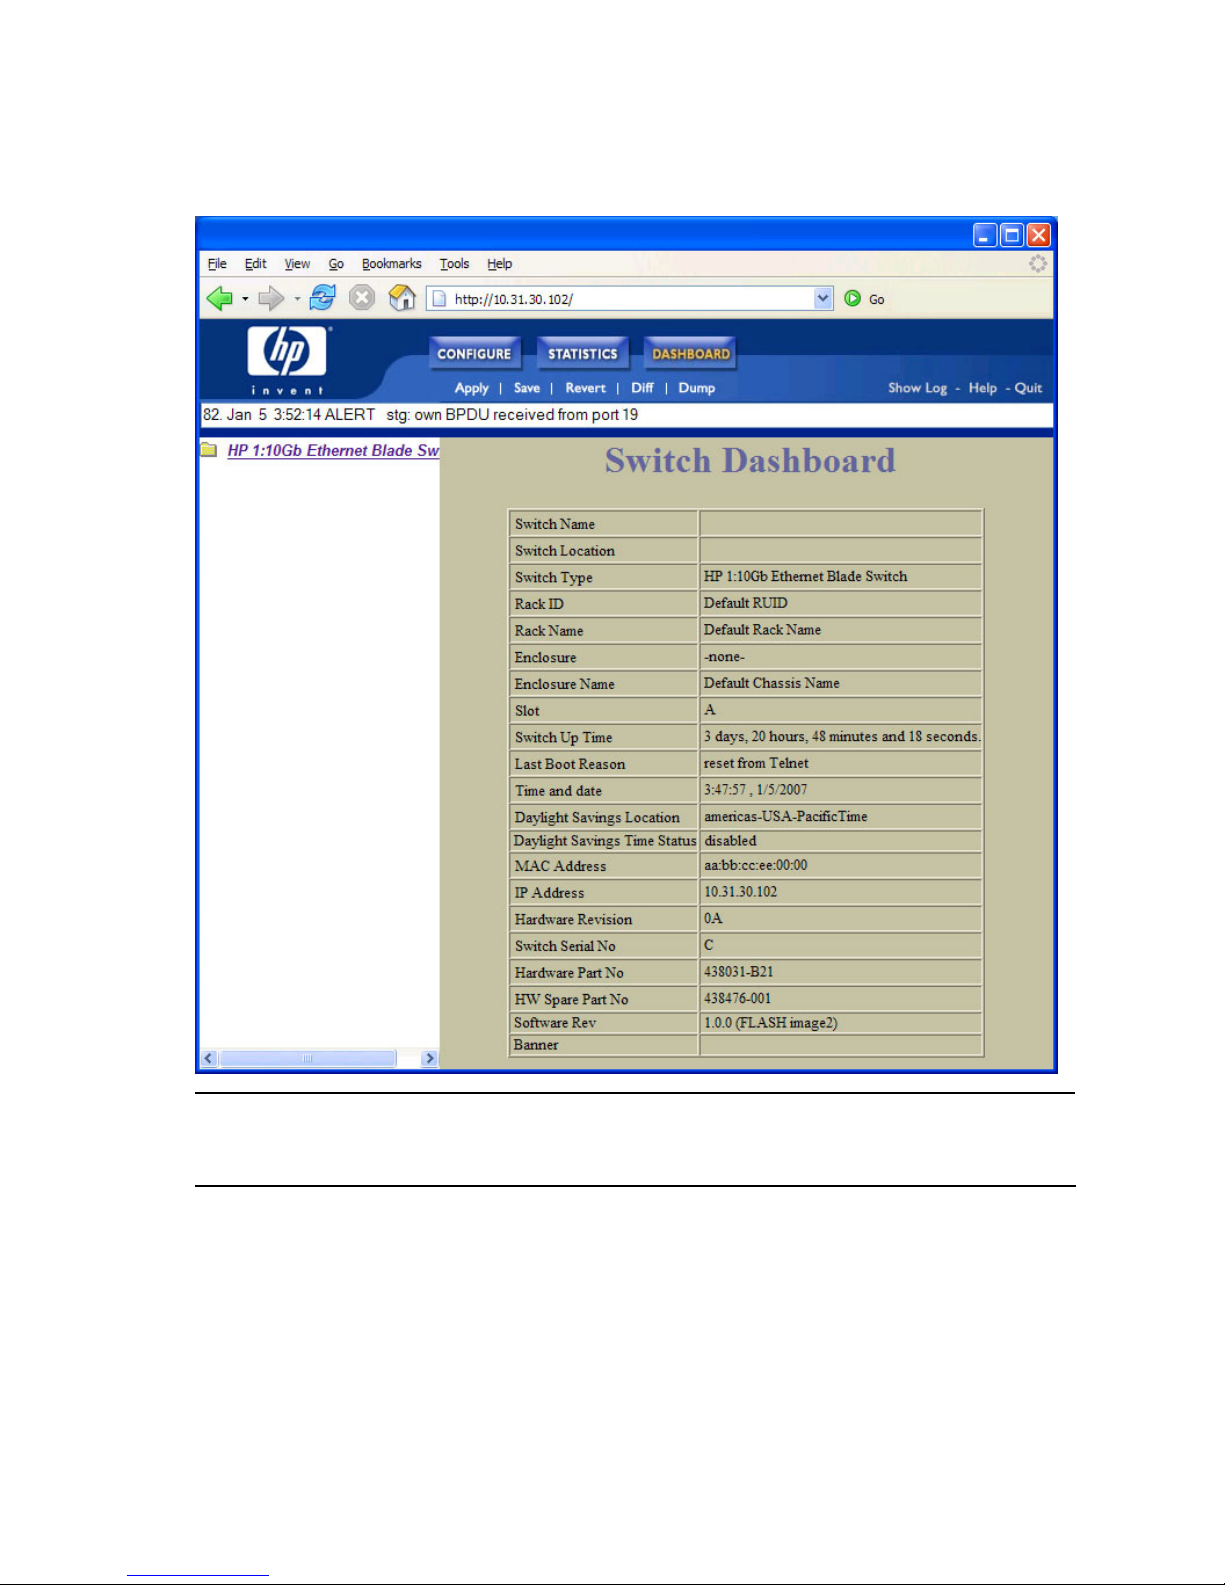
4. Allow the BBI Dashboard page to load.
When the proper account name and password combination is entered, the BBI Dashboard page is
displayed in the browser viewing area.
NOTE: There may be a slight delay while the Dashboard page is initializing. You should not stop
the browser while loading is in progress. When loading is complete, a folder icon for the switch
displays in the left-hand BBI window. Click this folder and a tree of folders displays.
12
Page 13
Browser-based interface basics
Browser-based interface basics
Introduction
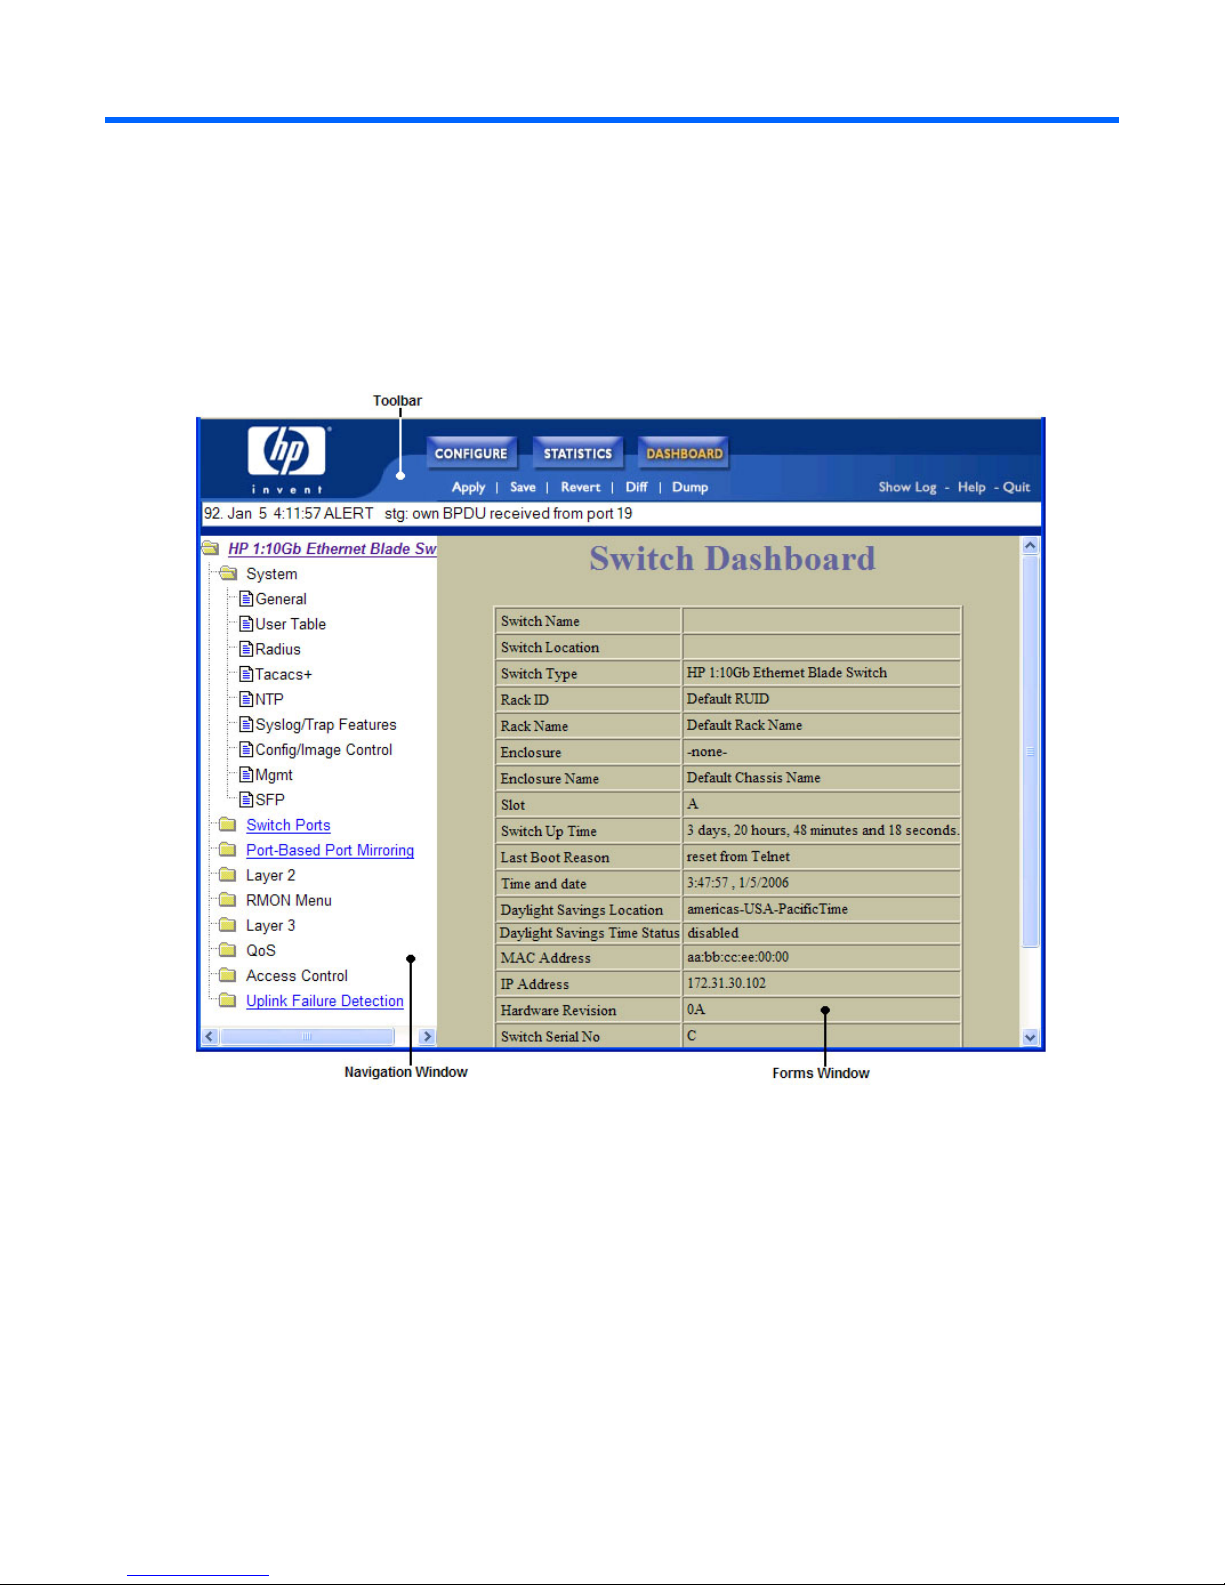
Once you are properly logged in, the switch BBI displays in the Web browser-viewing window.
There are three main regions on the screen.
• The Toolbar is used for selecting the context for your actions in the other windows.
• The Navigation window is used for selecting particular items or features to act upon.
• The Forms window is used for viewing or altering switch information.
Toolbar
The toolbar contains buttons and commands used to access and execute switch functions.
13
Page 14

Browser-based interface basics
Context buttons
The toolbar is used for setting the context for your actions in the application. There are three context
buttons:
Table 1 Context buttons
Button Description
Configure When selected, you can access and alter the switch configuration forms. Select an item in the
navigation window to display the desired configuration form in the forms window.
NOTE: This context is only available when you are logged in as an administrator.
Statistics When selected, you can view information about switch performance. Select an item in the
navigation window to display the desired statistics in the forms window.
Dashboard This context button is selected by default when the BBI is first activated. When selected, basic
switch information and status can be viewed in the forms window. Select an item in the
navigation window to display the desired dashboard information in the forms window.
First click a context button, and then click an item in the navigation window. When a context button is
selected, the button is highlighted as a reminder of the current context mode.
Commands
The following general commands are available on the toolbar:
Table 2 Toolbar commands
Command Description
Apply
Save Writes applied configuration changes to non-volatile flash memory on the switch (with the
Revert Removes pending configuration changes between Apply commands. Use this command to
Diff Shows any pending configuration changes.
Dump Writes current switch configuration to the screen. Configuration information is displayed with
Pending configuration changes do not take effect until you select the Apply command. Once
applied, all changes (except enabling/disabling Spanning Tree Protocol) take effect on the
switch immediately. If you do not save the changes, however, they will be lost the next time the
switch is rebooted.
option of not overlaying the current backup).
restore configuration parameters set since last Apply command.
parameters that have been changed from default values.
Show Log Opens a new Web-browser window for displaying the 100 most recent switch log messages.
Close the log browser when finished.
Help Opens a new Web-browser window for displaying the basic online help information. Close the
help browser when finished.
Quit Logs off the switch and exits the BBI.
14
Page 15
Browser-based interface basics
Navigation window
The navigation window is used for selecting a particular switch feature to act upon. Status, statistics, or
configuration forms for the selected item will display in the forms window, depending on the context
chosen on the toolbar.
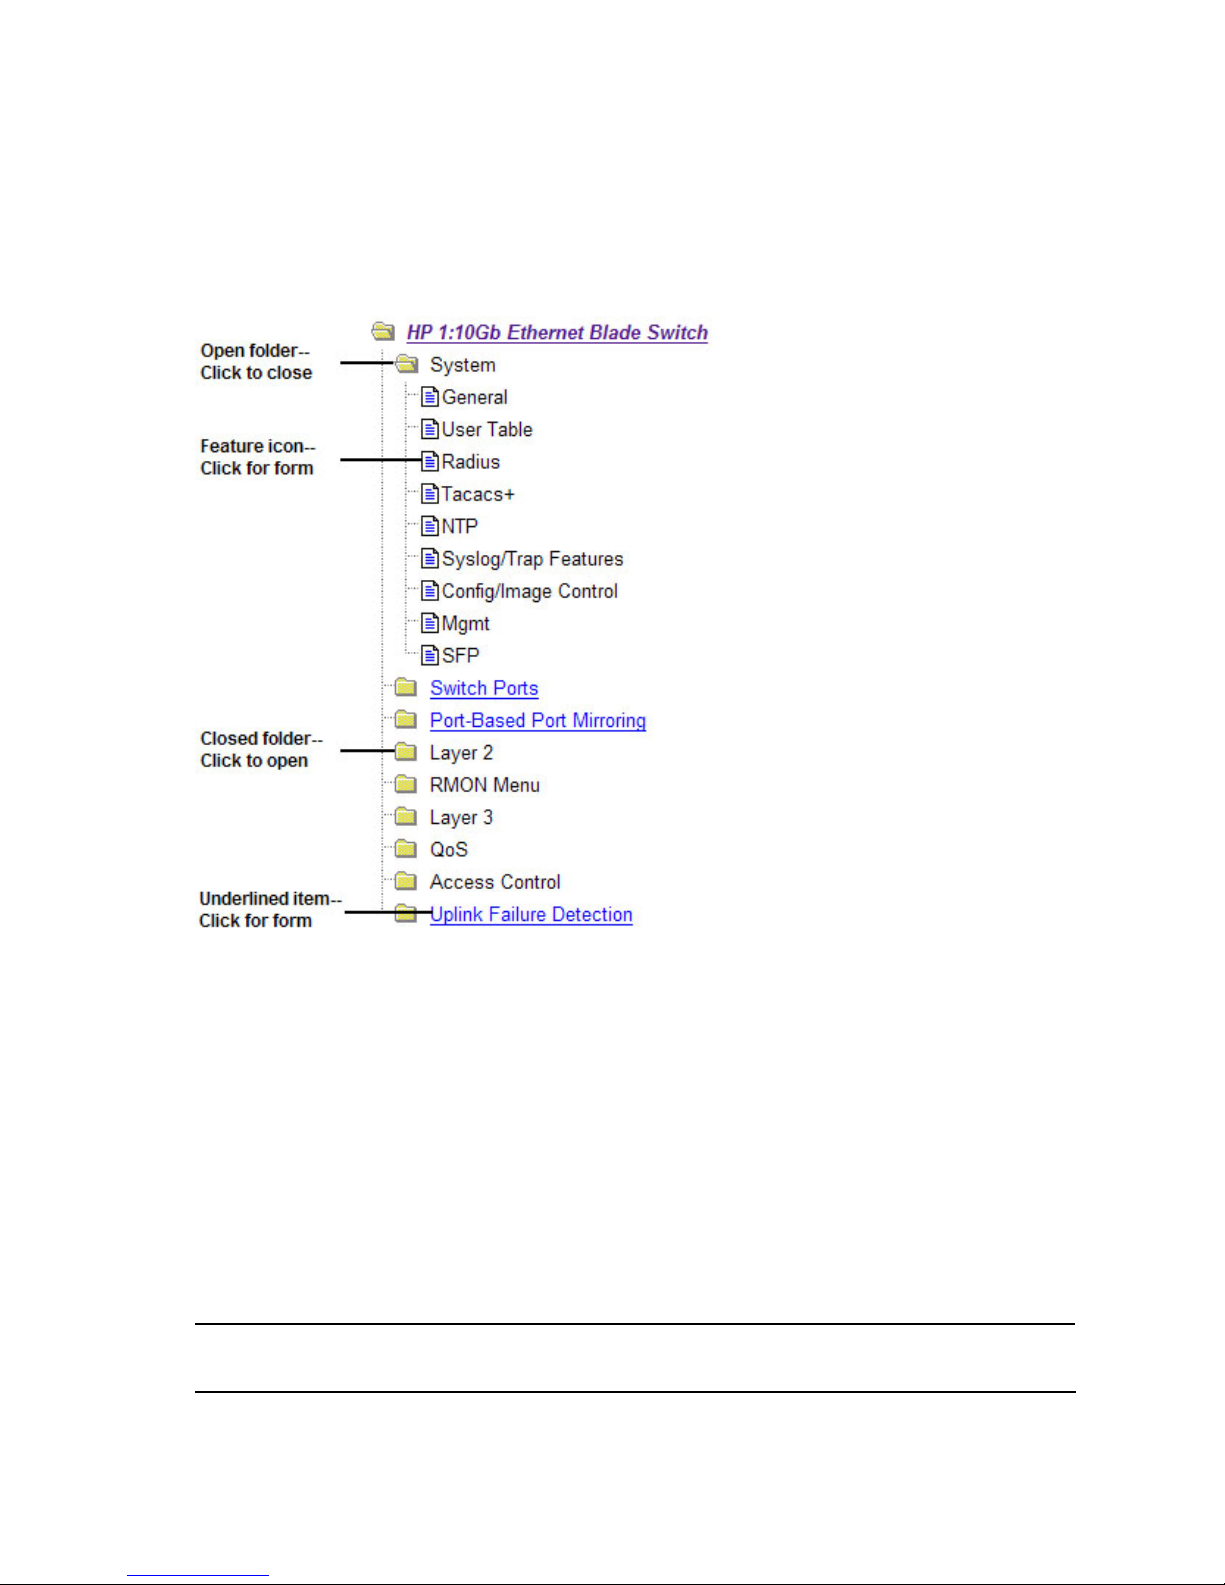
The navigation window contains a tree of folders, subfolders, and feature icons.
Click any closed folder to open it and reveal its contents. Click any open folder to close it. Click any
feature icon to load the appropriate status, statistics, or configuration form in the forms window.
Some folders also have forms. If the name of a folder is underlined, click the name to display the
appropriate form.
Forms window
When a feature icon is selected on the navigation window, a status, statistics, or configuration form is
displayed in the forms window. The exact nature of the form depends on the current context selected on
the toolbar, as well as the type of information available. Not all feature icons have forms for all contexts.
Some forms display switch information such as settings, status, or statistics. Others allow you to make
configuration changes to switch parameters.
NOTE: Some items display blank forms, depending on the context. A blank form indicates that no
information or actions are available in that context.
15
Page 16
Dashboard
Dashboard
Introduction
The switch BBI can be used to view the present settings and operating status of a variety of switch
features. Most of the same information available through the switch’s command line interface is present
on the dashboard forms.
The following provides a basic outline for viewing the dashboard forms. You should first be familiar with
configuration as covered in the HP 1:10Gb Ethernet BL-c Switch Command Reference.
Steps for displaying dashboards
Follow these basic steps for viewing switch dashboard forms.
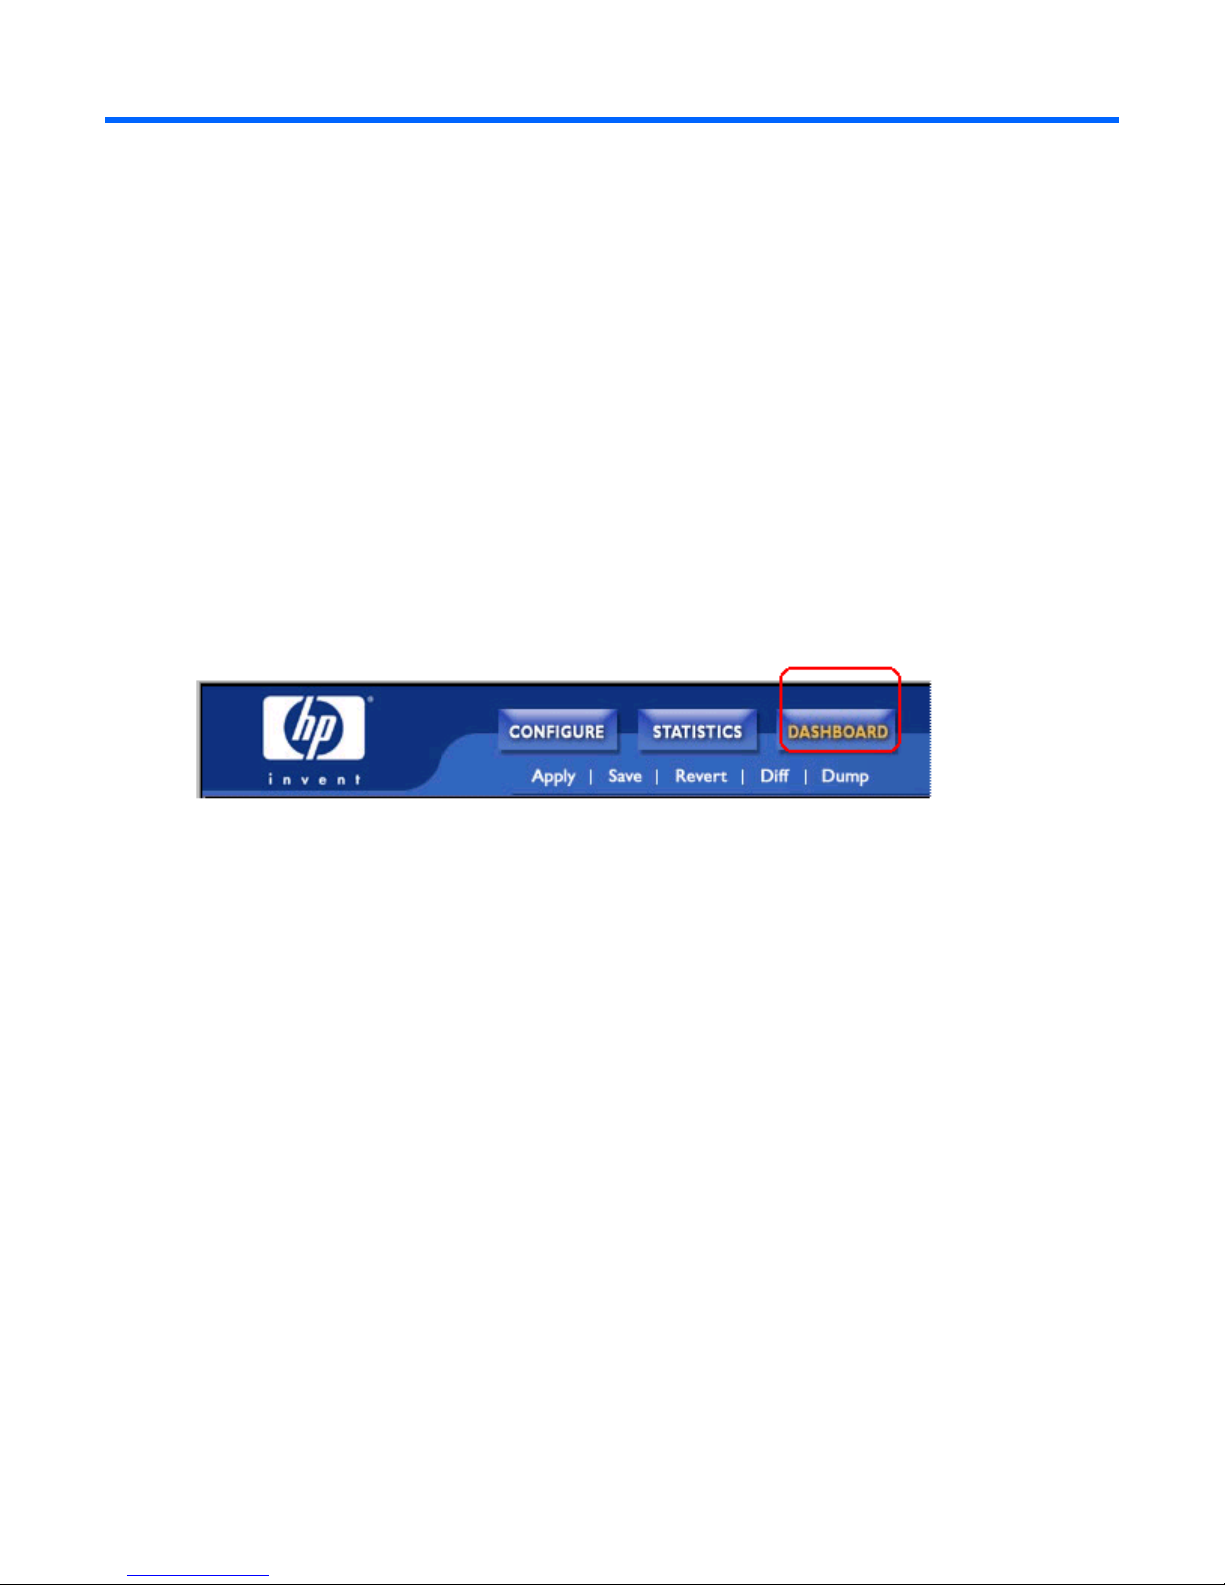
1. Select the Dashboard context button in the BBI toolbar.
16
Page 17
Dashboard
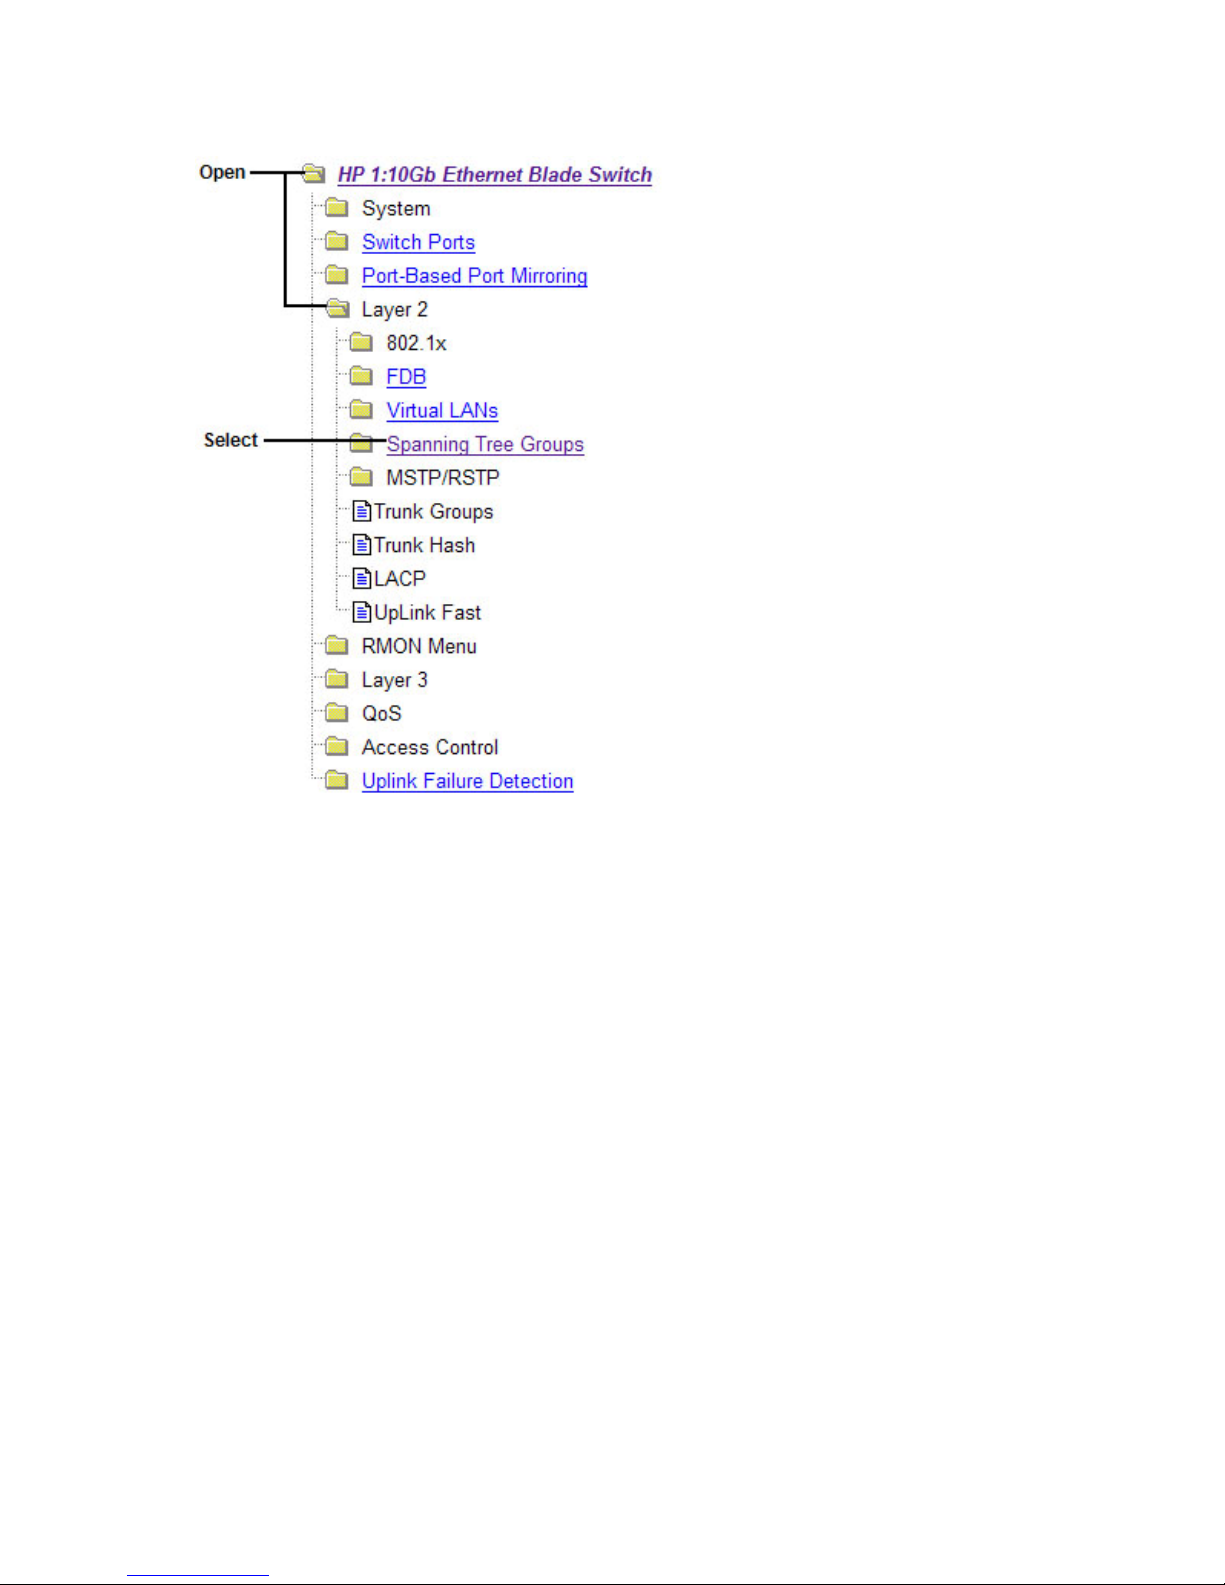
2. Select a feature icon in the navigation window. For example, select Spanning Tree Groups:
17
Page 18
Dashboard
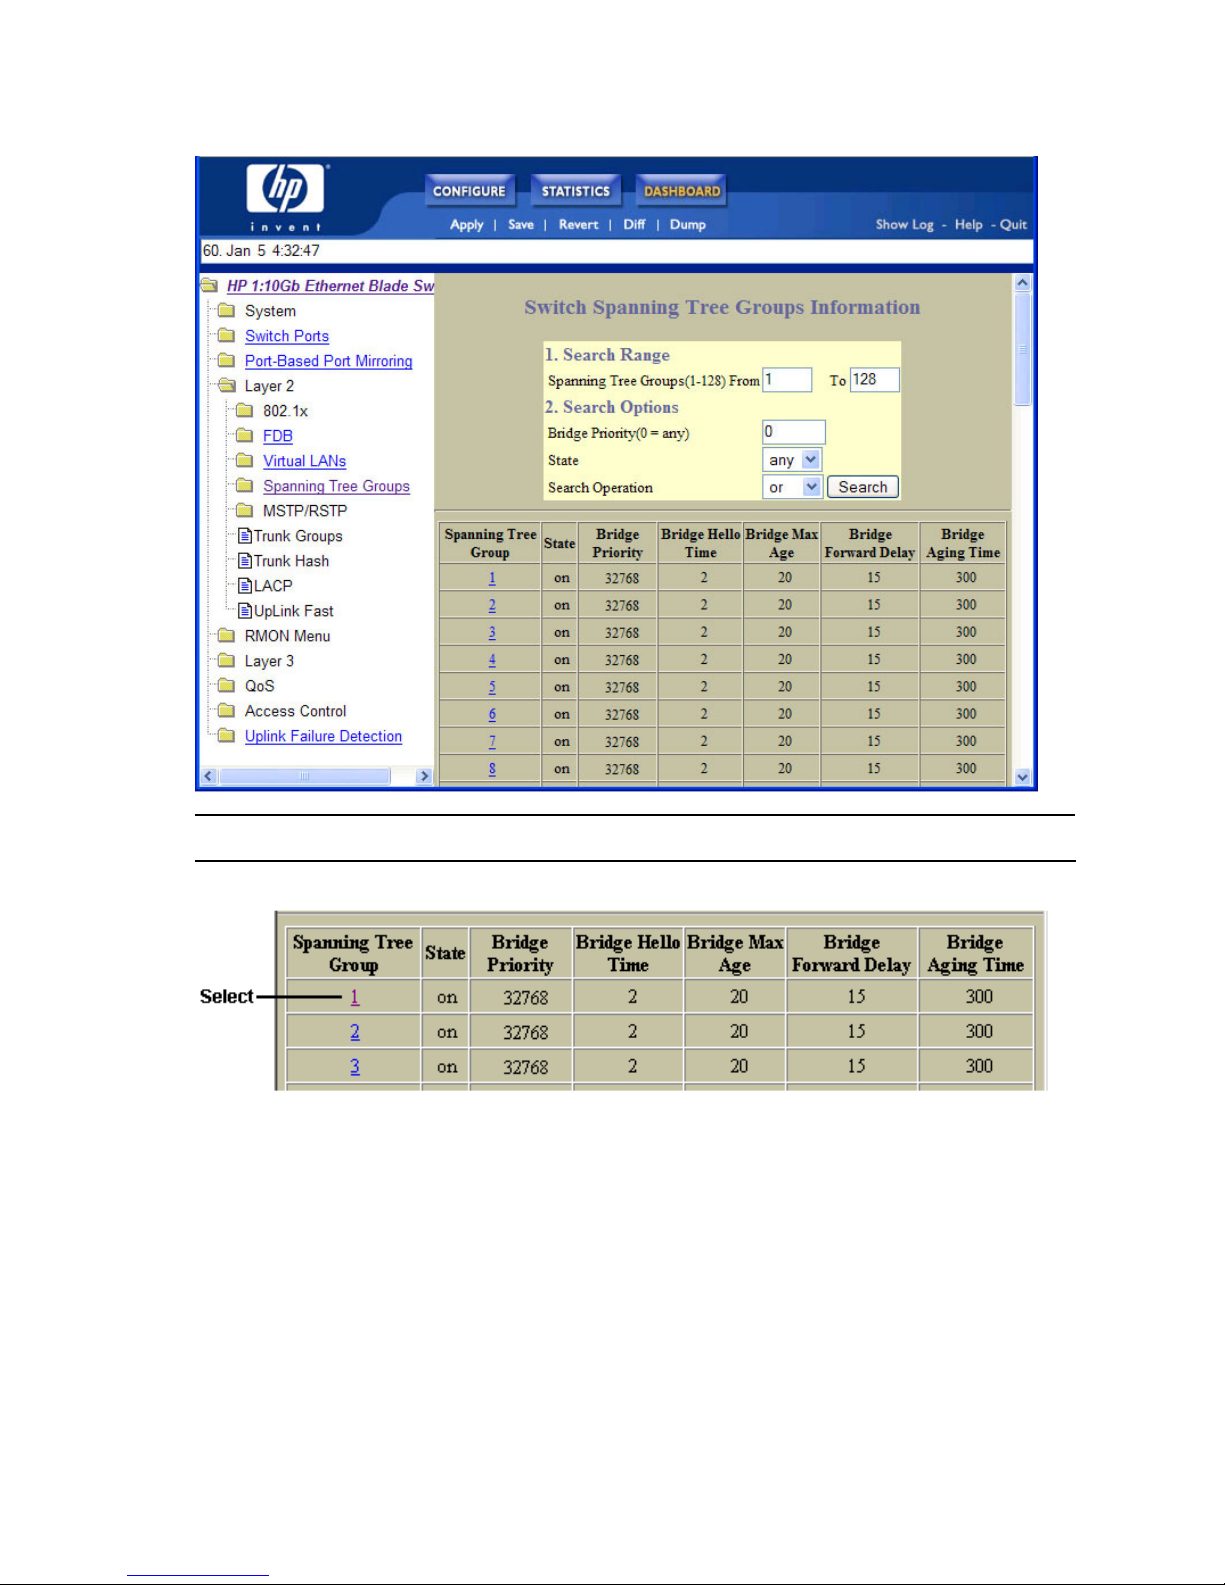
3. View information shown in the forms window.
NOTE: Items that load other forms when selected are underlined.
4. Select an underlined item to view details or perform actions.
18
Page 19
Dashboard
In this example, click a Spanning Tree Group number to view detailed information about the group
(shown in form below).
19
Page 20
Dashboard
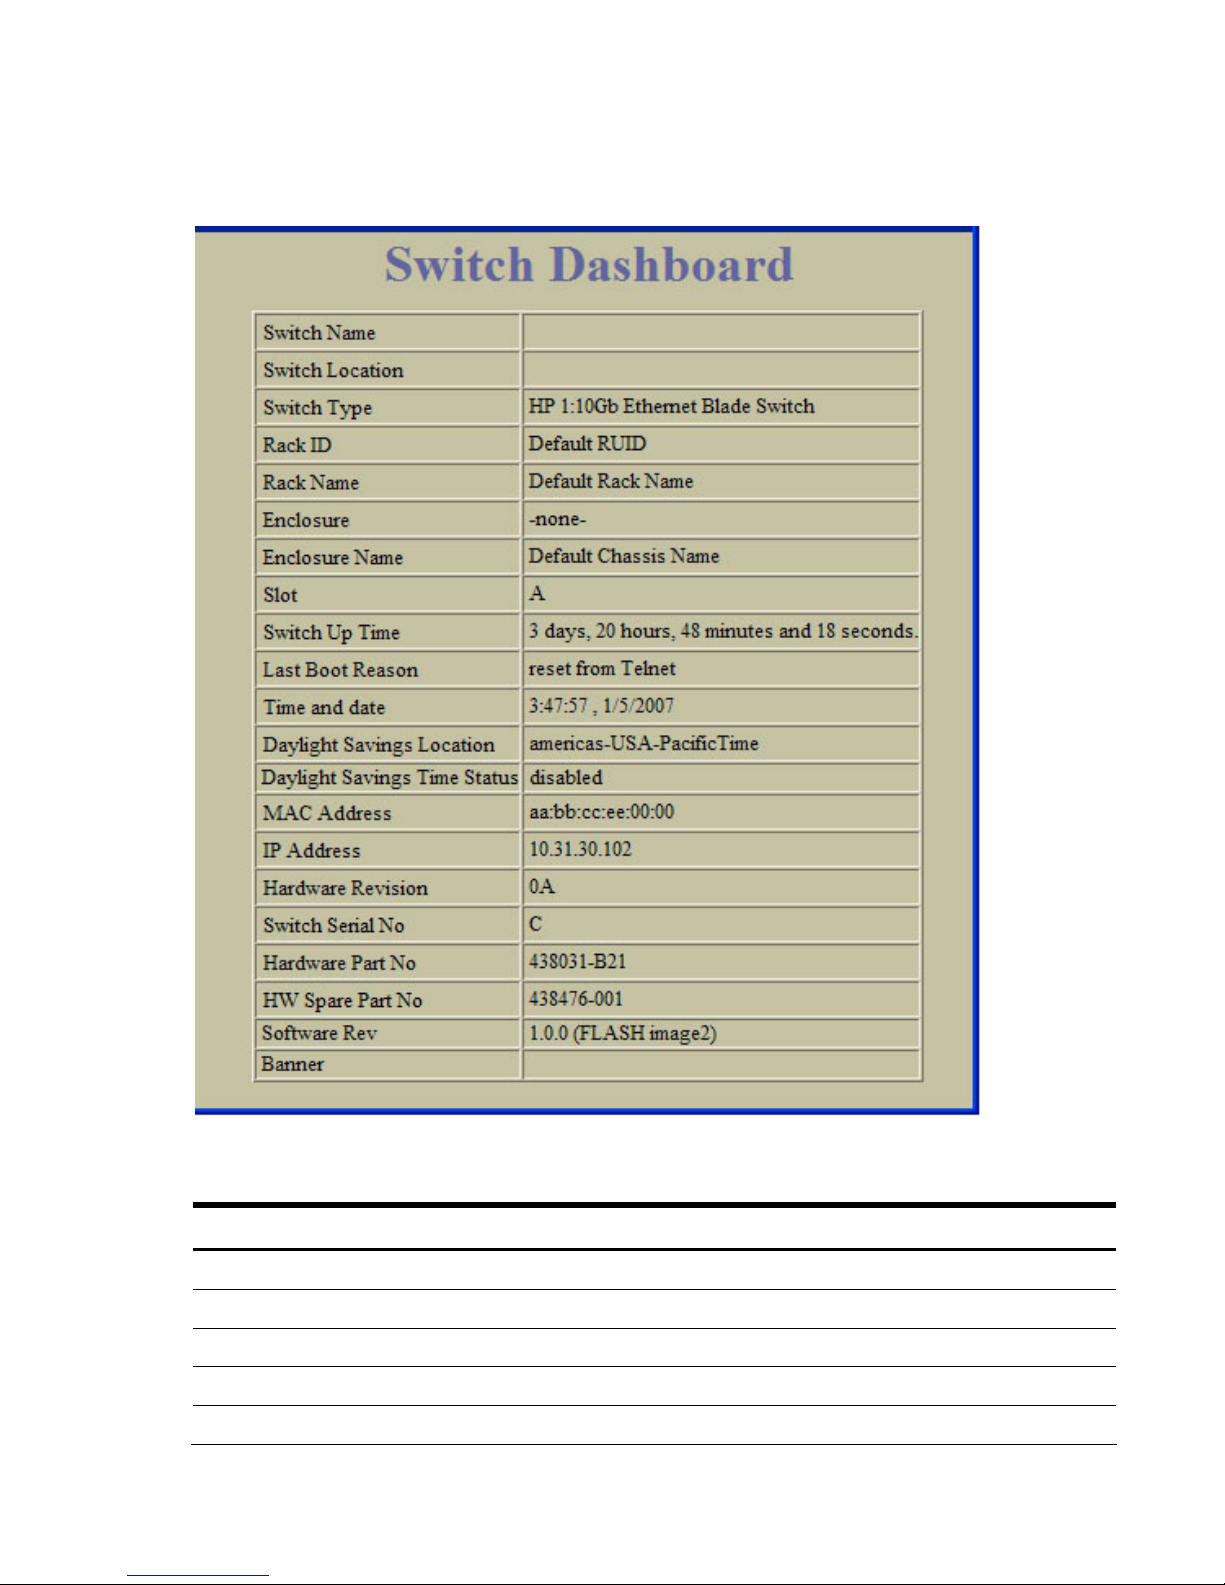
Switch Dashboard
To display the following form, select System > General. This is the default form for the switch.
The following table describes the Switch Dashboard controls:
Table 3 Switch Dashboard controls
Control Description
Switch Name Displays the name of the switch, as entered in Configuration > Switch > General (SNMP).
Switch Location Displays the location of the switch, as entered in Configuration > Switch > General (SNMP).
Switch Type Displays the type of switch.
Rack ID Displays the serial number of the chassis in which the switch resides.
Rack Name Displays the name of the chassis in which the switch resides.
20
Page 21

Dashboard
Table 3 Switch Dashboard controls
Control Description
Enclosure Displays the serial number of the enclosure (or “bay”) in which the switch resides.
Enclosure Name Displays the name of number of the enclosure (or “bay”) in which the switch resides.
Bay Number Displays the bay number in which the switch resides.
Switch Up Time Displays the amount of time the switch has been running.
Last Boot Time Displays the date and time of last switch boot.
Time and date Displays the current time and date.
Daylight Savings
Location
MAC Address Displays the MAC Address of the switch management processor.
IP Address Displays the IP address of IP Interface 1.
Hardware Revision Displays the hardware revision number of the switch.
Switch Serial No Displays the serial number of the switch.
Hardware Part No Displays the part number of the switch hardware.
HW Spare Part No Displays the part number of spare switch hardware.
Software Rev Displays the software revision number.
Banner Displays the login banner text. When a user or administrator logs into the switch, the login
Displays the time zone where the switch resides. You are prompted to select your location
(continent, country, region) by the timezone wizard. Once a region is selected, the switch
updates the time to reflect local changes to Daylight Savings Time, etc.
banner is displayed.
It is also displayed as part of the output from the /info/sys/gen command.
21
Page 22
Dashboard
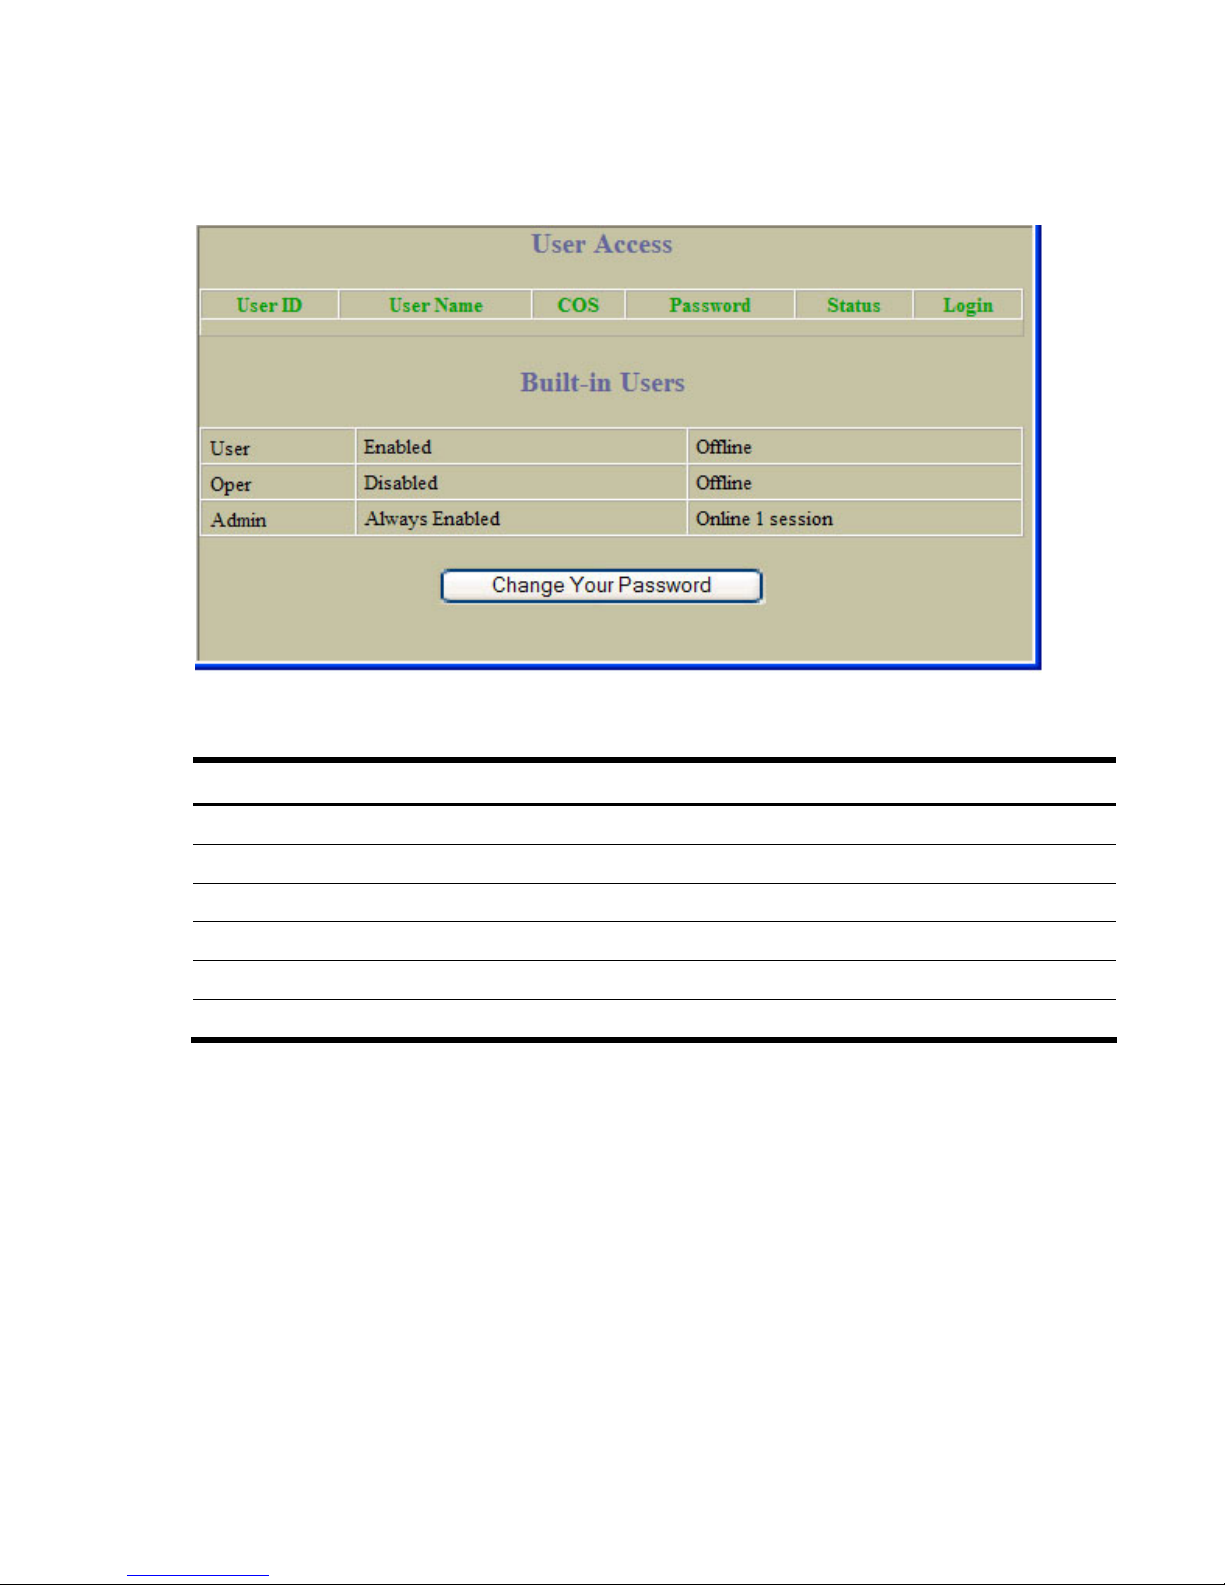
User Access Dashboard
To display the following form, select System > User Table.
The following table describes the User Access Dashboard controls:
Table 4 User Access Dashboard controls
Control Description
User ID Displays the numeric identifier for the user
User Name Displays the name of the user.
COS Displays the Class of Service level for the user.
Password Indicates whether a valid password is defined for the user.
Status Displays whether the user is enabled or disabled.
Login Displays the login status of the user (online or offline).
22
Page 23
Dashboard
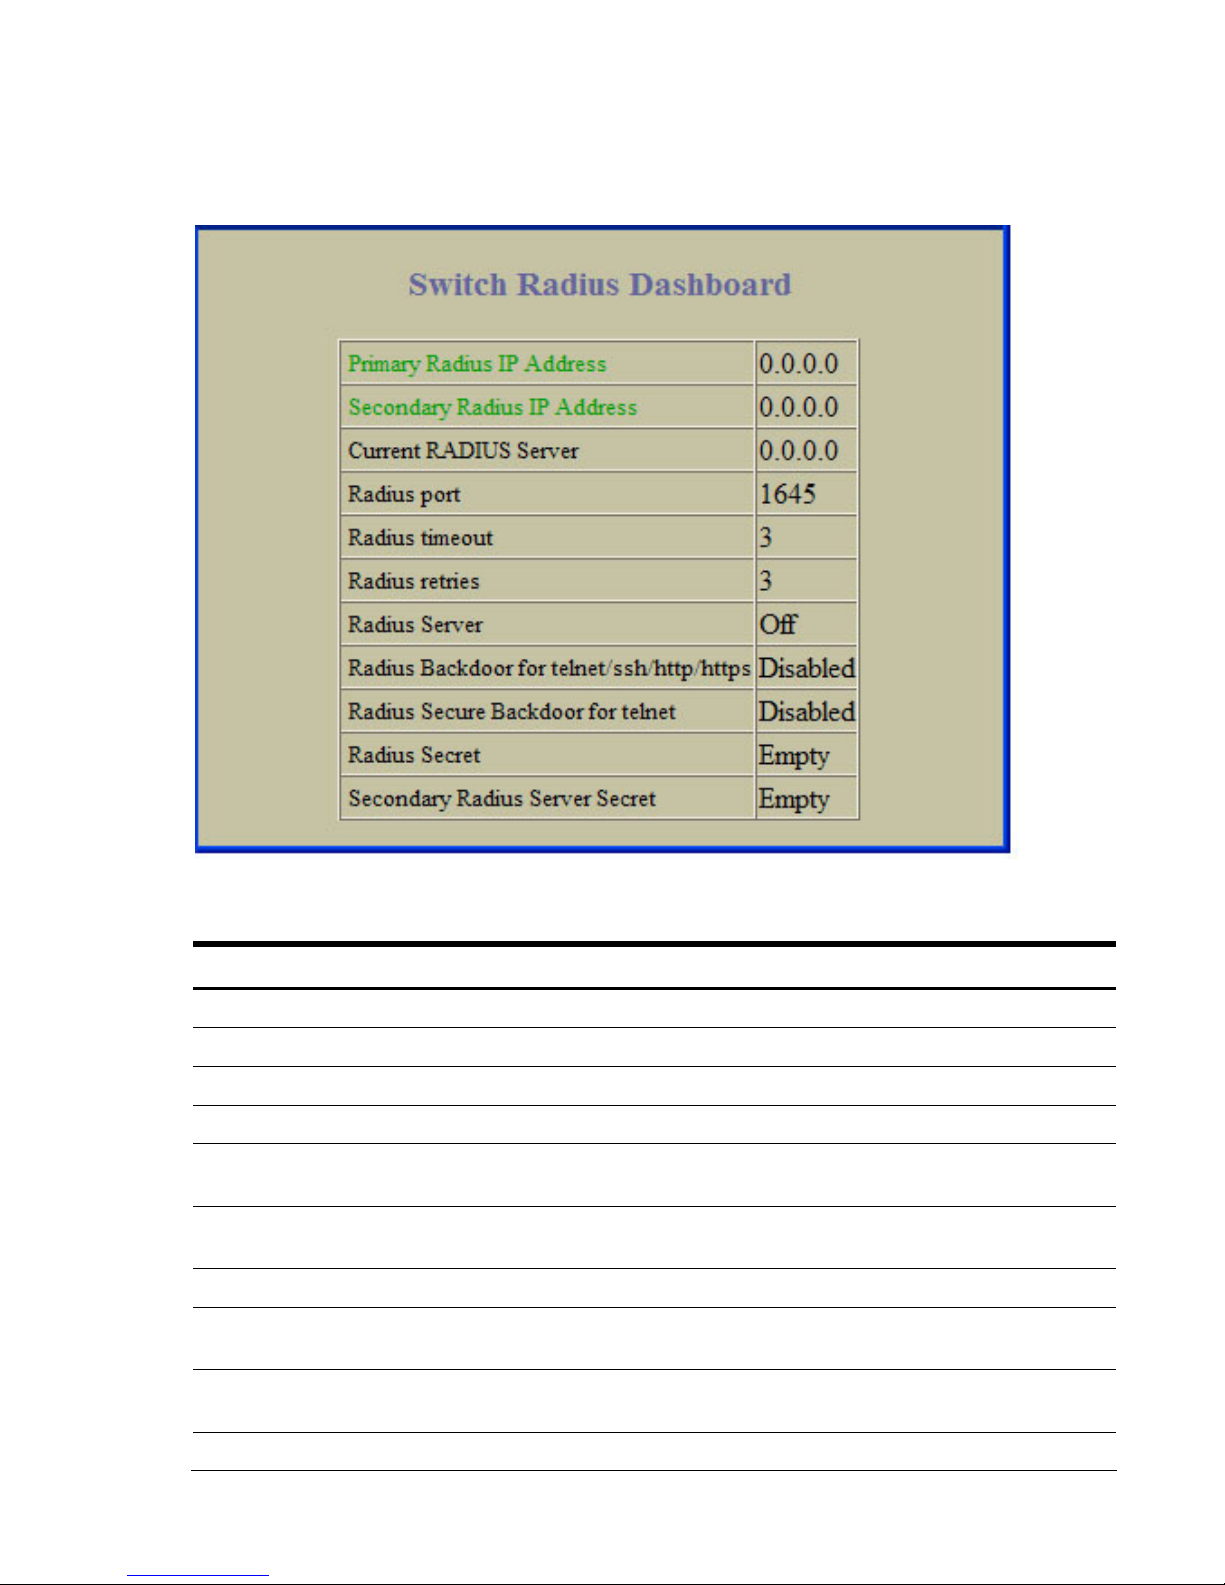
RADIUS Dashboard
To display the following form, select System > Radius.
The following table describes the switch RADIUS Dashboard controls:
Table 5 RADIUS Dashboard controls
Control Description
Primary Radius IP Address Displays the primary RADIUS server address.
Secondary Radius IP Address Displays the secondary RADIUS server address.
Current RADIUS server Displays the current RADIUS server address.
Radius port Displays the number of the User Datagram Protocol (UDP) port for RADIUS.
Radius timeout Displays the amount of time, in seconds, before a RADIUS server authentication
attempt is considered to have failed.
Radius retries Displays the number of failed authentication requests before switching to a
different RADIUS server.
Radius Server Displays the current status of the RADIUS server.
Radius Backdoor for
telnet/ssh/http/https
Radius Secure Backdoor for
telnet
Displays the status of the RADIUS back door for telnet/SSH/HTTP/HTTPS.
Displays the status of the RADIUS back door using secure password for
telnet/SSH/HTTP/HTTPS.
Radius Secret Displays the shared secret between the switch and the RADIUS server(s).
23
Page 24
Dashboard
Table 5 RADIUS Dashboard controls
Control Description
Secondary Radius Server Secret Displays the secondary shared secret between the switch and the RADIUS
server(s).
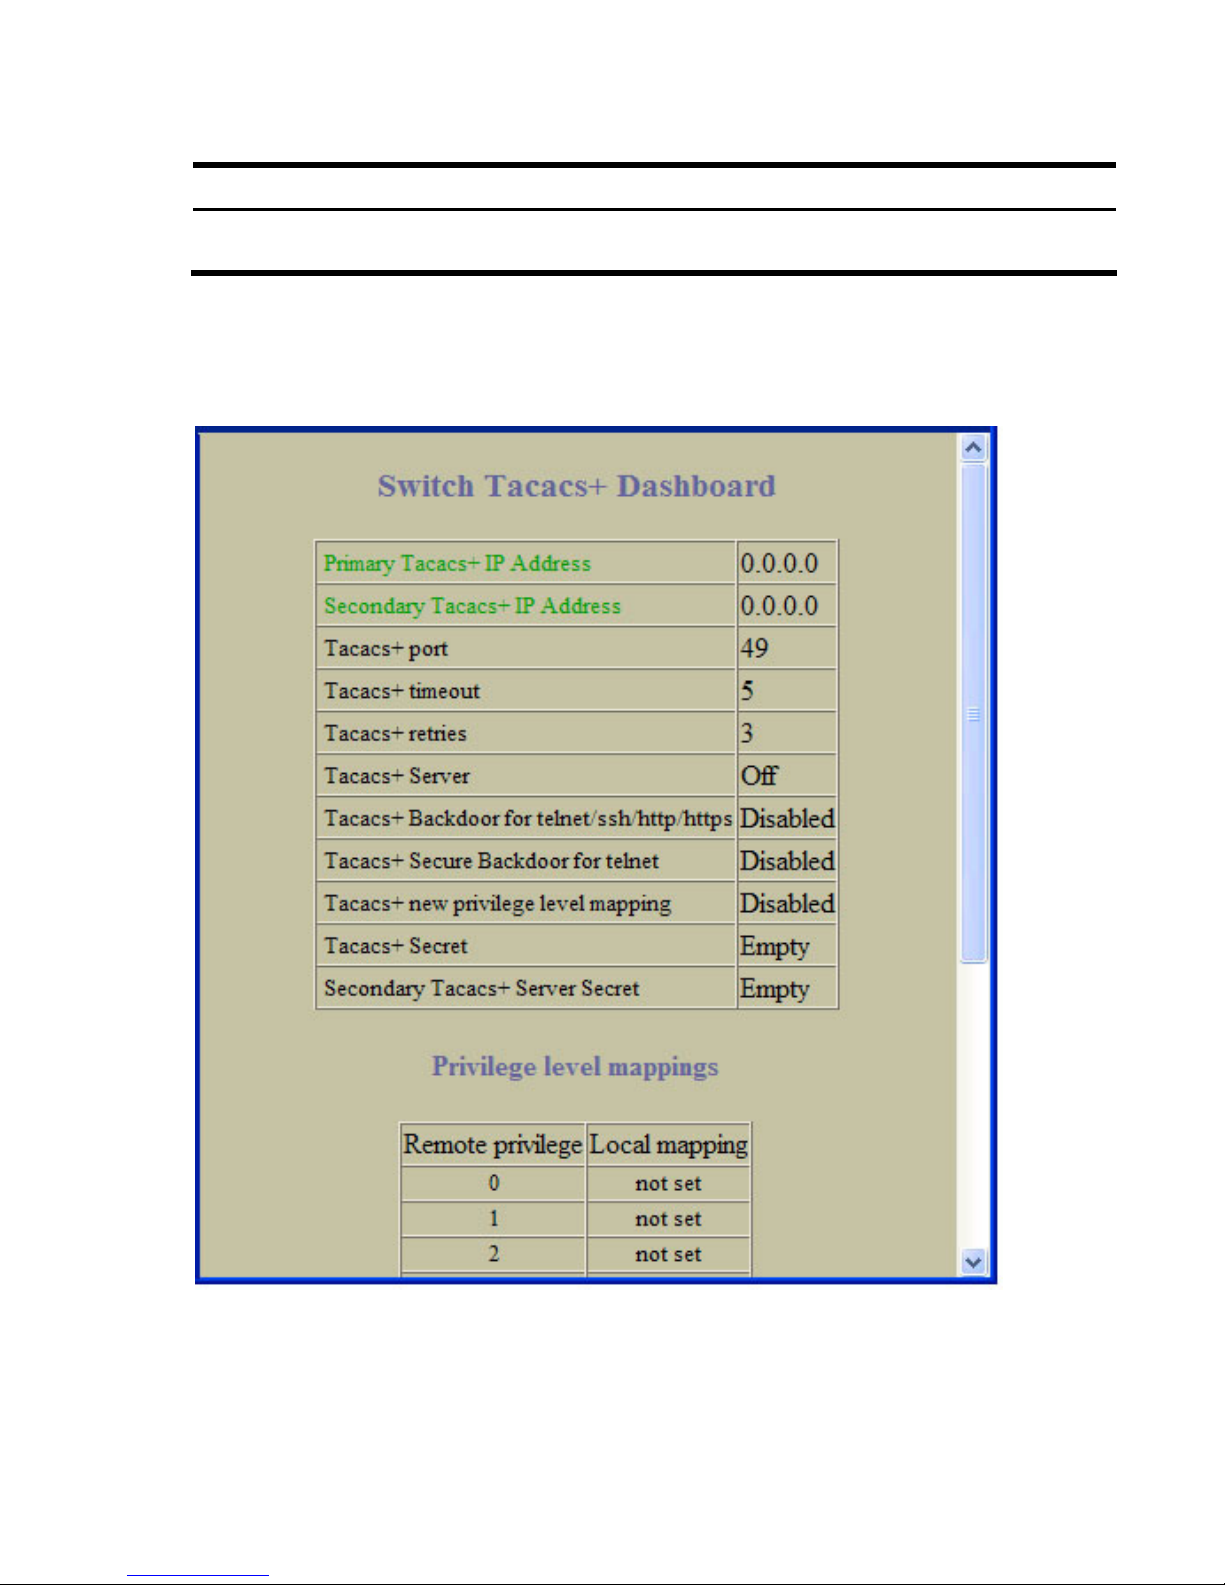
TACACS+ Dashboard
To display the following form, select System > Tacacs+.
24
Page 25

Dashboard
The following table describes the switch TACACS+ Dashboard controls:
Table 6 TACACS+ Dashboard controls
Control Description
Primary Tacacs+ IP Address Displays the primary TACACS+ server address.
Secondary Tacacs+ IP Address Displays the secondary TACACS+ server address.
Tacacs+ port Displays the number of the TCP port for TACACS+.
Tacacs+ timeout Displays the amount of time, in seconds, before a TACACS+ server
authentication attempt is considered to have failed.
Tacacs+ retries Displays the number of failed authentication requests before switching
to a different TACACS+ server.
Tacacs+ Server Displays the status of the TACACS+ server.
Tacacs+ Backdoor for Telnet
Tacacs+ Secure Backdoor for telnet/
ssh/http/https
Tacacs+ new privilege level mapping Displays the status of the TACACS+ new privilege-level mapping
Tacacs+ Secret Displays the shared secret between the switch and the TACACS+
Secondary Tacacs+ Server Secret Displays the secondary shared secret between the switch and the
Privilege level mappings
Remote Privilege Displays the TACACS+ server privilege levels.
Local mapping Displays the HP 1:10GbE switch privilege-level mapping.
Displays the status of the TACACS+ back door for telnet. The telnet
command also applies to SSH/SCP connections and the Browserbased Interface (BBI). This command does not apply when secure
backdoor (secbd) is enabled.
Displays the status of the TACACS+ back door using secure password
for telnet/SSH/ HTTP/HTTPS. This command does not apply when
backdoor (telnet) is enabled.
feature.
server(s).
TACACS+ server(s).
25
Page 26
Dashboard
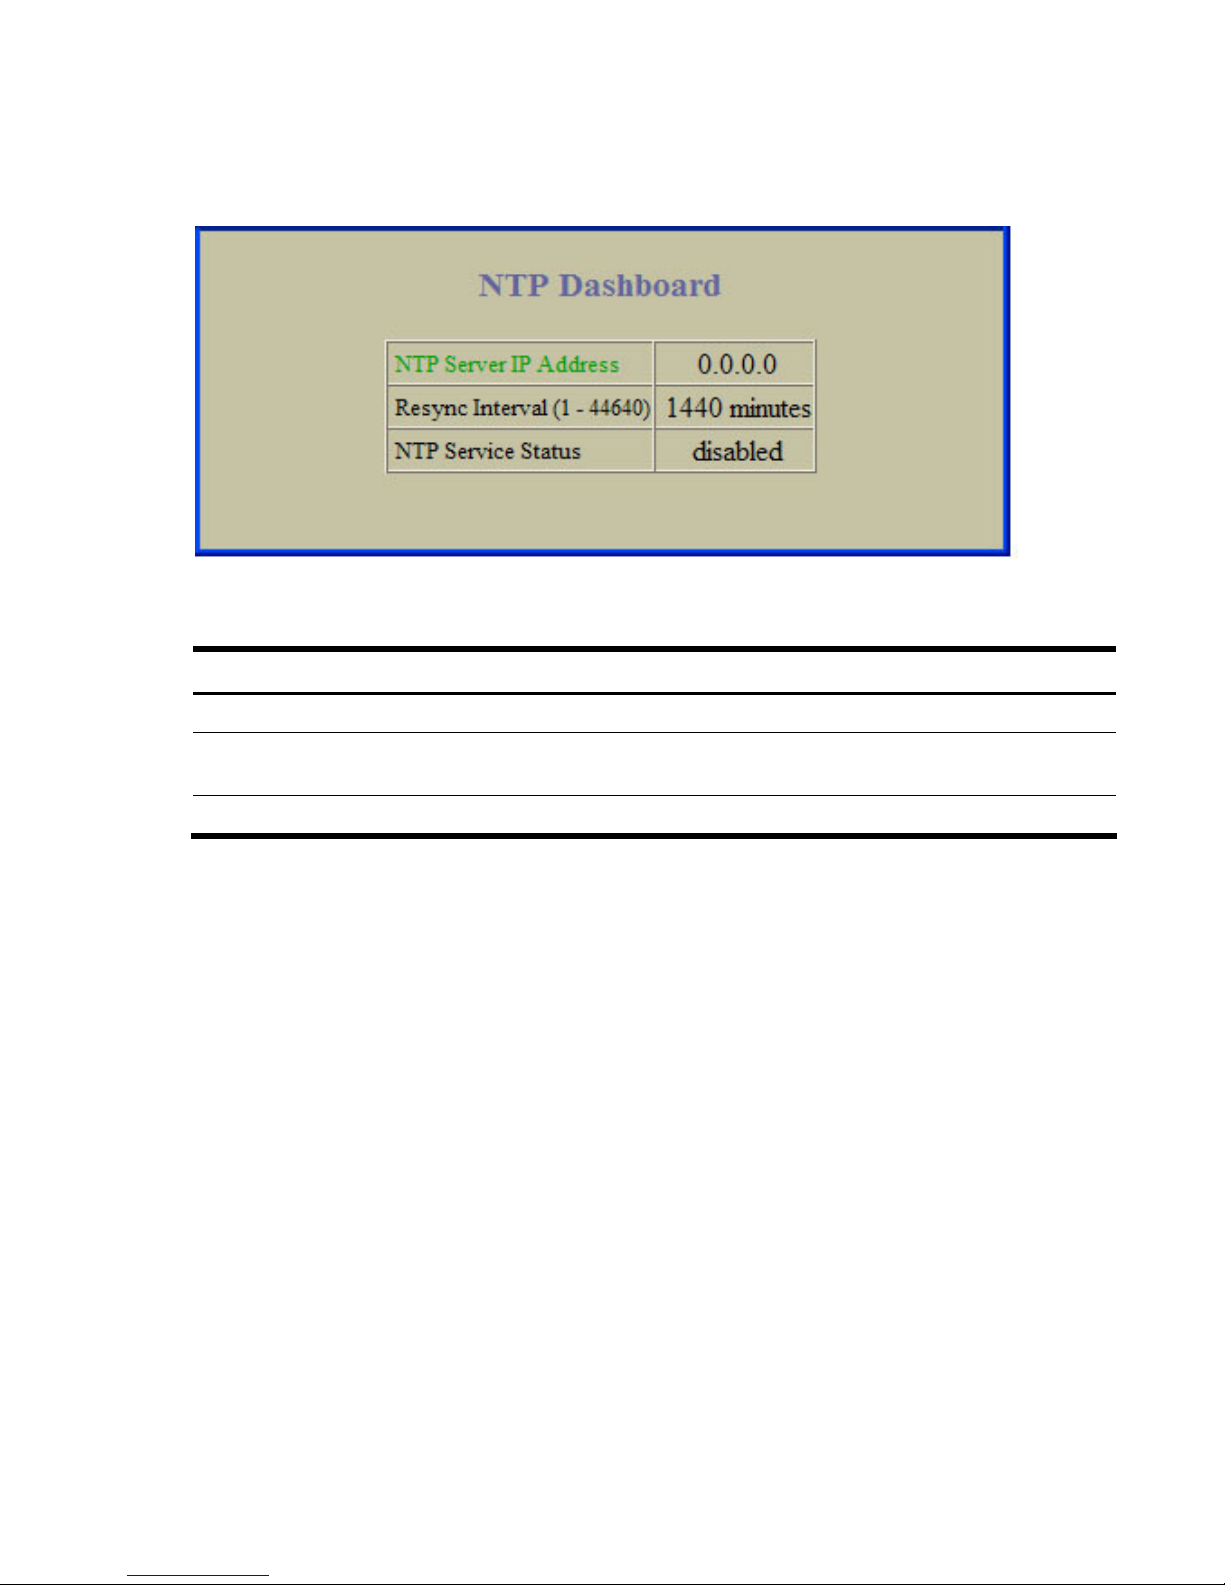
NTP Dashboard
To display the following form, select System > NTP.
The following table describes the Network Time Protocol Dashboard controls:
Table 7 NTP Dashboard controls
Control Description
NTP Server IP Address Displays the IP address of the active NTP server.
Resync Interval (1-44640) Displays the configured interval used to resynchronize the switch clock
with the NTP server.
NTP Service Status Displays the current NTP server status.
26
Page 27
Dashboard
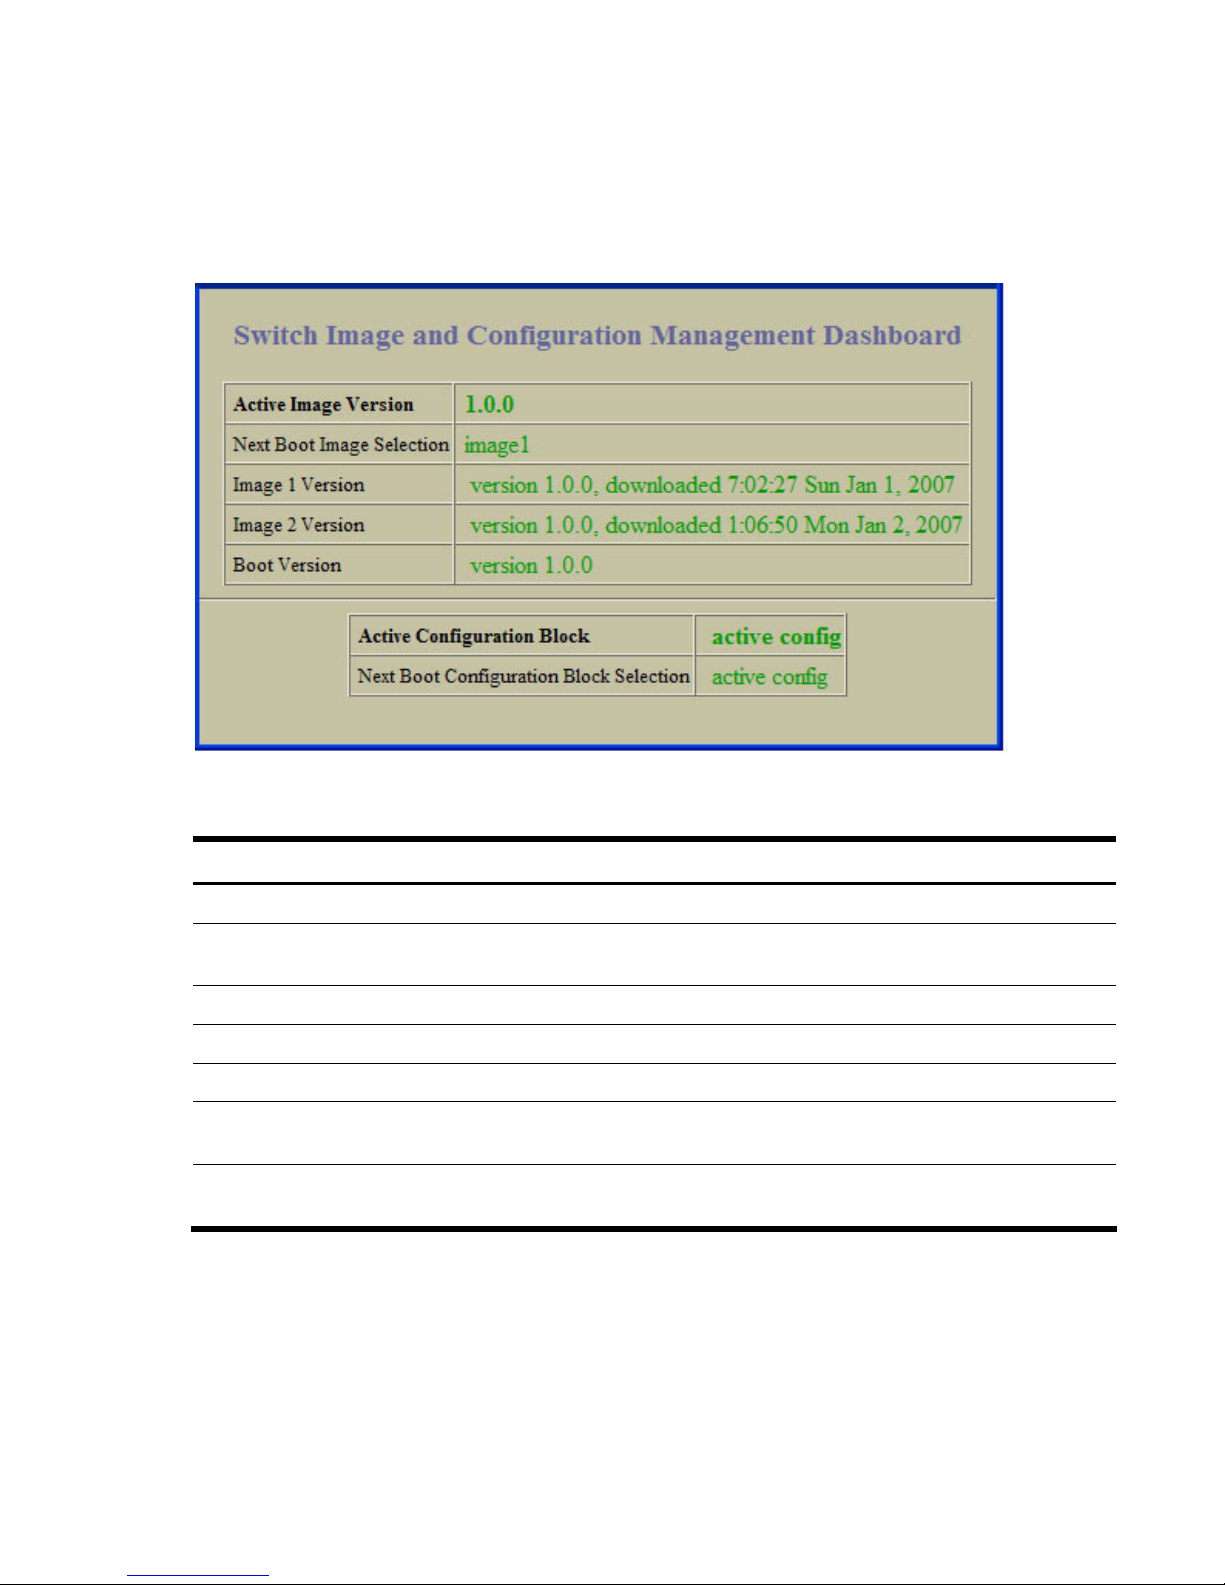
Switch Image and Configuration Management
Dashboard
To display the following form, select System > Config/Image Control.
The following table describes the Switch Image and Configuration Dashboard controls:
Table 8 Switch Image and Configuration Dashboard controls
Control Description
Active Image Version Displays the number of the active software image.
Next Boot Image Selection Displays which software image (image1 or image2) will be loaded
into switch memory for the next reboot.
Image 1 Version Displays information about the current Image 1 software.
Image 2 Version Displays information about the current Image 2 software.
Boot Version Displays the version number of the current Boot software.
Active Configuration Block Defines which configuration block is selected for the currently running
session.
Next Boot Configuration Block Selection Allows the user to select the configuration block to be loaded upon the
next reboot.
27
Page 28
Dashboard
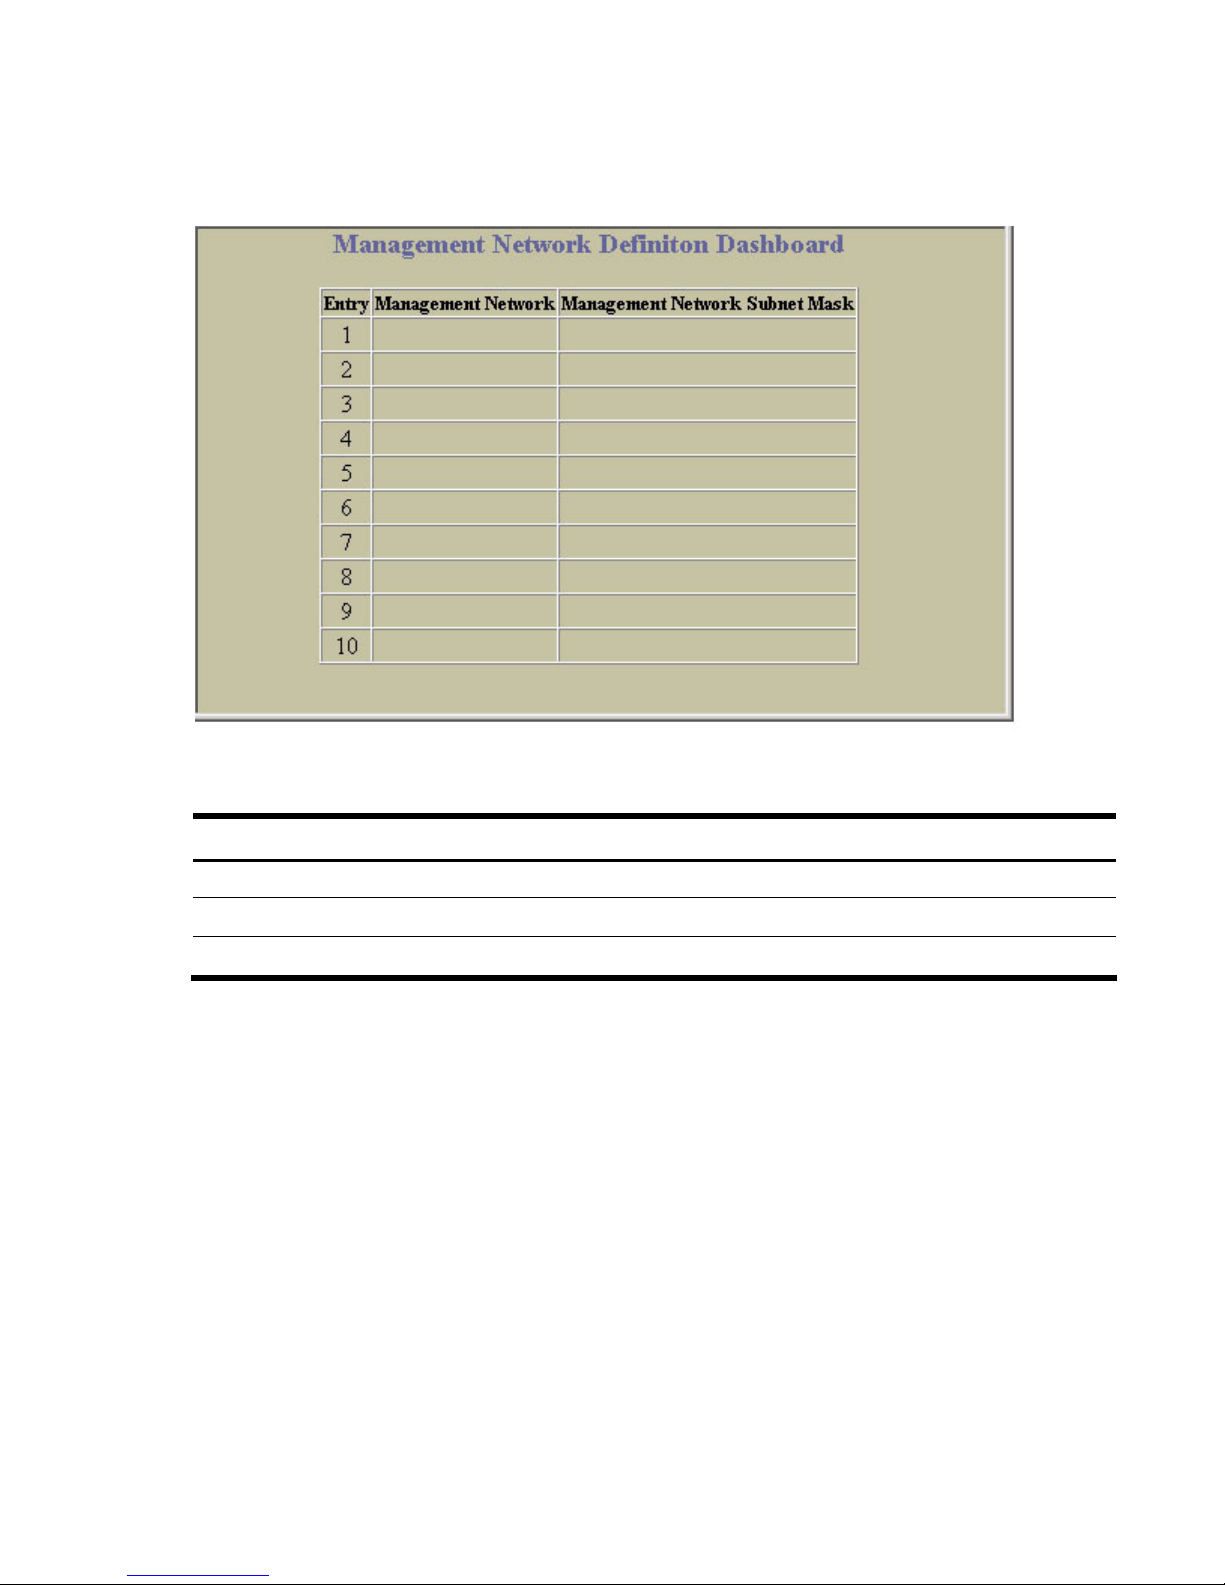
Management Network Definition Dashboard
To display the following form, select System > Mgmt.
The following table describes the Management Network Definition Dashboard controls:
Table 9 Management Network Definition Dashboard controls
Control Description
Entry Displays the entry number for each management network.
Management Network Displays the IP address of the management network.
Management Network Subnet Mask Displays the subnet mask of the management network.
28
Page 29
Dashboard
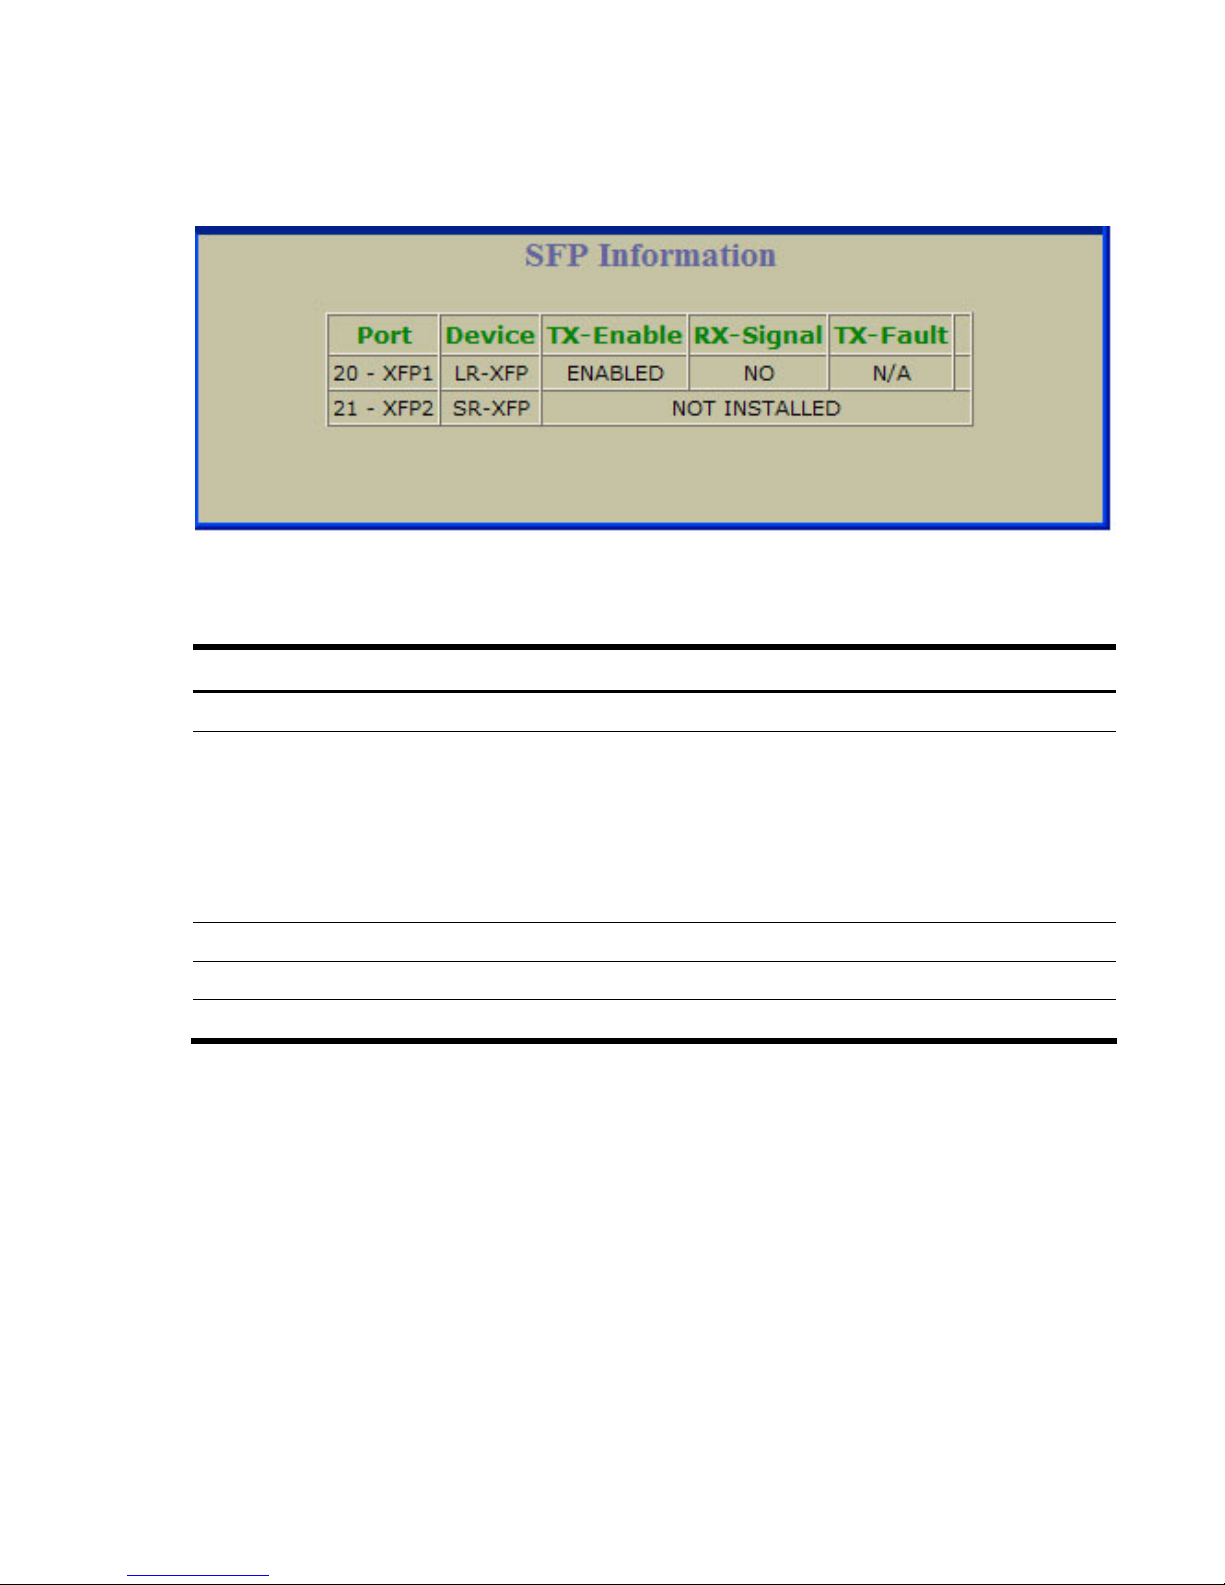
SFP Information
To display the following form, select System > SFP.
The following table describes the status of each Small Form Pluggable (SFP or XFP) module on each fiber
external port.
Table 10 SFP Information
Control Description
Port Displays the port number and SFP/XFP number.
Device Displays the transmission media and device type for the port, as follows:
• Media:
CU = Copper SFP
FI = Fiber SFP
SR = Short Range XFP
LR = Long Range XFP
• Device: SFP or XFP module
TX-Enable Displays the transmission status of the module (enabled or disabled).
RX-Signal Displays the link state of the module port (OK or LOST).
TX-Fault Displays the fault status of the module (none or FAULT).
29
Page 30
Dashboard
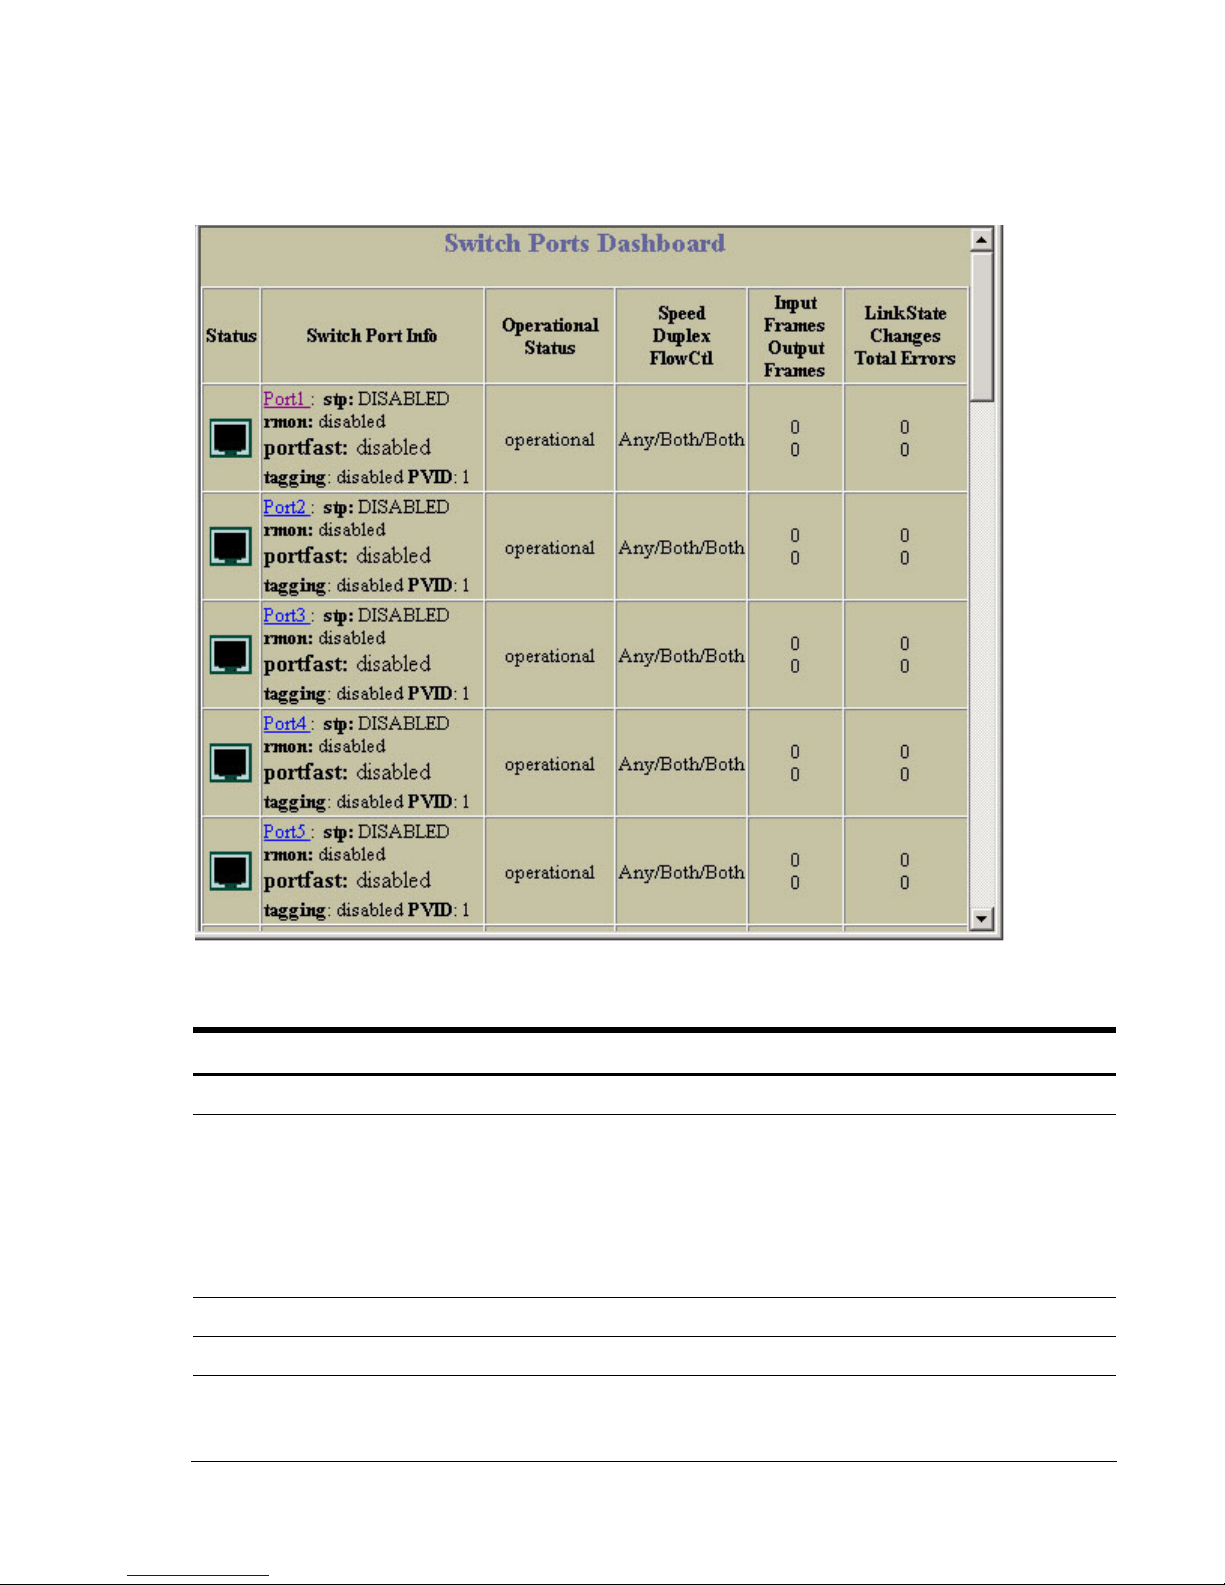
Switch Ports Dashboard
To display the following form, select Switch Ports (click the underlined text, not the folder).
The following table describes the Switch Ports Dashboard controls:
Table 11 Switch Ports Dashboard controls
Control Description
Status Shows if the port is enabled (green) or disabled (black).
Switch Port Info Summarizes the following port information:
Operational Status Displays the operational status of the port.
Speed/Duplex/Flow Ctl Displays parameters for the port link.
Input Frames/Output Frames Displays the number of frames that have been received by this port (Input
• STP: Shows if the port has Spanning Tree Protocol enabled or disabled.
• rmon: Shows if RMON is enabled or disabled.
• portfast: Shows if Port Fast Forwarding is enabled or disabled.
• tagging: Shows if this port has VLAN Tagging enabled or disabled.
• PVID: VLAN ID of any VLAN(s) to which this port is a member.
Frames) and the number of frames that have been transmitted by this port
(Output Frames).
30
Page 31
Dashboard
Table 11 Switch Ports Dashboard controls
Control Description
Link State Changes/Total Errors Displays the total number of link state changes for this port and the total
number of errors logged by this port.
For more information, select a port number to display detailed statistics for that port.
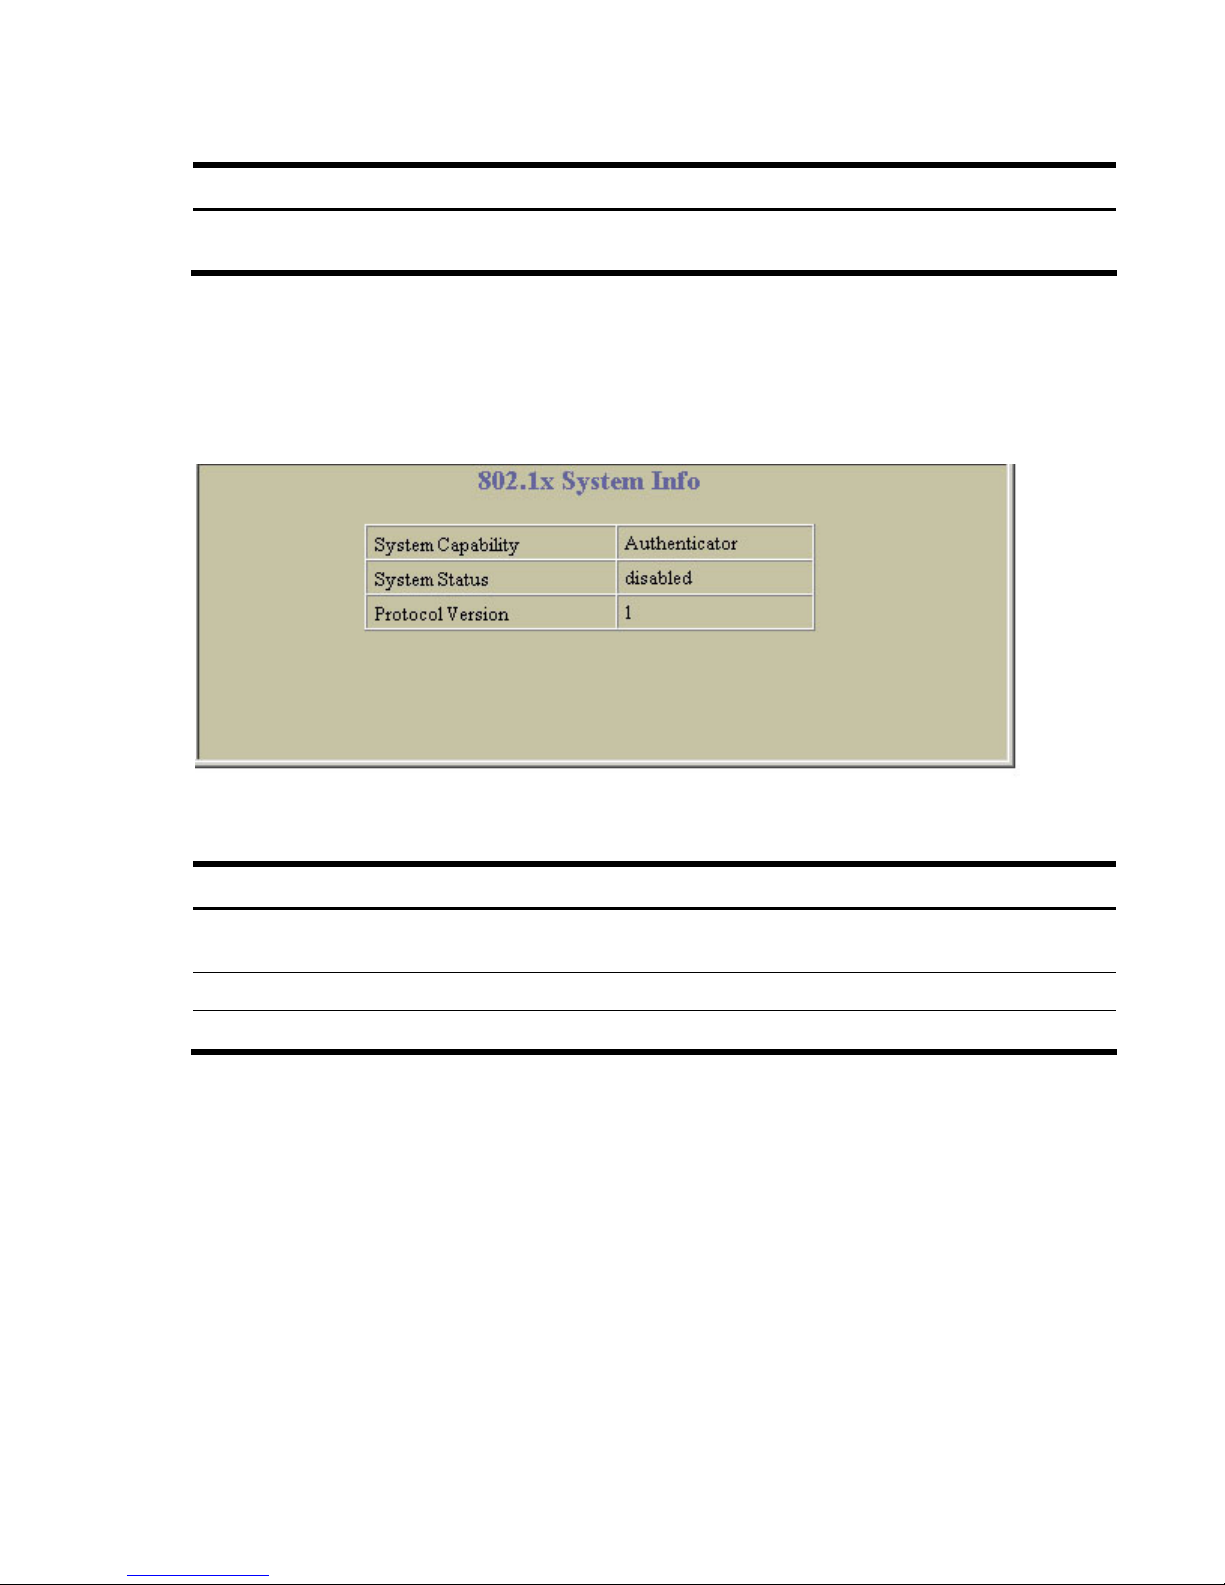
802.1x System Information
To display the following form, select Layer 2 > 802.1x > General.
The following table describes the 802.1x system information fields:
Table 12 802.1x System information
Control Description
System Capability Displays the capability of the switch as an 802.1x Authenticator. It cannot be
used as an Authentication Server or a Supplicant.
System Status Displays the current state (enabled or disabled) of 802.1x access control.
Protocol Version Displays the 802.1x protocol version number.
31
Page 32

Dashboard
Switch Ports 802.1x Dashboard
To display the following form, select Layer 2 > 802.1x > Switch Ports.
The following table describes the Switch Ports 802.1x Dashboard fields:
Table 13 Switch Ports 802.1x Dashboard
Field Description
Port Displays each port’s name.
Auth Mode Displays the Access Control authorization mode for the port. The Authorization mode
can be one of the following:
• force-unauth
• auto
• force-auth
Auth Status Displays the current authorization status of the port, either authorized or unauthorized.
Ctrl Dir Displays the controlled direction for the port, as follows:
• both: indicates that control is exerted over both incoming and outgoing traffic
through the controlled port.
• In: indicates that control is exerted only over incoming traffic through the controlled
port.
32
Page 33
Dashboard
Table 13 Switch Ports 802.1x Dashboard
Field Description
Authenticator PAE State Displays the Authenticator Port Access Entity State. The PAE state can be one of the
following:
• initialize
• disconnected
• connecting
• authenticating
• authenticated
• aborting
• held
• forceAuth
Backend Auth State Displays the Backend Authentication State. The Backend Authentication state can be
one of the following:
• request
• response
• success
• fail
• timeout
• idle
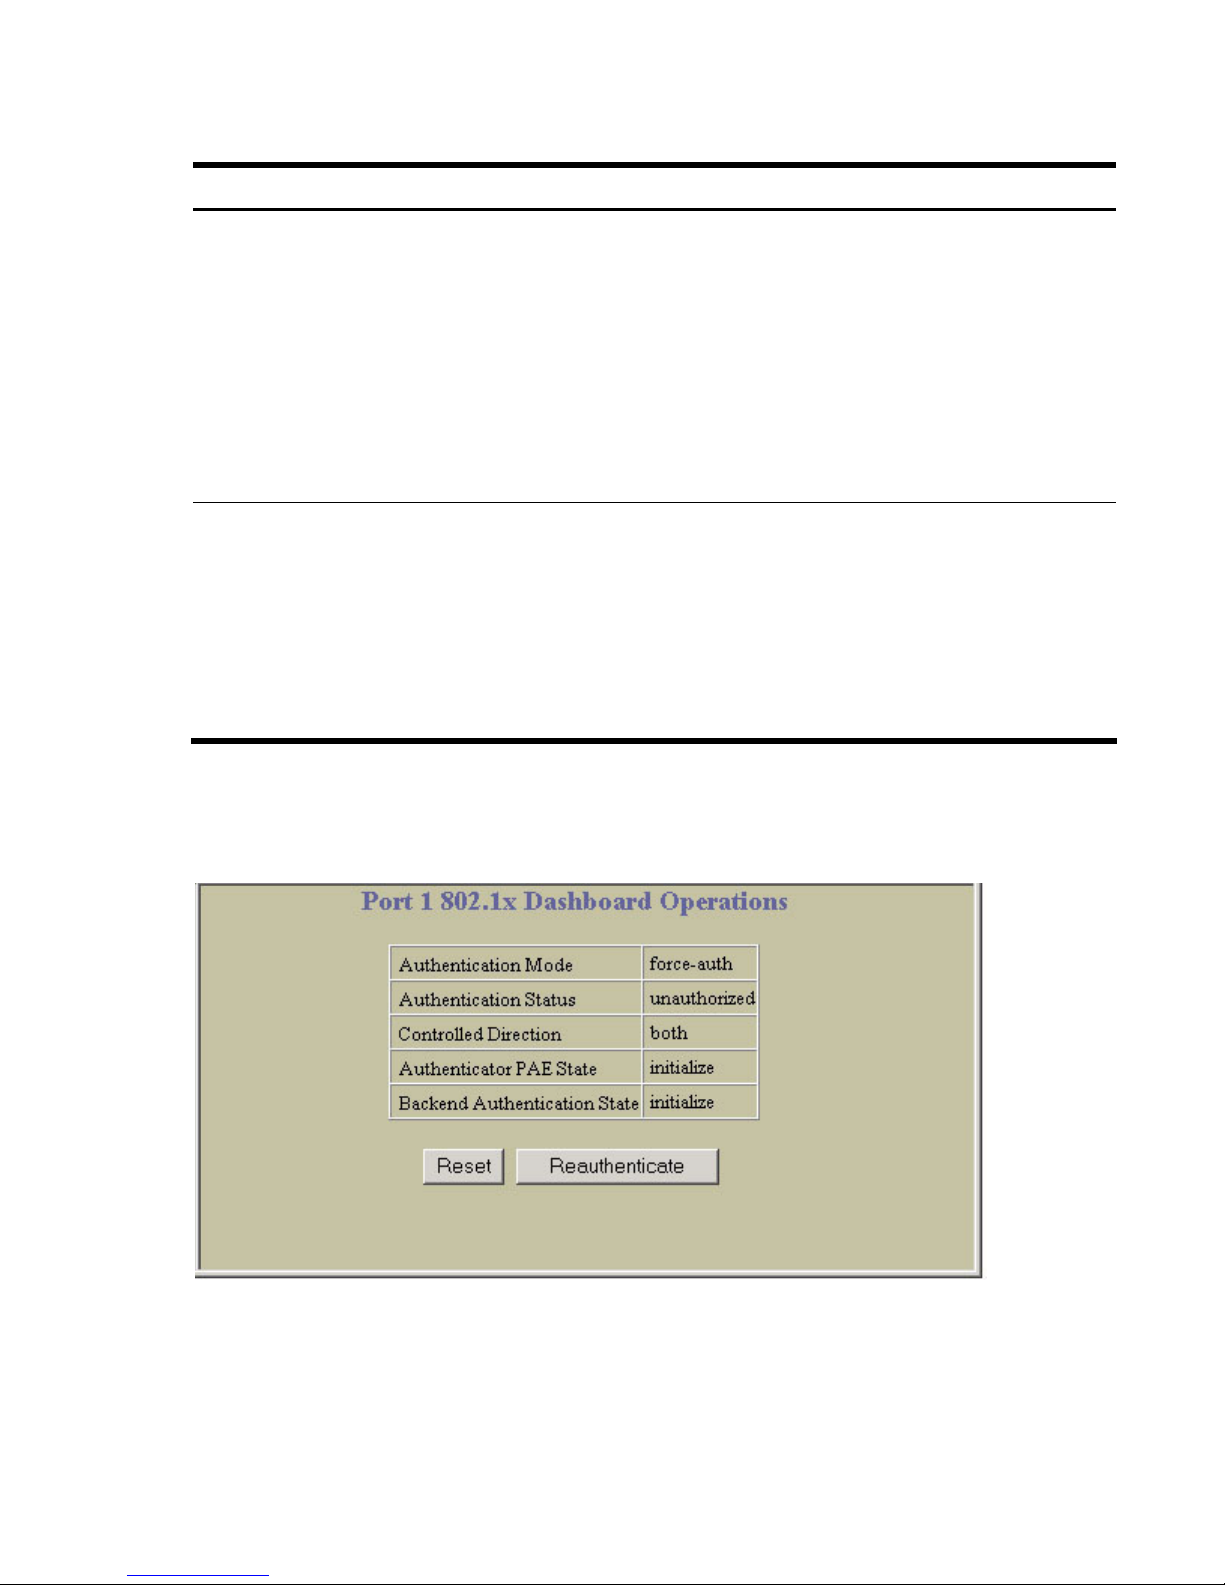
Port 802.1x Dashboard Operations
To display the following form, go to the Switch Ports 802.1x dashboard. Select a port number.
33
Page 34

Dashboard
The following table describes the Port 802.1x Dashboard controls:
Table 14 Port 802.1x Dashboard controls
Control Description
Authentication Mode Displays the Access Control authorization mode for the port. The
Authorization mode can be one of the following:
• force-unauth
• auto
• force-auth
Authentication Status Displays the current authorization status of the port, either authorized or
unauthorized.
Controlled Direction Displays the controlled direction for the port, as follows:
• both: indicates that control is exerted over both incoming and outgoing
traffic through the controlled port.
• In: indicates that control is exerted only over incoming traffic through the
controlled port.
Authenticator PAE State Displays the Authenticator Port Access Entity State. The PAE state can be one
of the following:
• initialize
• disconnected
• connecting
• authenticating
• authenticated
• aborting
• held
• forceAuth
Backend Authentication State Displays the Backend Authentication State. The Backend Authentication state
can be one of the following:
• request
• response
• success
• fail
• timeout
• idle
Reset Re-initializes the 802.1x access-control parameters for the port. The following
actions take place, depending on the 802.1x port configuration:
• force unauth: the port is placed in unauthorized state, and traffic is
blocked.
• auto: the port is placed in unauthorized state, then authentication is
initiated.
• force auth: the port is placed in authorized state, and authentication is not
required.
Reauthenticate Re-authenticates the supplicant (client) attached to the port. This command
only applies if the port’s 802.1x mode is configured as auto.
34
Page 35
Dashboard
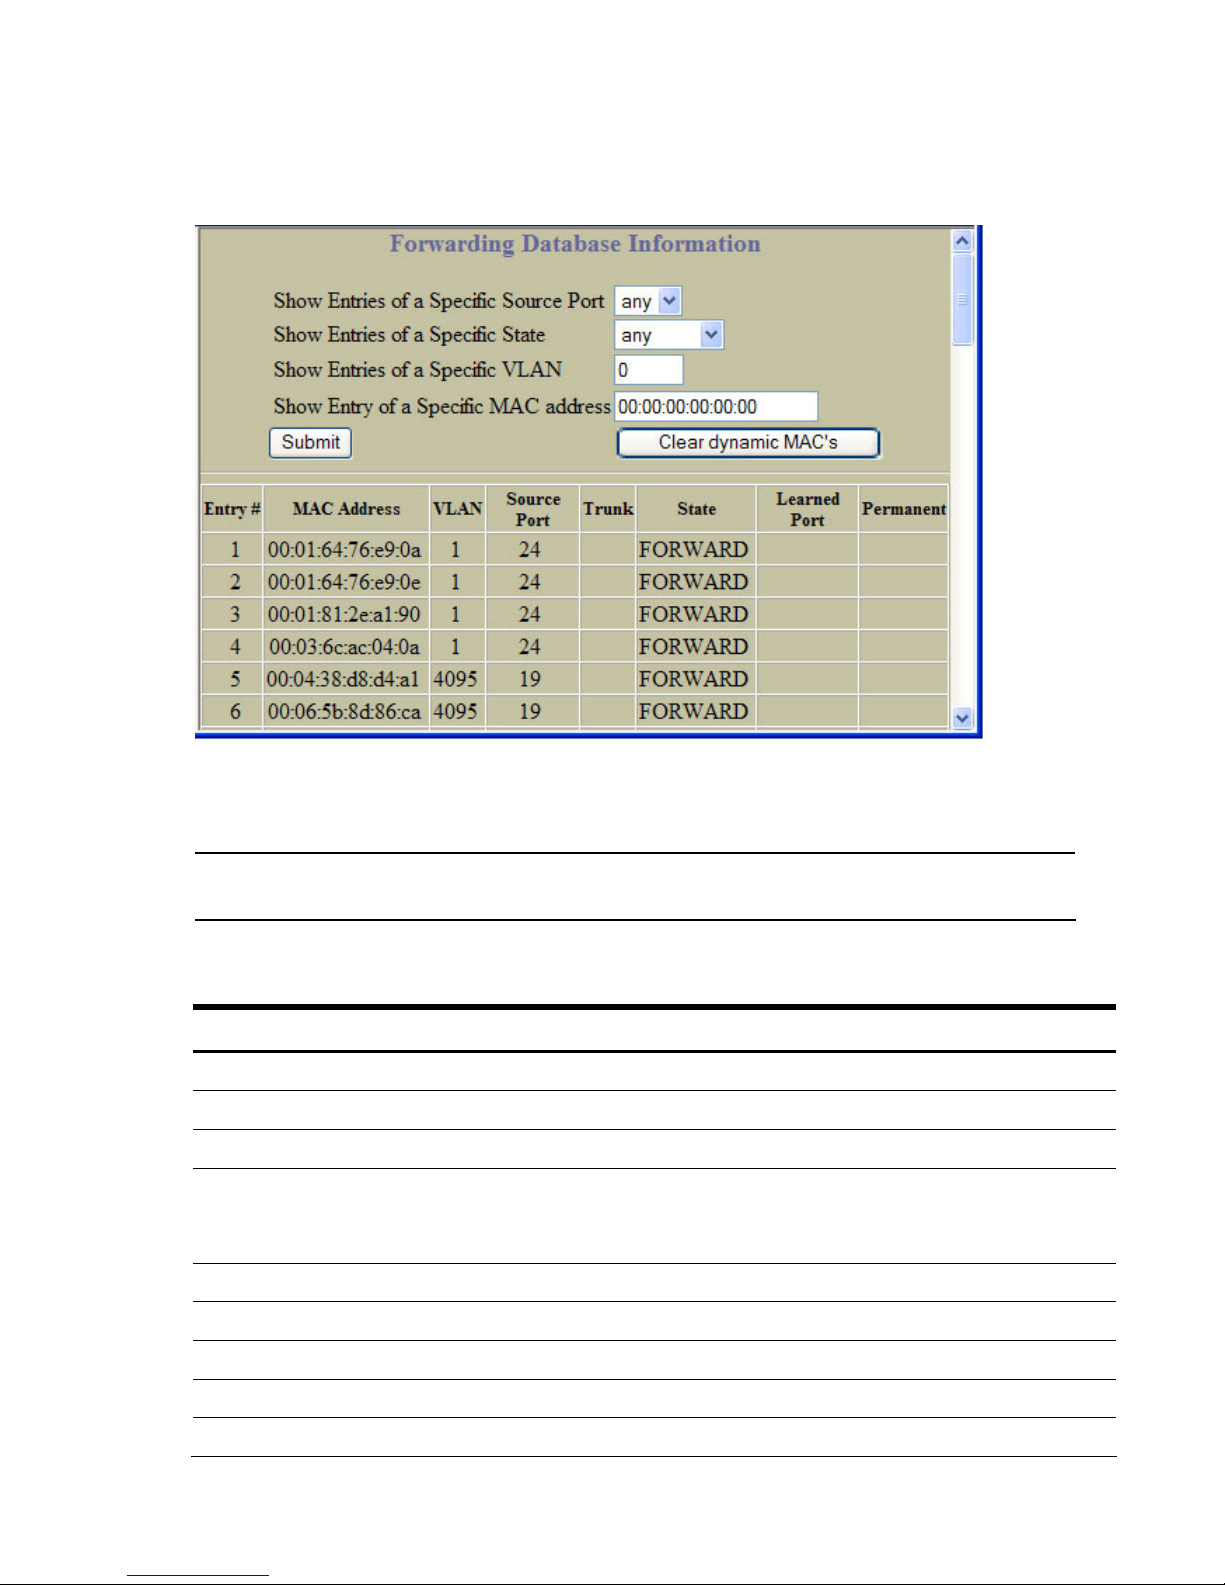
Forwarding Database Information
To display the following form, select Layer 2 > FDB.
The forwarding database (FDB) contains information that maps the media access control (MAC) address
of each known device to the switch port where the device address was learned. The FDB also shows
which other ports have seen frames destined for a particular MAC address.
NOTE: The master forwarding database supports up to 8K MAC address entries on the MP per
switch.
The following table describes the Forwarding Database Information controls:
Table 15 Forwarding Database Information controls
Control Description
Show Entries of a Specific Source Port Displays FDB entries for the selected port(s).
Show Entries of a Specific State Displays FDB entries by state.
Show Entries of a Specific VLAN Displays FDB entries for the selected VLAN.
Show Entry of a Specific MAC address Displays a single FDB entry by IP address.
Enter the MAC address using the format, xx:xx:xx:xx:xx:xx.
For example, 08:00:20:12:34:56
Clear Dynamic MACs Removes learned FDB entries.
Entry # Displays the numeric identifier of the FDB entry.
MAC Address Displays the MAC address of the FDB entry.
VLAN Displays the VLAN number of the FDB entry.
Source Port Displays the source port of the FDB entry.
35
Page 36

Dashboard
Table 15 Forwarding Database Information controls
Control Description
Trunk Displays the trunk number of the FDB entry, if applicable.
State Displays the port state of the FDB entry.
Learned Port Displays the port number of the port that received the FDB entry.
Permanent Displays whether the FDB entry is a static, permanent entry.
An address that is in the forwarding (FORWARD) state means that the switch has learned it. When in the
trunking (TRUNK) state, the port field represents the trunk group number. If the state for the port is listed as
unknown (UNKNOWN), the MAC address has not yet been learned by the switch, but has only been seen
as a destination address. When an address is in the unknown state, no outbound port is indicated.
VLANs Dashboard
To display the following form, select Layer 2 > Virtual LANs (click the underlined text, not the folder).
This form displays information for all configured VLANs and all member ports that have an active link
state.
36
Page 37

Dashboard
The following table describes the VLANs Dashboard controls:
Table 16 VLANs Dashboard controls
Control Description
Search Range To search for a VLAN, enter a range of VLAN numbers in the From and To fields.
Search Options To focus the search for a VLAN, enter optional search parameters:
• VLAN Name
• VLAN State
Fields that have a value of “any” are ignored during the search.
Choose a search operation:
• or: Search for VLANS specified in the search range that meet any of the criteria
entered.
• and: Search for VLANS specified in the search range that meet all of the criteria
entered.
Click Search to display VLANS that fit the range and meet the criteria entered.
VLAN ID Displays the numeric identifier of the VLAN.
VLAN Name Displays the name of the VLAN.
VLAN Ports Displays the port numbers of ports that are members of the VLAN.
State Shows if the VLAN is enabled or disabled.
37
Page 38

Dashboard
Switch Spanning Tree Groups Information
To display the following form, select Layer 2 > Spanning Tree Groups (click the underlined text, not
the folder).
38
Page 39

Dashboard
The following table describes the Switch Spanning Tree Groups Information controls:
Table 17 Switch Spanning Tree Groups Information controls
Control Description
Search Range To search for a Spanning Tree Group, enter a range of group numbers in the From
and To fields.
Search Options To focus the search for a Spanning Tree Group, enter optional search parameters:
• Bridge Priority
• Spanning Tree State
Fields that have a value of “any” are ignored during the search.
Choose a search operation:
• or: Search for spanning tree groups specified in the search range that meet any
of the criteria entered.
• and: Search for spanning tree groups specified in the search range that meet
all of the criteria entered.
Click Search to display spanning tree groups that fit the range and meet the
criteria entered.
Spanning Tree Group Displays the numeric identifier of the Spanning Tree Group.
State Shows if Spanning Tree is turned on or off for the port.
Bridge Priority Controls which bridge on the network will become the STP root bridge.
This command does not apply to MSTP.
Bridge Hello Time Specifies, in seconds, how often the root bridge transmits a configuration bridge
protocol data unit (BPDU). Any bridge that is not the root bridge uses the root
bridge hello value.
This command does not apply to MSTP.
Bridge Max Age Specifies, in seconds, the maximum time the bridge waits without receiving a
configuration bridge protocol data unit before it reconfigures the STP network. If the
bridge is not the root bridge, it uses the MaxAge value of the root bridge.
This command does not apply to MSTP.
Bridge Forward Delay Specifies, in seconds, the amount of time that a bridge port has to wait before it
changes from learning state to forwarding state. If the bridge is not the root bridge,
it uses the Forward Delay value of the root bridge.
This command does not apply to MSTP.
Bridge Aging Time Specifies, in seconds, the amount of time the bridge waits without receiving a
packet from a station before removing the station from the Forwarding Database.
Select a Spanning Tree Group number to display detailed information.
39
Page 40
Dashboard
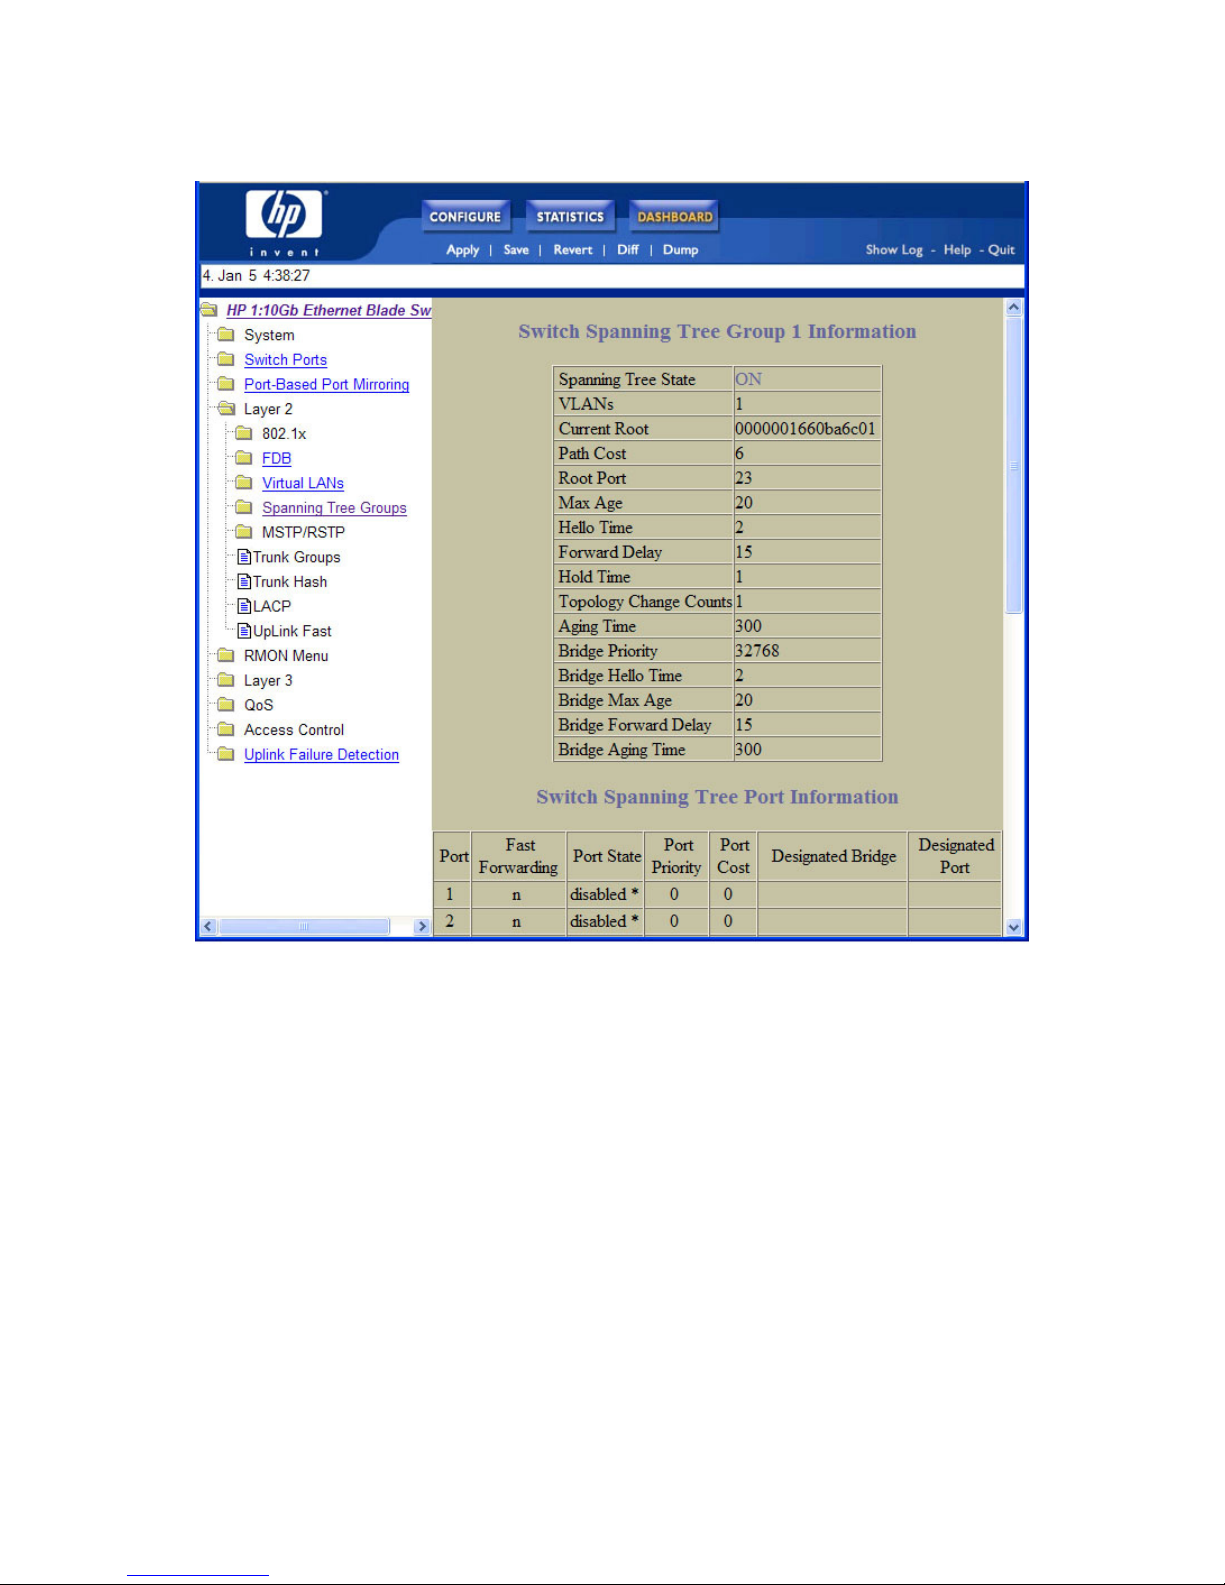
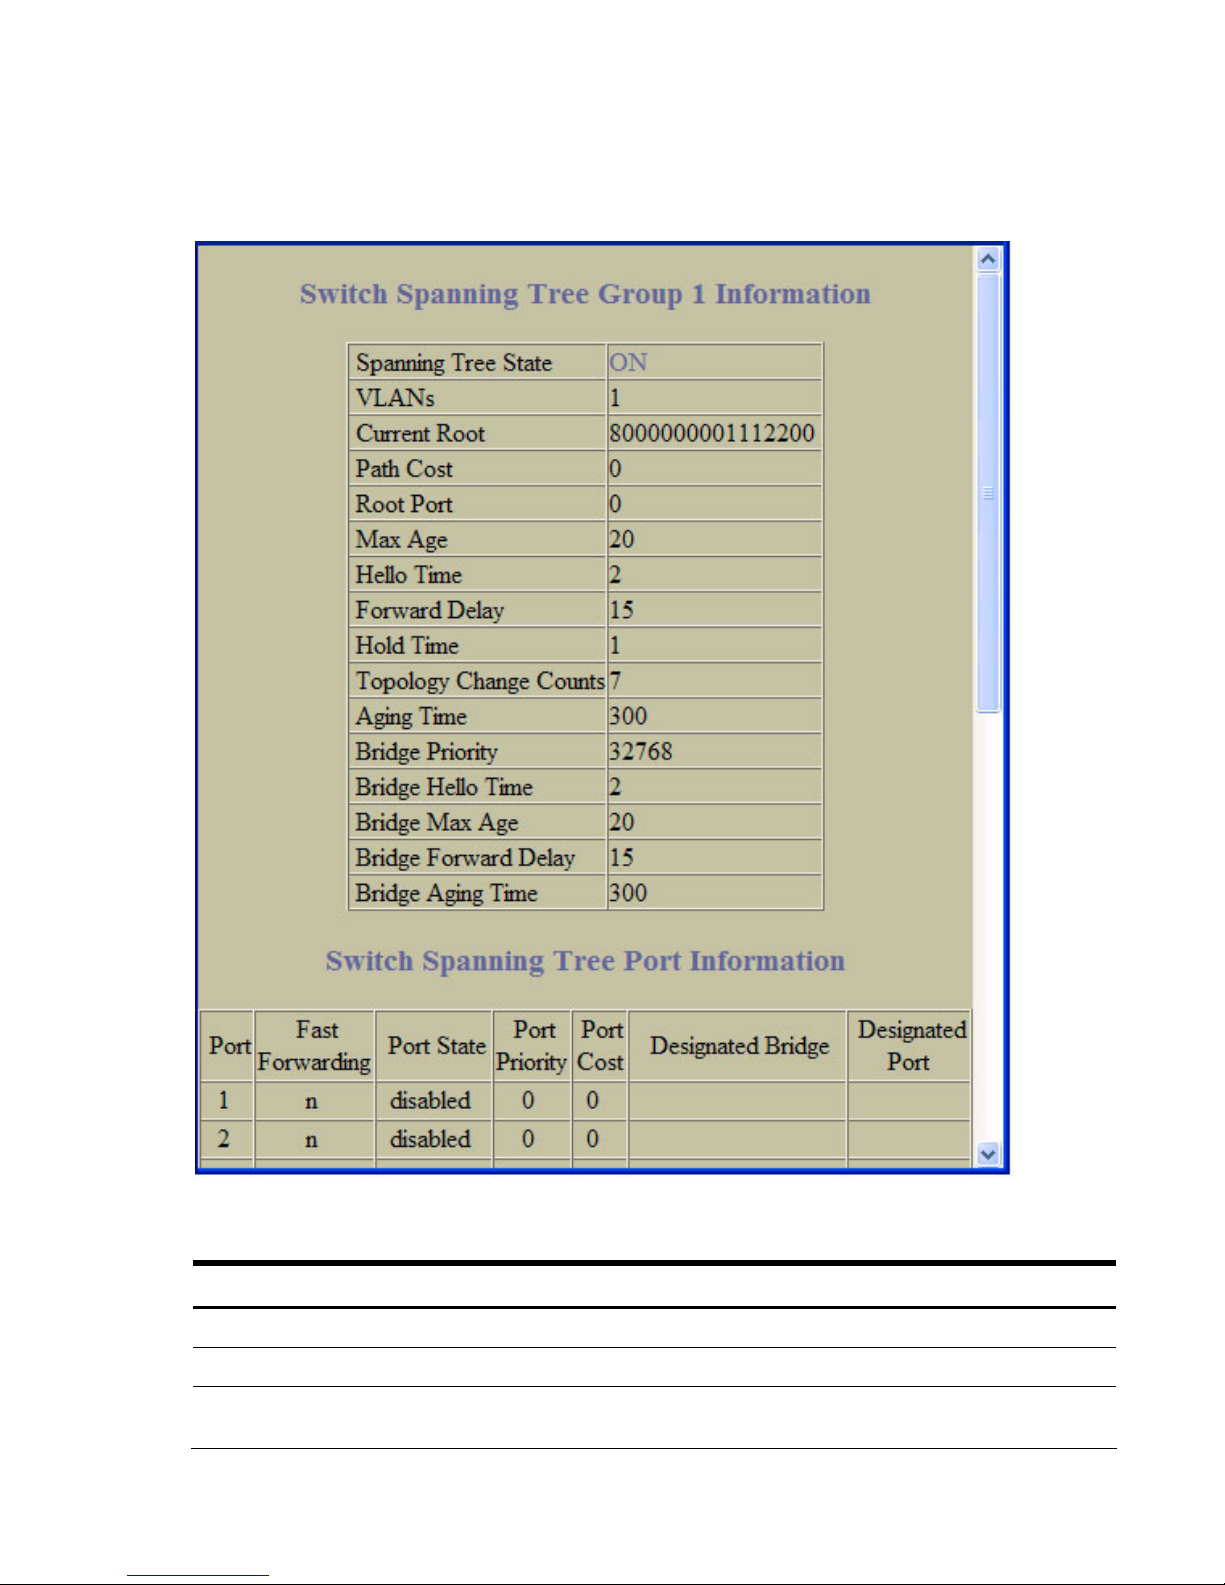
Switch Spanning Tree Group Information
To display the following form, go to the Switch Spanning Tree Groups Information form. Select a
Spanning Tree Group number.
The following table describes the Switch Spanning Tree Group Information controls:
Table 18 Switch Spanning Tree Group Information controls
Control Description
Spanning Tree State Shows if Spanning Tree is turned on or off for the switch.
VLANs Displays the VLANs that are members of this Spanning Tree Group.
Current Root Displays information about the root bridge for the Spanning Tree. Information
includes the priority (hex) and MAC address of the root.
40
Page 41

Dashboard
Table 18 Switch Spanning Tree Group Information controls
Control Description
Path Cost Displays the cumulative path cost to the Current Root.
Root Port Displays the switch port that is connected to the Current Root.
Max Age Specifies, in seconds, the maximum time the bridge waits without receiving a
configuration bridge protocol data unit before it reconfigures the STP network. If
the bridge is not the root bridge, it uses the MaxAge value of the root bridge.
Hello Time Specifies, in seconds, how often the root bridge transmits a configuration bridge
protocol data unit (BPDU). Any bridge that is not the root bridge uses the root
bridge hello value.
Forward Delay Specifies, in seconds, the amount of time that a bridge port has to wait before it
changes from learning state to forwarding state. If the bridge is not the root
bridge, it uses the Forward Delay value of the root bridge.
Hold Time Displays the minimum number of seconds that must elapse between transmissions
of consecutive configuration BPDUs on a port.
Topology Change Counts Displays the number of times the spanning tree topology has changed.
Aging Time Specifies, in seconds, the amount of time the bridge waits without receiving a
packet from a station before removing the station from the Forwarding Database.
Bridge Priority Controls which bridge on the network will become the STP root bridge.
Bridge Hello Time Specifies, in seconds, how often the root bridge transmits a configuration bridge
protocol data unit (BPDU). Any bridge that is not the root bridge uses the root
bridge hello value.
Bridge Max Age Specifies, in seconds, the maximum time the bridge waits without receiving a
configuration bridge protocol data unit before it reconfigures the STP network.
Bridge Forward Delay Specifies, in seconds, the amount of time that a bridge port has to wait before it
changes from learning state to forwarding state.
Bridge Aging Time Specifies, in seconds, the amount of time the bridge waits without receiving a
packet from a station before removing the station from the Forwarding Database.
Switch Spanning Tree Port Information
The following table describes the STP port parameters:
Table 19 Switch Spanning Tree Port Information controls
Control Description
Port Displays the port number for each port’s STP information.
Spanning Tree State Shows if Spanning Tree is turned on or off for the port.
Port State
Shows the current state of the port. The state field can be blocking, listening,
learning, forwarding, or disabled.
The State field in RSTP or MSTP mode can be one of the following: Discarding
(DISC), Learning (LRN), Forwarding (FWD), or Disabled (DSB).
41
Page 42

Dashboard
Table 19 Switch Spanning Tree Port Information controls
Control Description
Port Priority Helps determine which bridge port becomes the designated port. In a network
topology that has multiple bridge ports connected to a single segment, the port with
the lowest port priority becomes the designated port for the segment.
Port Cost Helps determine the designated port for a segment. Generally speaking, the faster the
port, the lower the path cost. A setting of 0 indicates that the cost will be set to the
appropriate default after the link speed has been auto-negotiated.
Designated Bridge Shows information about the bridge connected to each port, if applicable. Information
includes the priority (hex) and MAC address of the Designated Bridge.
Designated Port Displays the port ID of the port on the Designated Bridge to which this port is
connected. This information includes the port priority (hex) and the port number (hex).
Switch Trunk Groups Dashboard
To display the following form, select Layer 2 > Trunk Groups.
When trunk groups are configured, you can view the state of each port in the various trunk groups.
NOTE: If Spanning Tree Protocol on any port in the trunk group is set to forwarding, the remaining
ports in the trunk group will also be set to forwarding.
42
Page 43

Dashboard
The following table describes the Switch Trunk Groups Dashboard controls:
Table 20 Switch Trunk Groups Dashboard controls
Control Description
Status For each port in the Trunk Group, shows whether the port is down (red), up and
forwarding (green) or in blocking state.
Trunk Group Displays the numeric identifier of the Trunk Group.
Switch Port Displays the port number of each port that is a member of the Trunk Group.
STG Displays the Spanning Tree Group to which this trunk belongs.
Trunk Hash Dashboard
To display the following form, select Layer 2 > Trunk Hash.
The following table describes the Layer 2 (L2) Trunk Hash Dashboard controls:
Table 21 Trunk Hash Dashboard controls
Control Description
Smac Hash Displays the status of the source MAC hash: enabled or disabled.
Dmac Hash Displays the status of the destination MAC hash: enabled or disabled.
Sip Hash Displays the status of the source IP hash: enabled or disabled.
Dip Hash Displays the status of the source IP hash: enabled or disabled.
43
Page 44

Dashboard
LACP Dashboard
To display the following form, select Layer 2 > LACP.
The following table describes the Switch LACP Dashboard controls:
Table 22 LACP Dashboard controls
Control Description
Switch Port Displays the port number.
LACP Mode Displays the port’s LACP mode (active, passive, or off).
LACP Adminkey
LACP Operkey
LACP Selected Indicates whether the port has been selected to be part of a Link Aggregation Group.
Port Priority Shows the value of the port priority.
Attached Aggr Displays the aggregator associated with each port.
Trunk Displays the value that represents the LACP trunk group number.
Displays the value of the port’s adminkey.
Displays the value of the port’s operkey.
44
Page 45

Dashboard
LACP Port Dashboard
To display the following form, go to the Switch LACP Dashboard. Select a port number.
This form summarizes LACP port information.
45
Page 46

Dashboard
Uplink Fast General Information
To display the following form, select Layer 2 > Uplink Fast.
The following table describes the Uplink Fast Information controls:
Table 23 Uplink Fast General Information controls
Control Description
STP Uplink Fast Mode Displays the status of STP Uplink Fast: ON or OFF.
STP Uplink Fast Rate Displays the value of the Uplink Fast station update rate, in seconds.
46
Page 47

Dashboard
RMON History Group Information
To display the following form, select RMON > History (click the underlined text, not the folder).
This form displays information for all configured RMON History Groups.
The following table describes the RMON History Group Dashboard controls:
Table 24 RMON History Group Dashboard controls
Control Description
Search Range To search for a History Group, enter a range of numbers in the From and To fields.
Search Options To focus the search for a History Group, enter optional search parameters:
• MIB OID
• Number of buckets requested
Fields that have a value of “any” are ignored during the search.
Choose a search operation:
• or: Search for History Groups specified in the search range that meet any of the
criteria entered.
• and: Search for History Groups specified in the search range that meet all of
the criteria entered.
Click Search to display History Groups that fit the range and meet the criteria
entered.
RMON History Group ID Displays the numeric identifier of the History Group.
MIB Object Displays the MIB Object Identifier.
Number of Buckets Requested Displays the number of requested buckets, which is the number of data slots into
Granted Buckets Displays the number of granted buckets that may hold sampled data.
Polling Interval Displays the time interval for each sampling bucket.
which data is to be saved.
47
Page 48

Dashboard
Table 24 RMON History Group Dashboard controls
Control Description
Owner Displays a text string that identifies the person or entity that created this History
Group.
RMON Alarm Group Information
To display the following form, select RMON > Alarm (click the underlined text, not the folder).
This form displays information for all configured RMON Alarm Groups.
48
Page 49

Dashboard
The following table describes the RMON Alarm Group Dashboard controls:
Table 25 RMON Alarm Group Dashboard controls
Control Description
Search Range To search for a RMON Alarm Group, enter a range of numbers in the From and To fields.
Search Options To focus the search for a RMON Alarm, enter optional search parameters:
• MIB OID
• Interval
• Rising Limit
• Falling Limit
• Rising Event Index
• Falling Event Index
• Alarm Type
• Sample Type
Fields that have a value of “any” are ignored during the search.
Choose a search operation:
• or: Search for Alarms specified in the search range that meet any of the criteria
entered.
• and: Search for Alarms specified in the search range that meet all of the criteria
entered.
Click Search to display RMON Alarms that fit the range and meet the criteria entered.
RMON Alarm Group ID Displays the numeric identifier of the Alarm Group.
MIB Object Displays the MIB Object Identifier.
Polling Interval Displays the time interval over which data is sampled and compared with the rising and
falling thresholds.
Last Value Displays the most recent value sampled.
Rising Limit Displays the rising threshold for the sampled statistic.
Falling Limit Displays the falling threshold for the sampled statistic.
Rising Alarm Index Displays the rising alarm event index that is triggered when a rising threshold is crossed.
Falling Alarm Index Displays the falling alarm event index that is triggered when a falling threshold is crossed.
Alarm Type Displays the alarm type as rising, falling, or either (rising or falling).
Sample Type Displays the method of sampling the selected variable and calculating the value to be
compared against the thresholds, as follows:
• abs: absolute value, the value of the selected variable is compared directly with the
thresholds at the end of the sampling interval.
• delta: delta value, the value of the selected variable at the last sample is subtracted
from the current value, and the difference compared with the thresholds.
Owner Displays a text string that identifies the person or entity that created this Alarm Group.
49
Page 50
Dashboard
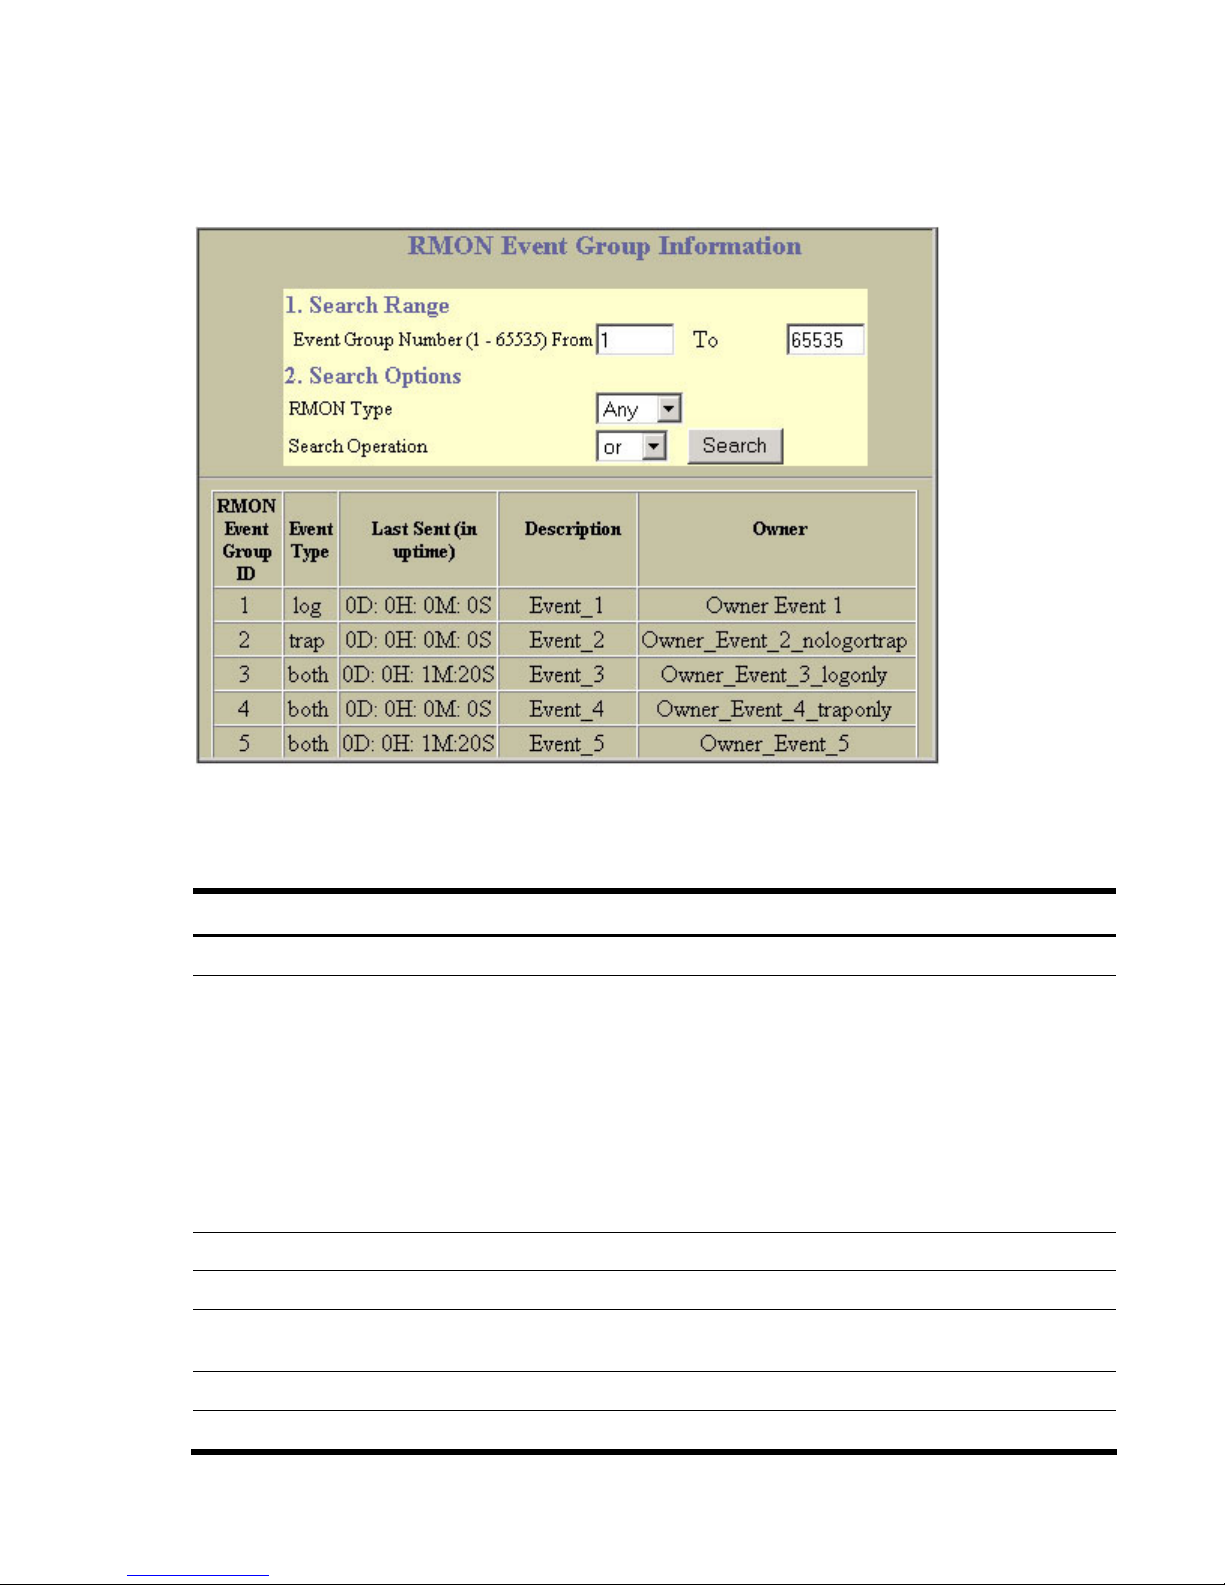
RMON Event Group Information
To display the following form, select RMON > Event (click the underlined text, not the folder).
This form displays information for all configured RMON Event Groups.
The following table describes the RMON Event Group Dashboard controls:
Table 26 RMON Event Group Dashboard controls
Control Description
Search Range To search for a RMON Event Group, enter a range of numbers in the From and To fields.
Search Options To focus the search for an Event Group, enter optional search parameters:
• RMON Type
Fields that have a value of “any” are ignored during the search.
Choose a search operation:
• or: Search for Events specified in the search range that meet any of the criteria
entered.
• and: Search for Events specified in the search range that meet all of the criteria
entered.
Click Search to display Events that fit the range and meet the criteria entered.
RMON Event Group ID Displays the numeric identifier of the Event Group.
Event Type Displays the type of notification provided for this event, as follows: none, log, trap, both.
Last Sent Displays the time that passed since the last switch reboot, when the most recent event was
triggered. This value is cleared when the switch reboots.
Description Displays a text description of the event.
Owner Displays a text string that identifies the person or entity that created this Event Group.
50
Page 51

Dashboard
IP Interfaces Dashboard
To display the following form, select Layer 3 > IP Interfaces (click the underlined text, not the folder).
The following table describes the IP Interfaces Dashboard controls:
Table 27 IP Interfaces Dashboard controls
Control Description
Search Range To search for an IP Interface, enter a range of IP Interface numbers in the From and To fields.
Search Options To focus the search for an IP Interface, enter optional search parameters:
• IP Address
• Subnet Mask
• VLAN ID number
• IP Interface State
Fields that have a value of “any” are ignored during the search.
Choose a search operation:
• or: Search for IP Interfaces specified in the search range that meet any of the criteria
entered.
• and: Search for IP Interfaces specified in the search range that meet all of the criteria
entered.
Click Search to display IP Interfaces that fit the range and meet the criteria entered.
Status Shows the IP Interface status: enabled (green), disabled (red), or enabled but down (blue).
IP Interface ID Displays the numeric identifier of the IP Interface.
IP Address Displays the IP address of the IP Interface.
Subnet Mask Displays the Subnet Mask of the IP Interface.
Broadcast Address Displays the IP Broadcast address for this IP Interface.
51
Page 52

Dashboard
Table 27 IP Interfaces Dashboard controls
Control Description
VLAN ID Displays the VLAN number for this interface. Each interface can belong to one VLAN,
although any VLAN can have multiple IP interfaces in it.
Route Table Information
To display the following form, select Layer 3 > Network Routes (click the underlined text, not the
folder).
52
Page 53

Dashboard
The following table describes the Route Table Information controls:
Table 28 Route Table Information controls
Control Description
Search Operation To focus the search for an IP static route, enter search parameters:
• Route Type
• Route Tag
• Routes for a Destination IP
• Routes to a Gateway IP
• Route for an IP Interface
Fields that have a value of “any” are ignored during the search.
Choose a search operation:
• or: Search for network routes specified in the Search range that meet any of the
criteria entered.
• and: Search for network routes specified in the Search range that meet all of the
criteria entered.
Click Search to display network routes that fit the range and meet the criteria entered.
Entry # Displays the entry number for each route.
Destination Displays the destination IP address fore the IP route.
Mask Displays the subnet mask for the IP route.
Gateway Displays the IP address of the gateway associated with the IP route.
Type Displays the IP route type. See the IP Routing Type information table for more detail.
Tag Displays the IP route tag. See the IP Routing Tag information table for more detail.
Metric Displays the value of the IP route metric.
IF Displays the interface number associated with the IP route.
The following table describes the Route Table Type parameter.
Table 29 IP Routing Type information
Field Description
indirect The next hop to the host or subnet destination will be forwarded through a router at
the Gateway address.
direct Packets will be delivered to a destination host or subnet attached to the switch.
local Indicates a route to one of the switch’s IP interfaces.
broadcast Indicates a broadcast route.
martian The destination belongs to a host or subnet which is filtered out. Packets to this
multicast Indicates a multicast route.
destination are discarded.
53
Page 54

Dashboard
The following table describes the Route Table Tag parameter.
Table 30 IP Routing Tag information
Field Description
fixed The address belongs to a host or subnet attached to the switch.
static The address is a static route which has been configured on the switch.
addr The address belongs to one of the switch’s IP interfaces.
rip The address was learned by the Routing Information Protocol (RIP).
ospf The address was learned by Open Shortest Path First (OSPF).
broadcast The address is a broadcast address.
multicast The address is a multicast address.
martian The address belongs to a filtered group.
ARP Cache Information
To display the following form, select Layer 3 > ARP (click the underlined text, not the folder).
54
Page 55

Dashboard
The ARP information includes IP address and MAC address of each entry, address status flags, VLAN,
and port for the address, and port referencing information.
The following table describes the ARP Cache Information controls:
Table 31 ARP Cache Information controls
Control Description
Show Entries of a Specific Source Port Displays ARP entries for the selected port(s).
Show Entries of a Specific VLAN Displays ARP entries for the selected VLAN.
Show Entry of a Specific IP Address Displays a single ARP entry by IP address.
Clear ARP Cache Clears the ARP data cache.
Entry # Displays the numeric identifier of the ARP entry.
IP Address Displays the IP address of the ARP entry.
MAC Address Displays the MAC address of the ARP entry.
VLAN Displays the VLAN number of the port where the ARP entry request
is received.
Source Port Displays the source port of the ARP entry.
Flags Displays the address status flag for the ARP entry.
The Flags field is interpreted as follows:
Table 32 ARP Dump Flag Parameters
Flag Description
Interface Permanent entry created for switch IP interface
Indirect Indirect route entry
Unresolved Unresolved ARP entry. The MAC address has not been learned.
55
Page 56

Dashboard
Network Filters Dashboard
To display the following form, select Layer 3 > Network Filters (click the underlined text, not the
folder).
The following table describes the Network Filters Dashboard controls:
Table 33 Network Filters Dashboard controls
Control Description
Entry Displays the entry number.
Local Network
Address
Local Network Mask Displays the IP subnet mask that defines the range of IP addresses that will be accepted by
Status Displays the status of the filter (enabled or disabled).
Displays the starting IP address for the filter.
the peer.
56
Page 57

Dashboard
Route Map Dashboard
To display the following form, select Layer 3 > Route Maps (click the underlined text, not the folder).
The following table describes the Route Map Dashboard controls:
Table 34 Route Map Dashboard controls
Control Description
Route Map ID Displays the Route Map identifier.
Precedence Displays the precedence level for the route map. The smaller the value, the higher the
precedence.
Type Assigns the type of OSPF metric, as follows:
• 1—External routes are calculated using both internal and external metrics.
• 2—External routes are calculated using only the external metrics. Type 2 routes have
more cost than Type 2.
• • none—no metric.
Metric
Enabled? Displays the status of the Route Map (enabled or disabled).
Displays the metric value in the AS-External (ASE) LSA.
57
Page 58
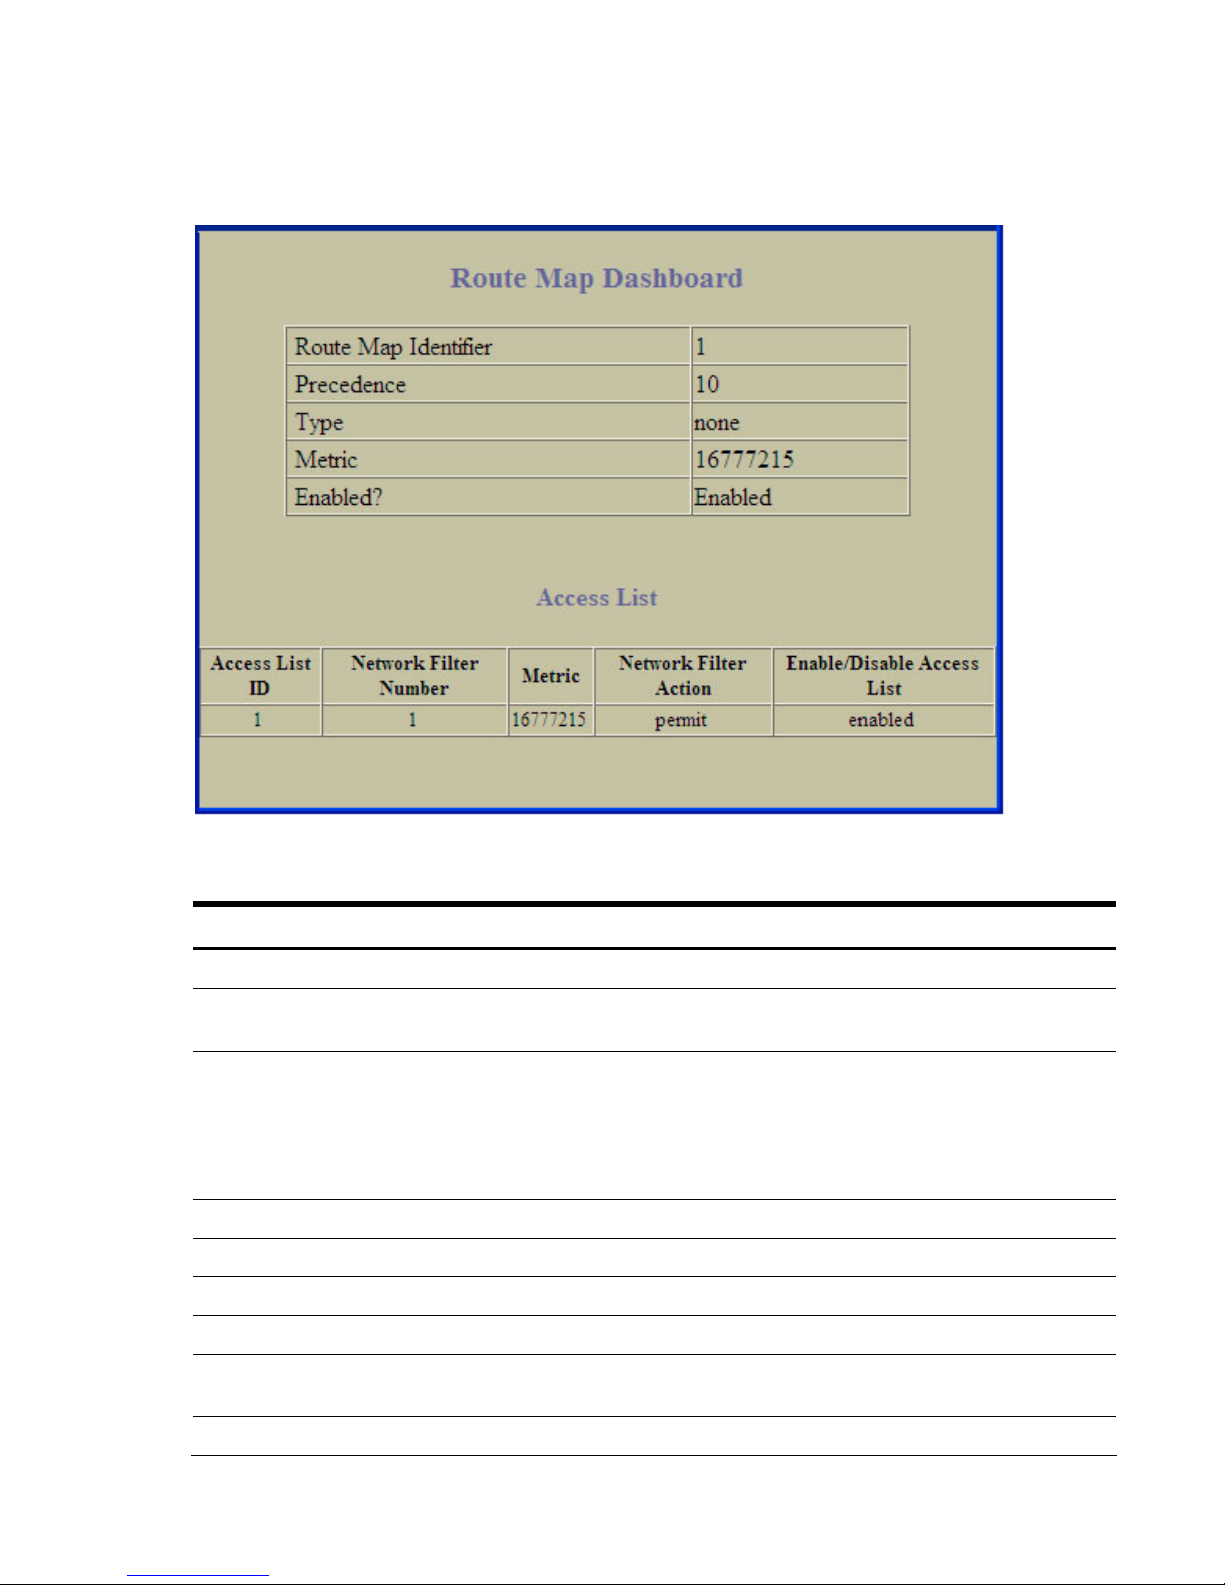
Dashboard
Route Map Dashboard
To display the following form, select Layer 3 > Route Maps (click the underlined text, not the folder).
The following table describes the Route Map Dashboard controls:
Table 35 Route Map Dashboard controls
Control Description
Route Map Identifier Numeric identifier for the route map.
Precedence
Type
Metric Metric of the matched route.
Enabled? Status of the route map: enabled or disabled.
Access List
Access List ID Numeric identifier of the access list.
Network Filter
Number
The precedence of the route map. The smaller the value, the higher the
precedence.
The type of OSPF metric. The default is type 1.
• 1—External routes are calculated using both internal and external metrics.
• 2—External routes are calculated using only the external metrics. Type 2 routes have
more cost than Type 2.
• none—Removes the OSPF metric.
Number of the network filter assigned to this access list.
Metric Metric value in the AS-External (ASE) LSA.
58
Page 59
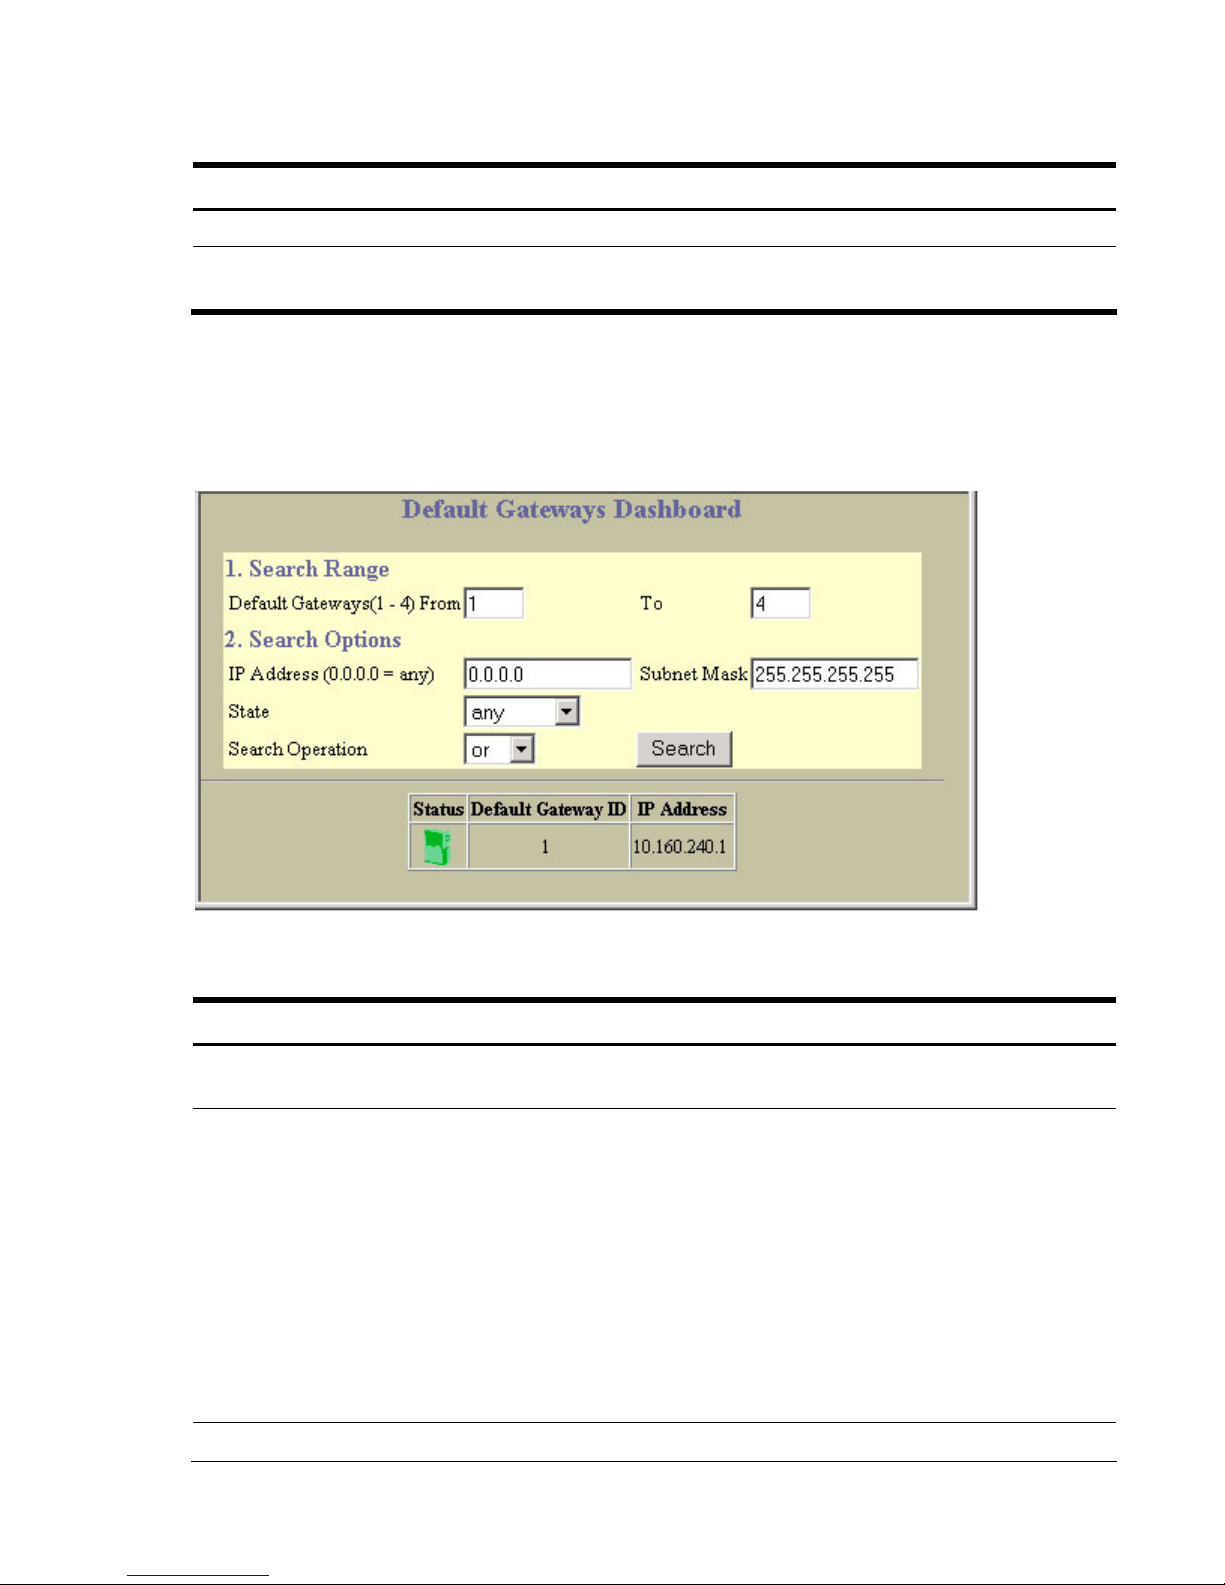
Dashboard
Table 35 Route Map Dashboard controls
Control Description
Network Filter Action Action associated with the network filter for the access list: permit or deny
Enable/Disable
Access List
Status of the access list: enabled or disabled.
Default Gateways Dashboard
To display the following form, select Layer 3 > Default Gateways (click the underlined text, not the
folder).
The following table describes the Default Gateways Dashboard controls:
Table 36 Default Gateways Dashboard controls
Control Description
Search Range To search for a Default Gateway, enter a range of Gateway numbers in the From and To
fields.
Search Options To focus the search for a Default Gateway, enter optional search parameters:
• IP Address
• Subnet Mask
• Default Gateway State
Fields that have a value of “any” are ignored during the search.
Choose a search operation:
• or: Search for Default Gateways specified in the search range that meet any of the
criteria entered.
• and: Search for Default Gateways specified in the search range that meet all of the
criteria entered.
Click Search to display Default Gateways that fit the range and meet the criteria entered.
Status
Shows if the Default Gateway is enabled (green) or disabled (red).
59
Page 60

Dashboard
Table 36 Default Gateways Dashboard controls
Control Description
Default Gateway ID Displays the numeric identifier of the Default Gateway.
IP Address Displays the IP Address of the Default Gateway.
IGMP Snooping Dashboard
To display the following form, select Layer 3 > IGMP > IGMP Snooping (click the underlined text,
not the folder).
60
Page 61

Dashboard
IGMP Multicast Groups
The following table describes the IGMP Multicast Groups information.
Table 37 IGMP Multicast Groups information
Field Description
Group Displays the IP address of the IGMP Multicast Group.
VLAN Displays the VLAN number of the IGMP Multicast Group.
Version Displays the IGMP version.
Ports Displays the port numbers of ports that carry IGMP Multicast traffic for the group.
Expires Displays the time remaining until an Mrouter port is deleted from the Multicast IGMP table.
Fwd Displays the forwarding state of the IGMP Multicast group.
IGMP Multicast Routers
The following table describes the commands used to display information about IGMP Multicast Routers.
Table 38 IGMP Multicast Routers information
Field Description
VLAN Displays the VLAN number on which the Multicast Router resides.
Port Displays the port to which the Multicast Router is connected.
Version Displays the IGMP version.
Expires Displays the time remaining until an Mrouter port is deleted from the Multicast IGMP
table.
Max Query Resp. Time Displays the maximum time allowed before responding to an IGMP Membership Query.
QRV Displays the Querier’s Robustness Variable (QRV).
QQIC Displays the Querier’s Query Interval Code (QQIC).
61
Page 62
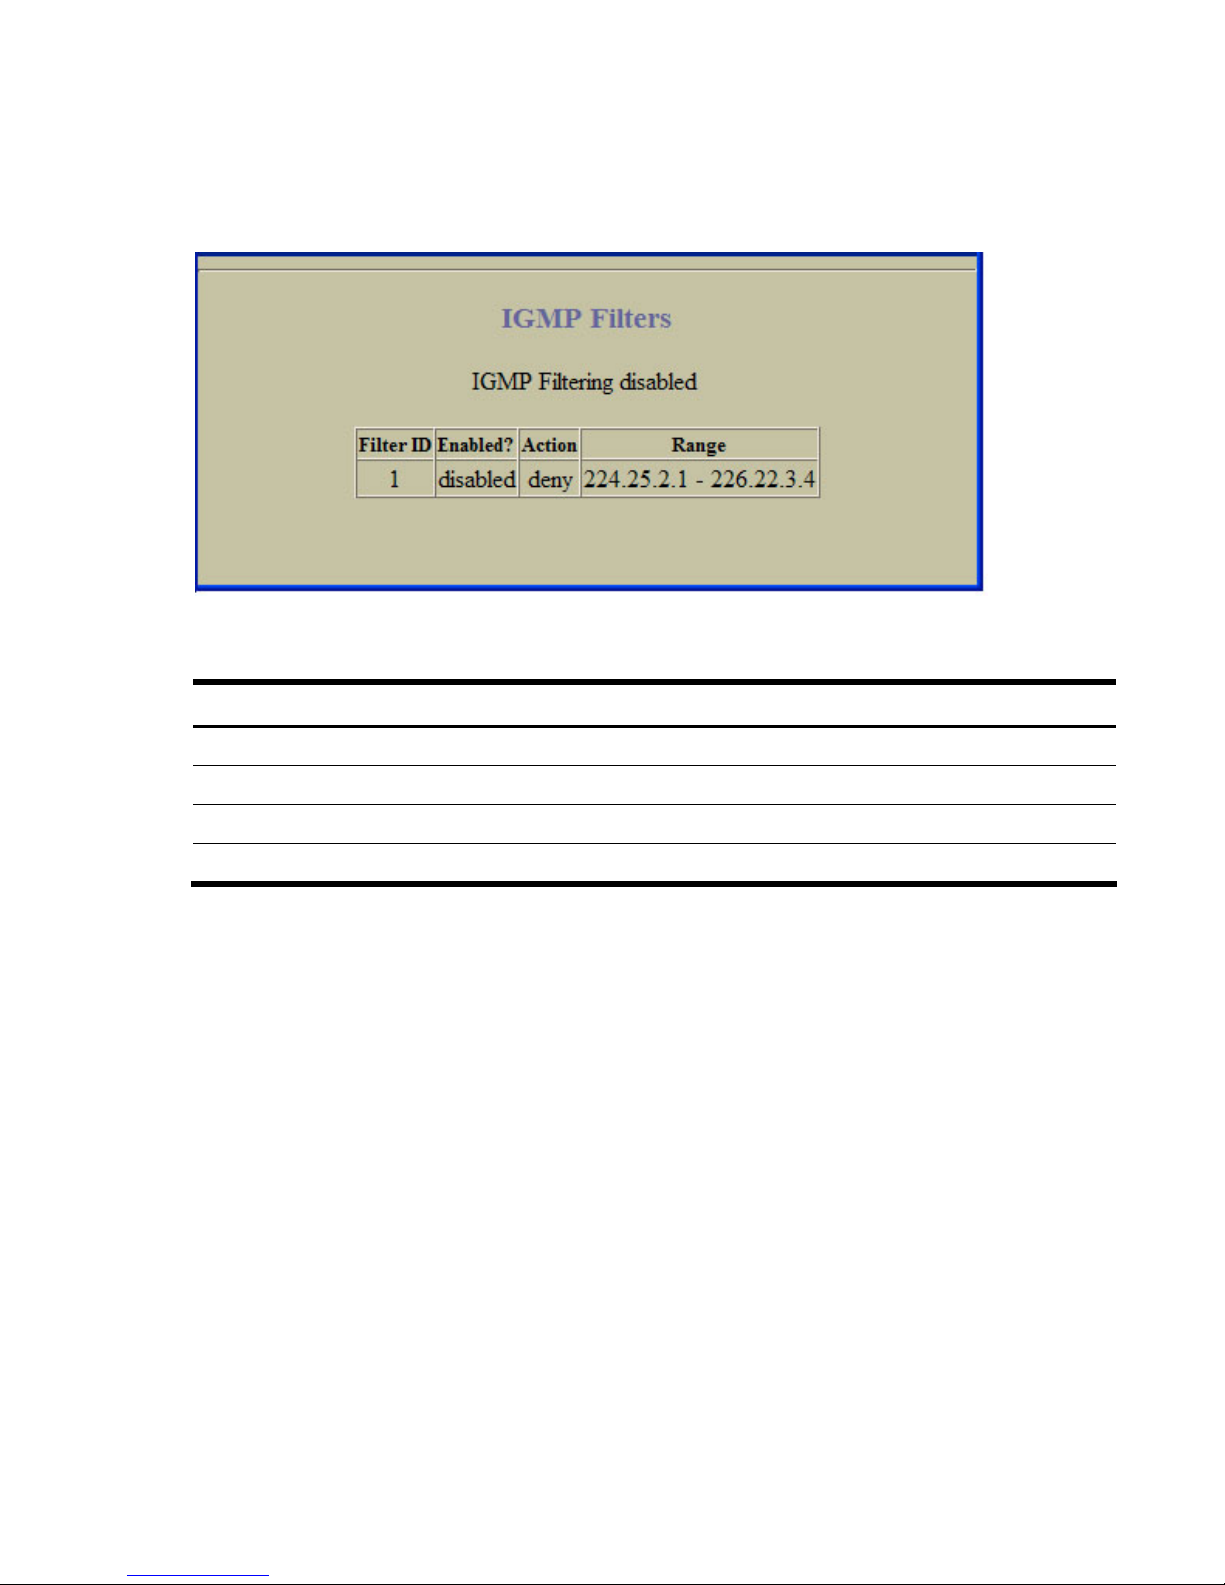
Dashboard
IGMP Filters Dashboard
To display the following form, select Layer 3 > IGMP > IGMP Filters (click the underlined text, not the
folder).
The following table describes the IGMP Filter information.
Table 39 IGMP Filters information
Field Description
Filter ID Displays the IGMP filter number.
Enabled? Displays the status of the filter (enabled or disabled).
Action Displays the action defined for the filter.
Range Displays the range of IP addresses configured for the filter.
62
Page 63

Dashboard
IGMP Static Multicast Router Configuration
To display the following form, select Layer 3 > IGMP > IGMP Static Mrouter (click the underlined
text, not the folder).
The following table describes the IGMP Static multicast router (Mrouter) information.
Table 40 IGMP Static Multicast Router information
Field Description
Mrouter Port Displays the port where the static Mrouter is configured.
Vlan Displays the VLAN number of the IGMP Multicast Group.
Version Displays the IGMP version.
63
Page 64
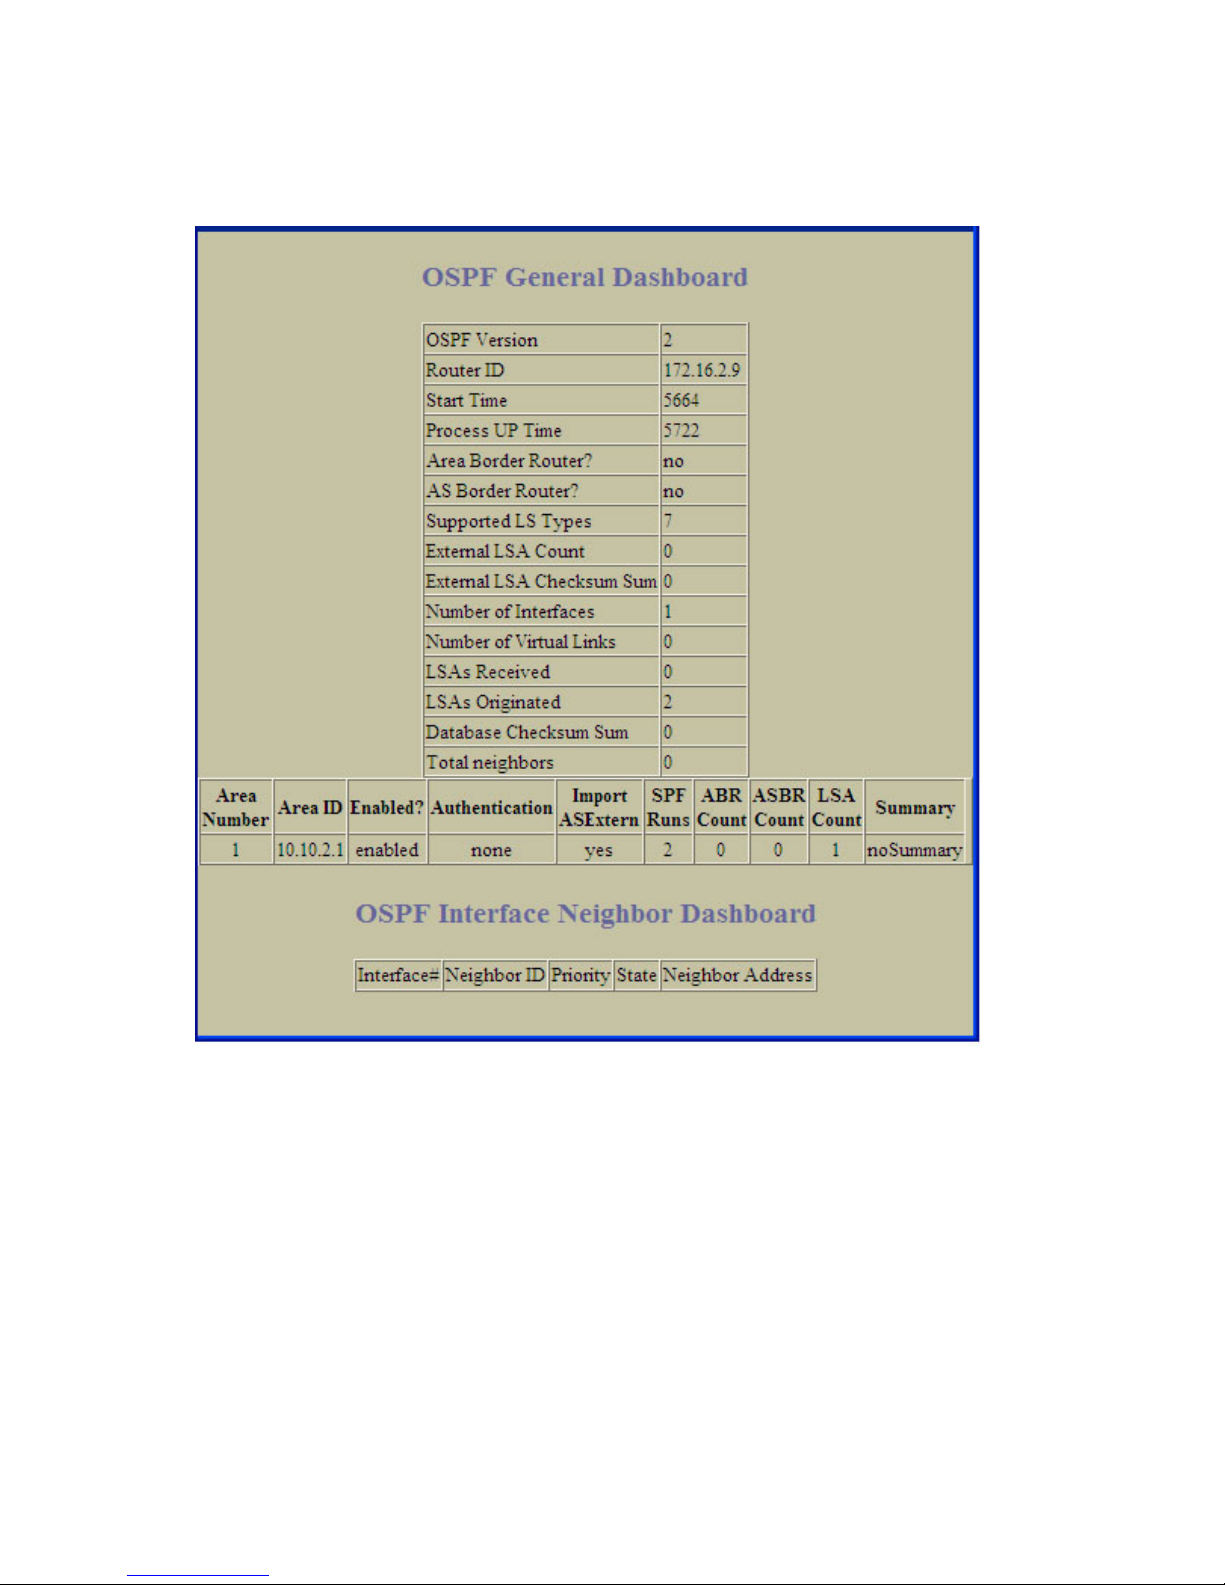
Dashboard
OSPF General Dashboard
To display the following form, select Layer 3 > OSPF > General.
This form summarizes general OSPF information.
64
Page 65

Dashboard
OSPF Areas Dashboard
To display the following form, select Layer 3 > OSPF > OSPF Areas (click the underlined text, not the
folder).
Select an area number to view statistics for the OSPF area.
OSPF Summary Ranges Dashboard
To display the following form, select Layer 3 > OSPF > Summary Ranges (click the underlined text,
not the folder).
The following table describes the OSPF Summary Ranges Dashboard controls:
Table 41 OSPF Summary Ranges Dashboard controls
Control Description
Range Number Displays the summary range number.
Enabled? Displays the status of the summary range, either enabled or disabled.
Area Number Displays the area index associated with the summary range.
Hide Range Indicates whether the summary range is hidden.
IP Address Displays the base IP address for the summary range.
Subnet Mask Displays the base subnet mask for the summary range.
Area Type Display the area type associated with the summary range.
65
Page 66

Dashboard
Table 41 OSPF Summary Ranges Dashboard controls
Control Description
Summary Address List Displays the summary address list for the range.
OSPF IP Interfaces Dashboard
To display the following form, select Layer 3 > OSPF > OSPF Interfaces (click the underlined text,
not the folder).
The following table describes the OSPF IP Interfaces Dashboard controls. Select an IP Interface ID number
to view statistics for the interface.
Table 42 OSPF IP Interfaces Dashboard controls
Control Description
Search Operation To focus the search for an OSPF interface, enter search parameters:
• IP interfaces
• Area number
• State
Fields that have a value of “any” are ignored during the search.
Choose a search operation:
• or: Search for OSPF interfaces specified in the Search range that meet any of the
criteria entered.
• and: Search for OSPF interfaces specified in the Search range that meet all of the
criteria entered.
Click Search to display OSPF interfaces that fit the range and meet the criteria entered.
66
Page 67

Dashboard
OSPF Virtual Links Dashboard
To display the following form, select Layer 3 > OSPF > Virtual Links (click the underlined text, not
the folder).
The following table describes the OSPF Virtual Links Dashboard controls:
Table 43 OSPF Virtual Links Dashboard controls
Control Description
Virtual Link Displays the virtual link number.
Enabled? Displays the status of the virtual link, either enabled or disabled.
Area Number Displays the area number associated with the virtual link.
Neighbor Router ID Displays the neighbor router ID.
Transit Delay Displays the transit delay value, in seconds.
67
Page 68

Dashboard
OSPF Routes
To display the following form, select Layer 3 > OSPF > Routes (click the underlined text, not the
folder).
This form summarizes OSPF route information.
RIP General Information
To display the following form, select Layer 3 > RIP > General.
The following table describes the Routing Information Protocol (RIP) General Information controls:
Table 44 RIP General Information controls
Control Description
Global RIP Enabled State Displays the global state of RIP: enabled or disabled.
Update Period (sec) Displays the time interval for sending for RIP table updates.
68
Page 69

Dashboard
RIP Interfaces Dashboard
To display the following form, select Layer 3 > RIP > RIP Interfaces (click the underlined text, not the
folder).
The following table describes the RIP Interfaces Dashboard controls:
Table 45 RIP Interfaces Dashboard controls
Control Description
Search Range To search for a RIP interface, enter a range of interface ID numbers in the From and To fields.
Search Options To focus the search for a RIP interface, enter optional search parameters:
• RIP version
• RIP state
Fields that have a value of “any” are ignored during the search.
Choose a search operation:
• or: Search for RIP interfaces specified in the search range that meet any of the criteria
entered.
• and: Search for RIP interfaces specified in the search range that meet all of the criteria
entered.
Click Search to display RIP interface that fit the range and meet the criteria entered.
Interface ID Displays each interface number.
RIP State Displays the current status of RIP in the interface: enabled or disabled.
RIP Version Displays the RIP version used by the interface.
Default Action Displays the default action for RIP on the interface.
Supply Updates Displays the current status of Supply: enabled or disabled.
Listen to Updates Displays whether Supply Updates is enabled or disabled.
69
Page 70
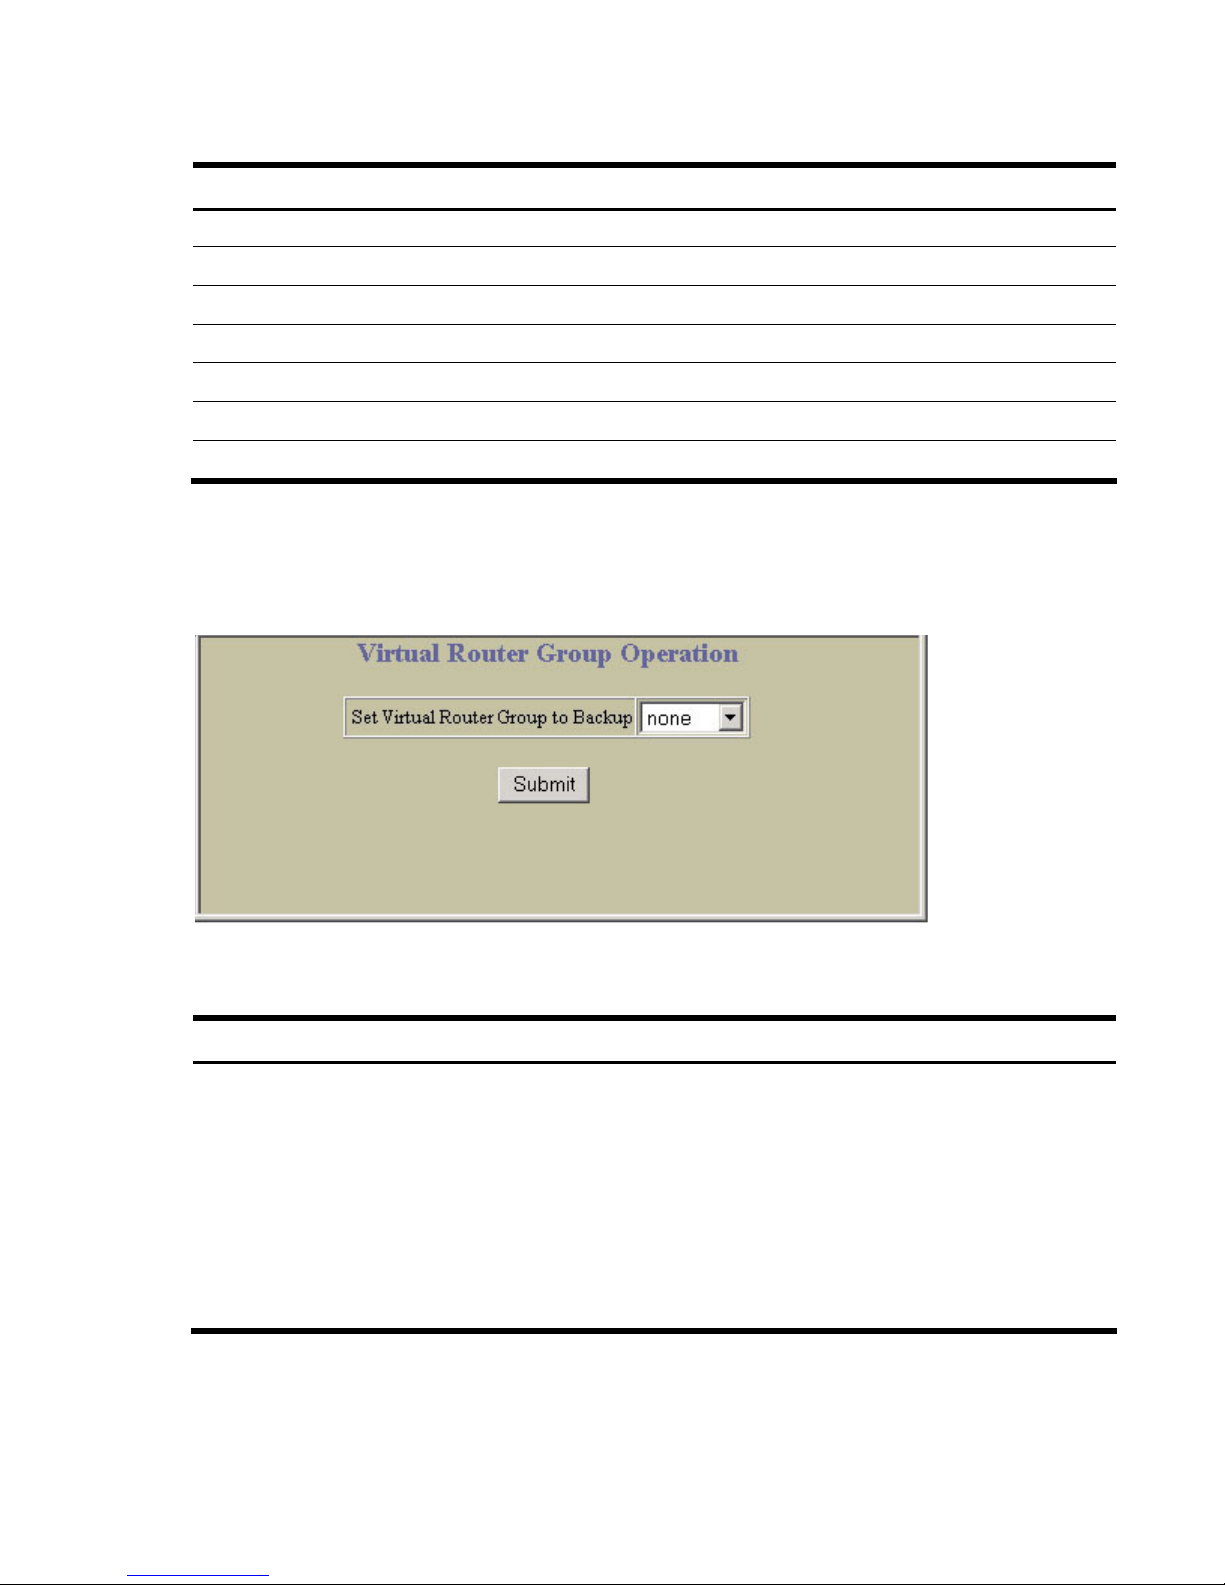
Dashboard
Table 45 RIP Interfaces Dashboard controls
Control Description
Poisoned Reverse Displays whether Poisoned Reverse is enabled or disabled.
Triggered Updates Displays whether Triggered Updates is enabled or disabled.
Multicast Updates Displays whether Multicast Updates is enabled or disabled.
Metric Displays the route metric for the interface.
Auth Type Displays the authentication type for the interface.
Auth Key Displays the authentication key for the interface.
Split Horizon Displays whether Split Horizon is enabled or disabled.
Virtual Router Group Operation
To display the following form, select Layer 3 > VRRP > General.
The following table describes the VRRP General controls:
Table 46 Virtual Router Group Operation controls
Control Description
Set Virtual Router
Group to Backup
Forces the master virtual router group into backup mode. This is generally used for passing
master control back to a preferred switch once the preferred switch has been returned to
service after a failure. When this command is executed, the current master gives up control
and initiates a new election by temporarily advertising its own priority level as 0 (lowest).
After the new election, the virtual router forced into backup mode by this command will
resume master control in the following cases:
• This switch owns the virtual router (the IP addresses of the virtual router and its IP interface
are the same)
• This switch’s virtual router has a higher priority and preemption is enabled.
• There are no other virtual routers available to take master control.
70
Page 71

Dashboard
Virtual Routers Dashboard
To display the following form, select Layer 3 > VRRP > Virtual Routers (click the underlined text, not
the folder).
The following table describes the Virtual Routers Dashboard controls:
Table 47 Virtual Routers Dashboard controls
Control Description
Search Operation To focus the search for virtual routers, enter search parameters:
• Virtual Router number
• IP address
• Virtual Router state
Fields that have a value of “any” are ignored during the search.
Choose a search operation:
• or: Search for virtual routers specified in the Search range that meet any of the
criteria entered.
• and: Search for virtual routers specified in the Search range that meet all of the
criteria entered.
Click Search to display virtual routers that fit the range and meet the criteria entered.
Status Shows whether the virtual router is enabled (green) or disabled (red).
Virtual Router Displays the virtual router number for each virtual router.
Virtual Router ID Displays the virtual router ID number for each virtual router.
IP Address Displays the IP address of the virtual router.
IP Interface Displays the IP interface associated with the virtual router.
Ownership Displays the ownership status of the virtual router: owner or renter.
Priority Displays the priority number.
Status Displays whether the virtual router is acting as master or standby.
71
Page 72

Dashboard
Virtual Router Operation
To display the following form, go to the Virtual Routers Dashboard. Select a virtual router number.
The following table describes the Virtual Router Operation controls:
Table 48 Virtual Router Operation controls
Control Description
Set Virtual Router
to Backup
Forces the master virtual router into backup mode. This is generally used for passing master
control back to a preferred switch once the preferred switch has been returned to service after
a failure. When this command is executed, the current master gives up control and initiates a
new election by temporarily advertising its own priority level as 0 (lowest). After the new
election, the virtual router forced into backup mode by this command will resume master control
in the following cases:
• This switch owns the virtual router (the IP addresses of the virtual router and its IP interface
are the same)
• This switch’s virtual router has a higher priority and preemption is enabled.
• There are no other virtual routers available to take master control.
Domain Name System Dashboard
To display the following form, select Layer 3 > Domain Name System.
This form summarizes DNS information.
72
Page 73
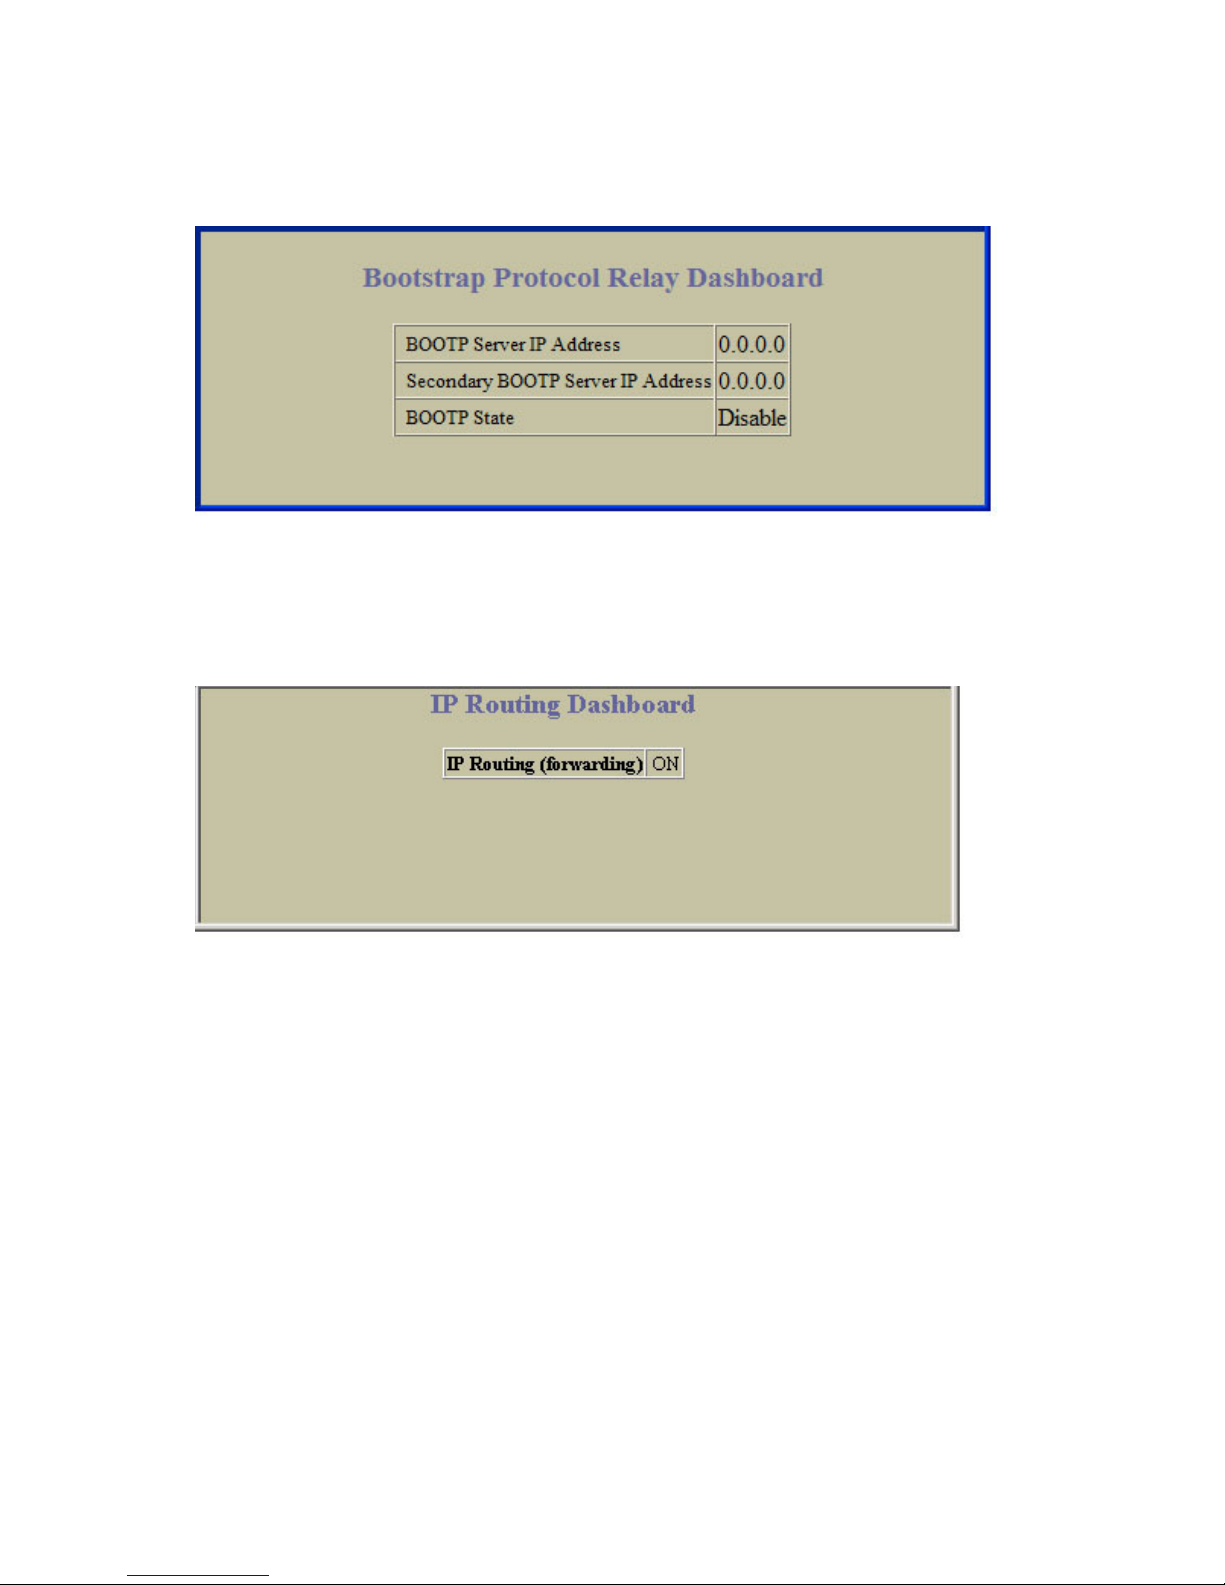
Dashboard
Bootstrap Protocol Relay Dashboard
To display the following form, select Layer 3 > Bootstrap Protocol Relay.
This form summarizes BOOTP information.
IP Routing Dashboard
To display the following form, select Layer 3 > General.
This form summarizes IP Routing information.
73
Page 74
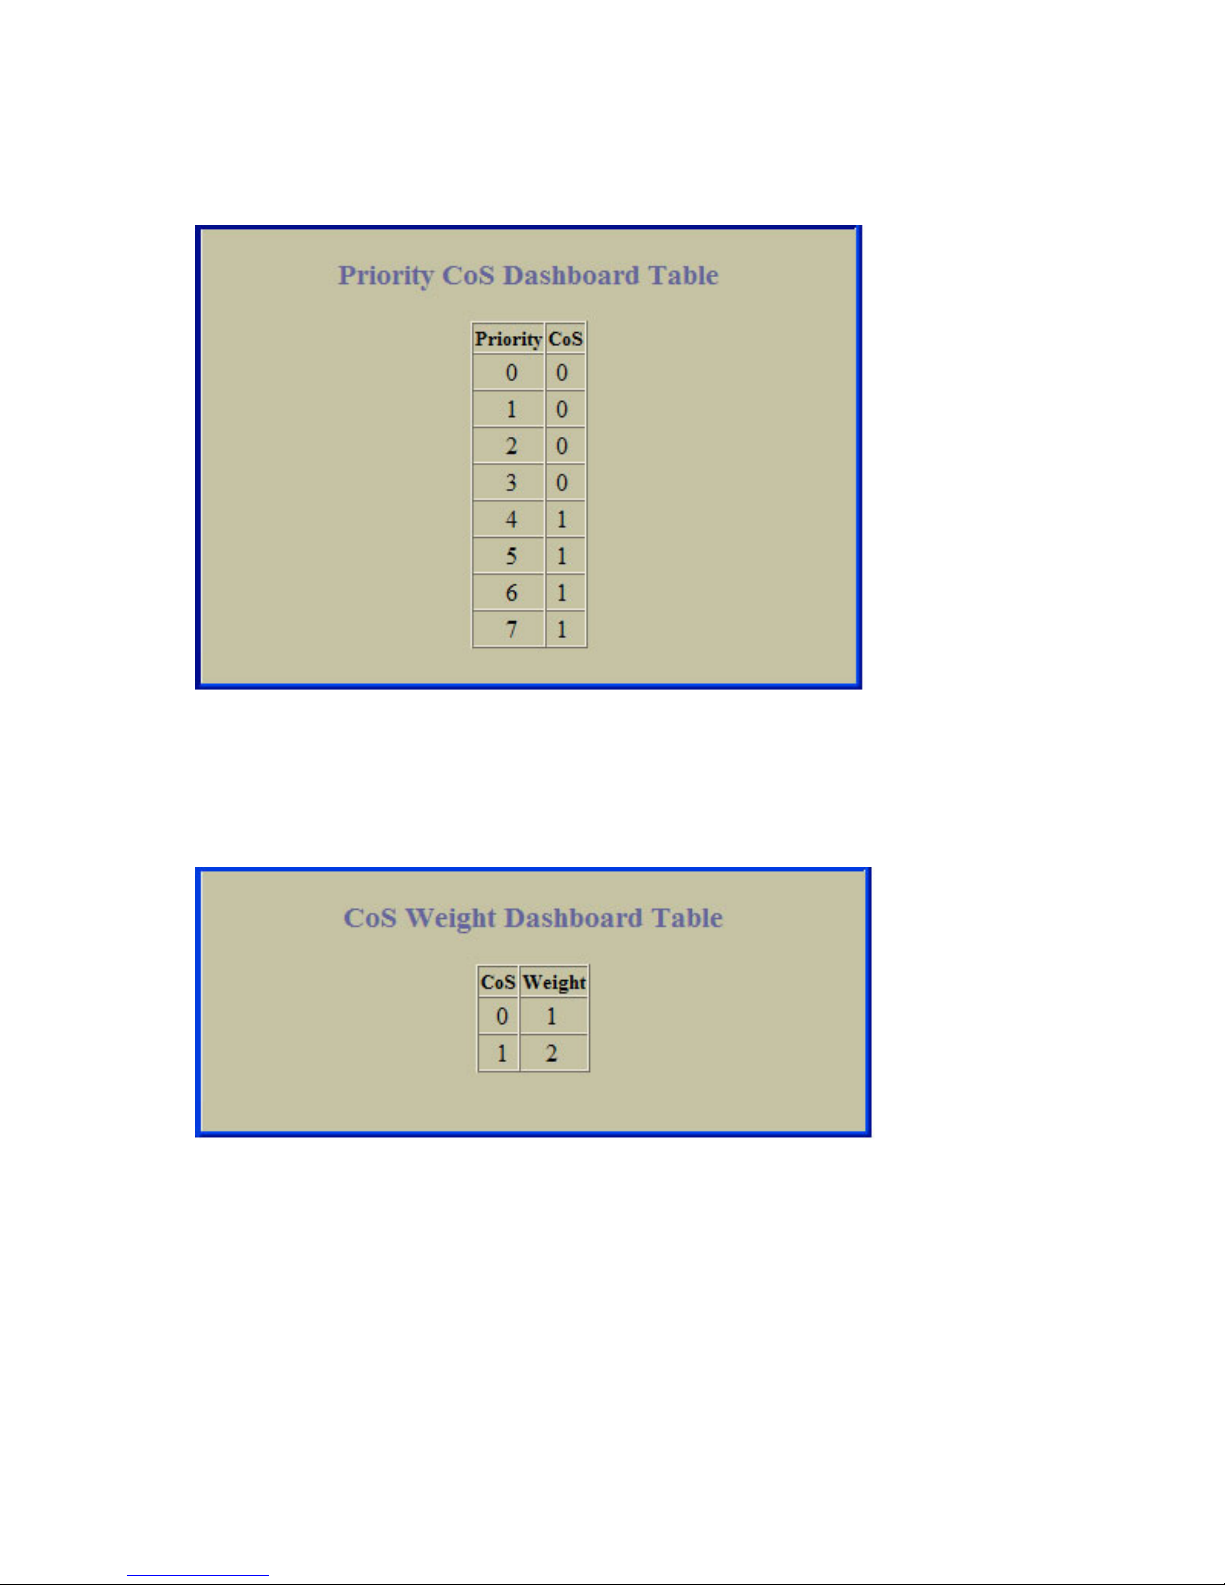
Dashboard
802.1p Priority to CoS Dashboard
To display the following form, select QoS > 802.1p > Priority - CoS.
This form shows the mapping between 802.1p Priority and Class of Service queue assignment.
802.1p CoS Weight Dashboard
To display the following form, select QoS > 802.1p > CoS – Weight.
This form shows the scheduling weight for each Class of Service queue.
74
Page 75

Dashboard
802.1p Switch Ports Priority Table Dashboard
To display the following form, select QoS > 802.1p > Ports Priority Table.
This form shows the 802.1p priority value, Class of Service queue assignment, and scheduling weight for
each switch port.
802.1p Number of CoS Dashboard
To display the following form, select QoS > 802.1p > Number of CoS.
This form shows the number of Class of Service queues configured for the switch.
75
Page 76

Dashboard
ACL Dashboard
To display the following form, select Access Control > Access Control Lists (click the underlined text,
not the folder).
This form summarizes information for configured Access Control Lists (ACLs).
76
Page 77

Dashboard
Access Control List Dashboard
To display the following form, go to the Access Control Lists form. Select an ACL number.
This form shows the configured parameters for the ACL.
ACL Groups Dashboard Table
To display the following form, select Access Control > Access Control List Groups (click the
underlined text, not the folder).
This form summarizes information for configured Access Control List (ACL) Groups.
77
Page 78

Dashboard
Access Control List Group Dashboard
To display the following form, go to the Access Control List Groups form. Select an ACL Group number.
This form shows the ACLs that reside within the selected ACL Group.
Uplink Failure Detection Dashboard
To display the following form, select Uplink Failure Detection (click the underlined text, not the
folder).
The following table describes the Uplink Failure Detection Dashboard controls:
Table 49 Uplink Failure Detection Dashboard controls
Control Description
UFD State Displays the global status of Uplink Failure Detection.
FDP State Displays whether the Failure Detection Pair is enabled or disabled.
LtM status Displays the current status of the Link to Monitor (LtM).
78
Page 79

Dashboard
Table 49 Uplink Failure Detection Dashboard controls
Control Description
LtD status Displays the current status of the Link to Disable (LtD).
LtM Ports Displays the link status and Spanning Tree information for each port in the LtM.
LtD Ports Displays the link status for each port in the LtD.
79
Page 80

Viewing statistics
Viewing statistics
Introduction
The switch BBI can be used to view a variety of switch performance statistics. The same statistics that are
available through the switch’s command line interface are present on the BBI statistics forms.
The following provides a basic outline for viewing statistics. You should first be familiar with configuration
as covered in the HP 1:10Gb Ethernet BL-c Switch Command Reference.
Steps for displaying statistics
Follow these basic steps for viewing switch statistics.
1. Select the Statistics context button in the toolbar.
2. Select a feature icon in the navigation window. For example, open the Switch folder and select
Switch Ports.
80
Page 81

Viewing statistics
3. View the statistics in the forms window. For example:
NOTE: Items that load other forms when selected are underlined.
4. Select an underlined item to view details on a per port basis. For example:
NOTE: This page is refreshed every 5 seconds.
81
Page 82

Viewing statistics
Management Processor Statistics
To display the following form, select System > General.
This form displays a summary of management processor (MP) statistics. MP statistics are described in the
following table:
Table 50 Management Processor Statistics
Statistic Syntax and Usage
IF Stats Click IF Stats to display IF portion of TCP/IP statistics
IP Stats Click IP Stats to display IP portion of TCP/IP statistics.
ICMP Stats Click ICMP Stats to display ICMP portion of TCP/IP statistics.
UDP Stats Click UDP Stats to display UDP/SNMP statistics.
TCP Stats Click TCP Stats to display TCP portion of TCP/IP statistics.
SNMP Stats Click SNMP Stats to display UDP/SNMP statistics.
CPU Utilization Click CPU Utilization to display CPU utilization.
FDB Stats Click FDB Stats to display FDB statistics.
82
Page 83

Viewing statistics
TCP/IP Statistics (IF and IP Statistics)
To display the following form, go to the Management Processor Statistics form. Select one of the
following: IF Stats, IP Stats, ICMP Stats, or TCP Stats.
The following table describes the interface statistics:
Table 51 IF statistics
Statistics Description
ifInOctets The total number of octets received on the interface, including framing characters.
ifInUcastPkts The number of packets, delivered by this sublayer to a higher sublayer, which were not
addressed to a multicast or broadcast address at this sublayer.
ifInNUCastPkts The number of packets, delivered by this sublayer to a higher sublayer, which were
addressed to a multicast or broadcast address at this sublayer. This object is deprecated in
favor of ifInMulticastPkts and ifInBroadcastPkts.
ifOutOctets The total number of octets transmitted out of the interface, including framing characters.
ifOutUcastPkts The total number of packets that higher-level protocols requested to be transmitted, and
which were not addressed to a multicast or broadcast address at this sublayer, including
those that were discarded or not sent.
ifOutNUcastPkts The total number of packets that higher-level protocols requested to be transmitted, and
which were addressed to a multicast or broadcast address at this sublayer, including those
that were discarded or not sent.
This object is deprecated in favor of ifOutMulticastPkts and ifOutBroadcastPkts.
83
Page 84

Viewing statistics
Table 51 IF statistics
Statistics Description
ifInErrors For packet-oriented interfaces, the number of inbound packets that contained errors
preventing them from being delivered to a higher-layer protocol.
For character-oriented or fixed-length interfaces, the number of inbound transmission units
that contained errors preventing them from being deliverable to a higher-layer protocol.
ifInDiscards The number of inbound packets that were chosen to be discarded even though no errors
were detected to prevent their being delivered to a higher-layer protocol. One possible
reason for discarding such a packet could be to free up buffer space.
ifInUnknownProtos For packet-oriented interfaces, the number of packets received via the interfaces that were
discarded because of an unknown or unsupported protocol.
For character-oriented or fixed-length interfaces which support protocol multiplexing the
number of transmission units received via the interface which were discarded because of an
unknown or unsupported protocol.
For any interface that does not support protocol multiplexing, this counter will always be
zero (0).
ifOutErrors For packet-oriented interfaces, the number of outbound packets that could not be transmitted
because of errors.
For character-oriented or fixed-length interfaces, the number of outbound transmission units
that could not be transmitted because of errors.
ifOutDiscards The number of outbound packets, which were chosen to be discarded even though no errors
had been detected to prevent their being transmitted. One possible reason for discarding
such a packet could be to free up buffer space.
IP statistics are described in the following table:
Table 52 IP Statistics
Statistic Description
ipInReceives The total number of input datagrams received from interfaces, including those received in error.
ipInDiscards The number of input IP datagrams for which no problems were encountered to prevent their
continued processing, but which were discarded (for example, for lack of buffer space). Note
that this counter does not include any datagrams discarded while awaiting re-assembly.
ipInDelivers The total number of input datagrams successfully delivered to IP user protocols (including
ICMP).
ipDefaultTTL The default value inserted into the Time-To-Live (TTL) field of the IP header of datagrams
originated at this entity (the switch), whenever a TTL value is not supplied by the transport layer
protocol.
ipInUnknownProtos The number of locally addressed datagrams received successfully but discarded because of an
unknown or unsupported protocol.
ipOutRequests The total number of IP datagrams which local IP user protocols (including ICMP) supplied to IP
in requests for transmission. Note that this counter does not include any datagrams counted in
ipForwDatagrams.
84
Page 85

Viewing statistics
Table 52 IP Statistics
Statistic Description
ipOutDiscards The number of output IP datagrams for which no problem was encountered to prevent their
transmission to their destination, but which were discarded (for example, for lack of buffer
space). Note that this counter would include datagrams counted in ipForwDatagrams if any
such packets met this (discretionary) discard criterion.
ipInHdrErrors The number of input datagrams discarded due to errors in their IP headers, including bad
checksums, version number mismatch, other format errors, time-to-live exceeded, errors
discovered in processing their IP options, and so forth.
ipInAddrErrors The number of input datagrams discarded because the IP address in their IP header’s
destination field was not a valid address to be received at this entity (the switch). This count
includes invalid addresses (for example, 0.0.0.0) and addresses of unsupported Classes (for
example, Class E). For entities which are not IP Gateways and therefore do not forward
datagrams, this counter includes datagrams discarded because the destination address was not
a local address.
TCP/IP Statistics (ICMP and TCP Statistics)
To display the following form, go to the Management Processor Statistics form. Select one of the
following: IF Stats, IP Stats, ICMP Stats, or TCP Stats.
85
Page 86

Viewing statistics
ICMP statistics are described in the following table:
Table 53 ICMP Statistics
Statistic Description
icmpInMsgs The total number of ICMP messages which the entity (the switch) received. Note
that this counter includes all those counted by icmpInErrors.
icmpOutMsgs The total number of ICMP messages which this entity (the switch) attempted to send.
Note that this counter includes all those counted by icmpOutErrors.
icmpInErrors The number of ICMP messages that the entity (the switch) received but determined
as having ICMP-specific errors (bad ICMP checksums, bad length, and so forth).
icmpOutErrors The number of ICMP messages which this entity (the switch) did not send due to
problems discovered within ICMP such as a lack of buffer. This value should not
include errors discovered outside the ICMP layer such as the inability of IP to route
the resultant datagram.
In some implementations there may be no types of errors that contribute to this
counter’s value.
icmpInDestUnreachs The number of ICMP Destination Unreachable messages received.
icmpOutDestUnreachs The number of ICMP Destination Unreachable messages sent.
icmpInTimeExcds The number of ICMP Time Exceeded messages received.
icmpOutTimeExcds The number of ICMP Time Exceeded messages sent.
icmpInParmProbs The number of ICMP Parameter Problem messages received.
icmpOutParmProbs The number of ICMP Parameter Problem messages sent.
icmpInSrcQuenchs The number of ICMP Source Quench (buffer almost full, stop sending data)
messages received.
icmpOutSrcQuenchs The number of ICMP Source Quench (buffer almost full, stop sending data)
messages sent.
icmpInRedirects The number of ICMP Redirect messages received.
icmpOutRedirects The number of ICMP Redirect messages sent. For a host, this object will always be
zero, since hosts do not send redirects.
icmpInEchos The number of ICMP Echo (request) messages received.
icmpOutEchos The number of ICMP Echo (request) messages sent.
icmpInEchoReps The number of ICMP Echo Reply messages received.
icmpOutEchoReps The number of ICMP Echo Reply messages sent.
icmpInTimestamps The number of ICMP Timestamp (request) messages received.
icmpOutTimestamps The number of ICMP Timestamp (request) messages sent.
icmpInTimestampReps The number of ICMP Timestamp Reply messages received.
icmpOutTimestampReps The number of ICMP Timestamp Reply messages sent.
icmpInAddrMasks The number of ICMP Address Mask Request messages received.
icmpOutAddrMasks The number of ICMP Address Mask Request messages sent.
icmpInAddrMaskReps The number of ICMP Address Mask Reply messages received.
86
Page 87

Viewing statistics
Table 53 ICMP Statistics
Statistic Description
icmpOutAddrMaskReps The number of ICMP Address Mask Reply messages sent.
TCP statistics are described in the following table:
Table 54 TCP Statistics
Statistic Description
tcpInSegs The total number of segments received, including those received in error. This count includes
segments received on currently established connections.
tcpOutSegs The total number of segments sent, including those on current connections, but excluding those
containing only retransmitted octets.
tcpRtoAlgorithm The algorithm used to determine the timeout value used for retransmitting unacknowledged
octets.
tcpMaxConn The limit on the total number of TCP connections the entity (the switch) can support. In entities
where the maximum number of connections is dynamic, this object should contain the value -1.
tcpRtoMin The minimum value permitted by a TCP implementation for the retransmission timeout, measured
in milliseconds. More refined semantics for objects of this type depend upon the algorithm used
to determine the retransmission timeout. In particular, when the timeout algorithm is rsre (3), an
object of this type has the semantics of the LBOUND quantity described in RFC 793.
tcpRtoMax The maximum value permitted by a TCP implementation for the retransmission timeout,
measured in milliseconds. More refined semantics for objects of this type depend upon the
algorithm used to determine the retransmission timeout. In particular, when the timeout algorithm
is rsre (3), an object of this type has the semantics of the UBOUND quantity described in RFC
793.
tcpActiveOpens The number of times TCP connections have made a direct transition to the SYN-SENT state from
the CLOSED state.
tcpPassiveOpens The number of times TCP connections have made a direct transition to the SYN-RCVD state from
the LISTEN state.
tcpAttemptFails The number of times TCP connections have made a direct transition to the CLOSED state from
either the SYN-SENT state or the SYNRCVD state, plus the number of times TCP connections
have made a direct transition to the LISTEN state from the SYN-RCVD state.
tcpEstabResets The number of times TCP connections have made a direct transition to the CLOSED state from
either the ESTABLISHED state or the CLOSE-WAIT state.
tcpRetransSegs The total number of segments retransmitted - that is, the number of TCP segments transmitted
containing one or more previously transmitted octets.
tcpInErrs The total number of segments received in error (for example, bad TCP checksums).
tcpCurBuff The total number of outstanding memory allocations from heap by TCP protocol stack.
tcpCurConn The total number of outstanding TCP sessions that are currently opened.
tcpOutRsts The number of TCP segments sent containing the RST flag.
All TCP allocated control blocks
Destinate Address Switch IP address of TCP connections.
87
Page 88

Viewing statistics
Table 54 TCP Statistics
Statistic Description
Remote Port TCP port used by the remote device.
Source Address IP address of TCP source connections.
Local Port Available TCP ports used for connecting to the switch.
State State of each TCP connection.
UDP/SNMP Statistics
To display the following form, go to the Management Processor Statistics form. Select UDP Stats or
SNMP Stats.
UDP statistics are described in the following table:
Table 55 UDP Statistics
Statistic Description
udpInDatagrams The total number of UDP datagrams delivered to the switch.
udpOutDatagrams The total number of UDP datagrams sent from this entity (the switch).
udpInErrors The number of received UDP datagrams that could not be delivered for reasons
udpNoPorts The total number of received UDP datagrams for which there was no application at
other than the lack of an application at the destination port.
the destination port.
88
Page 89

Viewing statistics
To display the following form, go to the Management Processor Statistics form. Select UDP Stats or
SNMP Stats, and scroll down.
SNMP statistics are described in the following table:
Table 56 SNMP Statistics
Statistic Description
snmpInPkts The total number of Messages delivered to the SNMP entity from the transport
service.
snmpOutPkts The total number of SNMP Messages that were passed from the SNMP protocol
entity to the transport service.
snmpInTooBigs The total number of SNMP Protocol Data Units (PDUs) that were delivered to the
SNMP protocol entity and for which the value of the error-status field is too big.
snmpOutTooBigs The total number of SNMP Protocol Data Units (PDUs), which were generated by the
SNMP protocol entity and for which the value of the error-status field is too big.
snmpInGetRequest The total number of SNMP Get-Request Protocol Data Units (PDUs), which have been
accepted and processed by the SNMP protocol entity.
snmpOutGetRequests The total number of SNMP Get-Request Protocol Data Units (PDUs), which have been
generated by the SNMP protocol entity.
snmpInNoSuchNames The total number of SNMP Protocol Data Units (PDUs) that were delivered to the
SNMP protocol entity and for which the value of the error-status field is
noSuchName.
snmpOutNoSuchNames The total number of SNMP Protocol Data Units (PDUs), which were generated by the
SNMP protocol entity and for which the value of the error-status is noSuchName.
snmpInGetNexts The total number of SNMP Get-Next Protocol Data Units (PDUs), which have been
snmpOutGetNexts The total number of SNMP Get-Next Protocol Data Units (PDUs), which have been
snmpInBadValues The total number of SNMP Protocol Data Units (PDUs) that were delivered to the
accepted and processed by the SNMP protocol entity.
generated by the SNMP protocol entity.
SNMP protocol entity and for which the value of the error-status field is badValue.
89
Page 90

Viewing statistics
Table 56 SNMP Statistics
Statistic Description
snmpOutBadValues The total number of SNMP Protocol Data Units (PDUs), which were generated by the
SNMP protocol entity and for which the value of the error-status field is badValue.
snmpInSetRequests The total number of SNMP Set-Request Protocol Data Units (PDUs), which have been
accepted and processed by the SNMP protocol entity.
snmpOutSetRequests The total number of SNMP Set-Request Protocol Data Units (PDUs), which have been
generated by the SNMP protocol entity.
snmpInReadOnlys The total number of valid SNMP Protocol Data Units (PDUs), which were delivered to
the SNMP protocol entity and for which the value of the error-status field is ‘readOnly’. It should be noted that it is a protocol error to generate an SNMP PDU, which
contains the value ‘read-Only’ in the error-status field. As such, this object is provided
as a means of detecting incorrect implementations of the SNMP.
snmpOutReadOnlys Not in use.
snmpInGetResponses The total number of SNMP Get-Response Protocol Data Units (PDUs) that were
delivered to the SNMP protocol entity.
snmpOutGetResponses The total number of SNMP Get-Response Protocol Data Units (PDUs), which have
been generated by the SNMP protocol entity.
snmpInGenErrs The total number of SNMP Protocol Data Units (PDUs), which were delivered to the
SNMP protocol entity and for which the value of the error-status field is genErr.
snmpOutGenErrs The total number of SNMP Protocol Data Units (PDUs), which were generated by the
SNMP protocol entity and for which the value of the error-status field is genErr.
snmpInTraps The total number of SNMP Trap Protocol Data Units (PDUs), which have been
accepted and processed by the SNMP protocol entity.
snmpOutTraps The total number of SNMP Trap Protocol Data Units (PDUs), which have been
generated by the SNMP protocol entity.
snmpInBadVersions The total number of SNMP Messages, which were delivered to the SNMP protocol
entity and were for an unsupported SNMP version.
snmpInTotalReqVars The total number of MIB objects which have been retrieved successfully by the SNMP
protocol entity as a result of receiving valid SNMP Get- Request and Get-Next
Protocol Data Units (PDUs).
snmpInBadCtyNames The total number of SNMP Messages delivered to the SNMP entity that used an
SNMP community name not known to the said entity (the switch).
snmpInTotalSetVars The total number of MIB objects, which have been altered successfully by the SNMP
protocol entity as a result of receiving valid SNMP Set-Request Protocol Data Units
(PDUs).
snmpInBadCtyUses The total number of SNMP Messages delivered to the SNMP protocol entity that
snmpEnableAuthTraps An object to enable or disable the authentication traps generated by this entity (the
represented an SNMP operation that was not allowed by the SNMP community
named in the Message.
switch).
90
Page 91
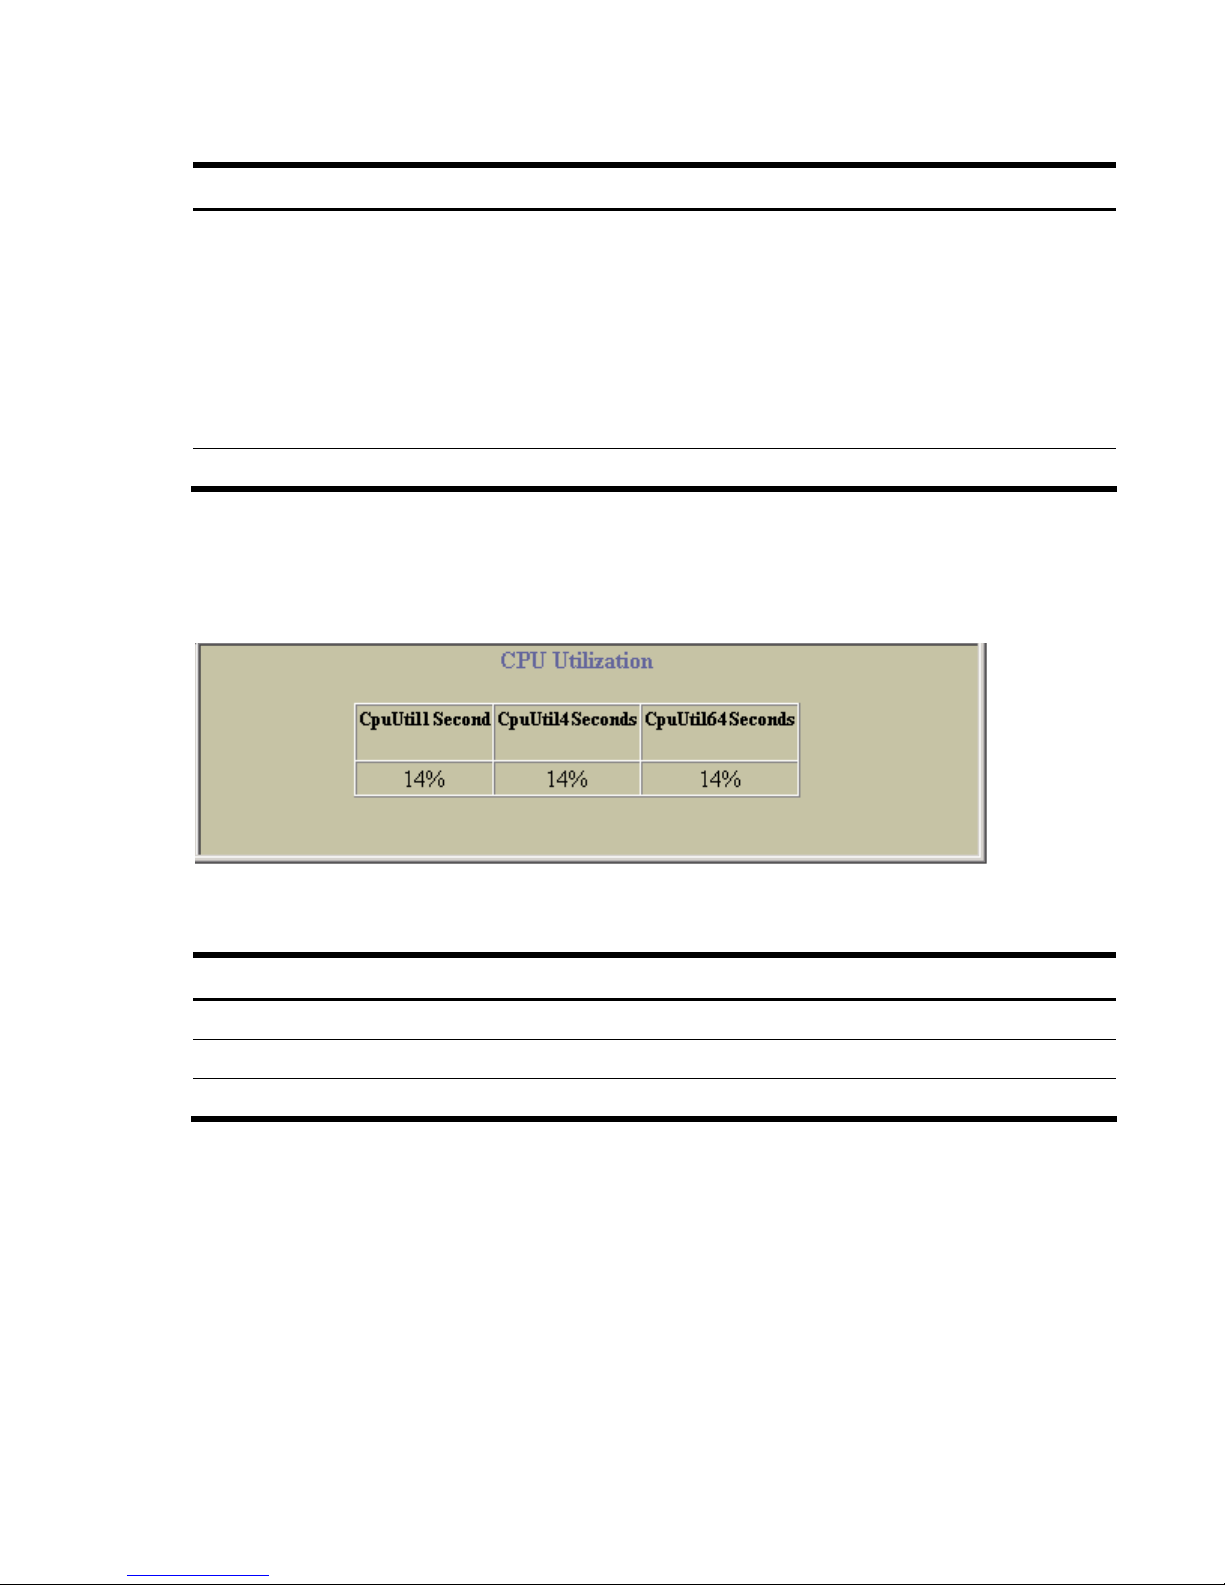
Viewing statistics
Table 56 SNMP Statistics
Statistic Description
snmpInASNParseErrs The total number of ASN.1 or BER errors encountered by the SNMP protocol entity
when decoding SNMP Messages received.
NOTE: OSI’s method of specifying abstract objects is called ASN.1 (Abstract Syntax
Notation One, defined in X.208), and one set of rules for representing such objects
as strings of ones and zeros is called the BER (Basic Encoding Rules, defined in
X.209). ASN.1 is a flexible notation that allows one to define a variety of data types,
from simple types such as integers and bit strings to structured types such as sets and
sequences. BER describes how to represent or encode values of each ASN.1 type as
a string of eight-bit octets.
snmpInBadTypes The total number of SNMP Messages which failed ASN parsing.
CPU Utilization
To display the following form, go to the Management Processor Statistics form. Select CPU Utilization.
CPU statistics are described in the following table:
Table 57 CPU Statistics
Statistic Description
CpuUtil1Second The utilization of MP CPU over 1 second. It shows the percentage.
CpuUtil4Seconds The utilization of MP CPU over 4 seconds. It shows the percentage.
CpuUtil64Seconds The utilization of MP CPU over 64 seconds. It shows the percentage.
91
Page 92

Viewing statistics
FDB Statistics
To display the following form, go to the Management Processor Statistics form. Select FDB Stats.
Forwarding Database (FDB) statistics are described in the following table:
Table 58 Forwarding Database Statistics
Statistic Description
current Current number of entries in the Forwarding Database.
hiwat Highest number of entries recorded at any given time in the Forwarding Database.
92
Page 93

Viewing statistics
Network Time Protocol Statistics
To display the following form, select System > NTP.
Network Time Protocol (NTP) statistics for the primary and secondary NTP servers are described in the
following table:
Table 59 NTP Statistics
Statistic Description
Request Sent The total number of NTP requests the switch sent to the primary NTP server to
synchronize time.
Responses Received The total number of NTP responses received from the primary NTP server.
Updates The total number of times the switch updated its time based on the NTP responses
received from the primary NTP server.
Last update time The time stamp showing the time when the switch was last updated.
Current system time The current switch system time.
93
Page 94
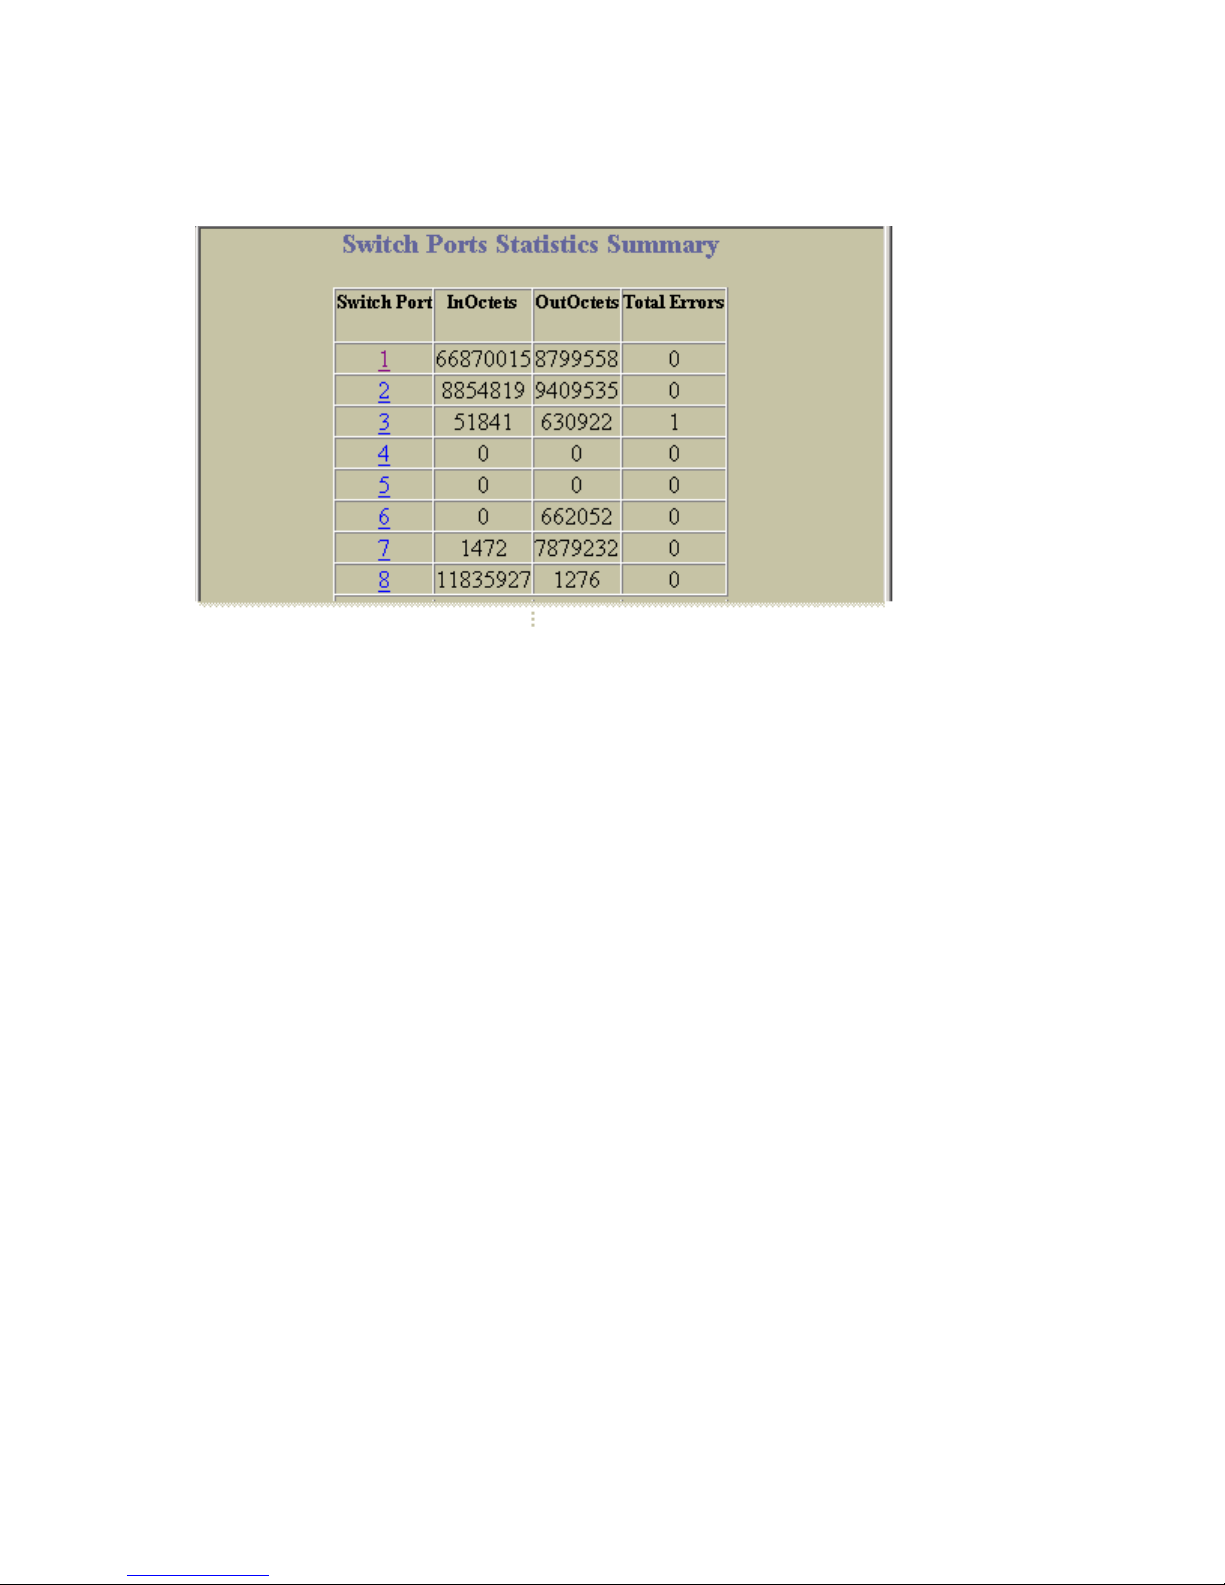
Viewing statistics
Switch Ports Statistics Summary
To display the following form, select Switch Ports (click the underlined text, not the folder).
This form displays traffic statistics on a port-by-port basis. For more information, select a port number to
display detailed statistics for that port.
94
Page 95
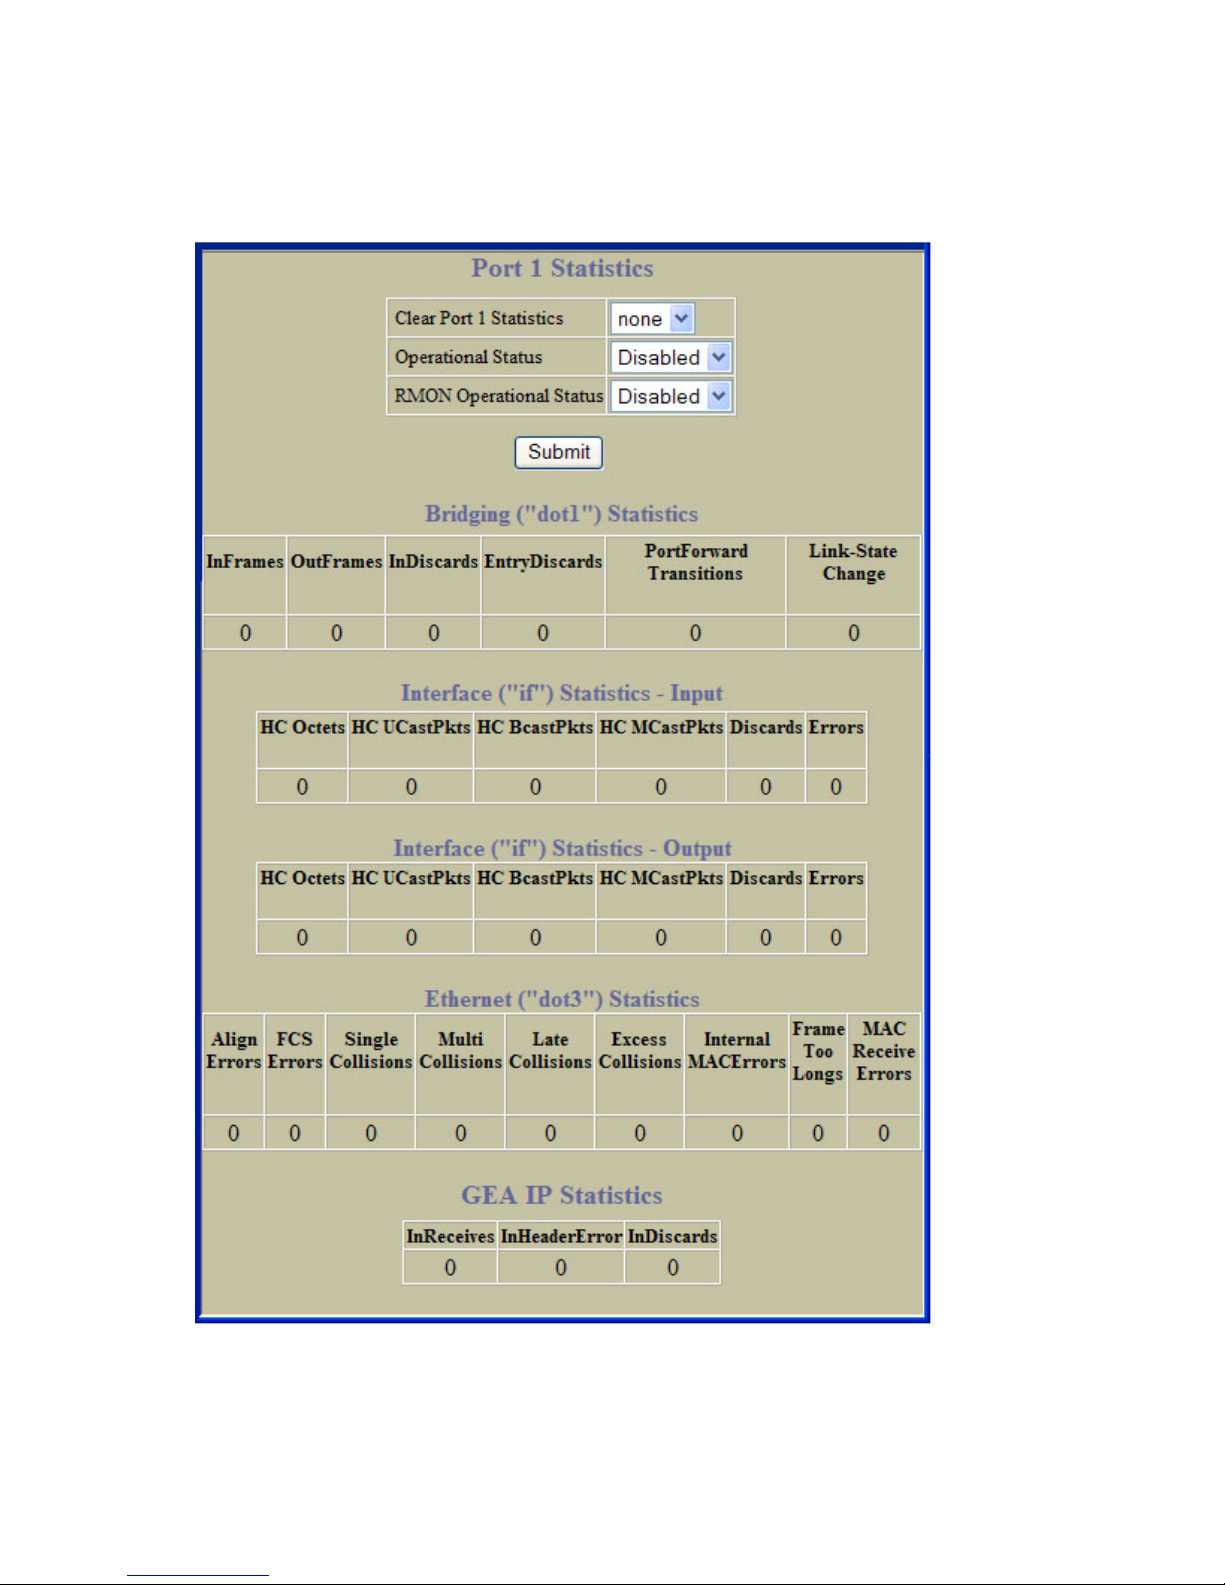
Viewing statistics
Port Statistics
To display the following form, go to the Switch Ports Statistics Summary form. Select a Switch Port
number.
95
Page 96

Viewing statistics
Port statistics are described in the following table:
Table 60 Port Statistics
Control Description
Clear Port x Statistics
Operational Status Enables or disables the port.
RMON Operational Status Enables or disables RMON for the port.
The next several tables contain specific information about bridging, interface (input and output), and
Ethernet statistics.
Bridging (“dot1”) Statistics
The following table describes the bridging statistics of the selected port:
Table 61 Bridging statistics of a port
Statistic Description
InFrames The number of frames that have been received by this port from its segment. A frame received
on the interface corresponding to this port is only counted by this object if and only if it is for a
protocol being processed by the local bridging function, including bridge management frames.
OutFrames The number of frames that have been transmitted by this port to its segment. Note that a frame
transmitted on the interface corresponding to this port is only counted by this object if and only
if it is for a protocol being processed by the local bridging function, including bridge
management frames.
Select Clear and click Submit to clear statistics for this port.
InDiscards Count of valid frames received that were discarded (that is, filtered) by the Forwarding Process.
EntryDiscards The total number of Forwarding Database entries, which have been or would have been learnt,
but have been discarded due to a lack of space to store them in the Forwarding Database. If
this counter is increasing, it indicates that the Forwarding Database is regularly becoming full
(a condition which has unpleasant performance effects on the sub network). If this counter has
a significant value but is not presently increasing, it indicates that the problem has been
occurring but is not persistent.
PortForward
Transitions
Link-State Change The number of times an interface has transitioned from either down to up or from up to down.
The number of times this port has transitioned from the Learning state to the Forwarding state.
Interface (“if”) Statistics - Input
The following table describes the interface input statistics of the selected port:
Table 62 Interface Statistics for a Port - Input
Statistic Description
HC Octets The total number of octets received on the interface, including framing characters.
HC UCastPkts The number of packets, delivered by this sub layer to a higher sub layer, which were not
addressed to a multicast or broadcast address at this sub layer.
96
Page 97

Viewing statistics
Table 62 Interface Statistics for a Port - Input
Statistic Description
HC BcastPkts The number of packets, delivered by this sub layer to a higher sub layer, which were
addressed to a broadcast address at this sub layer.
HC MCastPkts The total number of packets that higher-level protocols requested to be transmitted, and
which were addressed to a multicast address at this sub layer, including those that were
discarded or not sent. For a MAC layer protocol, this includes both Group and
Functional addresses.
Discards The number of inbound packets that were chosen to be discarded even though no errors
had been detected to prevent their being delivered to a higher-layer protocol. One
possible reason for discarding such a packet could be to free up buffer space.
Errors For packet-oriented interfaces, the number of inbound packets that contained errors
preventing them from being delivered to a higher-layer protocol. For character-oriented
or fixed-length interfaces, the number of inbound transmission units that contained errors
preventing them from being deliverable to a higher-layer protocol.
Interface (“if”) Statistics - Output
The following table describes the interface output statistics of the selected port:
Table 63 Interface Statistics for a Port - Output
Statistic Description
HC Octets The total number of octets transmitted out of the interface, including framing characters.
HC UCastPkts The total number of packets that higher-level protocols requested to be transmitted, and
which were not addressed to a multicast or broadcast address at this sub layer, including
those that were discarded or not sent.
HC BcastPkts The total number of packets that higher-level protocols requested to be transmitted, and
which were addressed to a broadcast address at this sub layer, including those that were
discarded or not sent. This object is a 64-bit version of ifOutBroadcastPkts.
HC MCastPkts The total number of packets that higher-level protocols requested to be transmitted, and
which were addressed to a multicast address at this sub layer, including those that were
discarded or not sent. For a MAC layer protocol, this includes both Group and
Functional addresses. This object is a 64-bit version of ifOutMulticastPkts.
Discards The number of outbound packets that were chosen to be discarded even though no errors
had been detected to prevent their being transmitted. One possible reason for discarding
such a packet could be to free up buffer space.
Errors For packet-oriented interfaces, the number of outbound packets that could not be
transmitted because of errors. For character-oriented or fixed-length interfaces, the
number of outbound transmission units that could not be transmitted because of errors.
97
Page 98

Viewing statistics
Ethernet (“dot3”) Statistics
The following table describes the Ethernet statistics of the selected port:
Table 64 Ethernet Statistics for a Port
Statistic Description
Align Errors A count of frames received on a particular interface that is not an integral number of
octets in length and do not pass the Frame Check Sequence (FCS) check.
The count represented by an instance of this object is incremented when the
alignmentError status is returned by the MAC service to the Logical Link Control (LLC) (or
other MAC user). Received frames for which multiple error conditions obtained are,
according to the conventions of IEEE 802.3 Layer Management, counted exclusively
according to the error status presented to the LLC.
FCS Errors A count of frames received on a particular interface that is an integral number of octets in
length but do not pass the Frame Check Sequence (FCS) check.
The count represented by an instance of this object is incremented when the
frameCheckError status is returned by the MAC service to the LLC (or other MAC user).
Received frames for which multiple error conditions obtained are, according to the
conventions of IEEE 802.3 Layer Management, counted exclusively according to the
error status presented to the LLC.
Single Collisions A count of successfully transmitted frames on a particular interface for which transmission
is inhibited by exactly one collision.
A frame that is counted by an instance of this object is also counted by the
corresponding instance of the ifOutUcastPkts, ifOutMulticastPkts, or ifOutBroadcastPkts,
and is not counted by the corresponding instance of the dot3StatsMultipleCollision-Frame
object.
Multi Collisions A count of successfully transmitted frames on a particular interface for which transmission
is inhibited by more than one collision.
A frame that is counted by an instance of this object is also counted by the
corresponding instance of the ifOutUcastPkts, ifOutMulticastPkts, or ifOutBroadcastPkts,
and is not counted by the corresponding instance of the dot3StatsSingleCollision-Frames
object.
Late Collisions The number of times that a collision is detected on a particular interface later than 512
bit-times into the transmission of a packet.
Five hundred and twelve bit-times corresponds to 51.2 microseconds on a 10 Mbps
system. A (late) collision included in a count represented by an instance of this object is
also considered as a (generic) collision for purposes of other collision-related statistics.
Excess Collisions A count of frames for which transmission on a particular interface fails due to excessive
collisions.
Internal MACErrors A count of frames for which transmission on a particular interface fails due to an internal
MAC sub layer transmit error. A frame is only counted by an instance of this object if it is
not counted by the corresponding instance of the dot3StatsLateCollisions object, the
dot3StatsExcessiveCollisions object, or the dot3Stats-CarrierSenseErrors object.
The precise meaning of the count represented by an instance of this object is
implementation-specific. In particular, an instance of this object may represent a count of
transmission errors on a particular interface that are not otherwise counted.
98
Page 99

Viewing statistics
Table 64 Ethernet Statistics for a Port
Statistic Description
Frame Too Longs A count of frames received on a particular interface that exceeds the maximum permitted
frame size.
The count represented by an instance of this object is incremented when the
frameTooLong status is returned by the MAC service to the LLC (or other MAC user).
Received frames for which multiple error conditions obtained are, according to the
conventions of IEEE 802.3 Layer Management, counted exclusively according to the
error status presented to the LLC.
Mac Receive Errors A count of frames for which reception on a particular interface fails due to an internal
MAC sub layer receive error. A frame is only counted by an instance of this object if it is
not counted by the corresponding instance of the dot3StatsFrameTooLongs object, the
dot3Stats-AlignmentErrors object, or the dot3StatsFCSErrors object. The precise meaning
of the count represented by an instance of this object is implementation-specific. In
particular, an instance of this object may represent a count of received errors on a
particular interface that are not otherwise counted.
GEA IP Statistics
The following table describes the GEA statistics for the selected port:
Table 65 GEA IP statistics of a port
Statistic Description
InReceives The total number of input datagrams received from interfaces, including those received in error.
InHeaderError The number of input datagrams discarded because the IP address in their IP header's
InDiscards The number of input IP datagrams for which no problems were encountered to prevent their
destination field was not a valid address to be received at this entity (the switch).
continued processing, but which were discarded (for example, for lack of buffer space). Note
that this counter does not include any datagrams discarded while awaiting re-assembly.
99
Page 100
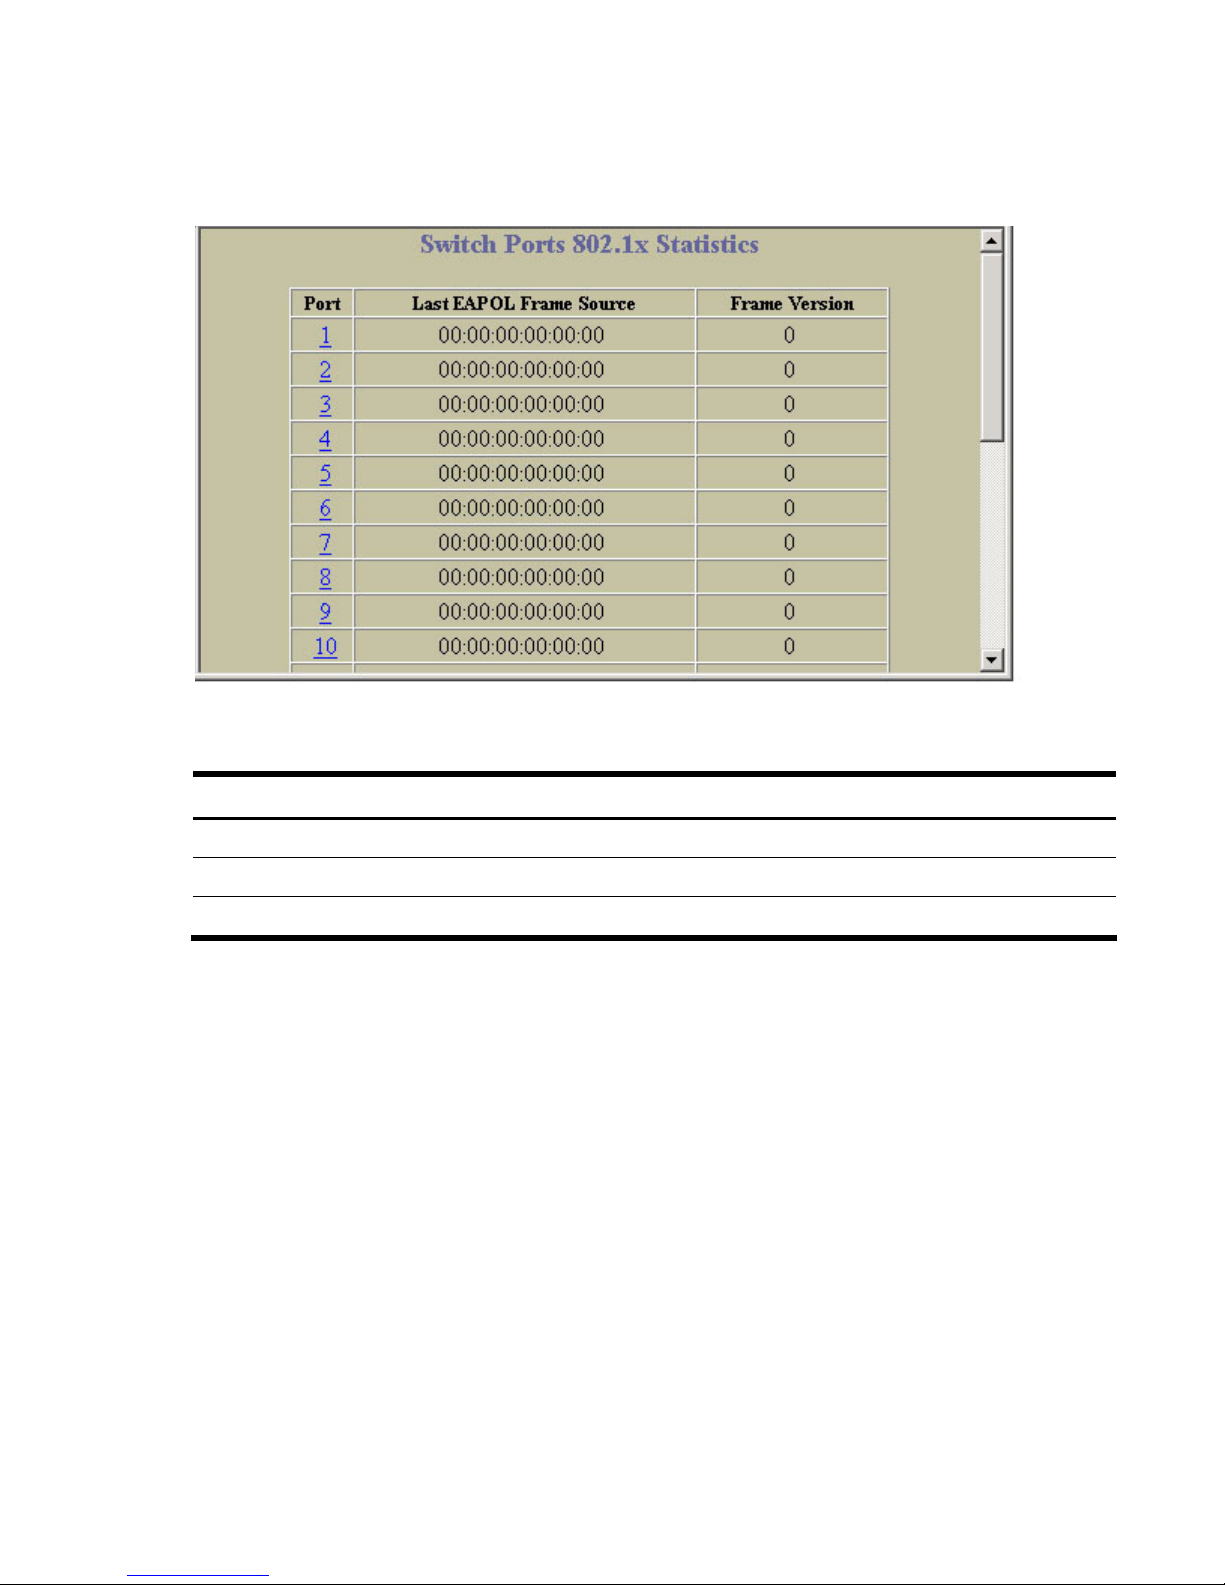
Viewing statistics
Switch Ports 802.1x Statistics
To display the following form, select Layer 2 > 802.1x > Switch Ports.
The following table describes 802.1x port statistics:
Table 66 Switch Port 802.1x Statistics
Statistic Description
Port Displays port numbers.
Last EAPOL Frame Source Displays the MAC address of the most recent 802.1x frame received on the port.
Frame Version Displays the version number of the most recent 802.1x frame received on the port.
100
 Loading...