

Page 1

Training Guide
Publication Number E2433-97034
First Edition, November 1997
For Safety information, Warranties, and Regulatory
information, see the pages behind the Index.
Copyright Hewlett-Packard Company 1992–1997
Training Kit for
HP 1660/70 Series Logic
Analyzers
Page 2
Start Here
Ready, Set, Run: Easy Steps to Logic Analysis with the HP 1660/70 Series
READY
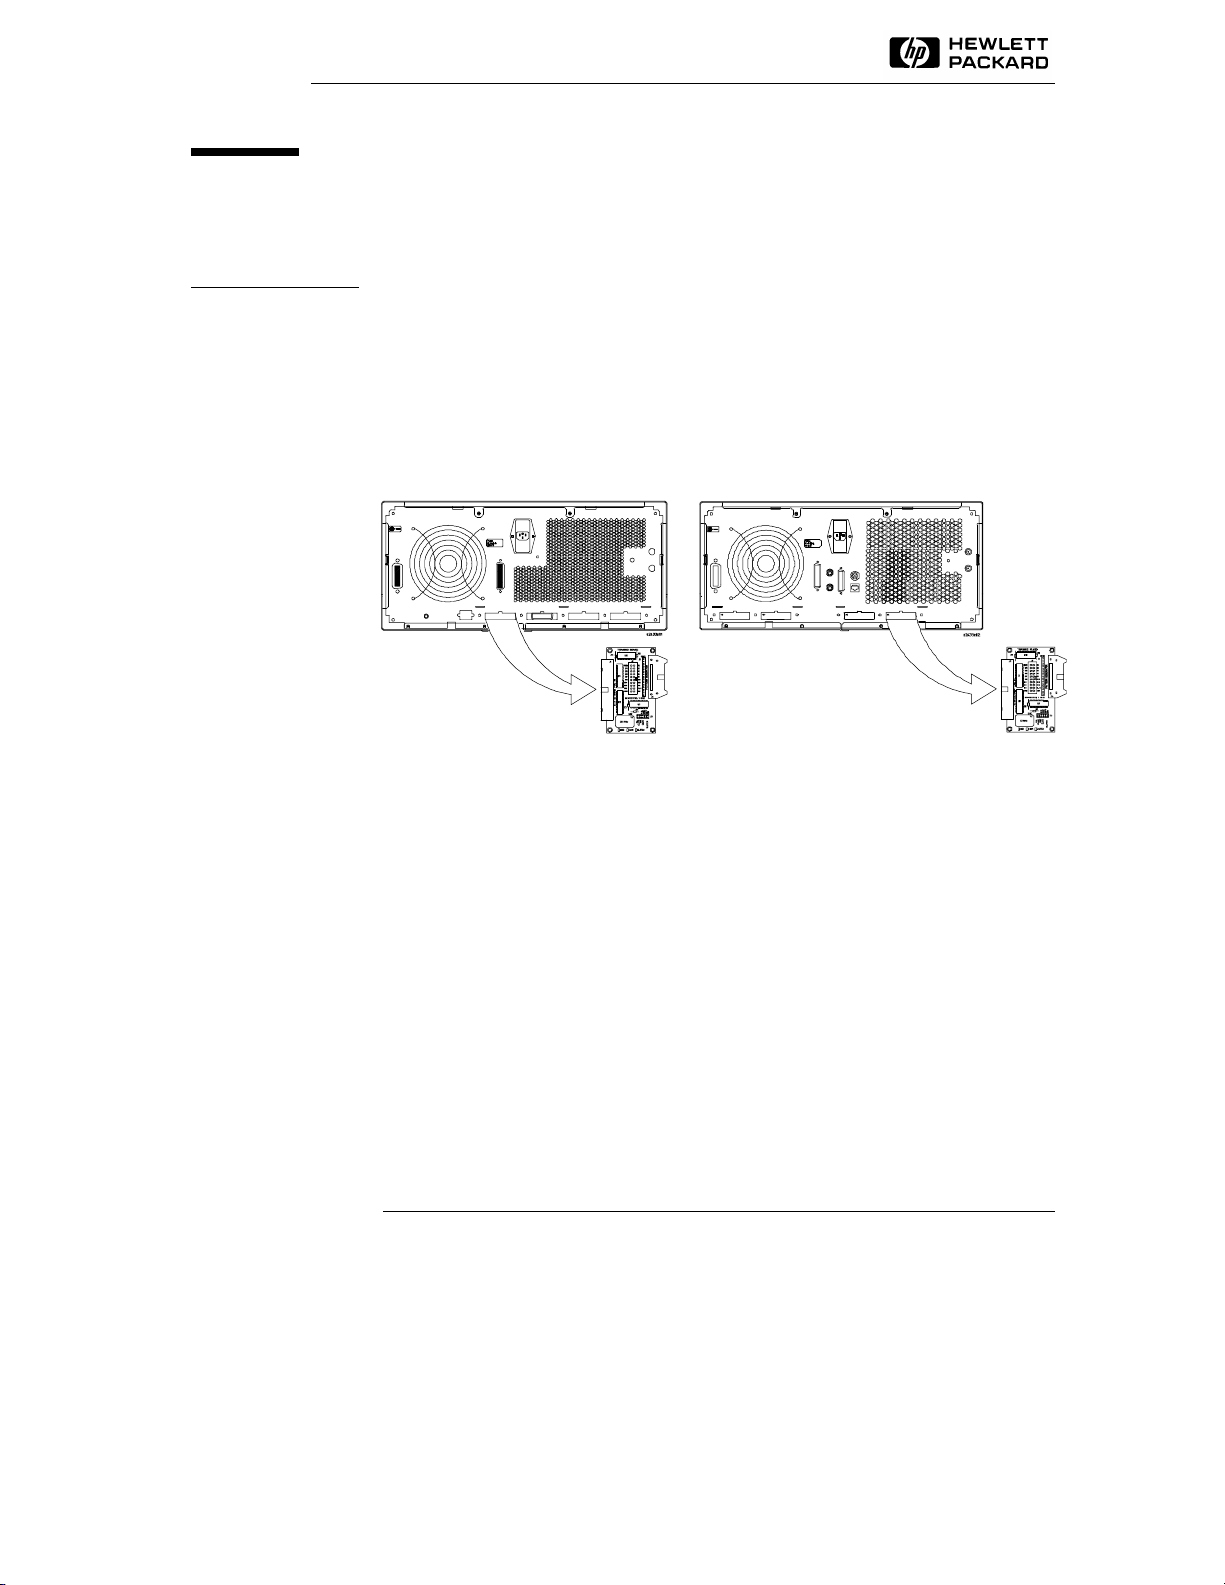
With the power off, connect Pod 1 of the analyzer to J1 on the
Training Board. For the HP 1660s, Pod 1 is the top cable in the
left-most position when you are facing the rear of the logic analyzer.
For the HP 1670s, Pod 1 is the top cable in the right-most position
when you are facing the rear of the logic analyzer.
1660 Series 1670 Series
SET Turn on the analyzer by pressing the power switch near the bottom
of the front panel.
The analyzer will take about 15 seconds to boot up.
ii
Page 3
Introduction
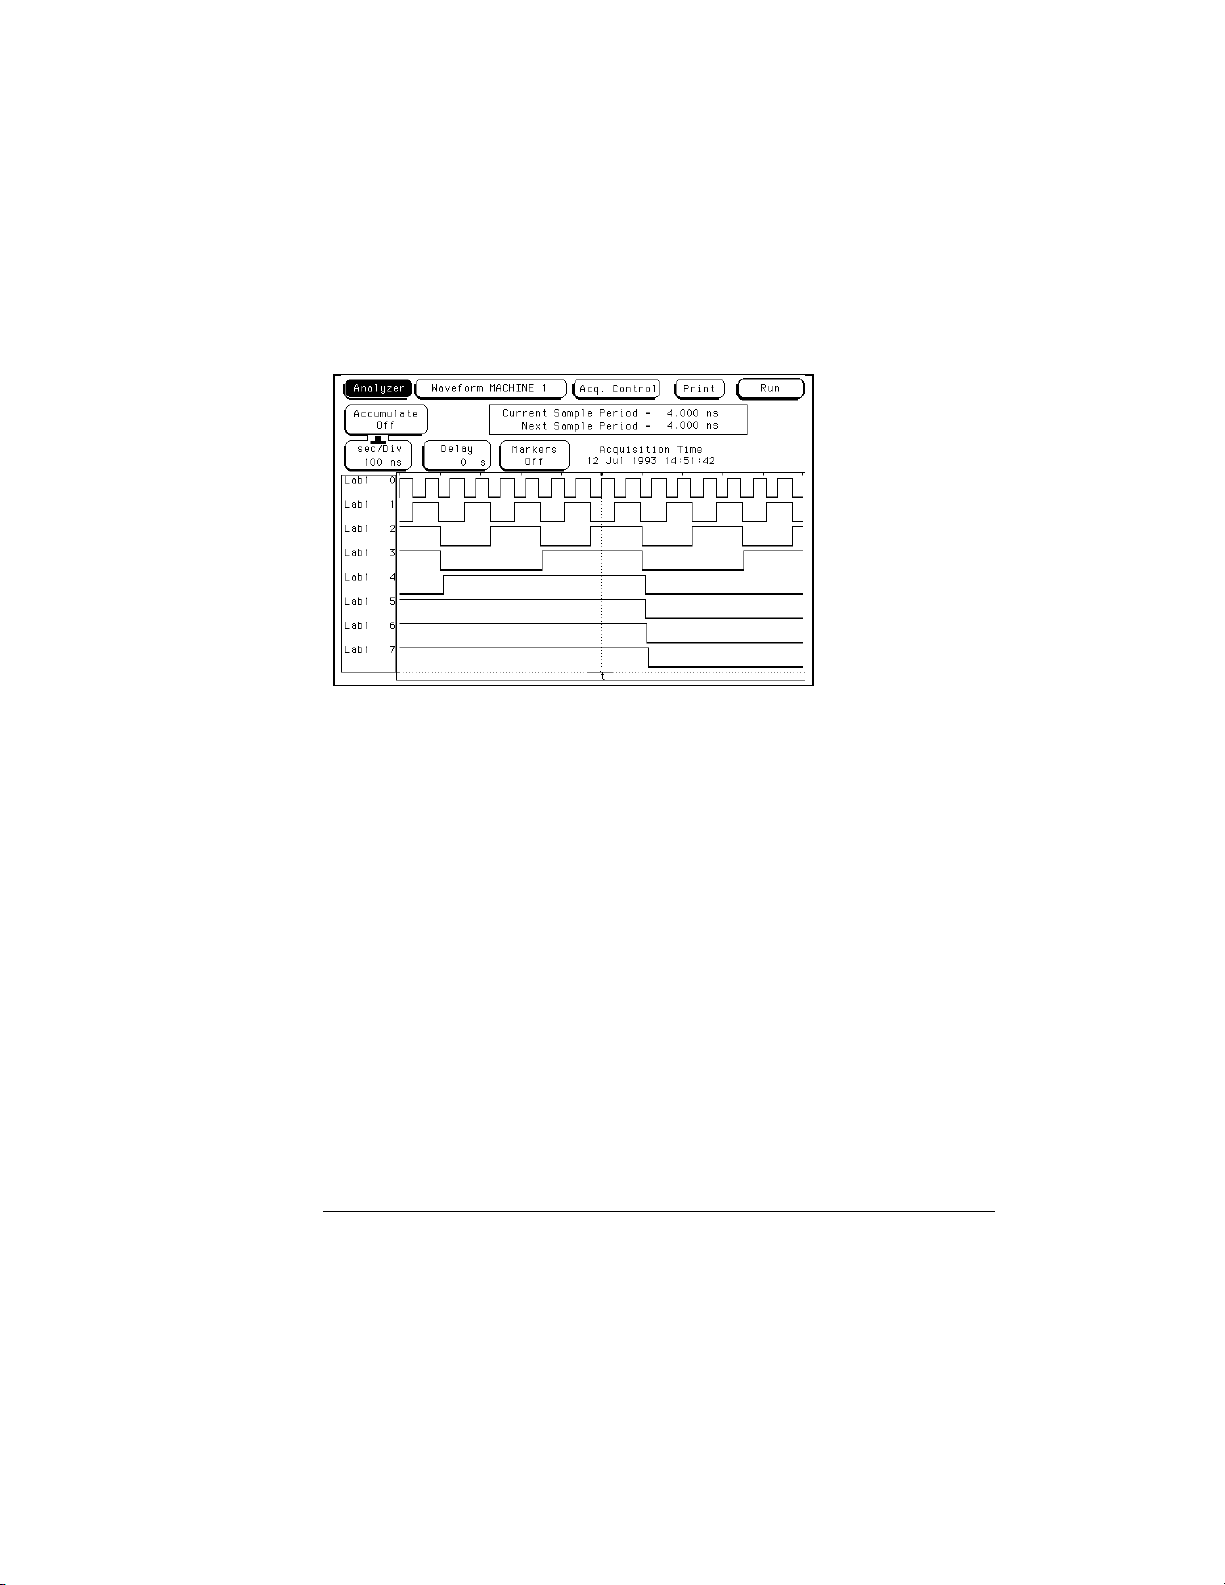
RUN Press the Run key, near the upper right corner of the front panel. You
will see the output of an 8-bit ripple counter like this:
Output of the 8-bit Ripple Counter
Next Please read the short introduction and chapter 1 before doing the exercises.
iii
Page 4

Logic Analysis made easy: a self-paced training guide
This training kit will quickly teach you how to use the HP 1660 and
HP 1670 Series Logic Analyzers to get your work done. The exercises
in this book will teach you how to perform basic timing and state
analysis measurements and how to make more complex
measurements, such as comparing two state listings, setting up
complex state triggers, and making state and timing measurements
simultaneously. You will also learn oscilloscope measurements if you
are using a logic analyzer that has a built-in oscilloscope. You will see
how easy it is to use the HP 1660 and HP 1670 Series Logic Analyzers,
and at the same time, learn basic digital measurement concepts.
The exercises in this training guide are designed to work with any of
the HP 1660 or HP 1670 Series analyzers with some exceptions: the
exercise in chapter 5, "Mixed Mode - Correlation of State and Timing
Data," will not work with an HP 1663 or HP 1664. Also, you need an
analyzer with an internal oscilloscope for chapters 7 and 8. If your
analyzer has an oscilloscope, you will see a "CS" after the model
number. To do the exercises in chapter 9, you will need an analyzer
with an internal pattern generator. If your analzyer has a pattern
generator, you will see a "CP" after the model number.
Materials needed
You need the following materials to complete the exercises in this
training kit:
• One HP 1660 or HP 1670 Series Logic Analyzer
• This training kit (part number HP E2433-60012)
• Probe assembly (part number HP 01650-61608) or termination
adapter (part number HP 01650-63203)
• One HP 10461A TTL Data Pod
iv
Page 5

Introduction
Using a Mouse
You can perform all of the exercises in this training kit using a mouse.
When an instruction tells you to highlight an item and press the
key, you can simply point to that item with the mouse pointer and
press the left mouse button. When you want to scroll up or down a
list, you can press and hold down the right mouse button and move
the mouse forward and backward. Remember, to scroll a field, the
field must be highlighted and have the knob icon at the top of the field.
With a mouse, some of the pop-up menus will have different
appearances from the figures in this guide. For example, when you
select a label and choose modify label from the pop-up menu, a
keypad pop-up appears. This allows you to enter text and numbers
using the mouse rather than the keypad on the front panel of the
analyzer.
Select
Configuration Disk
This kit includes a disk containing configuration files for the analyzer.
The files for each chapter of the training guide set up the analyzer so
you can perform an exercise. This allows you to perform the
exercises in any order. You do not need to use the configuration files
to do the exercises if you are working straight through this training
guide, chapter by chapter.
Getting Unexpected Results
If you get lost or the results of an exercise seem to be different than
this guide indicates, the system may have a previously set
configuration that prevents the exercise steps from working properly.
To remedy this, you can cycle the power on the analyzer and restart
the exercise, or load the configuration files for the exercises you want
to do.
v
Page 6

In This Book
This book will teach you how to set up and make measurements with the
HP 1660 Series and HP 1670 Series Logic Analyzers.
You can use this book in two ways: you can start at the beginning and
progress chapter by chapter in a building block approach, or you can
randomly access the exercises you want to do with minimum setup.
Chapter 1 contains an overview of how to use the analyzer and how to make a
measurement.
Chapters 2 through 9 contain measurement exercises designed to be
completed quickly and to teach you the skills you need to start making
successful measurements in your work environment.
Chapter 10 contains an introduction to inverse assembly.
Chapter 11 contains information about setting the jumpers on the training
board and loading the configuration files.
Chapter 12 is a reference chapter describing the training board. It includes a
schematic diagram of the training board circuitry.
If you need additional details on the operation of your logic analyzer, refer to
the User’s Guide supplied with your system.
vi
Page 7

Contents
1 Using the Analyzer and Understanding the Measurement
Process
Using the Analyzer 1–3
Understanding the Measurement Process 1–4
2 Introduction to Timing Analysis
Before You Begin 2–3
Put the Analyzer into Timing Mode 2–4
Change a Label Name 2–5
Modify Channel Assignments 2–6
Define a Term for the Timing Trigger 2–7
Set Up the Trigger Specification 2–8
Trigger on the Term and Examine the Waveform 2–9
3 Introduction to State Analysis
Before You Begin 3–3
Put the Analyzer into State Mode 3–4
Set Up the State Clock 3–5
Change a Label Name 3–6
Modify Channel Assignments 3–7
Define a Term for the State Trigger 3–8
Set Up Level 1 of the State Trigger Specification 3–9
Set Up Level 2 of the State Trigger Specification 3–10
Run the State Analyzer and View and Change the State Listing 3–11
Create Symbols to Display State Data 3–12
Create Additional Symbols 3–13
Select and View Symbols in the State Listing 3–14
4 Comparing State Traces
Before You Begin 4–3
Check the Configuration 4–4
Set Up the State Trigger Specification 4–5
Run the Analyzer and View the State Listing 4–6
Copy the State Listing to the Compare Reference Listing 4–7
vii
Page 8

Contents
Change the Jumper to Acquire a Different State Listing 4–8
Run the Analyzer and Find the Errors 4–9
5 Mixed Mode - Correlation of State and Timing Data
Before You Begin 5–3
Connect the Timing Analyzer 5–4
Put the Analyzer into State and Timing Modes 5–5
Change a Label Name and Modify Channel Assignments 5–6
Turn on the TCOUNT Label in the Waveform Menu 5–6
Clear the Timing Analyzer Trigger 5–7
Set Up the State Trigger Specification 5–7
Enable Time Correlation between the Timing and State Analyzers 5–8
Arm the Timing Analyzer with the State Analyzer 5–9
View the Mixed-Mode Display with Time-Correlated Markers 5–10
6 Advanced State Triggering
Before You Begin 6–3
Put the Analyzer into State Mode 6–4
Define State Trigger Terms "a" through "d" 6–5
Define State Trigger Term "e" and Range1 6–6
Add State Trigger Sequence Levels 6–7
Set Up Level 1 of the State Trigger Specification 6–8
Set Up Level 2 of the State Trigger Specification 6–9
Set Up Level 3 of the State Trigger Specification 6–10
Set Up Level 4 of the State Trigger Specification and Define a Combination
Trigger Term 6–11
Check the Trigger Specification 6–13
Run the State Analyzer and View the Data 6–14
7 Using the Oscilloscope
Before You Begin 7–3
Connect the Channel 1 Oscilloscope Probe 7–4
Get the Waveform on the Display 7–5
Delete Channel 2 from the Display 7–6
Zoom and Scroll Through the Clock Waveform 7–7
viii
Page 9

Measure the Clock Period Manually 7–8
Measure the Clock Period with Auto Measure 7–9
Read Voltage with the Markers 7–10
8 Triggering the Oscilloscope with the Timing Analyzer
Before You Begin 8–3
Set the Jumpers 8–4
Connect the Oscilloscope Probe 8–5
Get the Waveform on the Display 8–6
Change the Oscilloscope Trigger 8–7
Turn On the Timing Analyzer 8–8
Set Up the Timing Format Menu 8–9
Define the Timing Trigger Term "Edge 1" 8–10
Set Up the Timing Trigger Specification 8–11
Arm the Oscilloscope with the Timing Analyzer 8–12
Add Oscilloscope Waveform to the Timing Waveforms 8–13
Capture the Glitch with the Timing Analyzer and Oscilloscope 8–14
Align the Glitch Displayed by the Oscilloscope and Analyzer 8–15
Contents
9 Using the Pattern Generator
Before You Begin 9–3
Connect the Pattern Generator 9–4
Turn On the Timing Analyzer 9–5
Change a Label Name 9–6
Modify Channel Assignments 9–7
Set Up the Timing Analyzer Trigger Term 9–8
Add a Pattern Generator Label to the Timing Waveform Display 9–9
Set Up the Pattern Generator Format Menu 9–10
Program the Pattern Generator Output 9–12
Add Program Lines 9–13
Start the Pattern Generator and View the Walking Ones Pattern 9–14
Stop the Pattern Generator 9–15
ix
Page 10

Contents
10 Introduction to Inverse Assembly
Load the Inverse Assembler and Sample Listing 10–3
View the Address, Data, and Status Labels 10–4
View the Assembly Listing 10–5
Filter the Captured Data 10–6
11 Setting the Jumpers and Loading the Configurations
To Set the Jumpers 11–3
To Load a Configuration File 11–5
12 All About the Logic Analyzer Training Board
Power Source 12–2
Circuit Description 12–2
Jumpers 12–3
Schematic 12–4
x
Page 11

1
Using the Analyzer and Understanding the Measurement Process
Page 12

Using the Analyzer and Understanding the
Measurement Process
This chapter teaches you how to use the HP benchtop analyzer to
complete the exercises in this training kit. You will also learn the
general process of making a measurement.
You can refer back to this chapter whenever you have problems
moving around in the interface or following the measurement process.
In this chapter you will learn how to:
• Highlight a field
• Select a field
• Scroll through lists and menus
• Understand the measurement process
1–2
Page 13
Using the Analyzer and Understanding the Measurement Process
Using the Analyzer
Using the Analyzer
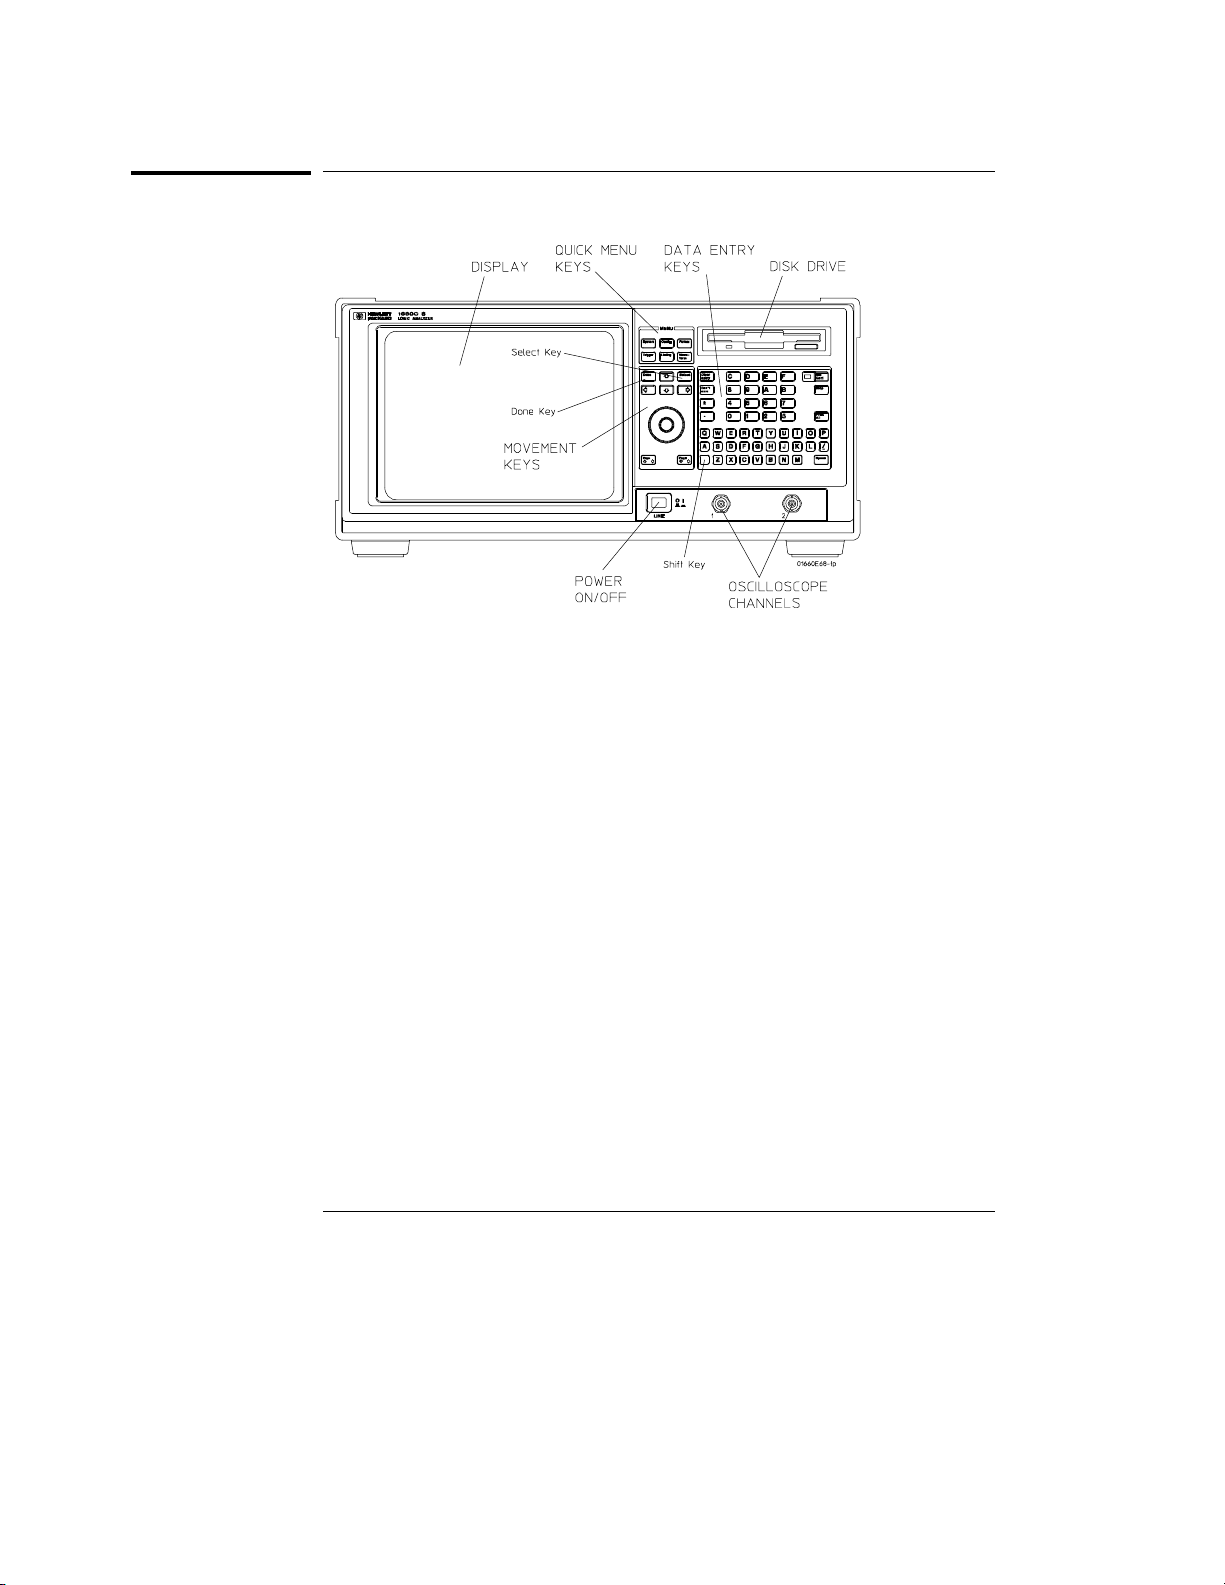
Front Panel
To Highlight a Field
Use the movement keys (⇐, ⇑, ⇒, ⇓) to move the cursor within and between
fields on the display. When the cursor is in a field, the field becomes
highlighted.
To Select a Field
Use the the movement keys (⇐, ⇑, ⇒, ⇓) to highlight the field you want to
select, then press the Select key. The type of field highlighted will determine
what will happen when the Select key is pressed. If the field is an option
field, the Select key brings up an option menu, or if there are only two
possible values, the Select key toggles the value in the field. If the
highlighted field performs a function, the Select key starts the function. If
the highlighted field is a menu choice, the Select key selects the menu choice.
To Scroll Through Lists and Menus
Use the knob to change the value in a field, to scroll the display, and to move
the cursor in pop-up menus. If you are using a mouse, you can do the same
actions by holding down the right button of the mouse while dragging.
1–3
Page 14
Using the Analyzer and Understanding the Measurement Process
Understanding the Measurement Process
Understanding the Measurement Process
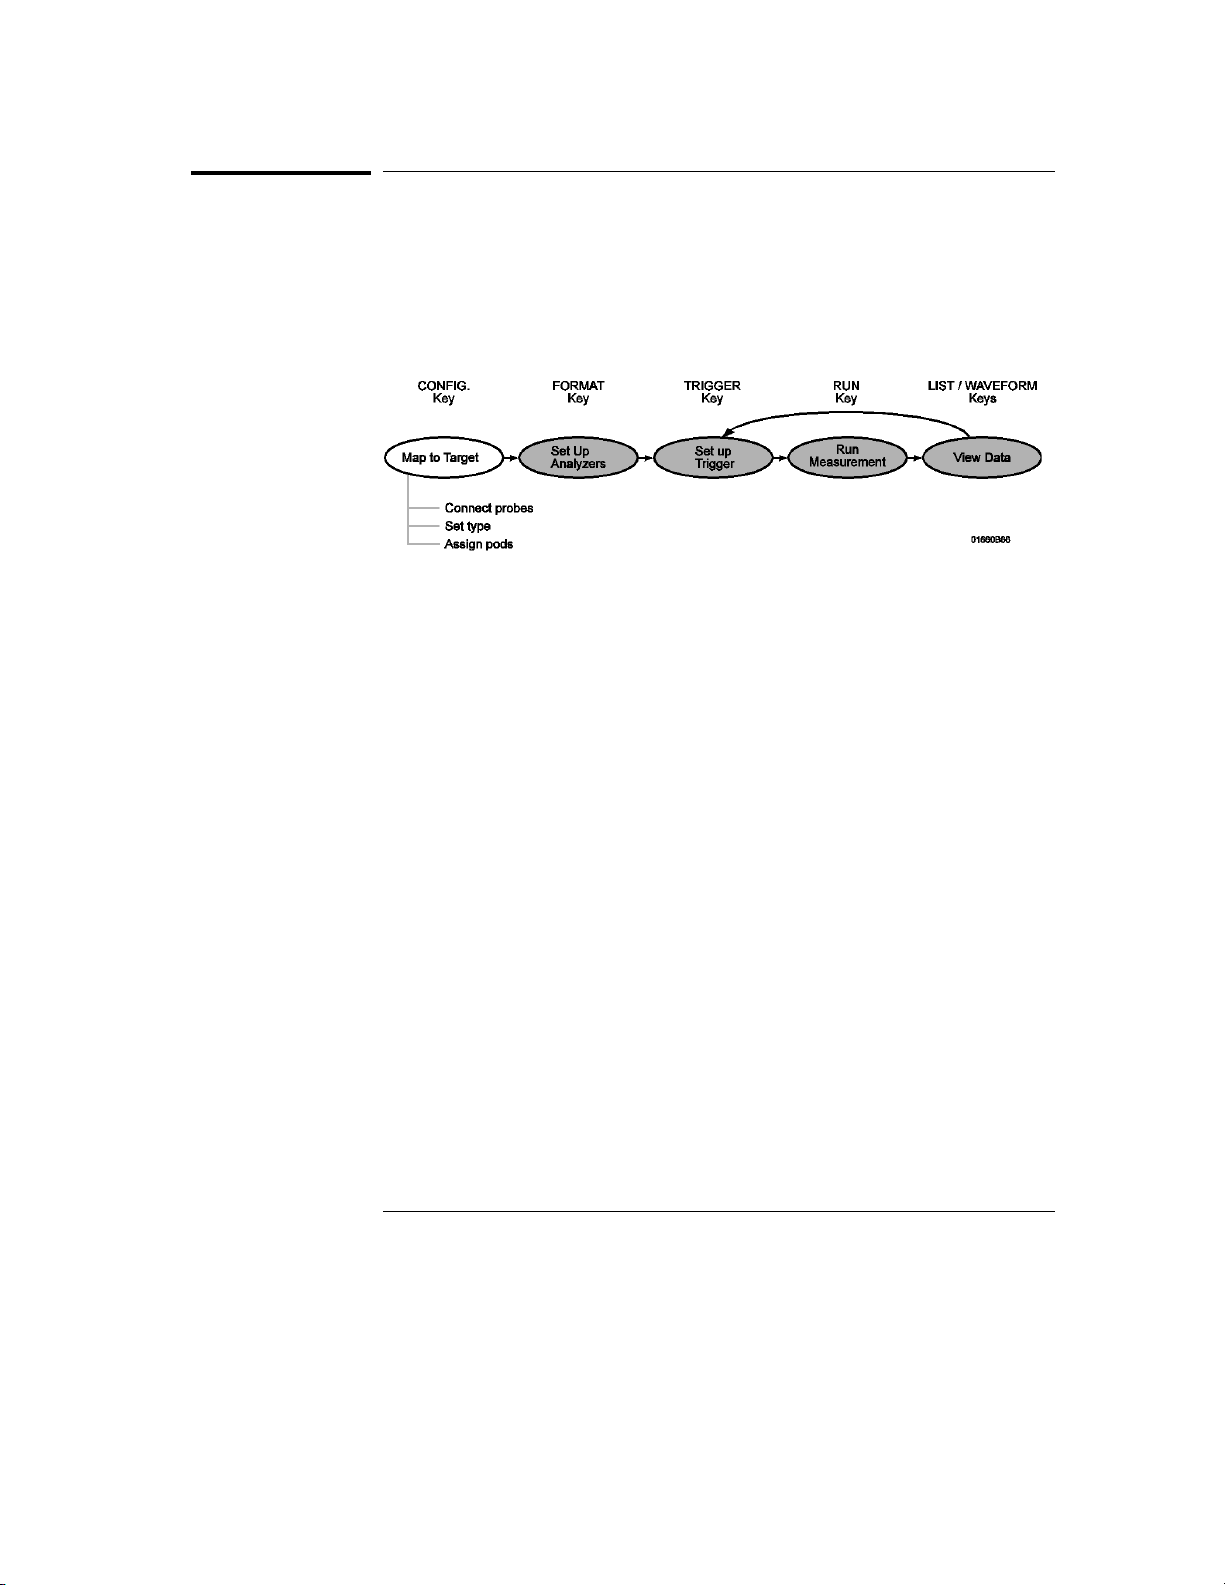
Whenever you make a basic measurement, there is a sequence of events that
you will go through. Referring back to this measurement process will help
you to better understand the exercises as you complete them.
1 Map to target
Connect probes Connect probes from the target system to the logic
analyzer to physically map the target system to the channels in the logic
analyzer. Attach probes to a pod in a way that keeps logically-related
channels together. Remember to ground the pod. For the logic analysis
lessons you will connect pods 1 and 3, for the oscilloscope lessons you
will also connect an oscilloscope probe, and for the pattern generator
lesson you will connect a pattern generator pod and TTL Data Pod to the
training board.
Set type The analyzer has three modes: the timing analyzer mode, the
state analyzer mode, and the system performance (SPA) mode. The
exercises in this training kit will teach you about the first two modes,
timing and state. The timing mode uses the clock within the analyzer
and the state mode uses the clock supplied by the target system. When
the logic analyzer is turned on, Analyzer 1 is named Machine 1 and is set
to timing mode, and Analyzer 2 is off. To use state analysis, you must set
the analyzer mode to state. You can use state and timing modes
together, but you can’t set both analyzer modes to timing.
Assign pods In the Analyzer Configuration menu, assign the connected
pods to the analyzer you want to use. The number of pods on your logic
analyzer depends on the model. Pods are paired and are always assigned
as a pair to a particular analyzer.
1–4
Page 15
Using the Analyzer and Understanding the Measurement Process
Understanding the Measurement Process
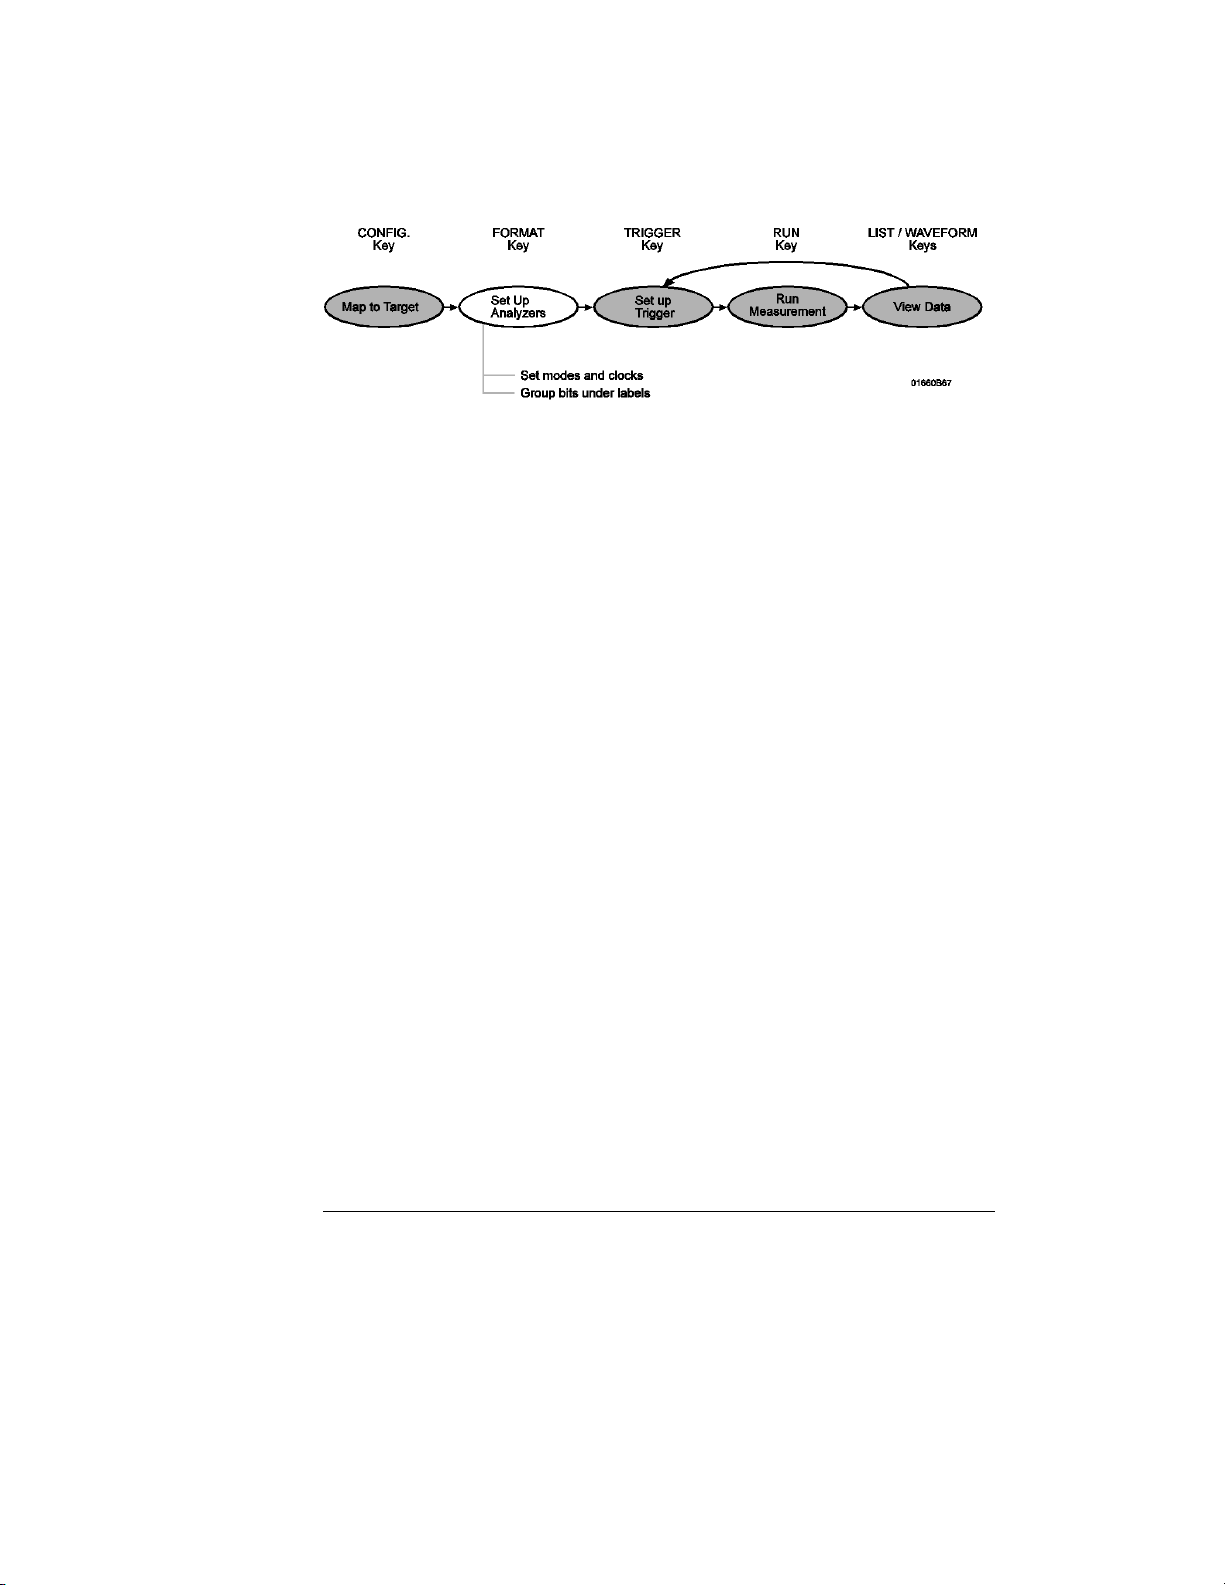
2 Set up analyzers
Set modes and clocks Set the state and timing analyzer modes using
the Analyzer Format menu. In general, these modes trade channel count
for speed or storage. If your state clock is set incorrectly, the data
gathered by the logic analyzer might indicate an error where none exists.
Group bits under labels The Analyzer Format menu indicates active
pod bits. You can create groups of bits across pods or subgroups within
pods and name the groups or subgroups using labels.
1–5
Page 16
Using the Analyzer and Understanding the Measurement Process
Understanding the Measurement Process
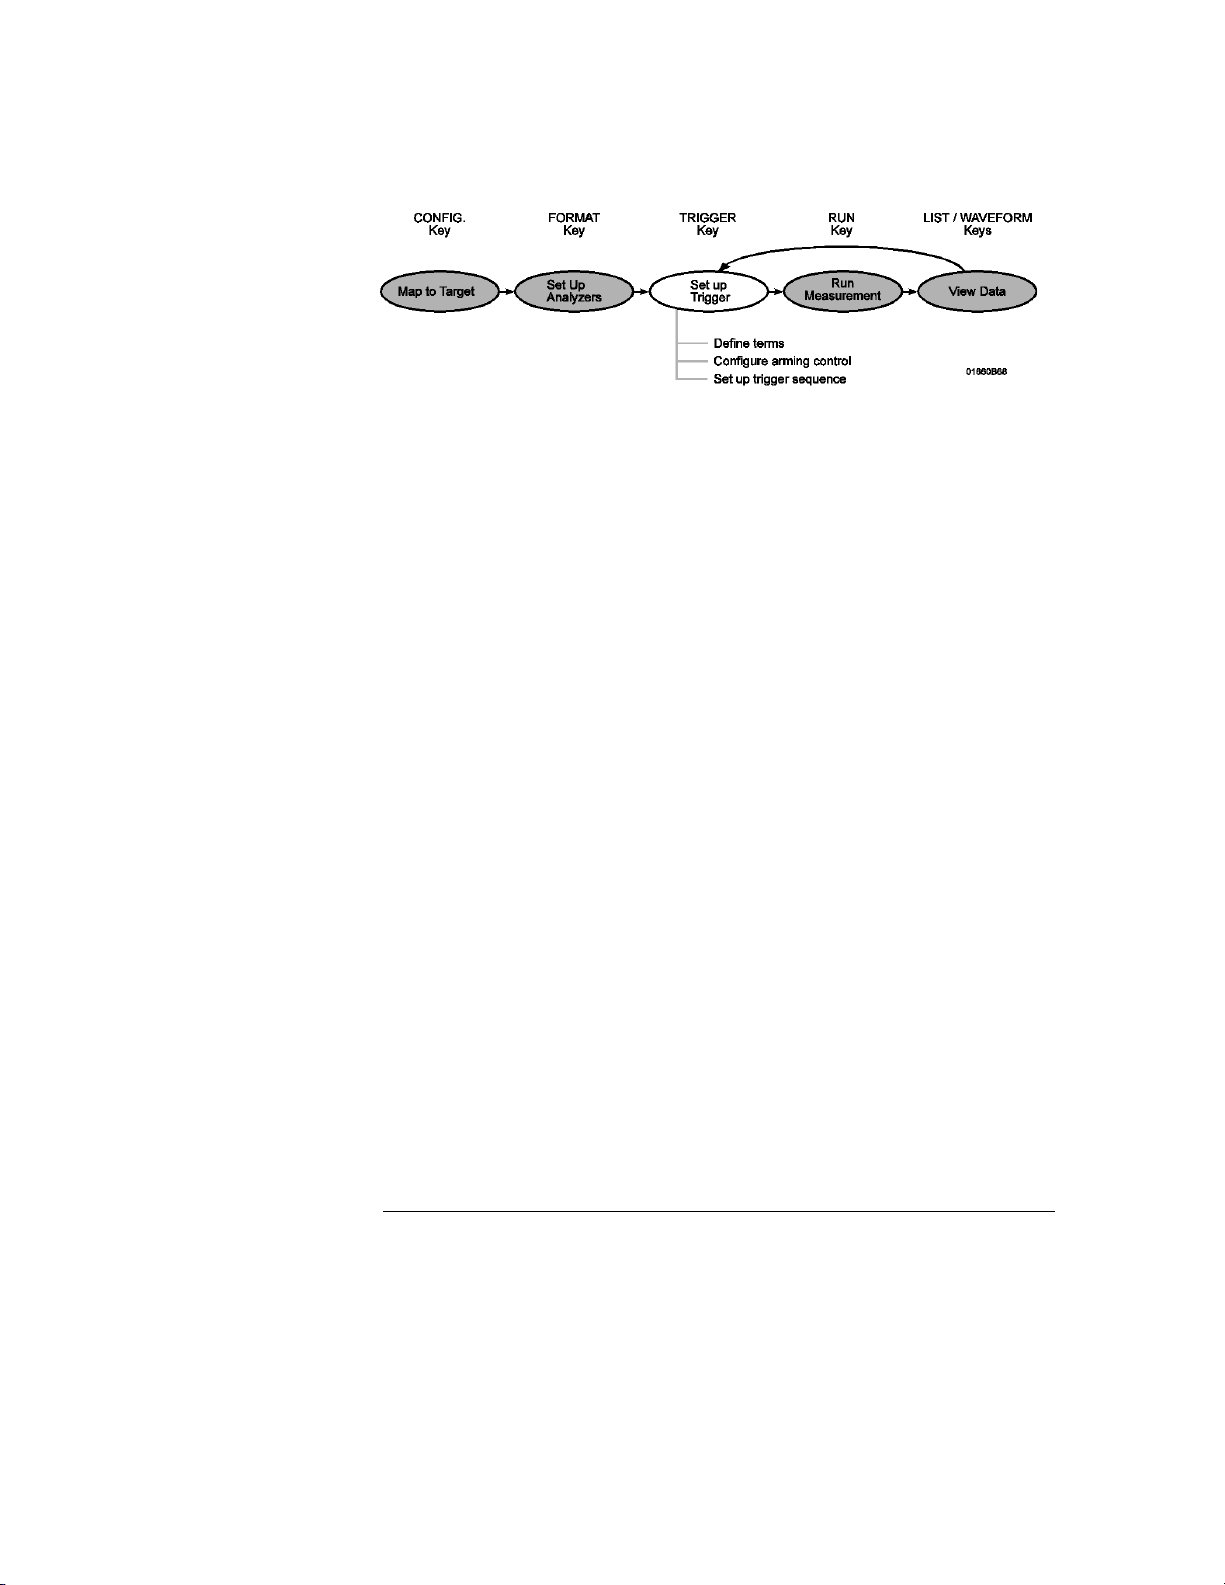
3 Set up trigger
Define terms In the Analyzer Trigger menu, define trigger variables
called terms to match specific conditions in your target system. Terms
can match patterns, ranges, or edges across multiple labels.
Configure Arming Control Use Arming Control if:
you want to correlate the triggers and data of both analyzers
•
you want to use the analyzer to trigger an external instrument or the
•
built-in oscilloscope
you want to use an external instrument or the built-in oscilloscope to
•
trigger the analyzer
Set up trigger sequence Create a sequence of steps that control what
the analyzer captures. For common tasks, you can use a trigger macro to
simplify the process or use the user-defined macros to loop and jump in
sequence.
1–6
Page 17
Using the Analyzer and Understanding the Measurement Process
Understanding the Measurement Process
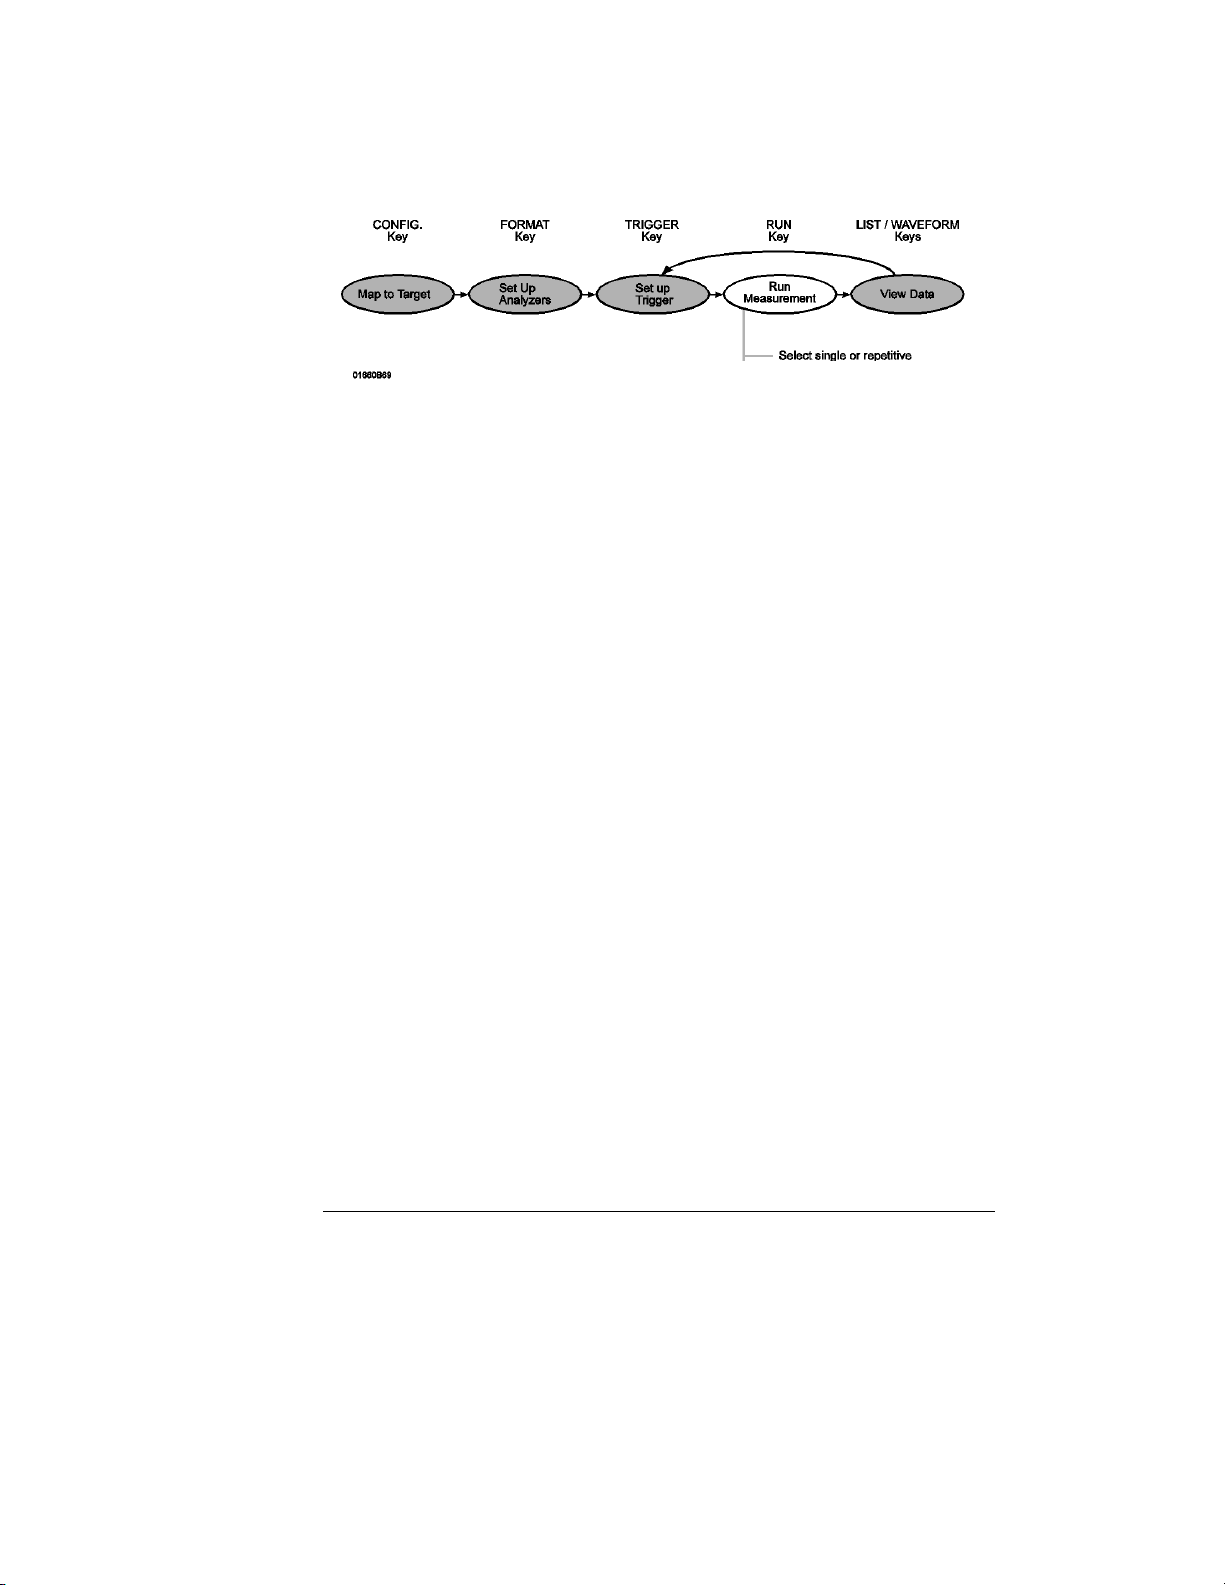
4 Run Measurement
Select single or repetitive From any Analyzer or Scope menu, select
the field labeled Run in the upper right corner to start the measurement,
or press the Run key. A "single" run will run once, until memory is full; a
"repetitive run" will run until you select Stop or until a stop measurement
condition is fulfilled, which you set in the markers menu.
1–7
Page 18
Using the Analyzer and Understanding the Measurement Process
Understanding the Measurement Process
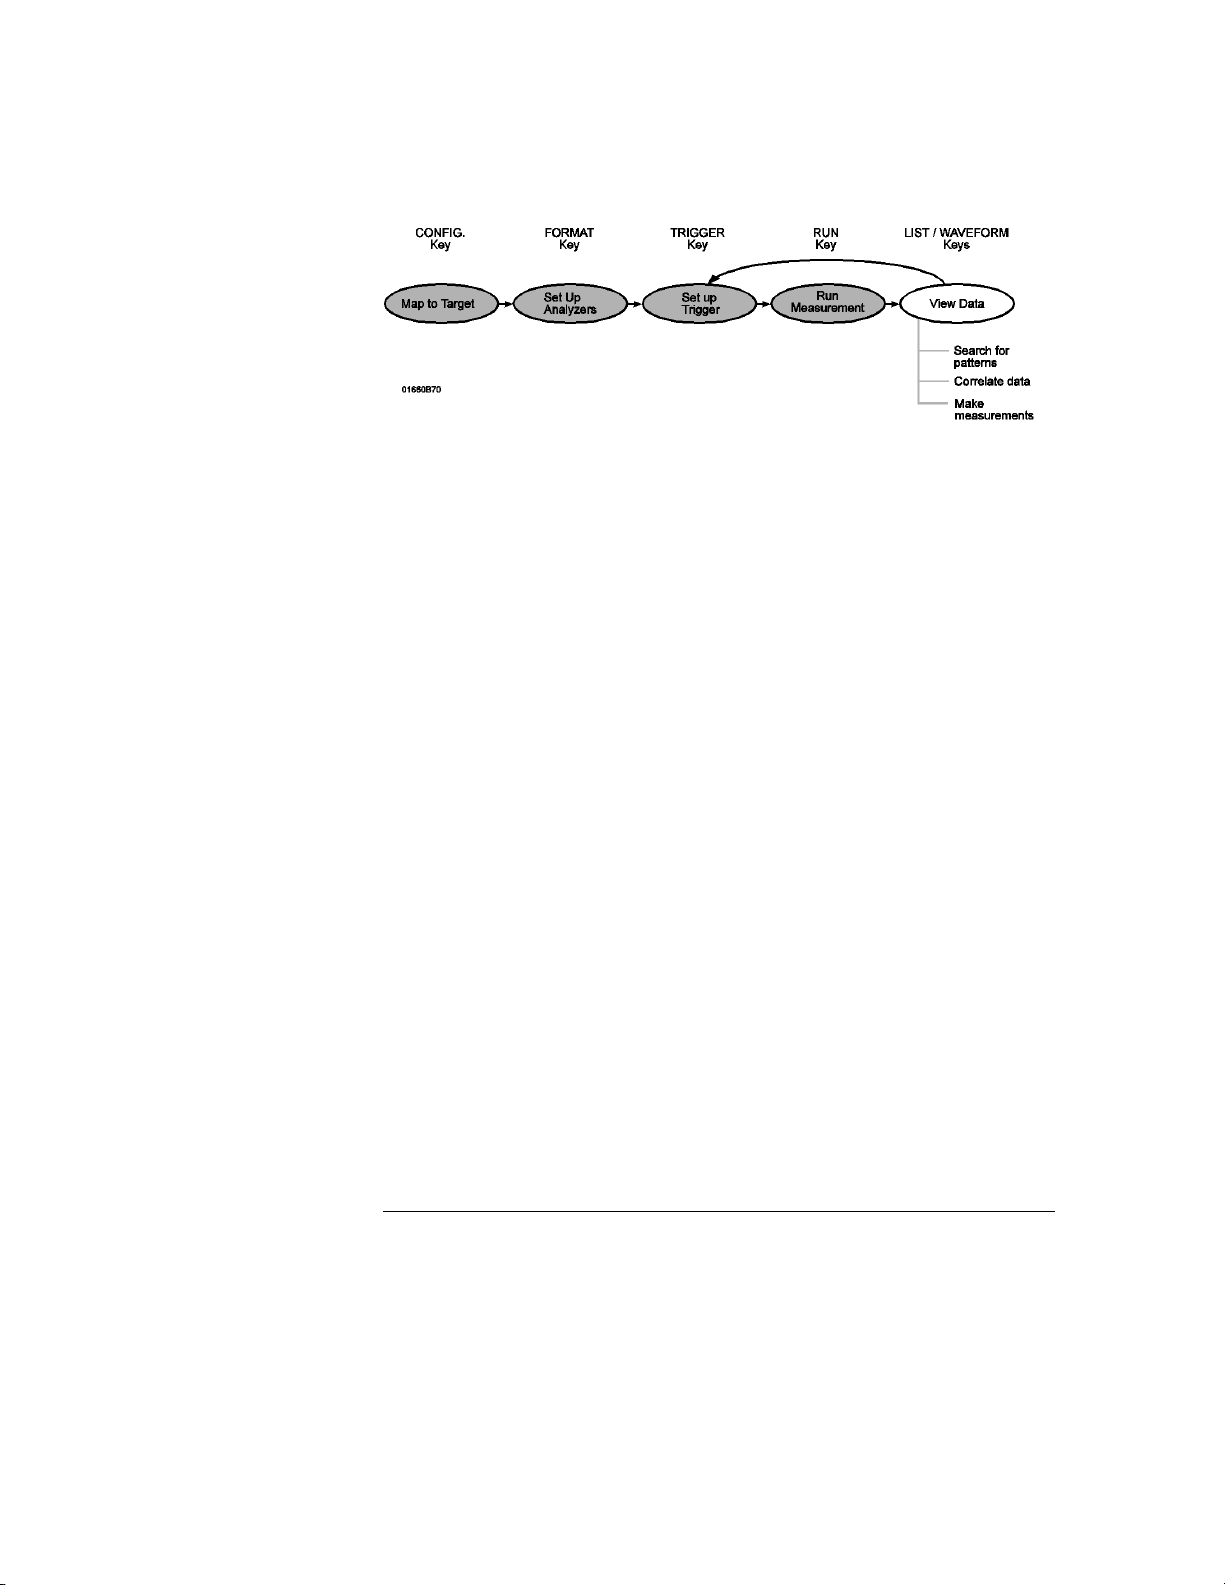
5 View data
Search for patterns In both the Waveform and Listing menus you can
use symbols and markers to search for patterns in your data. In the
Analyzer Waveform or Analyzer Listing menu, toggle the Markers field to
turn the pattern markers on and then specify the pattern. When you
switch views, the markers keep their settings.
Correlate data You can correlate data by setting Count Time in your
state analyzer’s Trigger menu and then using interleaving and mixed
display. Interleaving correlates the listings of two state analyzers. Mixed
display correlates a timing analyzer waveform and a state analyzer listing,
or a state analyzer and an oscilloscope waveform, or a state analyzer and
both timing and oscilloscope waveforms. To correlate oscilloscope data,
the oscilloscope arm mode must be set to Immediate. The System
Performance Analysis (SPA) Software does not save a record of actual
activity, so it cannot be correlated with either timing or state mode.
Make measurements The markers can count occurrences of events,
measure durations, and collect statistics, and SPA provides high-level
summaries to help you identify bottlenecks. To use the markers, select
the appropriate marker type in the display menu and specify the data
patterns for the marker. To use SPA, go to the SPA menu, select the
most appropriate mode, fill in the parameters, and press Run.
1–8
Page 19

2
Introduction to Timing Analysis
Page 20

Introduction to Timing Analysis
Timing analysis in its simplest form means acquiring and storing data
at equal time intervals. When doing timing analysis you must put the
logic analyzer into timing mode. An analyzer in timing mode is
referred to as a timing analyzer. The timing analyzer’s time interval is
controlled by a clock inside the analyzer, just like the clock in a
digitizing oscilloscope. However, there are key differences between a
timing analyzer and a digitizing oscilloscope. These key differences
are channel count and voltage resolution. A logic analyzer typically
has a large number of channels, and it displays signals at only two
voltage levels, a logic high or a logic low. A digitizing oscilloscope
typically has fewer channels, but it can display signals with much finer
voltage resolution.
To determine whether a given sample of data should be stored and
displayed as a logic high or a logic low, the timing analyzer compares
the data to a threshold voltage. The threshold voltage works just like
the threshold voltage in logic circuits. If the voltage level of the
sampled data is above the threshold, the analyzer stores a logic high
(a "1"). If the voltage level of the data is below the threshold, the
analyzer stores a logic low (a "0").
The exercises in this chapter step you through the process of making
a timing measurement.
In this chapter, you will:
• Put the analyzer into timing mode
• Change a label name
• Modify channel assignments
• Define a term for the timing trigger
• Set up the trigger specification
• Trigger on the term and examine the waveform
2-2
Page 21
Introduction to Timing Analysis
Before You Begin
Before You Begin
1 Decide what to do next.
If you have just completed "Ready, Set, Run", go to "Change a Label Name" on
page 2-5.
If you have not just completed "Ready, Set, Run" go to step 2.
Turn off the analyzer by pressing the power switch. Wait at least five
2
seconds, then press the power switch again to turn on the logic
analyzer.
Cycling the power defaults all system settings. This sets up the analyzer so
you can perform the remaining exercises.
Connect Pod 1.
3
Connect Pod 1 of the analyzer to J1 on the Training Board. For the HP 1660s
analyzer, Pod 1 is the top cable in the left-most position when you are facing
the rear of the logic analyzer. For the HP1670s, Pod 1 is the top cable in the
right-most position when you are facing the rear of the logic analyzer.
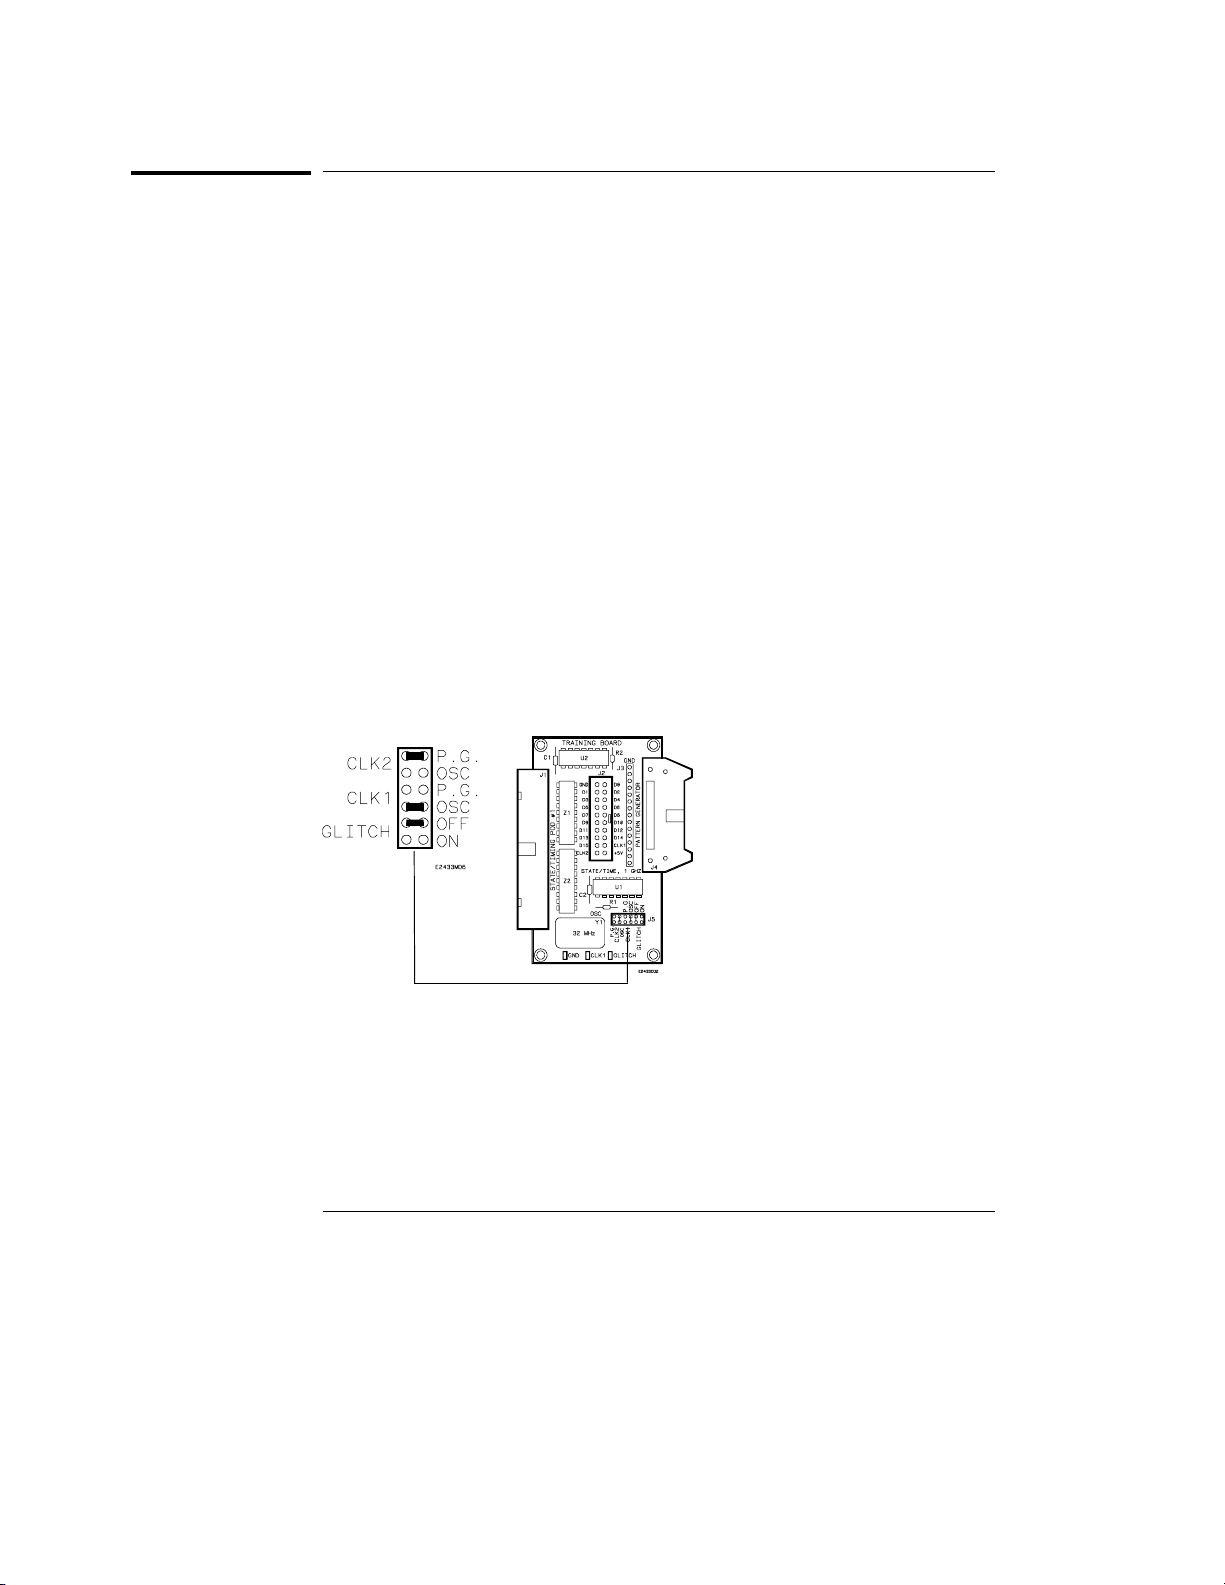
Set the jumpers as shown below.
4
The jumper settings of J5 on the training board for this chapter are the same
as the default settings.
J1
Setting the Jumpers
See Also "To Set the Jumpers" and "To Load a Configuration File" in chapter 11 for
more information.
2-3
Page 22
Introduction to Timing Analysis
Put the Analyzer into Timing Mode
Put the Analyzer into Timing Mode
When you first turn on the analyzer, the Configuration Menu is displayed with
Analyzer 1 set to Timing mode. This is the mode the analyzer needs to be in
to do timing analysis. Timing analysis uses the clock inside the analyzer to
sample data at consistent time intervals.
Note If the analyzer is in Timing mode, continue on to "Change a Label Name"
on the next page.
If the analyzer is not in timing mode, put it in timing mode now by following
the steps below.
If you are not already in the Configuration menu, press the Config MENU
1
key.
2 In the Analyzer 1 box, highlight the field to the right of Type, and press
Select key.
the
3 Highlight Timing in the pop-up menu, and press the Select key.
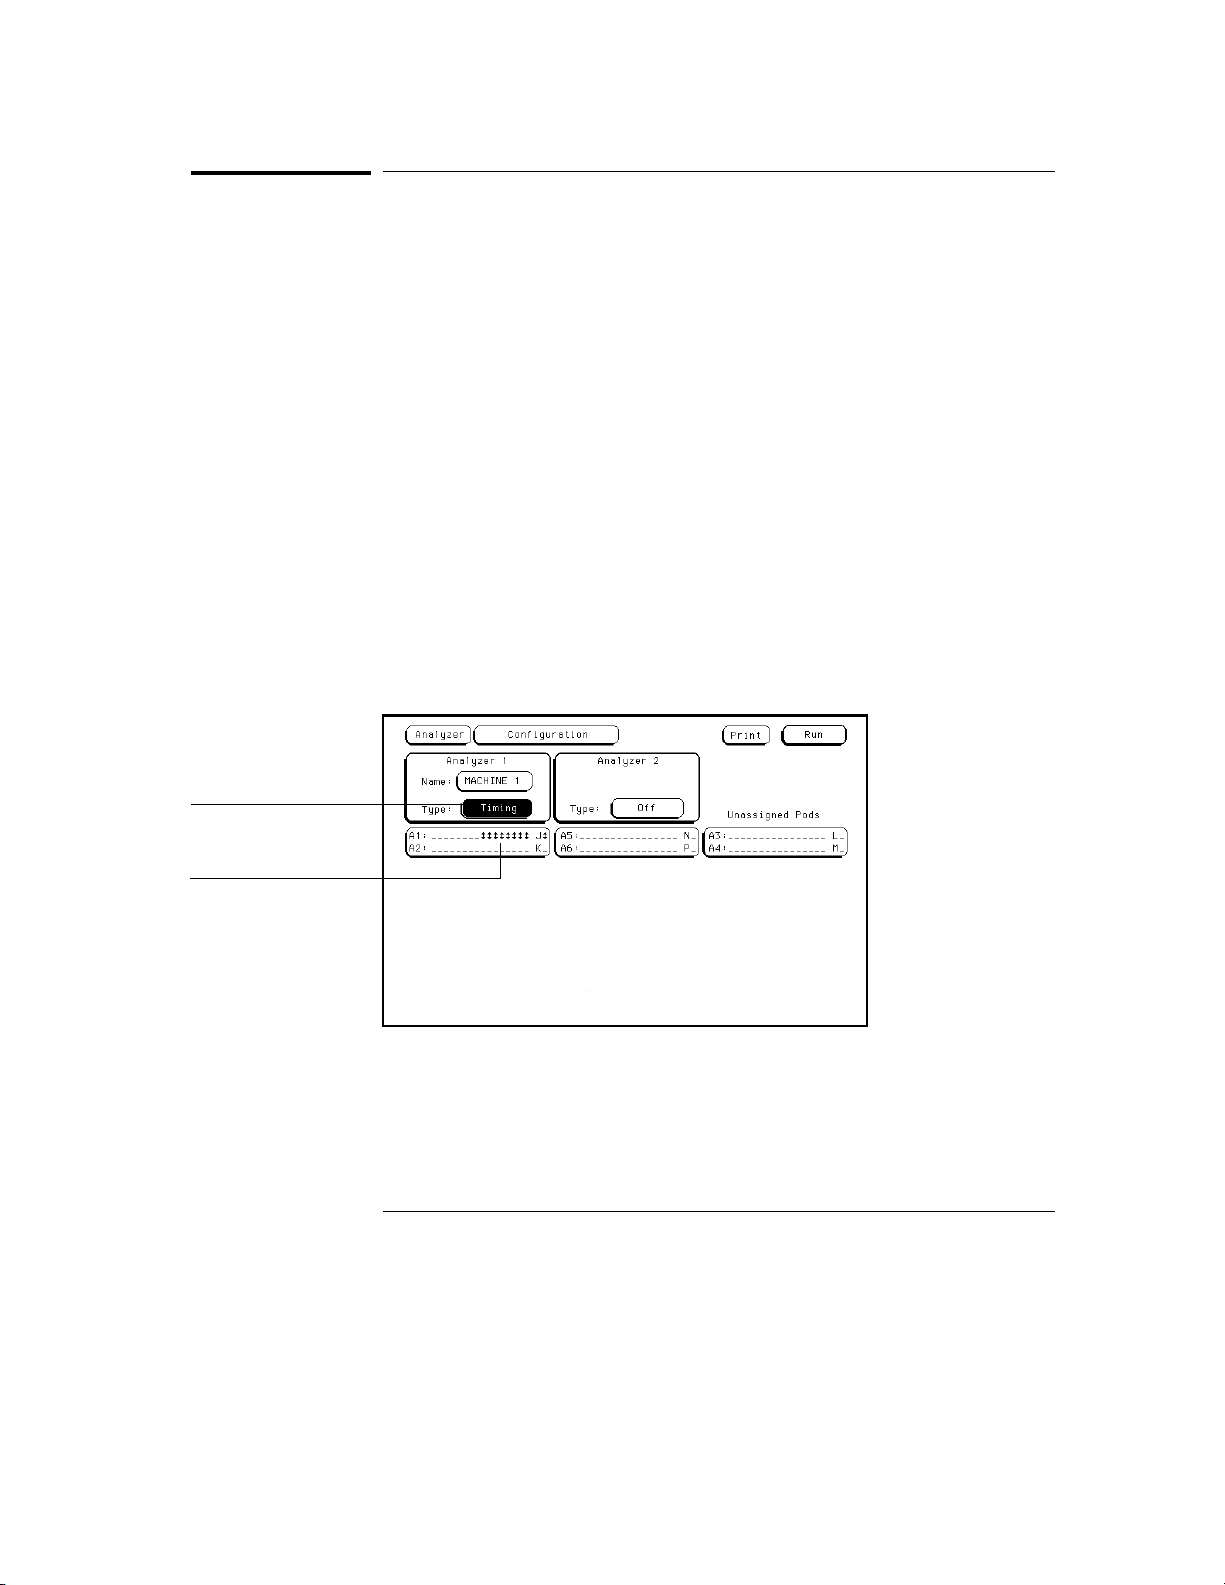
Unless your analyzer is an HP 1661 or an HP 1671, your Configuration Menu
will look different than the one shown below because your analyzer has a
different number of data pods.
The analyzer is in
Timing mode.
Pod A1 has arrows on
the lower eight channels
and the J-clock
channel, indicating that
transitions across the
threshold voltage are
occurring on these
channels.
Putting the Analyzer into Timing Mode
Result The analyzer is in timing mode with activity showing on the lower eight
channels and the J-clock channel of pod A1.
2-4
Page 23
Introduction to Timing Analysis
Change a Label Name
Change a Label Name
Labels group channels together. You can rename a label to make it more
meaningful. For example, you could use the label name DATA for all of the
channels that are connected to the data bus of a microprocessor.
In this exercise, you will change a label name to TCOUNT to represent the
timing count data captured from the 8-bit ripple counter on the training
board. The counter counts from 0 to 255 (0 to FF in hex) repetitively.
Press the Format MENU key.
1
2
Use the arrow keys (⇑ ⇓ ⇐ ⇒) to highlight Lab1.
Type TCOUNT using the keypad on the front panel of the analyzer.
3
You can use the knob or the left and right arrow keys to backspace the cursor
if you need to correct a typing error.
Press the Done key.
4
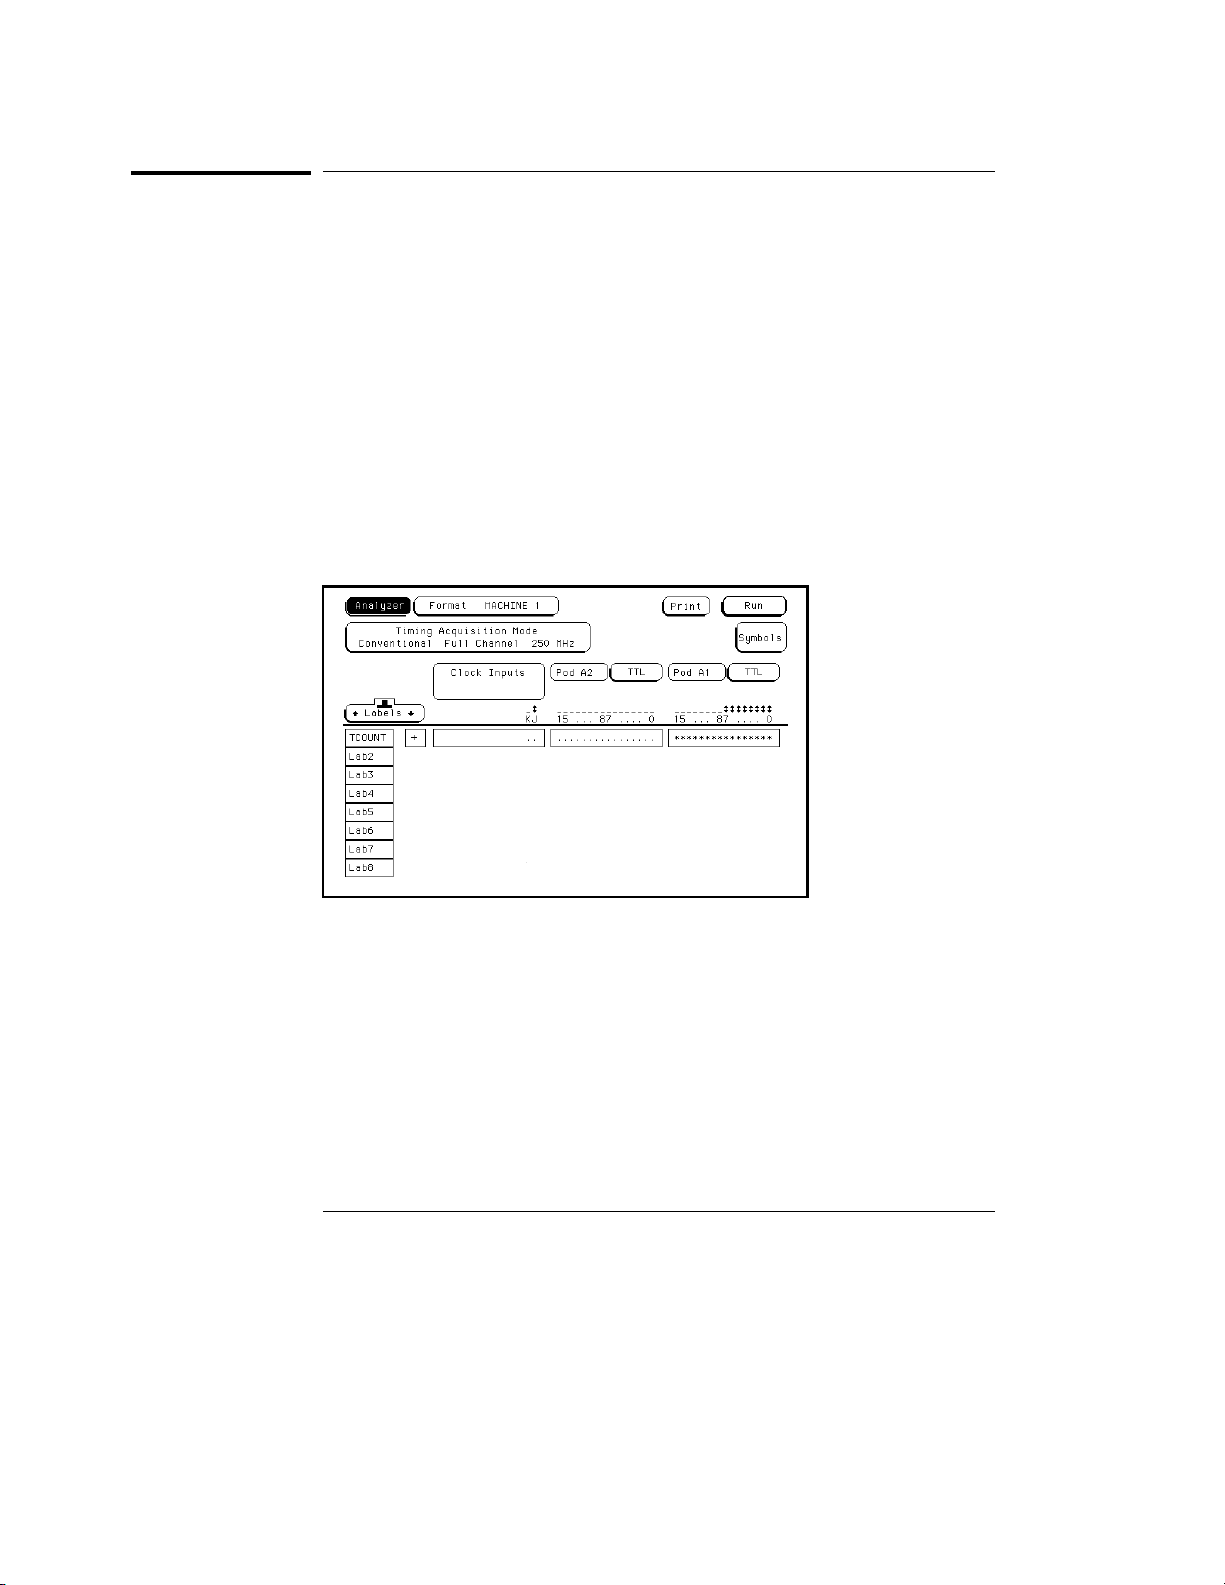
Changing a Label Name
Result The label is now named TCOUNT, which represents timing count.
2-5
Page 24
Introduction to Timing Analysis
Modify Channel Assignments
Modify Channel Assignments
In this exercise, you will assign the active bits of pod A1 to the label TCOUNT.
1 Using the arrow keys, highlight the field showing the 16 channels of
Pod A1, to the far right of the TCOUNT label. Press the
2 Press the Clear Entry key to clear the default bit assignments.
3 Use the knob to move the cursor to channel 7 in the pop-up menu.
4
Press the ⇑ (up-arrow) key to put asterisks in the lower eight channel
positions.
5 Press the Done key.
Select key.
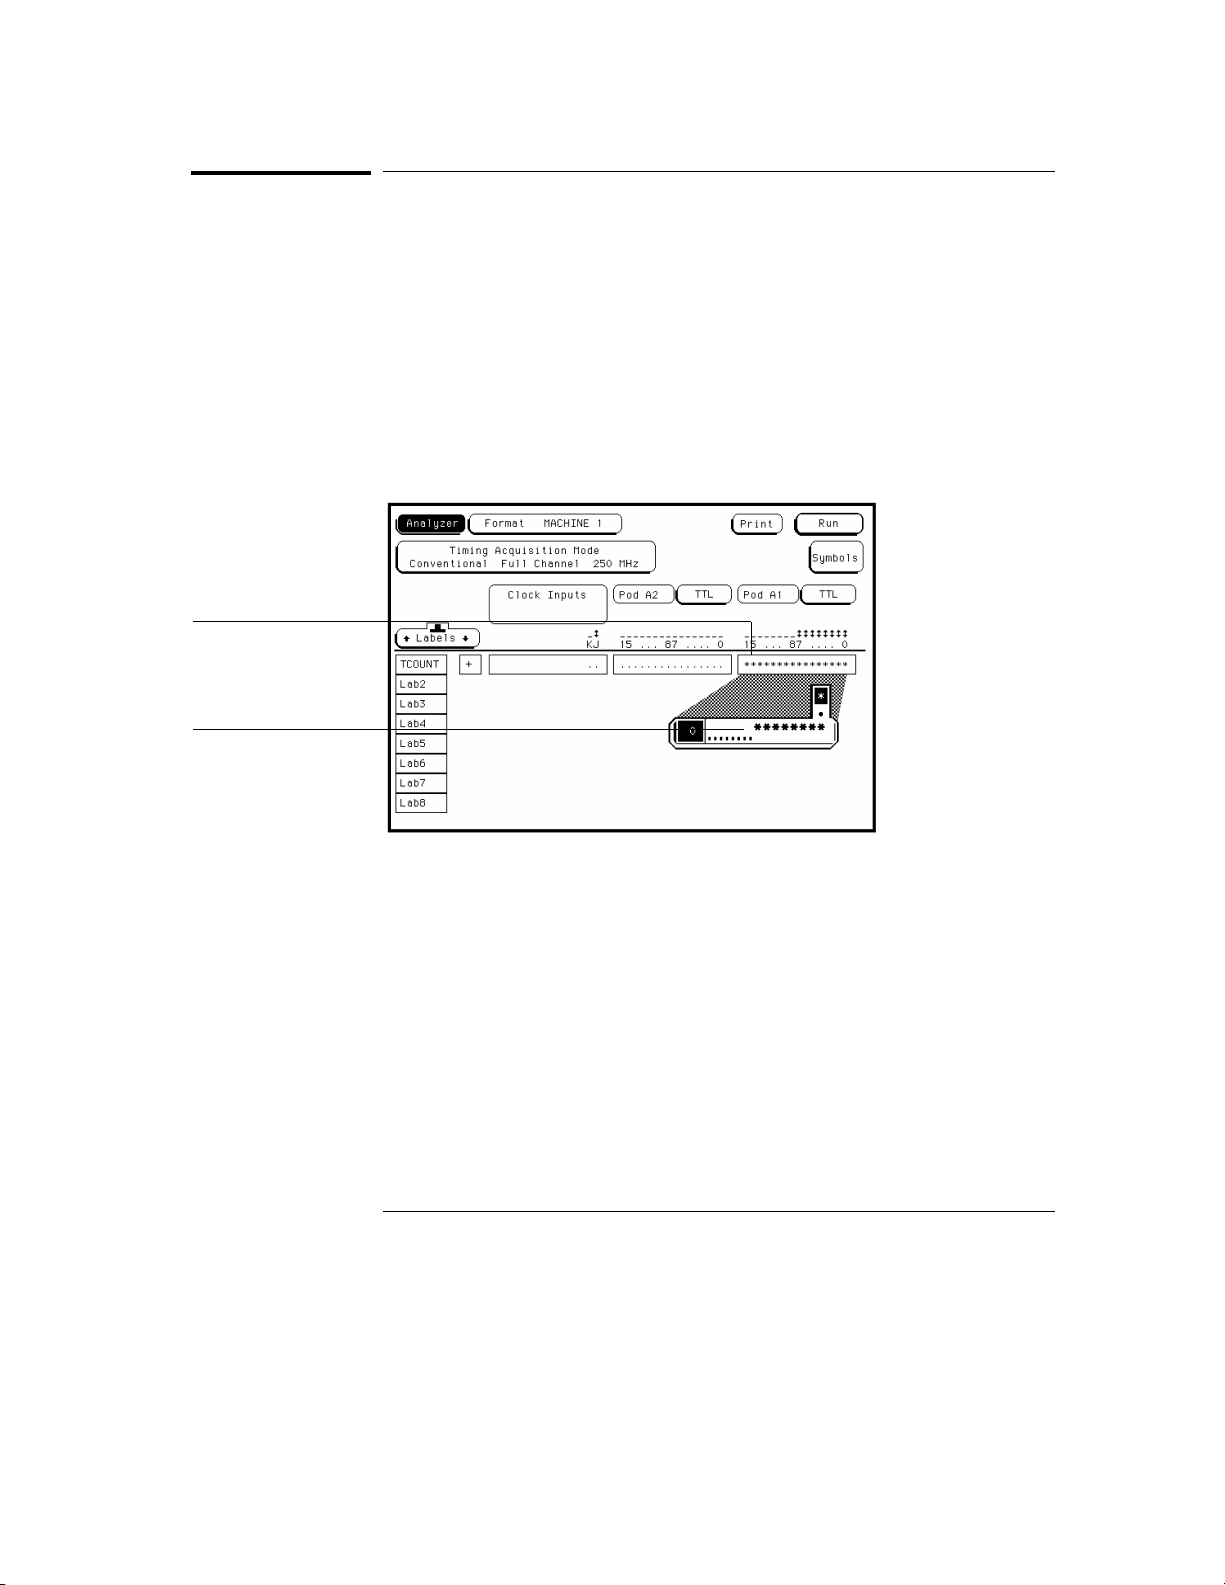
Pod A1 has 16
channels and is
connected to the
training board.
An asterisk (*) assigns
a channel to a label. In
this exercise, the lower
eight channels are
assigned to TCOUNT.
Modifying Channel Assignments
Result The lower 8 channels of pod A1 are assigned to the label TCOUNT.
2-6
Page 25
Introduction to Timing Analysis
Define a Term for the Timing Trigger
Define a Term for the Timing Trigger
For the analyzer to capture the data you want, you need to tell it what to
trigger on by defining a term. Trigger terms are variables that you can use to
tell the analyzer when to start recording data, what to store, and when to
stop.
In this exercise, you will set up the analyzer to trigger when the counter on
the training board reaches its maximum value of 255, or FF (hex). To do this,
you will assign the hex value FF to term "a" of TCOUNT.
Press the Trigger MENU key.
1
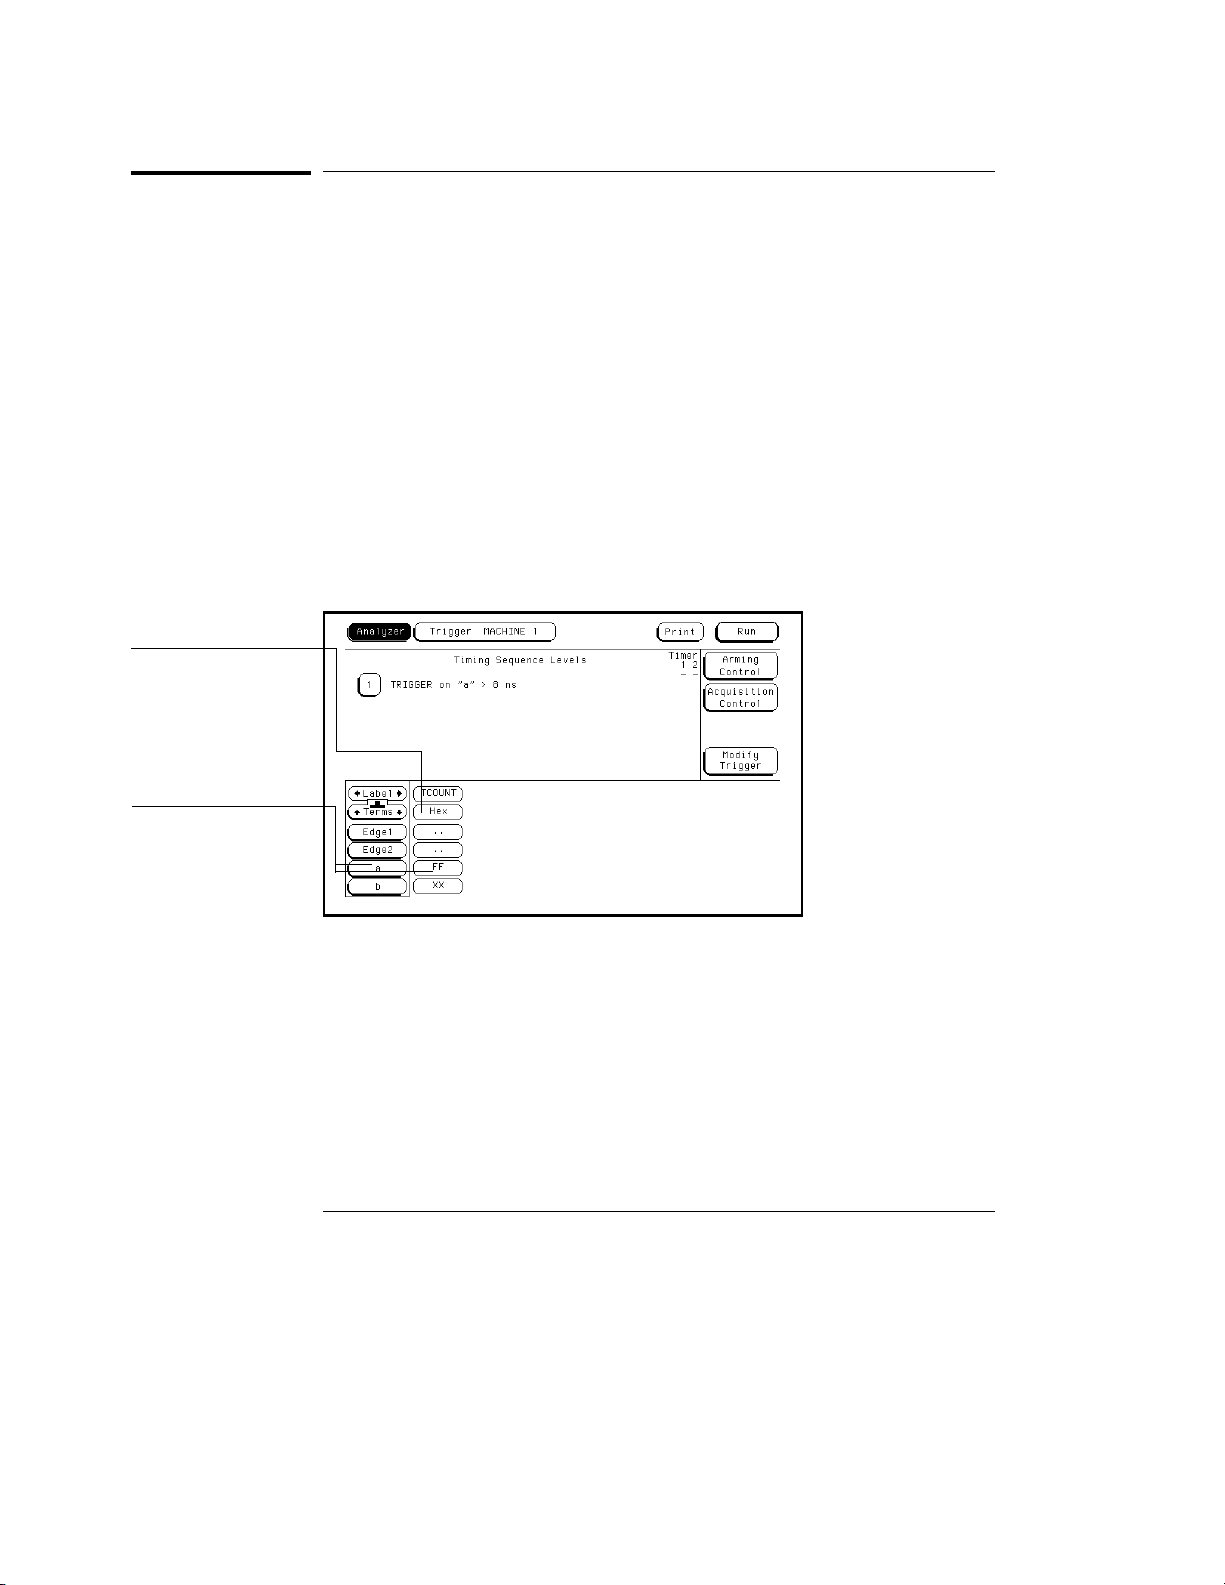
2 Highlight the base field under TCOUNT and press the Select key.
3 Highlight Hex in the pop-up menu, press the Select key.
Hex is the default setting. Notice the other display options other than hex.
4 Under TCOUNT, highlight the field to the right of term a, enter FF,
and press the
Done key.
The base field specifies
the type of values
entered. In this
exercise you selected
Hex and entered the
hex value FF.
A term is a variable
that stores a value.
Defining a Term for the Timing Trigger
Result TCOUNT’s term "a" is assigned the value FF. The "a" term is a variable that
the analyzer will trigger on once you set up the trigger specification in the
next exercise.
2-7
Page 26
Introduction to Timing Analysis
Set Up the Trigger Specification
Set Up the Trigger Specification
Using the pattern term FF that you set in the previous exercise, you will now
set up the analyzer to record the data after FF occurs on the eight channel
bus.
Highlight the 1 field in the Timing Sequence Levels box of the Trigger
1
menu, and press the
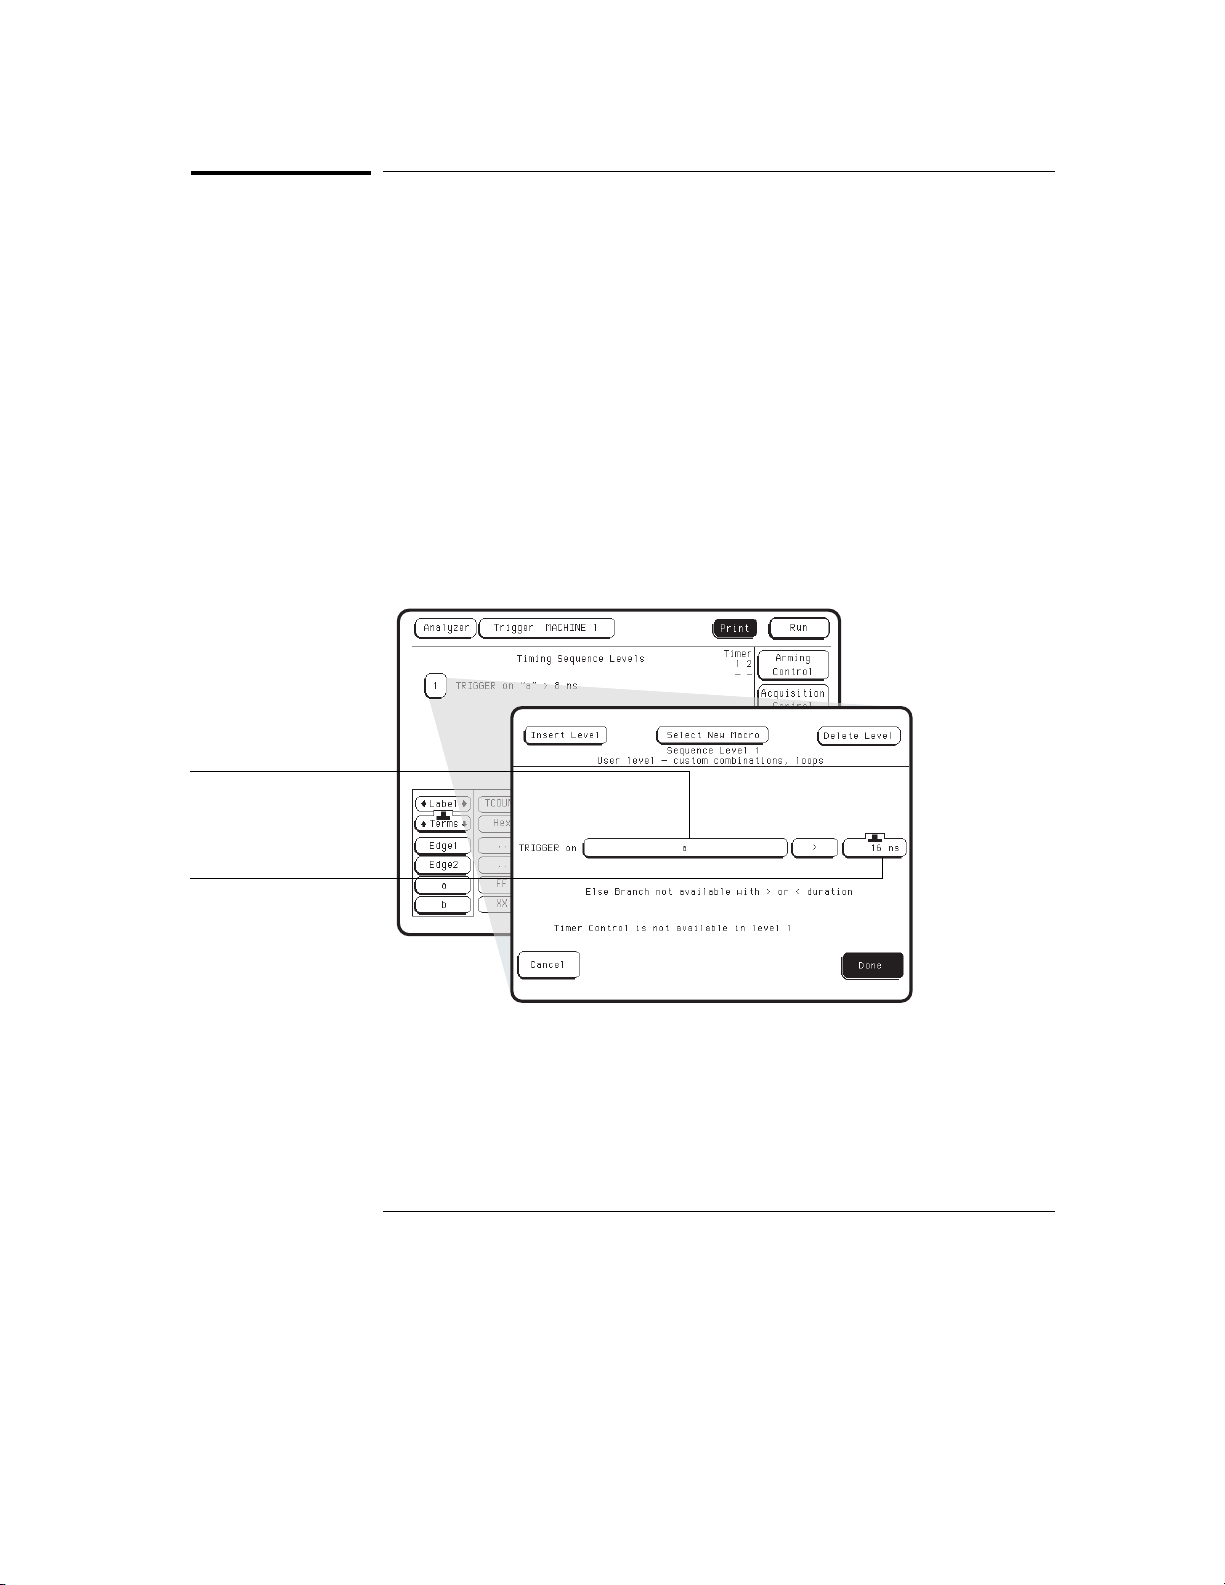
2 Highlight the field to the right of Trigger On, and press the Select key.
3 Highlight term a and press the Done key.
4 Highlight the field to the right of >, and turn the knob to select 16 ns
for the pattern duration.
Setting the duration to 16 ns ensures that the analyzer will trigger when the
counter on the training board is in a stable state. A shorter duration might
cause the analyzer to trigger when the counter is transitioning.
Press the Done key to close the Timing Sequence Level 1 pop-up menu.
5
Select key.
The trigger term "a"
has the hex value FF
that you assigned to it.
The pattern duration is
set to 16 ns. The value
FF must be present for
16 ns before triggering.
Setting Up the Trigger Specification
Result Your trigger specification now shows: Level 1 - TRIGGER on "a" > 16 ns. The
analyzer triggers when the term "a" (FF) is detected for a minimum duration
of 16 ns.
2-8
Page 27
Introduction to Timing Analysis
Trigger on the Term and Examine the Waveform
Trigger on the Term and Examine the Waveform
When you press the Run key, the analyzer triggers on the term you set up in
the previous exercise, captures the data, and then switches to the Waveform
menu where the data is displayed.
Press the Run key.
1
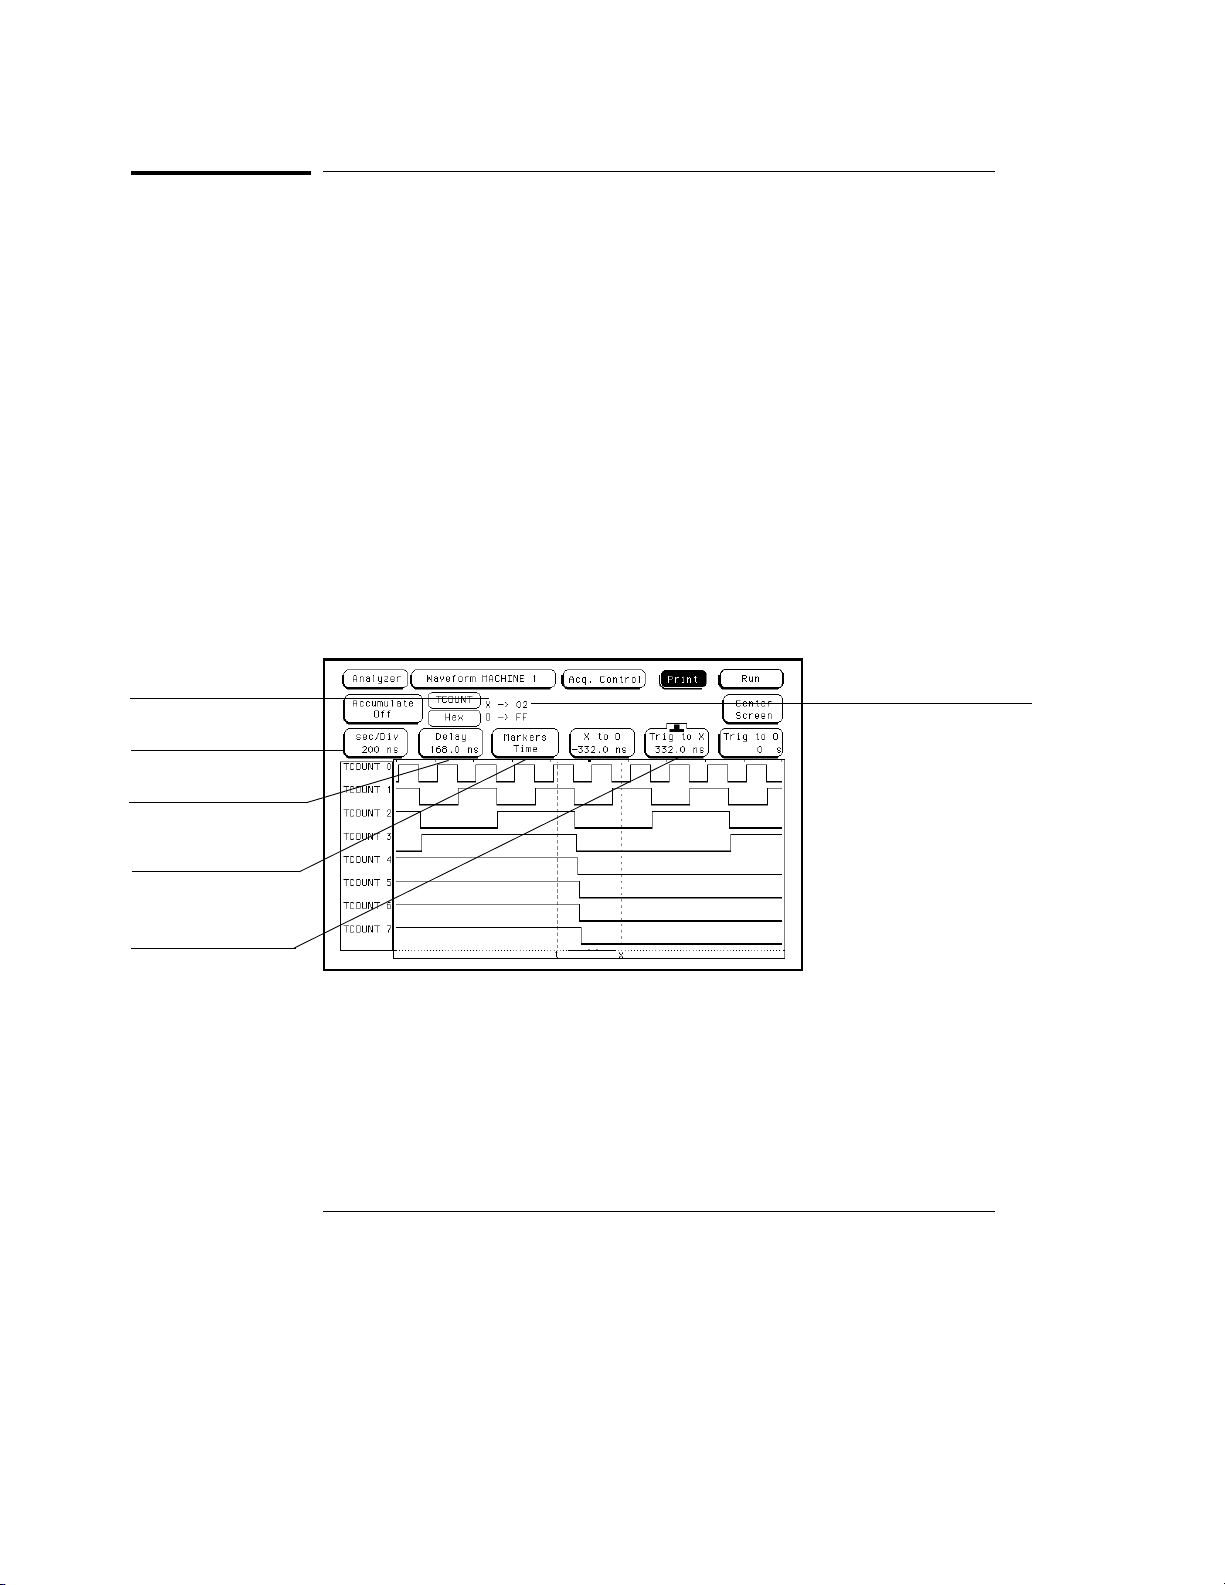
2 Use the table below to examine the waveform.
To Do This: Do This:
To scale the waveform
To scroll through the waveform
To measure a time interval
Highlight the
to zoom in and counter clockwise to zoom out. If you
zoom out enough you can view the entire acquisition
buffer.
Highlight the
direction to scroll through the data.
Highlight the
key. Choose Time from the pop-up menu. Highlight the
sec/Div field, then turn the knob clockwise
Delay field, then turn the knob in either
Markers Off field, then press the Select
Trig to X field, then turn the knob to move the X marker.
Hex value of waveform
at X-marker
Sec/Div (zoom)
Delay
Markers
Trig to X
As you move the X-marker
past transitions on the
waveform, the hex value to
the right of X-> changes,
showing you the value of
the TCOUNT label at the
current X-marker position.
Triggering on the Term and Examining the Waveform
3 Highlight the Markers Time field. Press the Select key, then select Off.
2-9
Page 28

2-10
Page 29

3
Introduction to State Analysis
Page 30

Introduction to State Analysis
State analysis in its simplest form means acquiring data and storing it
when it is valid for a system under test. When doing state analysis,
you must put the analyzer into state mode. The differences between
state mode and timing mode are the source of the sample clock and
the way the data is displayed. In state analysis, the source of the
sample clock is the system under test, rather than the analyzer, and
the default display is a sequential listing of logical states, rather than a
waveform.
Each time the analyzer receives a state clock pulse, it samples and
stores the logic state of the system under test. Just as in the timing
analyzer, the state analyzer compares sampled data to a threshold
voltage to determine whether it should be stored and displayed as a
logic high or a logic low. The analyzer then displays the data as a
sequential listing of logical states.
What makes the analyzer more than just a data acquisition instrument
is its capability to acquire and store only the data that you specify.
This is called data qualification. Examples of storing qualified data
include storing only a certain subroutine in a program, storing all data
being sent to a specified address in a system, or storing only data
leading up to a system failure.
In this chapter, you will:
• Put the analyzer into state mode
• Set up the state clock
• Change a label name and modify channel assignments
• Define a term for the state trigger
• Set up the trigger specification
• Run the analyzer and view and change the state listing
• Create and view symbols
3-2
Page 31

Introduction to State Analysis
Before You Begin
Before You Begin
1 Decide what to do next.
If you have just completed the exercises in chapter 2, go to "Put the Analyzer
Into State Mode" on the next page. Otherwise, continue to step 2.
If you are using an HP 1660 series analyzer, load the Analyzer with the
2
configuration file, CH03_60._A. If you are using an HP 1670 series
analyzer, load the
For instructions on loading configuration files, see "To Load a Configuration
File" in chapter 11.
The file defaults all system settings and sets up the analyzer as if you had just
completed the exercises in chapter 2.
Unless you are using an HP 1661 or an HP 1671 analyzer, you may see an
advisory message when you load the files. This is not an error. The message
is displayed because these logic analyzers have a different number of data
pods from the HP 1661, which was used to create the files.
Connect Pod 1.
3
Connect Pod 1 of the analyzer to J1 on the Training Board. For the
HP 1660s, Pod 1 is the top cable in the left-most position when you are facing
the rear of the logic analyzer. For the HP 1670s, Pod 1 is the top cable in the
right-most position when you are facing the rear of the logic analyzer.
Set the jumpers as shown below.
4
The jumper settings for this chapter are the same as the default settings.
Analyzer with the configuration file, CH03_70._A.
CLK2
CLK1
GLITCH
Setting the Jumpers
P. G.
OSC
P. G.
CLK2
OFF
ON
J1
See Also "To Set the Jumpers" and "To Load a Configuration File" in chapter 11 for
more information.
3-3
Page 32

Introduction to State Analysis
Put the Analyzer into State Mode
Put the Analyzer into State Mode
To make a state measurement, you must set the analyzer to state mode. The
state mode uses the clock supplied by the system under test to control when
data is sampled.
Press the Config MENU key.
1
2 In the Analyzer 1 box, highlight the field to the right of Type, and press
Select key.
the
3 Highlight State in the pop-up menu, and press the Select key.
Unless you are using an HP 1661 or an HP 1671 analyzer, your Configuration
Menu will look different than the one shown below because your analyzer has
a different number of data pods than the HP 1661, which was used to create
the figure.
The analyzer is in state
mode.
Pod A1 has arrows on
the lower eight channels
and the J-clock channel,
indicating that
transitions across the
threshold voltage are
occurring on these
channels.
Putting the Analyzer into State Mode
Result The analyzer is now in state mode showing activity on the lower eight
channels and the J-clock channel of pod A1.
3-4
Page 33

Introduction to State Analysis
Set Up the State Clock
Set Up the State Clock
The state clock is a signal from the system under test that clocks the
analyzer, causing the analyzer to sample and store data.
Press the Format MENU key.
1
2 Highlight the Master Clock field in the upper center of the display.
Press the
Your display will look different from the one shown in the figure below if you
are using an HP 1662, 1663, 1664, or an HP 1672 analyzer. There are fewer
clock lines available on these analyzers than on an HP 1661, which was used
to create the figure.
3
Highlight the J field, and press the Select key. Highlight the ↓ (down
arrow) in the pop-up menu, and press the
an HP 1670 series analyzer, you also need to set the
4 Press the Done key to close the Master Clock pop-up menu.
Select key.
Select key. If you are using
L field to OFF.
The down arrow
represents a negative
edge. The negative
edge of the clock is used
to get the best results
from the training board.
Setting Up the State Clock
Result The analyzer will collect data on the falling edge of the J clock.
3-5
Page 34

Introduction to State Analysis
Change a Label Name
Change a Label Name
Labels group channels together. You can rename a label to make it more
meaningful. For example, you could use the label name DATA for all of the
channels that are connected to the data bus of a microprocessor.
In this exercise, you will change Lab2 to SCOUNT to represent the state
count data. The label is named SCOUNT so that you can keep track of the
counter output acquired by the state analyzer.
Highlight the label Lab2 below the Labels field.
1
2 Type SCOUNT, then press the Done key.
3 Highlight the field labeled TCOUNT, and press the Select key.
Highlight
If you have already performed the Introduction to Timing Analysis exercises
in chapter 2, this field will be the TCOUNT label, which represents timing
count. Turning the label off now saves it for later use.
Turn Label Off in the pop-up menu, and press the Select key.
Changing a Label Name
Result The label TCOUNT is turned off and Lab 2 is now named SCOUNT, which
represents state count.
3-6
Page 35

Introduction to State Analysis
Modify Channel Assignments
Modify Channel Assignments
In this exercise, you will assign the lower eight channels of pod A1 to the
label SCOUNT.
Highlight the field showing the 16 channels of Pod A1 to the far right
1
of the SCOUNT label. Press the
2 Using the knob, move the cursor to channel 7 in the pop-up menu.
Then, press the ⇑ (up-arrow) key to put asterisks in the lower eight
channel positions.
3 Press the Done key.
Select key.
Pod A1 has 16
channels and is
connected to the
training board.
The asterisks (*)
assign the lower 8
channel positions to
the label SCOUNT.
Modify the Channel Assignments
Result The lower eight channels of pod A1 are assigned to the label SCOUNT.
3-7
Page 36

Introduction to State Analysis
Define a Term for the State Trigger
Define a Term for the State Trigger
For the state analyzer to capture the data you want, you need to tell it what
to trigger on by defining a term. Trigger terms are used in the trigger
specification to tell the analyzer when to start recording data, what to store,
and when to stop.
Press the Trigger MENU key.
1
2 Highlight the base field under SCOUNT, and press the Select key.
Highlight
Hex is the default setting. Notice that there are other display options other
than hex.
Under SCOUNT, highlight the field to the right of b, enter 00, and
3
press the
The "b" term is a variable to which you can assign a value.
Hex in the pop-up menu, and press the Select key.
Done key.
The base field is used
to specify the type of
values entered.
A term is a variable that
stores a value. In this
exercise, you selected
Hex, and entered the
hex value 00 for the "b"
term.
Define a Term for the State Trigger
Result SCOUNT’s "b" term is assigned the value 00 (hex). The "b" term is a variable
that the analyzer will trigger on once you set up the trigger specification in
the next exercise.
3-8
Page 37

Introduction to State Analysis
Set Up Level 1 of the State Trigger Specification
Set Up Level 1 of the State Trigger Specification
In the next two exercises, you will set up the sequence of events that you
want the logic analyzer to follow when triggering and storing data. In this
exercise you will set Level 1 to store all data occurring before the trigger
pattern is found.
Highlight the 1 field in the State Sequence Levels box of the Trigger
1
menu. Press the
2 Highlight the field to the right of Trigger on, and press the Select key.
Highlight
3 Press the Done key to close the Sequence Level 1 pop-up menu.
b in the pop-up menu, and press the Done key.
Select key.
The b term holds
the value 00.
Setting Up Level 1 of the State Trigger Specification
Result The state analyzer stores all samples, starting from the time you press run,
and continuing until the trigger pattern 00 is found.
3-9
Page 38

Introduction to State Analysis
Set Up Level 2 of the State Trigger Specification
Set Up Level 2 of the State Trigger Specification
In sequence level 1 the analyzer stores data before the trigger point. For
sequence level 2, you will tell the analyzer to store any data once the trigger
pattern is found. This will fill the rest of the acquisition memory.
Highlight the 2 field in the State Sequence Levels box. Press the Select
1
key.
2 Highlight the field to the right of Store, and press the Select key.
Highlight
3 Press the Done key to close the Sequence Level 2 pop-up menu.
anystate in the pop-up menu, and press the Done key.
Once the trigger pattern
is found, the logic
analyzer will store any
data that it samples.
Setting Up Level 2 of the State Trigger Specification
Result The State Trigger Specification is now:
Level 1 - While storing "anystate", TRIGGER on "b" 1 time
Level 2 - Store "anystate"
If your trigger specification does not match this one, repeat the exercises,
starting with "Modify Channel Assignments" on page 3–7.
3-10
Page 39

The line numbers
show the locations
of the data in the
logic analyzer’s
memory.
Introduction to State Analysis
Run the State Analyzer and View and Change the State Listing
Run the State Analyzer and View and Change the State
Listing
1 Press the Run key.
2 Observe the State Listing.
The trigger pattern 00 is centered around the zero line number, which
corresponds to the trigger point you specified in the Trigger menu. The
negative line numbers indicate the states stored prior to the trigger point.
Trigger point 00
This is the state data
you acquired from the
ripple counter.
State Listing Menu
3 Use the table below to view and change the state listing.
To Do This: Do This:
To change the state listing
display from hex to decimal
To scroll through the state listing On the left-center side of the display, highlight the line
To page through the state listing
one screen at a time
Highlight the
and press the
pop-up menu.
number field, then turn the knob.
Press the
Hex field directly below the SCOUNT label,
Select key. Choose Decimal from the
Page keys below the knob.
3-11
Page 40

The Symbols field.
Introduction to State Analysis
Create Symbols to Display State Data
Create Symbols to Display State Data
Symbols are used to display state data in easily understandable terms, which
you define. This can make the state listing much easier to interpret. In the
following exercises, you will define and display some symbols.
Press the Format MENU key.
1
2 Highlight the Symbols field, and press the Select key.
3 Highlight the New Symbol field below Symbol. Type "ONE" using the
keypad. Press the
4 Highlight the field below Pattern/Start. Enter 01 using the keypad.
Press the
Done key when you are finished typing.
Done key when you are finished typing.
The symbol ONE will
appear in the state
listing when the state
analyzer records the
hex value 01.
Creating Symbols to Display State Data
Result In the state listing, the analyzer will display ONE in place of the hex number
01 when the base field is set to Symbol.
3-12
Page 41

Introduction to State Analysis
Create Additional Symbols
Create Additional Symbols
You can create as many symbols as you want. In this exercise, you will create
symbols TWO and THREE for the hex values 02 and 03.
If the Symbol Table pop-up menu is now displayed, go to step 2. If this
1
is not the case, highlight the
press the
2 Highlight the ONE field below Symbol, and press the Select key.
Highlight
Select key.
Add a Symbol in the pop-up menu, and press the Select key.
Type TWO using the keypad. Press the
finished typing.
3 Highlight the field to the right of the TWO under Pattern/Start. Enter 02
using the keypad. Press the
4 Highlight the TWO field. Repeat steps 2 and 3 to create a symbol,
THREE, with a pattern value of 03.
5 Press the Done key to close the Symbol Table pop-up menu.
Symbols field in the Format Menu, and
Done key when you are
Done key when you are finished typing.
The symbol TWO
represents the hex
value 02.
The symbol THREE
represents the hex
value 03.
Creating Additional Symbols
Result In the state listing, the analyzer will display TWO in place of the hex number
02, and THREE in place of the hex number 03, when the base field is set to
Symbol.
3-13
Page 42

Introduction to State Analysis
Select and View Symbols in the State Listing
Select and View Symbols in the State Listing
Symbols are helpful when viewing more complex state listings. For example,
you might monitor a microprocessor’s status lines which have specific
patterns for read and write cycles. You can define symbols for these
patterns. Then, wherever a read or write cycle occurs in the state listing, you
will see "READ" or "WRITE," instead of a numerical representation of the
patterns.
Press the List MENU key.
1
2 Highlight the base field under the SCOUNT label, and press the Select
key. Highlight Symbol in the pop-up menu, and press the Select key.
The symbols ONE, TWO, and THREE are displayed in the state listing
in place of the numeric counts 01, 02, and 03, respectively.
The base field is set to
display the data in
symbol form.
Symbols ONE, TWO, and
THREE represent data
01, 02, 03.
State Listing with Symbols
3 Select the Symbol field under SCOUNT label, and then choose Hex
from the pop-up menu.
Step 3 changes the base from decimal to hexadecimal for the rest of the
exercises.
3-14
Page 43

4
Comparing State Traces
Page 44

Comparing State Traces
The State Compare feature allows you to compare two state listings.
You can check if your system is executing correct states by acquiring
a state listing from the system under test and comparing it to a listing
that is known to be good. If there are differences between the two
listings, you can use the Difference Listing feature to see where the
differences occur.
In these exercises, you will run a test and store the state listing as the
reference listing. Next, you will change the jumper settings and run a
different test using the same trigger specification. You will then use
the Difference Listing to see the differences between the two listings.
These exercises will step you through the process of using the
Compare mode of the state analyzer. They are designed to use many
of the same exercises as the State Analyzer Exercises in the previous
chapter; therefore, the beginning exercises do not include figures or
explanations. If you need this additional information on any of these
common exercises, refer back to the same exercise in chapter 3,
"Introduction to State Analysis."
In this chapter, you will:
• Put the analyzer into state mode
• Set up the state clock
• Change a label name and modify channel assignments
• Define a term for the state trigger
• Set up the state trigger specification
• Run the analyzer and view the state listing
• Copy the state listing to the compare reference listing
• Change the jumper to acquire a different state listing
• Run the analyzer and find the errors
4-2
Page 45

Comparing State Traces
Before You Begin
Before You Begin
1 Decide what to do next.
If you have just completed the exercises in chapters 2 and 3, go to "Check the
Configuration" on the next page.
If you have not just completed the exercises in chapters 2 and 3, go to step 2.
Load the Analyzer with the configuration file, CH04._A.
2
The file defaults all system settings and sets up the analyzer as if you just
completed the exercises in chapters 2 and 3.
Unless you are using an HP 1661 or an HP 1671 analyzer, you may see an
advisory message when you load the files. This is not an error. The message
is displayed because these logic analyzers have a different number of data
pods from the HP 1661, which was used to create the files.
Connect Pod 1.
3
Connect Pod 1 of the analyzer to J1 on the Training Board. For the
HP 1660s, Pod 1 is the top cable in the left-most position when you are facing
the rear of the logic analyzer. For the HP 1670s, Pod 1 is the top cable in the
right-most position when you are facing the rear of the logic analyzer.
Set the jumpers as shown below.
4
The jumper settings of J5 on the training board for this chapter are the same
as the default settings.
CLK2
CLK1
GLITCH
Setting the Jumpers
P. G.
OSC
P. G.
CLK2
OFF
ON
J1
See Also "To Set the Jumpers" and "To Load a Configuration File" in chapter 11 for
more information.
4-3
Page 46

Comparing State Traces
Check the Configuration
Check the Configuration
Either you have just completed chapter 3, "Introduction to State Analysis", or
you have loaded the configuration file CH_04.
If you are using an HP 1660 series analyzer go to step 2. If you are
1
using an HP 1670 series analyzer, put the analyzer into State Compare
mode before checking the configurations.
To do this, press the Config MENU key. In the Analyzer 1 box, highlight the
field to the right of Type, press the Select key, and then choose State Compare
from the pop-up menu.
Check the configuration.
2
In the Config menu, Analyzer 1 is set to State mode for the HP 1660s and
•
State Compare for the HP 1670s.
In the Format menu, the Master Clock field is displaying J ↓.
•
In the Format menu, the SCOUNT label is turned on with the lower eight
•
channels of pod A1 assigned to it.
In the Trigger menu SCOUNT’s term "a" is assigned the value FF (hex).
•
4-4
Page 47

Comparing State Traces
Set Up the State Trigger Specification
Set Up the State Trigger Specification
When comparing two state listings, it is best to only sample the data you are
interested in comparing. This will ensure that the errors you find are errors in
the data you are interested in, rather than in the pretrigger data. Setting the
analyzer to store "no state" before the trigger, tells the analyzer to begin
capturing data after the trigger is found.
If the Trigger Menu is not already displayed, press the Trigger MENU
1
key.
2 Highlight the 1 field in the State Sequence Levels box, and press the
Select key.
3 Highlight the field to the right of While storing, and press the Select key.
Highlight
4 Highlight the field to the right of Trigger on, and press the Select key.
Highlight
Done key to close the Sequence Level 1 pop-up menu.
5 Highlight the 2 field in the State Sequence Levels box, and press the
Select key.
6 Highlight the field to the right of Store, and press the Select key.
Highlight
the
no state in the pop-up menu, and press the Select key.
a in the pop-up menu, and press the Select key. Press the
anystate in the pop-up menu, and press the Select key. Press
Done key to close the Sequence Level 2 pop-up menu.
Result The trigger specification is now:
Level 1 - While storing "no state", trigger on "a" 1 time
•
Level 2 - Store "any state"
•
4-5
Page 48

Comparing State Traces
Run the Analyzer and View the State Listing
Run the Analyzer and View the State Listing
1 Press the Run key.
2 Observe the listing.
The State Listing is now displaying the output of the ripple counter in
hexadecimal with FF (hex) at the top of the listing under the SCOUNT label.
FF is at the beginning of the listing and to the right of a field in which 0 is
displayed. The zero line number always displays the trigger point specified in
the Trigger menu. There are no negative line numbers preceding the trigger
point because the pretrigger specification was set to "While storing no state."
Trigger point (FF)
State Listing with no Pretrigger Data
Result The state analyzer triggered on FF and began to store data, filling the
acquisition memory. The data is displayed in the State Listing.
4-6
Page 49

Comparing State Traces
Copy the State Listing to the Compare Reference Listing
Copy the State Listing to the Compare Reference
Listing
In this exercise, you will copy the state listing you acquired in the previous
exercise to the reference listing so you can compare it with other listings.
This feature can be used in a test environment to check that your system is
executing correctly. You can acquire a state listing from the system under
test and compare it to a listing that is known to be good. Any differences
between the two listings can be seen using the Difference Listing feature.
Press the List MENU key, then choose Compare from the pop-up menu.
1
2 Highlight the Copy Listing to Reference field, and press the Select key.
3 Highlight Execute in the pop-up menu, and press the Select key.
Compare allows you to
compare two state
acquisitions to find
differences.
Selecting this field and
choosing Execute copies
the listing.
Copying the State Listing to the Compare Reference Listing
Result The state listing acquired in the previous exercise is now copied to the
reference listing.
4-7
Page 50

Comparing State Traces
Change the Jumper to Acquire a Different State Listing
Change the Jumper to Acquire a Different State Listing
Changing the glitch jumper changes channel 7 of the counter so that some of
the acquired states will not match the original listing. After you change the
jumper, you will acquire the data again in the next exercise, then compare it
to the data you copied to the Reference Listing.
Pull the glitch jumper from the pins labeled GLITCH OFF.
1
2 Push the jumper onto the pins labeled GLITCH ON.
CLK2
CLK1
GLITCH
P. G.
OSC
P. G.
CLK2
OFF
ON
Result The glitch jumper is changed to GLITCH ON. The next listing you acquire
will be different from the one you copied to the Compare Reference listing.
4-8
Page 51

Comparing State Traces
Run the Analyzer and Find the Errors
Run the Analyzer and Find the Errors
Now that you have changed the jumper, you are ready to acquire a different
state listing and compare it to the previous listing. In this exercise, you will
switch to the Difference Listing, press the Run key to acquire the new state
listing, and use the knob to scroll through the differences between the two
listings.
Highlight the Reference Listing field, and press the Select key to switch
1
Difference Listing.
to the
2 Press the Run key.
The listing now shows the data that you just acquired. The analyzer
compares this data to the data that you stored in the Reference Listing.
Highlight the Find Error field.
3
4 Use the knob to scroll through the listing. Observe the states where
one of the hex numbers is white.
The white color indicates states in the new listing that do not match the
reference listing. You can also type a number into the Find Error field. Find
Error will jump you to that error if it exists in the listing.
The Difference Listing
displays the listing you
want to compare.
The Find Error field is
used to scroll through
the differences between
the listings.
The incorrect bytes
are displayed in white
on your display. In
this graphic, the
white text is
represented by the
light black font.
Difference Listing
5 Return the Glitch Jumper on the training board to the OFF position.
6 Press the List MENU key. Choose Listing MACHINE 1 from the pop-up
menu.
Steps 5 and 6 reset the training board and the analyzer for the next exercises.
4-9
Page 52

4-10
Page 53

5
Mixed Mode - Correlation of State and Timing Data
Page 54

Mixed Mode - Correlation of State and
Timing Data
Mixed mode allows you to analyze a system in both state and timing
modes simultaneously. A common example is using the state analyzer
to capture a problem that occurs infrequently and then using the
timing analyzer to analyze the problem in detail. The Mixed Mode
exercises will show you how to use the mixed mode capabilities of the
timing and state analyzers. These exercises are built on the timing
and state exercises in chapters 2 and 3.
If your logic analyzer is an HP 1663 or HP 1664, you will not be able to
perform these exercises. These analyzers have 32 data acquisition
channels on two pods. All 32 channels may be assigned to either state
or timing analysis, but they cannot be separated to perform mixed
mode measurements.
In this chapter you will:
• Connect the timing analyzer
• Enable time-correlation between the timing and state analyzers
• Arm the timing analyzer with the state analyzer
• Run the analyzers and view the mixed mode display with time
correlated markers
5-2
Page 55

Mixed Mode - Correlation of State and Timing Data
Before You Begin
Before You Begin
Note If your logic analyzer is an HP 1663 or HP 1664 you cannot perform
these exercises. The HP 1663 and HP 1664 have 32 data acquisition
channels on two pods. All 32 channels may be assigned to either state
or timing analysis, but they cannot be separated to perform mixed-mode
measurements.
Set the jumpers as shown below.
1
The jumper settings of J5 on the training board for this chapter are the same
as the default settings.
CLK2
CLK1
GLITCH
P. G.
OSC
P. G.
CLK2
OFF
ON
2 Decide what to do next.
If you have just completed all of the exercises in chapters 2 through 4, go to
"Connect the Timing Analyzer" on the next page.
If you have not just completed all of the exercises in chapters 2 through 4, go
to step 3.
Load the Analyzer with the configuration file, CH05._A.
3
The file will default all system settings and then set up the analyzer as if you
had just completed all of the exercises in chapters 2 through 4.
Unless you are using an HP 1661 or an HP 1671 analyzer, you may see an
advisory message when you load the files. This is not an error. The message
is displayed because these logic analyzers have a different number of data
pods from the HP 1661, which was used to create the files.
Connect Pod 1.
4
Connect Pod 1 of the analyzer to J1 on the Training Board. For the
HP 1660s, Pod 1 is the top cable in the left-most position when you are facing
the rear of the logic analyzer. For the HP 1670s, Pod 1 is the top cable in the
right-most position when you are facing the rear of the logic analyzer.
See Also "To Set the Jumpers" and "To Load a Configuration File" in chapter 11 for
more information.
5-3
Page 56

Mixed Mode - Correlation of State and Timing Data
Connect the Timing Analyzer
Connect the Timing Analyzer
Note If you have a termination adapter, HP part number 01650-63203, connect
the adapter between Pod 3 of the logic analyzer and J2 of the training
board, then go to the next page to put the analyzer into state and timing
modes.
Connect the Pod 3 connector to the probe assembly.
1
For the HP 1660s, Pod 3 is the top cable in the second connector from the
left, as you are facing the back of the logic analyzer. For the HP 1670s, Pod 3
is the top cable in the second connector from the right, as you are facing the
back of the logic analyzer.
Note Leave Pod 1 connected to J1 of the training board. Pod 1 provides the
+5 V power for the training board.
Connect the probe leads 0 through 7 to the pins D0 through D7 of J2.
2
3 Connect the probe ground lead to any pin of J3.
Probe Assembly
Pod 3 Connector
Connecting the Pod 3 Cable to the Probe Assembly
5-4
Page 57

Mixed Mode - Correlation of State and Timing Data
Put the Analyzer into State and Timing Modes
Put the Analyzer into State and Timing Modes
In this exercise you will use both the timing analyzer mode and the state
analyzer mode to correlate the state and timing measurements. Pod 1 will be
capturing the state measurement and Pod 3 will be capturing the timing
measurement. All other pods will be unassigned.
Press the Config MENU key.
1
2 In the Analyzer 2 box, highlight the field to the right of Type, and press
Select key. Highlight Timing in the pop-up menu, and press the
the
Select key.
3 Highlight the Pod A3/A4 field, and press the Select key. Highlight
Machine 2 in the pop-up menu, and press the Select key.
4 If you have any other pod pair fields other than A1/A2 and A3/A4,
select each pair and choose
Unassigned in the pop-up menu.
If you are using a 1660, 1661,
1670, or a 1671 set Pod A5/A6
Analyzer 1 is in state
mode with the lower 8
bits of Pod A1 and the J
clock are showing
activity.
Analyzer 2 in timing
mode. The lower 8 bits
of Pod A3 and the L clock
are showing activity.
Putting the Analyzer into State and Timing Modes
to "Unassigned".
If you are using an HP 1660 or
an HP 1670, set Pod A7/A8 to
"Unassigned".
Result Analyzer 1 is in state mode with Pod 1 assigned to it. Analyzer 2 is in timing
mode with Pod 3 assigned to it. The remaining pods are unassigned.
5-5
Page 58

Mixed Mode - Correlation of State and Timing Data
Change a Label Name and Modify Channel Assignments
Change a Label Name and Modify Channel
Assignments
1 Press the Format MENU key twice.
2 Highlight Format MACHINE 2 in the pop-up menu, and press the Select
key.
3 Highlight the top field under Labels, then type TCOUNT using the
keypad. Press the
4 Highlight the field showing the 16 channels of Pod A3, to the far right
of the TCOUNT label. Press the
4 If there are asterisks in the pop-up, press the Clear entry key.
5
Press the ⇑ (up-arrow) key to place asterisks in the lower eight
channel positions. Press the
Result The top label is now the TCOUNT label with the lower eight channels of Pod
A3 assigned to it.
Done key when you are finished typing.
Select key.
Done key.
Turn on the TCOUNT Label in the Waveform Menu
The timing data will be displayed in the waveform menu with the state data
listed above. Turning the TCOUNT label on in the waveform menu tells the
analyzer to display the timing data for TCOUNT.
Press the Waveform MENU key to display Waveform Machine2.
1
2 If the large vertical field on the left side of the display has TCOUNT 0
through TCOUNT 7 displayed, go to "Clear the Timing Analyzer
Trigger" on the next page. Otherwise, continue to the next step.
3 Highlight the large vertical field on the left side of the display, and
press the
4 Highlight Insert in the pop-up menu, and press the Select key.
5 Press the Select key to choose TCOUNT.
6 Choose Sequential from the next pop-up menu.
Result The waveform menu is now set to display the timing data for TCOUNT. The
sequential option inserted all channels of the label into the display.
5-6
Select key twice.
Page 59

Mixed Mode - Correlation of State and Timing Data
Clear the Timing Analyzer Trigger
Clear the Timing Analyzer Trigger
Clearing the timing analyzer trigger sets the specification to "don’t care". By
doing this, the timing analyzer will trigger as soon as it is armed by the state
analyzer.
Press the Trigger MENU key.
1
2 Highlight the Modify Trigger field on the right side of the screen, and
press the
3 Highlight the Clear Trigger field, press the Select key, and choose All
Select key.
from the pop-up menu.
Result The timing analyzer trigger specification is set to a "don’t care" state.
Set Up the State Trigger Specification
1 Press the Trigger MENU key. Highlight Trigger MACHINE 1 in the pop-up
menu, and press the
now displayed. If this is not the case, press the
again, then choose
2 Highlight the 1 field in the State Sequence Levels box of the Trigger
menu. Press the
3 Highlight the field to the right of While storing, and press the Select key.
Highlight
4 Press the Done key to close the Sequence Level 1 pop-up menu.
anystate in the pop-up menu, and press the Select key.
Select key. The Trigger MACHINE 1 menu is
Trigger MENU key
Trigger MACHINE 1 from the pop-up menu.
Select key.
Result The state analyzer trigger specification is now:
Level 1 - While storing "anystate", TRIGGER on "a" 1 time
Level 2 - Store "anystate"
The trigger term "a" is assigned the hex value FF.
5-7
Page 60

Mixed Mode - Correlation of State and Timing Data
Enable Time Correlation between the Timing and State Analyzers
Enable Time Correlation between the Timing and
State Analyzers
Setting the Count to Time causes the state analyzer to store a time value,
called a time stamp, for each data point that is stored in memory. When the
mixed display is selected, the time stamp information is used to display the
data in both the timing and state displays with the proper time relationship
(correlation).
Highlight the Count Off field, and press the Select key.
1
2 In the pop-up menu, highlight the field to the right of Count, and press
Select key.
the
3 Highlight Time in the next pop-up menu, and press the Select key.
Press the
Data stored before triggering has negative time numbers, and data stored
after triggering has positive time numbers.
Done key to close the Count pop-up menu.
The Count field
accesses a selection
menu which indicates
whether acquisition
data is stamped with
a Time tag or a State
Count tag.
Count Time places time
tags on all displayed
data.
Enabling Time Correlation between the Timing and State Analyzers
Result The state analyzer is set to store a time stamp for each state that is recorded.
A time stamp does not have to be set for the timing analyzer because the
timing analyzer automatically keeps track of time.
5-8
Page 61

Mixed Mode - Correlation of State and Timing Data
Arm the Timing Analyzer with the State Analyzer
Arm the Timing Analyzer with the State Analyzer
Arming control sets up the order of triggering for complicated measurements
that involve more than one mode, such as state and timing. Although state
and timing modes involve a single analyzer, they are often referred to as the
timing analyzer and the state analyzer. Arming the timing analyzer with the
state analyzer allows the two modes to run simultaneously so that the data
captured by both analyzers can be time-correlated.
Highlight the Arming Control field, and press the Select key.
1
If you are using an HP 1670 series logic analyzer, the Arming Control pop-up
menu will look different because these machines do not have an oscilloscope.
Highlight MACHINE 2 near the center of the screen, next to the Run
2
field. Press the Select key.
3 Highlight the field next to Run from, and press the Select key.
4 Highlight MACHINE 1 in the pop-up menu, and press the Select
key. Press the Done key to close the Machine 2 pop-up menu.
5 Press the Done key to return to the Trigger Menu.
Machine 1 is the
state analyzer.
Machine 2 is the timing
analyzer.
Arming the Timing Analyzer with the State Analyzer
Result When the state analyzer (Machine 1) arms the timing analyzer (Machine 2),
the timing analyzer begins to look for its own trigger condition.
The timing analyzer is
armed by the state
analyzer.
5-9
Page 62

Mixed Mode - Correlation of State and Timing Data
View the Mixed-Mode Display with Time-Correlated Markers
View the Mixed-Mode Display with Time-Correlated
Markers
When you press the Run key, the state analyzer triggers on the pattern FF
(when all eight lines are high) and arms the timing trigger. Mixed Display
displays trigger points for both the timing analyzer and the state analyzer
with the state data displayed in a state listing and the timing data displayed
in a timing waveform.
Press the Run key.
1
2 Press the List MENU key. Choose Mixed Display from the pop-up menu.
Notice the delay between the state trigger and the timing trigger, causing the
timing trigger marker to appear to the right of the FF state. This is due to
the time required for the state analyzer to arm the timing analyzer.
Highlight the Trig to X field and rotate the knob to observe that the X
3
markers move in both the state listing and the timing waveform
displays.
The state analyzer
trigger point (FF).
The X-marker.
The timing analyzer
trigger point to the right
of the FF state.
The X-marker.
The delay between the
state trigger and the timing
trigger. The FF state is
where all eight lines are
high.
Mixed Mode Display
4 Press the Trigger MENU key twice.
5 Highlight the Count Time field, and press the Select key twice. Highlight
Off in the pop-up menu, and press the Select key. Press the Done key.
Steps 4 and 5 turn off the Time Count function for the next exercise.
5-10
Page 63

6
Advanced State Triggering
Page 64

Advanced State Triggering
The power of the state analyzer is in its wide range of trigger
capabilities. These exercises step you through the process of using
the multi-level triggering capabilities of the state analyzer.
In this chapter, you will:
• Put the analyzer into state mode
• Set up the state analyzer format
• Define individual trigger terms
• Define the range trigger term
• Add state trigger sequence levels
• Set up multiple state trigger levels
• Define a combination trigger term
• Check the trigger specification
• Run the state analyzer and view the data
6-2
Page 65

Advanced State Triggering
Before You Begin
Before You Begin
1 Decide what to do next.
If you have just completed all of the exercises in Chapters 2 through 5, go to
"Put the Analyzer into State Mode" on the next page.
If you have not just completed all of the exercises in Chapters 2 through 5, go
to step 2.
Load the Analyzer with the configuration file, CH06._A.
2
The file defaults all system settings and sets up the analyzer as if you just
completed all of the exercises in Chapters 2 through 5.
Unless you are using an HP 1661 or an HP 1671 analyzer, you may see an
advisory message when you load the files. This is not an error. The message
is displayed because these logic analyzers have a different number of data
pods from the HP 1661, which was used to create the files.
Connect Pod 1.
3
Connect Pod 1 of the analyzer to J1 on the Training Board. For the
HP 1660s, Pod 1 is the top cable in the left-most position when you are facing
the rear of the logic analyzer. For the HP 1670s, Pod 1 is the top cable in the
right-most position when you are facing the rear of the logic analyzer.
Set the jumpers as shown below.
4
The jumper settings of J5 on the training board for this chapter are the same
as the default settings.
CLK2
CLK1
GLITCH
P. G.
OSC
P. G.
CLK2
OFF
ON
See Also "To Set the Jumpers" and "To Load a Configuration File" in chapter 11 for
more information.
6-3
Page 66

Advanced State Triggering
Put the Analyzer into State Mode
Put the Analyzer into State Mode
1 Press the Config MENU key.
2 In the Analyzer 2 box, highlight the field to the right of Type, and press
Select key. Highlight Off in the pop-up menu, and press the Select
the
key.
3 In the Analyzer 1 box, highlight the field to the right of Type, and press
Select key. Highlight State in the pop-up menu, and press the Select
the
key.
Result The analyzer is now in state mode. The lower eight channels and the J-clock
channel of pod A1 are showing activity.
6-4
Page 67

Advanced State Triggering
Define State Trigger Terms "a" through "d"
Define State Trigger Terms "a" through "d"
In the following exercises, you will set up the analyzer to check for and store
a complex sequence of states before it triggers. While the analyzer checks
for these states, it will store only selected states that you define. As in
chapter 3, you will define your trigger terms first, then use these terms to
define a sequence of events. In this case, the sequence will be made up of
states of the ripple counter on the training board. You can use this same
method to monitor any state sequence, such as subroutine calls or read and
write cycles of a microprocessor.
Press the Trigger MENU key.
1
2 Highlight the base field below SCOUNT, and press the Select key.
Highlight
3 Under SCOUNT, highlight the field to the right of the a term.
4 Enter 011 and then press the Done key.
5 Repeat steps 3 and 4 to enter 022, 033, and 044 in terms b, c, and d,
respectively.
Decimal in the pop-up menu, and press the Select key.
Defining State Trigger Terms "a" through "d"
Result The trigger terms "a", "b", "c", and "d" are assigned the decimal values 011,
022, 033, and 044.
6-5
Page 68

Advanced State Triggering
Define State Trigger Term "e" and Range1
Define State Trigger Term "e" and Range1
The trigger term "e" stores one value. The Range1 term, however, can store a
range of values. Storing a range of values is useful when you are looking to
store the data of a subroutine or procedure.
Turn the knob clockwise to display the e term in the bottom left
1
corner of the display. Under SCOUNT, highlight the field to the right
e. Enter 059 using the keypad. Press the Done key.
of
2 Turn the knob until the Range1 term is displayed. Highlight the field
to the right of
key.
3 Highlight the field to the right of lower and enter 050 using the
keypad. Press the
upper and enter 058 using the keypad. Press the Done
Done key.
Defining State Trigger Terms "e" and Range1
Result The trigger term "e" is assigned the decimal value 059, and Range1 is
assigned decimal values 050 through 058.
6-6
Page 69

Advanced State Triggering
Add State Trigger Sequence Levels
Add State Trigger Sequence Levels
You tell the analyzer what data to capture by setting the sequence
specification. In this exercise, your sequence specification will have five
sequence levels.
Highlight the 1 field in the State Sequence Levels box of the Trigger
1
menu. Press the
2 Highlight the Insert Level field, and press the Select key. Highlight
Before in the pop-up menu, and press the Select key.
3 In the Trigger Macro Library, use the knob to highlight "1. User level -
custom combinations, loops,
Custom triggering is set up by selecting the user level. In the Trigger Macro
library, trigger macros are also available for common trigger applications.
Repeat step 2 and 3 two more times. After inserting these two levels,
4
press the
Done key to close the Sequence Level 1 pop-up menu.
Select key.
" then press the Done key.
Selecting "Before"
inserts a new
sequence level
before the sequence
level 1.
Adding State Trigger Sequence Levels
Result You now have Sequence Levels 1 through 5. You can scroll through the
sequence levels by highlighting "State Sequence Levels" centered above
sequence level 1 and turning the knob.
6-7
Page 70

Advanced State Triggering
Set Up Level 1 of the State Trigger Specification
Set Up Level 1 of the State Trigger Specification
The first term you will look for and store before triggering is term "a", which
stores the value 011. Because you are only interested in 011, you will set the
"While Storing" field to "no state" so that no other data is stored.
Highlight the 1 field in the State Sequence Levels box of the Trigger
1
menu. Press the
2 In the pop-up menu, highlight the field to the right of While storing, and
press the
the
3 Highlight the field to the right of Find, and press the Select key.
Highlight
4 Press the Done key to close the Sequence Level 1 pop-up menu.
Select key. Highlight no state in the pop-up menu, and press
Select key.
a in the pop-up menu, and press the Select key.
Select key.
The analyzer will not
store any data before
it finds term "a".
The "a" term holds
the decimal value
Setting Up Level 1 of the State Trigger Specification
Result Sequence Level 1 is set to find and store only term "a" the first time it occurs.
6-8
Page 71

Advanced State Triggering
Set Up Level 2 of the State Trigger Specification
Set Up Level 2 of the State Trigger Specification
The second term you will look for is the range of values 050 through 058,
which you defined as "In range1". While you are storing these values, you
also want to find and store term "e" with the value 059.
Highlight the 2 field in the State Sequence Levels box of the Trigger
1
menu. Press the
2 Highlight the field to the right of While storing, and press the Select key.
Highlight
3 Highlight the field to the right of Then find, and press the Select key.
Highlight
4 Press the Done key to close the Sequence Level 2 pop-up menu.
In_Range1 in the pop-up menu, and press the Select key.
e in the pop-up menu, and press the Select key.
Select key.
In_Range1 tells the
analyzer to store the
values 050 through 058.
While storing
In_Range1, the
analyzer looks for and
stores "e" one time.
Setting Up Level 2 of the State Trigger Specification
Result Sequence Level 2 is set to store the "In_Range1" values 050 through 058 and
then find and store the term "e" value 059.
6-9
Page 72

Advanced State Triggering
Set Up Level 3 of the State Trigger Specification
Set Up Level 3 of the State Trigger Specification
The third term you want to find and store is term "b" with the value 022.
Because you only want to store this value, you set the "While Storing" field to
"no state".
Highlight the 3 field in the State Sequence Levels box of the Trigger
1
menu. Press the
2 Highlight the field to the right of While storing, and press the Select key.
Highlight
3 Highlight the field to the right of Then find, and press the Select key.
Highlight
4 Press the Done key to close the Sequence Level 3 pop-up menu.
no state from the pop-up menu, and press the Select key.
b from the pop-up menu, and press the Done key.
Select key.
No data will be stored
while the analyzer is
looking for term "b".
The analyzer looks for
and stores term "b"
with the value 022.
Setting Up Level 3 of the State Trigger Specification
Result Sequence Level 3 is set to find and store only term "b" the first time it occurs.
6-10
Page 73

Advanced State Triggering
Set Up Level 4 of the State Trigger Specification and Define a Combination Trigger Term
Set Up Level 4 of the State Trigger Specification and
Define a Combination Trigger Term
In Sequence Level 4 you will store a combination of values while looking for
the trigger term "e". A combination term, is a logical combination of other
terms, using boolean logic operators like AND and OR. In this exercise, you
will define the combination of terms "c" or "In_Range1" or "d". These three
terms are ORed together so that one, two, or all three of the terms could be
stored.
Turn the knob clockwise to display sequence levels 3, 4, and 5.
1
2 Highlight the 4 field in the State Sequence Levels box of the Trigger
menu. Press the
3 Highlight the field to the right of While storing, and press the Select key.
Highlight
4 In the combination pop-up menu, highlight c, and press the Select key.
Highlight
5 Highlight In_Range1, and press the Select key. Highlight In in the
Combination in the pop-up menu, and press the Select key.
ON in the pop-up menu, and press the Select key.
pop-up menu, and press the
6 Highlight d and press the Select key. Highlight ON in the pop-up menu,
and press the
Note the "Current Qualifier" display in the top right corner of the screen.
Your qualifier is now "c + in_range1 + d."
Select key.
Select key.
Select key.
The "c" term is now
turned on. See the
connection from "c"
to one of the Or fields.
When you select
"in_range1", the logic
analyzer looks for
values that are
within the limits for
the term Range1.
The "d" term is now
turned on.
Defining a Combination Trigger Term
6-11
Page 74

The analyzer stores
one, two, or all three
of these terms while
looking for term "e".
The analyzer looks for
and stores term "e"
with the value 059.
Advanced State Triggering
Set Up Level 4 of the State Trigger Specification and Define a Combination Trigger
Term
7 Press the Done key once to close the Combination Term pop-up menu.
8 Highlight the field to the right of the TRIGGER on field, and press the
Select key. Highlight e in the pop-up menu, and press the Select key.
9 Press the Done key to close the Sequence Level 4 pop-up menu.
Setting Up Level 4 of the State Trigger Specification
Result Sequence Level 4 is set to store the combination of values "c+In_Range1+d."
before finding and triggering on term "e".
6-12
Page 75

Advanced State Triggering
Check the Trigger Specification
Check the Trigger Specification
Now you can check the trigger specification by scrolling through the five
sequence levels. You did not have to set up Level 5 because you want the
analyzer to trigger and store "anystate". The last level of a trigger
specification has this as the default.
Highlight the "State Sequence Levels" field centered above the
1
sequence specification.
2 Turn the knob clockwise to scroll down through the sequence levels.
Your trigger specification should look like the one below:
Level 1 - While storing "no state"; Find "a" 1 time
•
Level 2 - While storing "In_Range1"; Then find "e" 1 time
•
Level 3 - While storing "no state"; Then find "b" 1 time
•
Level 4 - While storing "c + In_Range1 + d" ; TRIGGER on "e" 1 time
•
Level 5 - Store "anystate"
•
If your trigger specification is not correct, repeat the appropriate exercises
on the previous pages to correct the sequence levels that do not match.
6-13
Page 76

Advanced State Triggering
Run the State Analyzer and View the Data
Run the State Analyzer and View the Data
1 Press the Run key.
2 Highlight the base field below the SCOUNT label, and press the Select
key. Highlight Decimal in the pop-up menu, and press the Select key.
3 Highlight the line number field on the left side of the display. Scroll
the listing to the beginning by turning the knob counter clockwise.
Result Your listing now matches the data under the SCOUNT label in the figure
below. The first state in your listing is decimal 011 which is term "a." You
then see the Range1 values (050 - 058), followed by terms "e," "b," and the
combination term "c + in_range1 + d". At line number 0, you see the trigger
term "e," followed by "anystate".
Term a
Range1 values
Term e
Term b
Combination term
c + in_range1 + d
Trigger term e
State Listing Showing Your Defined Terms
6-14
Page 77

Counter Output
Logic analyzer
storage sequence
Advanced State Triggering
Run the State Analyzer and View the Data
Ripple Counter Output and Stored States
The figure above shows you the output of the ripple counter (the circle) and
the sequence of qualification and storage that the state analyzer performed.
The asterisks indicate when the state analyzer found and stored valid terms
in this example. All states were initially excluded, using the "no state" term.
First the "a" term was stored. Next, states that were within the specified
Range1 term (50 - 58) were stored, while the analyzer searched for an
occurrence of term "e." Once the remaining terms and range were found in
the specified sequence, the state analyzer stored everything (anystate) until
its acquisition memory was filled.
With multi-level state triggering, you specify the data to be stored by the
state analyzer. If you are debugging software, you can store or exclude
certain program lines or entire blocks of code, such as subroutines.
6-15
Page 78

6-16
Page 79

7
Using the Oscilloscope
Page 80

Using the Oscilloscope
These exercises show you how to use the oscilloscope inside the
analyzer. If you are using an HP 1660CS, HP 1661CS, HP 1662CS, or
an HP 1663CS analyzer, you have a built in oscilloscope.
You will start by using the Autoscale feature to set up the
oscilloscope. You will also use the Auto Measure feature to measure
the period of the training board clock signal.
In this chapter, you will:
• Connect the channel 1 oscilloscope probe
• Get the waveform on the display with Autoscale
• Delete the unused channel from the display
• Zoom and scroll through the clock waveform
• Measure the clock period manually
• Measure the clock period with Auto Measure
• Read the pulse voltage with the markers
7-2
Page 81

Using the Oscilloscope
Before You Begin
Before You Begin
1 Decide what to do next.
If you have just completed the exercises in chapters 2 through 6, go to
"Connect the Channel 1 Oscilloscope Probe" on the next page.
If you have not just completed the exercises in chapters 2 through 6, go to
step 2.
Load the configuration files CH07._A and CH07._B.
2
When loading these files, you must set the analyzer to load All, because you
are loading two types of files for this exercise. Setting the analyzer to load
Analyzer like you did in previous exercises, will only load CH07._A properly.
The files will default all system and oscilloscope settings. If you need
instructions to load the configuration files, refer to chapter 11, "To Load a
Configuration File."
Connect Pod 1.
3
Connect Pod 1 of the analyzer to J1 on the Training Board. For the
HP 1660s, Pod 1 is the top cable in the left-most position when you are facing
the rear of the logic analyzer. Pod 1 must be connected in order to supply
the +5 V power for the training board.
Set the jumpers as shown below.
4
The jumper settings of J5 on the training board for this chapter are the same
as the default settings. For more information about setting the jumpers, refer
to chapter 11, "To Set the Jumpers."
CLK2
CLK1
GLITCH
P. G.
OSC
P. G.
CLK2
OFF
ON
7-3
Page 82

Using the Oscilloscope
Connect the Channel 1 Oscilloscope Probe
Connect the Channel 1 Oscilloscope Probe
1 Connect the oscilloscope probe to channel 1 on the front panel of the
analyzer.
2 Connect the probe tip to the test point labeled "CLK 1" on the Logic
Analyzer Training Board.
3 Connect the probe ground lead to the test point labeled "GND" on the
Logic Analyzer Training Board.
Note Connect pod 1 to J1 of the training board. Pod 1 must be connected to
supply the +5 V power for the training board.
J1 - Pod 1 of the
analyzer connects
here.
GND - Oscilloscope
ground connects here.
CLK1 - Oscilloscope
probe tip connects here.
J5 - Jumpers are set
here.
Connecting the Channel 1 Oscilloscope Probe
7-4
Page 83

The analyzer is in scope
mode.
This field initiates the
Autoscale feature.
Using the Oscilloscope
Get the Waveform on the Display
Get the Waveform on the Display
The Autoscale feature automatically scales the vertical sensitivity and the
horizontal time base of the oscilloscope to provide a display of the waveform.
This simplifies the setup of the oscilloscope and is very helpful when the
amplitude and period of a signal are unknown.
Press the Config key.
1
2 Highlight the field in the top, left corner of the display and press the
Select key. Highlight Scope in the pop-up menu, and press the Select
key.
3 Highlight the Autoscale field and press the Select key. Highlight
Continue in the pop-up menu, and press the Select key.
Channel designator
Training board
clock signal
Getting the Waveform on the Display
Result The training board clock signal is automatically scaled and is displayed in
channel C1.
7-5
Page 84

This is channel 1 with the
waveform of the training
board clock signal
displayed.
Using the Oscilloscope
Delete Channel 2 from the Display
Delete Channel 2 from the Display
You can delete the unused channels to get more display space.
1 Highlight the bar on the left side of the waveform area.
2 Using the knob, place the cursor on the channel 2 designator (C2),
then press the
3 Select Delete from the pop-up menu.
Select key.
This is channel 2, and it
does not contain data.
Therefore, this channel
can be deleted to allow
more display space for
channel 1.
Deleting Channel 2 from the Display
Result The unused channel 2 is deleted from the display. The waveform for channel
1 occupies the entire display.
7-6
Page 85

This field zooms the
waveform in and out.
Using the Oscilloscope
Zoom and Scroll Through the Clock Waveform
Zoom and Scroll Through the Clock Waveform
You can use the s/Div field to set the time scale on the horizontal axis of the
display from 1 ns/div to 5 s/div, and you can use the Delay field to scroll
through the waveform.
Highlight the s/Div field.
1
2 Rotate the knob clockwise to expand the clock waveform. Rotate
the knob counter clockwise to compress the waveform.
3 Highlight the Delay field.
4 Rotate the knob in both directions to scroll the clock waveform.
This field scrolls
through the waveform.
Expanding and Scanning the Clock Waveform
7-7
Page 86

Using the Oscilloscope
Measure the Clock Period Manually
Measure the Clock Period Manually
Time and voltage measurements can be made manually by turning the
T Markers field on.
Press the Marker MENU key. Marker is printed in white on the MENU
1
key.
2 Highlight the T Markers Off field and press the Select key. Highlight On
in the pop-up menu, and press the Select key.
3 Highlight the Trig to X field. Using the knob, move the X Marker to the
lowest point on the negative pulse.
You may need to expand or compress the waveform, using the s/Div field to
see a complete period of the waveform on the display.
Highlight the Trig to O field. Using the knob move the O Marker to the
4
same point on the next negative edge after the X Marker.
5 Read the period of the clock in the Tx to To field.
Read the clock
period in this field.
Highlight this field
and select On.
Highlight this field and
position the X Marker.
Highlight this field and
position the O Marker.
Measuring the Clock Period Manually with the X and O Markers
7-8
Page 87

The clock period is
displayed in this field.
Using the Oscilloscope
Measure the Clock Period with Auto Measure
Measure the Clock Period with Auto Measure
The Auto Measure function allows you to automatically measure many signal
parameters.
Press the Meas MENU key. Meas is printed in white on the MENU key.
1
2 Read the clock period in the box below the top row of fields.
Measuring the Clock Period with Auto Measure
7-9
Page 88

Use this field to position
the Va Marker.
Using the Oscilloscope
Read Voltage with the Markers
Read Voltage with the Markers
You can use the time and voltage markers to make time and voltage
measurements at specific points on the waveform.
Press the Marker MENU key.
1
2 Highlight the V Markers Off field, and press the Select key.
3 Highlight the Va Volts field. Rotate the knob and watch the Va marker
scroll up and down the screen across the displayed waveform.
Notice the changing voltage value in the Va Volts field.
The Va Marker.
The Vb Marker.
Reading the Voltage at the Markers
7-10
Page 89

8
Triggering the Oscilloscope with the Timing Analyzer
Page 90

Triggering the Oscilloscope with the
Timing Analyzer
You can use the oscilloscope and the timing analyzers together so that
the data and trigger points can be time-correlated. To perform these
exercises, you need an analyzer with an oscilloscope.
These exercises show you how to make the timing analyzer trigger the
oscilloscope inside the analyzer to find a glitch on the training board.
To do these exercises you need an HP 1660CS, HP 1661CS,
HP 1662CS, or an HP 1663CS analyzer. The CS models have the built
in oscilloscope.
In this chapter, you will:
• Set the jumpers
• Connect the oscilloscope probe
• Get the waveform on the display
• Change the oscilloscope trigger
• Turn on the timing analyzer
• Set up the timing format menu
• Define the timing trigger term
• Set up the timing trigger specification
• Arm the oscilloscope with the timing analyzer
• Add oscilloscope waveform to the timing waveforms
• Capture the glitch with the timing analyzer and oscilloscope
• Align the glitch displayed by the oscilloscope and analyzer
8-2
Page 91

Triggering the Oscilloscope with the Timing Analyzer
Before You Begin
Before You Begin
1 Decide what to do next.
If you have just completed all of the exercises in Chapters 2 through 7, go to
the "Set the Jumpers" exercise, on the next page.
If you have not just completed all of the exercises in Chapters 2 through 7, go
to step 2.
Load the configuration files CH08._A, and CH08._B.
2
When loading these files, you must set the analyzer to load All, because you
are loading two types of files for this exercise. Setting the analyzer to load
Analyzer like you did in previous exercises, will only load CH07._A properly.
The files will default all system settings and then set up the analyzer and
oscilloscope as if you had just completed all of the exercises in Chapters 2
through 7. If you need instructions to load the configuration files, refer to
chapter 11, "To Load a Configuration File."
Connect Pod 1.
3
Connect Pod 1 of the analyzer to J1 on the Training Board. For the
HP 1660s, Pod 1 is the top cable in the left-most position when you are facing
the rear of the logic analyzer.
8-3
Page 92

Triggering the Oscilloscope with the Timing Analyzer
Set the Jumpers
Set the Jumpers
You will create the glitch on bit 7 of the counter on the training board by
setting the glitch jumper to ON.
• Set the jumpers as shown below.
For more information about setting the jumpers, refer to chapter 11, "To Set
the Jumpers."
CLK2
CLK1
GLITCH
Setting the Jumpers
P. G.
OSC
P. G.
CLK2
OFF
ON
J1
Result The glitch on bit 7 is turned on.
8-4
Page 93

Triggering the Oscilloscope with the Timing Analyzer
Connect the Oscilloscope Probe
Connect the Oscilloscope Probe
1 Connect the oscilloscope probe to channel 1 on the front panel.
2 Connect the probe tip to the test point labeled "Glitch" on the Logic
Analyzer Training Board.
Note that this is a different test point than the "CLK 1" test point that was
used in Chapter 7.
Connect the probe ground lead to the test point labeled "Ground" on
3
the training board.
Note Leave Pod 1 connected to J1. This provides +5 V for the training board.
If Pod 1 is not connected to J1, connect it now.
J1 - Pod 1 of the
analyzer connects
here.
GND - Oscilloscope
ground connects here.
GLITCH - Oscilloscope
probe tip connects here.
Connecting the Oscilloscope Probe
8-5
Page 94

Triggering the Oscilloscope with the Timing Analyzer
Get the Waveform on the Display
Get the Waveform on the Display
The first step when using an oscilloscope is to get the waveform on the
display. Autoscale is an algorithm that automatically optimizes the display of
one or more waveforms. The oscilloscope triggers at an arbitrary point until
you set up the trigger conditions.
Press the Config key.
1
2 Highlight the field in the top, left corner of the display, and press the
Select key. Highlight Scope in the pop-up menu, and press the Select
key.
3 Highlight the Autoscale field and press the Select key. Highlight
Continue in the pop-up menu and press the Select key.
The arbitrary trigger
point happens to be on a
rising edge.
The glitch you will
capture with the timing
analyzer and the
oscilloscope.
Running the Oscilloscope with Autoscale
Result The waveform is on the display with the trigger occurring on a rising edge.
8-6
Page 95

Setting this field to
Immediate tells the
oscilloscope to trigger
immediately after the
timing analyzer triggers.
Triggering the Oscilloscope with the Timing Analyzer
Change the Oscilloscope Trigger
Change the Oscilloscope Trigger
You will be using the timing analyzer to find the glitch and then the
oscilloscope to display it. This correlation of timing and scope is done by
arming the scope with the timing analyzer. To capture the glitch on the
scope, you want it to capture data immediately after the glitch is captured by
the timing analyzer.
Press the Trigger MENU key.
1
2 Highlight the Mode/Arm Edge field at the left side of the display, and
press the
3 Highlight Immediate in the pop-up menu, and press the Select key.
Select key.
Changing the Oscilloscope Trigger
Result The oscilloscope is set to capture data after the timing analyzer triggers on
the glitch.
8-7
Page 96

Triggering the Oscilloscope with the Timing Analyzer
Turn On the Timing Analyzer
Turn On the Timing Analyzer
Now you will begin to set up the timing analyzer to capture the glitch.
1 Highlight the Scope field and press the Select key. Highlight Analyzer in
the pop-up menu, and press the
2 Press the Config MENU key.
If the Configuration menu is already displayed when you press the Config key,
then a pop-up menu will appear. Choose Configuration from the pop-up menu.
Highlight the field to the right of Type in the Analyzer 1 box and
3
press the
the
Result Analyzer 1 is set to timing mode.
Select key. Highlight Timing in the pop-up menu, and press
Select key.
Select key.
8-8
Page 97

The Timing Acquisition
Mode set to capture
the glitch.
Triggering the Oscilloscope with the Timing Analyzer
Set Up the Timing Format Menu
Set Up the Timing Format Menu
Because you will be making a timing measurement, you will use the TCOUNT
label that represents timing count. You will also set the timing acquisition
mode to capture the glitch.
Press the Format MENU key.
1
2 Highlight the SCOUNT label, and press the Select key. Highlight Turn
Label Off
3 Highlight the TCOUNT label, and press the Select key. Highlight Turn
Label On
4 Highlight the Timing Acquisition Mode, and press the Select key.
Highlight
Select key.
in the pop-up menu, and press the Select key.
in the pop-up menu, and press the Select key.
Glitch, Half Channel, 125 MHz in the pop-up menu, and press the
The TCOUNT label that
represents timing count.
Setting Up the Timing Format Menu
Result The label TCOUNT is turned on, and the timing analyzer acquisition mode is
set to glitch.
8-9
Page 98

Triggering the Oscilloscope with the Timing Analyzer
Define the Timing Trigger Term "Edge 1"
Define the Timing Trigger Term "Edge 1"
The timing analyzer can be configured to trigger on edges, or a glitch. In this
exercise, you will set the trigger term to glitch on bit 7.
Press the Trigger MENU key.
11
2 Highlight the Modify Trigger field, and press the Select key. Highlight
Clear Trigger, press the Select key, then highlight All, and press the
Select key.
3 Highlight the base field below TCOUNT, and press the Select key.
Highlight
4 Highlight the field to the right of Edge 1, and press the Select key.
5 Using the arrow key, move the cursor to highlight the asterisk in the
pop-up menu for bit 7. Press the
The asterisk tells the analyzer to look for a glitch on bit 7 of the counter.
Binary in the pop-up menu, and press the Select key.
Done key.
Edge 1
Bit 7
Defining Timing Trigger Terms Edge 1
Result The term "Edge 1" is defined as a glitch on bit 7.
8-10
Page 99

Triggering the Oscilloscope with the Timing Analyzer
Set Up the Timing Trigger Specification
Set Up the Timing Trigger Specification
You will now tell the analyzer to trigger on the glitch the first time it occurs.
1 Highlight the 1 field in the Timing Sequence Levels box, and press the
Select key.
2 Highlight the ">" field, and press the Select key. Highlight Occurs in the
pop-up menu, and press the
3 Highlight the field next to Trigger on, and press the Select key.
Highlight
4 Highlight the field next to Else on, and press the Select key. Highlight
no state in the pop-up menu, and press the Select key.
55 Press the Done key to close the Sequence Level 1 pop-up menu.
Edge 1 in the pop-up menu, and press the Select key.
Select key.
The trigger term
"Edge1" is set for the
analyzer to look for
the glitch on bit 7.
Setting Up the Trigger Specification
Result Your trigger specification now shows: Level 1 - TRIGGER on "Edge1" 1 time.
8-11
Page 100

Triggering the Oscilloscope with the Timing Analyzer
Arm the Oscilloscope with the Timing Analyzer
Arm the Oscilloscope with the Timing Analyzer
The timing analyzer and the oscilloscope can be configured so that the timing
analyzer’s glitch triggering capability will capture the glitch, and then arm the
oscilloscope so that it, too, captures the glitch.
Highlight the Arming Control field at the far right side of the screen, and
1
press the
2 Highlight the field under Scope Arm In, and press the Select key.
Highlight
When you select the analyzer to arm the scope, the field under
Analyzer Arm In changes to Group Run
3 Press the Done key to exit the Arming Control pop-up menu.
Select key.
Analyzer in the pop-up menu, and press the Select key.
.
The timing analyzer
starts when Group
Run is initiated.
Arming the Oscilloscope with the Timing Analyzer
Result The timing analyzer will look for the glitch, trigger, and then arm the scope,
which allows the scope to capture the glitch.
8-12
The oscilloscope is
armed by the Timing
Analyzer.
 Loading...