

Page 1
DOC023.52.80221
FT660 sc
01/2012, Edition 2
User Manual
Page 2

Page 3

Table of Contents
Specifications..................................................................................................................................................................................3
General information.....................................................................................................................................................................4
Safety information..............................................................................................................................................................................4
Use of hazard information..................................................................................................................................................................4
Precautionary labels..........................................................................................................................................................................4
Certification........................................................................................................................................................................................5
Product overview...............................................................................................................................................................................5
Product components..........................................................................................................................................................................6
Installation.........................................................................................................................................................................................7
Installation guidelines.........................................................................................................................................................................7
Mechanical installation.......................................................................................................................................................................7
Instrument mounting...................................................................................................................................................................7
Electrical installation..........................................................................................................................................................................8
Connect an sc controller using Quick-connect fitting..................................................................................................................8
Plumbing............................................................................................................................................................................................8
Sample line considerations.........................................................................................................................................................8
Connect the sample stream........................................................................................................................................................8
Operation............................................................................................................................................................................................9
Using the sc controller.......................................................................................................................................................................9
Configure the instrument....................................................................................................................................................................9
Data logging.....................................................................................................................................................................................10
Calibration........................................................................................................................................................................................10
Prepare the StablCal® Standard...............................................................................................................................................10
Calibration notes.......................................................................................................................................................................10
Calibration procedure...............................................................................................................................................................10
Calibration verification......................................................................................................................................................................11
Types of verifications................................................................................................................................................................12
Verification procedure with a wet standard...............................................................................................................................12
Prerequisites for dry standard use............................................................................................................................................12
Verification with a dry standard and software...........................................................................................................................13
1
Page 4

Table of Contents
Enable the dry standard software......................................................................................................................................13
Assign a baseline value to the dry standard......................................................................................................................13
Verification procedure with dry standard and software......................................................................................................14
Verification with a dry standard without software......................................................................................................................15
Assign a baseline value to the dry standard......................................................................................................................15
Verification procedure with dry standard without software................................................................................................16
Calibration and verification history...................................................................................................................................................16
Maintenance...................................................................................................................................................................................16
Maintenance schedule.....................................................................................................................................................................17
Clean the instrument........................................................................................................................................................................17
How to clean spills....................................................................................................................................................................20
Troubleshooting..........................................................................................................................................................................20
Errors...............................................................................................................................................................................................20
Warnings..........................................................................................................................................................................................20
Diagnostics and Test menu.............................................................................................................................................................21
Theory of operation...................................................................................................................................................................22
RSD parameter................................................................................................................................................................................22
Correlation study between kaolin standards and measured turbidity......................................................23
Replacement parts and accessories...............................................................................................................................24
2
Page 5
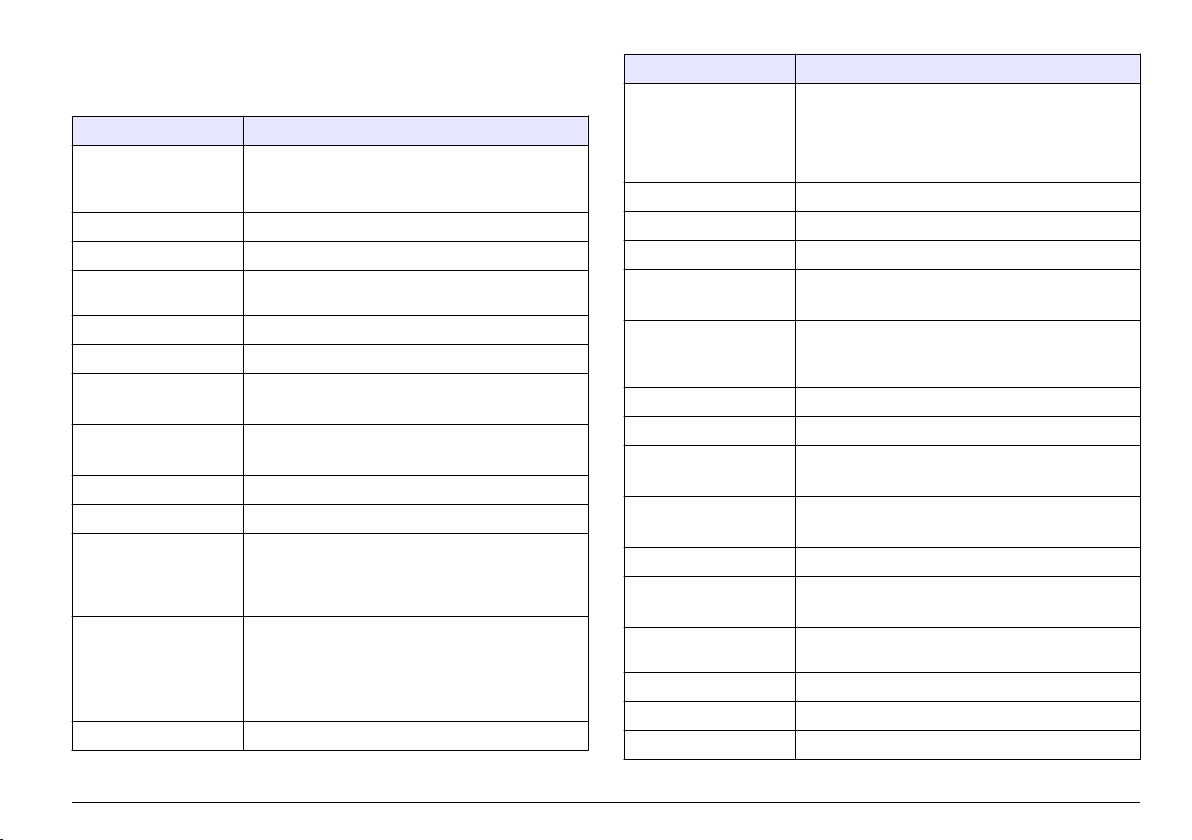
Specifications
Specifications are subject to change without notice.
Specification Details
Range 0.000–5000 milli-Nephelometric Turbidity Units
Measurement units mNTU, mFTU, NTU, FTU, mg/L, Degree
Over-range limit
Method compliance USEPA Approved for drinking water applications by
Lowest expected reading 7 mNTU
Accuracy ±3% of reading or ±5 mNTU (whichever is greater)
Repeatability ±0.42% at 50 mNTU
Resolution 0.001 mNTU on lowest range
Calibration Single point at 800 mNTU ±50 mNTU
Calibration frequency Every 3 months (or as per regulations)
Calibration (wet)
verification method
Calibration (dry)
verification method
Signal averaging No averaging, 6, 30, 60 or 90 seconds
*
(mNTU)
(0–5.0 NTU with +10% over-range limit)
+10%
Method 10133
±0.3% at 800 mNTU
0.1 mNTU on highest range
Pass/fail criteria or tolerance (standards less than
1000 mNTU): 25–50 mNTU
Pass/fail criteria or tolerance (standards greater than
1000 mNTU): 5%
Verification level: 20–50 mNTU
Performance default: ±5 mNTU of the identified
baseline value
Method precision: less than or equal to 5% relative
standard deviation (RSD)
Specification Details
Sample light source Class 1 Laser Product with embedded 7.5 mW,
Power requirement 10.5 to 13.2 VDC at 1.5 VA
Operating conditions 0 to 40 °C (32 to 100 °F), 5–95% non-condensing
Storage conditions –20 to 60 °C (–4 to 140 °F)
Sample requirements Temperature: 0 to 50 °C (32 to 121 °F)
Recorder output 0–20 mA or 4–20 mA
Sample inlet fitting ¼-in. NPT female, ¼-in. compression fitting
Drain fitting ½-in. NPT female, ½-in. hose barb
Tubing requirements Sample inlet: ¼-inch OD rigid or semi-rigid tubing
Dimensions
(W x D x H)
Mounting options Wall mounted or floor stand
Shipping weight Turbidimeter and controller—16.31 kg (13.5 lb)
ASTM conformance D6698 Standard test method for online measurement
Limit of detection (LOD) 0.296 mNTU (ISO 15839)
Protection class III
Pollution degree 2/II
670 nm, Class 3B Laser Source
Complies with 21 CFR 1040.10 except for deviations
pursuant to Laser Notice No. 50, dated June 24,
2007. FDA Laser Accession No. 9911570
Flow: 100–750 mL/minute (1.6–11.9 gal/hour)
The output span is programmable over any portion of
the 0.000–1000 mNTU range.
Drain: ½-inch ID flexible plastic tubing
25.4 x 30.5 x 40.6 cm (10 x 12 x 16 in.)
Turbidimeter only—4.71 kg (10 lb)
of turbidity below 5 NTU
English 3
Page 6
*
The instrument range is from 0 to 5000 mNTU. The instrument is
guaranteed to meet specifications relative to accuracy, repeatability and
linearity up to 5000 mNTU. The instrument will still show a value above
5000 mNTU to the level of 5500 mNTU, but above 5000 mNTU,
measurement performance is not guaranteed. Between 5000 and
5500 mNTU, the warning alarm will flash to tell the operator that the
operating range has been exceeded. An over-range event is also logged.
All alarm setpoints are calculated based on the maximum value show
(5500 mNTU).
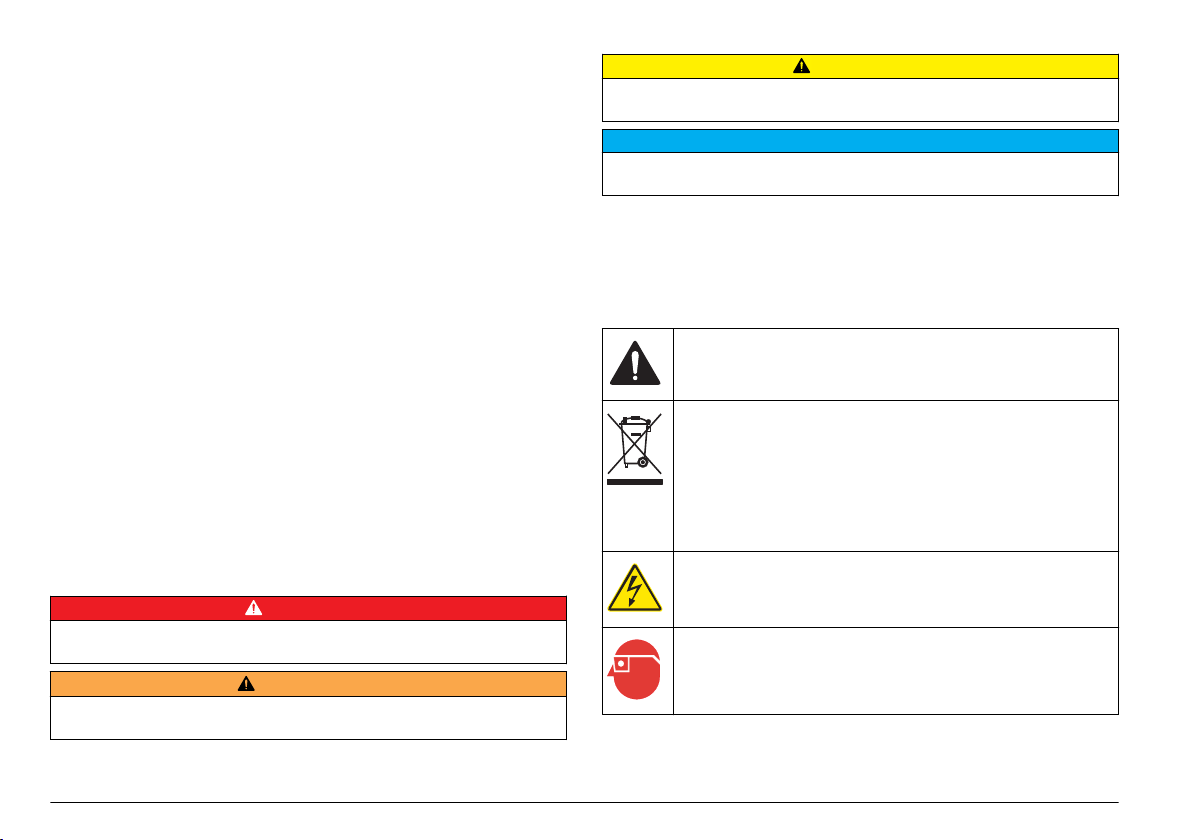
C A U T I O N
Indicates a potentially hazardous situation that may result in minor or moderate
injury.
Indicates a situation which, if not avoided, may cause damage to the instrument.
Information that requires special emphasis.
N O T I C E
General information
In no event will the manufacturer be liable for direct, indirect, special,
incidental or consequential damages resulting from any defect or
omission in this manual. The manufacturer reserves the right to make
changes in this manual and the products it describes at any time, without
notice or obligation. Revised editions are found on the manufacturer’s
website.
Safety information
Please read this entire manual before unpacking, setting up or operating
this equipment. Pay attention to all danger and caution statements.
Failure to do so could result in serious injury to the operator or damage
to the equipment.
Make sure that the protection provided by this equipment is not impaired.
Do not use or install this equipment in any manner other than that
specified in this manual.
Use of hazard information
D A N G E R
Indicates a potentially or imminently hazardous situation which, if not avoided, will
result in death or serious injury.
Indicates a potentially or imminently hazardous situation which, if not avoided,
could result in death or serious injury.
W A R N I N G
Precautionary labels
Read all labels and tags attached to the instrument. Personal injury or
damage to the instrument could occur if not observed. A symbol, if noted
on the instrument, will be included with a danger or caution statement in
the manual.
This symbol, if noted on the instrument, references the instruction
manual for operation and/or safety information.
Electrical equipment marked with this symbol may not be disposed of
in European public disposal systems after 12 August of 2005. In
conformity with European local and national regulations (EU Directive
2002/98/EC), European electrical equipment users must now return
old or end-of-life equipment to the Producer for disposal at no charge
to the user.
Note: For return for recycling, please contact the equipment producer or supplier
for instructions on how to return end-of-life equipment, producer-supplied
electrical accessories, and all auxillary items for proper disposal.
This symbol indicates that a risk of electrical shock and/or
electrocution exists.
This symbol indicates the need for protective eye wear.
4 English
Page 7
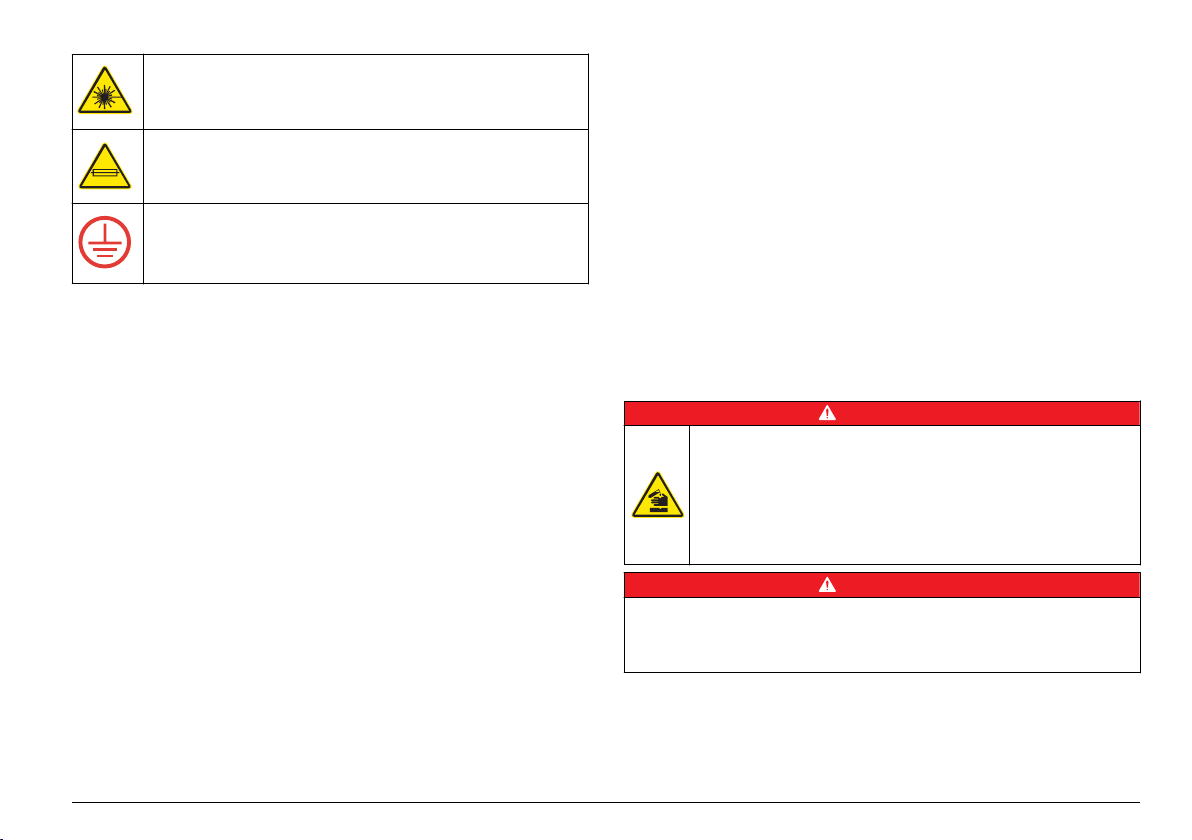
This symbol indicates a laser device is used in the equipment.
This symbol, when noted on the product, identifies the location of a
fuse or current limiting device.
This symbol indicates that the marked item requires a protective earth
connection. If not provided with a plug on a cord, connect positive
earth to this terminal (U.S. cord set provides ground).
Certification
Canadian Radio Interference-Causing Equipment Regulation,
IECS-003, Class A:
Supporting test records reside with the manufacturer.
This Class A digital apparatus meets all requirements of the Canadian
Interference-Causing Equipment Regulations.
Cet appareil numèrique de la classe A respecte toutes les exigences du
Rëglement sur le matériel brouilleur du Canada.
FCC Part 15, Class "A" Limits
Supporting test records reside with the manufacturer. The device
complies with Part 15 of the FCC Rules. Operation is subject to the
following conditions:
1. The equipment may not cause harmful interference.
2. The equipment must accept any interference received, including
interference that may cause undesired operation.
Changes or modifications to this equipment not expressly approved by
the party responsible for compliance could void the user's authority to
operate the equipment. This equipment has been tested and found to
comply with the limits for a Class A digital device, pursuant to Part 15 of
the FCC rules. These limits are designed to provide reasonable
protection against harmful interference when the equipment is operated
in a commercial environment. This equipment generates, uses and can
radiate radio frequency energy and, if not installed and used in
accordance with the instruction manual, may cause harmful interference
to radio communications. Operation of this equipment in a residential
area is likely to cause harmful interference, in which case the user will be
required to correct the interference at their expense. The following
techniques can be used to reduce interference problems:
1. Disconnect the equipment from its power source to verify that it is or
is not the source of the interference.
2. If the equipment is connected to the same outlet as the device
experiencing interference, connect the equipment to a different
outlet.
3. Move the equipment away from the device receiving the interference.
4. Reposition the receiving antenna for the device receiving the
interference.
5. Try combinations of the above.
Product overview
D A N G E R
Chemical or biological hazards. If this instrument is used to monitor a
treatment process and/or chemical feed system for which there are
regulatory limits and monitoring requirements related to public health,
public safety, food or beverage manufacture or processing, it is the
responsibility of the user of this instrument to know and abide by any
applicable regulation and to have sufficient and appropriate
mechanisms in place for compliance with applicable regulations in the
event of malfunction of the instrument.
Although the sc controller is certified for Class 1, Division 2 Hazardous Locations,
it is only certified when installed with sensors listed in Control Drawings 5860078.
The sc controller and FT660 sc are NOT suitable for use in Class 1, Division
2 Hazardous Locations.
The FT660 sc is a continuous-reading instrument for filter management
(Figure 1). The FT660 sc is appropriate for ultra pure and all processes
that include clean water monitoring.
D A N G E R
English 5
Page 8
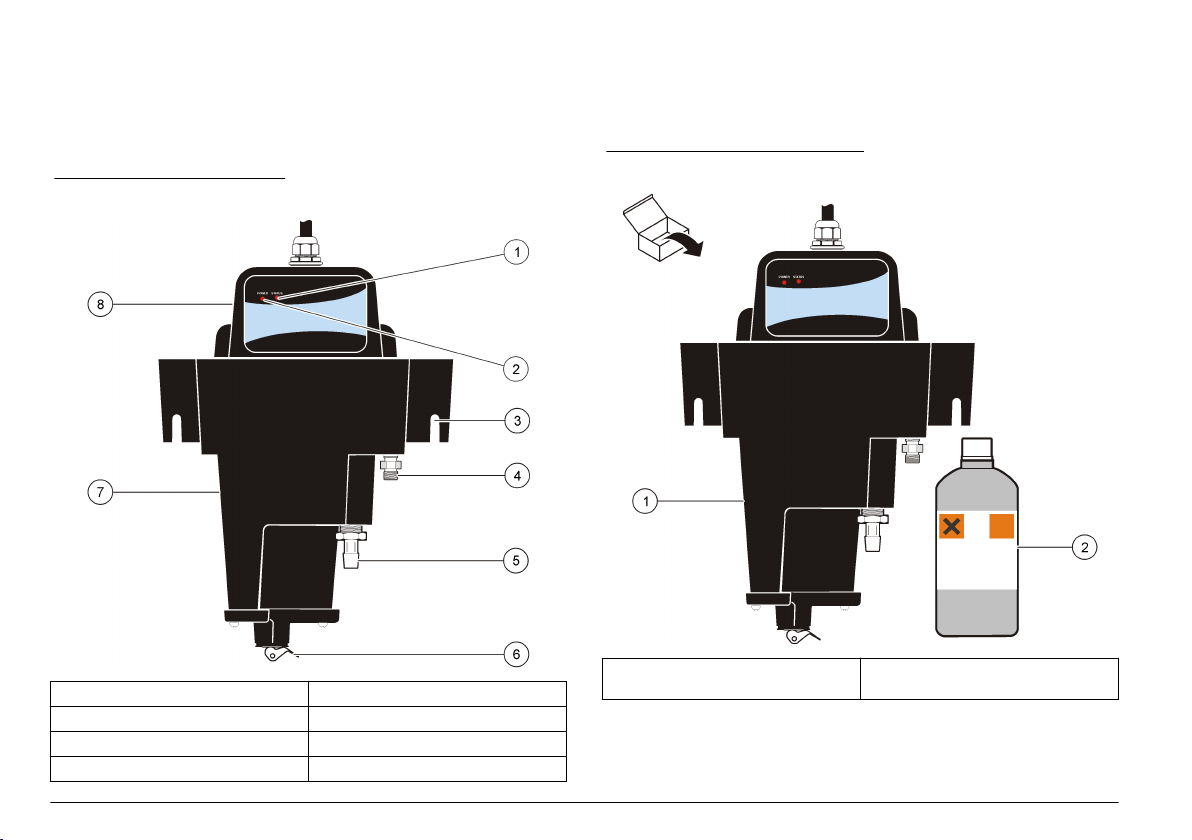
The status light on the head assembly is illuminated when an error
occurs and flashes when a warning occurs or the head assembly is not
installed correctly.
The back of the head assembly has a molded "lip" that may be used to
hang the head on the edge of the body of the instrument during
maintenance.
Figure 1 Instrument overview
Product components
Make sure that all components have been received (Figure 2). If any
items are missing or damaged, contact the manufacturer or a sales
representative immediately.
Figure 2 Instrument components
1 Status light 5 Drain fitting
2 Power light 6 Drain plug
3 Mounting bracket 7 Body of the instrument
4 Sample inlet fitting 8 Head assembly
6 English
1 FT660 sc turbidimeter 2 800 mNTU StablCal® Certified
Standard
Page 9
Installation
D A N G E R
Multiple hazards. Only qualified personnel must conduct the tasks
described in this section of the document.
Installation guidelines
N O T I C E
High internal temperatures will damage the instrument components.
• Do not operate the instrument in direct sunlight or next to a heat
source.
Install the instrument indoors in a clean environment with minimum
•
vibration.
Note: Particulate contamination from the surrounding area is a major cause of
error.
• Install the instrument level.
• Keep the flow rate and operating temperature as constant as possible
for best performance.
Mechanical installation
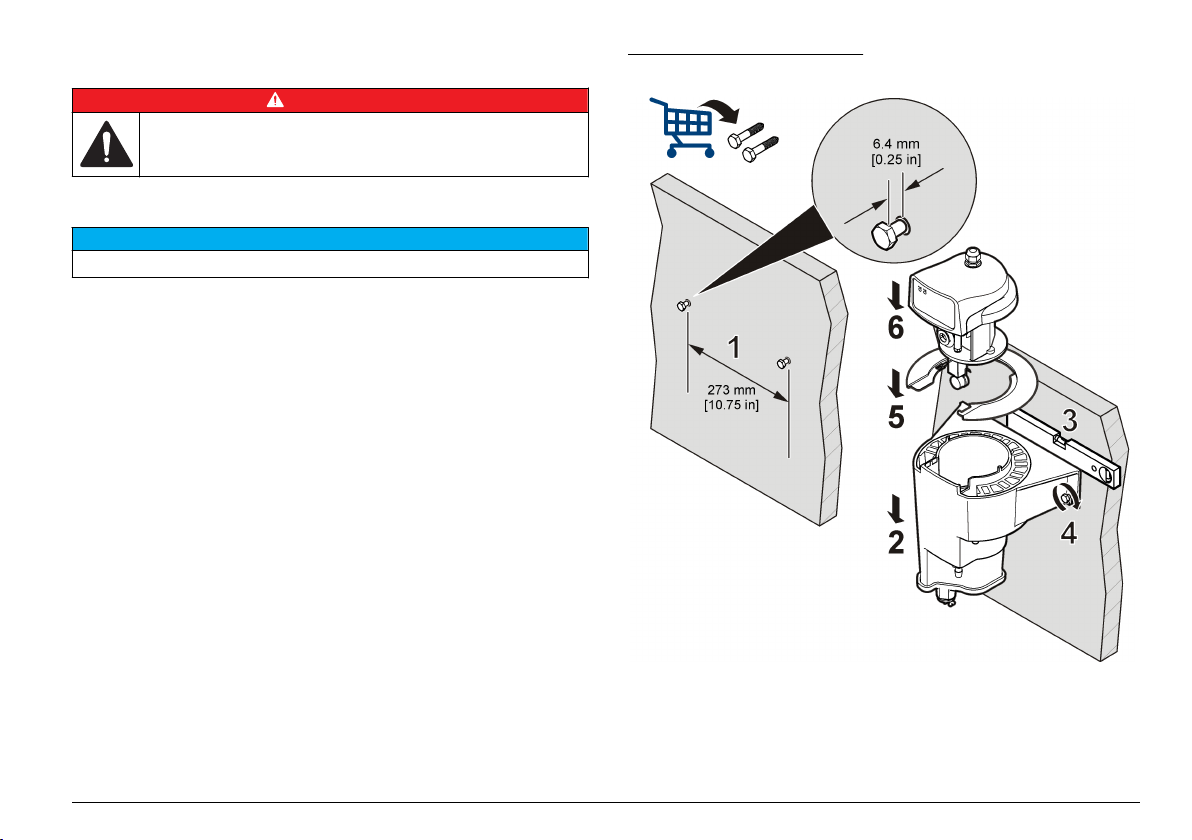
Instrument mounting
Install this instrument on a flat, vertical surface. Refer to the illustrated
steps in Figure 3. Mounting hardware (two ¼-20 bolts) is supplied by the
customer.
Install the instrument as near to the sampling point as possible to
minimize lag time of the sample flow.
Refer to Figure 4 for instrument dimensions and clearance
specifications.
Note: As an alternative, this instrument can be installed on the optional floor stand.
Figure 3 Instrument mounting
English 7
Page 10

Figure 4 Instrument dimensions
1 22 cm (10 in.) minimum clearance
Electrical installation
Connect an sc controller using Quick-connect fitting
The instrument can be connected to an sc controller using the keyed
quick-connect fitting (Figure 5). Extension cables are available. Retain
the connector cap to seal the connector opening in case the instrument
must be removed. Refer to the sc controller manual for more information.
Figure 5 Quick-connect fitting
Plumbing
Sample line considerations
Select a good, representative sampling point for optimum instrument
performance. The sample analyzed must be representative of the
conditon of the entire system.
To minimize erratic readings:
Draw samples from locations that are sufficiently distant from points of
•
chemical additions to the process stream
• Make sure samples are sufficiently mixed
• Make sure all chemical reactions are complete
Connect the sample stream
Connect sample inlet and drain lines to the fittings on the body of the
instrument (Figure 1 on page 6). Sample inlet and drain tubing are
supplied by the customer. Refer to Specifications on page 3 for tubing
requirements.
Install the sample line(s) into a larger process pipe to minimize
interference from air bubbles or pipeline bottom sediment. A sample line
going into the center of a process pipe is best.
8 English
Page 11

Figure 6 shows examples of good and bad methods of installing a
sample line into a process pipe.
Notes:
•
Keep the sample inlet and drain tubing as short as possible to
minimize lag time of the sample flow.
• Control the flow rate into the instrument with a flow restriction device
on the sample line. Refer to Specifications on page 3 for flow rate
specifications.
Note: Flow rates greater than 750 mL/minute will cause the instrument to
overflow into the drain, decrease the performance of the bubble trap and cause
incorrect readings.
Figure 6 Sampling methods
1 Air 2 Sample flow
Operation
Configure the instrument
Use the Configure menu to enter identification information and display
options for the instrument and to change options for instrument settings,
data handling and storage.
1. From the Main menu, select Sensor Setup, [Select Sensor],
Configure.
2. Use the arrow keys to select an option and confirm. To enter
numbers, characters or punctuation, push and hold the UP or DOWN
arrow keys. Push the RIGHT arrow key to advance to the next
space.
Option Description
BUBBLE
REJECT
SIGNAL AVG Select no signal averaging or the amount of time for
MEAS UNITS Select the measurement units to show on the display—
EDIT NAME Change the name to show on the display for the
SET
RESOLUTION
Enable or disable bubble reject—Yes (default) or No
Bubble reject is an averaging algorithm that
compensates for higher readings caused by entrained
air coming out of the solution in the sample chamber.
signal averaging—no averaging, 6, 30, 60 or 90 (default)
seconds.
mNTU (default), mFTU, NTU, FTU, mg/L or Degree.
instrument. The instrument name can be a maximum of
12-digits in any combination of symbols and alpha or
numeric characters.
Note: The serial number of the instrument is the default
name.
Set the number of significant digits to show on the
display (default=3).
Using the sc controller
Before using the instrument with an sc controller become familiar with
the operating mode of the sc controller. Refer to the sc controller user
manual and learn how to use and navigate the menu functions.
English 9
Page 12

Option Description
DATALOG
INTRVL
OFFSET Sets an offset of the value of the standard used for
Select the interval between saving data points to the
data log—30 seconds or 1, 5, 10 or 15 (default) minutes.
calibration (-50 to +50 mNTU, default=0).
The offset value is subtracted from the calibration
standard value shown on the sc controller.
The offset can be entered after a calibration is complete
and is based on independent turbidity measurement of
the calibration standard.
Note: The offset will not result in a calibration standard
value of less than zero on the sc controller.
Data logging
The sc controller provides one data log and one event log for each
instrument. The data log stores the measurement data at selected
intervals. The event log stores different types of events that occur on the
devices (i.e., configuration changes, alarms and warning conditions).
The data log and the event log can be saved in CSV format. Refer to the
sc controller user manual for instructions.
Calibration
Calibration is done in the body of the instrument or using the optional
calibration kit.
Calibration is done using 1 L of 800 ± 50 mNTU StablCal Stabilized
Formazin Certified Standard. Do not use other types or values of
standards. Do not use user-prepared formazin.
The performance specifications given in this manual are based on and
guaranteed only when calibration is done with StablCal Stabilized
Formazin Certified Standard for this instrument. The manufacturer
cannot guarantee the performance of the instrument if calibrated with copolymer styrenedivinylbenzene beads or other suspensions.
Prepare the StablCal®
• Before opening a StablCal Standard bottle, clean the exterior surface
of the bottle with clean water to remove dust or other debris.
Standard
• Gently invert the bottle for 1 minute (about 50 inversions). Do not
shake.
Note: The suspension is stable for 30–60 minutes after mixing.
The StablCal Certified Standard is stabilized formazin with a value that is
identified to within ± 1 mNTU. The value, specific to that particular lot of
product, is printed on the label. Lot-to-lot variation will be ± 50 mNTU
from the standard value, with a standard deviation of less than ± 5%
within a single lot.
Calibration notes
Calibrate the instrument before initial use.
•
• Calibrate the instrument every three months (or as set by regulatory
agencies).
• Calibrate the instrument after any significant maintenance or repair is
done on the instrument.
• Always clean the instrument immediately before calibration. Refer to
Clean the instrument on page 17.
• Operate the instrument at least 10 hours before calibration.
• For the best calibration, calibrate the instrument when it is at the same
temperature as the operating conditions.
• The Hold Outputs feature is automatically enabled during the zero
electronics and calibration procedure. The Hold Output feature holds
attached outputs at the before-calibration settings.
Calibration procedure
1. From the Main menu, select Sensor Setup, [Select Sensor],
Calibrate, StablCal Cal.
2. Select the available Output Mode (Active, Hold or Transfer) from the
list box and confirm.
3. Remove the head assembly and bubble trap cover from the body of
the instrument. Refer to Figure 7.
4. Make sure that the body of the instrument is drained completely.
5. Enter the turbidity value that is on the label of the StablCal Standard
bottle and confirm.
10 English
Page 13

6. Put a funnel at the end of the bubble trap and slowly put 800 mNTU
StablCal Standard in the funnel to fill the body. Refer to Figure 7.
7. Put the bubble trap cover and head assembly on the body of the
instrument.
Note: If the head assembly is not correctly installed, the laser will not turn on
and the reading on the display will be near 0.000 mNTU or a negative value.
The red status light on the instrument will also flash one time per second.
8. When the turbidity reading is stable (and after greater than
5 minutes), confirm to accept the reading.
9. When the display shows "GOOD CAL! GAIN: X.XX ENTER TO
CONT.", confirm to save the turbidity value.
Note: If the display shows "BAD CAL!", confirm to do the calibration again or
exit.
10. When the display shows "VERIFY CAL?", confirm to do a calibration
verification or exit without verification.
11. Do a calibration verification or enter the operator initials to complete
the calibration.
12. When the display shows "RETURN SENSOR TO MEASURE
MODE", confirm.
Figure 7 Calibrate the instrument
1 Head assembly 4 Funnel
2 800 mNTU StablCal® Certified
Standard
3 Bubble trap 6 Bubble trap cover
5 Body of the instrument
Calibration verification
Do a calibration verification immediately after every calibration.
Subsequent verifications are referenced to the initial verification.
Do a calibration verification monthly between calibrations.
A calibration verification is a check that is done to make sure that the
instrument is working correctly and calibrated.
English 11
Page 14

Types of verifications
Wet or dry standards can be used to do calibration verifications.
To do a wet standard verification, refer to Verification procedure with a
wet standard on page 12.
To do a dry standard verification, refer to Prerequisites for dry standard
use on page
12 and then either:
• Verification with a dry standard and software on page 13—Applies
to instruments with dry standard software.
• Verification with a dry standard without software on page 15—
Applies to instruments that do not have dry standard software.
Verification procedure with a wet standard
Wet standard verification is done using 1 L of StablCal Stabilized
Formazin Certified Standard (0–5500 mNTU) for this instrument . Do not
use other standards. Do not use user-prepared formazin.
Note: For the best verification results, clean the instrument before doing a wet
standard verification. Refer to Clean the instrument on page 17.
Note: On the sc controller, there is no option to set the pass or fail criteria (PFC)
for a wet verification. The default PFC is ± 50 mNTU (0.050 NTU) or 5% of the
reading, whichever is greater.
1. From the Main menu, select Sensor Setup, [Select Sensor],
Calibrate, Verification, Perform Ver.
2. Select the available Output Mode (Active, Hold or Transfer) from the
list box and confirm.
3. Select WET for the verification type and confirm.
4. Enter the turbidity value that is on the label of the StablCal Standard
bottle and confirm.
5. When the display shows "DRAIN AND CLEAN BODY. ENTER TO
CONT.", fully flush the body of the instrument with water that is less
than 50 mNTU (0.05 NTU).
a. Remove the head assembly and bubble trap cover from the body
of the instrument. Refer to Figure 7 on page 11.
b. Put an empty container under the instrument.
c. Remove the drain plug from the bottom of the body of the
instrument. Refer to Figure 1 on page 6.
Note: There is no risk of laser exposure with the drain plug removed. The
laser is disabled when the head assembly is removed.
d. Fully flush the body of the instrument with water that is less than
50 mNTU (0.05 NTU).
e. Install the drain plug in the instrument.
6. Prepare the StablCal standard. Refer to Prepare the StablCal
Standard on page
10.
®
7. Put a funnel at the end of the bubble trap and slowly put the StablCal
Standard in the funnel to fill the body. Confirm. Refer to Figure 7
on page 11.
8. Put the bubble trap cover and head assembly on the body of the
instrument.
9. When the turbidity reading is stable (and after greater than
5 minutes), confirm to accept the reading.
10. If "GOOD VER" (good verification) is shown:
a. Select ENTER INITIALS and confirm.
b. Enter operator initials and confirm.
c. Select RETURN SENSOR TO MEASURE MODE and confirm.
11. If "BAD VER" (bad verification) is shown:
a. To do the calibration verification again, confirm.
Note: If the verification fails two times, “Please Recalibrate” is shown, then
the display returns to the Calibrate Menu. Verification cannot be done until
the instrument is recalibrated.
b. To exit, push BACK.
Note: The bad verification is saved in the verification history.
Prerequisites for dry standard use
In order to use the dry standard, the instrument must have a special
aperture plate. Refer to Figure 8 on page 14. The instrument can also
have a software upgrade to install dry standard software.
Instruments made before April 2008 do not have the special aperture
plate. Customers can order and install the special aperture plate.
Installation instructions are provided with the aperture plate.
12 English
Page 15

Instruments made before April 2008 do not have dry standard software
installed. Software upgrades must be done by the manufacturer.
Starting in April of 2008, the aperture plate and dry standard software
will be installed on instruments at the time of manufacture.
Verification with a dry standard and software
This procedure includes instructions on how to:
•
Enable the dry standard software and set the pass or fail criteria for
verification
• Find and save a baseline value for the dry standard using the dry
standard software
• Do a dry standard verification using the dry standard software
Find and save the baseline value for the dry standard immediately after
the instrument is calibrated and after every subsequent calibration. Refer
to Assign a baseline value to the dry standard on page 13.
The baseline value is referenced for subsequent calibration verifications
until the next calibration.
Note: When not in use, keep the dry standard in the protective case.
Enable the dry standard software
1. From the Main menu, select Sensor Setup, [Select Sensor],
Calibrate, Verification, CVM Select, Enable.
2. To set the pass or fail criteria to a value other than the recommended
default (± 5 mNTU):
a. Select Verification, P/F Criteria.
Note: The P/F Criteria menu option is available only if CVM is set to
ENABLE in step 1.
b. Use the arrow keys to change the PFC (pass or fail criteria) value
and confirm.
The PFC range is 5–250 mNTU.
Assign a baseline value to the dry standard
1. After the instrument is calibrated and the operator initials have been
entered, the display shows "VERIFY CAL?". Confirm to start the
verification process.
2. Select DRY for the verification type and confirm.
3. Remove the head assembly from the body of the instrument.
4. Remove the dry standard from the protective case. Refer to Figure 8.
5. Record the serial number of the dry standard. Refer to Figure 8.
6. Clean, dry and inspect the dry standard.
a. Use the disposable wipes provided to clean the dry standard.
b. Use a dry cloth to dry the top 1/3 of the dry standard. Refer to
Figure 8.
c. Make sure that the glass of the dry standard is free of chips and
scratches.
7. Install the dry standard.
a. Put the dry standard in the aperture plate. Make sure that the
locking pin goes in the notch in the aperture plate. Refer to
Figure 8.
b. Turn the dry standard 1/8 of a turn clockwise until the dry standard
locks in position.
c. Use a dry cloth to remove any fingerprints and oils from the glass
of the dry standard.
8. Put the head assembly on the body of the instrument.
9. Enter the serial number of the dry standard, then confirm.
10. When the instrument reading is stable, confirm to accept the reading
as the baseline value.
11. Remove the dry standard from the instrument.
a. Remove the head assembly from the body of the instrument.
b. Turn the dry standard 1/8 of a turn counter-clockwise, then
remove the dry standard from the aperture plate.
c. Put the head assembly on the body of the instrument.
12. Confirm to go to Measurement Mode.
English 13
Page 16

13. Push HOME to show the online measurements.
14. Put the dry standard in the protective case.
Figure 8 Install the dry standard
1 Dry standard 5 Locking pin
2 Protective case 6 Notch in the aperture plate
3 Top of the dry standard 7 Head assembly
4 Serial number 8 Aperture plate
Verification procedure with dry standard and software
1. From the Main menu, select Sensor Setup, [Select Sensor],
Calibrate, Verification, Perform Ver.
2. Select the available Output Mode (Active, Hold or Transfer) from the
list box and confirm.
3. Select DRY for the verification type and confirm.
4. Remove the dry standard from the protective case. Refer to Figure 8
on page
14.
5. Make sure that the serial number on the display is the same as the
serial number on the dry standard, then confirm. Refer to Figure 8
on page
14.
6. Remove the head assembly from the body of the instrument.
7. Clean, dry and inspect the dry standard.
a. Use the disposable wipes provided to clean the dry standard.
b. Use a dry cloth to dry the top 1/3 of the dry standard. Refer to
Figure 8 on page 14.
c. Make sure that the glass of the dry standard is free of chips and
scratches.
8. Install the dry standard.
a. Put the dry standard in the aperture plate. Make sure that the
locking pin goes in the notch in the aperture plate. Refer to
Figure 8 on page 14.
b. Turn the dry standard 1/8 of a turn clockwise until the dry standard
locks in position.
c. Use a dry cloth to remove any fingerprints and oils from the glass
of the dry standard.
9. Put the head assembly on the body of the instrument.
10. When the instrument reading is stable, confirm.
"GOOD VER" (good verification) or "BAD VER" (bad verification) is
shown. If "BAD VER" is shown, the instrument did not to meet the
PFC (pass or fail criteria), or the instrument was not able to get a
stable reading. Use Table 1 to identify the result and what action
should be done.
11. Remove the dry standard from the instrument.
a. Remove the head assembly from the body of the instrument.
b. Turn the dry standard 1/8 of a turn counter-clockwise, then
remove the dry standard from the aperture plate.
c. Put the head assembly on the body of the instrument.
12. Confirm to go to Measurement Mode.
13. Push HOME to show the online measurements.
14. Put the dry standard in the protective case.
14 English
Page 17

Table 1 Interpretation of verification values
Verification values Result identified Suggested action
± 5 mNTU of the
2
baseline
- 5 mNTU (or less) of
the baseline
+ 5 mNTU (or
greater) of the
baseline
2**
*
If the instrument consistently does not meet the PFC, contact the
manufacturer.
**
A significantly low value is 25% or less of the expected value. A significantly
low value may occur because the light source or detector is not working
correctly. If the verification value is consistently significantly low, send the
instrument to the manufacturer for service.
The instrument is
calibrated.
The instrument is not
calibrated.
The instrument body
may be contaminated.
There may be fluid on
the optical surface of the
dry standard.
None
1. Clean the instrument.
2. Do the verification again.
3. Recalibrate the instrument
if necessary.
4. If recalibrated, assign a
new baseline value.
1. Clean the body of the
instrument, bubble trap,
detector and dry standard.
2. Recalibrate the instrument.
3. Assign a new baseline
value.
Verification with a dry standard without software
This procedure includes instructions on how to:
Assign an initial baseline value to the dry standard without dry
•
standard software
• Do a dry standard verification without dry standard software
Find and store the baseline value for the dry standard immediately after
the instrument is calibrated and after every subsequent calibration. Refer
to Assign a baseline value to the dry standard on page 15.
The baseline value is referenced for subsequent calibration verifications
until the next calibration.
Note: This procedure can be done on instruments that use the AquaTrend
controller by manually recording the baseline value for the dry standard, pass or fail
criteria (PFC) for verification and verification value.
Note: When not in use, keep the dry standard in the protective case.
®
Assign a baseline value to the dry standard
1. Remove the head assembly from the body of the instrument.
2. Remove the dry standard from the protective case. Refer to Figure 8
on page 14
.
3. Clean, dry and inspect the dry standard.
a. Use the disposable wipes provided to clean the dry standard.
b. Use a dry cloth to dry the top 1/3 of the dry standard. Refer to
Figure 8 on page 14.
c. Make sure that the glass of the dry standard is free of chips and
scratches.
4. Install the dry standard.
a. Put the dry standard in the aperture plate. Make sure that the
locking pin goes in the notch in the aperture plate. Refer to
Figure 8 on page 14.
b. Turn the dry standard 1/8 of a turn clockwise until the dry standard
locks in position.
c. Use a dry cloth to remove any fingerprints and oils from the glass
of the dry standard.
5. Put the head assembly on the body of the instrument.
6. When the instrument reading is stable, record the value.
This value is one of three values that will be used to calculate an
average value. The average value will be the final baseline value.
7. Prepare the dry standard to be measured again.
a. Remove the head assembly from the body of the instrument.
b. Turn the dry standard 1/8 of a turn counter-clockwise, then
remove the dry standard from the aperture plate.
c. Do steps 3–5.
8. When the instrument reading is stable, record the value.
English 15
Page 18

9. Do step 7 again.
10. When the instrument reading is stable, record the value.
11. Calculate and record the average of the three recorded values. The
average value is the final baseline value for the dry standard for this
specific instrument.
12. Near the final baseline value, record the serial number of the
instrument and the serial number of the dry standard. Refer to
Figure 8 on page
Note: The final baseline value for the dry standard is applicable only for the
combination of the dry standard and the instrument used to measure the dry
standard.
13. Remove the dry standard from the instrument.
a. Remove the head assembly from the body of the instrument.
b. Turn the dry standard 1/8 of a turn counter-clockwise, then
remove the dry standard from the aperture plate.
c. Put the head assembly on the body of the instrument.
14. Put the dry standard in the protective case.
Verification procedure with dry standard without software
1. Do steps 1– 5 of Assign a baseline value to the dry standard
on page 15.
2. When the instrument reading is stable, record the value.
3. Use Table 1 on page 15 to identify the result and what action should
be done.
Note: Table 1 on page 15 assumes a PFC (pass or fail criteria) of ± 5 mNTU.
4. Remove the dry standard from the instrument.
a. Remove the head assembly from the body of the instrument.
b. Turn the dry standard 1/8 of a turn counter-clockwise, then
remove the dry standard from the aperture plate.
c. Put the head assembly on the body of the instrument.
5. Put the dry standard in the protective case.
14.
Calibration and verification history
The calibration and verification history logs contain information on the
last 12 calibrations and the last 12 verifications.
To access the calibration history logs, select Sensor Setup, [Select
Sensor], Calibrate, Cal History.
To access the verification history logs, select Sensor Setup, [Select
Sensor], Calibrate, Verification.
Push confirm to move through a history log. After all 12 entries are
shown, the display goes back to the menu. Push BACK
the menu.
A verification history entry shows the:
• Value of the certification standard used
• Turbidity reading at verification
• Operator initials
• Date and time
A calibration history entry shows the:
• Gain value
• Operator initials
• Date and time
Notes:
• History data is saved as first in, first out. When a history log is full, the
newest entry is saved and the oldest entry in the log is deleted.
• When the instrument is received from the factory, default values or
blank spaces are shown for the history information. Those values are
replaced with real data as the history log is filled.
to go back to
Maintenance
D A N G E R
Multiple hazards. Only qualified personnel must conduct the tasks
described in this section of the document.
16 English
Page 19

Maintenance schedule
N O T I C E
The laser module and detector system are not user-servicable items. Contact
Technical Support for replacement.
Clean the instrument at least once a month. The instrument may need to
be cleaned more frequently depending on water quality.
Clean the instrument
W A R N I N G
Do not remove the bottom plate of the instrument or drain plug when
the head assembly is installed and the instrument is in operation. Risk
of exposure to Class 3B Radiation will result.
Personal injury hazard. Never remove covers from the instrument. This is a laserbased instrument and the user risks injury if exposed to the laser.
W A R N I N G
Sediment of the size that passes through with filter effluent is difficult to
see. Reading accuracy may be affected if the instrument is not cleaned
at regular intervals. Noise (fluctuation) in the reading may indicate the
need to clean the instrument.
Refer to the illustrated steps to clean the instrument.
Make sure to remove debris from internal corners and other internal
areas that are difficult to access.
Do a calibration verification after this procedure is complete if a
calibration will not be done immediately.
Required tools and materials:
•
Soft brush
• Test tube brush
• Cleaning solution (25 mL of household bleach in 3.78 L of water or
1 mL laboratory detergent (i.e., Liqui-nox) in 1L of water)
• Water that is less than 50 mNTU (0.05 NTU)
Note: Put the cleaning solution in a container that can hold all of the bubble trap.
English 17
Page 20

1 2
18 English
Page 21

3 4
English 19
Page 22

How to clean spills
C A U T I O N
Chemical exposure hazard. Dispose of chemicals and wastes in
accordance with local, regional and national regulations.
1. Obey all facility safety protocols for spill control.
2. Discard the waste according to applicable regulations.
Troubleshooting
Problem Possible cause Resolution
Low (< 1) or negative
readings
Errors
When an error occurs:
The reading on the measurement screen flashes.
•
• All outputs are held.
• The red status light on the instrument turns on.
To access the current instrument errors, select Diagnostics, [Select
Sensor], Error List.
Head assembly is not
correctly installed on the
body of the instrument
Laser failure Contact Technical Support.
PMT/Electronics failure
Correctly install the head
assembly on the body of the
instrument. If not, the red
status light will flash.
Select an error and confirm to identify the cause of the error. Refer to
Table 2.
Table 2 Error list
Error Possible cause Resolution
A/D FAILURE A/D conversion failure Contact Technical Support.
LASER FAILURE Laser did not work correctly
FLASH FAILURE Data log and event log not
LOW SIGNAL
ERROR
and is turned off
working
Signal is too low (less than
3.0 mNTU)
Make sure that the head
assembly is installed
correctly. If not, the red
status light will flash.
Contact Technical Support.
Warnings
When a warning occurs:
•
A warning icon flashes and a message is shown on the bottom of the
measurement screen.
• The red status light on the instrument starts flashing.
Warnings do not affect the operation of menus, relays and outputs.
To access the current instrument warnings, select Diagnostics, [Select
Sensor], Warning List.
Select a warning and confirm to identify the cause of the warning. Refer
to Table 3.
20 English
Page 23

Note: A warning can be used to trigger a relay. The sc controller can be used to
set warning levels to identify the severity of the warning. Refer to the sc controller
user manual.
Table 3 Warning list
Warning Definition Resolution
DARK READING Dark reading identifies
too much light (greater
than 50 mNTU).
TEMPERATURE The internal temperature
of the head assembly is
greater than 50 °C
(122 °F).
5 VOLT The monitored voltage is
outside the range 4.5–
5.5 V.
VOLTAGE IN The monitored voltage is
outside the range of
9.08–14.3 V.
LASER V The laser voltage is out
of the operating range of
4.55–5.5 V.
LASER I The laser current is out of
operating range of 25–
75 mA.
1. Make sure that the head
assembly is correctly
installed on the body of
the instrument.
2. From the Main menu,
select Sensor Setup,
[Select Sensor],
Calibrate, 0 Electronics.
Make sure that the operating
environment is within the
specifications. Refer to
Specifications on page 3.
If the operating environment
is within specifications,
contact Technical Support.
Contact Technical Support.
Table 3 Warning list (continued)
Warning Definition Resolution
DATA LOG FULL Only 30 minutes of
EVENT LOG FULL Only 30 minutes of
OUTPUT MODE
NOT NORMAL
PMT VOLTAGE The PMT voltage is out of
REFERENCE
VOLTAGE
storage space is
available in the data log.
storage space is
available in the event log.
The instrument is being
calibrated.
operating range of
11.77–15.94 V.
The reference voltage is
out of operating range of
2.41–2.59 V.
Download the log from the sc
controller to prevent loss of
data.
Complete calibration and/or
calibration verification.
Contact Technical Support.
Diagnostics and Test menu
The diagnostic and test menu shows current information about the
instrument. Refer to Table 4.
To access the diagnostic and test menu, select Sensor Setup, [Select
Sensor], Diag/Test.
Table 4 DIAG/TEST menu
Option Description
SOFTWARE VERS. Shows the installed software version.
SERIAL NUMBER Shows the serial number of the instrument.
INT TEMP Shows the internal temperature of the instrument
DEFAULT SETUP Sets the settings to the factory default settings. Makes the
POWER CHECK Shows the electrical statistics for the instrument.
electronics in °C.
current calibration invalid.
English 21
Page 24

Table 4 DIAG/TEST menu (continued)
Option Description
SERVICE MODE Enable or disable service mode—On or Off (default).
SERVICE DIAGS Passcode protected. Menu options are only available to
service personnel.
Theory of operation
The FilterTrak 660 sc nephelometer uses nephelometric detection of
light scatter from particles in a sample. The optical design is shown in
Figure 9. The geometry of the incident light source and the centerline
into the detector receive fiber is fixed at 90 degrees, which is consistent
with the detection angle associated with current nephelometry
technology.
The light source is a laser diode with a wavelength of 660-nm. The
response system is optimized to detect this specific wavelength. In
addition, the incident light is collimated into a narrow beam, resulting in a
relatively high beam power density. This high power density results in
higher scattered intensity from smaller particles. In addition, the portion
of the narrow beam that passes through the sample without being
scattered is absorbed by a light trap at the bottom of the nephelometer
body. These features combined to create a measurement system with
dramatically lower stray light.
The FilterTrak 660 sc nephelometer detection apparatus is coupled with
fiber optic technology to convey the scattered light signal to the detector.
The high power source and very sensitive detector combine to produce a
strong signal even at the lowest of turbidity levels. The optimization of
the optical components results in an increase in sensitivity of more than
two orders of magnitude over the sensitivity that is achieved with the
best turbidimeters in use today. This allows for a very stable baseline
capable of detecting a change in turbidity down to 0.05 mNTU
(1.000 NTU = 1000 mNTU). Since sensitivity is defined as the detection
of a change in turbidity, the lowest numerical value that an instrument
can read is not as significant as the smallest change that it can detect.
Figure 9 Laser nephelometer optical configuration
1 Laser module 5 Light receiver
2 Light detector 6 Water level
3 Optical fiber 7 Aperture
4 Scattered light 8 Incident light beam
RSD parameter
The FilterTrak 660 sc offers a complementary parameter to the laser
nephelometry measurement. This parameter is known as the relative
standard deviation (RSD). RSD is a dimensionless parameter that
provides a quantative assessment of the variability (fluctuation) of the
laser turbidity measurement. Studies have shown that the baseline of a
turbidity measurement will often increase in fluctuation before the actual
22 English
Page 25

laser turbidity measurement will begin to increase in response to a
particle event. In addition, the RSD parameter has been shown to be
more sensitive to a turbidity event in addition to serving as a precursor
event to a turbidity spike. The Hach Technical Information bulletin
"Introduction to Laser Nephelometry: An Alternative to Conventional
Particulate Analysis Methods", Literature piece 7044, Appendix B
provides more information on the application and use of the RSD
parameter.
The sensitivity of the RSD parameter is directly related to the instrument
design of the FT660 sc nephelometer. This is due to the optical creation
of a very small analysis volume within the turbidity sensor. (The analysis
or view volume is that volume of sample within the turbidimeter body that
is in view by the detector window.) This volume is small but well defined
by the optical design. This volume also contains a high energy density
from the incident light beam, which can easily be scattered by a single or
low number of particles. When a particle passes through the view
volume, there is a rapid increase in the scattered light signal while that
particle is in the view volume. When the particle passes out of the view
volume, the signal decreases rapidly. The change in signal is infrequent
and this instability of signal is quantified by the RSD parameter.
The RSD value is calculated as the standard deviation divided by the
mean for a given set of measurements. The result is multiplied by
100 and is expressed as a percent. Equation 1 provides the calculation
used to determine the RSD value:
RSD = (standard deviationn ÷ meann) × 100
Where n = number of measurements used
The RSD calculation is accomplished through a process of evaluating
the most recent seven displayed turbidity measurements. From the
seven measurements, the standard deviation and the average are
calculated. The value is then displayed on the secondary measurement
line of the SC controller. When a new turbidity measurement is
displayed, the value replaces the oldest of the seven measurements and
the RSD is recalculated and displayed. This is referred to as the
continuous RSD measurement and it is updated once every second.
The RSD parameter is treated as a separate and independent
monitoring parameter relative to the laser turbidity measurement. The
parameter is updated every second, which is the same rate the laser
turbidity value is updated. The parameter is best used as an early
warning parameter to an impending turbidity event and as a
complementary parameter to the turbidity parameter. (A turbidity spike
will also be complemented by a spike in the RSD parameter.) The
parameter has been designed to be very responsive to particles in the
1–10 μm range at very low concentrations. While the laser turbidity
parameter is currently approved for regulatory monitoring, the RSD
parameter is not a regulatory approved monitoring parameter.
Correlation study between kaolin standards and measured turbidity
A study was done on the FilterTrak 660 sc (FT660 sc) laser
nephelometer to identify the specific correlation between kaolin and the
NTU value recorded using the FT660 sc. Two sets of kaolin standards
were prepared for turbidity measurement. Each set was prepared from
an independent lot of kaolin stock standard that was supplied by the
manufacturer. Each test standard was prepared using ultra-filtered water
immediately before measurement.
After preparation, each standard was put in the FT660sc, starting with
the lowest value. Measurements on the standard were done at 30second intervals, and 15 to 25 measurements were recorded for each
standard. From the measurement on a specific test standard, the
respective average and standard deviation was calculated.
Table 5 shows the:
•
Averaged turbidity measurements from each of the two lots of kaolin
standard
• Pooled standard deviation from these two lots of kaolin standards
• 95% confidence interval (predicted) and the percent error expected in
the preparation for each standard value
The results show a strong correlation between mg/L kaolin and NTU.
The correlation is better than one percent over the measurement range
of the FT660 sc. The summarized correlation values for the entire study
are shown in Table 6.
Even though there was a strong correlation between the mg/L and the
NTU values when using the FT660 sc, the reproducibility of these
measurements was not good at the lowest two kaolin standards. This is
shown in Table 5, where the pooled standard deviations and predicted
English 23
Page 26

95% confidence intervals are very high. The error was primarily traced to
the lot-to-lot variability in the preparation and subsequent measurement
for each standard.
From the data collected in this study, it was identified that 1.0 mg/L
kaolin is equivalent to 1.0 NTU turbidity.
Table 5 Summary: Correlation between kaolin mg/L values and
NTU turbidity values on the FT660 sc
Standard
value
(theoretical) in
mg/L kaolin
0.10 0.098 0.0273 0.0546 55.6%
0.20 0.169 0.0594 0.1187 70.3%
0.41 0.339 0.0239 0.0479 14.1%
0.80 0.754 0.0504 0.1009 13.4%
1.01 0.999 0.0534 0.1069 10.7%
1.20 1.186 0.0414 0.0829 7.0%
1.59 1.573 0.0870 0.1740 11.1%
1.80 1.850 0.0487 0.0974 5.3%
2.10 2.065 0.0480 0.0960 4.6%
2.40 2.338 0.0466 0.0932 4.0%
Averaged
turbidity in
NTU for
kaolin lots A
and B
Pooled
standard
deviation
for kaolin
lots A and
B
Predicted
95%
confidence
range +/-NTU
from the
averaged
kaolin value
Percent
uncertainty at
95%
confidence
Table 6 Statistical summary of the correlation between mg/L kaolin
and NTU
Pooled standard
deviation for kaolin lots
A and B
Slope Correlation
coefficient
0.9932 0.9990 0.6804
Averaged % error
(over the full range)
Replacement parts and accessories
Note: Product and Article numbers may vary for some selling regions. Contact the
appropriate distributor or refer to the company website for contact information.
Replacement parts
Description Quantity Item no.
Cover, bubble trap 1 5201200
Drain plug for the FT660 sc 1 4411600
Body of the FT660 sc 1 5230300
Head assembly of the FT660 sc
Sensor cap 1 5791100
*
Only compatible with 5230300.
Accessories
Description Quantity Item no.
Aperture plate 1 6735600
Cleaning brush 1 68700
Calibration kit
(includes the calibration body, 1 L of
800 mNTU StablCal Standard and a funnel)
Deionized (demineralized) water 1 L 27256
*
1 6016100
1 5236400
24 English
Page 27

Replacement parts and accessories (continued)
Description Quantity Item no.
Detergent, Liquinox 0.946 L 2088153
Drain assembly funnel 1 5237100
Dry standard quick check verification (VQC)
kit, includes:
- Dry standard 1 6735800
- Protective case for the dry standard 1 6735400
- Disposable wipes 1 2097000
Floor stand 1 57432-00
Flow meter, 500–700 mL/minute 1 4028200
Funnel 1 5237100
Load termination box
*
Plug, sealing, conduit opening 1 5868700
100 mNTU, StablCal Certified Standard for
verification of the FT660 sc
300 mNTU, StablCal Certified Standard for
verification of the FT660 sc
500 mNTU, StablCal Certified Standard for
verification of the FT660 sc
800 mNTU, StablCal® Certified Standard for
calibration and verification of the FT660 sc
**
1000 mNTU (1.00 NTU), StablCal Certified
Standard for verification of the FT660 sc
Strain relief, Heyco 1 16664
Tubing, sample in, ¼-inch O.D., Polyethylene 0.3 m (1 ft) 4215200
Tubing, sample out, ½-inch I.D., ¾-inch O.D.,
Tygon R3603
1 6735500
1 5867000
1 L 27233-53
1 L 26979-53
1 L 26980-53
1 L 2788453
1 25897-56
0.3 m (1 ft ) 5126300
*
Required if the distance between the instrument and sc controller is greater
than 31 m (101 ft)
**
EDA approved for calibration.
English 25
Page 28

26 English
Page 29

Page 30

HACH COMPANY World Headquarters
P.O. Box 389, Loveland, CO 80539-0389 U.S.A.
Tel. (970) 669-3050
(800) 227-4224 (U.S.A. only)
Fax (970) 669-2932
orders@hach.com
www.hach.com
©
Hach Company/Hach Lange GmbH, 2011-2012. All rights reserved. Printed in Germany.
HACH LANGE GMBH
Willstätterstraße 11
D-40549 Düsseldorf, Germany
Tel. +49 (0) 2 11 52 88-320
Fax +49 (0) 2 11 52 88-210
info@hach-lange.de
www.hach-lange.de
HACH LANGE Sàrl
6, route de Compois
1222 Vésenaz
SWITZERLAND
Tel. +41 22 594 6400
Fax +41 22 594 6499
 Loading...