

Page 1

DOC022.52.90367
DR 6000
USER MANUAL
06/2013 Edition 2A
© HACH-LANGE GmbH, 2012, 2013. All rights reserved. Printed in Germany.
Page 2

Page 3

Table of contents
Section 1 Technical data ........................................................................................................................ 9
Section 2 General information............................................................................................................. 11
2.1 Safety notes...................................................................................................................................... 11
2.1.1 Warning labels ......................................................................................................................... 11
2.1.2 Safety around source lamps .................................................................................................... 12
2.1.3 RFID module (not available on all models).............................................................................. 12
2.1.4 Chemical and Biological Safety ............................................................................................... 13
2.2 Product overview .............................................................................................................................. 13
Section 3 Installation............................................................................................................................ 15
3.1 Unpacking the instrument................................................................................................................. 15
3.2 Operating environment ..................................................................................................................... 15
3.3 Front and back view.......................................................................................................................... 16
3.4 Power connections ........................................................................................................................... 17
3.5 Interfaces.......................................................................................................................................... 18
3.6 Cell compartments and universal cell adapter.................................................................................. 18
3.6.1 Cell compartments and adapter............................................................................................... 18
3.6.2 How to position the universal cell adapter ............................................................................... 19
3.7 Beam path ........................................................................................................................................ 20
Section 4 Startup .................................................................................................................................. 21
4.1 Switch on the instrument, startup process........................................................................................ 21
4.2 Language selection........................................................................................................................... 21
4.3 Self-check ......................................................................................................................................... 21
4.4 Sleep mode....................................................................................................................................... 22
4.5 Power off the instrument................................................................................................................... 22
Section 5 Standard programs.............................................................................................................. 23
5.1 Overview........................................................................................................................................... 23
5.1.1 Tips for using the touch screen................................................................................................ 23
5.1.2 Use of the alphanumeric keypad .............................................................................................23
5.1.3 Main menu ............................................................................................................................... 24
3
Page 4

Table of contents
5.2 Instrument Setup...............................................................................................................................25
5.2.1 Operator ID...............................................................................................................................25
5.2.1.1 Operator RFID tag (not available on all models) .............................................................26
5.2.2 Sample ID.................................................................................................................................27
5.2.2.1 Sample ID with scanner method 1...................................................................................28
5.2.2.2 Sample ID with scanner method 2...................................................................................28
5.2.2.3 Import external sample ID ...............................................................................................29
5.2.3 Sample ID and operator ID with the optional RFID Sample ID Kit (not available on all models) .
29
5.2.4 Security settings.......................................................................................................................29
5.2.4.1 Assign operator security level..........................................................................................31
5.2.4.2 Deactivate password .......................................................................................................32
5.2.5 Date and time...........................................................................................................................33
5.2.6 Sound settings..........................................................................................................................34
5.2.7 PC and printer ..........................................................................................................................35
5.2.7.1 Printer setup ....................................................................................................................36
5.2.7.2 Print data .........................................................................................................................37
5.2.7.3 Print data continuously ....................................................................................................37
5.2.7.4 Network setup..................................................................................................................37
5.2.8 Power Management .................................................................................................................41
5.2.9 Lamp control.............................................................................................................................41
5.3 Save, recall, send and delete data....................................................................................................42
5.3.1 The data log .............................................................................................................................42
5.3.1.1 Auto/manual data storage ...............................................................................................42
5.3.1.2 Recall stored data from the data log................................................................................43
5.3.1.3 Send data from the data log ............................................................................................44
5.3.1.4 Delete stored data from the data log...............................................................................45
5.3.2 Control charts for data from the AQA Log................................................................................46
5.3.3 Store, recall, send and delete data from wavelength scan and time course............................47
5.3.3.1 Data storage from wavelength scan or time course ........................................................48
5.3.3.2 Recall stored data from wavelength scan or time course................................................48
5.3.3.3 Send data from wavelength scan or time course ............................................................49
5.3.3.4 Delete stored data from wavelength scan or time course ...............................................50
5.3.4 Data analysis............................................................................................................................50
5.3.4.1 Trends .............................................................................................................................51
5.3.4.2 Ratios ..............................................................................................................................52
5.3.4.3 Interference Check (not available on all models) ............................................................55
4
Page 5

Table of contents
5.4 Stored Programs............................................................................................................................... 56
5.4.1 Select a saved test/method; entering user-specific basic data................................................ 56
5.4.2 Stored programs options.......................................................................................................... 56
5.4.3 Use of program timers ............................................................................................................. 58
5.4.4 Set the dilution factor ............................................................................................................... 58
5.4.5 Run a standard adjust.............................................................................................................. 59
5.4.6 Set the chemical form .............................................................................................................. 59
5.4.6.1 Change of the default setting of the chemical form......................................................... 60
5.4.7 Run a reagent blank................................................................................................................. 60
5.4.8 To carry out a multiple determination....................................................................................... 61
5.4.9 Selection of Reading Mode...................................................................................................... 61
5.4.10 Standard Addition - monitoring/checking results.................................................................... 62
5.4.10.1 Complete a standard addition....................................................................................... 63
5.4.11 Analysis of samples ............................................................................................................... 66
5.4.12 Update/Program tests............................................................................................................ 66
5.4.12.1 General advice for program update and edit ................................................................ 66
5.4.12.2 Manual update of test data ........................................................................................... 66
5.4.12.3 Program a new test....................................................................................................... 67
5.4.13 Add stored programs to the favorite programs list................................................................. 67
5.5 Barcode Programs............................................................................................................................ 69
5.5.1 Perform a barcode test ............................................................................................................ 69
5.5.2 Select the chemical evaluation form ........................................................................................70
5.5.2.1 Change of the default setting of the chemical form......................................................... 70
5.5.3 Basic test-specific and sample-specific data settings.............................................................. 70
5.5.4 Sample blank ........................................................................................................................... 72
5.5.5 Update/edit barcode tests........................................................................................................ 73
5.5.5.1 Update barcode tests with test packaging (not available on all models) ........................ 73
5.5.5.2 Manual update of a barcode test .................................................................................... 73
5.5.5.3 Manual check/revision of test data.................................................................................. 76
5.5.5.4 Update via the Internet.................................................................................................... 76
5.5.5.5 Program a new test......................................................................................................... 77
5
Page 6

Table of contents
Section 6 Expanded programs.............................................................................................................79
6.1 User programs...................................................................................................................................79
6.1.1 Program a user method............................................................................................................80
6.1.1.1 Single wavelength settings..............................................................................................81
6.1.1.2 Multi wavelength settings ................................................................................................82
6.1.1.3 Calibration settings for single and Multi Wavelength mode.............................................84
6.1.1.4 Store a user program.......................................................................................................87
6.1.1.5 Additional user-defined parameters and functions..........................................................87
6.1.2 "Free programming" program type ...........................................................................................88
6.1.2.1 Measurement process.....................................................................................................90
6.1.2.2 Enter a new measurement process.................................................................................90
6.1.2.3 Enter the calibration formula (evaluation formula)...........................................................92
6.1.2.4 Enter an amount during a measurement.........................................................................95
6.1.2.5 Enter variables.................................................................................................................97
6.1.2.6 Save a free programming user program..........................................................................97
6.1.3 Select a user program..............................................................................................................97
6.1.4 Add, edit and delete user programs from the favorites list.......................................................97
6.1.4.1 Add to Favorites ..............................................................................................................98
6.1.4.2 Edit ..................................................................................................................................98
6.1.4.3 Delete program................................................................................................................99
6.2 Favorites ...........................................................................................................................................99
6.2.1 Recall a favorite program .........................................................................................................99
6.2.2 Delete a favorite program.........................................................................................................99
6.3 Single Wavelength (absorbance, concentration and transmittance readings)................................100
6.3.1 Set up Single Wavelength mode............................................................................................100
6.3.2 Take single wavelength readings (single reading) .................................................................102
6.4 Multi Wavelength mode – readings with more than one wavelength..............................................102
6.4.1 Set reading mode at different wavelengths............................................................................102
6.4.2 Complete a reading in the Multi Wavelength mode................................................................105
6.5 Wavelength Scan mode – recording of absorbance and transmission spectrums..........................105
6.5.1 Set up the wavelength scan ...................................................................................................106
6.5.2 Perform a wavelength scan....................................................................................................108
6.5.2.1 Navigation of the wavelength scan graph or a wavelength scan analysis.....................109
6.5.3 Work with reference scans.....................................................................................................110
6.6 Time course of absorbance/transmittance ......................................................................................112
6.6.1 Time course setup parameters...............................................................................................112
6.6.2 Time course scan reading......................................................................................................114
6.6.3 Analysis of time course data ..................................................................................................114
6.6.3.1 Navigation of a time scan or a time scan analysis.........................................................114
6
Page 7

Table of contents
6.7 System Checks............................................................................................................................... 115
6.7.1 Instrument Information........................................................................................................... 116
6.7.2 Update the instrument software.............................................................................................116
6.7.3 Optical Checks....................................................................................................................... 116
6.7.3.1 Verification kit................................................................................................................ 117
6.7.3.2 Test solution.................................................................................................................. 118
6.7.3.3 Wavelength check.........................................................................................................120
6.7.3.4 Stray Light Check.......................................................................................................... 120
6.7.3.5 Absorbance Check........................................................................................................ 121
6.7.3.6 Noise Check.................................................................................................................. 122
6.7.3.7 Drift Check .................................................................................................................... 122
6.7.4 AQA - Analytical Quality Assurance....................................................................................... 123
6.7.4.1 AQA Standard configuration ......................................................................................... 123
6.7.4.2 AQA Addition ................................................................................................................ 125
6.7.4.3 Multiple Determination .................................................................................................. 126
6.7.4.4 Dilution .......................................................................................................................... 126
6.7.4.5 Performing AQA measurement..................................................................................... 126
6.7.4.6 Pipette check ................................................................................................................ 127
6.7.5 Instrument backup ................................................................................................................. 128
6.7.6 Service menu......................................................................................................................... 129
6.7.7 Service time ........................................................................................................................... 130
6.7.8 Lamps operating time ............................................................................................................ 130
6.8 Toolbar............................................................................................................................................ 131
6.8.1 Log on.................................................................................................................................... 131
6.8.2 Sample ID .............................................................................................................................. 131
6.8.3 Timer...................................................................................................................................... 131
6.8.4 AQA ....................................................................................................................................... 132
6.8.5 Trends.................................................................................................................................... 132
6.8.6 Carousel insert....................................................................................................................... 132
6.8.7 LINK2sc ................................................................................................................................. 132
6.8.8 DR 6000 website.................................................................................................................... 133
Section 7 Maintenance .......................................................................................................................135
7.1 Cleaning requirements.................................................................................................................... 135
7.1.1 Spectrophotometer ................................................................................................................ 135
7.1.2 Display ................................................................................................................................... 135
7.1.3 Cuvettes/cells......................................................................................................................... 136
7.2 Lamp replacement .......................................................................................................................... 136
7.2.1 Open the lamp compartment ................................................................................................. 136
7.2.2 Change halogen lamp............................................................................................................ 137
7.2.3 Change deuterium lamp (UV) ................................................................................................ 138
7.3 Maintain and replace filter pad........................................................................................................ 139
7.4 Replace fuses ................................................................................................................................. 140
7
Page 8

Table of contents
Section 8 Troubleshooting .................................................................................................................141
Section 9 Replacement parts .............................................................................................................145
9.1 Accessories.....................................................................................................................................145
9.2 Replacement parts ..........................................................................................................................146
Section 10 Contact .............................................................................................................................147
Section 11 Warranty, liability and complaints...................................................................................149
Appendix A Help Guide ......................................................................................................................151
A.1 Display of the Help Guide for stored programs..............................................................................151
A.2 Display of the Help Guide for barcode programs...........................................................................152
Index.....................................................................................................................................................155
8
Page 9
Section 1 Technical data
Changes reserved!
Performance specifications
Operating mode Transmittance (%), Absorbance and Concentration
Source lamp Deuterium lamp (UV) and halogen lamp (visual range)
Wavelength range 190–1100 nm
Wavelength Accuracy ± 1 nm (wavelength range 200–900 nm)
Wavelength reproducibility < 0.1 nm
Wavelength resolution 0.1 nm
Wavelength calibration Automatic
Wavelength selection Automatic, based on method selection
Scanning speed 900 nm/min (in 1-nm steps)
Spectral bandwidth 2 nm (1.5–2.9 nm at 656 nm, 1 nm for D2 line)
Photometric measuring range ± 3 Abs (wavelength range 200–900 nm)
Photometric accuracy
Photometric linearity
Stray light
Photometric drift against blank
reading
(30-min baseline stable)
Long-term stability Zero point at 546 nm for 10 hours ≤ 0.0034 Abs
Data log
User programs 200
5 mAbs at 0.0–0.5 Abs
< 1 % at 0.50–2.0 Abs at 546 nm
< 0.5 % to 2 Abs
≤ 1 % at > 2 Abs with neutral glass at 546 nm
KI solution at 220 nm
< 3.3 Abs / < 0.05 %
190–199 nm +/- 0.0100 Abs
200–349 nm +/- 0.0054 Abs
350–899 nm +/- 0.0034 Abs
900–1100 nm +/- 0.0100 Abs
5000 measurement values (result, date, time, sample ID, user ID)
50 scans, 50 time scans
Physical and environmental specifications
Width 500 mm (19.69 in)
Height 215 mm (8.46 in)
Depth 460 mm (18.11 in)
Weight 11 kg (24.25 lb)
Ambient operating requirements
Ambient storage requirements
Additional technical data
Power connection 100–240 V/50–60 Hz
Power consumption 150 VA
Fuse T 2A H; 250 V (2 units)
10–40 °C (50–104 °F), maximum 80 % relative humidity
(without condensate formation)
–25–60 °C (–13–140 °F), maximum 80 % relative humidity
(without condensate formation)
9
Page 10

Technical data
Performance specifications
Use only shielded cable with maximum length of 3 m:
2× USB type A
Interfaces
Housing rating IP20 with closed cell compartment cover
Protection class Class I
1× USB type B
Use only shielded cable (for example STP, FTP, S/FTP)
with maximum length of 20 m:
1× Ethernet
10
Page 11
Section 2 General information
2.1 Safety notes
Read the entire user manual carefully before you unpack, set up
or operate the device. Observe all danger and warning notes.
Non-observance could lead to serious injury of the operator or to
damage to the device.
To make sure that the protection provided by this instrument is
not impaired, do not use or install this instrument in any manner
other than that specified in these operating instructions.
Indicates a potentially or imminently hazardous situation that, if not
avoided, results in death or serious injury.
Indicates a potentially or imminently hazardous situation that, if not
avoided, may result in death or serious injury.
Indicates a potentially hazardous situation that may result in minor or
moderate injury.
DANGER
WARNING
CAUTION
2.1.1 Warning labels
This symbol may be attached to the device and references the operation- and/or safety notes in the user manual.
This symbol on the device is an indication of hot surfaces.
Electrical equipment marked with this symbol may as of August 12, 2005 Europe-wide no longer be disposed of in
unsorted house or industrial waste. According to valid provisions (EU Directive 2002/96/EC), from this point
consumers in the EU must return old electrical devices to the manufacturer for disposal. This is free for the
consumer.
Note: Contact the manufacturer or supplier to find out how you can return worn out devices, electrical accessories
supplied by the manufacturer and all auxiliary articles for correct disposal or recycling.
NOTICE
Indicates a situation that, if not avoided, could result in damage to the
device. Information that particularly should be emphasized.
Note: Information that supplements aspects from the main text.
Observe all marks and labels that are attached to the device.
Non-observance may result in personal injury or damage to the
device. For symbols attached to the device, corresponding
warning notes are found in the user manual.
11
Page 12
General information
2.1.2 Safety around source lamps
WARNING
The manufacturer is not responsible for any damages due to
misapplication or misuse of this product including, without limitation,
direct, incidental and consequential damages, and disclaims such
damages to the full extentpermitted under applicable law.
The user is solely responsible to identify critical application risks and
install appropriate mechanisms to protect processes during a possible
equipment malfunction.
The source lamps are operated at high temperatures.
To avoid the risk of electrocution, make sure the instrument is
disconnected from the power source before changing the lamps.
CAUTION
Health hazard caused by ozone.
Hazardous levels of ozone can be generated when the UV lamp is not
cooled.
Health hazard caused by UV light.
UV-Licht can cause eye and skin damage. Protect eyes and skin from
direct exposure to UV light.
Do not look directly at an energized lamp without UV safety glasses.
Burn hazard, allow the lamp(s) to cool down for at least 30 minutes
before they are serviced/replaced.
2.1.3 RFID module (not available on all models)
RFID technology is a radio application. Radio applications are
subject to national conditions of authorization. The use of the
DR 6000 (model with RFID module) is currently permitted in the
following countries: EU, CH, NO, HR, RS, MK, TR, CY, US, CA,
AU, NZ. We point out that the use of the DR 6000 (model with
RFID module) outside of the named regions may contravene
national law. The manufacturer reserves the right also to obtain
authorization in other countries. For questions about use in your
area, please contact your distributor.
The DR 6000 contains an RFID module for the reception and
transmission of information and data. The RFID module operates
with a frequency of 13.56 MHz.
WARNING
CAUTION
12
WARNING
The spectrophotometer may not be used in dangerous environments.
The manufacturer and its suppliers reject any express or indirect
guarantee for use with high-risk activities.
Page 13
General information
Follow the following safety information, in addition to any local
guidelines in force.
Safety information for the correct use of the instrument:
• Do not operate the instrument in hospitals or comparable
establishments in the vicinity of medical equipment, such as
pace makers or hearing aids.
• Do not operate the instrument near highly flammable
substances, such as fuels, highly combustible chemicals and
explosives.
• Do not operate the device near combustible gases, vapors or
dust.
• Do not vibrate or jolt the instrument.
• The instrument can cause interference in immediate
proximity to televisions, radios and computers.
• Do not open the instrument.
• Guarantee is voided if the instrument is not used in
accordance with the guidelines present in this document.
2.1.4 Chemical and Biological Safety
2.2 Product overview
DANGER
Potential danger with contact with chemical/biological substances.
Working with chemical samples, standards and reagents can be
dangerous.
Make yourself familiar with the necessary safety procedures and the
correct handling of the chemicals before use and read and follow all
relevant safety data sheets.
Normal operation of this device may require the use of chemicals
or samples that are biologically unsafe.
• Observe all cautionary information printed on the original
solution containers and safety data sheets prior to their use.
• Dispose of all consumed solutions in accordance with the
local and national regulations and laws.
• Select the type of protective equipment suitable to the
concentration and quantity of the dangerous material being
used.
The DR 6000 is a UV-VIS-spectrophotometer with a wavelength
range of 190 to 1100 nm. The visible spectrum (320 to 1100 nm)
is covered by a halogen lamp and a deuterium lamp produces the
light in the ultraviolet spectrum (190 to 360 nm).
The instrument is supplied with a complete range of application
programs and supports several languages.
The DR 6000 spectrophotometer contains the following programs
and operating modes:
• Stored programs (pre-installed tests)
13
Page 14

General information
• Barcode Programs
• User Programs
• Favorites
• Single Wavelength
• Multi Wavelength
• Wavelength Scan
• Time course
The DR 6000 spectrophotometer provides digital readouts of
concentration, absorbance and percent transmittance.
When selecting a user-generated or programmed method, the
menus and prompts serve to direct the user through the test.
This menu system can also produce reports, statistical
evaluations of generated calibration curves and reports on
instrument diagnostic checks.
14
Page 15

Section 3 Installation
3.1 Unpacking the instrument
WARNING
Electrical dangers and fire hazard.
Only use the supplied power cable.
Only qualified experts may perform the tasks described in this section
of the manual, while adhering to all locally valid safety regulations.
WARNING
Removable power cables must not be replaced with inadequately
dimensioned power cables.
The DR 6000 spectrophotometer package is supplied with the
following items:
• DR 6000 spectrophotometer
• Dust cover
• USB dust cover, fitted as standard
3.2 Operating environment
• Power cord for EU
• Universal cell adapter
• Operator RFID tag (not available on all models)
• Basic DR 6000 user manual, LINK2SC user manual
Further information, detailed user manuals and documentation
are available on the website of the manufacturer.
Note: If any of these items are missing or damaged, please contact the
manufacturer or a sales representative immediately.
Observe the following points so that the device functions
faultlessly and thus has a long service life.
• Place the device securely on an even surface. Push no
objects under the device.
• Position the device so that the power cord is not impaired.
• The ambient temperature must be 10–40 °C (50–104 °F).
NOTICE
Protect the instrument from extreme temperatures from heaters,
direct sunlight and other heat sources.
• The relative humidity should be less than 80 %; moisture
should not condense on the instrument.
• Leave at least a 15 cm clearance at the top and on all sides
for air circulation to avoid overheating of electrical parts.
15
Page 16
Installation
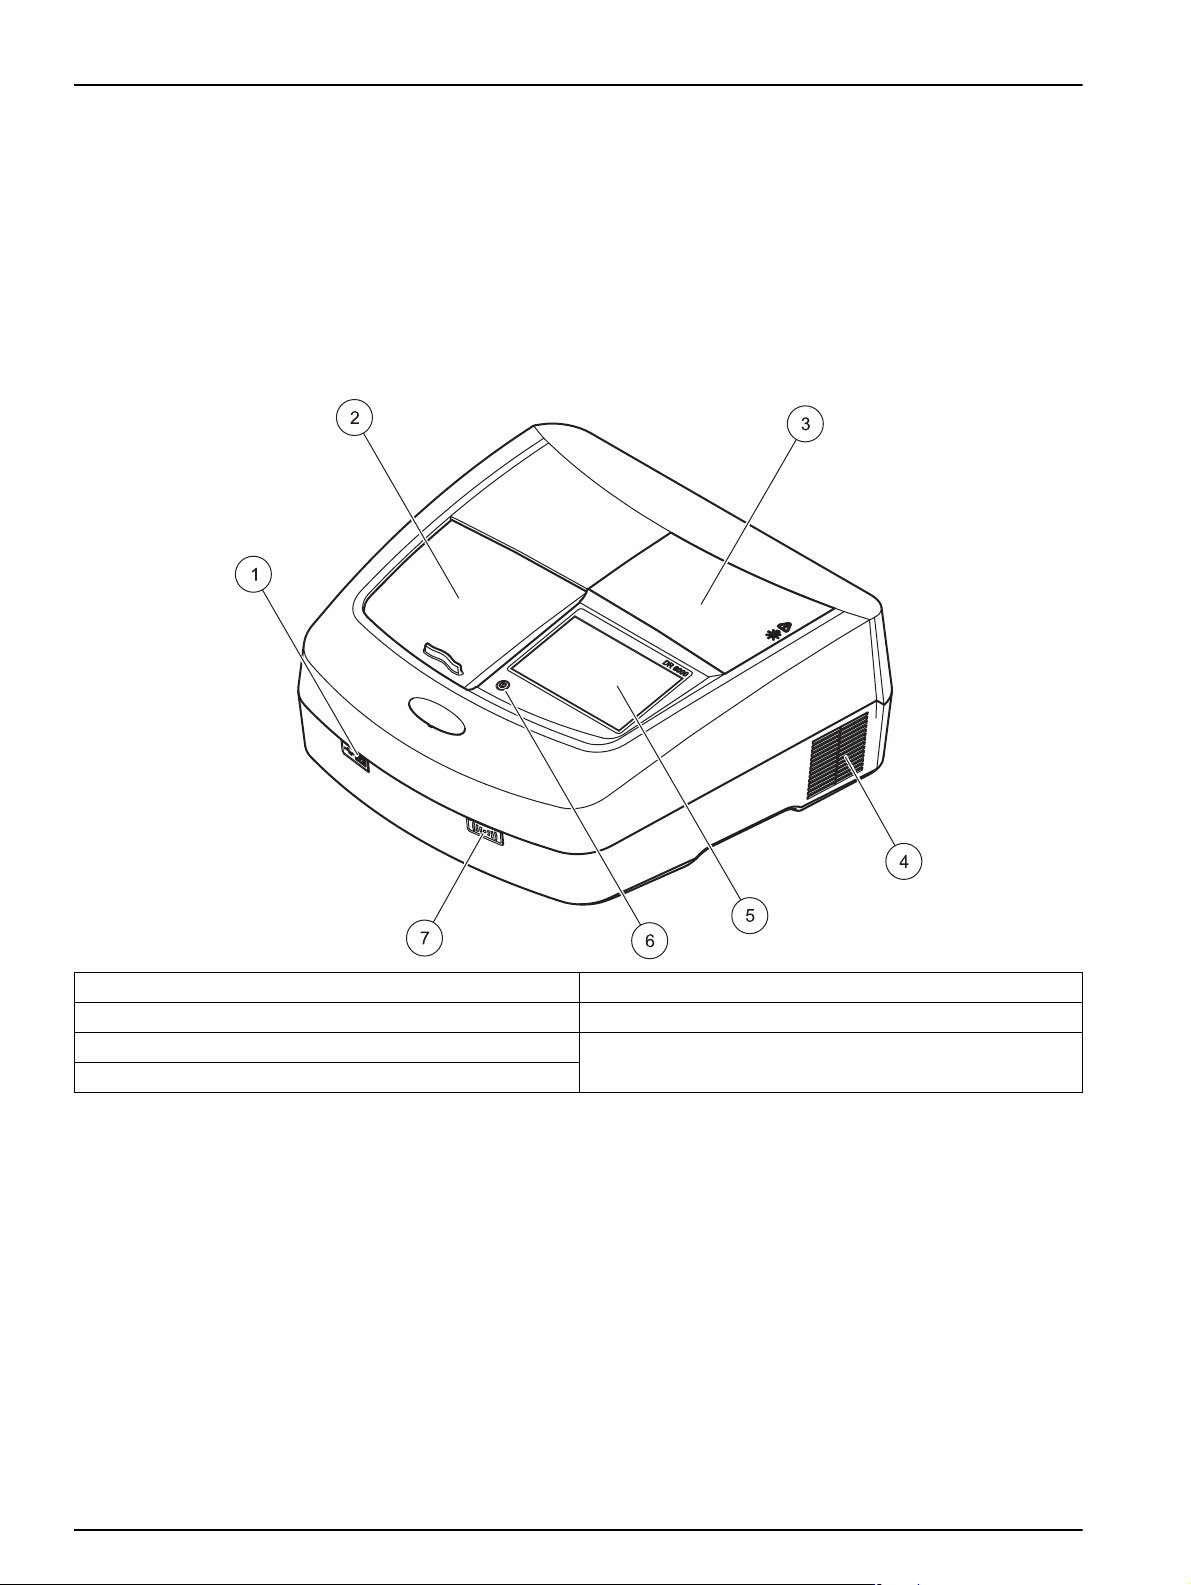
3.3 Front and back view
Figure 1 Front view
• Do not use or store the device in extremely dusty, humid or
wet places.
• Keep the surface of the instrument, the cell compartment and
all accessories clean and dry at all times. Immediately
remove splashes or spilt materials on or in the instrument
(refer to Section 7).
1 USB port type A 5 Touch screen
2 Cell compartment cover 6 Power save key
3 Lamp compartment cover 7 RFID module (not available on all models)
4 Fan outlet
16
Page 17
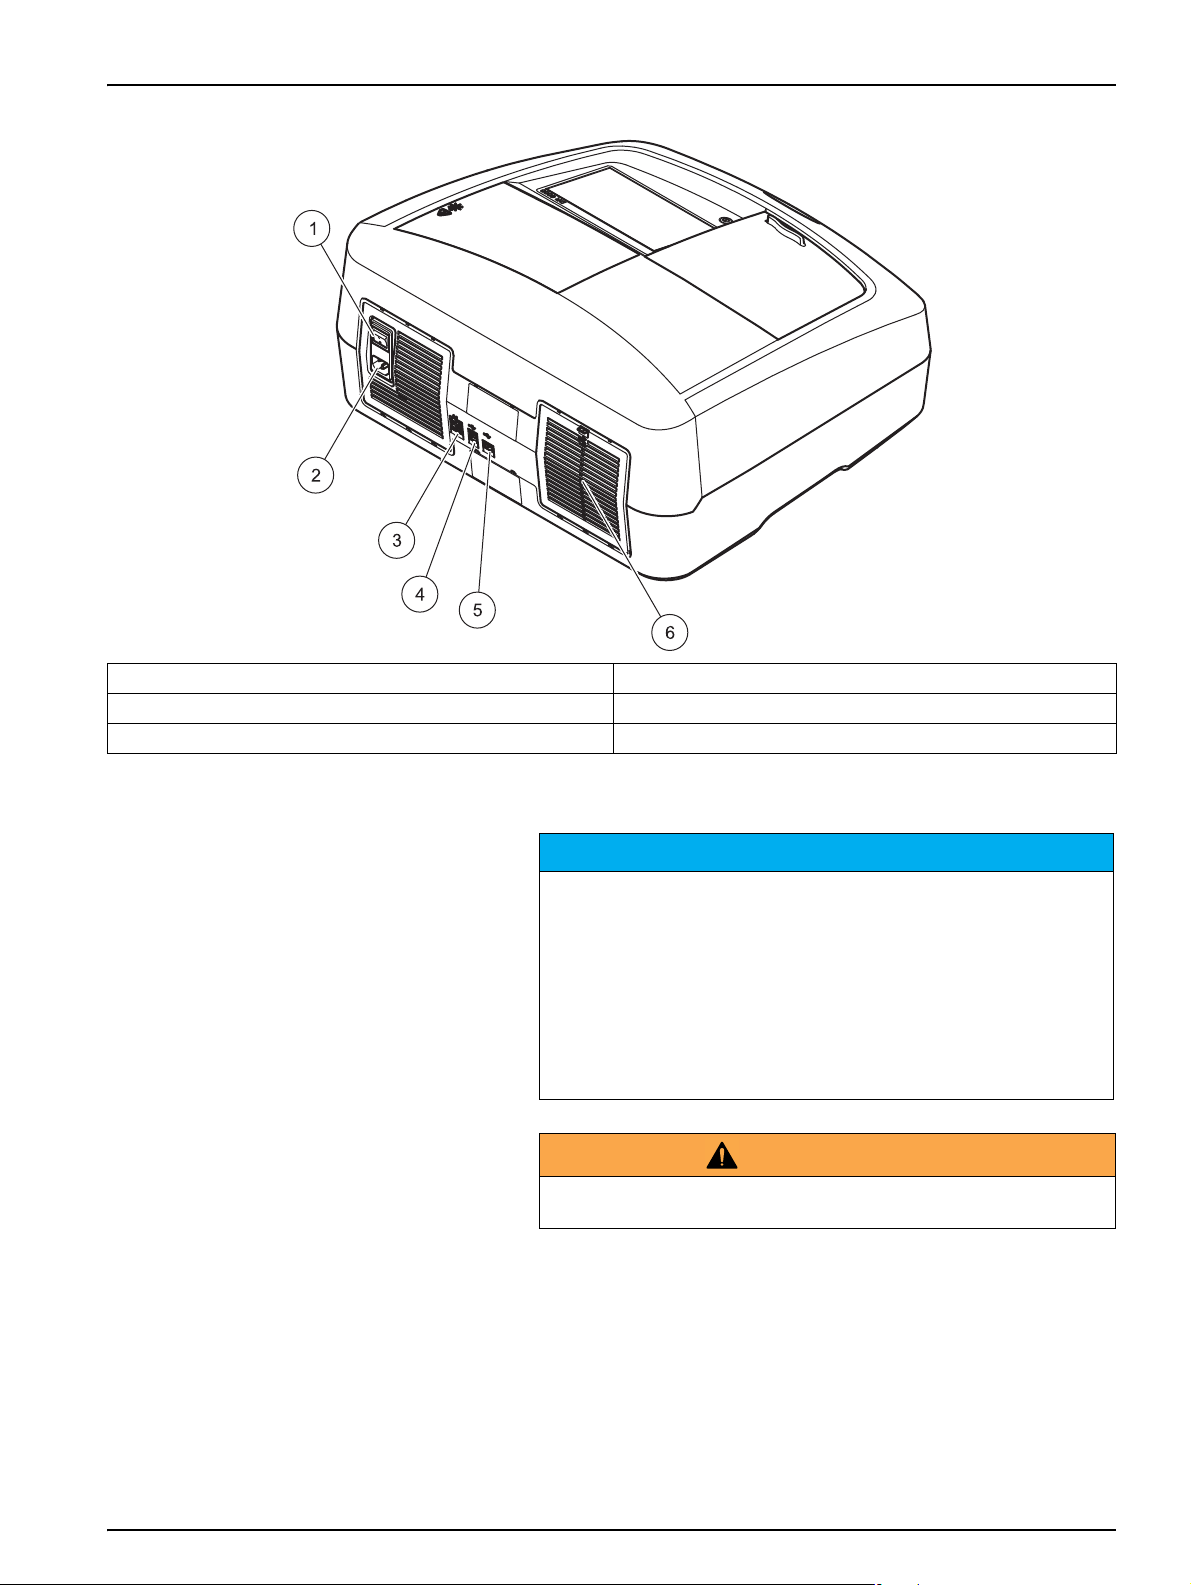
Figure 2 Back view
Installation
1 On/off switch 4 USB port type B
2 Socket for power cable 5 USB port type A
3 Ethernet port 6 Filter pad cover
3.4 Power connections
NOTICE
Use only a grounded socket for the connection of this device to the
power supply. If you are not sure if the sockets are grounded, have
this checked by a qualified electrician. The power plug serves in
addition to the power supply to isolate the device quickly from the
power source where necessary. During the disconnection from the
power source it must be made sure that the correct power plug is
pulled (for example by labeling the sockets). This is recommended for
long-term storage and can prevent potential dangers in the event of a
fault. Therefore make sure that the socket to which the device is
connected is easy to reach by each user at all times.
WARNING
Electrical dangers and fire hazard.
Only use the supplied power cable.
1. Plug the power cable into the back of the instrument
(Figure 2, Page 17).
2. Insert the plug of the power cable into a grounded mains
socket (100–240 V~ / 50–60 Hz).
3. Switch the power button to "On" to turn on the instrument
(Figure 2, Page 17).
17
Page 18

Installation
3.5 Interfaces
The DR 6000 features three USB ports and one Ethernet port as
standard, located on the front and back of the instrument
(Figure 1 and Figure 2, Page 17).
The USB type A ports are used for communications with a printer,
USB memory stick or keyboard. A USB memory stick can be
used to update the instrument software.
The USB type B port is used for communications with a PC. The
optional Hach Data Trans software (refer to Section 9, Page 145)
must be installed on the PC for data transfer.
A USB hub may be used to connect several accessories at a
time.
Note: USB cables must not be longer than 3m. Use USB cables with
ferrite shielding.
These interfaces provide the output of data and graphics to
printers and PCs and the updating of the device software (refer to
section 6.7.2, page 116). The Ethernet port supports real-time
data transfer in local networks, LIMS systems and SC controllers.
Only use a shielded cable (for example STP, FTP, S/FTP) with a
maximum length of 20 m for the Ethernet port.
3.6 Cell compartments and universal cell adapter
3.6.1 Cell compartments and adapter
The DR 6000 has two cell compartments (Figure 3). Only one cell
type at a time can be used for a reading.
Cell compartment (1) for:
• 13 mm round cells
Note: Cell compartment (1) contains a barcode detector for cells.
Cell compartment (2) for:
The following cell types can be inserted into the cell compartment
(2) via the universal cell adapter.
• 10 mm square cells
• 20 mm square cells
• 30 mm square cells
• 50 mm square cells
• 1 inch square cells
• 1 inch round cells
18
• 1 inch Pour-Thru cells
• AccuVac
®
vials
Page 19
Installation
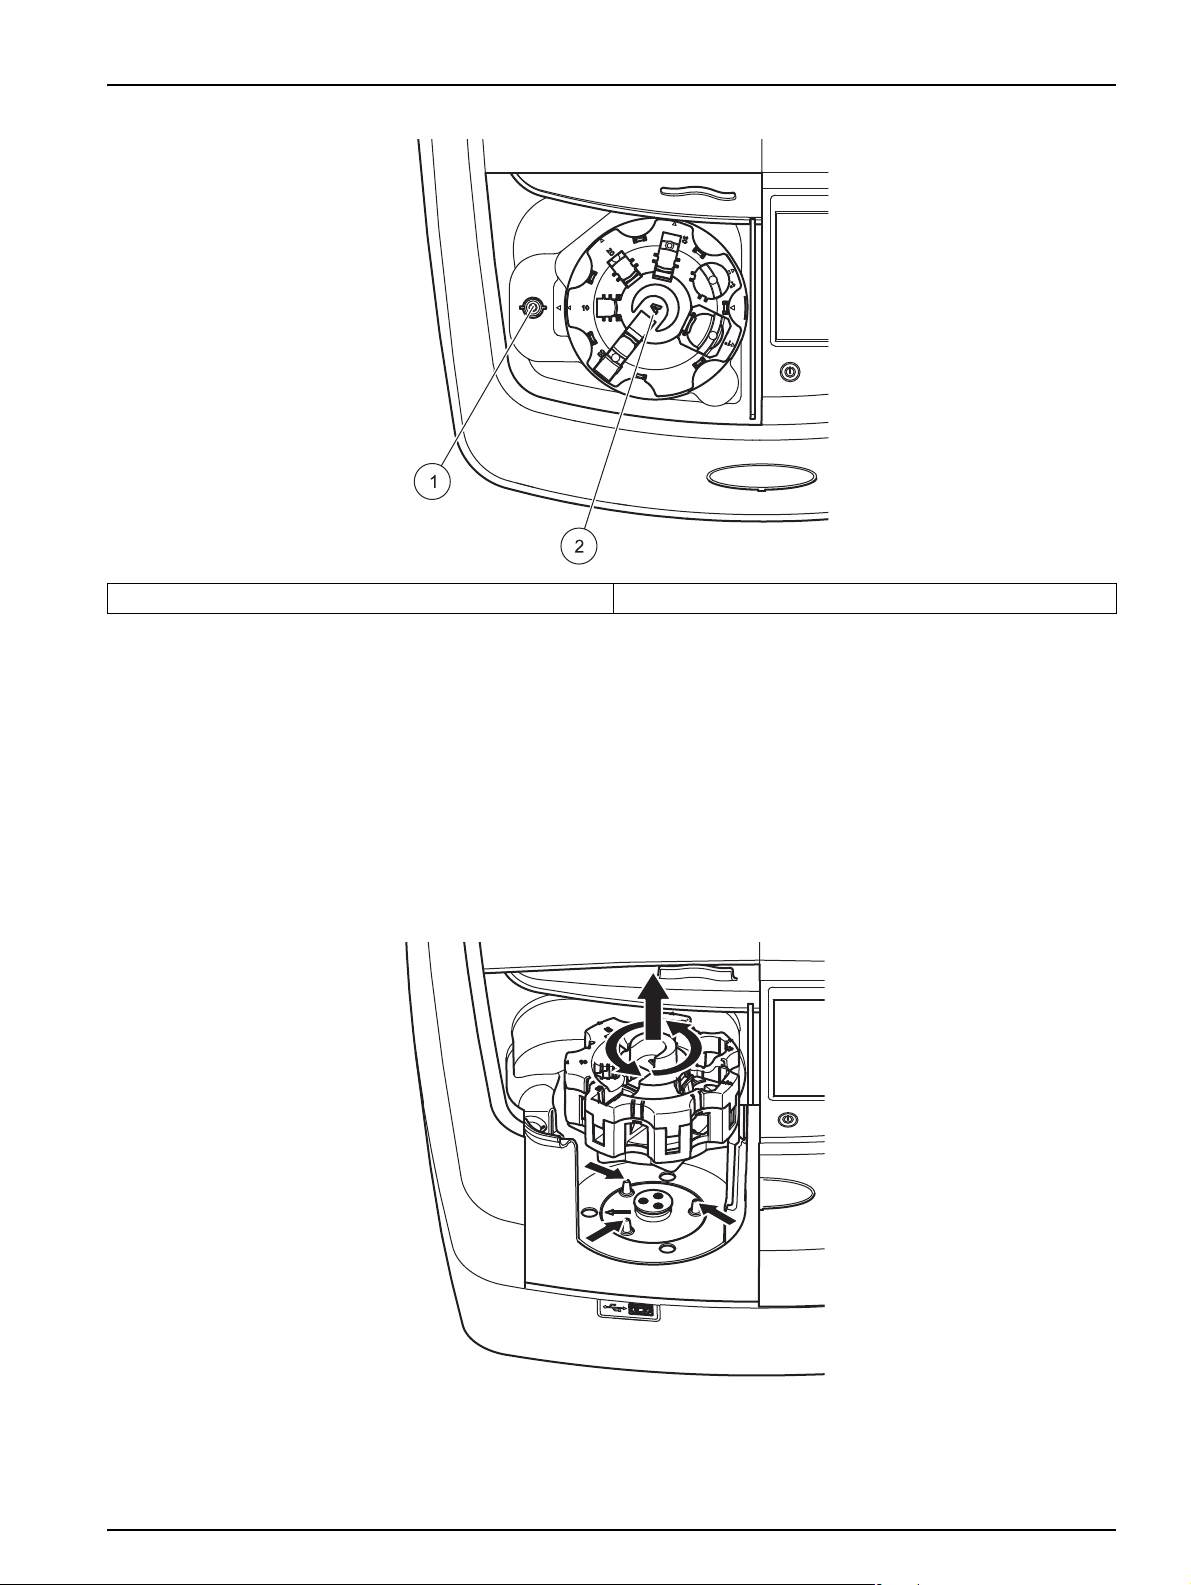
Figure 3 Cell compartments
1 Cell compartment for round cells (1) 2 Cell compartment with universal cell adapter (2)
3.6.2 How to position the universal cell adapter
1. Open the cell compartment.
2. Raise the universal cell adapter by approx. 1 cm.
3. Rotate the universal cell adapter such that the guide of the
required cell profile faces left toward the cell compartment
(1).
4. Press the universal cell adapter down until it snaps into
place.
Figure 4 How to position the universal cell adapter
19
Page 20
Installation
3.7 Beam path
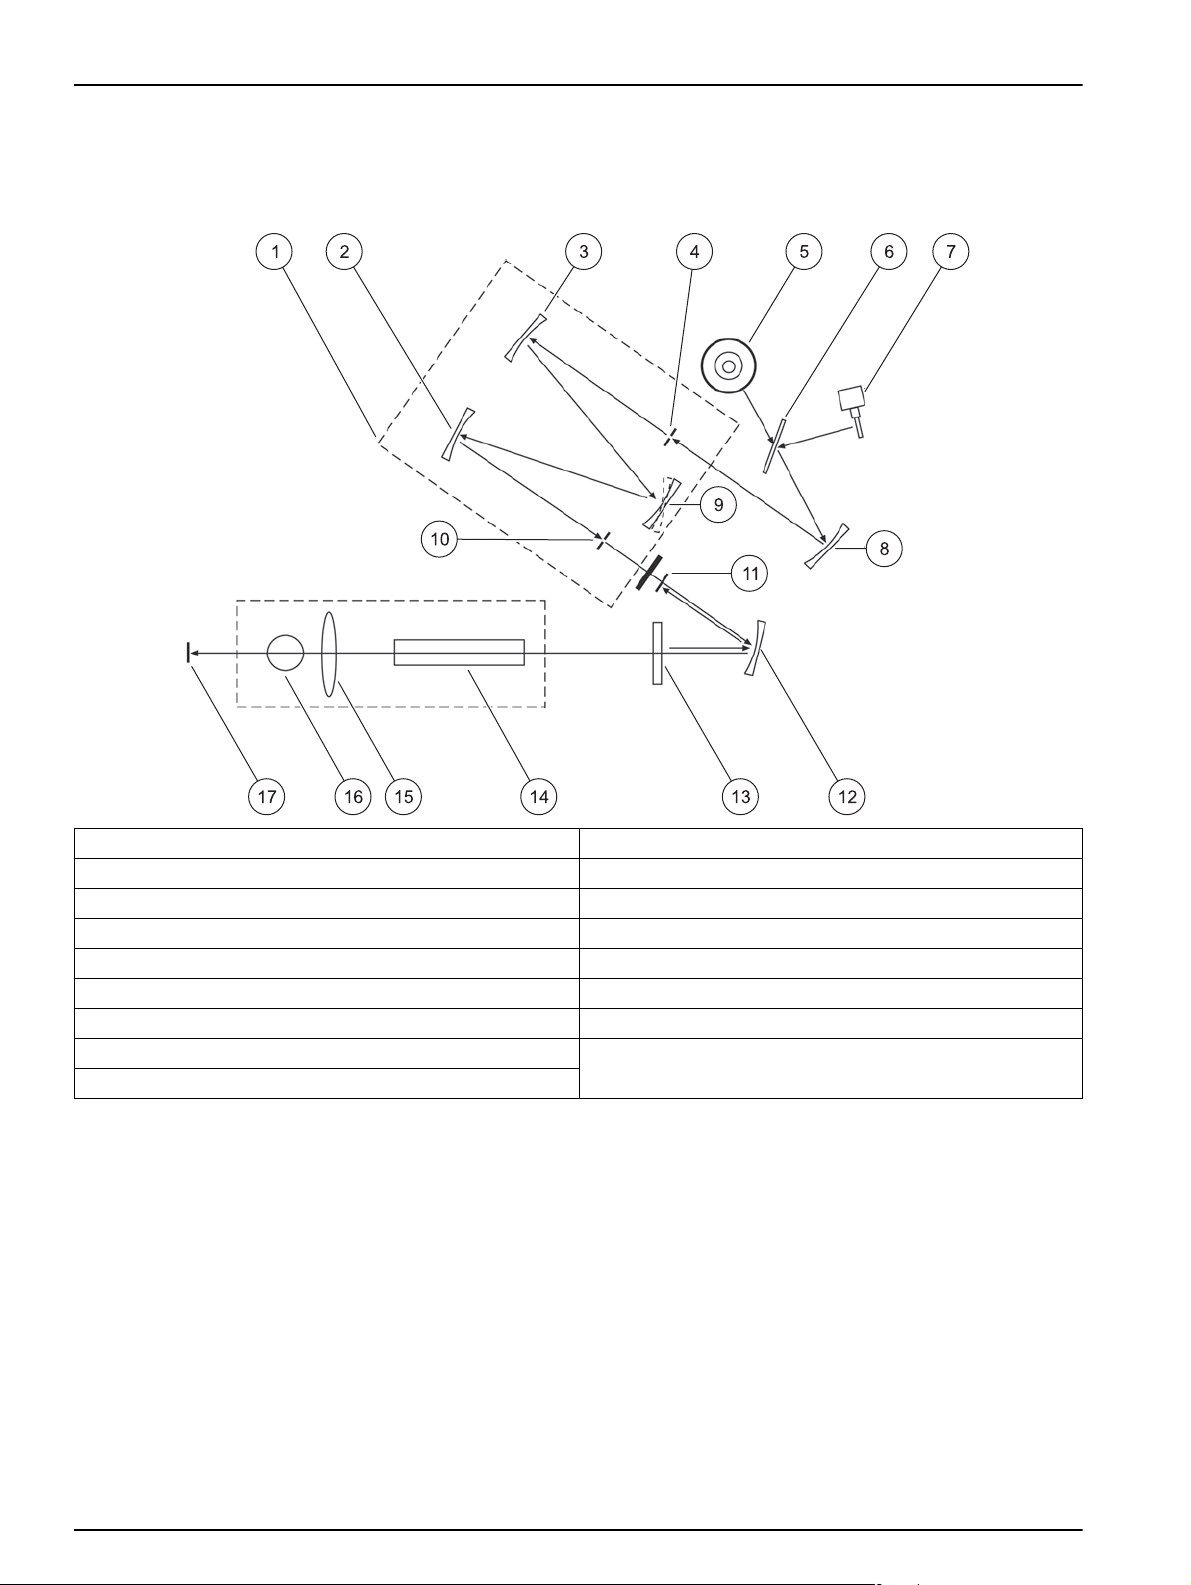
Figure 5 Beam path
Figure 5 shows the beam path of the DR 6000.
1 Monochromator 10 Exit slit
2 Mirror 11 Lens reference element
3 Mirror 12 Mirror
4 Entrance slit 13 Splitter mirror
5 Deuterium lamp 14 Cell compartment (2) for universal cell adapter
6 Lamp selection mirror 15 Lens
7 Halogen lamp 16 Cell compartment (1) for round cells
8 Mirror 17 Reading element
9 Grating
20
Page 21
Section 4 Startup
4.1 Switch on the instrument, startup process
1. Connect the power cable to a power socket.
2. Switch on the instrument via the power switch on the back.
3. The device automatically starts an approximately 45 second
long startup process. The display shows the logo of the
manufacturer. At the end of the startup process, a startup
melody is heard.
Note: Wait approximately 20 seconds before switching on again so as
not to damage the electronics and mechanics of the instrument.
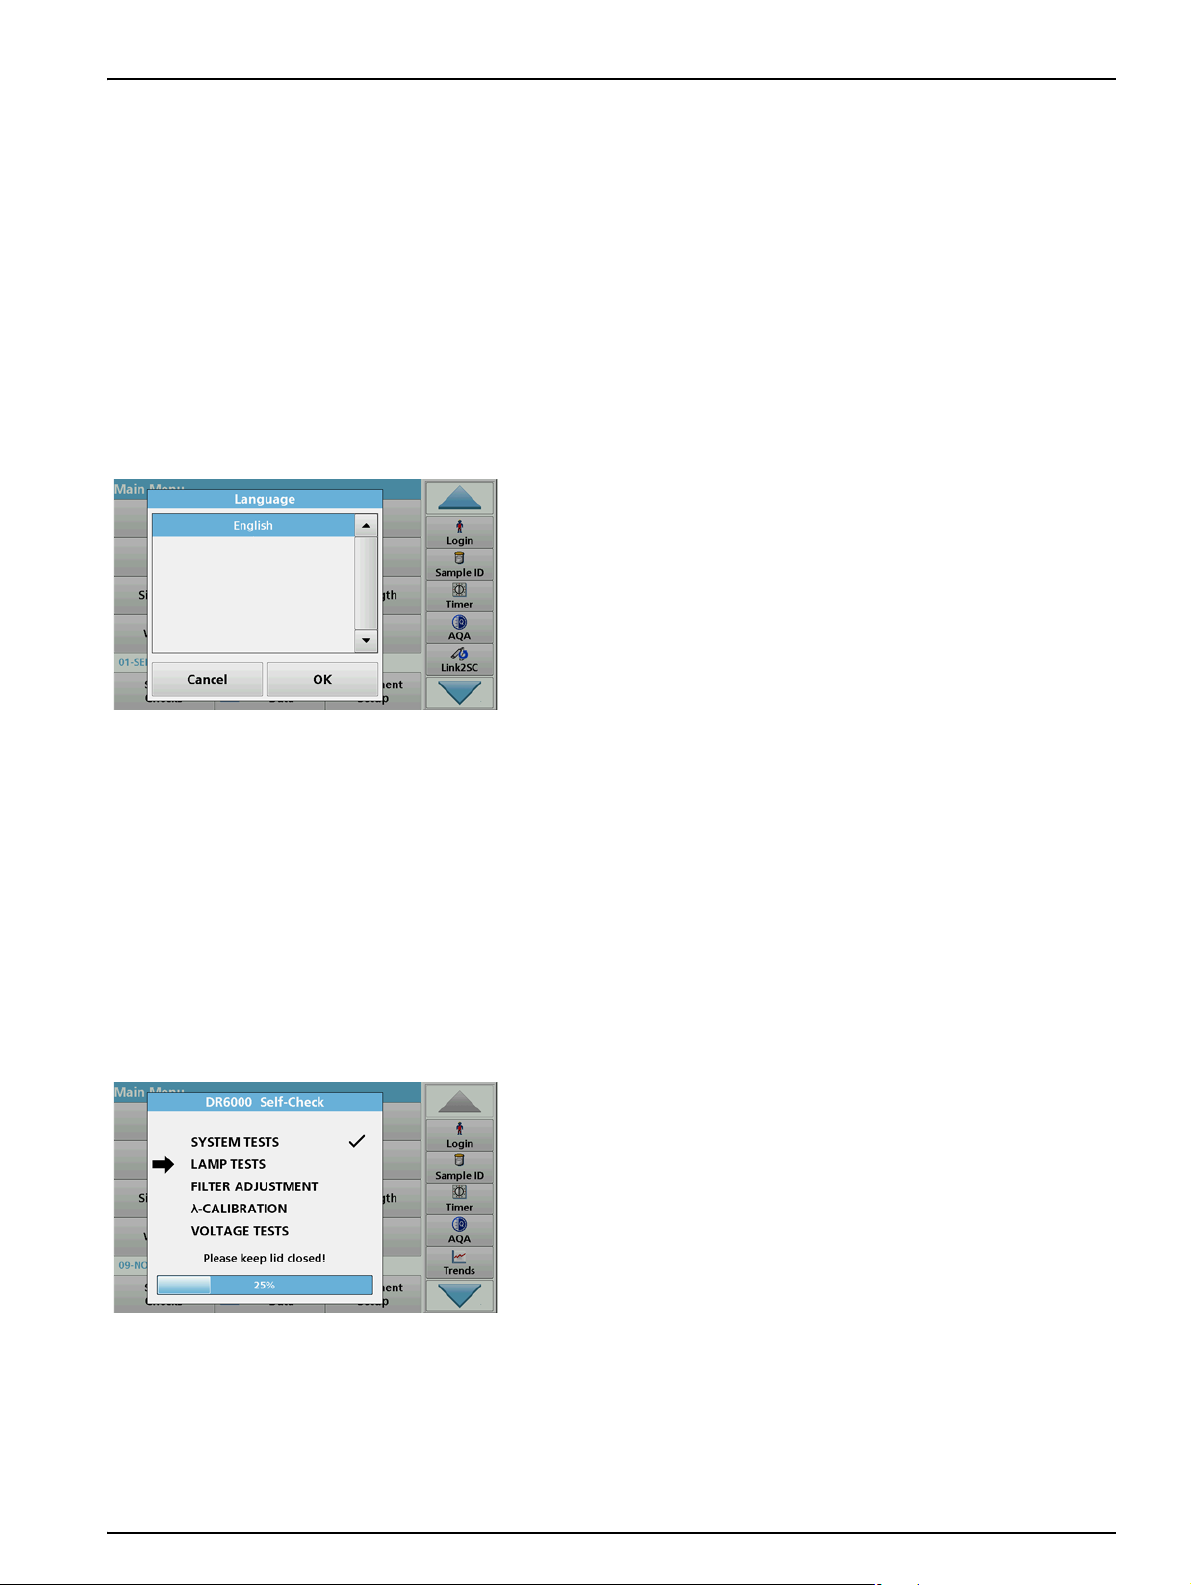
4.2 Language selection
The DR 6000 software includes several language options. The
first time the instrument is switched on, the language selection
screen will be shown automatically after the startup process.
1. Select the required language.
2. Press OK to confirm the language selection. The self-check
will then start automatically.
4.3 Self-check
Change the language setting
The device works in the selected language until the option is
changed.
1. Turn the instrument on.
2. During the startup process, touch the display at any point
until (approximately 45 seconds) the list for the selection of a
language is shown.
3. Select the required language.
4. Press OK to confirm the language selection. The self-check
will then start automatically.
Each time the instrument is powered up, a test program begins.
This procedure, which takes approximately two minutes, checks
the system, lamp, filter adjustment, wavelength calibration and
voltage. Each checked function is marked accordingly on the
display.
The Main Menu is displayed when diagnostics are completed.
Note: In the event of further error messages during the test program,
refer to Section 8, Page 141.
21
Page 22
Startup
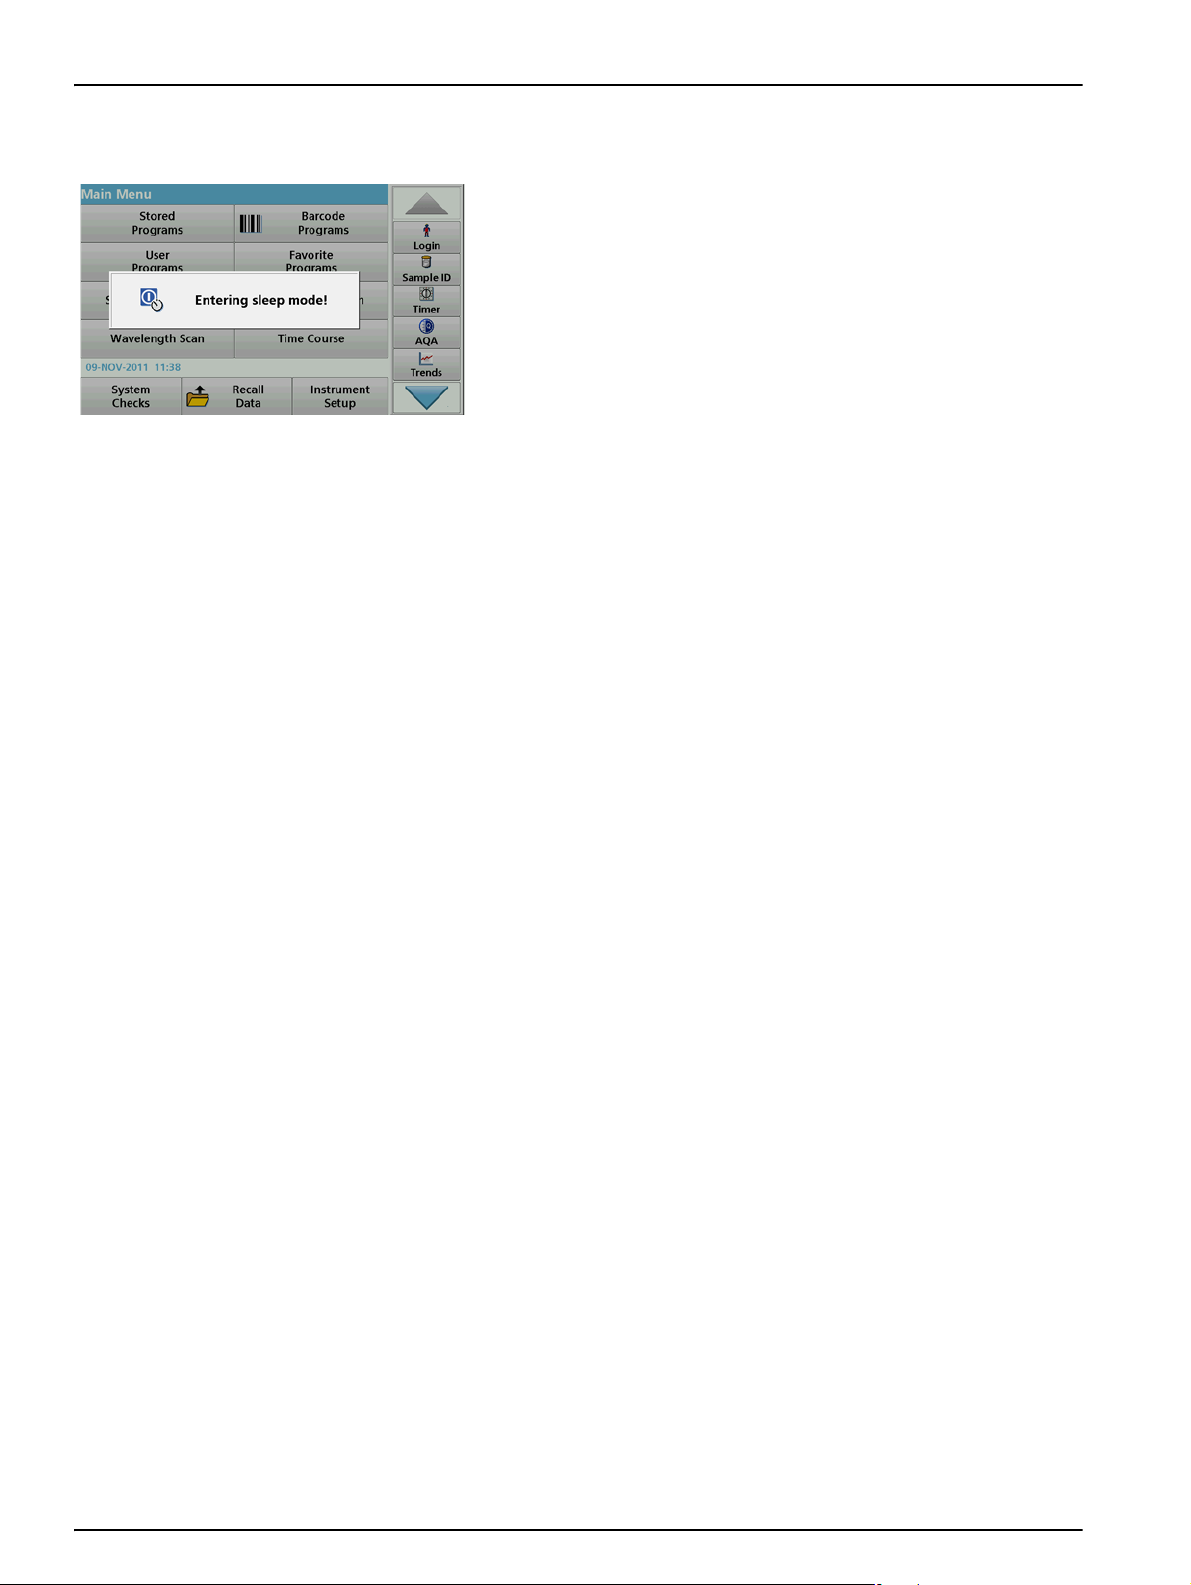
4.4 Sleep mode
4.5 Power off the instrument
The instrument can be put into sleep mode.
1. Press the power save key beneath the display.
The "Sleep mode" message is shown. The display will then
switch off automatically.
2. Press the power save key again to switch back on.
The self-check will start automatically.
After that, the instrument is ready to use.
1. Press the power switch on the back of the instrument.
22
Page 23
Section 5 Standard programs
5.1 Overview
5.1.1 Tips for using the touch screen
The entire display reacts to touch. Make selections by tapping
with a fingernail, fingertip, eraser or stylus. Do not touch the
display with sharp objects (for example a ballpoint pen tip).
• Do not place anything on top of the screen, to prevent
damage or scratches on the screen.
• Press buttons, words or icons to select them.
• Use scroll bars to move up and down long lists very quickly.
Press and hold the scroll bar, then move up or down to move
through the list.
• Highlight an item from a list by pressing it once. When the
item has been successfully selected, it will be displayed as
reversed text (light text on a dark background).
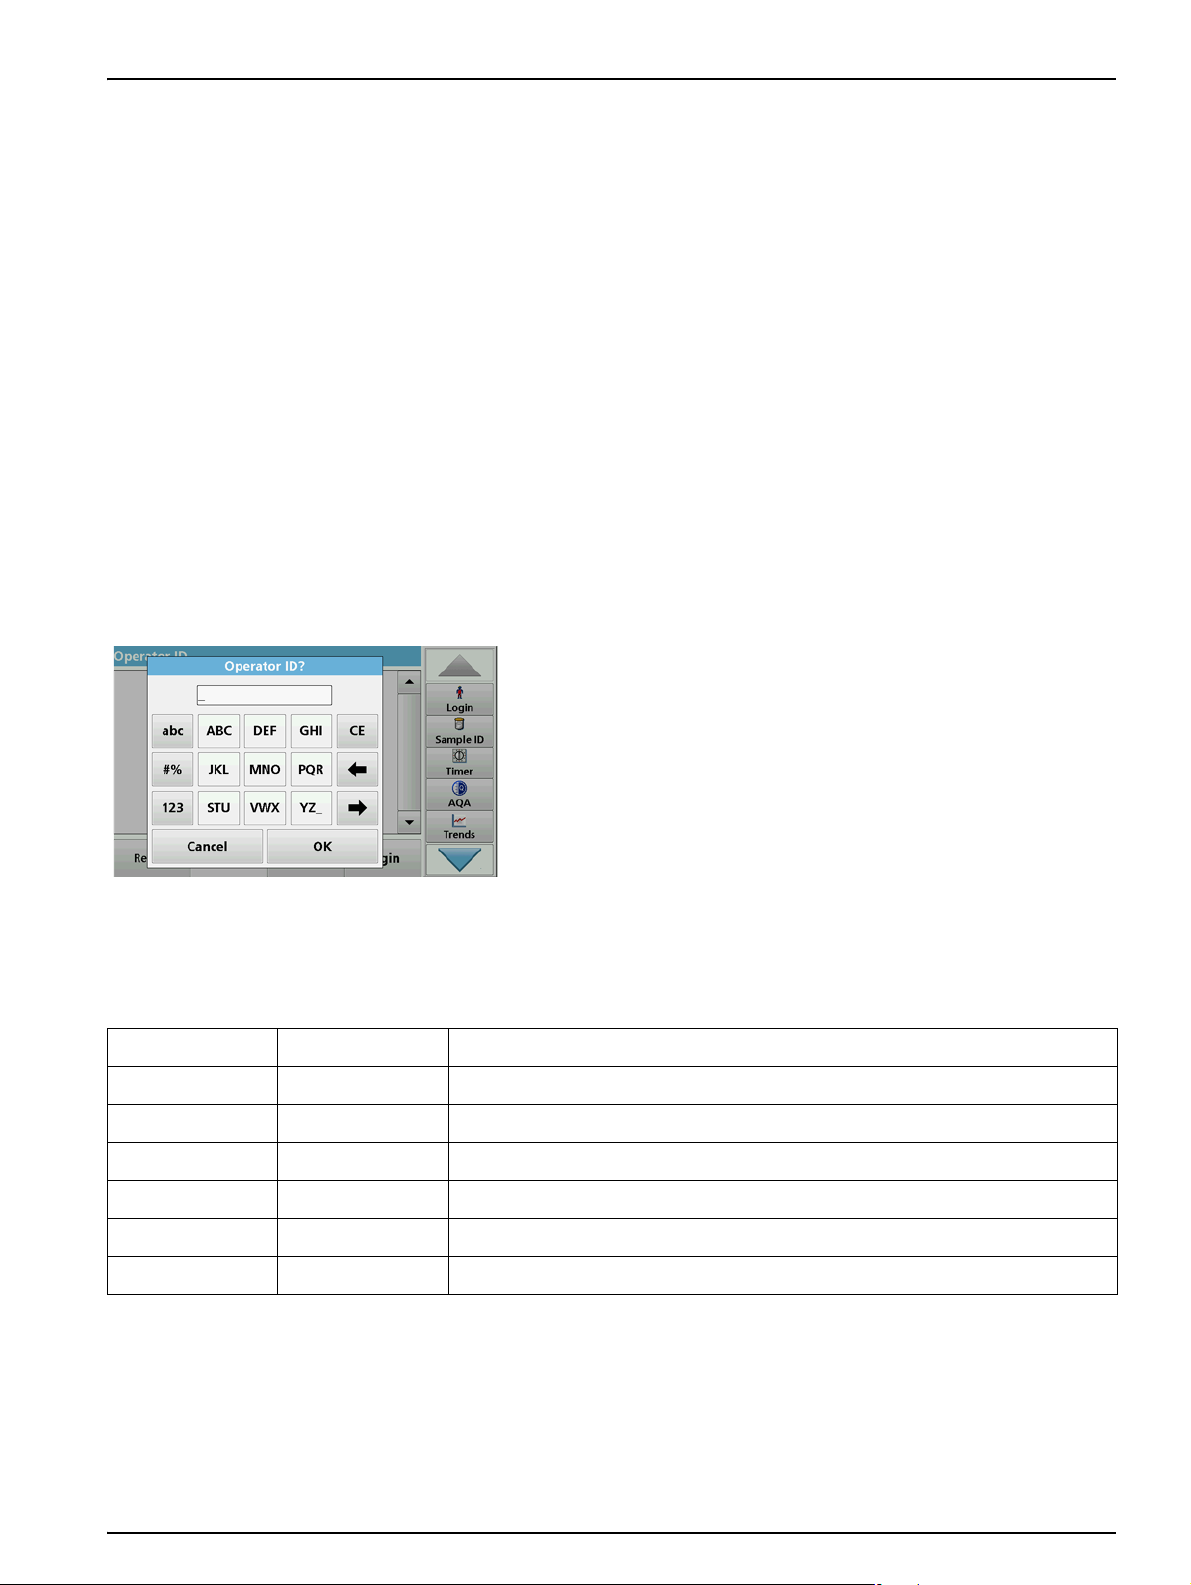
5.1.2 Use of the alphanumeric keypad
This display is used to enter letters, numbers and symbols as
needed when programming the instrument. Unavailable options
are disabled (grayed out). The symbols left and right on the
display are described in Table 1.
The designations of the center keypad change according to the
selected entry function. Touch each key repeatedly until the
required character is shown on the display. A space can be
entered by using the underscore on the YZ_ key.
Press Cancel to cancel an entry, or press OK to confirm an entry.
Note: It is also possible to use a USB keyboard (with US keyboard
layout) or a hand-held USB barcode scanner (refer to Section 9,
Page 145).
Table 1 Alphanumeric keypad
Icon / key Description Function
ABC/abc Alphabetic Toggles the character input mode between upper and lower case.
# % Symbols Punctuation, symbols and numerical sub- and superscripts may be entered.
123 Numeric For entering regular numbers.
CE Clear Entry Clear the entry.
Left Arrow Back key Deletes the current character and goes back one position.
Right Arrow Next Navigates to the next space in an entry.
23
Page 24
Standard programs
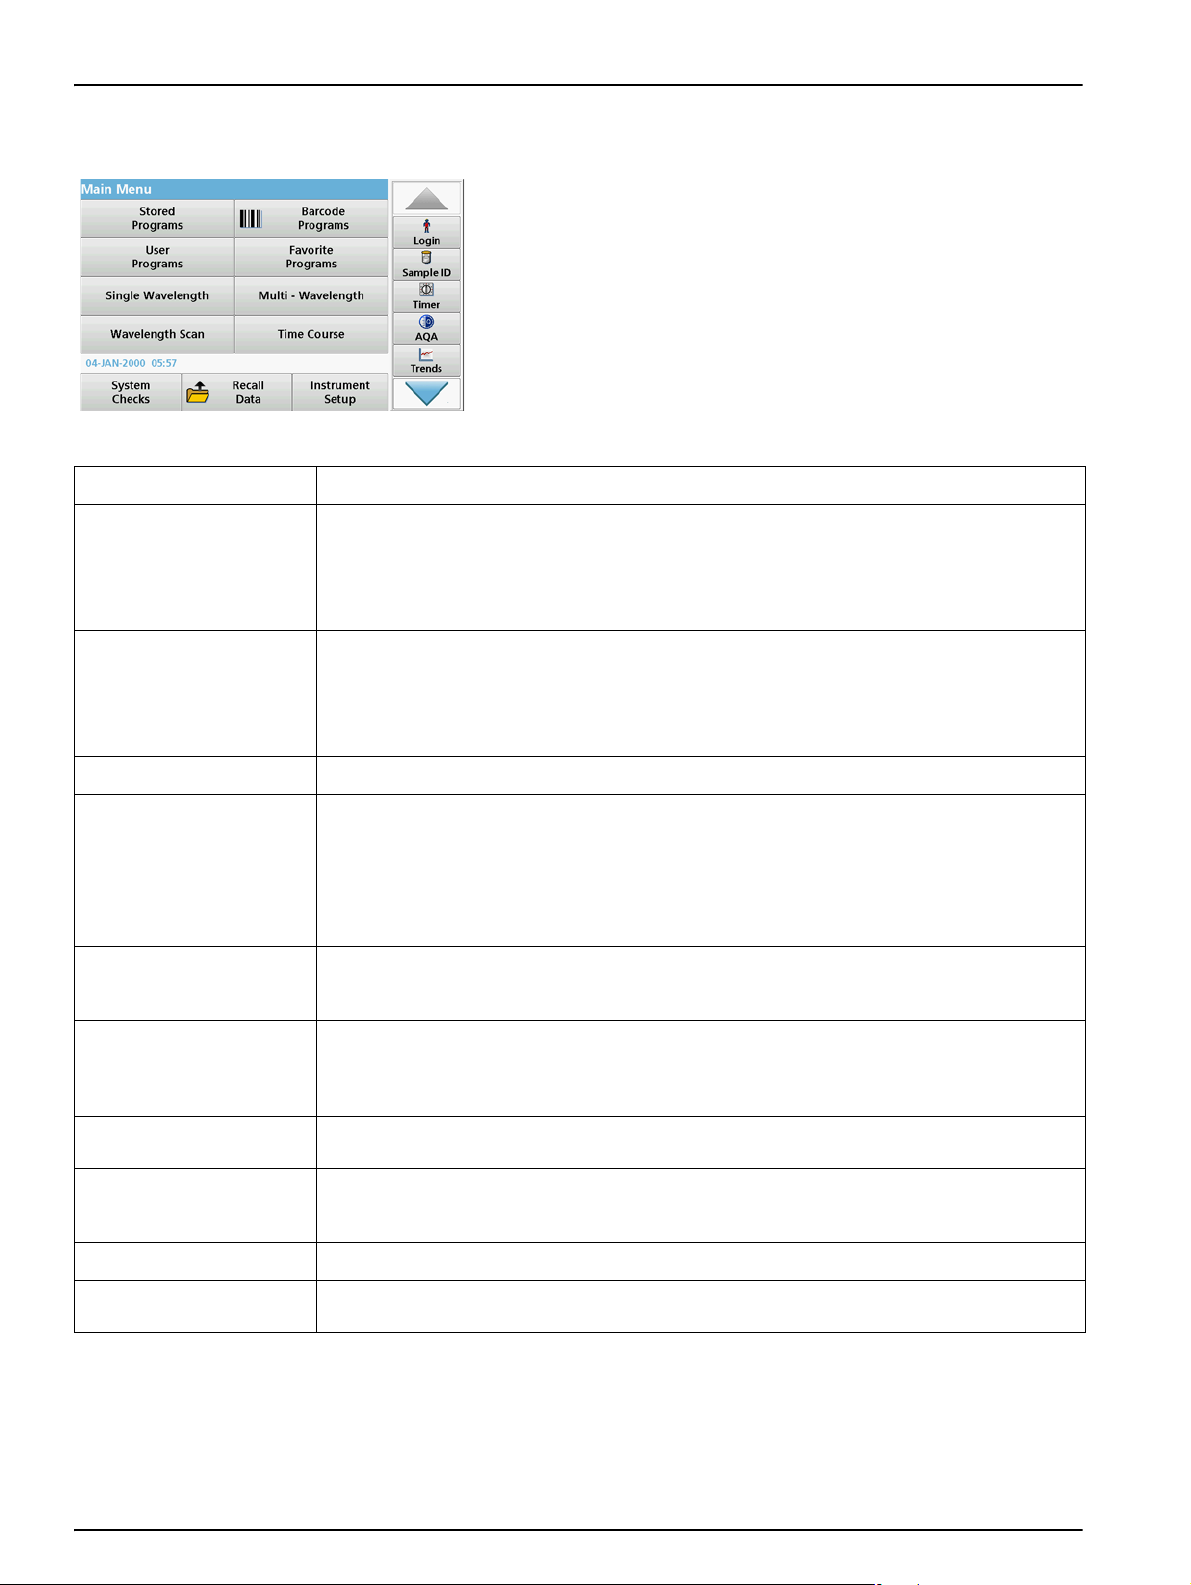
5.1.3 Main menu
Option Function
Stored programs are pre-programmed methods that make use of HACH chemicals and
Stored Programs /
Barcode Programs
(HACH-LANGE programs)
HACH-LANGE pipette tests.
The working procedures for HACH-LANGE tests are included in the test packs.
Further information, as well as illustrated, step-by-step process instructions for analyses using
HACH programs, are available on the website of the manufacturer.
User programs make "made to measure analysis" possible:
A variety of modes may be selected from the Main Menu. The
following table briefly describes each menu option.
You find a toolbar on the right in the display. Press to activate the
various functions.
Table 2 Main Menu options
User Programs
• Users can program methods they have developed themselves
• Existing HACH- and HACH-LANGE procedures can be stored as user programs.
These procedures can then be modified according to separate requirements.
Favorites List of methods/tests created by the user to suit his own requirements.
Single wavelength readings are:
Absorbance readings: The light absorbed by the sample is measured in absorbance units.
Single Wavelength
Multi Wavelength
Wavelength Scan
Time course
System checks
Recall measurement data Stored data can be called up, filtered, sent and deleted.
Instrument Setup
Transmittance reading (%): Measures the percent of the original light that passes through the
sample and reaches the detector.
Concentration readings: A concentration factor can be entered to enable the measured
absorbance values to be converted into concentration values.
In the Multi Wavelength mode, absorbance (Abs) or percentage transmittance (%T) is
measured at up to four wavelengths and absorbance differences and absorbance relationships
are calculated. Simple conversions into concentrations can also be carried out.
A wavelength scan shows how the light from a sample is absorbed over a defined wavelength
spectrum. This function can be used to determine the wavelength at which the maximum
absorbance value can be measured. The absorbance behavior is displayed graphically during
the scan.
The time scan records the absorbance or % transmittance at a wavelength over a defined
time.
The "System check" menu offers a number of options, including optical checks, output checks,
lamp history, instrument update, service time, settings for analytical quality assurance and
instrument backup.
In this mode, user-specific or method-specific settings can be entered: operator ID, sample ID,
date & time, sound, PC & printer, password, energy-saving mode and stored data.
24
Page 25
5.2 Instrument Setup
5.2.1 Operator ID
Standard programs
1. Select Instrument Setup in the Main Menu.
A selection of functions appears in order to configure the
functions of the instrument.
Use this option to enter up to 30 sets of operator initials (up to ten
characters each) into the instrument. This feature helps record
which operator measured each sample.
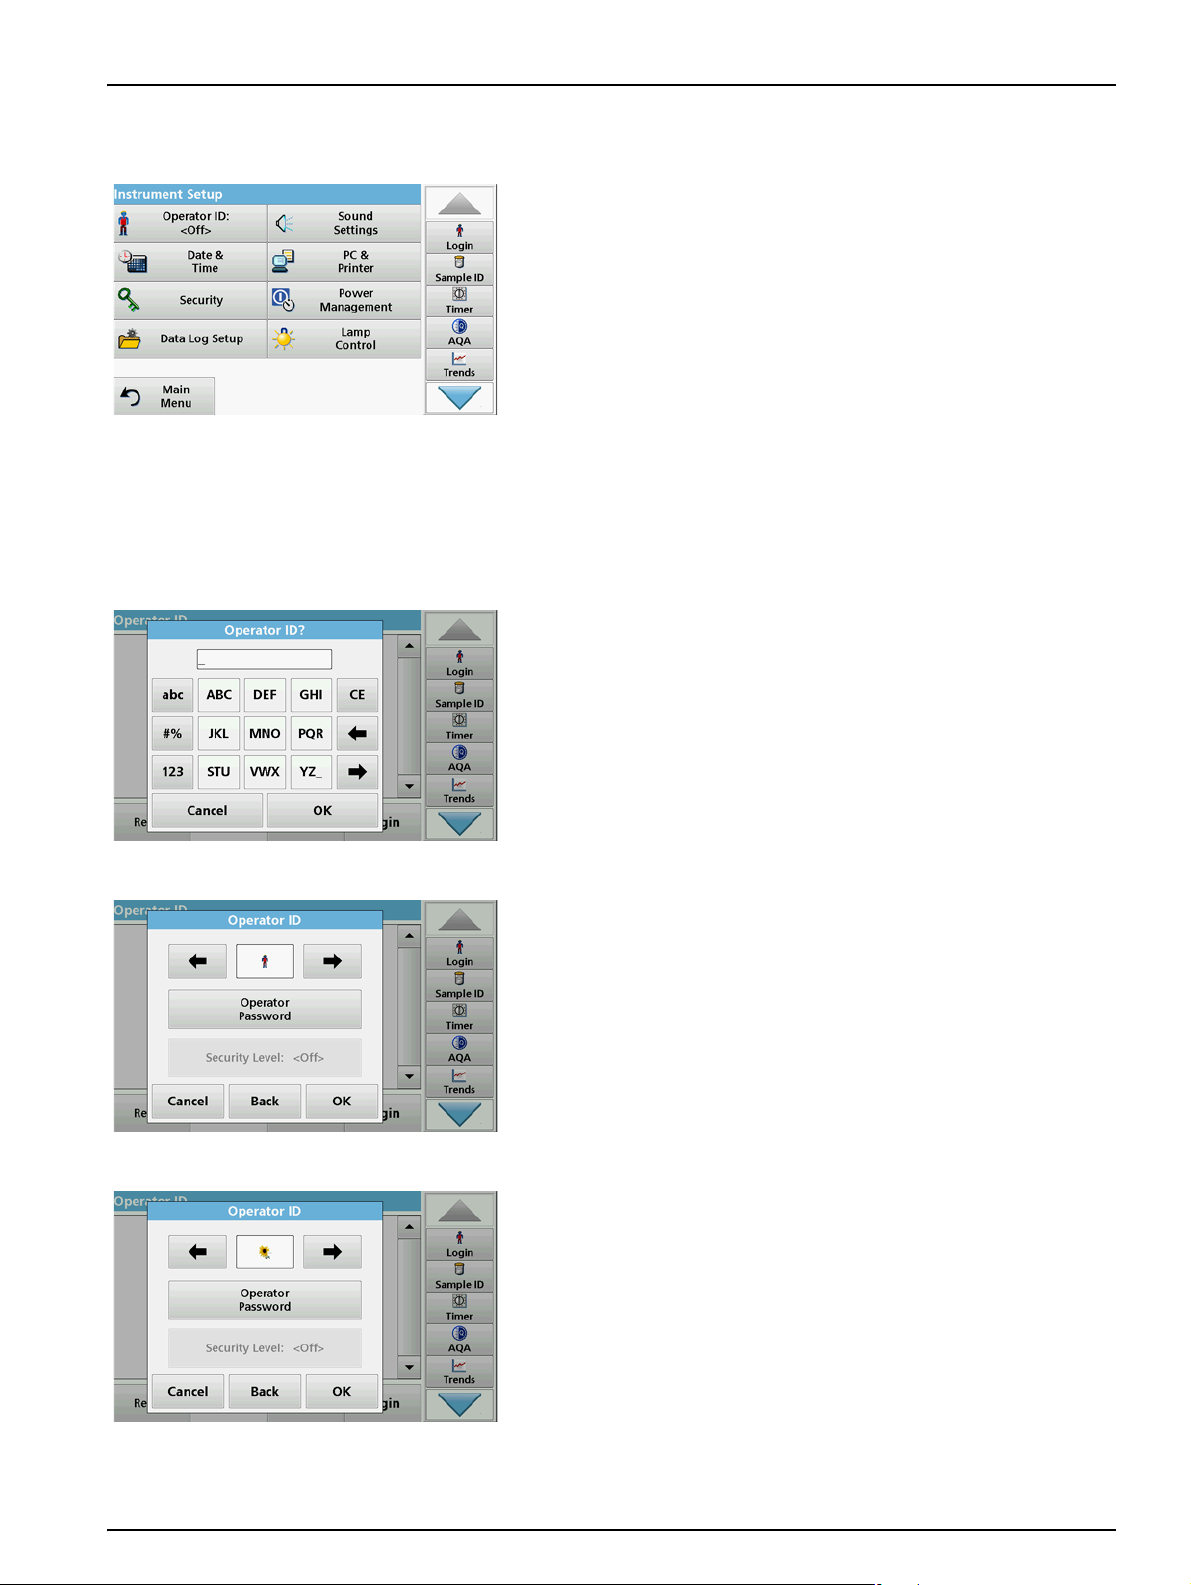
1. Press Operator ID in "Instrument Setup".
2. Press Options > New to enter a new operator ID.
Note: If no operator ID has yet been entered, the alphanumeric
keyboard is immediately displayed.
3. Use the alphanumeric keypad to enter a new operator ID.
4. Press OK to confirm the entry.
5. Choose an icon for the operator ID using the Left Arrow and
Right Arrow.
6. Press Operator Password to protect the operator ID with a
password.
7. Use the alphanumeric keypad to enter an operator
password.
8. Press OK to confirm the entry.
9. Press Cancel to delete the complete entry for the operator
ID.
With Back you go back into the input display for the
operator ID.
Press OK to confirm the entry.
25
Page 26
Standard programs
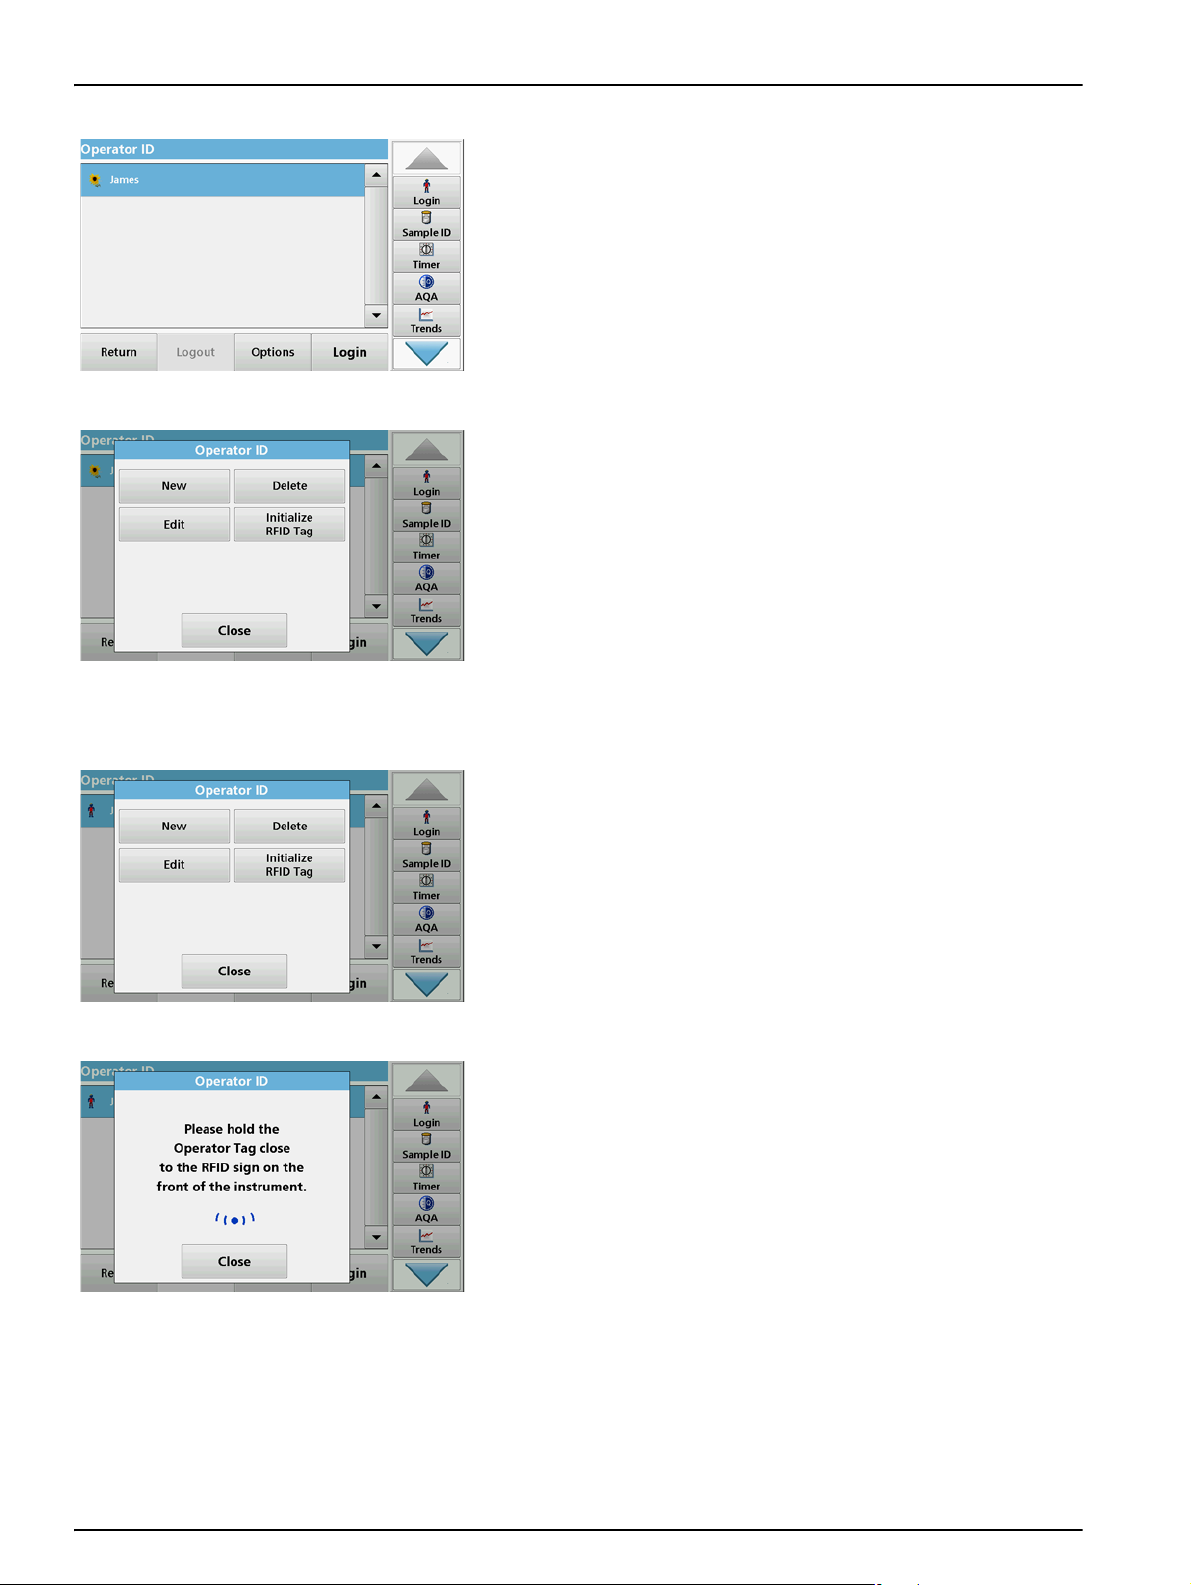
10. With Back the device returns to the menu "Instrument
Setup".
Press Logout to log out of an active operator ID.
Press Login to activate a selected operator ID.
Press Options to enter, change, or delete other operator
IDs.
11. Press New to enter another operator ID.
Press Delete to delete an operator ID.
Press Edit to edit an operator ID.
Press Initialize RFID Tag to write the operator ID to an
optional operator RFID tag (not available on all models).
Refer to section 5.2.1.1 for more information.
5.2.1.1 Operator RFID tag (not available on all models)
1. Define an operator ID (refer to section 5.2.1).
2. Press Initialize RFID Tag.
3. Following instructions on the display, hold the operator RFID
tag close to the RFID sign on the front of the instrument.
A sound indicates that the write process has been sucessful.
4. The operator RFID tag can be newly written at any time. To
do so, confirm the "Overwrite Operator ID" message with OK
and enter the password if the old operator ID is protected
with a password.
If the operator RFID tag is successfully overwritten, a
message confirming this will briefly be shown on the display.
26
The operator is logged on and the operator ID is shown in the
toolbar.
Page 27
5.2.2 Sample ID
Standard programs
Use this option to enter up to 100 Sample Identification tags (up
to 20 characters each) into the instrument. This can define a
sample location or other sample specific information.
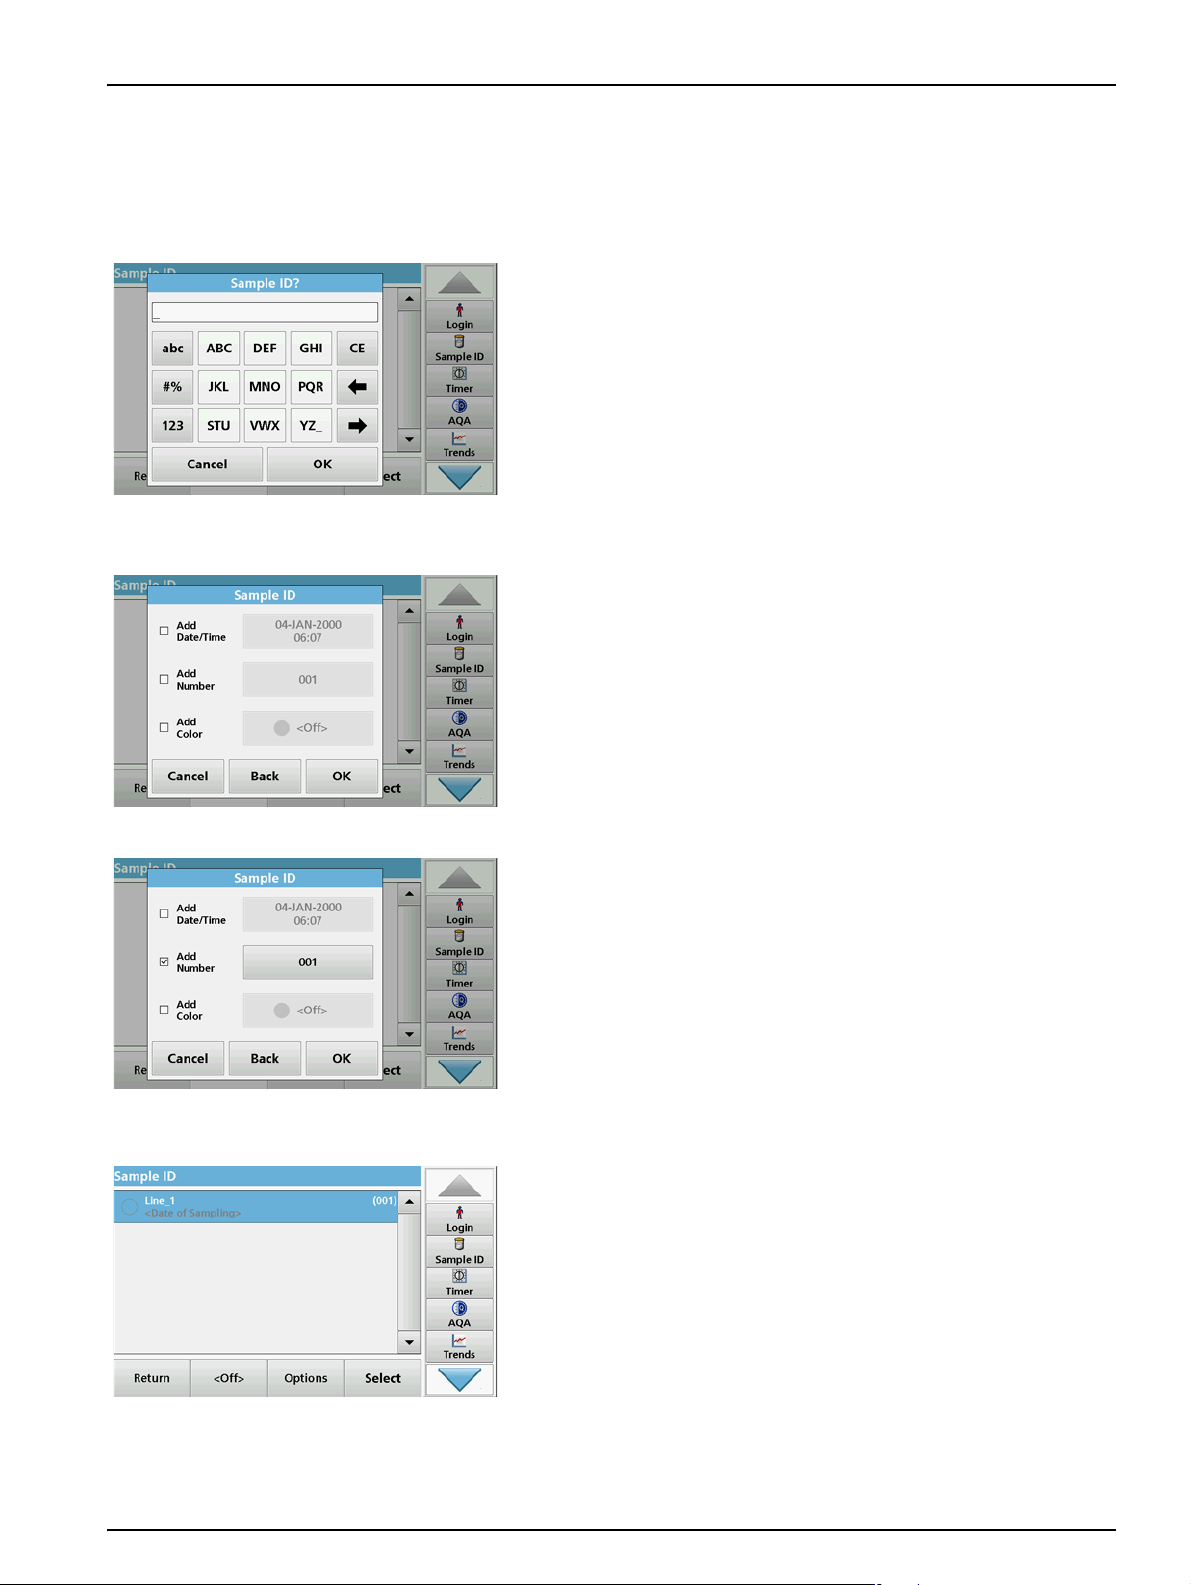
1. Press Sample ID in the toolbar on the right.
2. Press New to enter a new sample ID.
Note: If no sample ID has been entered yet, the alphanumeric
keyboard is immediately displayed.
3. Use the alphanumeric keypad to enter a new Sample ID.
Note: If a USB Barcode handset scanner ( refer to section 5.2.2.1,
page 28 ) is connected, Sample IDs can also be scanned.
4. Press OK to confirm the entry.
5. Assign the current time and date, a sequential number or a
colour to the sample ID.
6. To number the sample IDs sequentially—e.g. Inflow (01)
etc.—press Add Number.
• Use the arrow keys to specify the first number of the
sequence.
• Use the key between the arrow keys to enter the first
number of the sequence using the alphanumeric keypad.
7. Press OK to return to the "Instrument Setup" menu.
The Sample ID is activated. Each Sample ID is automatically
numbered in ascending order after a reading. The number is
shown in parentheses behind the Sample ID.
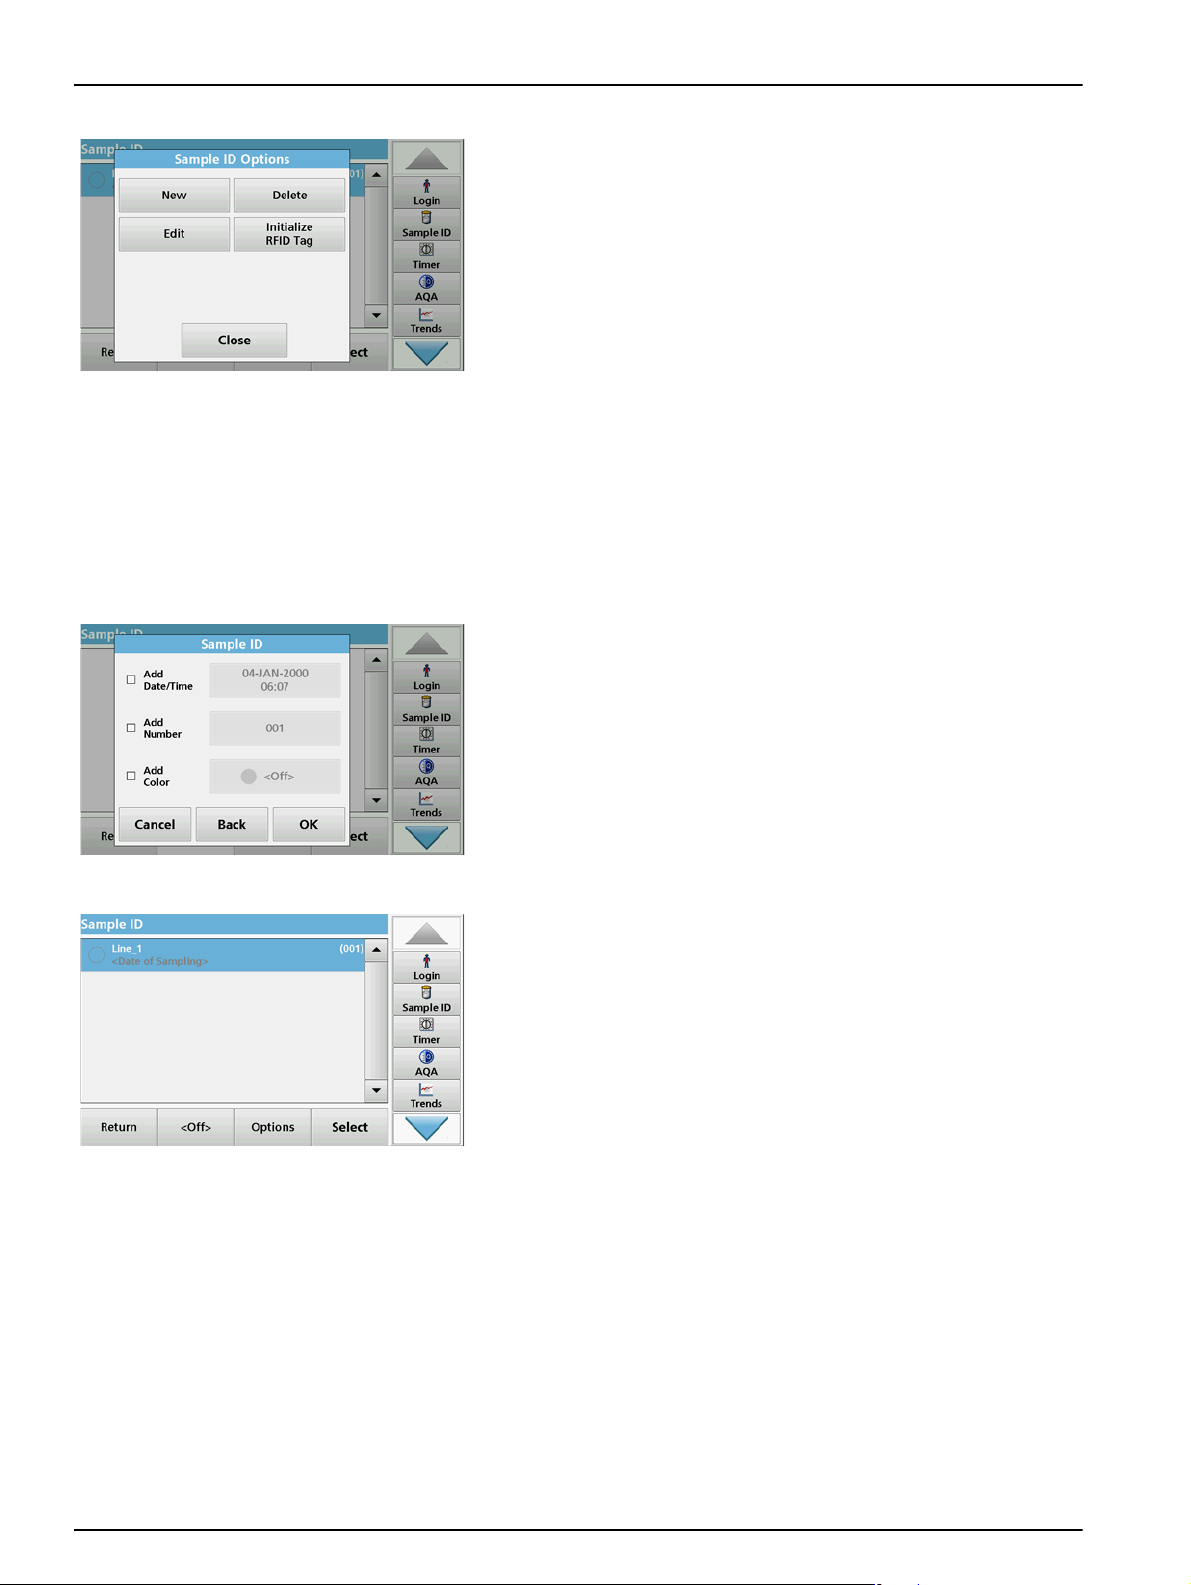
8. Press Back to return the instrument to the "Instrument
Setup" menu.
Press Off to switch off the active sample ID.
Press Select to activate the selected sample ID.
With Options other sample IDs can be entered, changed or
deleted.
27
Page 28
Standard programs
9. Press New to enter another sample ID.
5.2.2.1 Sample ID with scanner method 1
1. Connect the scanner to the USB port.
2. Press Sample ID > Options and New.
3. Read barcode with scanner.
4. The sample ID can have the current date and time, a
Press Delete to delete a sample ID.
Press Edit to edit a sample ID.
Press Initialize RFID Tag to write the sample ID to an
optional location RFID tag (not available on all models).
Successful connection is indicated by a sound.
sequential number and a colour allocated to it.
Select the required options or a colour.
5. Press OK to confirm the entry.
6. Press New again and repeat the process for each barcode.
5.2.2.2 Sample ID with scanner method 2
1. Read the sample ID on the screen with the barcode scanner
and perform measurement.
The barcode is stored along with the reading, but is not
adopted into the list of sample IDs.
28
Note: To delete a sample ID, select the ID and press Delete.
Note: A sample ID can be entered or changed in Reading Mode. To do
so, press the icon for the sample ID in the toolbar.
Page 29

Standard programs
5.2.2.3 Import external sample ID
1. Create an external sample ID list with a spreadsheet
program. Four columns are permitted, column 1 contains the
sequential number, column 2 the sample designation,
columns 3 and 4 are optional. Headings and comment lines
must begin with #.
2. Create a folder named "SampleID" on a USB stick or in your
established network.
3. Save the sample ID list with Save As in the format CSV or
UNICODE-TXT in the folder "SampleID".
4. Connect the DR 6000 to the USB stick or network.
All *.TXT and *.CSV files in the SampleID folder are shown
for selection.
5. Transfer the shown sample ID list with Done.
6. Select the required file with OK.
5.2.3 Sample ID and operator ID with the optional RFID Sample ID Kit (not available on all models)
5.2.4 Security settings
The optional RFID Sample ID Kit consists of:
• A LOC 100 RFID Locator
• An operator RFID tag
• Five location RFID tags and
• Three sample bottle RFID labels each, in black, red, green,
blue and yellow
The operator and location RFID tags can be written to and read in
by the RFID module in the DR 6000 as often as required.
More information can be found in the user manual for the
LOC 100 RFID Locator.
The "Security" menu contains a variety of security settings to
control access to various functions.
All functions can be allocated to three different security levels:
• not secured: every operator can make changes in this area.
• one key: every operator assigned this security level can
make changes to non-secured functions and functions with
one key.
• two keys: every operator assigned this security level can
make changes in all functions
29
Page 30
Standard programs
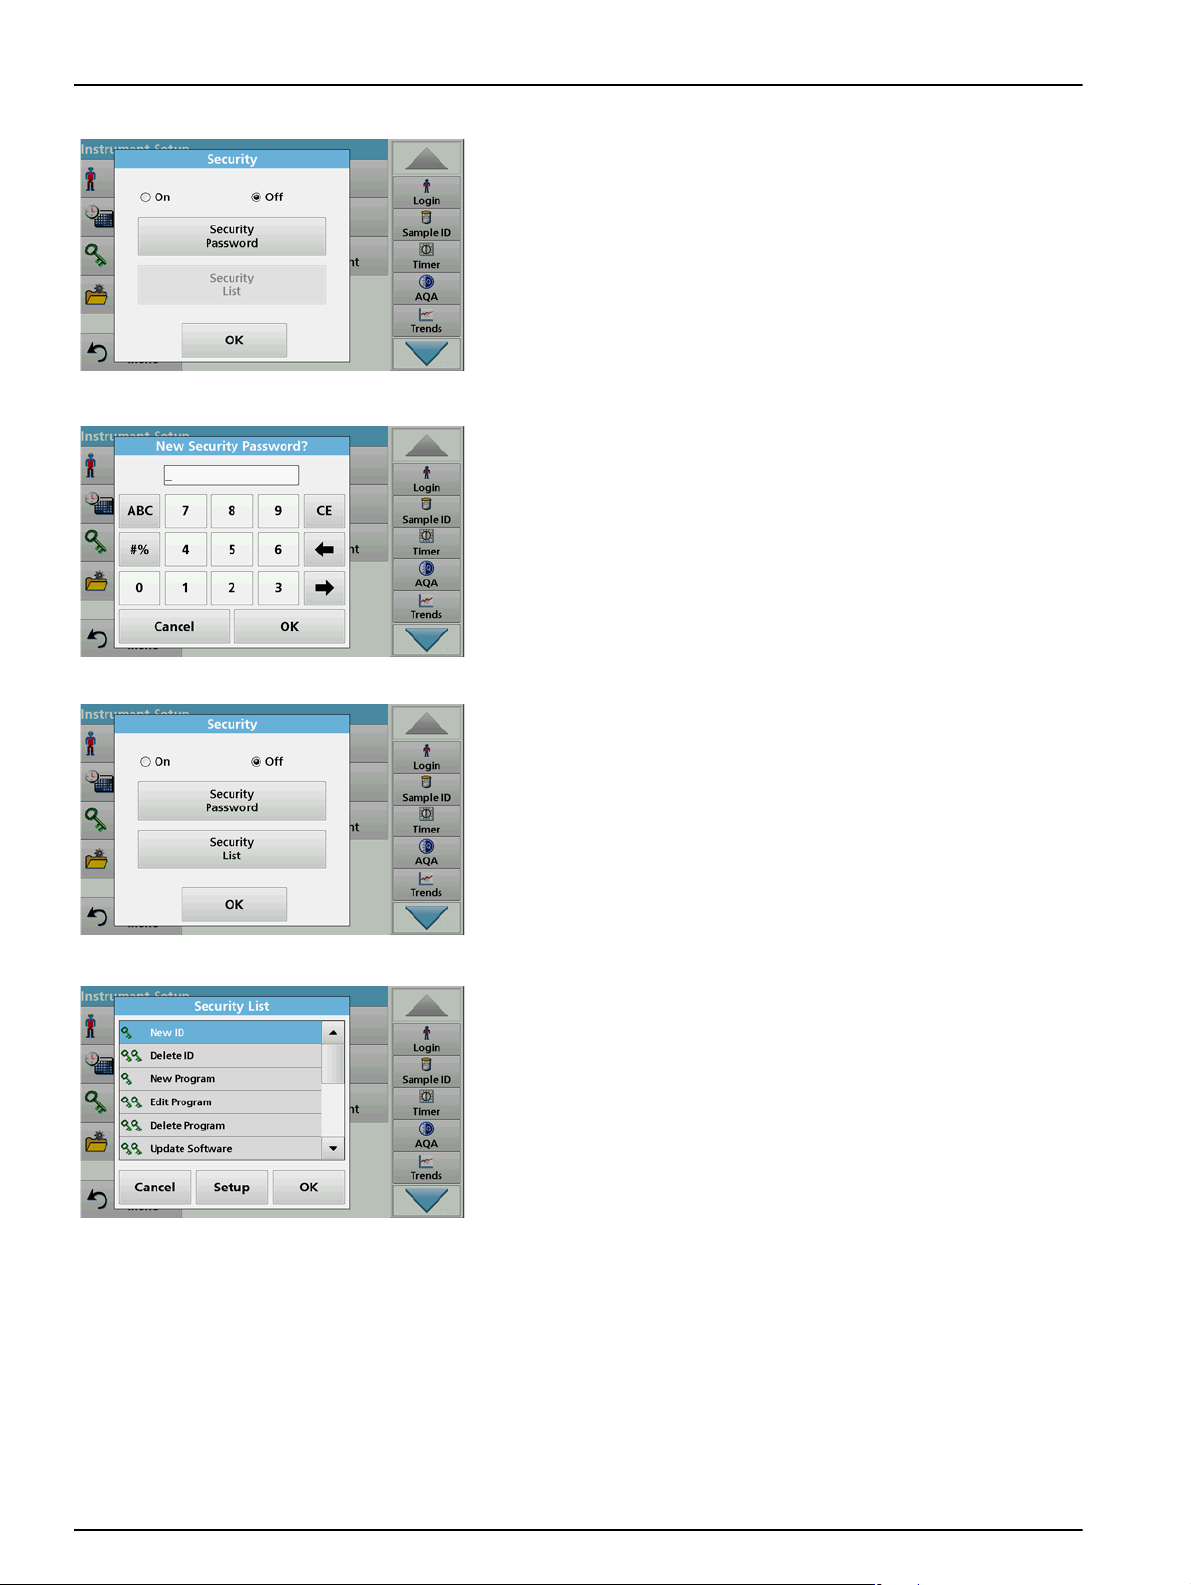
1. Press Security in the "Instrument Setup" menu.
2. In order to open the Security List, assign a password as
security administrator. Activate On and press Security
Password.
3. Enter a new security password (up to 10 characters long) via
the alphanumeric keypad, and confirm with OK.
4. Press Security List to access various functions with security
level 1 or 2.
5. Select the required function and press Setup.
30
Page 31

Standard programs
6. Select the required security level (two keys, one keys or off)
and confirm using OK.
7. Confirm the Security List using OK to return to the
"Security" menu.
8. Press OK to return to the "Instrument Setup" menu.
Note: The alphanumeric keypad for entering the password appears
when a user tries to reach a locked setting.
5.2.4.1 Assign operator security level
Every operator with an operator ID can be assigned a security
level. This assignment is connected to the operator password.
Setup must be coordinated with the security administrator and
the operator.
1. Select Operator ID from "Instrument Setup".
2. Set up an operator ID (refer to section 5.2.1).
3. Tap on Operator Password.
4. Enter the operator password and confirm with OK.
5. Ta p Security Level <Off>.
6. Enter the security password and confirm with OK.
The current security level for the selected operator is shown.
31
Page 32

Standard programs
7. Select the required security level for this operator ID and
confirm with OK.
8. Press OK.
5.2.4.2 Deactivate password
The operator ID is displayed with the selected security level.
9. Press Login to activate the selected operator ID.
10. Enter the operator password.
11. Confirm with OK and return to "Instrument Setup".
1. Press Security in the "Instrument Setup" menu.
2. Enter the security password and confirm with OK.
32
Page 33

5.2.5 Date and time
Standard programs
3. Press Off to deactivate the settings of the Security List.
4. Press OK and return to the "Instrument Setup" menu.
Note: Use this function to delete the former password or to enter a new
one.
1. Ta p Date & Time in the "Instrument Setup".
2. Select a Date Format for the date.
3. Press OK to confirm the entry.
4. Select a Time Format for the time.
5. Press OK to confirm the entry.
33
Page 34

Standard programs
6. Press OK to confirm the entry and press Date & Time to
open.
7. Enter the current date and time. Change the information
using the arrow keys.
8. Press OK to confirm the entry.
The instrument then returns to "Instrument Setup".
5.2.6 Sound settings
1. Press Sound Settings in "Instrument Setup".
The following options will be displayed:
• All: Activates/deactivates a sound with a variable volume for
every function, with the exception of the timer.
• Touch screen: Activates/deactivates a short sound with
variable volume with each touch of the display.
• Reading done: Activates/deactivates a short sound with
variable volume when the reading is done.
•Timer: Sets short/long sound with variable volume when
timer has ended.
•Startup: Activates/deactivates a startup melody with variable
volume when the test program is started.
• Warning: Activates/deactivates a short sound with variable
volume if there is an error message.
• RFID done: Activates/deactivates a short sound with variable
volume when a RFID transfer is done.
• Shutdown: Activates/deactivates a short sound with variable
volume when shutting down.
34
Page 35

5.2.7 PC and printer
Standard programs
2. Select the required action.
3. Press Setup and complete the required settings.
4. Press OK to confirm the entry.
The instrument then returns to "Instrument Setup".
The DR 6000 features an Ethernet port and two USB ports on the
rear of the instrument, as well as one USB port on the front (refer
to Figure 1 and Figure 2, Page 17). These interfaces can be used
to send data and graphics to local and network printers, update
data and transfer data to a PC and within a network. These
interfaces can be used for the connection of a USB stick, an
external USB keyboard or a USB Barcode handset scanner.
Note: Various accessories can also be connected simultaneously using
a USB hub.
Interfaces Description
USB (Type A)
USB B
Ethernet
This USB interface is for the connection of a printer, of a USB storage device or of a USB
keyboard.
This USB port is only intended for the connection of the DR 6000 to a PC (with installation of the
corresponding software).
The Ethernet port is intended for data transfer to a PC without installed software or in a local
network. Only use a shielded cable (e.g. STP, FTP, S/FTP) with a maximum length of 20 m for
the Ethernet port.
A USB memory stick is used to update data, refer to
section 6.7.2, page 116.
Note: A shielded USB cable must not be longer than 3m!
Table 3 USB connector
1. Press PC & Printer in "Instrument Setup".
A list with information about the connections opens.
35
Page 36

Standard programs
5.2.7.1 Printer setup
1. Press Printer.
2. Press Setup to display the Printer Setup screen.
Printer Setup:
• Resolution: Font size
• Paper: Paper size
• Network Printer: Automatic printer search or fixed input via IP
address.
Note: If an optional Thermal Printer is connected, the function "Auto
Send" on/off is available.
3. Press Resolution to select the print quality.
For selection are
• 100 dpi,
• 150 dpi and
• 300 dpi.
4. Press OK to confirm the entry.
Note: Press OK again to return to the "Instrument Setup" menu.
5. Press Paper to select the paper size.
For selection are
• Letter,
• Monarch,
• Executive,
• A4.
6. Press OK to confirm the entry.
Note: Press OK again to return to the "Instrument Setup" menu.
36
When you have connected the DR 6000 to your local network
(refer to section 5.2.7.4) you can print out your data on all
network printers.
Page 37

5.2.7.2 Print data
Standard programs
7. Press Network Printer to define the network printer.
Automatic: All available printers in the local network are
listed.
Select the required printer and press OK to confirm.
Fixed: Enter the IP address of the required printer and press
OK to confirm.
8. Press OK to confirm the entry.
Note: Press OK again to return to the "Instrument Setup" menu.
1. Press Recall Data from the Main Menu.
2. Select the data source, where the data to be printed are
stored.
A list is displayed. Data can be filtered. Refer to
section 5.3.1.2, page 43 for more information.
5.2.7.3 Print data continuously
3. Press the Printer icon to send the data (table, curve)
immediately to the printer.
4. Highlight Single point, Filtered data or All data and press
OK to confirm.
Send data... appears on the display until the data is
printed.
If you would like to automatically print out all measured values
immediately after measurement, the use of a continuous form
printer is recommended, for example the 4" paper thermal printer
refer to Section 9, Page 145.
1. Connect the thermal printer to a USB type A port.
2. Press PC & Printer in the "Instrument Setup" menu.
A list with information about the connections opens.
3. Highlight Printer.
4. Press Setup to display the Printer Setup screen.
5. Activate Auto Send: On to send all measurement data
automatically to the thermal printer. Also activate in the data
log setup the Auto Send function. Refer to section 5.3.1.1.
5.2.7.4 Network setup
The DR 6000 supports communication over local networks. For
the setup of an Ethernet communication in networks, a special
configuration is required. The manufacturer recommends support
from a network administrator. Only use a shielded cable
(e.g. STP, FTP, S/FTP) with a maximum length of 20 m for the
Ethernet port. This section describes the setting options for the
photometer in relation to network communication.
37
Page 38

Standard programs
The connection parameters must be configured for data transfer
to a PC or connection to a network.
1. Press PC & Printer in "Instrument Setup".
2. Press Network > Setup.
3. Press On.
4. Press IP address.
An IP address is used to send data from a sender to a
pre-defined recipient.
• If the IP for the DR 6000 is automatically assigned in the
network, no further adjustment occurs. A hostname can
optionally be assigned.
• If the instrument address is fixed, the connection must be
configured.
5. Select Fix to configure the IP address.
6. Press IP address and enter the address.
38
Page 39

Standard programs
In conjunction with the IP address of an instrument, the subnet
mask establishes which IP addresses are located within the local
network.
7. Press Subnet Mask and enter the address.
A Gateway enables data communication in networks that are
based on varying protocols.
8. Press Default Gateway and enter the address.
9. Press OK to confirm the entry.
10. Press Network Server: <Off> to determine the target site for
the data transfer.
11. Select Netdrive and run Netdrive Setup.
Alternatively, select FTP and run FTP Setup.
The procedures are completely identical. As an example,
Netdrive Setup is described here.
39
Page 40

Standard programs
The target site can be defined by IP address or a server name.
12. Press IP-Address and enter the IP address or select Server
Name and enter the server name.
13. Press Data Folder and enter the target folder name.
Note: A folder with the selected name must exist on the target
system. Additionally, the folder must be shared with the operator,
using the corresponding password.
14. Press OK to confirm the entry.
User and password must be identical to the settings on the
target system.
15. Ta p User and enter the user name.
16. Confirm the entry with OK.
17. Ta p Password and enter the password.
18. Confirm the entries with OK.
19. Select Factory Default to set the network settings back to the
default settings.
40
Page 41

5.2.8 Power Management
Standard programs
1. Press Power Management in "Instrument Setup".
2. Select Sleep Timer.
3. Select the required time span after which the instrument will
go into energy-saving sleep mode if it is not used (refer to
section 4.4, page 22), and confirm with OK.
4. Select UV Lamp Save.
5. Select the required time span after which the UV lamp will be
powered off if it is not used, and confirm with OK.
5.2.9 Lamp control
Note: To protect the UV lamp, do not switch it on and off frequently.
The UV lamp requires time to warm up.
6. Select Visible Lamp Save.
7. Select the required time span after which the VIS lamp will
be powered off if it is not used, and confirm with OK.
Note: The manufacturer recommends the "Automatic" setting for
this. This means the VIS lamp is only switched on momentarily to
perform the measurement.
With the lamp control the UV lamp and the VIS lamp can be
switched on or off manually.
1. Ta p Lamp Control in the "Instrument Setup".
2. Select VIS-Lamp or UV-Lamp.
41
Page 42

Standard programs
3. Select Off or On and press OK to confirm.
The UV switch is used to define the changeover wavelength up to
which the UV lamp functions as source lamp and from which the
VIS lamp takes over as source lamp.
4. Select UV Switch:.
5. Enter the required wavelength between 320 nm and 360 nm.
The default setting is 331 nm. Press OK to confirm.
5.3 Save, recall, send and delete data
5.3.1 The data log
The data log can store up to 5000 readings saved by the
following programs:
• Stored Programs,
• Barcode Programs,
• User programs,
• Favorites,
• Single Wavelength and
• Multi Wavelength.
A complete record of the analysis is stored, including the Date,
Time, Results, Sample ID and Operator ID.
5.3.1.1 Auto/manual data storage
The data storage parameter indicates whether data is to be
stored automatically or manually (in which case the user has to
decide which data to store).
42
Page 43

Standard programs
1. Press Data Log Setup in the "Instrument Setup" menu.
• With the setting Auto Store: On the device saves all
recorded measurement data automatically.
• With the setting Auto Store: Off the device saves no
measurement data. To save the currently displayed
reading, select Options > Save icon from the results
display; the currently displayed reading only is saved.
2. Specify the output format of data to be exported using Send
Data Format. Select xml or csv.
3. The Auto Send: On setting allows the instrument to print all
recorded measurement data automatically when a thermal
printer is connected. Auto Send: On must be activated in
the Printer Setup for the thermal printer to enable this feature
(refer to section 5.2.7.1). If a PC is connected, the recorded
measurement data is imported automatically into a table.
4. Press OK to confirm the entry.
The instrument then returns to "Instrument Setup".
Note: When the instrument memory (data log) is full, the oldest data is
automatically deleted allowing the new data to be stored.
5.3.1.2 Recall stored data from the data log
1. Press Recall Data in the Main Menu.
2. Press Data Log.
A listing of the stored data is displayed.
43
Page 44

Standard programs
3. Press Filter: On/Off.
The function Filter Settings is used to search for specific
items.
4. Activate On. The data can now be filtered using the following
selection criteria.
• Sample ID
• Operator ID
• Start Date
• Parameter
or any combination of the four.
5. Press OK to confirm the selection.
The chosen items are listed.
5.3.1.3 Send data from the data log
6. Press View Details to get more information.
Data is sent from the internal data log as an XML (Extensible
Markup Language) file or as a CSV (Comma Separated Value)
file, to a directory with the name DataLog on a USB mass storage
device or a network drive. The file can then be processed using a
spreadsheet program. The file name has the format:
DLYear-Month-Day_Hour_Minute_Second.csv or
DLYear-Month-Day_Hour_Minute_Second.xml.
To send data to a printer, refer to section 5.2.7.2, page 37.
44
Page 45

Standard programs
1. Plug the USB storage device into the USB A interface on the
DR 6000 or connect the DR 6000 with a network drive (refer
to section 5.2.7.4, page 37).
2. Press Recall Data from the Main Menu.
3. Select the data category to be transferred, e.g. Data Log.
A list of the selected measurement data is displayed.
4. Tap on Options and then on the
PC & Printer symbol.
5. Select the data to be sent.
6. Press OK to confirm.
Note: The number in parentheses is the total number of data sets
assigned to this selection.
5.3.1.4 Delete stored data from the data log
1. Press Recall Data from the Main Menu.
2. Press Data Log > Options > Delete.
3. Highlight Single point, Filtered data or All data and press
The following options are available:
• Single point: only this selected reading will be sent
• Filtered data: only readings that correspond to the set
filters will be sent
•All data: all data in the selected data category will be
sent.
OK to confirm.
Note: The number in parentheses is the total number of data sets
assigned to this selection.
45
Page 46

Standard programs
5.3.2 Control charts for data from the AQA Log
1. Select Recall Data from the main menu.
2. Press AQA Log.
A listing of the stored data is displayed.
3. Press Filter: On/Off.
4. Activate On.
5. Select a required parameter.
6. Press OK to confirm the selection.
The chosen items are listed.
7. Press Options > Control Chart.
46
Page 47

Standard programs
8. Press Standard Control Chart to choose the control chart
of the selected standard.
The measured standard concentrations are displayed
graphically with the control limits and date.
9. Press Range Control Chart to select the control chart of the
range in % for multiple determinations.
The range in % is displayed graphically with the control limits
and date.
5.3.3 Store, recall, send and delete data from wavelength scan and time course
The instrument can store 50 datasets for the Wavelength Scan
and 50 datasets for the Time Course. The data must be stored
manually after it is displayed.
47
Page 48

Standard programs
5.3.3.1 Data storage from wavelength scan or time course
1. Press the Folder icon in the "Options" menu after a reading
is taken.
The Store Data list will be displayed.
2. Press Store to save the current scan to the highlighted
numbered line.
Note: Scans can be overwritten.
5.3.3.2 Recall stored data from wavelength scan or time course
1. Press Recall Data from the Main Menu.
a. Select Wavelength Scan or Time Course to recall data.
b. If a program is already running, press Options > More >
Recall Data.
2. Select the required data.
3. Tap on Graph to display details.
Note: Tap on View List to return to the "Recall Data" list.
48
Page 49

4. Tap on Table to display details.
Note: Press View List to return to the "Recall Data" list.
5.3.3.3 Send data from wavelength scan or time course
There are two ways to send data to a USB memory stick, printer,
PC or installed network drive with Hach Data Trans.
Option 1:
1. Press Recall Data in the Main Menu and then Wavelength
Scan or Time Course.
Standard programs
2. Press Option and then press the PC & printer symbol to
send the data to a USB storage device, printer, PC or
network drive with Hach Data Trans.
• When a printer is connected, you must select how the
data should be sent to the printer (as graph, table or
graph and table).
• If a USB storage device is connected, the files are
automatically sent as xml- or csv files to the file folder
"WLData" (data of a wavelength scan) or "TCData" (data
of a time course) on the USB storage device/or moved
into the folder.
• If a network drive has been installed under Instrument
Setup > PC & Printer > Network > Setup and csv or xml
has been selected as the data format, the data is sent to
the network drive.
The file name will be formatted as: "ScanData_X.csv"
(Wavelength Scan Data) or "TCData_X.csv" (Time Course
Data).
X = number of scans (1–20).
For further processing use a spreadsheet program.
Note: The message, "Data already present. Overwrite?" is displayed if
the files are already stored. Press OK to overwrite the stored data.
49
Page 50

Standard programs
Option 2:
1. Press Wavelength Scan or Time Course and then Options
> More > Send Data to send the data to a USB memory
stick or to a printer.
• When a printer is connected, select how to send the data
to the printer (graph, table or both graph and table).
• If a USB storage device is connected, the files are
automatically sent as xml- or csv files to the file folder
"WLData" (data of a wavelength scan) or "TCData" (data
of a time course) on the USB storage device.
• If a network drive has been installed under Instrument
Setup > PC & Printer > Network > Setup and csv or xml
has been selected as the data format, the data is sent to
the network drive.
The file name will be formatted as: "ScanData_X.csv"
(Wavelength Scan Data) or "TCData_X.csv" (Time Course
Data).
X = number of scans (1–20).
For further processing use a spreadsheet program.
5.3.3.4 Delete stored data from wavelength scan or time course
1. Press Recall Data in the Main Menu and then Wavelength
Scan or Time Course.
A listing of the stored data is displayed.
2. Highlight any data to delete.
3. Press Delete in the "Options" menu and press OK to
confirm.
5.3.4 Data analysis
Consistent use of the sample ID function is necessary for all data
analysis functions. Only data with identical sample IDs can be
used in data analysis functions.
Use the Trends function to display a time-variation curve for the
stored readings for each parameter and location. The
concentration of the the corresponding parameter is shown
graphically over time.
50
Use the Ratio function to monitor the parameter relationships at a
particular location and display them in a graph.
Use the Interference Check function to display analyses with the
same sample IDs and unfavourable levels of ion interference.
Page 51

5.3.4.1 Trends
Standard programs
1. Select Recall Data > Data analysis.
2. Choose Trends and press OK to confirm.
Alternatively, choose Trends from the toolbar.
3. Press Options > New.
4. Select the required parameter and press Next to confirm.
5. Select the required sample ID and press Next to confirm.
6. Select the required operator ID and press Next to confirm.
51
Page 52

Standard programs
7. Select the required data analysis interval, or the start- and
end date and confirm with Next.
8. Set an upper and lower control limit and confirm with Next.
5.3.4.2 Ratios
9. In Tren d Set ting s all selected functions are shown. Press
OK to confirm.
10. Select the required trend with the created settings from the
list. Press Select.
The trend can be displayed in several formats, as a line or a
point.
11. Select Information to call up an overview of the parameter
information.
12. Select Options > Add Data to add more readings to the
trend.
13. Select Options > Ratio:Off to activate the Ratio function.
The ratio corresponds to the first row of readings selected.
52
The Ratios function is based on a unique allocation of the
samples to a sample location with the optional accessories "LOC
100 RFID Locator" and "RFID Sample ID Kit". The precise
sample location, date and time are assigned automatically. Ratio
analysis calculates a ratio between two or three parameters. The
last defined parameter is represented by 1. The first or second
parameters are calculated as a ratio against this, e.g. 4:2:1.
Page 53

1. Select Recall Data > Data analysis.
2. Select Ratios.
Standard programs
If a ratio analysis has already been carried out, a list of the
defined analyses will be displayed.
3. Press Options.
4. Press New, to define a new ratio analysis.
53
Page 54

Standard programs
5. Select the required sample ID and press Next to confirm.
6. Select parameter I with the greatest concentration and press
Next to confirm.
7. Select parameter II with the middle concentration and press
Next to confirm.
8. Select parameter III with the smallest concentration and
press Next to confirm.
54
Page 55

Standard programs
9. Select the required data analysis interval.
You can select between a fixed interval and an individually
adapted interval with start- and end date.
10. Press OK to confirm.
11. Choose an upper and lower control limit for the first and
second parameters and press Next to confirm.
12. In Ratio Settings you get all selected functions shown.
Press OK to confirm.
13. Select the ratio with the defined settings from the ratio
directory. Press Select.
A table with the defined values is shown.
Values outside the defined limits are displayed in red.
5.3.4.3 Interference Check (not available on all models)
The DR 6000 performs an automatic interfering ions check.
Typical interferences, such as chloride for nitrate, are detected
from defined concentrations and a warning note is shown. This
check is only carried out for barcode tests that are indicated with
identical sample IDs.
Example:
55
Page 56

Standard programs
5.4 Stored Programs
Analysis of ammonium with barcode test LCK303 and recording
of the readings. According to the LCK303 ion interference table,
nitrate concentrates > 50 mg/L will interfere with the analysis.
The instrument displays a warning if the same sample ID has a
value > 50 mg/L for nitrate.
1. Select Recall Data > Data analysis > Interference Check
to activate a check.
Over 200 pre-programmed processes can be recalled via the
Stored Programs menu. Stored Programs do not include any
barcode tests.
5.4.1 Select a saved test/method; entering user-specific basic data
1. Press Stored Programs in the Main Menu to view an
alphabetical list of stored programs with program numbers.
The "Stored Programs" list will appear.
2. Highlight the required test.
Note: Select the program by name or scroll through the list using the
arrow keys. Highlight the program or press Select by No. to search
for a specific program number. Press OK to confirm.
3. Press Start to run the program. The respective
measurement window is displayed.
Note: All corresponding data (wavelength, factors and constants) is
already preset.
4. Follow the chemical procedural instructions. Further
information, detailed user manuals and documentation are
available on the website of the manufacturer.
Note: To display the procedural instructions in the display, press the
info icon. This option is not available for all tests.
5.4.2 Stored programs options
56
1. Press Stored Programs in the Main Menu. Select the
required process and press Start.
2. Press Options to enter specific data. The following
describes the options Table 4.
Page 57

Table 4 Stored programs options
Options Description
More For further Options
Standard programs
Save icon
% Trans/Conc/Abs Switches from % transmittance to concentration or absorbance in reading mode.
Send Data icon
Timer icon
Dilution Factor Off/On
Standard Addition
Standard Adjust:
Off/On
Chemical Form Some of the stored tests/methods allow selection of the chemical form and measuring range.
Reagent Blank: Off/On
Save as User Program To store the selected parameters as a User Program, refer to section 6.1, page 79.
Depending on whether Instrument Setup > Data Log Setup > Auto Store: On or Off is selected,
the Save icon either calls up stored data or performs a manual save procedure.
To send data to a printer, network drive, computer or USB memory stick (USB type A or Ethernet
port)
This functions as a stopwatch. It helps to make sure that the steps of an analysis are correctly
timed (e. g. reaction times, wait times, etc., can be exactly specified). When the specified time has
elapsed, a sound is emitted. The use of the timer has no influence on the reading program.
A corrective dilution factor can be entered in order to take account of certain properties.
The number entered at the dilution factor prompt will be multiplied by the result to compensate for
the adjustment. For example, if the sample has been diluted by a factor of 2, enter 2. The default
setting of the dilution factor is turned off.
Note: During use of a dilution factor, the dilution symbol is shown on the display.
This option enables the accuracy of the measurements to be checked. The procedural instructions
for test parameters contain a detailed explanation of how to use this function.
The procedural instructions for test parameters indicate whether a standard adjustment is
necessary and, if so, how to proceed.
Some of the stored tests/methods include the "Reagent Blank" function. This enables the reagent
blank value to be added to or subtracted from, the subsequent readings. The reagent blank value
shifts the calibration curve along the y-axis, without changing the shape or gradient of the curve.
The effect corresponds to a y-axis intercept of the calibration straight line. This is clarified by the
following formula: concentration =[conc. factor) x Abs] - (reagent blank)
Multiple determination This option allows multiple measurements of a sample.
The "Reading Mode" function is available for some saved tests/methods.
Single Reading: A single reading is displayed when Read is pressed.
Reading Mode
Recall Data To recall saved measurement data or time courses, refer to section 5.3, page 42.
Instrument Setup
mode
Continuous Readings: After the zero measurement, all readings are displayed automatically and
continuously.
Carousel 1 inch square: Optional measurement of carousel insert with up to 5 square cells.
Carousel 1 cm square: Optional measurement of carousel insert with up to 7 square cells.
Basic data for the instrument, refer to section 5.2, page 25.
57
Page 58

Standard programs
5.4.3 Use of program timers
Some procedures do not require the use of timers. Other
procedures require several timers. These timers are
pre-programmed into each Stored Program, along with a
description of the activity to be performed during the timed period.
1. Press the Timer icon.
2. Press OK to start the first timer.
The timer will count down on the screen.
3. Press the Timer symbol and confirm with OK to start the
next activity with predetermined time for the stored program.
Note: Press Close to view the reading screen while the timer is
running. The time will be shown on the lower left side instead of the
date.
Note: Press Cancel to stop the timer midway through the
countdown.
Note: The timer will beep when the timed interval ends.
5.4.4 Set the dilution factor
A general purpose timer is also available in many programs. Tap
on the symbol for the timer and select General Timer. Enter the
length of the timed interval and press OK to start the timer. The
timer will beep when the timed interval ends.
The Dilution Factor function is used to calculate the original
concentration of a sample that has been diluted by a known ratio.
1. Press Options > More… > Dilution Factor.
The number entered at the dilution factor prompt will be
multiplied by the result to compensate for the adjustment.
For example , if the sample has been diluted by a factor of 2,
enter 2. The default setting of the dilution factor is turned off.
2. Press OK to confirm. Press again OK.
58
Page 59

5.4.5 Run a standard adjust
Standard programs
Note: During use of a dilution factor, the dilution symbol is shown on the
display.
Note: If using undiluted samples, set the dilution factor off again.
The Standard Adjust functions allows the calibration curve for a
stored program to be adjusted based on analysis of a known
standard solution. The Accuracy Check section of written
procedures often suggests a standard solution concentration for
this purpose.
1. Follow the entire procedure, using a known standard for the
sample.
5.4.6 Set the chemical form
2. After reading the concentration, press Options > More >
Standard Adjust.
3. Press On.
The "Current Reading" will show the concentration. The box
on the right will show the default standard value for the test,
as mentioned in the procedure.
4. To set the standard concentration, press the button and enter
the new value. Press OK to confirm.
5. Press Adjust to enable the Standard Adjust. The Standard
Adjust icon will appear.
Note: The adjustment must be within certain limits, which vary with
each program. The allowable percentage is shown after
"Adjustment“.
Some Stored Programs allow a variety of chemical forms to be
selected.
Press the result display on the unit (for example mg/L) or the
chemical representation of the evaluation form (for example
3+
Al
). A list of available evaluation forms appear. Select the
required form by pressing the corresponding entry in the list.
Note: When exiting the program, the evaluation form reverts to the
standard setting.
59
Page 60

Standard programs
5.4.6.1 Change of the default setting of the chemical form
1. In the result display, press Options > More > Chemical
Form.
2. A list of available evaluation forms appear. Select the new
default setting.
3. Press Save as Default.
The current result and all further readings will be displayed in the
new chemical form.
5.4.7 Run a reagent blank
Some of the stored tests/methods include the "Reagent Blank"
function. This enables the reagent blank value to be measured
and then taken into account in calculating the reading result.
Reading/analysis of a reagent blank:
1. Prepare the test corresponding to the
specification/procedural instructions. Use distilled water
instead of a sample to determine the reagent blank value.
2. Select the test. Insert the zero solution into the cell
compartment, if required by the procedural instructions.
Press Zero.
3. Insert the prepared sample cell into the cell compartment.
Press Read. The result will be displayed.
4. Press Options > More > Reagent Blank.
5. Press On to highlight the Reagent Blank function.
6. The concentration shown on the button is the reading of the
reagent blank. To use this value for more analyses of this
parameter, press OK.
7. To change the value displayed on the button, press the
button. Use the alphanumeric keypad to enter the new value.
8. Next press OK.
Note: The "Reagent Blank" function is deactivated when the reading
program is left. To use the same blank value later for other tests using
the same reagent lot, enter the value per step 7.
Note: The results calculated using the reagent blank value must lie
within the limits of the measuring range of the test/method.
60
Page 61

Note: The reagent blank icon is shown in the result display (refer to
arrow) when the function is active.
5.4.8 To carry out a multiple determination
A sample can be measured several times using the multiple
determination functions.
1. Before reading the concentration, press Options > More >
Multiple Determination.
2. Press On.
The number of the multiple determinations is shown under
"Measurements".
Standard programs
5.4.9 Selection of Reading Mode
3. To change the value displayed on the button, press the
button. Use the alphanumeric keypad to enter the new value.
Press OK to confirm.
4. The Multiple Determination icon will be shown on the display.
The Reading Mode functions enable the sample to be analyzed
with a single reading, continuous readings or with an optional
carousel insert (sample changer).
1. Before reading the concentration, press Options > More >
Reading Mode.
2. Select the required reading mode.
Select Single Reading to perform just one measurement
after Read is pressed.
Select Continuous Readings. After the zero measurement
the current measurement value is shown continuously,
without actuation of Read.
61
Page 62

Standard programs
Select Carousel 1 inch square to perform a series of
measurements in 1-inch square cells with an optional
carousel insert.
Select Carousel 1 cm square to perform a series of
measurements in 1-cm square cells with an optional carousel
insert.
Additional information can be found in the Carousel user
manual.
5.4.10 Standard Addition - monitoring/checking results
The accuracy of readings (their correspondence with the actual
concentration of the analyte in the sample) and their precision
(correspondence of the reading results obtained from several
samples containing the same concentration of the test analyte)
can be determined or improved using the standard addition
method
This method (also known as standard-addition or spiking) serves
to detect sample-specific faults:
• The analysis was compromised by substances or
interferences in the sample (sample matrix effect),
• defective measuring device,
• impure reagents.
Method:
Add a defined quantity (concentration) of the substance to be
tested to the sample as a standard solution. The detection rate
(concentration of the added standard solution) should be close to
100 %.
Detection rate =
Detection rate Conclusion
100 %
≠ 100 %
Reading of successful standard addition
Expanded value after successful standard addition
Probability that the reading results are correct
is high.
Assumption: The analysis was compromised
by substances or interferences in the sample
(sample matrix effect)
Test to determine whether a sample matrix
effect is present:
Use distilled water instead of the sample. Add
standard solution as described in the
procedure.
Detection rate Conclusion
Ions in the sample are
100 %
≠ 100 % No interference ions.
interfering with the
analysis, causing false
results to be obtained.
62
Page 63

Standard programs
Measures to identify other interference factors:
Checklist:
1. Check if the procedure is completed correctly:
a. Are the reagents added in the correct order?
b. Is enough time allowed for colour development?
c. Is the correct glassware in use?
d. Is the glassware clean?
e. Does the test require the sample to be at a certain
temperature?
f. Was the pH of the sample in the correct range?
g. Is the pipette volume correct?
2. Check the reagents. Repeat the standard additions using
fresh reagents.
Detection rate Conclusion
The originally used reagents were defective.
Check the standard solution:
100 %
Repeat the standard addition procedure with
a freshly prepared standard solution and
distilled water!
Detection rate Conclusion
5.4.10.1 Complete a standard addition
The originally used
100 %
standard solution
was deficient.
If none of these measures resolves the problem, please contact
the manufacturer.
Carry out the standard addition in accordance with the
corresponding procedure.
There are two different methods:
Maximum Volume (standard addition)
A defined volume of a standard solution of known concentration
is incrementally added to a previously tested sample and the
sample is newly measured after every standard addition.
Sample volume:
A defined volume of a standard solution of known concentration
is added to the volume of sample specified in the procedure and
the sample is measured after each addition. In most cases three
different standard solutions are prepared and the procedure is
repeated for each of them.
Note: The units and chemical forms used for the sample are used for the
standard solutions. Be careful to make sure that to use the correct units
for subsequent entries.
63
Page 64

Standard programs
Maximum Method Volume/Sample volume
1. Analyze a sample without added standard solution in
accordance with the instructions in the Procedures Manual.
When the reading is complete, leave the sample cuvette/cell
in the cuvette/sample cell compartment.
2. Press Options > More > Standard Addition.
An overview of the data of the standard addition procedure is
displayed.
3. Press OK to accept the standard values for standard
concentration, sample volume (total) and standard addition
volume.
4. Press Edit, to change these values.
5. Press the key of the value to change it. Use the
alphanumeric keypad to change the value.
6. Press Next to confirm.
7. Press the keys to change the standard addition volumes.
Use the alphanumeric keypad to enter the new data.
64
8. Press OK to confirm.
Page 65

Standard programs
Description of the table of readings
• The first column shows the standard addition volume. 0 mL
stands for the sample without added standard.
• The second column shows the reading of the samples with
and without added standard.
• The third column shows the detection rate of the added
standard.
Note: The blue highlighted line is active.
The measurement result of the sample without added
standard is automatically shown under 0 mL.
9. Prepare the standard addition solution as described in the
procedure.
10. Press the standard addition volume in the table.
11. Insert the cell with the respective addition volume into the
cell compartment.
12. Press Read.
Repeat the procedure with all the other standard addition
solutions.
13. After all the standard addition solutions have been
measured, press Graph.
The regression line through the standard addition data points
is displayed.
The correlation coefficient r
2
indicates how close the data
points are to the line.
If the correlation coefficient = 1, the curve is linear.
The concentration shown above the curve is the estimated
concentration of the sample without the added standard.
Note: In the Graph menu, the name on the Graph key switches to
Table. Press Table to display all the data in the table again.
14. Press Ideal Line to display the relationship between the
additions and the ideal line (detection rate 100 %).
65
Page 66

Standard programs
5.4.11 Analysis of samples
1. Press Stored Programs and select a program.
Note: If available, the procedural instruction is indicated on the
display via the Info icon.
2. Insert the zero solution cell into the cell compartment.
3. Press Zero.
4. Remove the zero solution cell from the cell compartment.
Insert the sample cell into the cell compartment.
5. Press Read. The result will be displayed.
Note: To define a sample dilution, press the Dilution key in the
toolbar.
6. For data storage, refer to section 5.3.1, page 42.
5.4.12 Update/Program tests
5.4.12.1 General advice for program update and edit
For a manual test update and for a new programming of a test,
refer to section 5.4.12.2, page 66 and section 5.4.12.3, page 67.
Note: Only in very few cases does the revision of a test require the test
specifications to be updated.
To update and edit barcode tests, refer to section 5.5.5, page 73.
5.4.12.2 Manual update of test data
When a test is selected the instrument automatically sets the
reading wavelength and factors.
Tests are continuously reviewed for simplified handling and to
make sure current legal requirements are followed. This can bring
with it a change of the work instructions or of the factors. If such
an alteration is indicated on the test packaging, update the
instrument data according to the working procedure inside the
new test packaging.
For updating from the Internet, refer to section 5.5.5.4, page 76.
66
Page 67

Standard programs
1. Press Stored Programs in the Main Menu and select a
program.
2. Press Program Options and then Edit.
The Data list of the corresponding test will appear.
The process specification of the corresponding test contains
the new data (Wavelength, Factors, reading Ranges,
Conversion Factor for chemical Form etc.).
3. Highlight the corresponding line in the data overview and
press Edit.
4. Press OK and then Store after editing the test.
5.4.12.3 Program a new test
1. Press Stored Programs in the Main Menu.
2. Press Program Options and then New.
3. Use the alphanumeric keypad to enter the Program Number
indicated in the working procedure.
An overview of the data for the test to be programmed is
displayed.
The process specification of the corresponding test contains
the new data (Wavelength, Factors, reading Ranges,
Conversion Factor for chemical Form etc.).
4. Highlight the line containing the test specification that is to be
programmed, then press Edit and enter the data in the
appropriate program lines.
5. Press OK and then Store after editing the test.
5.4.13 Add stored programs to the favorite programs list
The "Favorites" menu simplifies test selection by creating a list of
the most frequently used tests from the Stored Programs and
User Programs.
67
Page 68

Standard programs
1. Press Stored Programs in the Main Menu. The "Stored
Programs" list will appear.
2. Highlight the selection by pressing it or Select by Number to
search for the program by number.
3. Press Program Options.
4. Select Add to Favorites and confirm with OK.
The program can now be selected from "Favorite
Programs" menu in the Main Menu.
68
Page 69

5.5 Barcode Programs
5.5.1 Perform a barcode test
Standard programs
A special barcode reader in cell compartment #1 automatically
reads the barcode on the 13 mm cuvette/vial as the cuvette/vial
completes a single rotation. The instrument uses the barcode
identification to automatically set the correct wavelength for the
analysis and calculates the result immediately with the help of
stored factors.
In addition, readings are recorded at 10 different positions during
a rotation. A special outlier-elimination program is run and then
the average of the measured values is calculated. Cell and round
cell faults and contaminations are detected and therefore a very
precise result is determined.
1. Prepare the barcode test in accordance with the work
instruction and insert the cell into the cell compartment (1).
• When a coded cell is inserted into the cell compartment
(1) (Figure 3, Page 19), the corresponding measurement
program is automatically activated in the main menu.
• Otherwise select in the main menu the menu option
Barcode Programs and insert a zero cell (depending on
work instruction) into the cell compartment (1).
Note: To obtain further information on the Help Guide ("Information"
symbol), refer to Appendix A, Page 151.
The measurement is started automatically and the results are
shown.
Note: To define a sample dilution, press the Dilution key in the toolbar.
To evaluate other cell tests and other parameters insert the
prepared cell into the cell compartment and read off the result.
Note: The control bar, which is shown on the right on the display, shows
the relationship of the measurement result with the measurement range.
The blue bar shows the reading result independently of any dilution
factor that was entered.
69
Page 70

Standard programs
5.5.2 Select the chemical evaluation form
The chemical form of the test result of a number of parameters
can be selected individually.
1. In the result display, press the unit (e. g. mg/L) or the
chemical representation of the evaluation form (e. g.
PO
A list of available evaluation forms appears.
2. Select the required form from the list. Press OK to confirm.
Another way of changing the standard setting is:
1. In the result display, press Options > More > Chemical
Form.
A list of available evaluation forms appear.
2. Select the required chemical form and press OK to confirm.
Note: The selected chemical form is displayed, but does not
become the default. To change the default, refer to se ction 5.5.2.1.
3–
–P).
4
5.5.2.1 Change of the default setting of the chemical form
1. Insert the zero cell or sample cell (corresponding to the
process specification) into the cell compartment.
2. In the result display, press Options > More > Chemical
Form.
3. A list of available evaluation forms appear. Select the new
default setting.
4. Press Save as Default.
The current result and all further readings will be displayed in the
new chemical form.
5.5.3 Basic test-specific and sample-specific data settings
Press Options to change test or sample specific settings.
70
Page 71

Standard programs
Table 5 Barcode program options
Options Description
More For further Options
Save icon
Abs % Trans Switches from % transmittance to absorbance in reading mode.
Send Data icon To send data to a printer, computer or USB memory stick (USB A) or network.
Timer icon
Dilution Factor Off/On
Chemical Form Some of the stored tests/methods allow to select the chemical form and the measuring range.
Depending on setup under Instrument Setup > Data Log Setup > Auto Store: On or Off the
stored data is called up with the Save symbol or a manual save is performed.
This functions as a stopwatch. It helps to make sure that the steps of an analysis are correctly
timed (e. g. reaction times, wait times, etc., can be exactly specified). When the specified time
has elapsed, a sound is emitted. The use of the timer has no influence on the reading program.
A corrective dilution factor can be entered in order to take account of certain properties.
The number entered at the dilution factor prompt will be multiplied by the result to compensate
for the adjustment. For example, if the sample has been diluted by a factor of 2, enter 2. The
default setting of the dilution factor is turned off.
Note: During use of a dilution factor, the dilution symbol is shown on the display.
Note: If undiluted samples are used, set the dilution factor off.
The function "Reagent Blank" is available for several barcode tests. This enables the reagent
blank value to be added to or subtracted from, the subsequent readings. The reagent blank
Reagent Blank: Off/On
Edit To modify an existing program
Lot information All relevant manufacturing data is stored here.
Save as User Program To store the selected parameters as a User Program, refer to section 6.1, page 79.
Multiple determination This option allows multiple measurements of the same sample.
Reading Mode Barcode test function not available.
Recall measurement
data
Instrument Setup mode For basic instrument data, refer to section 5.2, page 25.
value shifts the calibration curve along the y-axis, without changing the shape or gradient of the
curve. The effect corresponds to a y-axis intercept of the calibration straight line. This is clarified
by the following formula: concentration =[conc. factor) * Abs] - (reagent blank)
Recall saved measurement data, wave-length scans or time courses, see section 5.3, page 42.
71
Page 72

Standard programs
5.5.4 Sample blank
Turbidity and colour in the sample matrix can falsify the results of
a photometric analysis. The interference factors come from the
sample or are created by reactions with the reagents.
The influence of turbidity and/or colour can be eliminated or
reduced by taking a sample blank reading.
After the sample reading has been carried out, a special cell
(LCW919) with the sample blank is inserted in the cell
compartment. Measurement is automatic. The value of the
sample measurement is then corrected through addition or
subtraction of the blank value. The end result is shown in the
display with the blank value correction icon.
With some tests the determination of a sample blank value is not
necessary, as during the test procedure turbidities and coloring
are already recorded.
Note: To obtain further information on the Help Guide ("Information"
symbol), refer to Appendix A, Page 151.
72
Page 73

Standard programs
5.5.5 Update/edit barcode tests
5.5.5.1 Update barcode tests with test packaging (not available on all models)
Using the data provided in the barcode, the instrument
automatically sets the reading wavelength and factors. If a
deviation in barcode data from the stored data is detected, the
instrument will require a data update and display the error
message "Barcode control number? Update program data!"
1. Hold the packaging of the barcode test with the RFID symbol
in front of the RFID module of the instrument.
A sound indicates the successful transfer of data; the test is
automatically assessed.
If the packaging is held in front of the RFID module a second
time, the current lot information of the test is shown in the
display. The test can be performed next according to the
process specification.
5.5.5.2 Manual update of a barcode test
Note: Only in very few cases does the revision of a test require all test
specifications to be updated.
The various data types that determine a barcode test are
described in Table 6.
Table 6 Program update options
Program point Description
Name Name of the analysis parameter
Version An abbreviation assigned by the user or the version number, etc. is entered here
Measurement process
Exact definition of the test: the number of wavelengths at which readings are carried out, the
number of absorbance readings needed, the keys to be used, any waiting periods between
readings, etc.
73
Page 74

Standard programs
Table 6 Program update options (Continued)
Program point Description
Formula Definition of the evaluation formulas with which the test result is calculated
The number of variables shown in the display depends on the definition of the measurement
Varia bles
Timer 1, Timer 2,
Timer 3, Timer 4
process and the formulas. Input of the numerical values of the wavelengths, factors, constants,
etc.
This function can be used to enter abbreviations and defined times for up to four timers.
Highlight the corresponding line and press Edit.
The timers are activated or deactivated with the control boxes on the left of the display. In the
next column, a selection can be made from a list of names that describe the corresponding work
step. In the third column, the times for each active timer are entered.
Enter the Name
Check the process specification in advance to determine whether
this point needs to be changed.
1. Highlight the line containing Name and press Edit. Use the
alphanumeric keypad to enter the name indicated in the
process specification.
2. Press OK to confirm.
Enter the Version
1. Highlight the line containing Version and press Edit. Use the
alphanumeric keypad to enter the name indicated in the
process specification.
2. Press OK to confirm.
Enter the measurement process
For detailed information on entering the measurement process,
refer to section 6.1.2, page 88.
Check the process specification in advance to determine whether
this point needs to be changed.
1. Highlight the Measurement process line in the data
overview and press Edit.
74
2. Press Edit, select the sequence to be edited and press
Delete.
3. Press New and use the alphanumeric keypad to enter the
process indicated in the process specification.
Page 75

Standard programs
Enter the Formula, Concentration Units, Designation,
Measuring Ranges
For detailed information on entering the Formula, refer to
section 6.1.2, page 88.
Check the process specification in advance to determine whether
this information needs to be changed.
1. Highlight the Formula line in the data overview and press
Edit.
2. Select the formula; press Edit, and enter the data (refer to
process specification) (for C1=, C2=, units, name,
measurement range limits, etc.). Press OK to confirm the
entry.
Enter the Variables (Factors, Wavelength and Coversion
Factors)
For detailed information on entering the Variables, refer to
section 6.1.2, page 88.
Check the process specification in advance to determine whether
this point needs to be changed.
1. Mark the Variables line in the data overview, and tap on
Edit.
2. Select the variable, tap on Edit, and enter the data (refer to
process specification) with the alphanumeric keypad (for F1,
F2, λ 1, U1 etc.). Confirm each entry with OK.
Abbreviation of Variables:
F1: Factor 1
F2: Factor 2
λ1: Wavelength 1
U1: Conversion factor 1 for the first chemical form
U2: Conversion factor 2 for additional chemical forms, etc.
.
Timer 1, Timer 2, Timer 3 and Timer 4:
The timers are activated or deactivated with the control boxes on
the left of the display. In the next column, a selection can be
made from a list of names that describe the corresponding work
step. In the third column, the times for each active timer are
entered.
3. When finished programming, press Store and then Cancel
to return to the "User Programs" menu.
4. Press Start to begin the test with the new data.
75
Page 76

Standard programs
5.5.5.3 Manual check/revision of test data
If an incorrect entry was made during the data update and is not
recognized via the barcode of the cuvette/sample cell (e. g. an
incorrect measuring range), another option is available for
checking and if necessary revising, the test data.
1. The device must show the "main menu".
2. Insert the zero cell or sample cell (corresponding to the work
3. Press Option\s > More > Edit.
4. Compare the displayed data with the data in the process
5.5.5.4 Update via the Internet
Alternatively, select in the main menu the menu option
Barcode Programs.
instruction) into the cell compartment (1).
A data overview is displayed, with the specifications of the
test that is to be revised.
specification and edit the displayed data in accordance with
the process specification.
Update via USB memory stick
To obtain the software for the update from the Internet at
www.hach-lange.com:
1. Go to http://www.hach-lange.com.
2. Select the country and go to Download\>Software.
3. Enter DR 6000 in the Search field.
4. Navigate to the corresponding file for download.
5. Save the file to a USB storage device or PC.
6. Press Instrument Update in the "System Check" menu.
7. Connect the USB memory stick to the USB port (type A) on
the instrument, refer to section 3.5, page 18.
8. Press OK. The link is established automatically and the
software is updated.
9. Press OK to return to the "System Check" menu.
Update via the web function
1. Connect the instrument to the network via an Ethernet cable.
76
2. Activate the Internet connection by selecting
Instrument Setup > PC & Printer (section 5.2.7.4,
page 37).
Page 77

5.5.5.5 Program a new test
Standard programs
3. Press Web Function on the toolbar.
4. Press Instrument Update.
The update will start automatically.
Note: When the instrument software has been updated, a prompt to
restart the instrument is displayed.
1. The instrument needs to be at the "Main Menu" or press
Barcode Programs in the Main Menu.
2. Insert the zero cell or sample cell (corresponding to the
process specification) into the cell compartment.
The message "Program not available" is shown, followed by
a data overview with the specifications of the test that is to be
revised.
The process specification of the corresponding test contains
the new data (Wavelength, Factors, Reading Ranges,
Conversion Factor for chemical form etc.).
3. Highlight the corresponding line including the specifications
of the test that is to be programmed and press Edit.
4. To finish programming, press Store and then Cancel to
return to the Main Menu.
5. Press Start to begin the test with the new data.
Note: Once the instrument has an active network connection, new
software versions are announced as they become available. An
instrument update can then be performed.
77
Page 78

Standard programs
78
Page 79

Section 6 Expanded programs
6.1 User programs
User programs provide the opportunity to complete "made to
measure" analysis.
The "User Programs" database is empty when the instrument
leaves the factory and is used to accommodate programs created
by users for specific needs. User programs with 13 mm round
cells can only be performed with the empty cells LCW906. Here
are a few examples of entries:
• Programming of user-created procedures.
The analysis procedure must be developed first, before it can
be programmed. The user must define or determine the
program sequences, absorbance formulas, reading
wavelengths, factors, measuring range limits, etc.
• Modified tests
• Assignment of user programs to the "Favorites" menu for
frequently used tests.
• Creation of a specific selection of methods and tests.
1. Select User Programs in the "Main Menu"
2. Select Program Options.
The Program Options menu contains several input and editing
options (Tab le 7):
Table 7 Program options for user programs
Options Description
Select New to program a new user program.
New
Add to favorites Select Add to favorites to add an existing user program to the Favorites list.
Edit Select Edit to modify an existing program
Delete
Note: The first time Program Options is selected, only the New option is available. The other
options remain inactive (grey) until the first program has been created.
Select Delete to remove a program from the list of user programs. The program will be
simultaneously deleted from the Favorites list.
79
Page 80

Expanded programs
6.1.1 Program a user method
All input steps and their significance and options are explained in
the following sections.
1. Select New in the "Program Options" menu.
Program Number:
The program number is a specific test number, with which the
program can subsequently be called up from the selection list in
the User Programs menu or the Favorites menu.
2. Use the alphanumeric keypad to enter a program number
between 9000 and 9099. The lowest available number
appears automatically.
3. Press OK.
Note: Should a program number already be assigned to another
user program, the query occurs as to whether the existing program
should be replaced. If you tap on OK, the existing program is
overwritten.
Program Name:
4. Enter a program name via the alphanumeric keypad. The
name can be a maximum of 28 characters long.
5. Press Back to go back to the previous program point or
press Next to continue with the input of the program data.
Program type:
6. Select the required program type (Table 8) and press Next.
7. If the options Single Wavelength (section 6.1.1.1, page 81)
or Multi-Wavelength (section 6.1.1.2, page 82) are
selected, define the programming parameters:
• Unit
• Wavelength
• Calculation formula
• Wavelength λx
80
• Concentration factor Kx
• Concentration solution
• Chemical form
• Calibration equation
For more information on free programming parameters refer to
section 6.1.2, page 88.
Page 81

Table 8 Program descriptions
Program type Description
Single Wavelength Readings at a defined wavelength
Multi Wavelength
Free programming
In the Multi Wavelength mode, absorbance values can be measured at up to four wavelengths
and the results can be mathematically processed to obtain sums, differences and relationships.
A high degree of flexibility results in individual options to create a user program. The free
programming is an expanded form of test or method programming.
6.1.1.1 Single wavelength settings
The following parameters can be defined when selecting the
single wavelength mode:
Units:
1. Select the required unit from the list.
2. Press Continue.
Note: Units of measure not included in this list can be added in the edit
program under Program Options, Edit. Select Units, Edit and then
New.
Expanded programs
Wavelength (single wavelength program type):
1. Enter measured wavelength.
A wavelength in the range of 190–1100 nm can be entered.
2. Press Continue.
Concentration resolution (number of decimal places)
1. Select the required number of decimal places to be
displayed after the decimal point from the displayed list.
2. Press Continue.
81
Page 82

Expanded programs
6.1.1.2 Multi wavelength settings
Chemical form:
1. Enter the chemical formula used in the display to represent
the analysis parameter.
2. Press Continue.
Note: For subsequent programming steps, refer to section 6.1.1.3
onwards.
When selecting the Multi-Wavelength mode, the following
parameters can be defined:
Units:
1. Select the required unit from the list
2. Press Continue.
Note: User-specific units not included in this list can be added in the edit
program under Program Options, Edit. Select Units, Edit and then
New.
Absorbance formula (Multi Wavelength program type):
Define the wavelengths and the coefficients used in the formula.
The absorbance formula defines the calculation for the multi
wavelength reading.
1. Press Formula.
2. Select the formula relevant to the programming from the
displayed list.
3. Press OK to confirm the selection.
List of the available absorbance formulae
A
refers to the absorbance at wavelength 1
1
A
refers to the absorbance at wavelength 2, etc.
2
K
refers to the coefficient at wavelength 1
1
K
refers to the coefficient at wavelength 2, etc.
2
If a subtraction has to be performed, the factors can be entered
with a minus sign.
82
Page 83

Wavelength λx:
Expanded programs
1. Press the λ
buttons.
x
The number of wavelengths results from the calculation
formula.
2. Enter the required wavelengths.
3. If necessary, repeat until all values for the formula have been
entered.
The entered wavelengths must be in the range from
190-1100 mm.
4. Press OK to confirm.
Concentration factor K
x
The concentration factor Kx is a multiplication factor to convert
absorbance values into concentration values.
1. Press the K
buttons.
x
The number of the concentration factors results from the
calculation formula.
2. Enter the required factor.
3. If necessary, repeat until all the values for the formula have
been entered.
4. Press OK to confirm.
5. Press Continue.
Note: Up to 5 digit place values can be entered. A maximum of 4
decimal places are possible.
Concentration resolution (number of decimal places)
1. Select the required number of decimal places to be
displayed after the decimal point from the list.
2. Press Continue.
Chemical form:
1. Enter the chemical formula used in the display to represent
the analysis parameter.
2. Press Continue.
83
Page 84

Expanded programs
6.1.1.3 Calibration settings for single and Multi Wavelength mode
A method is calibrated by determining the absorbance values of
several standard solutions of known concentration.
Create and save a calibration curve by entering values or
measuring standards or entering formulas (Table 9).
Table 9 Calibration settings
Option Description
Create a calibration table by entering the concentration values and the corresponding
Enter values
Measure standards
Enter formula
absorbance values of the standard solutions be measured. The absorbance values are applied
in a diagram against the concentrations of the standard solutions. The calibration curve is
graphically presented (page 84).
Create a calibration table by entering the concentration values of the standard solutions to be
measured and then determining the corresponding absorbance values by measuring the
standard solutions. The absorbance values are applied in a diagram against the concentrations
of the standard solutions. The calibration curve is graphically presented (page 85).
If it is possible to determine the calibration curve from the mathematical relationship between
concentration and absorbance through linear regression or another curve adaptation, the
respective formula (linear, polynomial 2nd or 3rd order can be selected from a list and the
corresponding factors can be entered (page 86).
Calibration by "Enter values"
1. Select Enter values.
2. Press Continue.
3. Press +.
4. Enter the standard concentration.
5. Press OK to confirm.
6. Enter the corresponding absorbance value.
7. Press OK to confirm.
8. If necessary, repeat until all values have been entered.
Note: To change a value in the table, mark the corresponding row. Press
the key of the unit (e. g. mg/L) or Abs. Enter the changed value.
84
Page 85

Expanded programs
9. Press Next.
The entered data is shown as a calibration curve.
Note: The correlation coefficient (r2) is shown on the left below th e
axes.
The linear equation corresponds to the standard setting.
10. Press Next graph.
The presentation changes to polynomial curve of the second
order.
11. Press Next graph.
The presentation changes to polynomial curve of the third
order.
12. Press Force 0 to change the setting from Off to On. The
curve then passes through the origin of the coordinate
system.
Note: This can have a detrimental effect on the correlation
coefficient (r
2
).
13. Tap on Back to go back to the values table, or on Done to
go to the methods overview.
14. Go to section 6.1.1.4, page 87.
Calibration using "Measure standards"
1. Press Measure standards.
2. Press Continue.
3. Press +.
4. Enter the standard concentration.
5. Press OK to confirm.
6. If necessary, repeat until all values have been entered. A
maximum of 24 values can be entered.
Note: To change a value in the table, mark the corresponding row.
Press the key of the unit (e. g. mg/L). Enter the changed value.
Note: For 13 mm round cells, a 10-times rotary measurement is
automatically performed.
7. Insert the zero solution into the cell compartment.
8. Press Zero.
9. Mark the row with the first standard concentration and insert
the respective cell.
10. Press Read.
11. If necessary, repeat until all standard solutions are
measured.
85
Page 86

Expanded programs
The entered and measured data is shown in the table.
Note: If you want to delete a standard concentration, activate the
corresponding line and tap on the Delete symbol. For 13 mm round cells,
a 10-times rotary measurement is automatically performed.
12. Press Graph.
The entered and measured data is shown as a calibration
curve.
Note: The correlation coefficient (r2) is shown on the left below the
axes.
The linear equation corresponds to the standard setting.
13. Press Next graph.
The presentation changes to polynomial curve of the second
order.
14. Press Next graph.
The presentation changes to polynomial curve of the third
order.
15. Press Force 0 to change the setting from Off to On. The
curve then passes through the origin of the coordinate
system.
Note: This can have a detrimental effect on the correlation
coefficient (r2).
16. Tap on Back to go back to the values table, or on Done to
go to the methods overview.
17. Go to section 6.1.1.4, page 87.
Calibration using "Enter formula"
1. Press Enter formula.
2. Press Continue.
86
Page 87

6.1.1.4 Store a user program
Expanded programs
3. Press the Formula key.
A list of available formulas (linear and 2nd and 3rd order
polynomial order) is displayed. Up to 4 coefficients can be
entered, depending on the selected formula.
4. Press the required formula.
According to the selected formula, the required factors (a, b,
c...) are shown.
5. Press the factors keys and enter the corresponding values.
6. Press Done to confirm each factor entry.
Note: The coefficients can have 5 digits and can have a positive or a
negative sign.
7. Press OK to confirm.
The input of the basic data is complete. An overview of the
variable program data is shown on the display.
1. To enter further specifications or make changes, activate the
corresponding line and tap on Edit.
2. Select Store to save the user program. Tap on Exit to go
back into the main menu.
6.1.1.5 Additional user-defined parameters and functions
In addition to the previously defined basic data, additional
parameters and functions can be defined for user programs:
• measuring range upper and lower limits
• timer functions
• chemical forms
Upper and lower limits of the measuring range
It is possible to enter a maximum (upper) and minimum (lower)
reading value. An error message is displayed if a reading is
above the upper limit or below the lower limit.
1. Mark the Upper limit or Lower limit row.
2. Press Edit.
3. Select On.
4. Press 0.000 and enter the measuring range limit.
5. Press OK to confirm.
87
Page 88

Expanded programs
Timer 1 / Timer 2 / Timer 3 / Timer 4:
Up to four time intervals can be defined as timers with this
function. Descriptions of the individual work steps, such as
shaking, waiting, and stirring can be allocated to the timers.
1. Mark the Timer x row.
2. Press Edit.
Activate or deactivate the timers using the check box in the
lower area of the display.
3. Activate a timer.
4. Press Timer.
5. Select the designation from the displayed list that describes
the respective process and confirm with OK.
6. Press 00:00.
7. Enter the required time interval (in mm:ss) and confirm with
OK.
Chemical form 2 / chemical form 3 / chemical form 4:
If a chemical form 1 was defined, up to three additional
alternative forms can be entered.
1. Mark the Chemical form x row.
2. Press Edit.
3. Press the left key to enter an additional chemical form.
4. Press OK to confirm.
5. Press the right key to enter the conversion factor for this
6. Press OK to confirm.
7. Press Store to save the program data. Press Cancel to
6.1.2 "Free programming" program type
Free programming is an advanced option for entering original
user-developed methods. The data overview contains the
specifications of the programmed tests. Each entry option can be
activated by pressing the respective row and can be changed
using Edit (refer to Table 10).
Activate or deactivate the chemical form using the check box
in the left area of the display.
additional chemical form.
return to the Main Menu.
88
1. Select New in the "Program Options" menu.
Page 89

Expanded programs
Program Number:
The program number is a specific test number, with which the
program can subsequently be called up from the selection list in
the User Programs menu or the Favorites menu.
2. Enter a program number between 9000 and 9099. The
lowest available number appears automatically.
3. Press OK.
Note: Should a program number already be assigned to another
user program, the query occurs as to whether the existing program
should be replaced. If you tap on OK, the existing program is
overwritten.
Program name:
4. Use the alphanumeric keypad to enter a program name. The
name can be a maximum of 28 characters long.
5. Press Back to go back to the previous program point or
press Next to continue with the input of the program data.
Program type:
6. Select Free programming and then press Continue.
7. Highlight the line containing the program point that is to be
edited or defined and press Edit.
89
Page 90

Expanded programs
Table 10 Definitions of the program points
Program point Description
Name Name of the analysis parameter
Version An abbreviation or version number assigned by the user is entered here.
Exact definition of the test: the number of wavelengths at which readings are carried out, the
Measurement process
Formula Definition of the formulas with which the test result is calculated.
Varia bles
Timer 1, Timer 2,
Timer 3, Timer 4
6.1.2.1 Measurement process
number of absorbance readings needed, the keys to be used, any waiting periods between
readings, etc.
The number of variables shown in the display depends on the definition of the measurement
process and the formulas. Input of the numerical values of the wavelengths, factors, constants,
etc.
This function can be used to enter abbreviations and defined times for up to four timers.
Highlight the corresponding line and press Edit. The timers are activated or deactivated with the
control boxes on the left of the display. In the next column, a selection can be made from a list of
names that describe the corresponding work step. In the third column, the times for each active
timer are entered.
The measurement process defines the handling and the readings
of the test:
• At which and how many wavelengths should readings be
• How many absorbance readings must be completed?
• When should the zero reading and the sample reading be
• Are waiting times necessary between readings?
• Should individual program sequences be repeated?
The elements of a measuring sequence, such as zero and
sample readings and the timers (reaction times, waiting times
etc.) are individually defined.
6.1.2.2 Enter a new measurement process
Note: Each component of the measurement process must be entered in
the order in which it will be completed.
[Z] key / Zeroing...
1. Press [Z] to program a zero reading.
completed?
completed?
90
2. Press Zeroing and enter the wavelength for which the zero
reading is to be performed.
3. If zero readings are to be carried out at a number of
wavelengths, repeat the steps starting with 1 for each
wavelength.
Note: The entered reading sequence is displayed.
Page 91

Expanded programs
Process Timer key
1. Tap on the Process Timer key to enter wait-, reaction- or
handling times.
2. Tap on OK and confirm the entry.
Note: This time is integrated into the measurement process.
Note: The entered reading sequence is displayed.
[R] key / Reading...
1. Press [R] to program a reading of the substance that is to
be analyzed.
2. Press Reading... and enter the wavelength to be used for
the measurement.
3. If readings are to be completed at a number of wavelengths,
repeat the steps starting with 1 for each wavelength.
Note: The entered reading sequence is displayed.
Key { }
Elements of the reading sequence that are to be repeated are
placed in brackets.
The left bracket "{"marks the start of the sequence that is to be
repeated and the right bracket "}" marks the end.
Note: The button with the right parenthesis remains inactive until a left
bracket is entered.
1. To start the repetition sequence tap on {.
2. Tap on the key that defines the sequence to be repeated: [Z]
or [R].
3. Tap on the key Zeroing... or Reading... and enter the
wavelength to be used for the measurement. Define
additional steps that are to be included in the repetition
sequence.
4. Press }.
5. Once the measurement process has been defined, click
Next.
Alternate entry of measurement process via function list
A pre-programmed selection can be accessed and edited via
List.
91
Page 92

Expanded programs
1. Click on List.
2. Select the required measurement process.
• [Z]Z1λ
{ [R]R1λ1}: Zero measurement, repeated
1
single-wavelength measurement.
• [Z]Z1λ
[R]R1λ1: Zero measurement with subsequent
1
measurement on one wavelength.
• [Z]Z1λ
[R]Z2λ1 {[R] R1λ1}: Two zero measurements,
1
repeated measurement on one wavelength. For
example, zero measurement against air, zero
measurement against sample blank value, measurement
of sample.
• [Z]Z1λ
[R]R1λ1 [R] R2λ1: Zero measurement, two
1
measurements on one wavelength. For example, zero
measurement, measurement of sample with reagent 1,
measurement of sample with reagent 2.
• [Z]Z1λ
Z2λ2 [R] R1λ1 R1λ2: Two dual-wavelength zero
1
measurements, two dual-wavelength measurements of
sample.
3. Press OK.
4. Input the wavelength and press OK to confirm.
The wavelength is displayed in the measurement process.
5. Press Next.
6.1.2.3 Enter the calibration formula (evaluation formula)
The calibration formula (evaluation formula) defines the
calculation and display of intermediate and final results. The
previously defined elements of the measuring sequence are the
basis for calculating the concentrations.
Refer to Tab l e 11 for detailed information on the Edit formula
keys.
Note: The evaluation formula is built up successively in the display in
accordance with the input.
Note: The key with the arrow deletes the last entered section of the
equation.
92
Page 93

Table 11 Description of the keys for the editing of formulae
Display Key Description
Press the Abs/Variables key to select, from the
displayed list, the required element of the defined
measuring sequence and therefore the corresponding
reading wavelength, so that this can be taken into
Abs/Variables
account in the formula.
Zn represents the zero measurement at wavelength n,
Rn the measurement at wavelength n, Fn the factors for
calculation and Un the factors for conversion, for
example between two different chemical formulae.
Expanded programs
+ –
÷ ×
Press + –
Select the operation and press OK to confirm.
The available choice of mathematical operations
depends on the defined formula.
This means that functions such as "( )" or "ln"/"log" etc.
are only active if a term in parentheses or the calculation
of a logarithm is mathematically permissible in the
defined formula (this also applies to the basic
mathematical operations).
The following mathematical operations are available:
÷ × to enter a mathematical operation.
• + (Addition)
• - (Subtraction)
• ÷ (Division)
• × (Multiplication)
• ^ (Exponent)
• Ln (Natural logarithm)
• Log (Common logarithm)
New Number Press New Number to enter a new factor or constant.
93
Page 94

Expanded programs
Table 11 Description of the keys for the editing of formulae (Continued)
Display Key Description
Press >=< to include logic statements/links/conditions in
the formula. The following functions are available:
= (Equal to), < (Less than), > (Greater than), <= (Less
than or equal to), >= (Greater than or equal to), IF,
THEN, ELSE
>=<
When the evaluation formula C1 has been entered
completely, press OK to confirm. Press OK again to
return to the Formula display.
When the formula C1 has been entered and confirmed,
the parameter name, upper and lower limits of the
measuring range and display result (yes, no) can be
entered.
1. Press Next and enter the unit for C1.
2. Press Next and enter the designation for C1.
3. Press Next and decide whether an upper or lower limit must
be defined.
If yes, press On and define the upper or lower limit with the
corresponding key. Press OK to confirm.
94
Page 95

Expanded programs
4. Press Next and define the results display.
Enter the next calibration formula (C2 or Cn)
In addition to the keys described in Table 11, a further function is
now available: Select Conc..
5. If a previously defined formula, in this case C1, is to be taken
into account in the formula for C2, press Select Conc.
6. Enter the numbering for the equation (for example, 1 for C
7. Press OK to confirm the entry. C
mathematical operation.
Note: The Cn concentrations that are to be calculated are numbered
in sequence: C
Note: Whenever a Cn formula is defined, the Formula list is
automatically increased by C
8. Once the formula has been entered, define the unit,
designation, upper and lower limit and display of the formula
as done previously for C1.
9. Once all necessary formulae have been defined, press
Done.
6.1.2.4 Enter an amount during a measurement
If the application program used requires the amount of the
sample to be factored into the calculation during analysis,
proceed as follows:
1. The amount is selectable via the Abs/Variables list or can
alternatively be entered via the keypad.
, C2, C3 etc.
1
n+1
can now be linked with a
n
.
).
1
2. From the data overview, select Formula and press Edit.
95
Page 96

Expanded programs
3. From the list, highlight a free, as yet undefined formula. :Off
is shown after free formulae in the list.
4. Press Edit.
5. Enter the formula for the calculation of the amount, see
below.
The Result (for example in mg/L) is listed under Select Cn.
The amount is found under Abs Variables.
6. During execution of the methods you will be asked to enter
the amount and the result is calculated accordingly.
7. Press OK to confirm.
8. Once the formula has been entered, define the unit,
designation, upper and lower limit and display of the formula
as done previously for C1.
9. Once all necessary formulae have been defined, press
Done.
Please note the following for the input of amounts and calculation
of the end result:
Enter the following formula to calculate the weight-specific result:
C
= (C
x
(mg/L result)
x 10) / C
y(amount)
Amount: in g/100 mL
If during the analysis there is a prompt to enter the amount of the
sample, enter the value in g/100 mL.
The concentration of the displayed result will then be
g analyte/100 g amount.
Note: The analyte is dissolved in 100 mL. The test result is first
established as a concentration in mg/L. The result is based on a volume
of 1 liter by a factor of 10/amount and the result expressed as a
concentration in g/100 g.
96
Page 97

6.1.2.5 Enter variables
1. Mark the Variables row in the data overview.
2. Press Edit.
3. Select the variable to be edited.
4. Press Edit and enter the data (refer to process specification)
(for F1, F2, λ1, U1 etc.)
5. Press OK to confirm each entry.
Abbreviation of Variables:
F1: Factor 1
F2: Factor 2
λ 1: Wavelength 1
U1: Conversion Factor 1 for the first chemical form
U2: Conversion Factor 2 for an additional chemical form etc.
6.1.2.6 Save a free programming user program
Expanded programs
1. Press Store to save the entered data.
The data can be stored under any data point (measurement
sequence, formula, timer, etc.).
6.1.3 Select a user program
1. Press User Programs in the Main Menu.
An alphabetical list of user programs with program numbers
is displayed.
Note: Use the scroll bar to scroll through the list quickly.
Note: Highlight the selection by pressing it or Select by Number to
search for the program by number.
2. Press Start to run the program.
6.1.4 Add, edit and delete user programs from the favorites list
The most frequently used tests/methods in the "User Programs"
menu can also be added to the list of favorites to simplify their
selection.
97
Page 98

Expanded programs
1. Press User Programs in the Main Menu.
The User Programs list will appear.
2. Highlight the selection by pressing it or Select by Number to
search for the program by number.
3. Press Program Options.
Use Add to Favorites to add the selected program to the
Favorites list.
Use Edit to edit the selected program.
Use Delete to delete the selected program.
Note: If the stored program is deleted in User Programs, it will also
be deleted in Favorites Programs.
6.1.4.1 Add to Favorites
6.1.4.2 Edit
1. Press Add to Favorites.
2. Press OK to confirm.
The program is added to the Favorites.
1. Press Edit.
2. Press OK to confirm.
A data overview that contains the specifications of the
programmed test is shown. More information can be found
about the input options in section 6.1.2, page 88. To call up or
to edit entered or measured values, choose "Calibration" and
press Edit.
98
Page 99

6.1.4.3 Delete program
6.2 Favorites
Expanded programs
1. Press Delete.
2. Press OK to confirm.
The program will be deleted from the list of user programs.
Note: If the stored program is deleted in User Programs, it will also
be deleted in Favorites Programs.
The most frequently used tests/methods in the Stored Programs
menu and the User Programs menu can also be added to the list
of favorites to simplify their selection.
To add Stored Programs and/or User Programs to the favorites
list or the favorite programs, refer to section 6.1.4, page 97.
6.2.1 Recall a favorite program
6.2.2 Delete a favorite program
1. Press Favorite Programs in the Main Menu.
The "Favorite Programs" list will appear.
2. Highlight the selection by pressing it.
Note: Use the scroll bar to scroll through the list quickly.
Note: Press Select by Number to search for the program by
number. Use the alphanumeric keypad to enter the test number
(program number) and confirm the input by pressing OK.
3. Press Start.
1. Press Favorite Programs in the Main Menu.
The "Favorite Programs" list will appear.
2. Highlight the selection by pressing it.
Note: Use the scroll bar to scroll through the list quickly.
Note: Press Select by Number to search for the program by
number. Use the alphanumeric keypad to enter the test number
(program number) and confirm the input by pressing OK.
3. Press Remove program.
99
Page 100

Expanded programs
4. Press OK to confirm.
Note: If a Favorite Program is deleted, it will stay in the User
Programs or Stored Programs.
Note: If the stored program is deleted in User Programs, it will also
be deleted in Favorites Programs.
6.3 Single Wavelength (absorbance, concentration and transmittance readings)
The Single Wavelength mode can be used in three ways. For
sample readings at a single wavelength, the instrument can be
programmed to measure the absorbance, % transmittance or
concentration of the analyte.
• Absorbance readings: The light absorbed by the sample is
measured in absorbance units.
• % Transmittance measures the percent of the original light
that passes through the sample and reaches the detector.
• Turning on the concentration factor allows selection of a
specific multiplier for converting absorbance readings to
concentration. In a graph of concentration versus the
absorbance, the concentration factor is the slope of the line.
6.3.1 Set up Single Wavelength mode
1. Press Single Wavelength in the Main Menu.
2. Press Options for Parameter Setup.
Table 12 Options for Single Wavelength
Options Description
More For further Options
Recall measurement
data symbol
Recall saved measurement data, wavelength scans or time courses, refer to section 5.3,
page 42.
% Trans/Abs Switches from % transmittance to concentration or absorbance in reading mode.
λWavelength
Timer icon
To input the wavelength setting. Use the alphanumeric keypad to enter the reading wavelengths.
A wavelength in the range of 190–1100 nm can be entered.
This functions as a stopwatch. It helps to make sure that the steps of an analysis are correctly
timed (e. g. reaction times, wait times, etc., can be exactly specified). When the specified time
has elapsed, a sound is emitted. The use of the timer has no influence on the reading program.
100
 Loading...