

Page 1

DOC022.52.00782
DR 3800
USER MANUAL
July 2007 Edition 1
©Hach Lange GmbH, 2007. All rights reserved. Printed in Germany.
sd/sk
Page 2

2
Page 3

Table of contents
Section 1 Specifications ........................................................................................................................................ 7
Section 2 General Information .............................................................................................................................. 9
2.1 Safety information .............................................................................................................................................. 9
2.1.1 Use of hazard information ......................................................................................................................... 9
2.1.2 Precautionary labels ................................................................................................................................. 9
2.1.3 Class 1 LASER ......................................................................................................................................... 9
2.1.4 Chemical and Biological Safety .............................................................................................................. 10
2.2 Overview of product ......................................................................................................................................... 10
Section 3 Installation ........................................................................................................................................... 11
3.1 Unpack the instrument ..................................................................................................................................... 11
3.2 Operating environment .................................................................................................................................... 11
3.3 Power connections ........................................................................................................................................... 11
3.4 Interfaces ......................................................................................................................................................... 13
3.5 Cell compartments, cuvette/sample cell adapters, light shield and Adapter Box ............................................. 14
3.5.1 Cell compartments and adapters ............................................................................................................ 14
3.5.2 Installation of the cuvette/sample cell adapters ...................................................................................... 15
3.5.3 Use of the light shield for measurements ................................................................................................ 17
3.6 Adapter Box ..................................................................................................................................................... 18
3.7 Beam path ........................................................................................................................................................ 19
Section 4 Start Up ................................................................................................................................................ 21
4.1 Power the instrument on and off ...................................................................................................................... 21
4.2 Language selection .......................................................................................................................................... 21
4.3 Self-Check ....................................................................................................................................................... 21
Section 5 Standard Operations ........................................................................................................................... 23
5.1 Overview .......................................................................................................................................................... 23
5.1.1 Tips for the use of the touch screen ........................................................................................................ 23
5.1.2 Use of the alphanumeric keypad ............................................................................................................ 23
5.1.3 Main Menu .............................................................................................................................................. 24
5.2 Instrument Setup mode .................................................................................................................................... 25
5.2.1 Operator ID ............................................................................................................................................. 25
5.2.2 Sample ID ............................................................................................................................................... 26
5.2.3 Date and time .......................................................................................................................................... 27
5.2.4 Display and sound preferences .............................................................................................................. 28
5.2.5 Lamp control ........................................................................................................................................... 28
5.2.6 PC and printer ......................................................................................................................................... 30
5.2.6.1 Printer setup ............................................................................................................................... 30
5.2.6.2 Print data .................................................................................................................................... 32
5.2.7 Password ................................................................................................................................................ 32
5.2.7.1 Deactivation password ................................................................................................................ 33
5.2.8 Select color ............................................................................................................................................. 34
5.3 Store, recall, send and delete data .................................................................................................................. 35
5.3.1 The data log ............................................................................................................................................ 35
5.3.1.1 Auto/manual data storage ........................................................................................................... 35
5.3.1.2 Recall stored data from the data log ........................................................................................... 35
5.3.1.3 Send data from the data log ....................................................................................................... 37
5.3.1.4 Delete stored data from the data log .......................................................................................... 37
5.3.2 Store, recall, send and delete data from wavelength scan and time course ........................................... 38
5.3.2.1 Data storage from wavelength scan or time course ................................................................... 38
5.3.2.2 Recall stored data from wavelength scan or time course ........................................................... 38
5.3.2.3 Send data from wavelength scan or time course ........................................................................ 39
5.3.2.4 Delete stored data from wavelength scan or time course ........................................................... 41
3
Page 4

Table of Contents
5.4 Stored Programs .............................................................................................................................................. 42
5.4.1 Select a saved test/method; entering user-specific basic data ............................................................... 42
5.4.2 Stored program options .......................................................................................................................... 42
5.4.3 Use of program timers ............................................................................................................................ 44
5.4.4 Set the reading mode .............................................................................................................................. 44
5.4.4.1 Take single wavelength measurements (single reading) ............................................................ 45
5.4.4.2 Take single wavelength measurements (continuous readings) .................................................. 45
5.4.5 Set the dilution factor .............................................................................................................................. 46
5.4.6 Run a standard adjust ............................................................................................................................. 46
5.4.7 Set the chemical form ............................................................................................................................. 47
5.4.7.1 Change of the default setting of the chemical form .................................................................... 48
5.4.8 Run a reagent blank ................................................................................................................................ 48
5.4.9 Analysis of samples ................................................................................................................................ 49
5.4.10 Update/edit tests ................................................................................................................................... 50
5.4.10.1 Manual update of test data ....................................................................................................... 50
5.4.10.2 Program a new test ................................................................................................................... 51
5.4.11 Add stored programs to the favorite programs list ................................................................................ 51
5.5 Barcode Programs ........................................................................................................................................... 52
5.5.1 Complete a barcode 13 mm test/vial ...................................................................................................... 53
5.5.2 Select the measuring range .................................................................................................................... 54
5.5.3 Select the chemical evaluation form ....................................................................................................... 54
5.5.3.1 Change of the default setting of the chemical form .................................................................... 54
5.5.4 Basic test-specific and sample-specific data settings ............................................................................. 55
5.5.5 Sample blank .......................................................................................................................................... 56
5.5.6 Update/edit barcode tests ....................................................................................................................... 56
5.5.6.1 Manual update of a barcode test ................................................................................................ 56
5.5.6.2 Update an existing barcode test ................................................................................................. 59
5.5.6.3 Program a new test ..................................................................................................................... 60
5.5.7 Update from the internet ......................................................................................................................... 61
5.5.8 Program an own barcode-readable applications with LCW 906 ............................................................. 61
5.5.8.1 Evaluation of barcode-readable appliaction with LCW 906 ........................................................ 62
5.5.8.2 Edit/delete of barcode-readable appliaction ............................................................................... 62
Section 6 Advanced Operations ......................................................................................................................... 65
6.1 User Programs ................................................................................................................................................. 65
6.1.1 Program a user method .......................................................................................................................... 65
6.1.1.1 Single wavelength settings ......................................................................................................... 67
6.1.1.2 Multi wavelength settings ............................................................................................................ 68
6.1.1.3 Calibration settings for single and multi wavelength mode ......................................................... 70
6.1.1.4 Store a user program .................................................................................................................. 74
6.1.1.5 Additional user-defined parameters and functions ..................................................................... 74
6.1.2 Free programming program type ............................................................................................................ 76
6.1.2.1 Measurement process ................................................................................................................ 76
6.1.2.2 Enter a new element of a measuring sequence ......................................................................... 77
6.1.2.3 Enter the calibration formula (evaluation formula) ....................................................................
6.1.2.4 Enter variables ............................................................................................................................ 82
6.1.2.5 Save a free programming user program ..................................................................................... 82
6.1.3 Select a user program ............................................................................................................................. 82
6.1.4 Add, edit and delete user programs from the favorites list ...................................................................... 82
6.1.4.1 Add to Favorites .......................................................................................................................... 83
6.1.4.2 Edit .............................................................................................................................................. 84
6.1.4.3 Delete ......................................................................................................................................... 84
.. 79
4
Page 5

Table of Contents
6.2 Favorite Programs ........................................................................................................................................... 85
6.2.1 Recall a favorite program ........................................................................................................................ 85
6.2.2 Delete a favorite program ....................................................................................................................... 85
6.3 Standard Addition – monitoring/checking results ............................................................................................. 86
6.3.1 Complete a standard addition ................................................................................................................. 87
6.4 Single Wavelength (absorbance, concentration and transmittance measurements) ....................................... 91
6.4.1 Set up single wavelength mode .............................................................................................................. 91
6.4.2 Take single wavelength measurements (single reading) ........................................................................ 93
6.4.3 Take single wavelength measurements (continuous readings) .............................................................. 93
6.5 Multi-Wavelength mode – measurements at more than one wavelength ........................................................ 94
6.5.1 Set the reading mode at different wavelengths ....................................................................................... 94
6.5.2 Complete a measurement in the multi wavelength mode ....................................................................... 97
6.6 Wavelength Scan mode – recording of absorbance and transmission spectrums .......................................... 98
6.6.1 Set up the wavelength scan .................................................................................................................... 98
6.6.2 Wavelength scan reading ..................................................................................................................... 101
6.6.2.1 Navigation of the wavelength scan graph or a wavelength scan analysis ................................ 102
6.6.3 Work with reference scans .................................................................................................................... 103
6.7 Time course of absorbance/transmittance ..................................................................................................... 105
6.7.1 Time course setup parameters ............................................................................................................. 105
6.7.2 Time course scan reading ..................................................................................................................... 106
6.7.3 Analysis of time course data ................................................................................................................. 107
6.7.3.1 Navigation of a time scan or a time scan analysis .................................................................... 108
6.8 System checks ............................................................................................................................................... 109
6.8.1 Instrument information .......................................................................................................................... 109
6.8.2 Upgrade of the instrument software ...................................................................................................... 110
6.8.3 Optical checks ....................................................................................................................................... 110
6.8.3.1 Wavelength check .................................................................................................................... 111
6.8.3.2 Noise check .............................................................................................................................. 111
6.8.3.3 Stray light check ....................................................................................................................... 113
6.8.3.4 Absorbance check .................................................................................................................... 114
6.8.3.5 Drift check ................................................................................................................................. 115
6.8.3.6 Verification kit ........................................................................................................................... 116
6.8.4 Output checks ....................................................................................................................................... 118
6.8.5 Lamp history ......................................................................................................................................... 118
6.8.5.1 Factory service ......................................................................................................................... 118
6.8.6 Service time .......................................................................................................................................... 119
6.8.7 Instrument backup ................................................................................................................................ 120
Section 7 Maintenance ...................................................................................................................................... 123
7.1 Cleaning requirements ................................................................................................................................... 123
7.1.1 Spectrophotometer ............................................................................................................................... 123
7.1.2 Display .................................................................................................................................................. 123
7.1.3 Cuvettes/sample cells ........................................................................................................................... 123
7.2 Lamp replacement ......................................................................................................................................... 124
7.3 Filter pad maintenance .................................................................................................................................. 126
7.3.1 Filter pad replacement .......................................................................................................................... 126
Section 8 Troubleshooting ................................................................................................................................ 129
Section 9 Replacement Parts ............................................................................................................................ 131
Section 10 Contact Information ........................................................................................................................ 133
Section 11 Warranty, liability and complaints ................................................................................................. 135
Appendix A Pour-Thru Cell ...............................................................................................................................137
5
Page 6

Table of Contents
A.1 Pour-Thru module specifications ................................................................................................................... 137
A.1.1 Pour-Thru Cell Assembly ...................................................................................................................... 137
A.2 Installation of the Pour-Thru module ............................................................................................................. 139
A.3 Use of the Pour-Thru Cell .............................................................................................................................. 140
A.4 Pour-Thru Cell Maintenance .......................................................................................................................... 141
Appendix B Help Guide ..................................................................................................................................... 143
B.1 Installation of the Help Guide ........................................................................................................................ 143
B.2 Use of the Help Guide ................................................................................................................................... 143
B.2.1 View the help guide for stored programs .............................................................................................. 143
B.2.2 View the help guide for barcode programs ........................................................................................... 145
Appendix C HACH Data Trans .......................................................................................................................... 147
Appendix D Thermal printer .............................................................................................................................. 149
Index .................................................................................................................................................................... 151
6
Page 7
Section 1 Specifications
Specifications are subject to change without notice.
Performance specifications
Operating mode Transmittance (%), Absorbance and Concentration
Source lamp Gas-filled Tungsten (visible)
Wavelength range 320–1100 nm
Wavelength accuracy ± 1.5 nm (wavelength range 340–900 nm)
Wavelength reproducibility ≤ 0.1 nm
Wavelength resolution 1 nm
Wavelength calibration Automatic
Wavelength selection Automatic, based on method selection
Scanning speed ≥ 12 nm/s (in steps of 1nm)
Spectral bandwidth 5 nm
Photometric measuring range ± 3.0 Abs (wavelength range 340–900 nm)
Photometric accuracy
Photometric linearity
Stray light < 0.1% T at 340 nm with NaNO
Data log 1000 measured values (Result, Date, Time, Sample ID, User ID)
5 m Abs at 0.0 to 0.5 Abs
1% at 0.50 to 2.0 Abs
< 0.5% to 2 Abs
< = 1% at > 2 Abs with neutral glass at 546 nm
2
User programs 50
Physical and environmental specifications
Width 368 mm (14.5 in.)
Height 144 mm (5.7 in.)
Depth 359 mm (14.1 in.)
Weight 6.4 kg (14.11 Ib)
Operating requirements 10–40 °C (50–104 °F), max. 80% relative humidity (non-condensing)
Storage requirements –40–60 °C (-40–140 °F) max. 80% relative humidity (non-condensing)
Additional technical data
Mains connection
Interfaces
Enclosure rating IP3X
Circuitry Classification
DR 3800 connected with:
External power supply: 100–240V/50–60Hz (input); 15V/30VA (output)
Use only screened cables with maximum length of 3 meters.
1 x USB type A
1 x USB type B
Instrument: Class III
System: Class II
7
Page 8

Specifications
8
Page 9
Section 2 General Information
2.1 Safety information
Please read this entire manual before unpacking, setting up or
operating this equipment. Pay attention to all danger, warning and
caution statements. Failure to do so could result in serious injury to
the operator or damage to the equipment.
To ensure that the protection provided by this equipment is not
impaired, do not use or install this equipment in any manner other
than that specified in this manual.
2.1.1 Use of hazard information
DANGER
Indicates a potentially or imminently hazardous situation
which, if not avoided, will result in death or serious injury.
WARNING
Indicates a potentially or imminently hazardous situation
which, if not avoided, could result in death or serious injury.
CAUTION
Indicates a potentially hazardous situation that may result in
minor or moderate injury.
2.1.2 Precautionary labels
This symbol, if noted on the instrument, references the instruction manual for operation and/or safety information.
Electrical equipment marked with this symbol may not be disposed of in European public disposal systems after
12 August of 2005. In conformity with European local and national regulations (EU Directive 2002/96/EC),
European electrical equipment users must now return old or end-of life equipment to the Producer for disposal at no
charge to the user.
Note: For return for recycling, please contact the equipment producer or supplier for instructions on how to return
end-of-life equipment, producer-supplied electrical accessories and all auxiliary items for proper disposal.
This symbol indicates that the instrument contains a Class 1 LASER device.
LASER CLASS 1
Data: 0.3 mW; l = 650 nm
Important Note: Indicates a situation which, if not avoided, may
cause damage to the instrument. Information that requires special
emphasis.
Note: Information that supplements points in the main text.
Read all labels and tags attached to the instrument. Personal injury
or damage to the instrument could occur if not observed. A symbol,
if noted on the instrument, will be included with a danger or caution
statement in the manual.
2.1.3 Class 1 LASER
A Class 1 LASER is installed in this instrument. Class 1 LASERS
are products where the radiant power of the LASER beam
accessible (the accessible emission) is always below the Maximum
Permissible Exposure value. Therefore, for Class 1 LASERS the
9
Page 10

General Information
2.1.4 Chemical and Biological Safety
output power is below the level at which it is believed eye damage
will occur. Exposure to the beam of a Class 1 LASER will not result
in eye injury. Class 1 LASERS may therefore be considered safe.
However, Class 1 LASER products may contain LASER systems of
a higher Class but there are adequate engineering control
measures to ensure that access to the beam is not reasonably
likely. Examples of such products include LASER printers and
compact disc players. CDRH assession number 0510555-02.
Data: 0.3 mW; wavelength = 650 nm
DANGER
Potential Chemical/ Biological Exposure Hazards. Handling
chemical samples, standards and reagents can be dangerous.
Users of this product are advised to familiarize themselves
with safety procedures and the correct use of chemicals, and
to carefully read all relevant Material Safety Data Sheets.
Normal operation of this instrument may involve the use of
hazardous chemicals or biologically harmful samples.
2.2 Overview of product
• The user must observe all cautionary information printed on the
original solution containers and safety data sheet prior to their
use.
• All waste solutions must be disposed in accordance with local
and national law.
• The type of protective equipment must be selected according to
the concentration and amount of the dangerous substance at
the specific workplace.
The DR 3800 Spectrophotometer is a VIS spectrophotometer with a
wavelength range of 320 to 1100 nm. The instrument comes with a
complete set of application programs and multi-language support.
The DR 3800 Spectrophotometer contains the following application
modes: Stored Programs (pre-installed tests), Barcode Programs,
User Programs, Favorite Programs, Single Wavelength Mode,
Multi-Wavelength Mode, Wavelength Scan and Time Course Mode.
The DR 3800 Spectrophotometer provides digital readouts in direct
concentration units, absorbance or percent transmittance.
When a user-generated or programmed method is selected, the
menus and prompts direct the user through the test.
10
This menu system can also generate reports, statistical evaluations
of generated calibration curves and to report instrument diagnostic
checks.
Page 11

Section 3 Installation
3.1 Unpack the instrument
WARNING
Electrical and Fire Hazards. Use only the provided power
supply. Only qualified personnel should conduct the tasks
described in this section of the manual.
The DR 3800 Spectrophotometer comes packaged with the
following items:
• DR 3800 spectrophotometer
• Dust cover
• External power supply, including 4 adapter for EU, UK, USA
and AUS/China
• Adapter Box
• 3 different cuvette/sample cell adapters (A, B and C)
• Light shield (already installed in the instrument)
• DR 3800 user manual
• Quick start guide DR 3800
3.2 Operating environment
• CD-ROM containing the HACH and HACH LANGE procedures
Note: If any of these items are missing or damaged, contact the
manufacturer or a sales representative immediatly.
The following conditions are necessary to ensure correct
instrument operation and accurate results:
• Place the instrument firmly on an even surface. Do not push
any objects under the instrument.
• Maintain an ambient temperature of 10 to 40 ºC (50 to 104 ºF)
for proper instrument operation.
• The relative humidity should be less than 80%; moisture should
not condense on the instrument.
• Leave at least a 15 cm (6 in.) clearance at the top and on all
sides for air circulation to avoid overheating of electrical parts.
• Do not operate or store the instrument in extremely dusty,
damp or wet locations.
• Keep the surface of the instrument, the cell compartment and
all accessories clean and dry at all times. Splashes or spills on
and in the instrument should be cleaned up immediately (see
section 7.1 on page 123).
3.3 Power connections
Important Note: Protect the instrument from temperature
extremes, including heaters, direct sunlight and other heat sources.
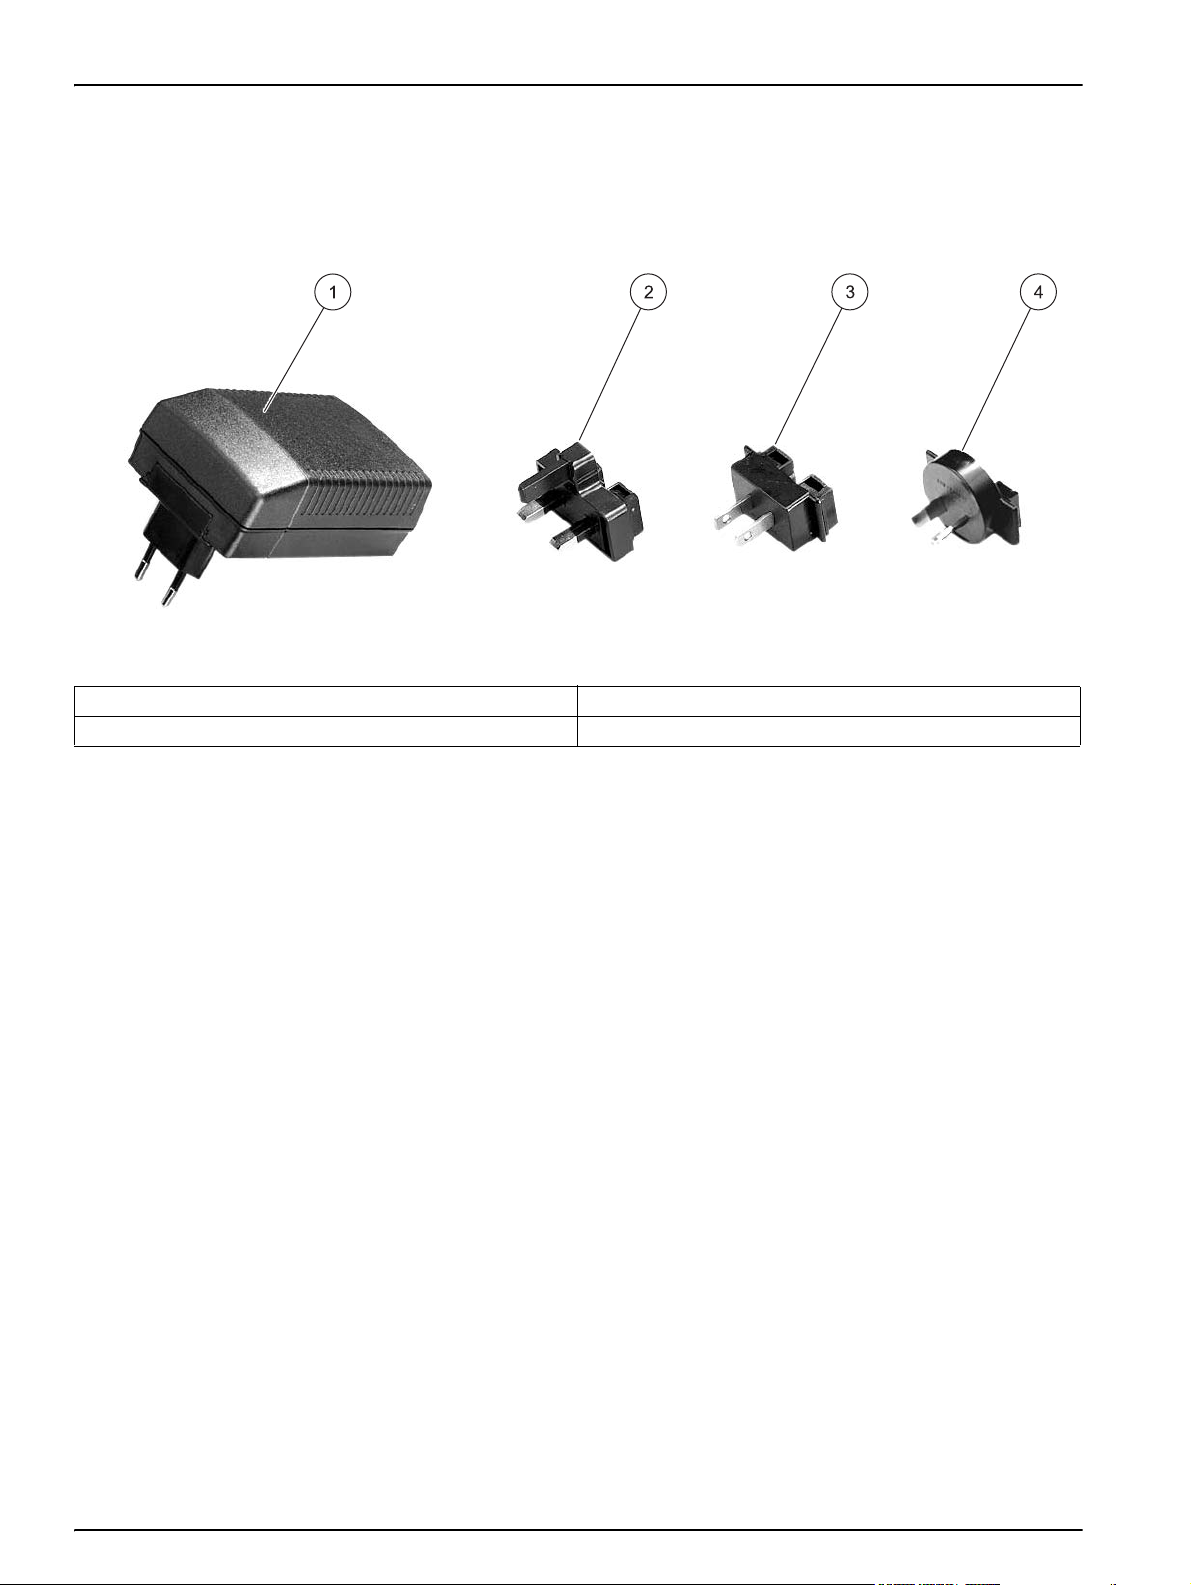
Install the correct adapter plug on the supplied external power
supply (Figure 1) by sliding the adapter on until it "clicks" into
position. Correctly mounted, both housing of power supply and plug
are in line. Plug the external power supply cord into the connector
11
Page 12
Installation
on the back panel of the instrument, then plug the supply into a
power outlet (100–240 V~ / 50–60 Hz). Press the power switch on
the back of the instrument to initialize power
(Figure 2 on page 13).
Figure 1 Power adapter
1 Power supply with EU adapter plug installed 3 USA adapter plug
2 UK adapter plug 4 AUS/China adapter plug
12
Page 13
3.4 Interfaces
Installation
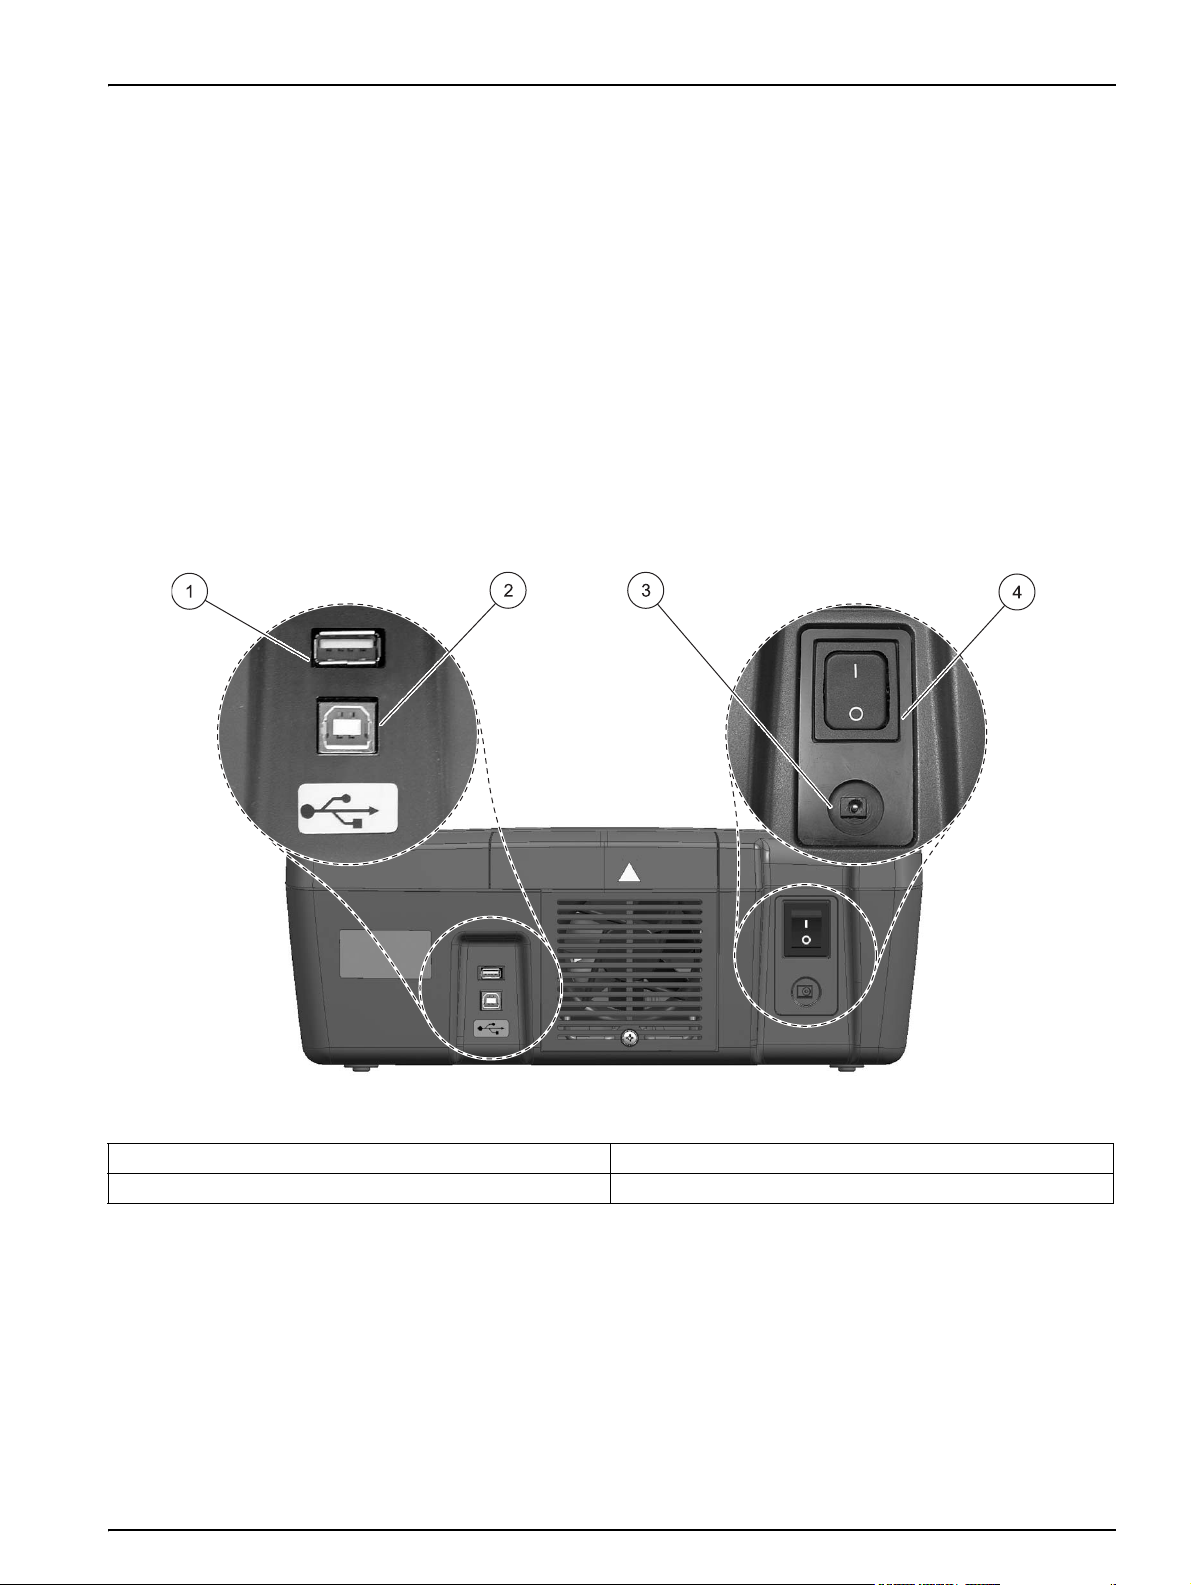
The DR 3800 has two USB interfaces as a standard feature,
located on the back of the instrument (Figure 2). The USB Type A
interface is used for communications with a printer, USB memory
stick or keyboard. A USB memory stick is used to update
instrument software.
The USB Type B interface is used for communications with a PC.
The optional Hach Data Trans software (see Section 9 on
page 131) must be installed on the PC for this use.
A USB hub may be used to connect several accessories at a time.
Note: USB cables must not be longer than 3 meters (10 feet).
These USB interfaces enable data and graphics to be output to a
Printer and a PC and upgrade instrument software (see
section 6.8.2 on page 110).
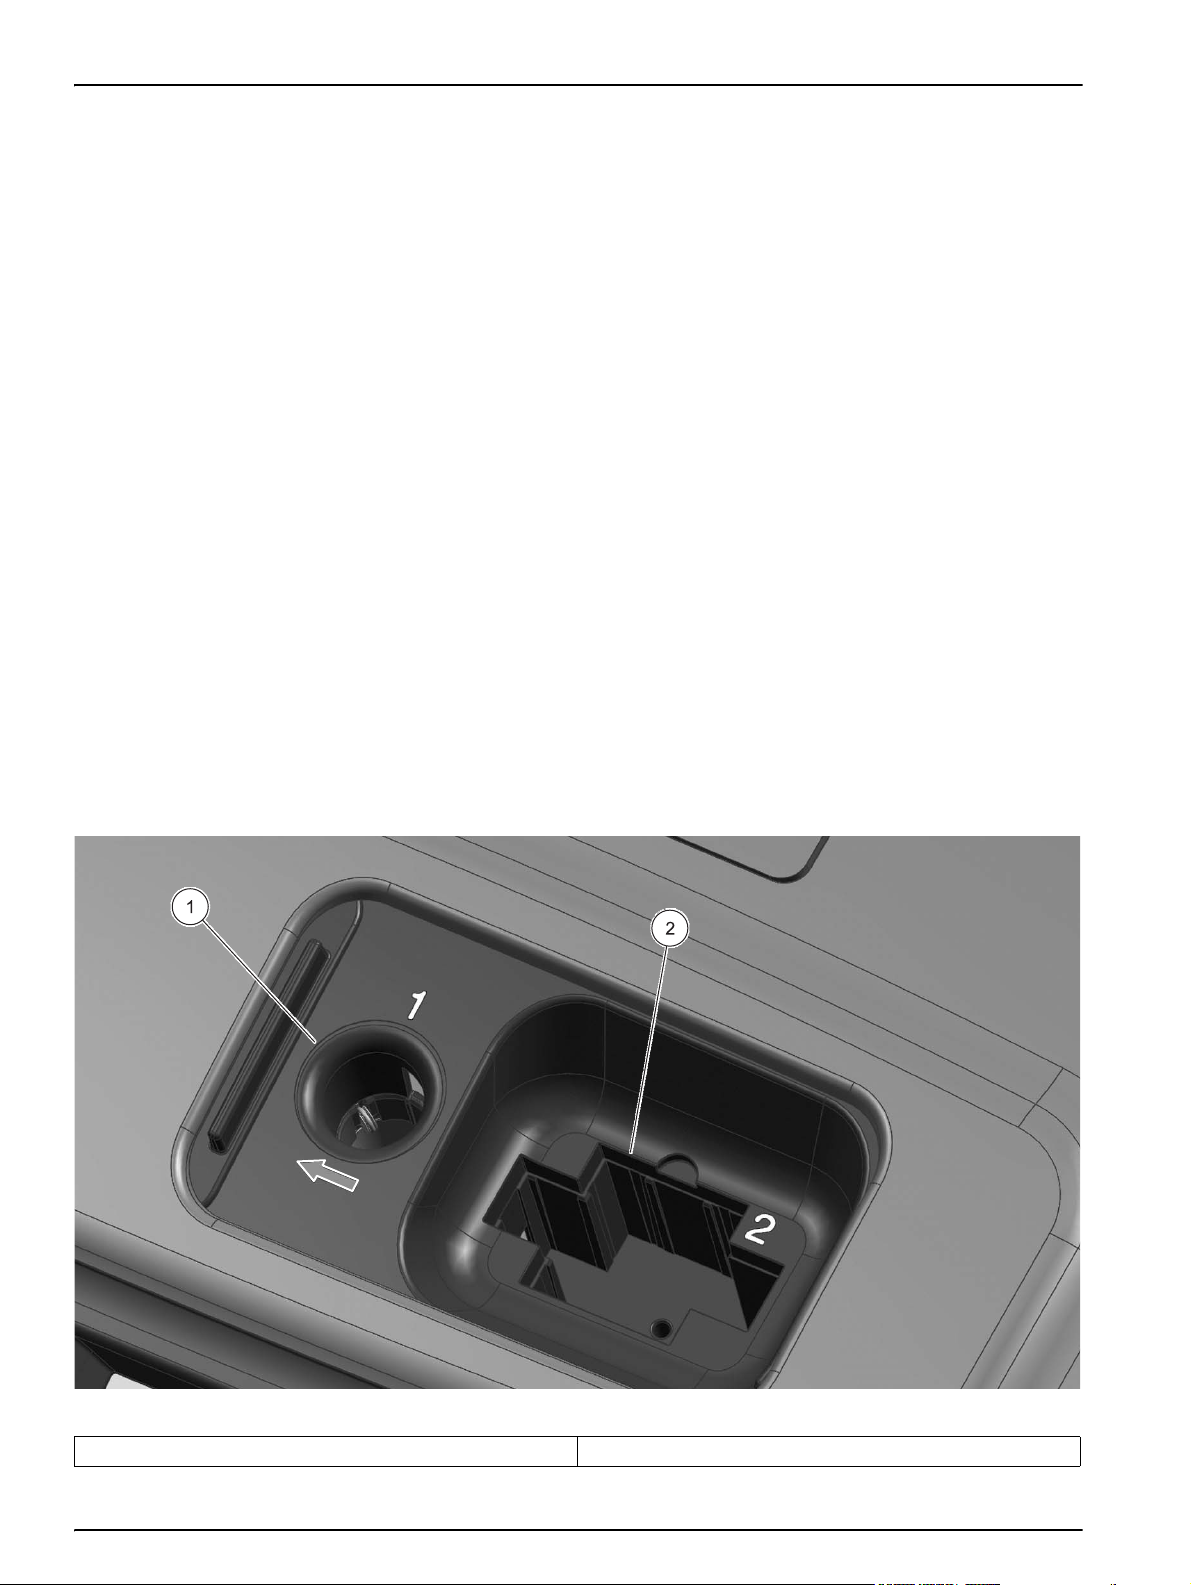
Figure 2 Interfaces
1 USB type A 3 Plug in power supply
2 USB type B 4 On/Off switch
13
Page 14
Installation
3.5 Cell compartments, cuvette/sample cell adapters, light shield and Adapter Box
3.5.1 Cell compartments and adapters
The DR 3800 has two cell compartments (Figure 3). Only one
cuvette/sample cell type at a time can be used for a measurement.
Cell compartment #1
• 13-mm round cuvettes/cells
Note: Cell compartment #1 contains a barcode reader for
cuvettes/vials.
Cell compartment #2
Cell compartment #2 uses adapters to accommodate different
cuvette/sample cell types.
• 1-inch square or 50-mm rectangular cells (can be inserted
directly into the cell compartment without using an adapter).
• Adapter A: 10-mm square cuvettes/cells
• Adapter B: Pour-Thru and multi-path cells
Note: Pour-Thru Cell must be used with Adapter B, not Adapter C.
• Adapter C: One-inch round cells and AccuVac® Ampuls
Note: One-inch round cuvettes/cells and AccuVac Ampuls must be used
with Adapter C, not Adapter B.
Figure 3 Cell compartments
1 Cell compartment #1 2 Cell compartment #2
14
Page 15
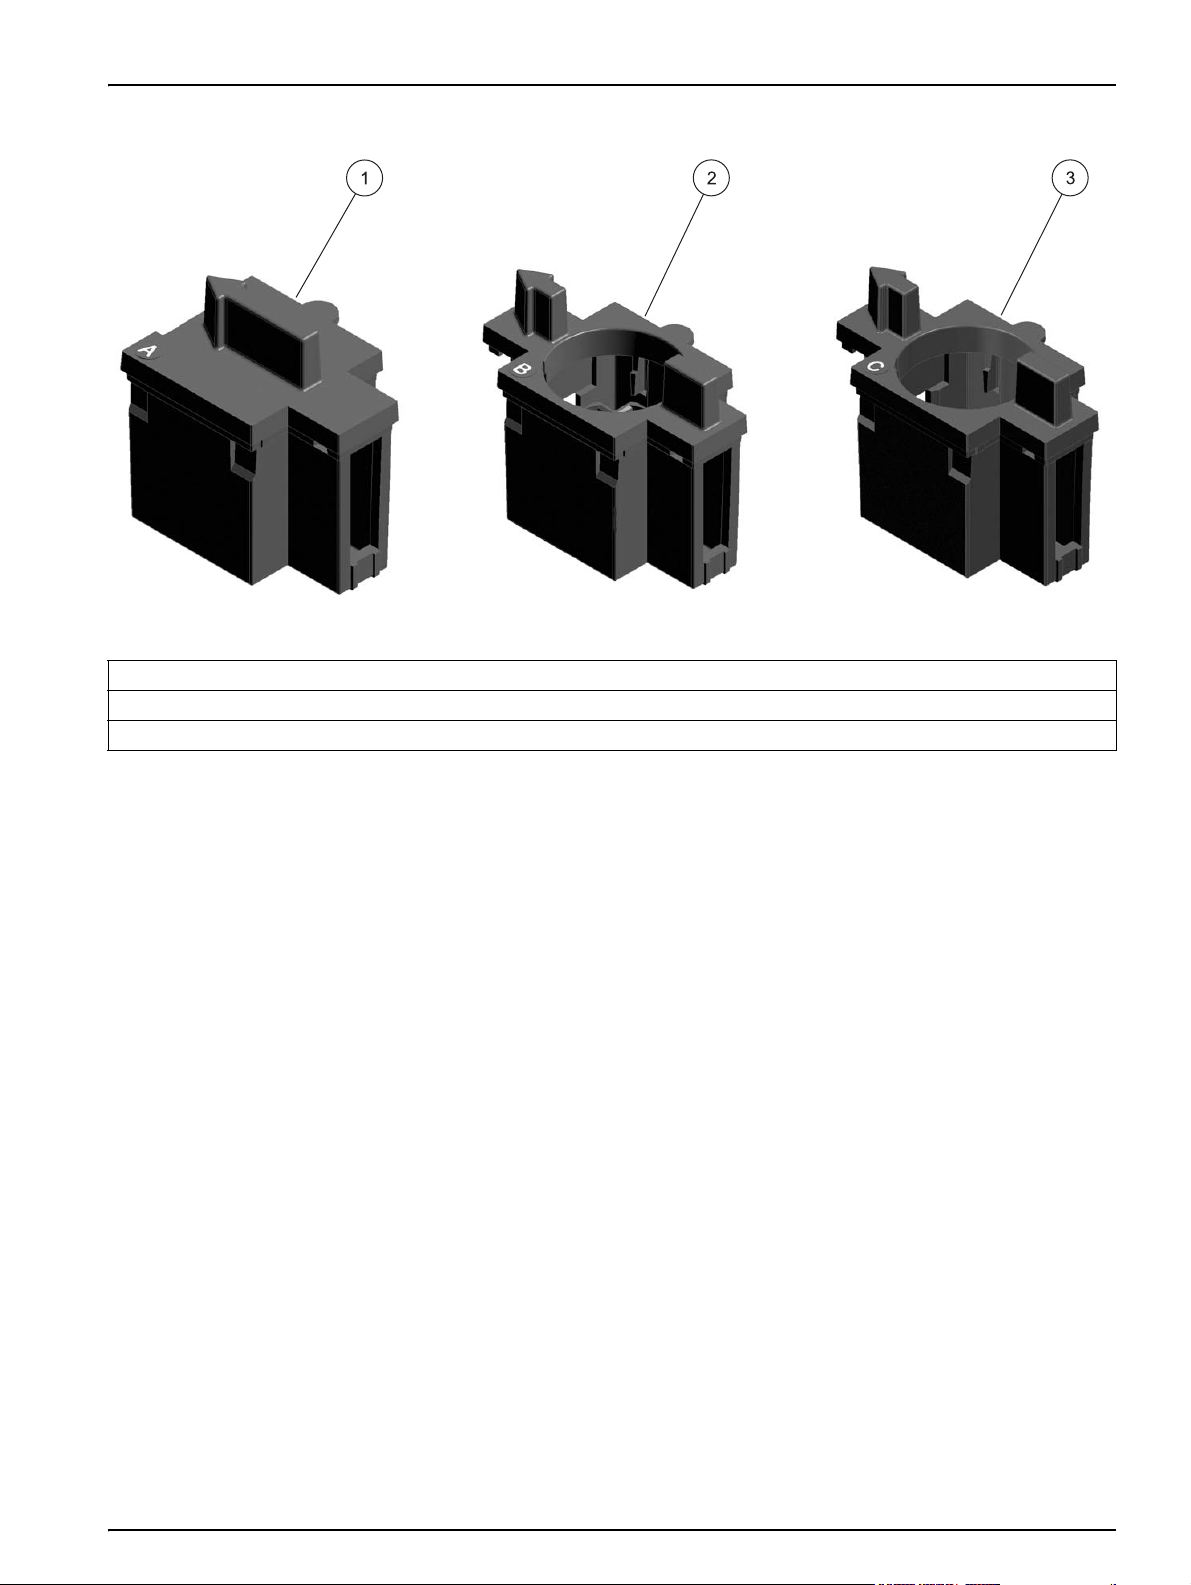
Figure 4 Cuvette/sample cell adapters
1 Adapter A: 10 mm square cell adapter
2 Adapter B: 1 inch Pour-Thru and multi-path adapter
3 Adapter C: 1 inch round cuvette/sample cell adapter
Installation
3.5.2 Installation of the cuvette/sample cell adapters
1. Open the cell compartment.
2. Select the correct adapter for the cuvette/sample cell type.
3. Insert the adapter so the arrow on top of the adapter points to
the left (Figure 5) and the orientation tab fits the groove in the
compartment opening. The cuvette/sample cell type imprint
should be legible on the adapter (Figure 4).
Note: The arrow on top of the adapter indicates the direction of the light
beam path.
15
Page 16

Installation
16
Figure 5 Installation of a cuvette/sample cell adapter
Page 17
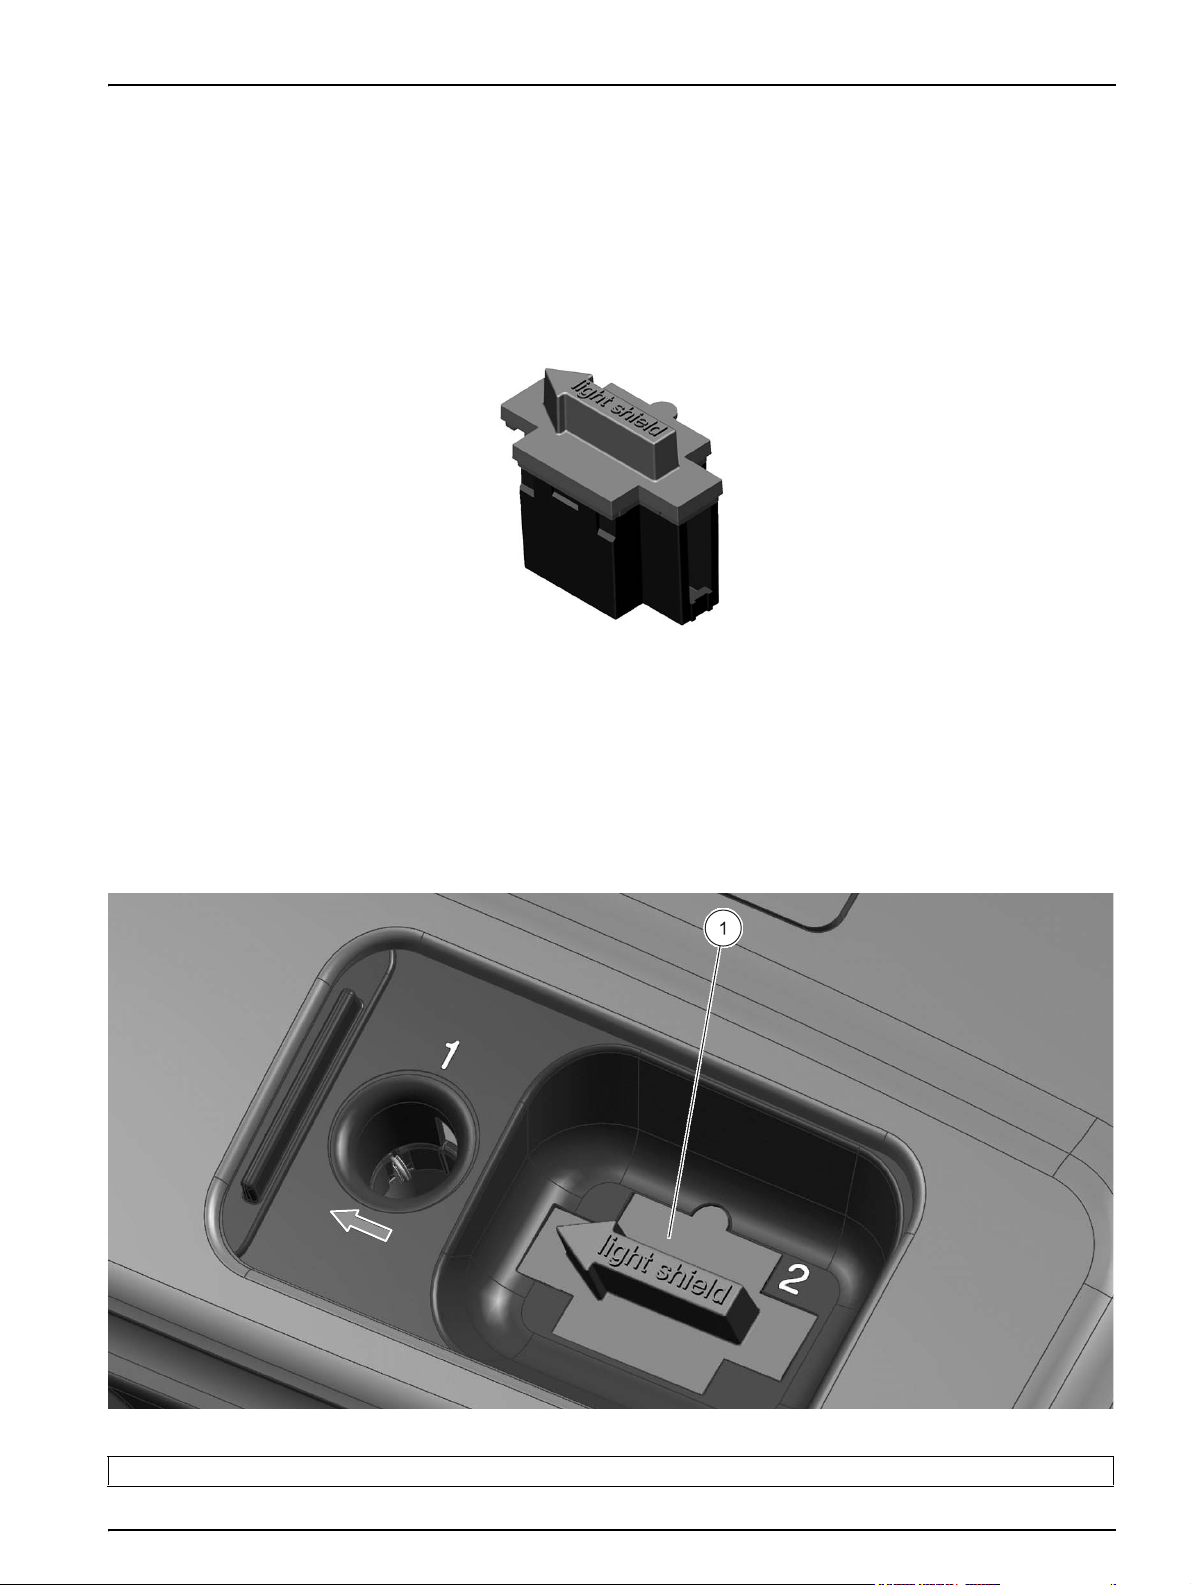
3.5.3 Use of the light shield for measurements
The light shield (Figure 6) prevents light interference when using
13 mm barcode tests and must be in place before measurements
can be taken in cell compartment #1. The light shield is required
only when using 13 mm barcode tests.
The DR 3800 is shipped with the light shield installed. Remove the
light shield before using cell compartment #2. The light shield can
be stored in the Adapter Box (Figure 8 on page 18).
Installation
Figure 6 Light shield
Installation of the light shield
1. Open the cell compartment.
2. Insert the light shield so the arrow on the light shield points to
the left and the orientation tab fits the groove in the
compartment opening (Figure 7)
1 Light shield
Figure 7 Light shield installed
17
Page 18
Installation
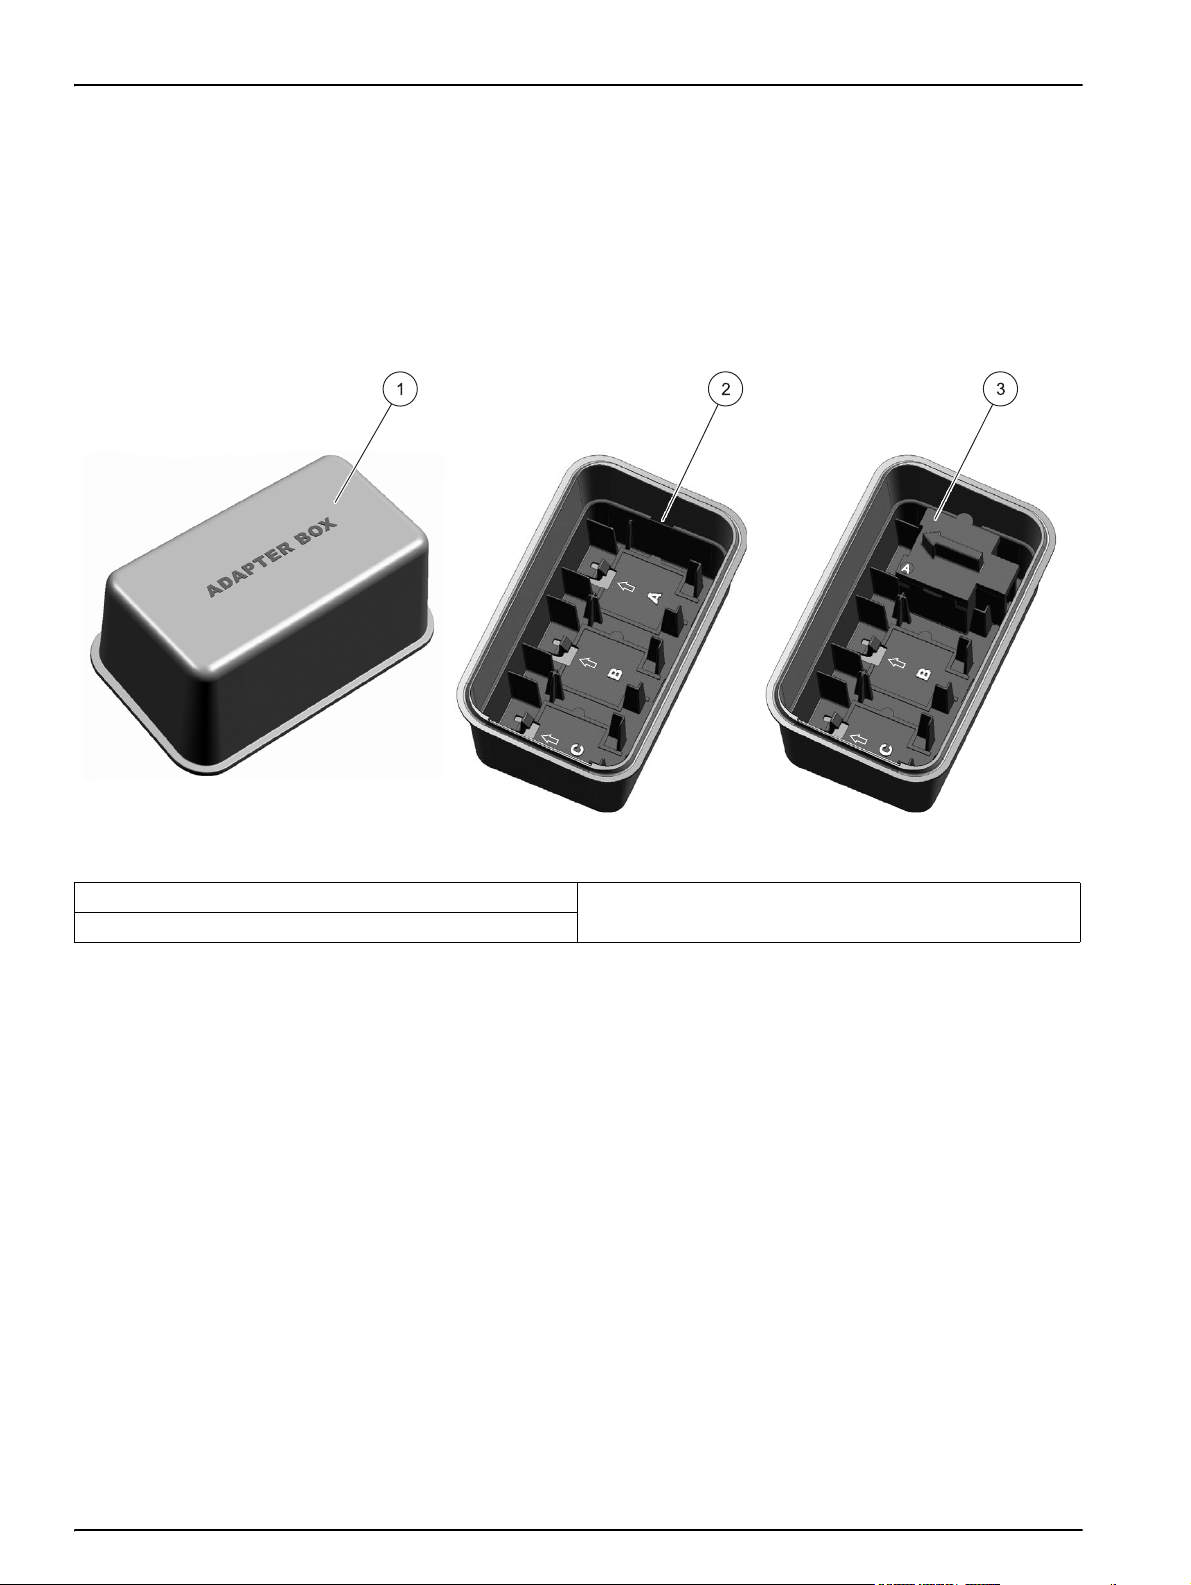
3.6 Adapter Box
The inside of the Adapter Box (Figure 8) can be used for the
storage of the three cuvette/sample cell adapters. The
cuvette/sample cell adapters recesses in the Adapter Box are
marked with the corresponding letters and arrows of the adapter.
The arrows indicate the direction of insertion. When a
cuvette/sample cell adapter is in use and removed from the cover,
The light shield can be stored in the Adapter Box.
Figure 8 Adapter Box
1 Adapter Box 3 Adapter Box with adapter A stored in position A
2 Adapter Box (inside view)
18
Page 19
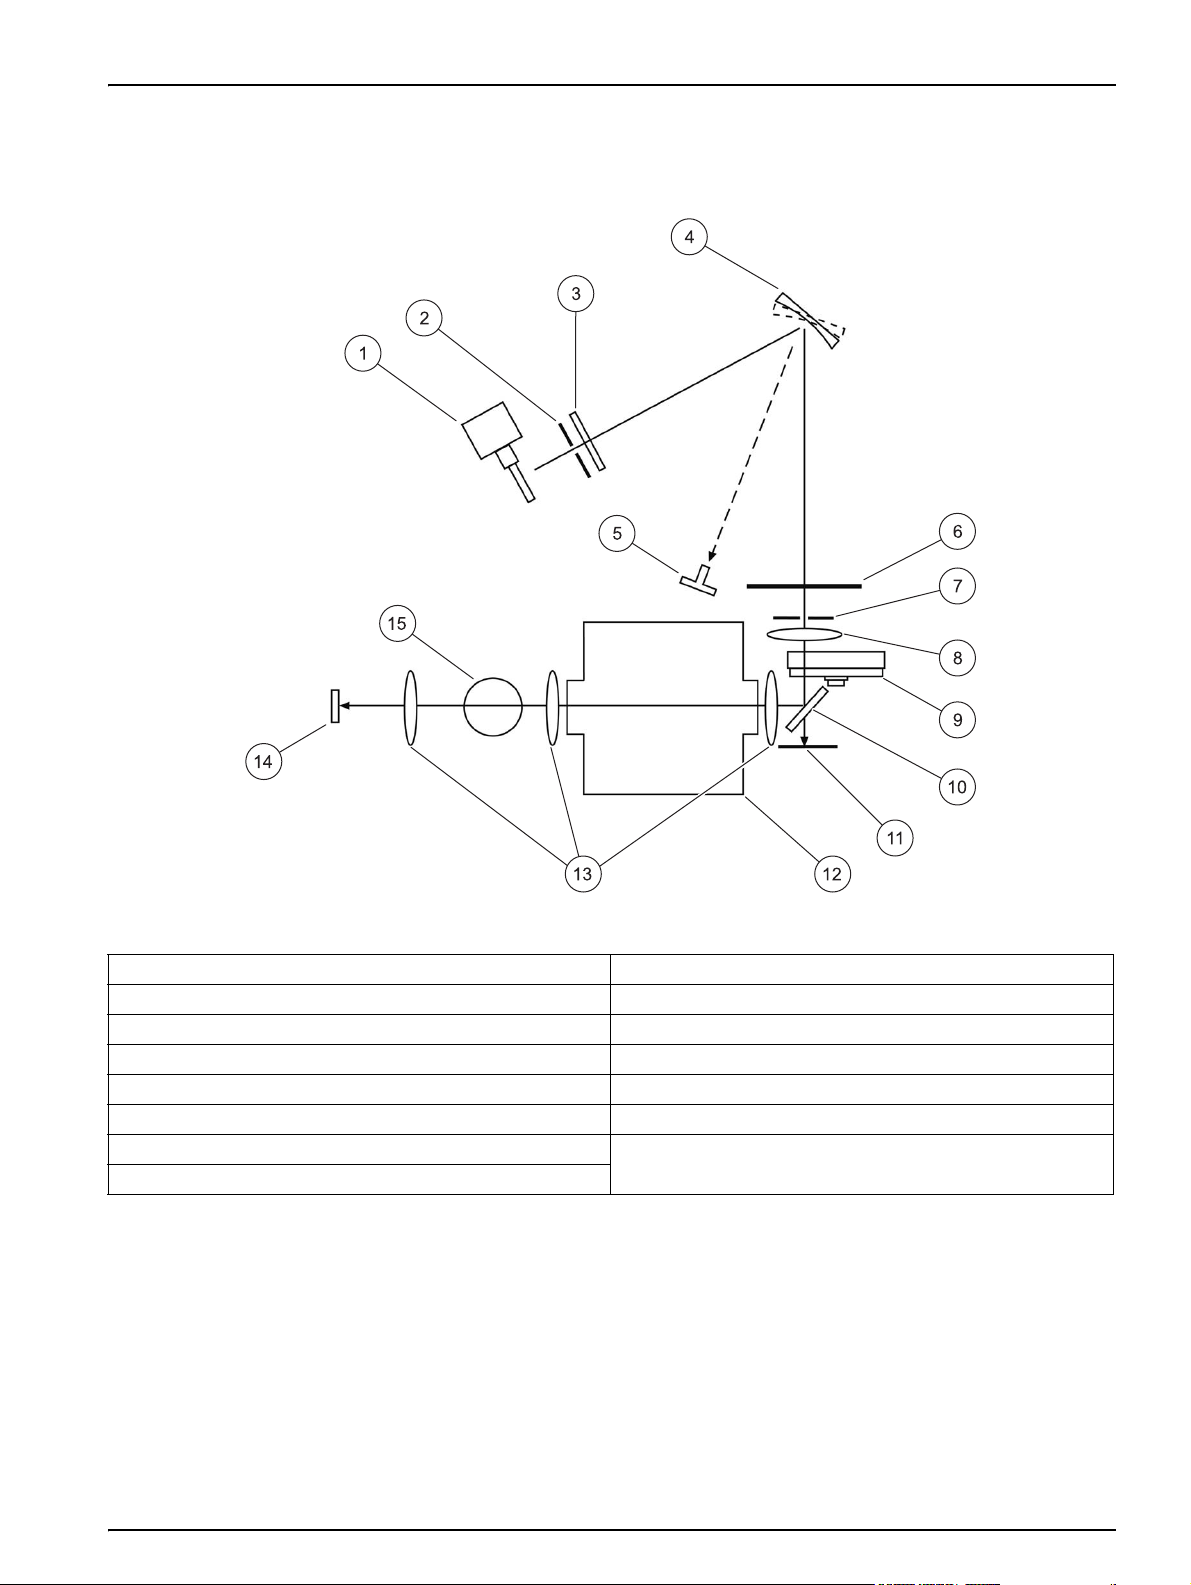
3.7 Beam path
Installation
Figure 9 shows the beam path of the DR 3800.
Figure 9 Beam path
1 Tungsten lamp 9 Filter wheel
2 Entrance slit 10 Splitter mirror
3 Heat-protection glass 11 Reference-element
4 Grating 12 Cell compartment
5 LED 13 Lens
6 Chopper 14 Measurement element
7 Exit slit
8 Lens
15 Cell compartment #1
#2
19
Page 20

Installation
20
Page 21
Section 4 Start Up
4.1 Power the instrument on and off
1. Plug external power supply into an electrical outlet.
2. Turn the instrument on by pressing the power switch on the
back.
Note: Do not turn the instrument off and on in rapid succession. Always
wait about 20 seconds before turning the instrument on again, otherwise
the electronic and mechanical systems will be damaged.
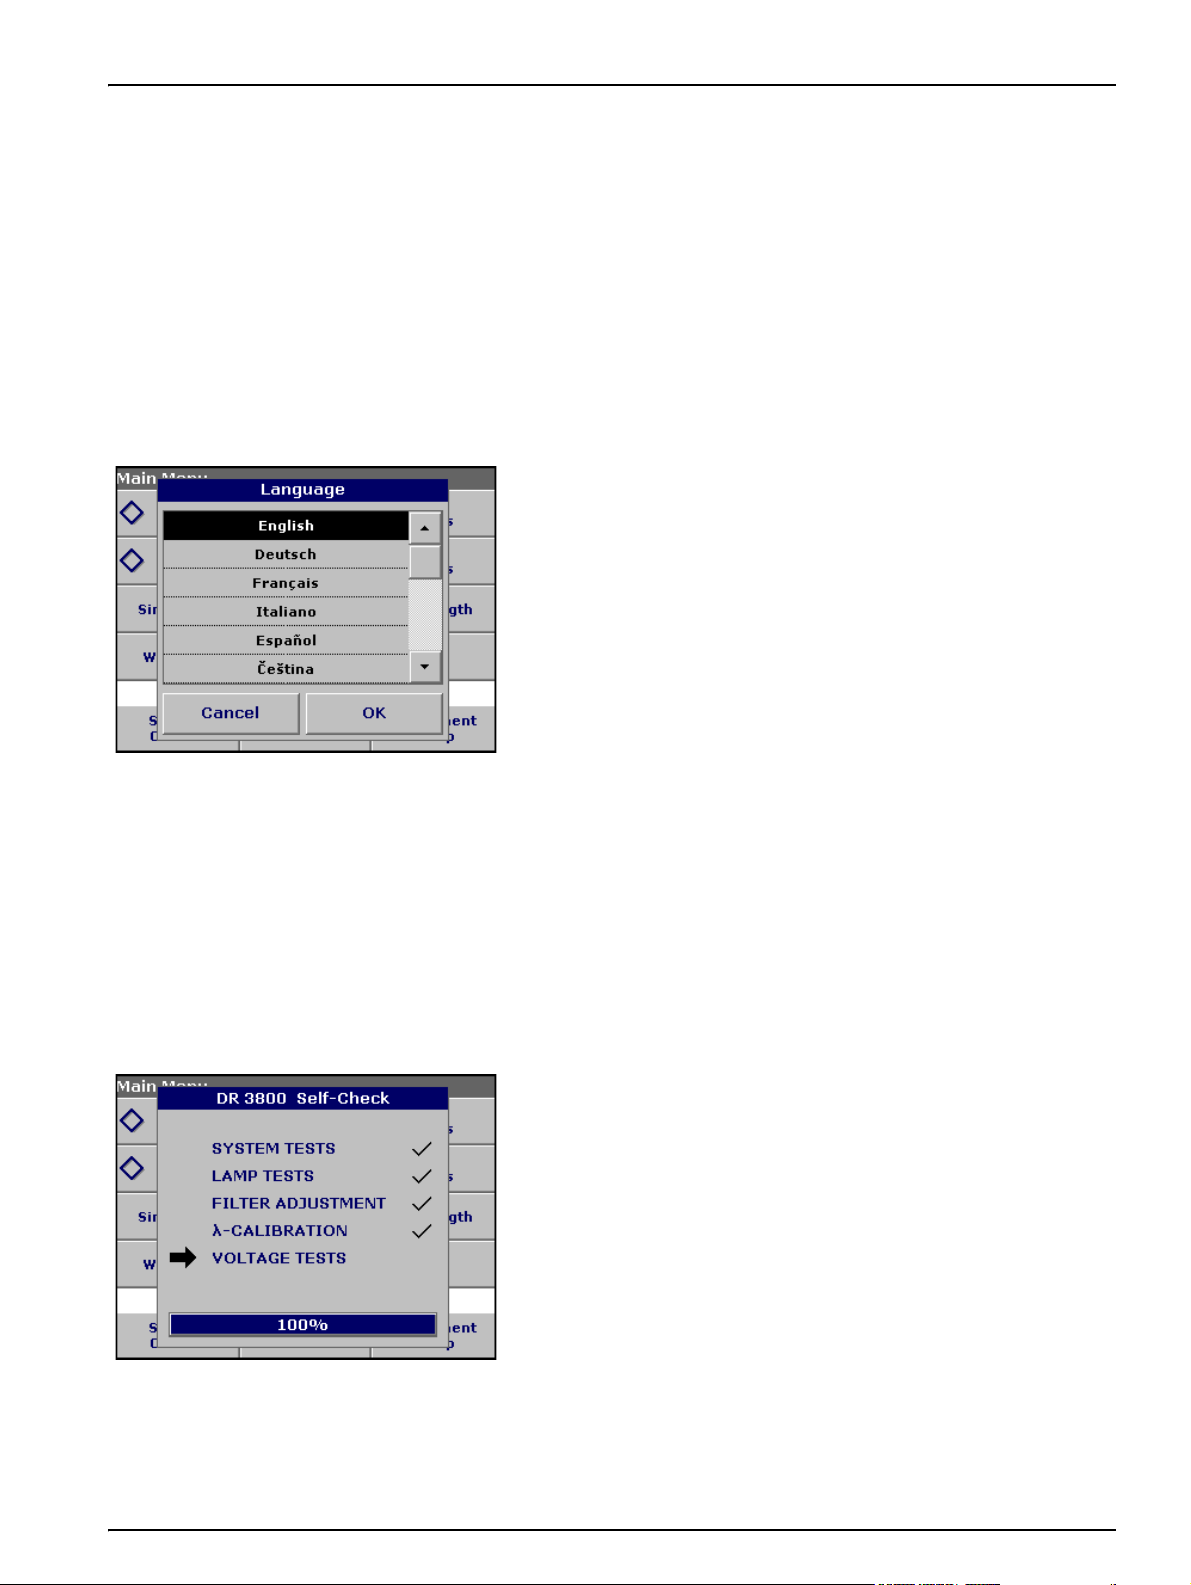
4.2 Language selection
The DR 3800 Spectrophotometer software includes several
language options. The first time the instrument is turned on, the
language selection screen will appear.
1. Select the desired language.
2. Press OK to confirm the language selection. The self check will
start automatically.
4.3 Self-Check
Changing the language setting
The instrument functions in the selected language until the option is
changed.
1. While turning the instrument on, touch the screen at any point
until the list for selecting a language appears (about
30 seconds).
2. Select the required language.
3. Press OK to confirm. The test program subsequently starts
automatically.
Each time the instrument is powered up, a series of diagnostic tests
are performed automatically to ensure operation of major system
components.
This procedure, which takes approximately two minutes, checks the
system, lamp, filter adjustment, wavelength calibration and voltage.
Each test which functions correctly is confirmed with a check mark.
The Main Menu is displayed when power up diagnostics are
completed.
Note: Further error messages during self check, see Section 8 on page
129.
21
Page 22

Start Up
22
Page 23
Section 5 Standard Operations
5.1 Overview
5.1.1 Tips for the use of the touch screen
The entire screen is touch-activated. To make a selection, press the
screen with a fingernail, fingertip, pencil eraser or a stylus. Do not
press the screen with a sharp object, such as the tip of a ball
point pen.
• Do not place anything on top of the screen, to prevent damage
or scratching on the screen.
• Press keys, words or icons to select them.
• Use scroll bars to move up and down long lists very quickly.
Press and hold the scroll bar, then move up or down to move
through the list.
• Highlight an item from a list by pressing it once. When the item
has been successfully selected, it will be displayed as reversed
text (light text on a dark background).
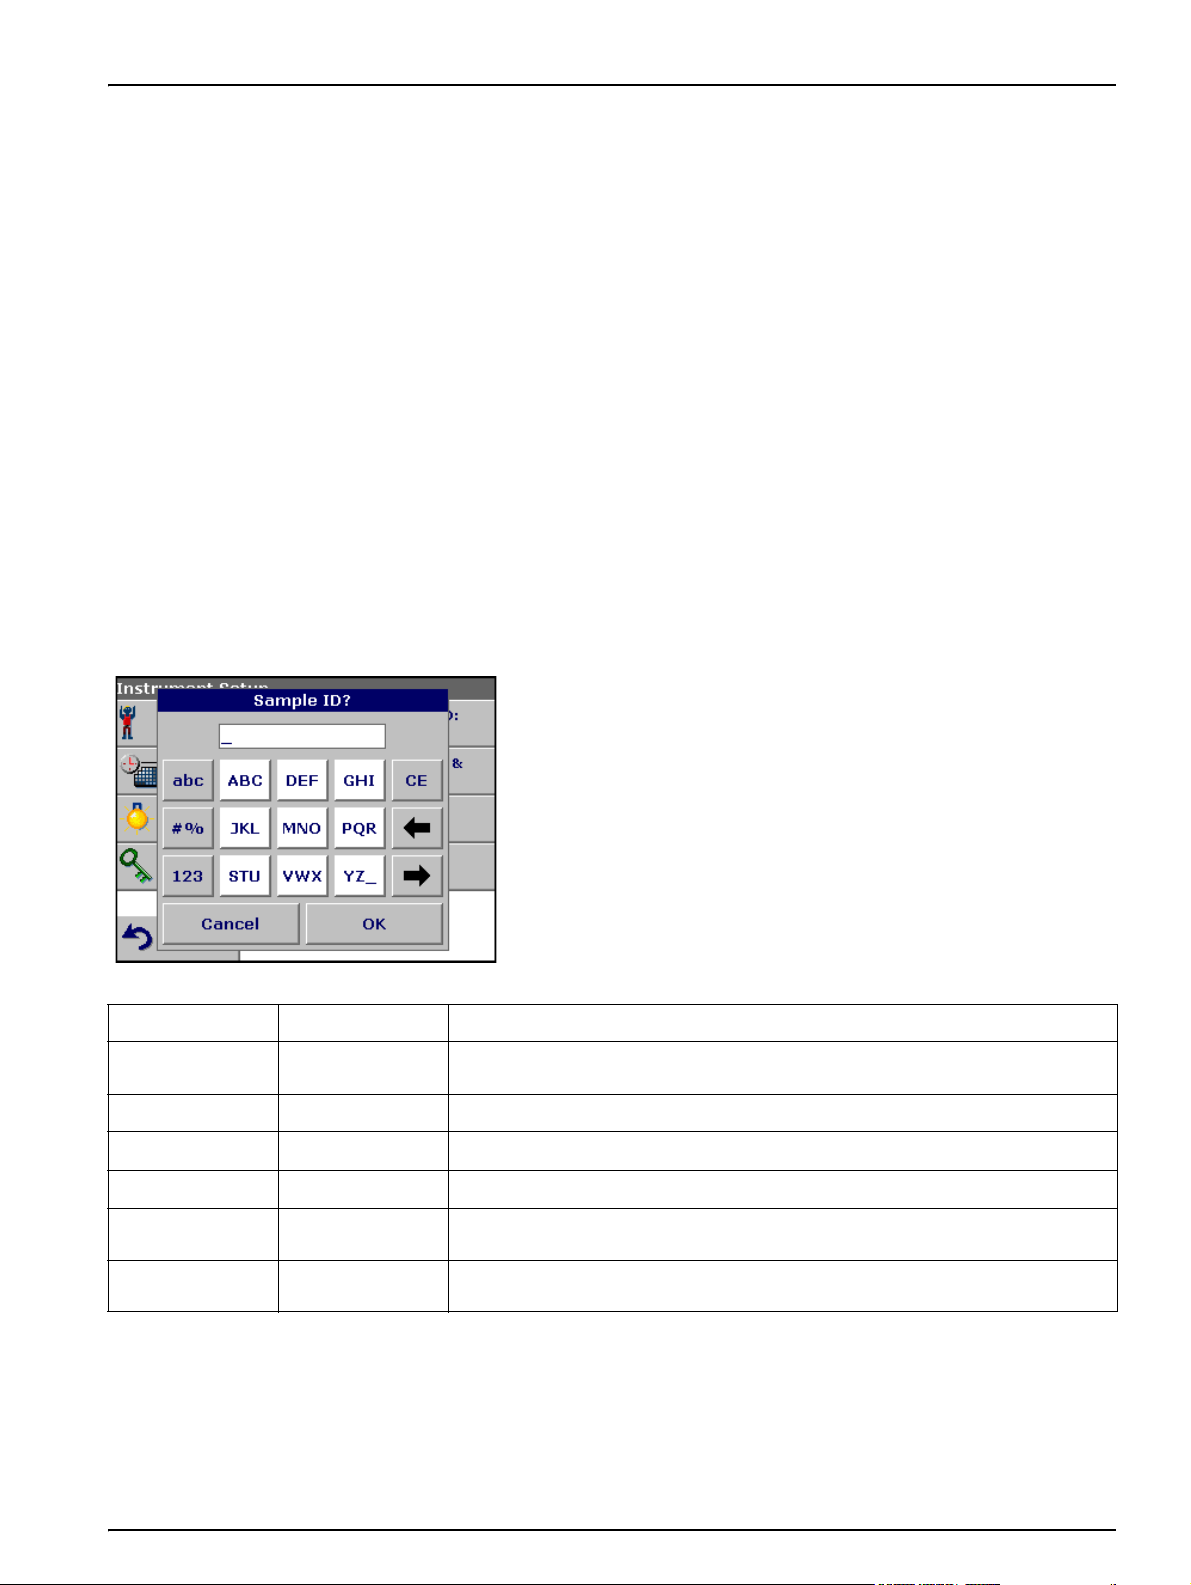
5.1.2 Use of the alphanumeric keypad
This display is used to enter letters, numbers and symbols as
needed when programming the instrument. Unavailable options are
disabled (grayed out). The icons on the right and left of the screen
are described in Table 1.
The central keypad changes to reflect the chosen entry mode.
Press a key repeatedly until the desired character appears on the
screen. A space can be entered by using the underscore on the
YZ_ key.
Note: A USB keyboard (with US keyboard layout) or a USB Barcode
handset scanner can be used for input (see Section 9 on page 131).
Table 1 Alphanumeric keypad
Icon / key Description Function
ABC/abc Alphabetic
# % Symbols Punctuation, symbols and numerical sub- and superscripts may be entered.
123 Numeric For entering regular numbers.
CE Clear Entry Clear the entry.
Left Arrow Backspace
Right Arrow Advance
When entering alphabetic characters (ex. user-entered units), this key allows to
toggle between upper and lower case letters.
Moves back one position. This deletes the character previously entered in the new
position.
Moves to the next space in an entry when two adjacent characters occur on the
same key.
23
Page 24
Standard Operations
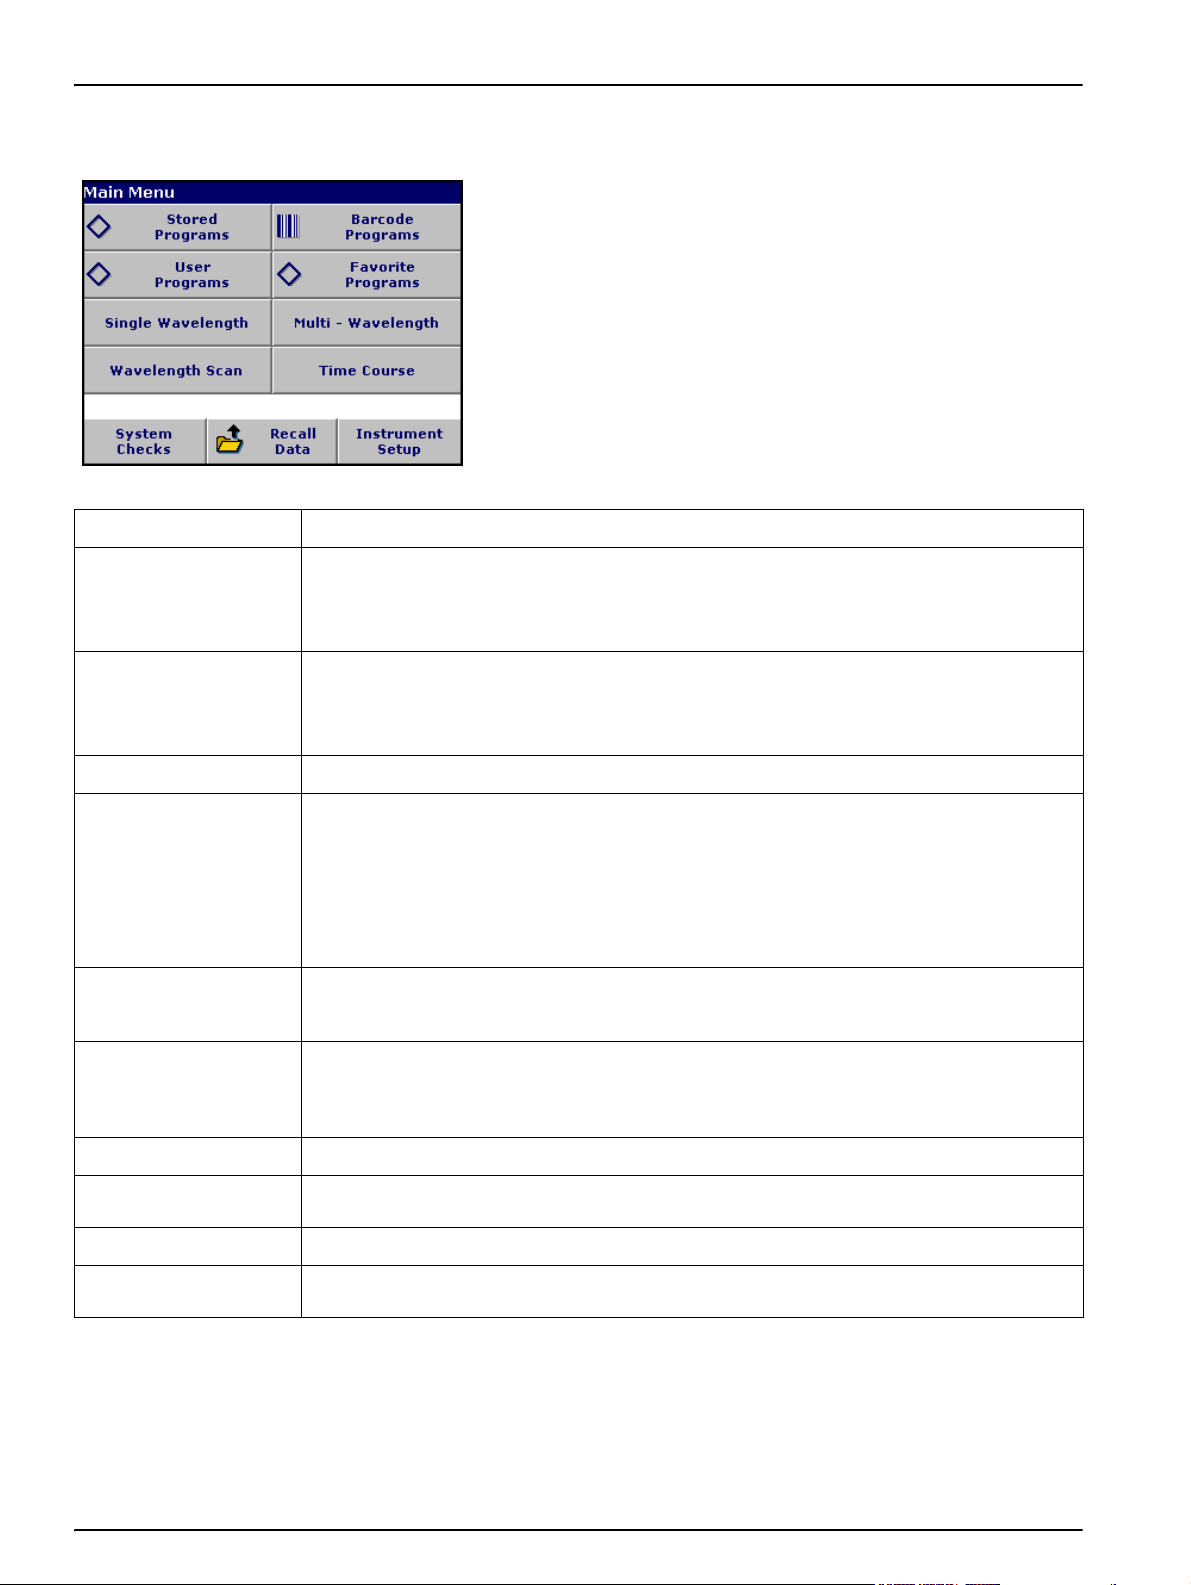
5.1.3 Main Menu
Option Function
A variety of modes may be selected from the Main Menu. The
following table briefly describes each menu option.
Table 2 Main Menu options
Stored Programs /
Barcode Programs
(HACH LANGE
Programs)
User Programs
Favorite Programs List of methods/tests created by the user to suit his own requirements.
Single Wavelength
Multi Wavelength
Wavelength Scan
Time Course The time scan records the absorbance or % transmittance at a wavelength over a defined time.
Stored programs are pre-programmed methods that make use of HACH reagents and LANGE
cuvette tests and pipette tests.
The DR 3800 Procedures Manual contains illustrated, step-by-step procedures for analyses
using HACH programs. The working procedures for LANGE tests are included in the test packs.
User programs make "made to measure analysis" possible:
–Users can program methods they have developed themselves
–Existing HACH and LANGE methods can be stored as user programs. The LANGE tests can
then be modified to suit the user's requirements.
Single wavelength measurements are:
Absorbance measurements: The light absorbed by the sample is measured in absorbance
units.
Transmittance measurements (%): The percentage of the light that passes through the sample
and reaches the detector is measured.
Concentration measurements: A concentration factor can be entered to enable the measured
absorbance values to be converted into concentration values.
In the multi-wavelength mode, absorbance (Abs) or percentage transmittance (%T) is measured
at up to four wavelengths and absorbance differences and absorbance relationships are
calculated. Simple conversions into concentrations can also be carried out.
A wavelength scan shows how the light from a sample is absorbed over a defined wavelength
spectrum.This function can be used to determine the wavelength at which the maximum
absorbance value can be measured.The absorbance behavior is displayed graphically during the
scan.
System Checks
Recall Data Stored data can be recalled, filtered, sent and deleted.
Instrument Setup
The system checks menu offers a number of options, including optical checks, output checks,
lamp history, instrument update, service time and instrument backup.
In this mode, user-specific or method-specific settings can be entered: Operator-ID, Sample-ID,
Date & Time, Display & Sound, Lamp Control, PC & Printer, Password and Select Color.
24
Page 25
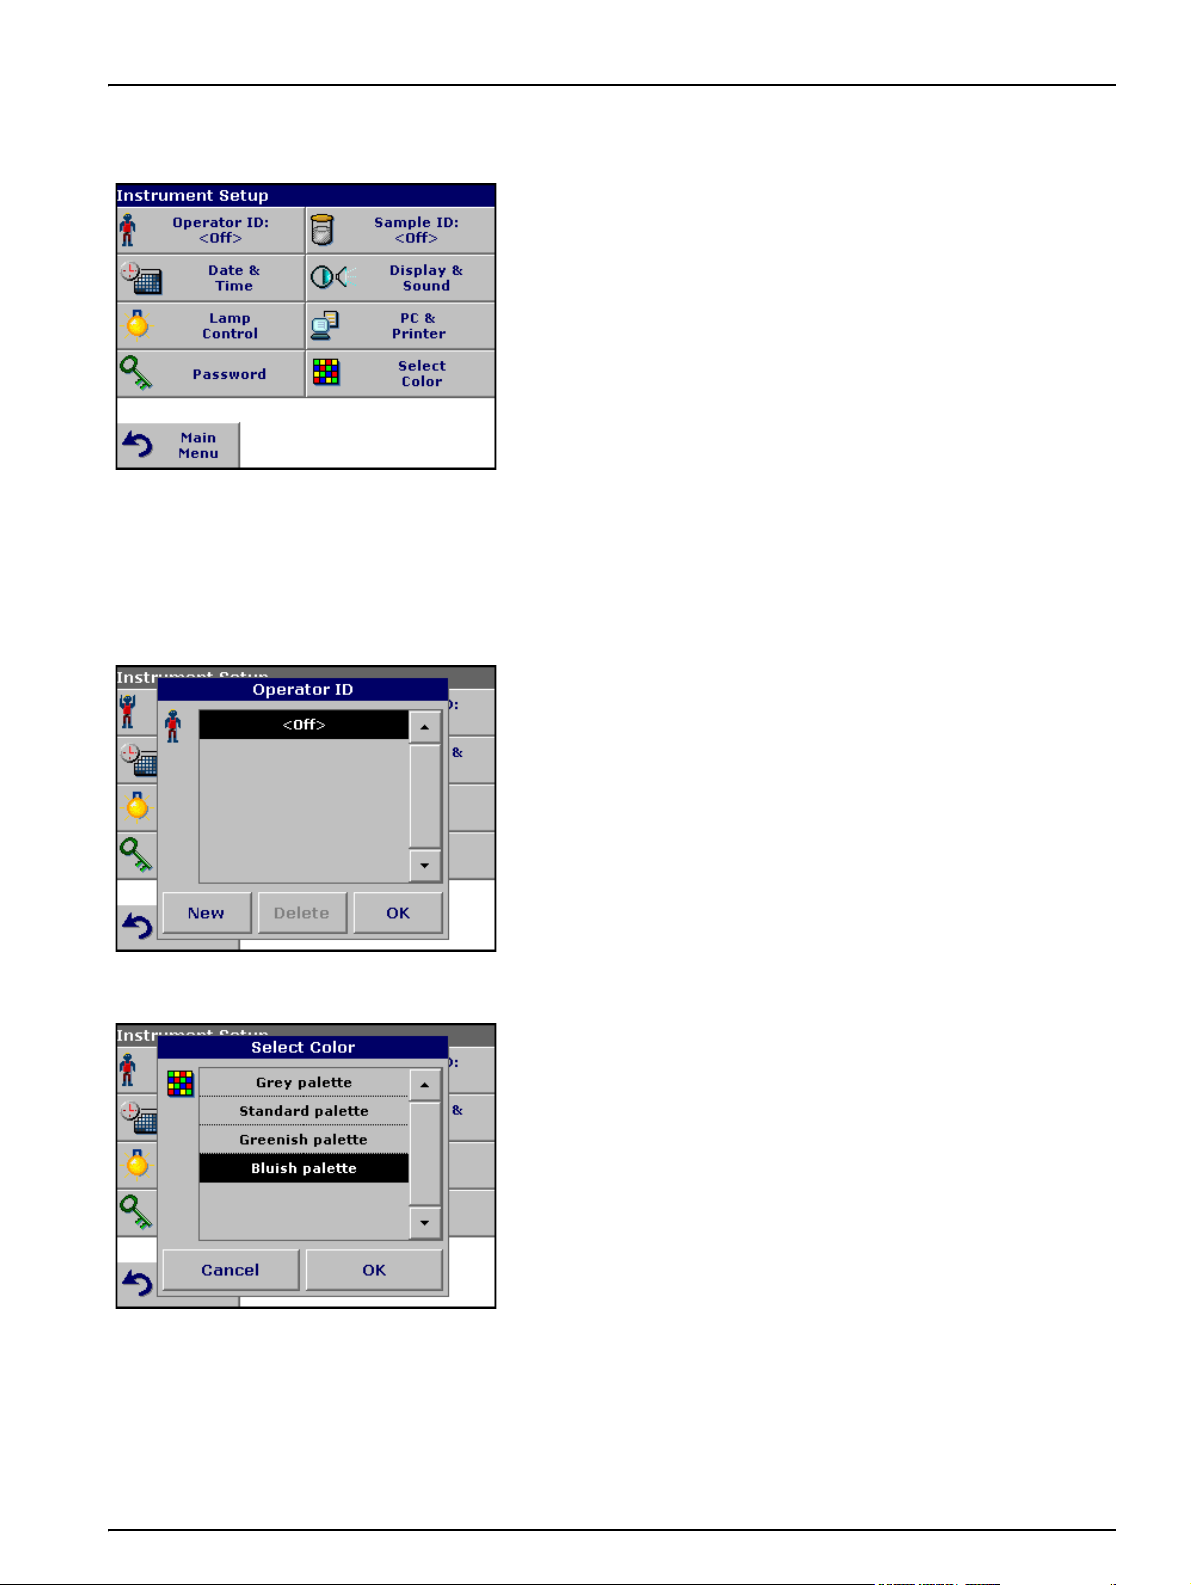
5.2 Instrument Setup mode
5.2.1 Operator ID
Standard Operations
1. Select Instrument Setup in the Main Menu.
A selection of functions appears in order to configure the functions
of the instrument.
Use this option to enter up to 30 sets of operator initials (up to five
characters each) into the instrument. This feature helps record
which operator measured each sample.
1. Press Operator ID in the Instrument Setup.
2. Press New to enter a new Operator ID.
3. Use the alphanumeric keypad to enter a new Operator ID.
4. Press OK to confirm.
Select one of the four preset color palett in the Select Color menu to
assign to the Operator ID.
5. Select a color category to highlight the color for the display
background.
Note: Press Cancel to select the default setting.
6. Press OK to confirm.
25
Page 26
Standard Operations
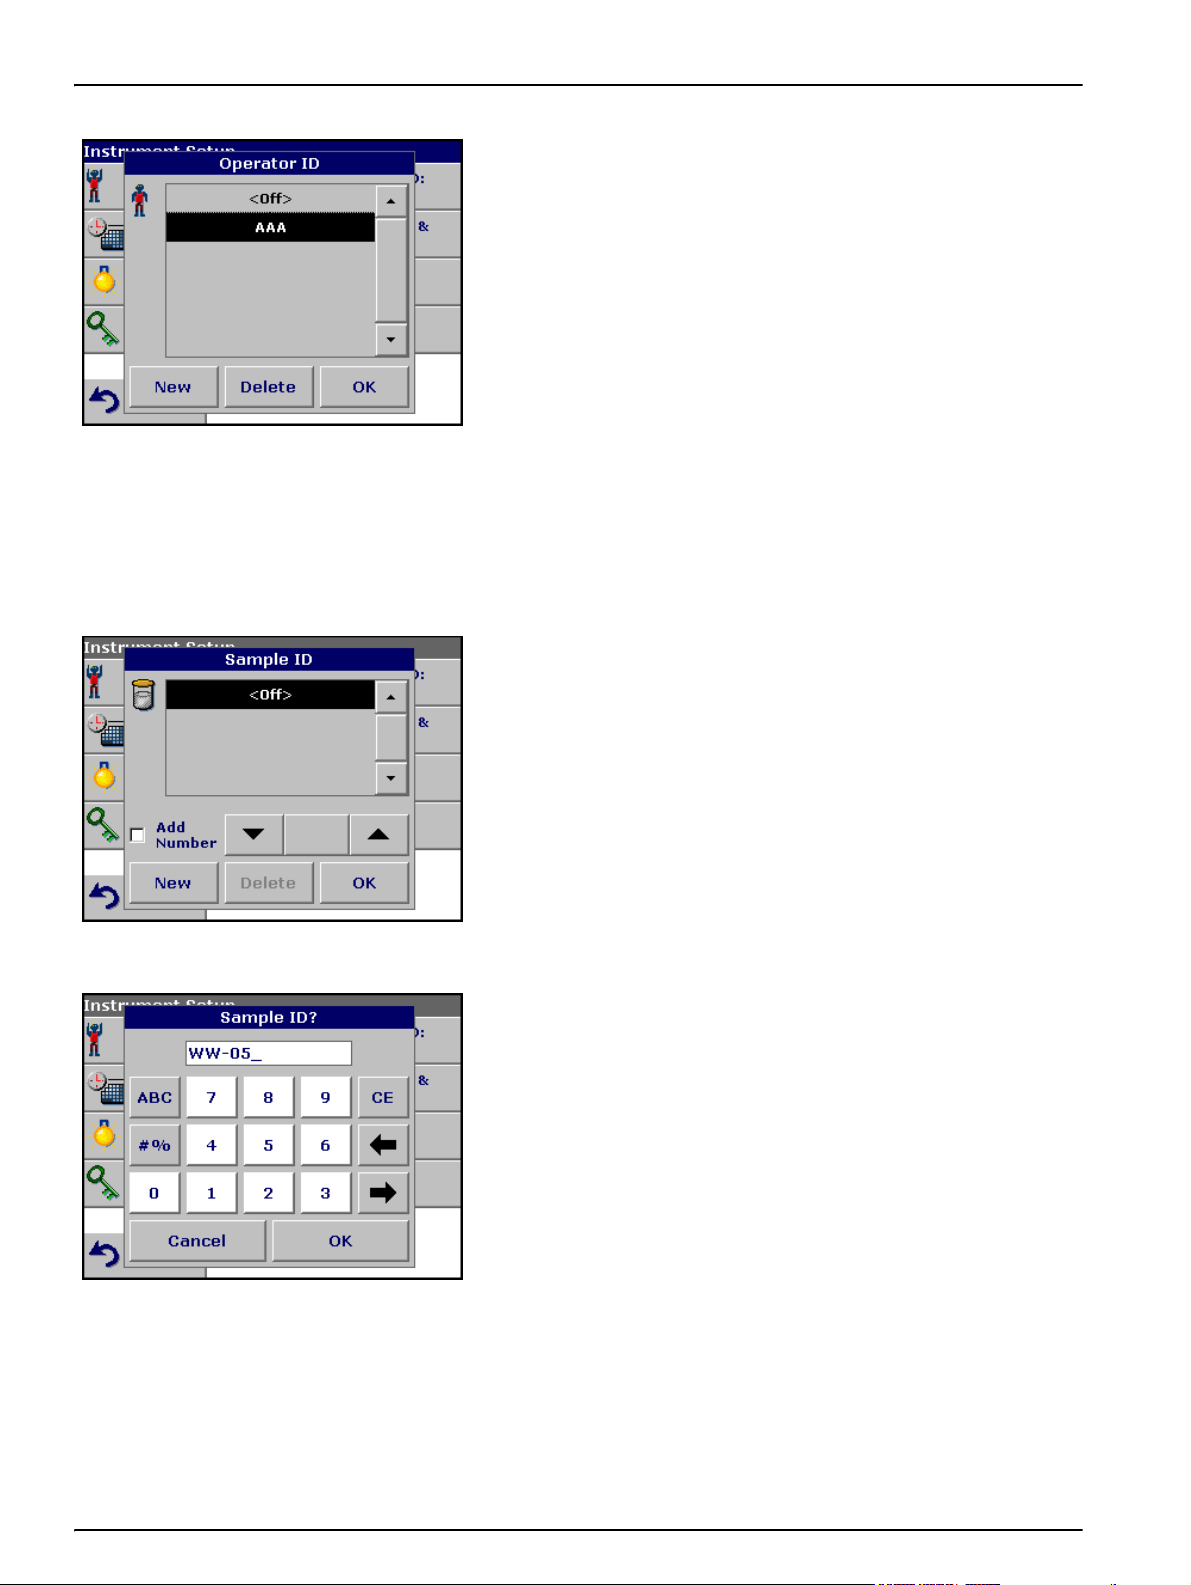
5.2.2 Sample ID
7. The display shows the chosen Operator ID.
8. Press OK. The instrument will return to the Instrument Setup
screen and show the selected operator identifier.
9. The chosen Operator ID is activated.
Note: Press Delete to remove an Operator ID from the list.
Note: Alternatively, enter or change an Operator ID in measurement mode.
In the results screen, press Options>More>Instrument Setup or if an
Operator ID is already assigned, select the "Operator ID symbol
immediately in the results screen.
Use this option to enter up to 100 Sample Identification tags (up to
13 characters each) into the instrument. Sample IDs can be used to
specify the sample location or other sample specific information.
1. Press Sample ID in the Instrument Setup.
2. Press New to enter a new Sample ID.
3. Use the alphanumeric keypad to enter a new Sample ID.
Note: If a USB Barcode handset scanner ( see Section 9 on page 131)
is connected, Sample IDs can also be scanned.
4. Press OK to confirm.
26
Page 27
Standard Operations
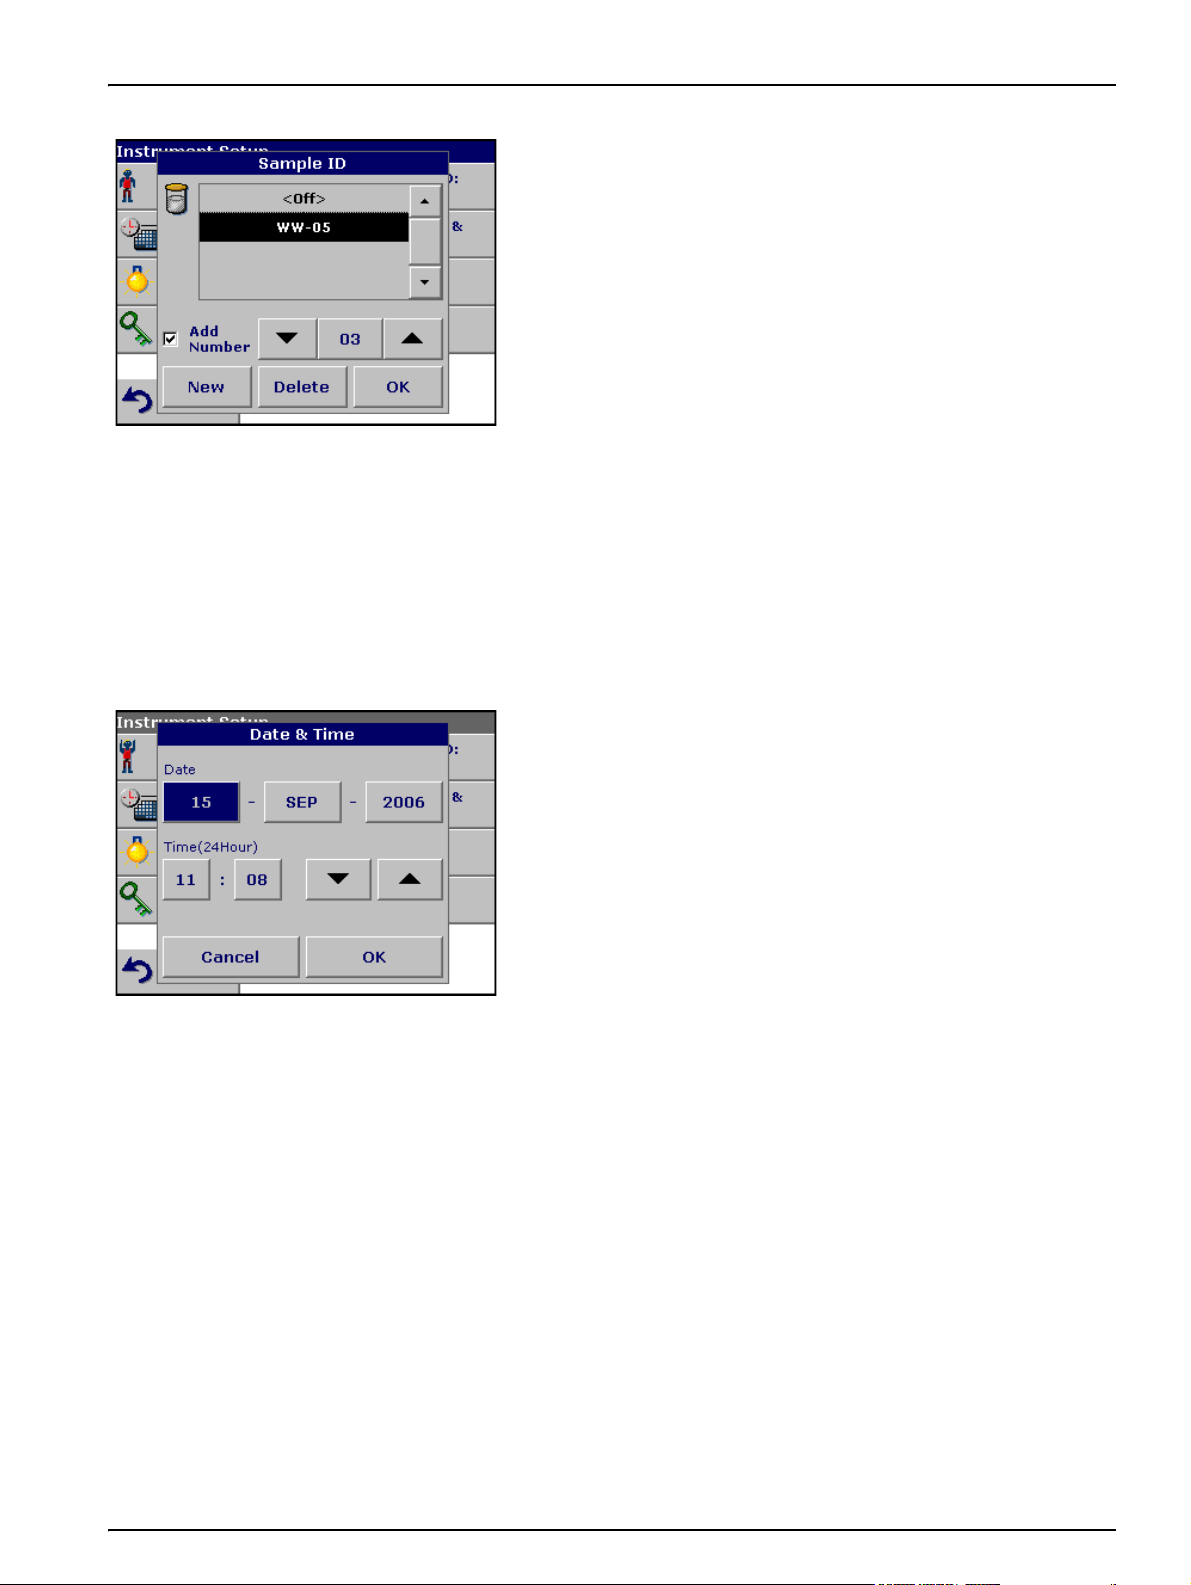
5. To number the Sample IDs sequentially (e.g. Inflow (01 etc.)),
select Add Number.
• Use the arrow keys to specify the first number of the
sequence.
• Use the key between the arrow keys to enter the first
number of the sequence using the alphanumeric keypad.
6. Press OK to return to "Instrument Setup".
7. The Sample ID is activated. Each Sample ID is automatically
numbered in ascending order after a measurement. The
number is shown in parentheses behind the Sample ID.
Note: To remove a Sample ID, highlight the ID and press Delete.
Note: A Sample ID can be entered or changed in measurement mode. In
the results screen, press Options>More>Instrument Setup
ID is already assigned, select the Sample ID symbol in the results screen.
. If a Sample
5.2.3 Date and time
1. Press Date & Time in the Instrument Setup.
2. The date and time are subdivided over a number of fields.
Press the appropriate field and use the arrow keys to change
the value.
3. Press OK to confirm. The instrument will return to
Instrument Setup.
27
Page 28
Standard Operations
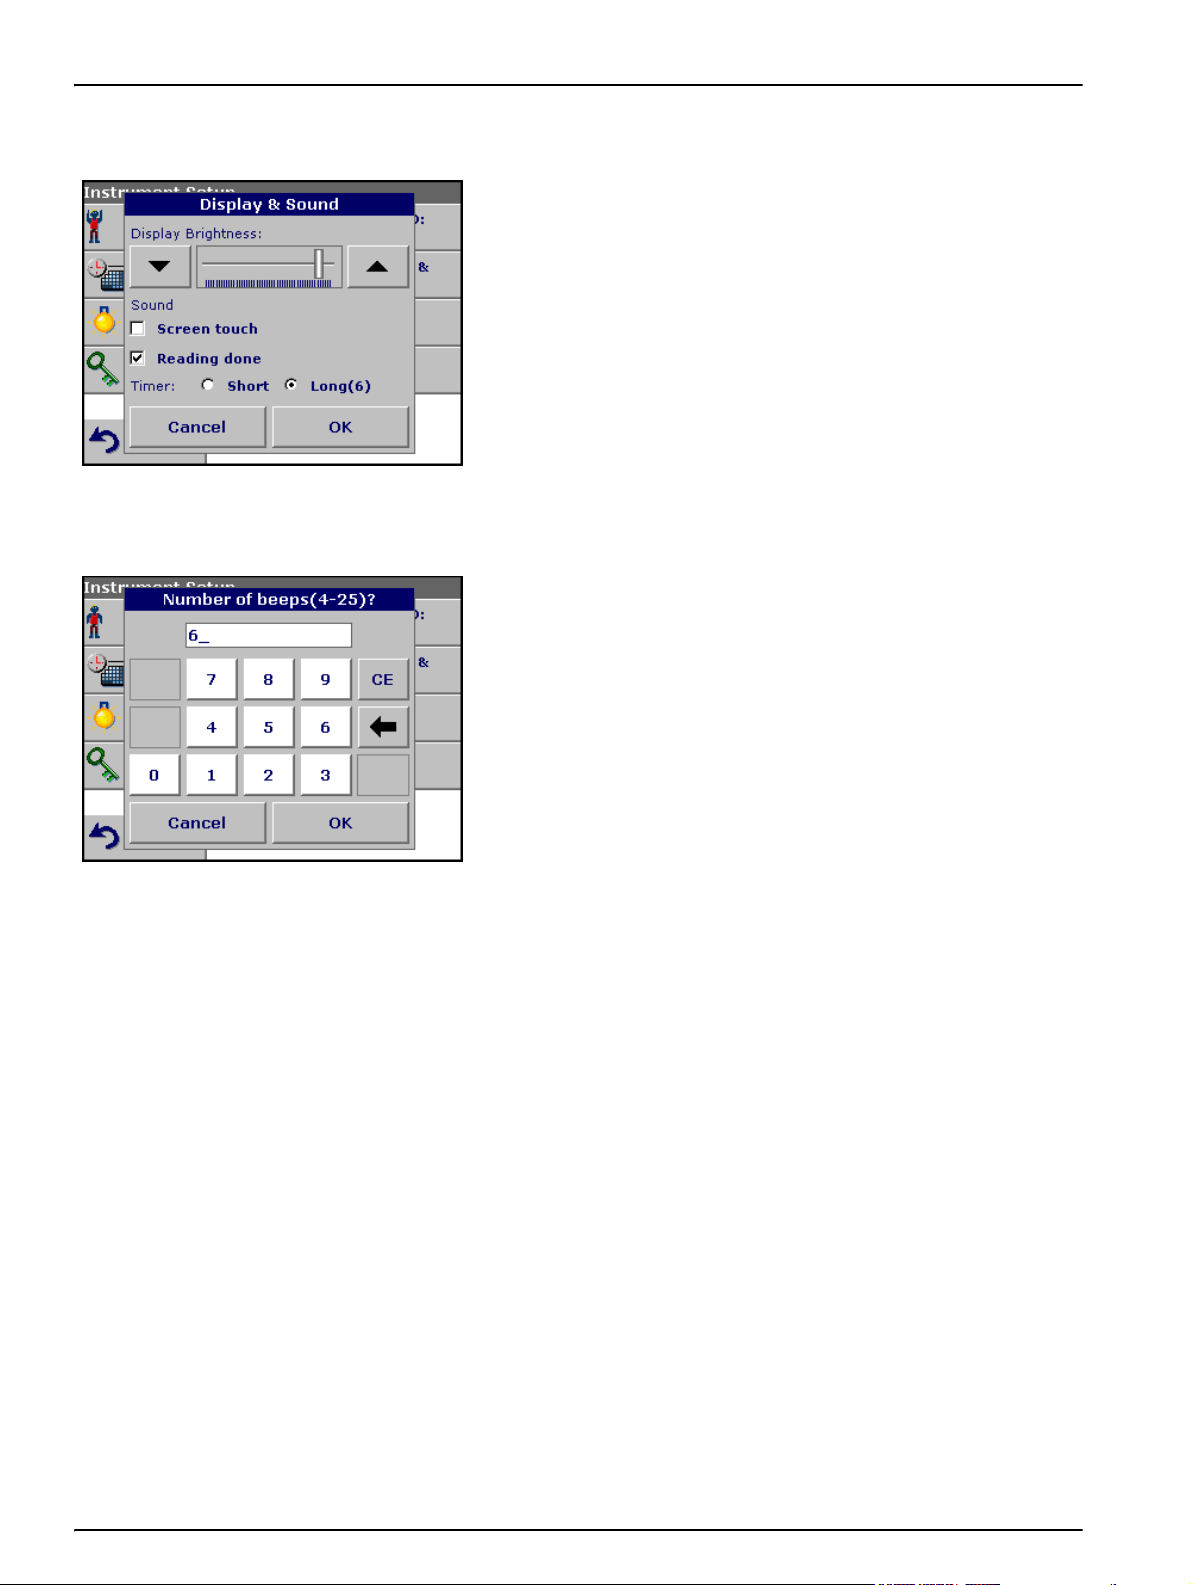
5.2.4 Display and sound preferences
1. Press Display & Sound in the Instrument Setup.
The following options will be displayed:
• Display Brightness—Adjusts the display brightness to suit
• Screen touch—Activates//Deactivates a short beep each time
• Reading done—Activates/Deactivates a sound when a
•Timer—Adjusts the length of the timer sound. Select Short or
2. Select Long to change the number of audio signals.
lighting conditions.
the screen is pressed (Default:off).
reading is complete (Default: short beep every time a reading is
complete).
Long. Long beeps are recommended for noisy environments.
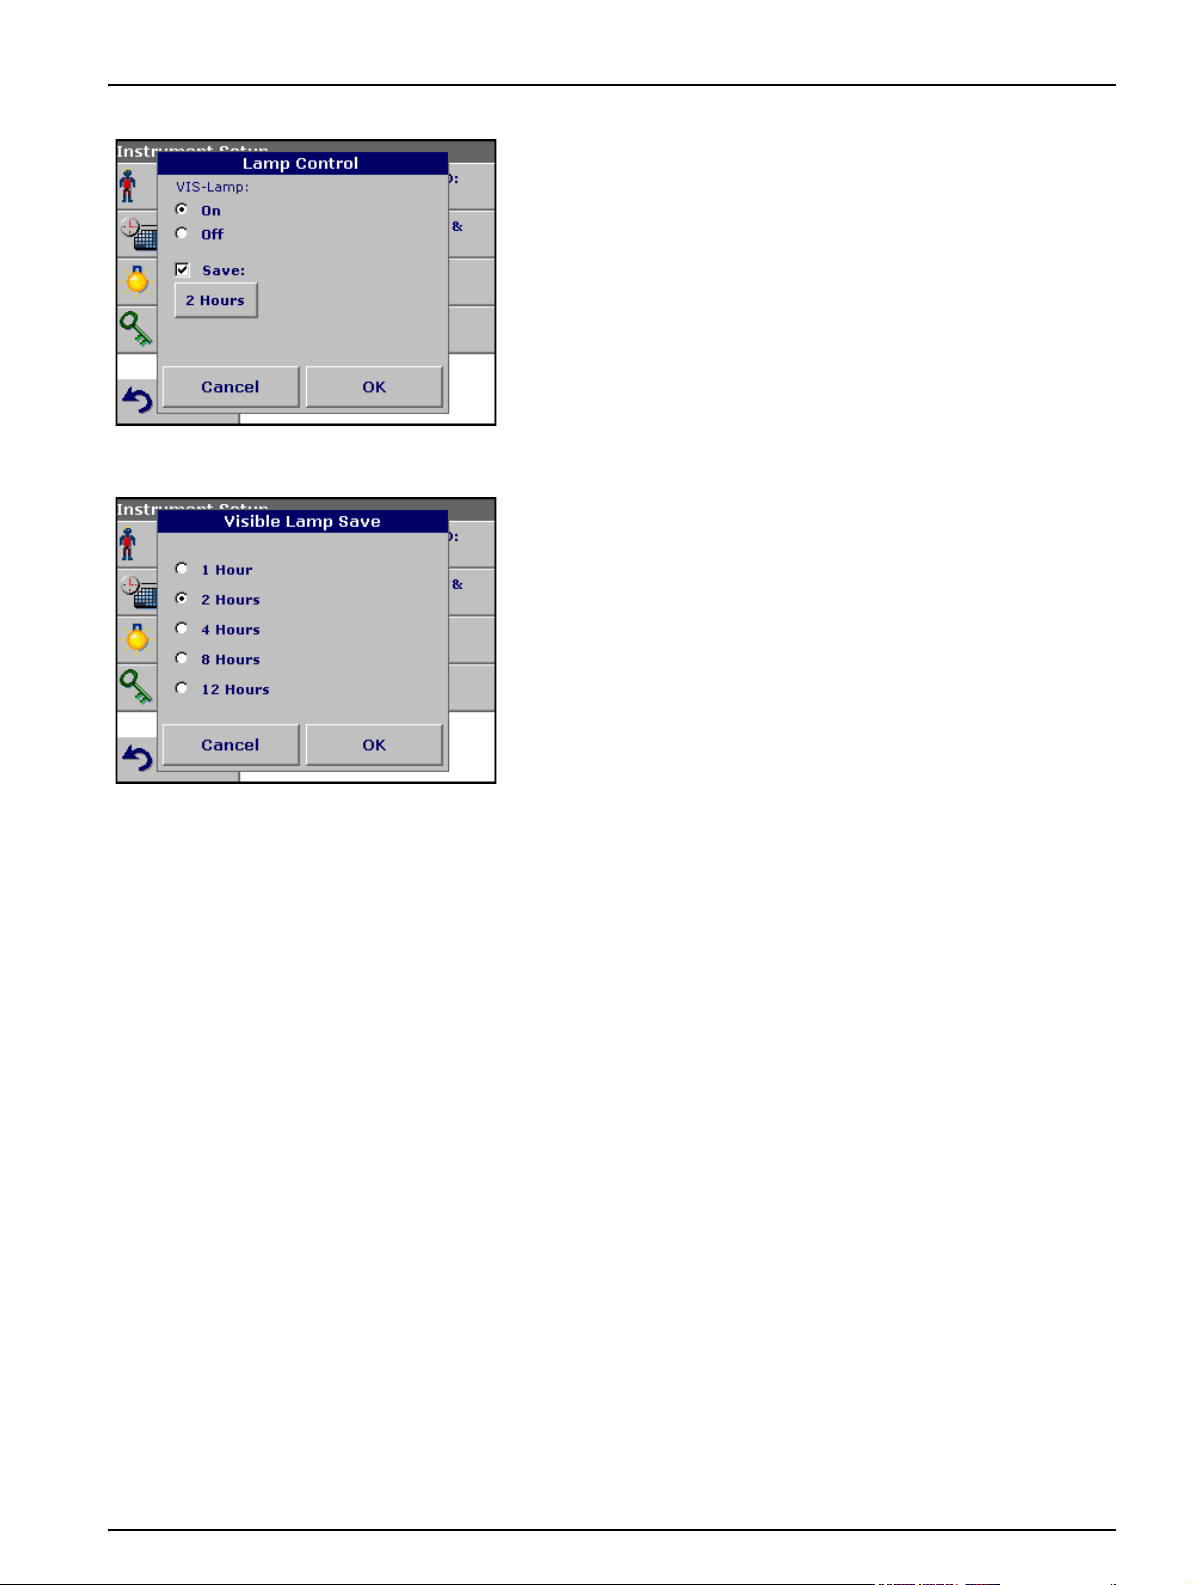
5.2.5 Lamp control
Use the alphanumeric keypad to enter/specify the number of
audio signals (4–25).
Note: A high number of audio signals increases the duration of the
tones and a small number of audio signals reduces the duration of the
tones.
3. Press OK to confirm. The selected number of the audio signals
sounds as a corresponding acoustic signal.
4. Press OK to confirm. The instrument will return to
Instrument Setup.
The tungsten lamp produces light in the wavelength spectrum
320 to 1100 nm.
The life span of the halogen lamp depends on the burning duration.
In order to extend the life span of the lamp, switch on the Lamp
control:
• If the instrument is not used during a longer period
(1–12 hours).
• If the instrument will never be switched off.
28
Page 29
Standard Operations
1. Press Lamp Control in the Instrument Setup.
2. Select On to switch on the Lamp.
3. Select Save: in order to define a time interval for the burning
time of the lamp.
4. Press the field below Save to select the lamp burning time.
5. Select the length of time the lamp will be switched on.
Note: After this period of time the lamp will automatical turn off, after
no measurement has been made.
Note: The lamp will be restarted automatically for measurements.
6. Press OK to confirm.
29
Page 30
Standard Operations
5.2.6 PC and printer
The DR 3800 series is provided with 2 USB interfaces, which are
located on the back of the instrument (see Figure 2 on page 13).
These interfaces can be used for exporting data and graphics to a
printer, updating data and for data communication to a personal
computer. These interfaces can be used for the connection of a
USB stick, an external USB keyboard or a USB Barcode handset
scanner.
Note: A USB hub may be used to connect several accessories at a time.
A USB memory stick is used to upgrade data, see section 6.8.2 on
page 110.
Important Note: A screened USB cable must not be longer than
3m!
Table 3 USB connector
USB Interfaces Description
USB (Type B)
USB (Type A) This USB port can be used to connect a printer, a USB memory stick and keyboard.
This USB interface is only intended for the connection DR 3800 - PC (with installation of the
HACH Data Trans Software).
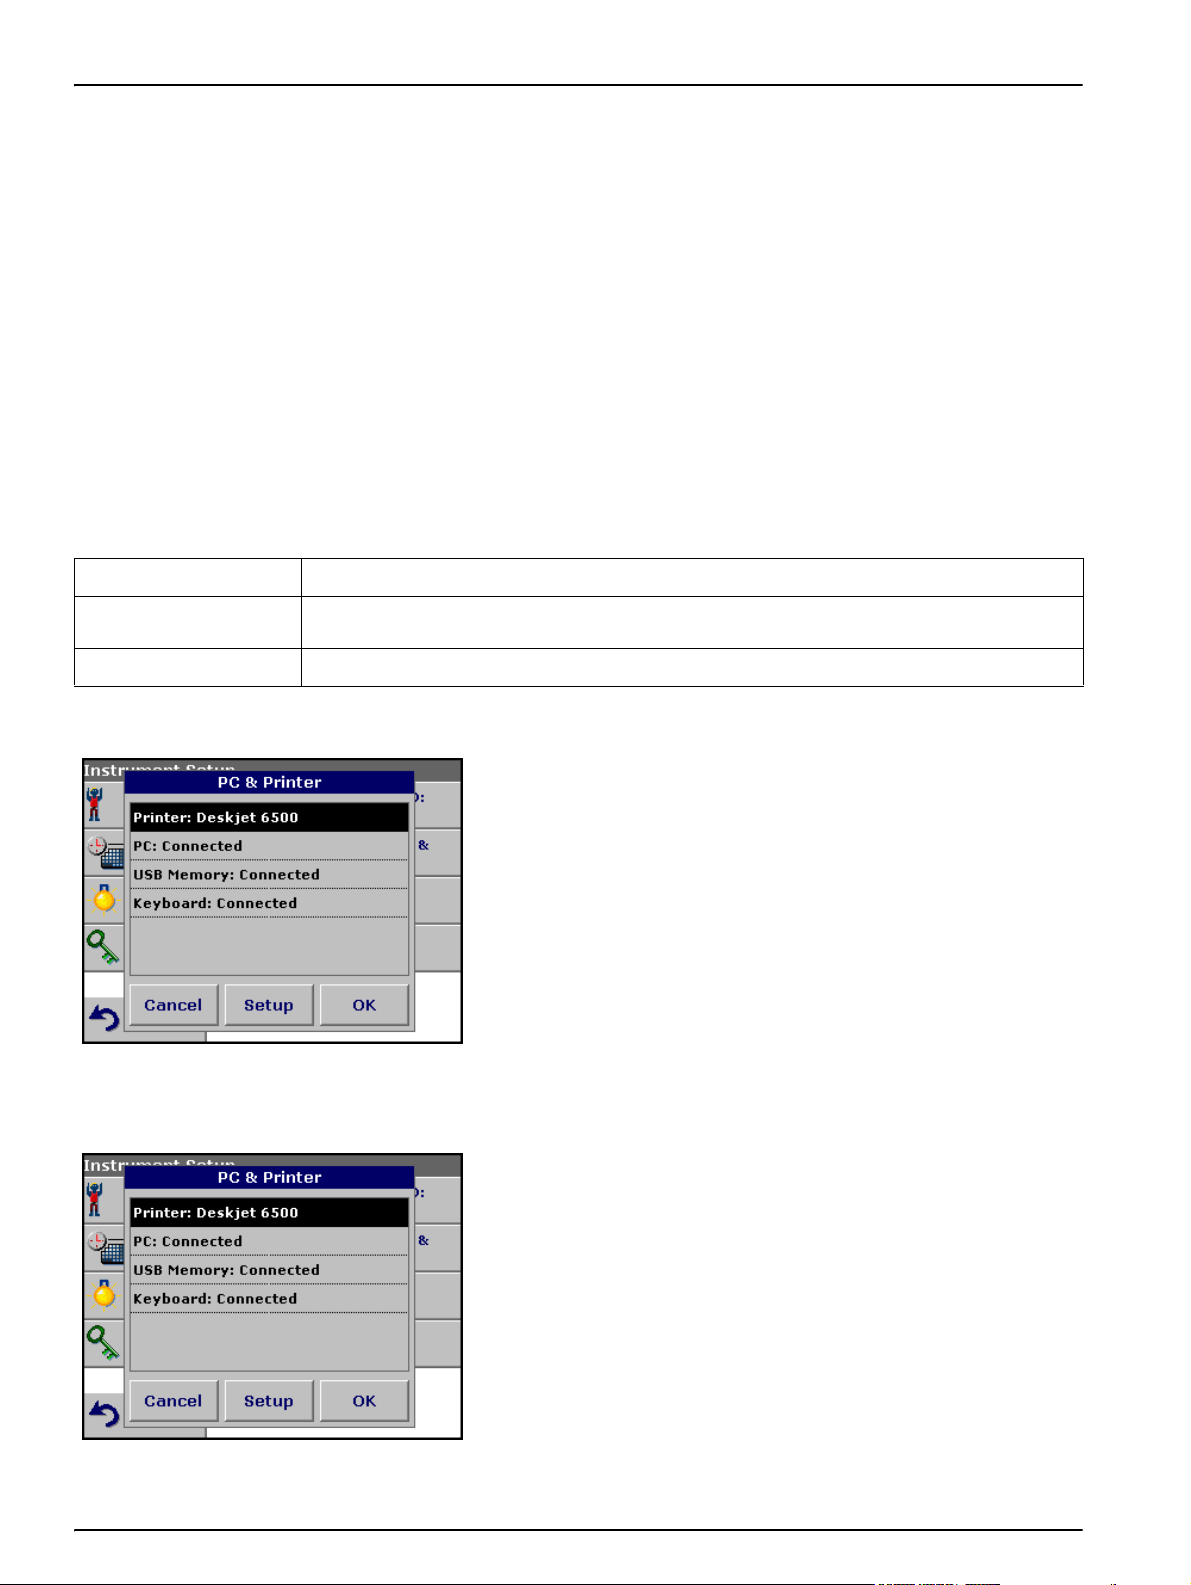
5.2.6.1 Printer setup
1. Press PC & Printer in the Instrument Setup.
A list with information about the connections opens.
For reasons of compatibility, the printer language must be
HP PCL 3.
2. Press Printer.
3. Press Setup to display the Printer Setup screen.
30
Page 31

Standard Operations
Printer Setup:
• Resolution: Font size
• Paper: Paper size
Note: If an optional Thermal Printer is connected, the function "Auto Send"
on/off is available (see Appendix C on page 147).
4. Press Resolution to select the print quality.
Select between
• 100 dpi
• 150 dpi and
• 300 dpi
5. Press OK to confirm.
Note: Press OK again to return to the Instrument Setup menu.
6. Press Paper to select the paper size.
Select between
• Letter
• Legal
• Executive
• A4
7. Press OK to confirm.
Note: Press OK again to return to the Instrument Setup menu.
31
Page 32

Standard Operations
5.2.6.2 Print data
5.2.7 Password
1. Press Recall Data in the Main Menu.
2. Select the data source, where the data to be printed are stored.
3. A list is displayed. Data can be filtered. For more information
see section 5.3.1.2 on page 35.
4. Press the Printer icon to send the data (table, curve)
immediately to the printer.
5. Highlight Single point or Filtered data or All data and press
OK to confirm.
Sending Data... is displayed until the data have been printed.
The Password menu contains a variety of security settings to
control access to various functions. For example, prevent
unauthorized changes to stored programs or instrument
configurations.
1. Press Password in the Instrument Setup menu.
2. In order to highlight the Security List assign a password. Press
Set Password.
3. Use the alphanumeric keypad to enter a new Password (up to
10 characters each) and press OK to confirm.
The access to the Security List is activated.
32
Page 33

Standard Operations
4. Press Security List to lock various functions for unauthorized
users.
5. Highlight the desired functions to control.
6. Confirm the Security List with OK to return to the Password
menu.
7. Press On to highlight the new settings of the Security List.
5.2.7.1 Deactivation password
8. Enter the new Password again to confirm.
9. Press OK to return to Instrument Setup.
Note: The alphanumeric keypad to the Password inquiry appears when a
user tries to reach a locked setting.
1. Press Password in the Instrument Setup.
2. Use the alphanumeric keypad to enter the former Password
and press OK to confirm.
33
Page 34

Standard Operations
5.2.8 Select color
3. Press Off to deactivate the settings of the Security List.
4. Press OK to return to Instrument Setup.
Note: Use this function to delete the former Password or to enter a new
one.
Select one of the four preset color palettes in the Select Color
menu.
1. Press Select color in the Instrument Setup.
A color chart list will appear.
2. Select a color category to highlight the color for the display
background.
3. Press OK to return to Instrument Setup.
34
Page 35

5.3 Store, recall, send and delete data
5.3.1 The data log
The data log will store up to 1000 readings taken in the following
modes: Stored Programs, Barcode Programs, User Programs,
Favorite Programs, Single Wavelength and Multi Wavelength. A
complete record of the analysis is stored, including the Date, Time,
Results, Sample ID and Operator ID.
5.3.1.1 Auto/manual data storage
The data storage parameter indicates whether data are to be stored
automatically or manually (in which case the user has to decide
which data to store).
1. Press Store: On/Off in the Options menu.
• With the Store On setting, all measurement data are stored
automatically.
• With the Store Off setting, no measurement data are
stored. However, this setting can be changed to Store On
in the result display through Configuration. The reading
currently shown in the display is then stored.
Standard Operations
Note: When the instrument's memory (data log) is full, the oldest data are
automatically deleted allowing the new data to be stored.
5.3.1.2 Recall stored data from the data log
1. Press Recall Data in the Main Menu.
2. Press Data Log.
3. Press Filter: On/Off.
A listing of the stored data is displayed.
35
Page 36

Standard Operations
4. The function Filter Settings is used to search for specific
items.
5. Highlight On to turn on the filters to select data by
• Sample ID
• Operator ID
• Start Date
• Parameter
or any combination of the four.
6. Press OK to confirm the selection. The chosen items are listed.
7. Press View Details to get more information.
36
Page 37

5.3.1.3 Send data from the data log
Standard Operations
Data is sent from the data log as CSV (Comma Separated Value)
files through a USB memory stick to a file named DATALOG. The
file can then be processed using a spreadsheet program. The file
name will be formatted as:
DLYear_Month_Day_Hour_Minute_Second. CSV.
To send data to a Printer, see section 5.2.6.2 on page 32.
1. Plug in the USB device (Figure 2 on page 13).
2. Press Recall Data from the Main Menu. Press Options and
then the PC&Printer icon.
3. Select the data to send to the memory stick and press OK.
Note: The number in parenthesis is the total number of data sets
assigned to this selection.
To send measurement data to a PC, see Appendix C on page 147.
5.3.1.4 Delete stored data from the data log
1. Press Recall Data in the Main Menu.
2. Press Data Log>Options>Delete.
3. Highlight Single Point or Filtered data or All data and press
OK to confirm.
Note: The number in parentheses is the total number of data sets
assigned to this selection.
37
Page 38

Standard Operations
5.3.2 Store, recall, send and delete data from wavelength scan and time course
The instrument can store 20 Wavelength Scans and 20 Time
Course Data sets.The data can be stored manually at the user's
discretion after viewing the data.
5.3.2.1 Data storage from wavelength scan or time course
1. Press the Store icon in the Options menu after a reading is
taken.
The Store Data list will be displayed.
2. Press Store to save the current scan to the highlighted
numbered line. A scan can also be overwritten.
5.3.2.2 Recall stored data from wavelength scan or time course
1. Press Recall Data in the Main Menu.
a. Select Wavelength Scan or Time Course to recall data.
b. If a program is already in progress, press
Options>More>Recall Data.
38
Page 39

Standard Operations
2. Press Graph to look at details.
Note: Press View Summary to return to the Recall Data list.
3. Press Table to look at details.
Note: Press View Summary to return to the Recall Data list.
5.3.2.3 Send data from wavelength scan or time course
There are two ways to recall sent data to a USB memory stick,
printer or PC with Hach Data Trans.
Option1:
1. Press Recall Data in the Main Menu and then Wavelength
Scan or Time Course.
2. Press Options and then the PC & Printer icon to send the data
to a USB memory stick, to a printer or to a PC with Hach Data
Trans.
39
Page 40

Standard Operations
• When a printer is connected, select how to send the data to
the printer (graph, table or both graph and table).
• When a USB memory stick is connected, the files will be
automatically sent as CSV files (Comma Separated Value)
to a file ”WLData“ (Wavelength Scan Data) or ”TCData“
(Time Course Data) to the USB memory stick.
The file name will be formatted as: ”ScanData_X.csv“
(Wavelength Scan Data) or ”TCData_X.csv” (Time Course
Data).
X = number of scans (1–20)
For further processing use a spreadsheet program.
Note: The advice ”Data already exist. Overwrite?“ appears when the files
were already stored. Press OK to overwrite the stored data.
Option 2:
1. Press Wavelength Scan or Time Course and then
Options>More>Send Data to send the data to a USB memory
stick or to a printer.
• When a printer is connected, select how to send the data to
the printer (graph, table or both graph and table).
• When a USB memory stick is connected, the files will be
automatically sent as CSV files (Comma Separated Value)
to a file ”WLData“ (Wavelength Scan Data) or ”TCData“
(Time Course Data).
The file name will be formatted as:
”ScanData_Year_Month_Day_Hour_Minute_Second.CSV“
(Wavelength Scan Data) or
The file name will be formatted as:
”TCYear_Month_Day_Hour_Minute_Second.CSV“ (Time
Course Data).
For further processing use a spreadsheet program.
40
Page 41

5.3.2.4 Delete stored data from wavelength scan or time course
1. Press Recall Data from the Main Menu and then Wavelength
Scan or Time Course or Options>More>Recall Data.
A listing of the stored data is displayed.
2. Highlight any data to delete.
3. Press Delete in the Options menu and press OK to confirm.
Standard Operations
41
Page 42

Standard Operations
5.4 Stored Programs
The instrument contains more than 200 programmed procedures.
They can be accessed through the Stored Programs menu.
5.4.1 Select a saved test/method; entering user-specific basic data
1. Press Stored Programs in the Main Menu to view an
alphabetical list of stored programs with program numbers.
The Stored Programs list will appear.
2. Highlight the required test.
Note: Select the program number by name or use the arrow keys to
scroll through the list quickly and highlight the program or press
Select by number to search for a specific program number. Use the
alphanumeric keypad to enter the test number and press OK.
3. Press Start to run the program. After a program is selected, the
screen for that parameter will appear.
5.4.2 Stored program options
Note: All corresponding data (wavelength, factors and constants) are
already preset.
4. Follow the chemical procedures described in the corresponding
Procedures Manual.
1. From the Main Menu, select Stored Programs. Select the
necessary method and press Start.
2. Press Options for Parameter Setup. Refer to Table 4 for stored
program descriptions.
Table 4 Stored programs options
Options Description
More For further Options
Store Off/On
With the Store On setting, all measurement data are stored automatically. With the Store Off
setting, no measurement data are stored.
42
Page 43

Table 4 Stored programs options (continued)
Options Description
% Trans/Conc/Abs To switch to % transmittance, concentration or absorbance readings
Standard Operations
Send Data icon /
Send Data
Information icon To open the help guide for further information, see Appendix B on page 143.
Timer icon
Reading Mode
Dilution Factor Off/On
Standard Addition
Standard Adjust
Chemical Form Some of the stored tests/methods allow to select the chemical form and the measuring range.
Reagent Blank
Save as User Program To store the selected parameters as a User Program, see section 6.1 on page 65.
To send Data to a printer, computer or USB memory stick (Type A)
This functions as a stopwatch. It helps to ensure that the steps of an analysis are correctly timed
(e.g. reaction times, wait times, etc., can be exactly specified). When the specified time has
elapsed, an acoustic signal is emitted. The use of the timer has no influence on the measurement
program.
Single Reading Mode: A reading is only displayed after a measurement has been carried out
(press Read; standard setting) (see section 5.4.4.1 on page 45).
Continuous Reading Mode: After the zero measurement, all readings are displayed
automatically and continuously (see section 5.4.4.2 on page 45).
A corrective dilution factor can be entered in order to take account of certain properties.
The number entered at the dilution factor prompt will be multiplied by the result to compensate for
the adjustment. For example, if the sample has been diluted by a factor of 2, enter 2. The default
setting of the dilution factor is turned off.
Note: When a dilution is in effect, the dilution icon will appear on the display.
This enables the accuracy of the measurements to be checked. The (working) procedure for a
test parameter contains a detailed explanation of how to use this function.
The (working) procedure for a test parameter indicates whether a standard adjustment is
necessary and, if so, how to proceed.
Some of the stored tests/methods include the "Reagent Blank" function. This enables the reagent
blank value to be added to or subtracted from, the subsequent readings. The reagent blank value
shifts the calibration curve along the y-axis, without changing the shape or gradient of the curve.
The effect corresponds to a y-axis intercept of the calibration straight line. This is made clear by
the following equation: Concentration = [(Conc. factor) * Abs] – (reagent blank value).
Recall Data Call up saved measurement data or time courses, see section 5.3 on page 35.
Instrument Setup Basic data of the instrument, see section 5.2 on page 25.
43
Page 44

Standard Operations
5.4.3 Use of program timers
Some procedures do not require the use of timers. Other
procedures require several timers. These timers are
pre-programmed into each Stored Program, along with a
description of the activity to be performed during the timed period.
1. Press the Timer icon on the display.
2. Press OK to start the first timer.
The timer will count down on the screen.
3. To start the next timed activity for the Stored Program, press
the Timer icon and OK.
Note: Press Close to view the measurement screen while the timer is
running. The time will be shown left side bottom instead of the date.
Note: Press Cancel to stop the timer midway through the countdown.
Note: The Timer will beep when the end of the running time is
reached.
5.4.4 Set the reading mode
A general purpose timer is also available in many programs. When
the timer icon is visible, press the icon and select General Timer.
A new screen will appear. Enter the length of the timed interval and
press OK to start the timer. The timer will beep when the timed
interval ends.
1. To highlight the required mode, press Reading Mode.
2. Select the required mode, then press OK, then Return to return
to the result display.
44
Page 45

5.4.4.1 Take single wavelength measurements (single reading)
1. Insert the blank cuvette into the cuvette/sample cell holder.
Press Zero.
Note:The Read key is only active after the zero measurement has
been carried out.
2. Insert the sample cuvette into the cuvette/sample cell holder.
Press Read.
Note: For data storage, see section 5.3.1 on page 35.
5.4.4.2 Take single wavelength measurements (continuous readings)
1. Insert the blank cuvette into the cuvette/sample cell holder.
Press Zero.
Standard Operations
Note: In the reading mode ”Continuous“ only the Zero key is shown to
start the reading. The reading sequence is started automatically.
2. Insert the sample cuvette into the cuvette/sample cell holder.
3. Press Options and then the Store icon to store the displayed
data in the Data Log.
Note: For data storage, see section 5.3.1 on page 35.
45
Page 46

Standard Operations
5.4.5 Set the dilution factor
The Dilution Factor function is used to calculate the original
concentration of a sample that has been diluted by a known ratio.
For example, dilution factor can bring the analyzed concentration
within the test range.
1. Press Options>More…>Dilution Factor.
The number entered at the dilution factor prompt will be
multiplied by the result to compensate for the adjustment.
For example, if the sample has been diluted by a factor of 2,
enter 2. The default setting of the dilution factor is turned off.
2. Press OK to confirm. Press again OK.
5.4.6 Run a standard adjust
Note: When a dilution is in effect, the dilution icon will appear on the
display.
Note: If using undiluted samples, set the dilution factor off again.
Note: For further information about the Help Guide (Information icon), see
Appendix B on page 143.
The Standard Adjust functions allows the calibration curve for a
stored program to be adjusted based on analysis of a known
standard solution. The Accuracy Check section of written
procedures often suggests a standard solution concentration for
this purpose.
Read a standard before setting Standard Adjust to On.
46
Page 47

Standard Operations
1. Follow the entire procedure, using a known standard for the
sample.
2. After reading the concentration, press
Options>More>Standard Adjust.
3. If Standard Adjust is set to Off, turn it On.
The Current Reading will show the concentration. The box on
the right will show the default standard value for the test, as
mentioned in the procedure.
4. If the measurement used a standard concentration that is
different from the one displayed in the box, press the box on the
right to enter a different standard value and enter the new
value. Press OK to confirm.
5. Press Adjust to enable the Standard Adjust. The Standard
Adjust icon will appear.
5.4.7 Set the chemical form
Note: The adjustment must be within certain limits, which vary with
each program. The allowable percentage is shown after "Adjustment“.
Note: When a Standard Adjust is in effect, the Standard Adjust icon
will appear on the display.
Note: For further information about the Help Guide (Information icon),
see Appendix B on page 143.
Some Stored Programs allow a variety of chemical forms to
be selected.
Press the unit (e.g. mg/L) or the chemical representation of the
evaluation form (e.g. Al
3+
). A list of available evaluation forms is
displayed. Select the required form by pressing the corresponding
entry in the list.
Note: To exit from the program, the evaluation form reverts to the standard
setting.
An alternative way of changing the standard setting:
47
Page 48

Standard Operations
1. Press Options>More>Chemical Form.
2. Select the Chemical Form.
Note: The stoichiometric conversion of the measurement result is
carried out automatically.
Note: The selected Chemical Form will appear on the display. Test
results will be calculated and displayed in this chemical form
5.4.7.1 Change of the default setting of the chemical form
1. Insert the sample cuvette or blank (depending on the working
procedure) into the cell compartment.
2. In the result display, press Options>More>Chemical Form.
3. A list of available evaluation forms appears. Select the new
default setting.
5.4.8 Run a reagent blank
4. Press Save as Default.
The current result and all further measurements will be displayed in
the new chemical form.
Some of the stored tests/methods include the "Reagent Blank"
function. This enables the reagent blank value to be measured and
then taken into account in calculating the measurement result.
Measurement/analysis of a reagent blank:
1. Prepare the test/method in accordance with the (working)
procedure. Instead of a sample, distilled water is used to
determine the reagent blank value.
2. Select the test. If required by the (working) procedure, insert
the reagent blank into the cell compartment. Press Zero.
3. Insert the prepared sample cuvette into the cell compartment.
Press Read. The result is displayed.
48
Page 49

Standard Operations
4. Press Options>More>Reagent Blank.
5. Press On to highlight the Reagent Blank function.
6. The concentration shown on the key is the measured value of
the reagent blank. To use this value for more analyses of this
parameter, press OK.
7. If the measurement does need to be saved, press the key and
use the alphanumeric keypad to enter a previously recorded
reagent blank value.
8. Press OK.
Note: The Reagent Blank function is deactivated when the measurement
program is left. To use the same blank value later for other tests using the
same reagent lot, enter the value per step 7.
Note: The results calculated using the reagent blank value must lie within
the limits of the measuring range of the test/method.
5.4.9 Analysis of samples
Note: The reagent blank icon is shown in the result display (see arrow)
when the function is active.
Note: For further information about the Help Guide (Information icon), see
Appendix B on page 143.
1. Press Stored Programs and select a program.
Note: For further information about the Help Guide (Information icon),
see Appendix B on page 143.
2. Insert the blank cuvette into the cuvette/sample cell holder.
3. Press Zero.
49
Page 50

Standard Operations
5.4.10 Update/edit tests
4. Remove zero solution and insert sample cuvette/cell into the
cell compartment.
5. Press Read. The result will be displayed.
6. For data storage, see section 5.3.1 on page 35.
General advices regarding the programming respectively updating
of program data.
For a manual test update and for a new programming of a test, see
section 5.4.10.1 and section 5.4.10.2 on page 51.
Note: Only in very few cases does the revision of a test require the test
specifications to be updated.
5.4.10.1 Manual update of test data
For the updating and editing of Barcode Tests, see section
section 5.5.6 on page 56.
When a test is selected the instrument automatically set the
measurement wavelength and factors.
Tests are continuously reviewed for simplified handling and to make
sure current legal requirements are followed. This can lead to a
change in the working procedure or an alteration to the factors. If
such an alteration is indicated on the test packaging, update the
instrument data according to the data supplied on the working
procedure inside the test packaging.
For updating from the Internet, see section 5.5.7 on page 61.
1. Press Stored Programs in the Main Menu and select a
program.
2. Press Program Options and then Edit.
50
Page 51

5.4.10.2 Program a new test
Standard Operations
3. The Data list of the corresponding test will appear.
The working procedures of the corresponding test contains the
new data (Wavelength, Factors, Measurement Ranges,
Conversion Factor for chemical Form etc.).
4. Highlight the corresponding line in the data overview and press
Edit.
5. Press OK and then Store after editing the test.
1. Press Stored Programs in the Main Menu.
2. Press Program Options and then New.
3. Use the alphanumeric keypad to enter the Program Number
indicated in the working procedure.
A data overview, which should show the program points of the
test that is to be programmed, is displayed.
The working procedures of the corresponding test contains the
new data (Wavelength, Factors, Measurement Ranges,
Conversion Factor for chemical Form etc.).
4. Highlight the line containing the test specification that is to be
programmed, then press Edit and enter the data in the
appropriate program lines.
5. Press OK and then Store after editing the test.
5.4.11 Add stored programs to the favorite programs list
The Favorites menu simplifies test selection by creating a list of the
most frequently used tests from the Stored Programs and
User Programs.
1. Press Stored Programs in the Main Menu. The Stored
Programs list will appear.
2. Highlight the selection by pressing it or Select by Number to
search for the program by number.
3. Press Program Options, Add to Favorites and press OK to
confirm.
The program can now be selected from Favorite Programs
menu in the Main Menu.
51
Page 52

Standard Operations
5.5 Barcode Programs
A special barcode reader in cell compartment #1 automatically
reads the barcode on the 13 mm cuvette/vial as the cuvette/vial
completes a single rotation. The instrument uses the barcode
identification to automatically set the correct wavelength for the
analysis and calculates the result immediately with the help of the
stored factors.
In addition, measured values are recorded at 10 different positions
during a rotation. A special outlier-elimination program is run and
then the average of the measured values is calculated. Cuvette/vial
errors and soiling are recognized and highly precise results are
obtained.
52
Figure 10 Cell compartment #1 for barcode 13 mm cuvettes/vials
Page 53

5.5.1 Complete a barcode 13 mm test/vial
1. Insert the light shield in cell compartment #2.
2. Prepare the barcode 13 mm cuvette/vial in accordance with the
working procedure and insert the cuvette/vial in cell
compartment #1.
• When a coded cuvette/sample cell is placed in cell
• Otherwise, press Barcode Programs in the Main Menu.
Note: For further information about the Help Guide (Information icon), see
Appendix B on page 143.
Standard Operations
compartment #1 (Figure 10), the corresponding
measurement program is automatically activated in the
Main Menu.
and insert the blank or sample cuvette/vial (depending on
the working procedure) in cell compartment #1.
The measurement is started automatically and the results are
displayed.
To evaluate other cuvette/vial tests and other parameters, insert the
prepared cuvette/vial into the cell compartment and read the result.
Note: The control bar displayed on the right of the screen shows the
relationship of the measurement result to the measuring range. The black
bar shows the measured result independently of any dilution factor that
was entered.
53
Page 54

Standard Operations
5.5.2 Select the measuring range
Some tests can be used for different measuring ranges. After the
sample cuvette/vial has been inserted, a list of the different
measuring ranges is displayed.
Select the required measuring range by highlighting the appropriate
line.
Press Start Permanent if this measuring range is to apply to all
subsequent measurements.
Changing the standard setting
In the result display, press Options>More>Permanent: On. The
key will change to Permanent: Off.
5.5.3 Select the chemical evaluation form
The chemical form of the test result of a number of parameters can
be selected individually.
In the result display, press the unit (e.g. mg/L) or the chemical
representation of the evaluation form (e.g. PO
possible evaluation forms is displayed, from which the required
form can be selected. Press
Another way of changing the standard setting is:
1. In the result display, press Options>More>Chemical Form.
A list of available evaluation forms appears.
2. Select the required chemical form and press
Note: The selected chemical form is displayed, but does not become
the default. To change the default, see section 5.5.3.1.
5.5.3.1 Change of the default setting of the chemical form
1. Insert the blank or sample cuvette/cell (depending on the
working procedure) into the cell compartment.
OK to confirm.
3–
–P). A list of
4
OK to confirm.
54
2. In the result display, press Options>More>Chemical Form.
3. A list of available evaluation forms appear. Select the new
default setting.
4. Press Save as Default.
The current result and all further measurements will be displayed in
the new chemical form.
Page 55

5.5.4 Basic test-specific and sample-specific data settings
Press Options to change test or sample specific settings.
Table 5 Barcode program options
Options Description
More For further Options
Store Off/On
With the Store On setting, all measurement data are stored automatically. With the Store Off
setting, no measurement data are stored.
Standard Operations
Abs % Trans To switch to % transmittance or absorbance readings
Send Data icon /
Send Data
Timer icon
Information icon To open the help guide for further information, see Appendix B on page 143.
Dilution Factor Off/On
Chemical Form Some of the stored tests/methods allow to select the chemical form and the measuring range.
Edit To modify an existing program
Save as User Program To store the selected parameters as a User Program, see section 6.1 on page 65.
Recall Data
Instrument Setup Basic data of the instrument, see section 5.2 on page 25.
To send data to a printer, computer or USB memory stick (Type A)
This functions as a stopwatch. It helps to ensure that the steps of an analysis are correctly timed
(e.g. reaction times, wait times, etc., can be exactly specified). When the specified time has
elapsed, an acoustic signal is emitted. The use of the timer has no influence on the measurement
program.
A corrective dilution factor can be entered in order to take account of certain properties.
The number entered at the dilution factor prompt will be multiplied by the result to compensate for
the adjustment. For example, if the sample has been diluted by a factor of 2, enter 2. The default
setting of the dilution factor is turned off.
Note: When a dilution is in effect, the dilution icon will appear on the display.
Note: If undiluted samples are used, set the dilution factor off.
Call up saved measurement data, wavelength scans or time courses, see section 5.3 on
page 35.
55
Page 56

Standard Operations
5.5.5 Sample blank
Turbidity and color in the sample matrix can falsify the results of a
photometric analysis. The interference factors come from the
sample or are created by reactions with the reagents.
The influence of turbidity and/or color can be eliminated or reduced
by taking a sample blank reading.
In the barcode mode, a special cuvette/sample cell (LCW 919)
containing the sample blank is placed in cell compartment #1 after
the sample reading has been taken and is automatically measured.
The sample reading is then corrected by adding or subtracting the
blank value. The final result is displayed, with the message "After
blank value corr.".
Some barcode tests do not require a sample blank value to be
determined, as turbidity and color are dealt with during the test
procedure.
Note: For further information about the Help Guide (Information icon), see
Appendix B on page 143.
5.5.6 Update/edit barcode tests
5.5.6.1 Manual update of a barcode test
Using the data provided in the barcode, the instrument
automatically sets the measurement wavelength and factors. If a
discrepancy is detected between the barcode data and the stored
data or a new test is identified, the instrument requests an update.
Data types are described in Table 5.
Table 6 Program update options
Program point Description
Name Name of the analysis parameter
Version An abbreviation assigned by the user or the version number, etc. is entered here
Exact definition of the test: the number of wavelengths at which measurements are carried out,
Measurement process
Formula Definition of the evaluation formulas with which the test result is calculated
Variables
the number of absorbance measurements needed, the keys to be used, any waiting periods
between measurements, etc.
The number of variables shown in the display depends on the definition of the measurement
process and the formulas. Input of the numerical values of the wavelengths, factors, constants,
etc.
56
Page 57

Table 6 Program update options (continued)
Program point Description
This function can be used to enter abbreviations and defined times for up to four timers. Highlight
Timer 1, Timer 2,
Timer 3, Timer 4
the appropriate line and press Edit.
The timers are activated or deactivated with the control boxes on the left of the display. In the
next column, a selection can be made from a list of names that describe the corresponding work
step. In the third column, the times for each active timer are entered.
Standard Operations
Enter the Name
Check the working procedure in advance to determine whether this
point needs to be changed.
1. Highlight the line containing Name and press Edit. Use the
alphanumeric keypad to enter the name indicated in the
working procedure.
2. Press
OK to confirm.
Enter the Version
1. Highlight the line containing Versio n and press Edit. Use the
alphanumeric keypad to enter the name indicated in the
working procedure.
2. Press OK to confirm.
Enter the Measurement Process
For detailed information on entering the measurement process, see
section 6.1.2 on page 76.
Check the working procedure in advance to determine whether this
point needs to be changed.
1. Highlight the Measurement Process line in the data overview
and press Edit.
2. Press Edit, select the sequence to be edited and press Delete.
3. Press New and use the alphanumeric keypad to enter the
process indicated in the working procedure.
57
Page 58

Standard Operations
Enter the Formula, Concentration Units, Designation,
Measuring Ranges
For detailed information on entering the Formula, see section 6.1.2
on page 76.
Check the working procedure in advance to determine whether this
information needs to be changed.
1. Highlight the Formula line in the data overview and press Edit.
2. Select the formula, press Edit and use the alphanumeric
keypad to enter the data specified in the working procedure (for
C1=, C2=, units, name, measuring range limits, etc.).
Enter the Variables (Factors, Wavelength and Coversion
Factors)
For detailed information on entering the Variables, see section 6.1.2
on page 76.
Check the working procedure in advance to determine whether this
point needs to be changed.
1. Highlight the Variables line in the data overview and press
Edit.
2. Select the variable, press Edit and use the alphanumeric
keypad to enter the data specified in the working procedure (for
F1, F2, λ1, U1 etc.). Confirm each entry with OK.
Abbreviation of Variables:
F1: Factor 1
F2: Factor 2
λ1: Wavelength 1
U1: Conversion Factor 1 for the first chemical form
U2: Conversion Factor 2 for additional chemical forms etc.
Timer 1, Timer 2, Timer 3 and Timer 4:
The timers are activated or deactivated with the control boxes on
the left of the display. In the next column, a selection can be made
from a list of names that describe the corresponding work step. In
the third column, the times for each active timer are entered.
58
Page 59

5.5.6.2 Update an existing barcode test
Standard Operations
Note: Only in very few cases does the revision of a test require all test
specifications to be updated.
Option 1: Manual update of test data
1. Insert the light shield in cell compartment #2.
2. The instrument needs to be at the Main Menu or press
Barcode Programs in the Main Menu.
3. Insert the blank or sample cuvette/cell (depending on the
working procedure) in cell compartment #1.
4. After "Barcode controlnumber?", a data overview is displayed,
including the specifications of the test that is to be revised.
Note: The working procedures of the corresponding test contains the
new data (Wavelength, Factors, Measurement Ranges, Conversion
Factor for chemical Form, etc.).
5. Highlight the corresponding line and press Edit.
6. When finished programming, press Store and then Cancel to
return to the User Programs menu.
7. Press Start to begin the test with the new data.
Option 2: Manual check/revision of test data
If an incorrect entry was made during the data update and is not
recognized via the barcode of the cuvette/sample cell (e.g. an
incorrect measuring range), another option is available for checking
and if necessary revising, the test data.
1. Insert the light shield in cell compartment #2.
2. The instrument need to be at the Main Menu or press Barcode
Programs in the Main Menu.
3. Insert the blank or sample cuvette/cell (depending on the
working procedure) into the cell compartment #1.
4. Press Options>More>Edit.
5. A data overview is displayed, including the specifications of the
test that is to be revised. Compare the displayed data with the
data in the working procedure and edit the displayed data in
accordance with the working procedure.
59
Page 60

Standard Operations
5.5.6.3 Program a new test
1. The instrument needs to be at the Main Menu or press
Barcode Programs in the Main Menu.
2. Insert the sample cuvette/cell or blank (depending on the
working procedure) into the cell compartment.
3. After "Program not available", a data overview is displayed,
including the specifications of the test that is to be revised.
The working procedures of the corresponding test contains the
new data (Wavelength, Factors, Measurement Ranges,
Conversion Factor for chemical Form etc.).
4. Highlight the corresponding line including the specifications of
the test that is to be programmed and press Edit.
5. To finish programming, press Store and then Cancel to return
to the Main Menu.
6. Press Start to begin the test with the new data.
60
Page 61

5.5.7 Update from the internet
Standard Operations
To obtain the software for the update from the Internet at
www.hach-lange.com:
1. Go to http://www.hach-lange.com
2. Select the country and go to Download>Software.
3. Enter DR 3800 in ”Search for documents“.
4. Locate the appropriate download and follow the prompts for
saving the file(s) to the USB memory stick (Section 9 on page
131) or to the PC.
5. Unpack the ZIP file and save the files to the USB memory stick.
6. Press Instrument Update in the System Checks menu.
7. Connect the USB memory stick to the USB interface (type A)
on the instrument, see section 3.4 on page 13.
8. Press OK. The link is established automatically and the
software is updated.
9. Press OK to return to the System Checks menu.
Note: When the instrument software has been updated, a prompt to restart
the instrument is displayed.
5.5.8 Program an own barcode-readable applications with LCW 906
LCW 906 empty cuvettes can be used to program a
barcode-readable applications.
Several user applications can be assigned to this program number.
Note: Use the program name to assign the barcode application to
LCW 906.
1. Press Stored Programs in the Main Menu. Press Program
Options and then New.
2. Use the alphanumeric keypad to enter the Program Number
906.
3. A data overview is displayed, including the specifications of the
test that is to be revised.
4. Highlight the corresponding line in the data overview and press
Edit.
For general advices on updating program data, see section 5.5.6
on page 56 and section 6.1.2 on page 76.
61
Page 62

Standard Operations
5.5.8.1 Evaluation of barcode-readable appliaction with LCW 906
1. The instrument needs to display the Main Menu or the
Barcode Programs menu.
2. Insert the cuvette LCW 906.
3. Select the required application 906 from the displayed list and
press Start.
Note: Press Start Permanent if this application 906 is to apply to all
subsequent measurements.
To disable the function Start permanent:
Insert the cuvette LCW 906 and close the cell compartment. Press
Options>More>Permanent: On.
5.5.8.2 Edit/delete of barcode-readable appliaction
To edit a barcode-readable application:
1. Press Stored Programs in the Main Menu and select a
program.
a. Press Program Options and then Edit.
b. Insert the LCW 906 cuvette, press Options>More>Edit.
2. The Data list of the corresponding application will appear.
3. Highlight the corresponding line in the data overview and press
Edit.
General advices regarding the programming respectively updating
of program data, see section 5.5.6 on page 56 and section 6.1.2 on
page 76.
62
Page 63

Standard Operations
To delete a barcode-readable application:
1. Press Stored Programs in the Main Menu and select a
program.
2. Press Program Options and then Delete.
3. Press OK.
63
Page 64

Standard Operations
64
Page 65

Section 6 Advanced Operations
6.1 User Programs
User programs provide the opportunity to complete "made to
measure" analysis.
The User Programs database is empty when the instrument leaves
the factory and is used to accommodate programs created by users
specific needs. Here are a few examples of entries:
• Programming of user-created procedures. The analysis
procedure must be developed first, before it can be
programmed. The user must define or determine the program
sequences, calculation formulas, measurement wavelengths,
factors, measuring range limits, etc.
• Modified tests
• Assignment of user programs to the favorites menu for
frequently used tests.
• Creation of a specific selection of methods and tests.
Press User Programs in the Main Menu and then
Program Options. The Program Options menu contains several
input and editing options (Table 7):
Table 7 Program options user programs
Options Description
Select New to program a new user program.
New
Add to favorites Select Add to favorites to add an existing user program to the list of frequently used programs.
Edit Select Edit to modify an existing program.
Delete
Note: The first time Program Options is selected, only the New option is available. The other
options remain inactive (grey) until the first program has been created.
Select Delete to remove a program from the list of user programs. The program will be
simultaneously deleted from the Favorites list.
6.1.1 Program a user method
All input steps and their significance and options are explained in
the following sections.
1. Select New in the Program Options menu.
65
Page 66

Advanced Operations
Program Number:
Specific test number, with which the program can subsequently be
called up from the selection list in the User Programs menu or the
Favorites menu.
2. Use the alphanumeric keypad to enter a program number
between 950 and 999. The lowest available number appears
automatically.
3. Press OK.
Note: If the program number is already assigned to another user
program, a message appears, asking whether the existing program
should be replaced. Press OK to overwrite the existing program.
Program Name:
4. Use the alphanumeric keypad to enter a program name. The
name can be a maximum of 28 characters long.
Program Type Description
5. Press Back to go back to the previous program point or press
Next to continue with the input of the program data.
Program Type:
6. Select the required option (Table 8) and press Next.
7. If the Single Wavelength (section 6.1.1.1 on page 67) or Multi
Wavelength (section 6.1.1.2 on page 68) is selected, define the
unit, wavelength, absorbance formula, wavelength λx,
concentration factor Kx, concentration resolution, chemical
form and calibration equation.
More information on Free Programming parameters see
section 6.1.2 on page 76.
Table 8 Program descriptions
Single Wavelength Measurements at a defined wavelength
Multi Wavelength
Free Programming
In the Multi Wavelength mode, absorbance values can be measured at up to four wavelengths
and the results can be mathematically processed to obtain sums, differences and relationships.
This is an advanced form of programming for original user-developed methods. In Free
Programming, the user defines the measurement process, variables and calculations involved in
obtaining a reading.
66
Page 67

6.1.1.1 Single wavelength settings
Advanced Operations
If the Single Wavelength mode is selected, the following
parameters can be defined:
Units:
Select the required unit from the list and press Next.
Note: Units of measure not included in this list can be added in the edit
program under Program Options, Edit. Select Units, Edit and then New.
Wavelength (single wavelength program type):
Use the alphanumeric keypad to enter the measurement
wavelength. The entered wavelength must be in the range from
320–1100 nm.
Press Next to proceed.
Concentration resolution (number of decimal places)
Select the required number of decimal places from the displayed
list and press Next.
67
Page 68

Advanced Operations
6.1.1.2 Multi wavelength settings
Chemical form:
Enter the chemical formula used in the display to represent the
analysis parameter.
Use the alphanumeric keypad to enter the chemical form and press
Next to enter Calibration settings.
If the Multi Wavelength mode is selected, the following parameters
can be defined:
Units:
Select the required unit from the list and press Next.
Note: Units of measure not included in this list can be added in the edit
program under Program Options, Edit. Select Units, Edit and then New.
Absorbance formula (multi-wavelength program type):
The Absorbance Formula menu is used to define the wavelengths
and the coefficients used in the formula. The absorbance formula
defines the calculation for the multi-wavelength measurement.
Press the appropriate key to edit the input.
Press the Formula key.
In the displayed list, select the formula for the program and press
OK to confirm.
68
Page 69

Advanced Operations
List of available absorbance formulas
A
is the absorbance at wavelength 1,
1
A
is the absorbance at wavelength 2 and so on
2
K
is the factor at wavelength 1,
1
K
is the factor at wavelength 2 and so on
2
If a subtraction has to be completed, the factors can be entered
with a minus sign.
Wavelength λ
Press a λ
wavelength. Press another λ
:
x
key and use the alphanumeric keypad to enter a
x
key and enter the next wavelength. If
x
necessary, repeat until all the wavelengths for the formula have
been entered. The wavelengths must be in the range from
320–1100 nm. Press OK.
Concentration Factor Kx
Multiplication factor for converting absorbance values into
concentration values.
Press a factor key and use the alphanumeric keypad to enter a
factor. If the formula includes more than one factor, press another
factor key and enter another factor and repeat until all the factors
have been entered. Press OK. When all the relevant data have
been entered, press Next.
Note: Up to five digits can be entered, including a maximum of 4 decimal
places to the right of the decimal.
Concentration resolution (number of decimal places)
Select the required number of decimal places from the displayed
list and press Next.
69
Page 70

Advanced Operations
Chemical form:
Enter the chemical formula used in the display to represent the
analysis parameter.
Use the alphanumeric keypad to enter the chemical form and press
Next to enter Calibration settings.
6.1.1.3 Calibration settings for single and multi wavelength mode
A method is calibrated by determining the absorbance values of
several standard solutions of known concentration.
There are three ways to create and store a calibration curve.
Instructions for each method follows (Table 9).
Table 9 Calibration settings
Mode Descriptions
A calibration table is created by entering the concentration values and the absorbance values of
Enter values
the analyte solution. The absorbance values are plotted versus standard concentrations and the
calibration curve is displayed as a graph (page 70).
A calibration table is created by entering the concentration values of the standard
Read Standards
solutions and then measuring the absorbance of the analyte solutions. The absorbance
values are plotted versus standard concentrations and the calibration curve is
displayed as a graph (page 72).
If the calibration curve can be determined from the mathematical relationship between
Enter Formula
concentration and absorbance by linear regression, etc., the corresponding formula can be
selected (linear, 2nd or 3rd order polynomial) from a list and the appropriate factors can be
entered (page 73).
Calibration by entering calibration values
Entering concentration/absorbance
1. Select the Enter Values and press Next.
70
Page 71

Advanced Operations
2. To enter the standard concentrations and corresponding
absorbance values in the displayed table, press the "+" symbol.
Use the alphanumeric keypad to enter the values.
Press OK and enter the corresponding absorbance value.
Press OK.
The entered data are displayed in the table. Repeat the
sequence for each data point to enter it.
3. To change a value in the table, highlight the appropriate line,
press the unit key (e.g. mg/L) or Abs and enter the changed
value via the alphanumeric keypad.
4. When the data have all been entered, press Graph to display
the curve that results from plotting the entered data.
Note: The correlation coefficient (r2) is shown on the left below the
axes.
5. The linear equation corresponds to the standard setting. Press
Next Curve to display the polynomial 2nd order curve. Press
Next Curve again, to display the polynomial 3rd order curve.
6. Press Force 0 to change the setting from Off to On. The curve
now passes through the origin of the coordinate system.
Note: This may have an adverse effect on the correlation coefficient
2
).
(r
7. Press Table to display the table again.
8. When the table has been completed and the curve type has
been chosen, press Done when the graph is displayed or Exit
when the table is displayed. Go to section 6.1.1.4 on page 74.
71
Page 72

Advanced Operations
Calibration by reading standards
1. Press Read Standards and press Next.
2. To enter the standard concentrations in the displayed table,
press the "+" symbol. Use the alphanumeric keypad to enter
the standard concentration. Press OK.
3. Press the "+" symbol again (see arrow) and enter the next
standard concentration. Repeat this sequence until all standard
conentrations (maximum of 24 solutions) have been entered.
4. Highlight the line with the appropriate concentration and insert
the cuvette with the corresponding standard solution.
5. Insert the zero solution into the cell compartment. Press Zero.
6. Insert the first standard solution into the cell compartment.
Press Read.
Insert the second standard solution into the cell compartment.
Press Read.
Repeat this sequence until all the standard solutions have been
measured (maximum of 24 solutions).
The entered and measured data are displayed in the table.
Note: To delete a standard concentration, highlight the appropriate line and
press the Delete icon.
The timer icon shown in the display helps to ensure, when
necessary, that the steps of an analysis are correctly timed (e.g.
reaction times, wait times, etc., can be exactly specified). When the
specified time has elapsed, an acoustic signal is emitted. The use
of the timer has no influence on the measurement program.
7. When the data have all been entered and the measurements
have all been completed, press Graph to display the curve that
results from plotting the entered data.
72
8. The linear curve corresponds to the standard setting. Press
Next Curve to display the polynomial 2nd order curve.Press
Next Curve again to display the polynomial 3rd order curve.
Page 73

Advanced Operations
9. Press Force 0 to change the setting from Off to On. The curve
then passes through the origin of the coordinate system.
Note: This may have an adverse effect on the correlation coefficient
(r2).
10. Press Table to display the table again.
11. When the table has been completed and the curve type has
been chosen, press Done when the graph is displayed or Exit
when the table is displayed. Go to section 6.1.1.4 on page 74.
Calibration by entering the formula
1. Press Enter Formula and press Next.
2. Press the formula key.
A list of available formulas (linear and 2nd and 3rd order
polynomial) is displayed. Up to 4 coefficients can be entered,
depending on the selected formula. Press the required formula.
3. Depending on the selected formula, the required coefficients (a,
b, c...) are displayed. Press the coefficient keys and enter the
corresponding values via the alphanumeric keypad. After each
entry, press OK to confirm.
Note: The coefficients can have 5 digits and can have a positive or a
negative sign.
73
Page 74

Advanced Operations
6.1.1.4 Store a user program
The input of the basic data is complete. An overview of the variable
program data is displayed.
1. To enter more specifications or change existing ones, highlight
the appropriate line and press Edit.
2. Select Store to save the user program.
6.1.1.5 Additional user-defined parameters and functions
In addition to the previously defined basic data, additional
parameters and functions can be defined for user programs:
• measuring range upper and lower limits
• timer functions
• chemical forms
Upper and lower limits of the measuring range
It is possible to enter a maximum (upper) and minimum (lower)
measurement value. An error message is displayed if a reading is
above the upper limit or below the lower limit.
3. Highlight the appropriate line in the overview of the program
data and press Edit.
4. Set On and press the 0.000 key to enter the measuring range
limit. Confirm the entry by pressing OK.
Timer 1 / Timer 2 / Timer 3 / Timer 4:
This function can define time intervals for up to four timers. Timer
designations such as Shake, Wait and Swirl can be assigned.
5. Highlight the appropriate line in the overview of the program
data and press Edit.
74
6. The timers are activated or deactivated with the check boxes in
the left part of the display. In the next column, a selection can
be made from a list of names that designate the corresponding
work step. In the third column, the times for each timer are
entered (in mm:ss).
Page 75

Advanced Operations
Chemical form 2 / chemical form 3 / chemical form 4:
If a Chemical Form 1 has been defined, up to three additional
alternative forms can be entered here.
7. Highlight the appropriate line in the overview of the program
data and press Edit.
8. The chemical forms are activated or deactivated with the check
boxes in the left part of the display.
9. Press the left key to enter another chemical form with the
alphanumeric keypad and press OK to confirm. Press the right
key to enter the conversion factor to calculate the concentration
of the additional chemical form from the concentration of
Chemical Form 1 and press OK to confirm.
10. Press Store to save the program data. Press Cancel to return
to the Main Menu.
75
Page 76

Advanced Operations
6.1.2 Free programming program type
Free Programming is an advanced option for entering original
user-developed methods. When the Free Programming option is
selected, an overview of the specifications of the programmed test
is displayed. Each input option can be modified to develop the user
method. Refer to Table 10 for more information. To modify an input
option, select the appropriate line and press Edit.
Important Note: Perform steps 1–6 of Programming a New User
Method (section 6.1.1 on page 65) before proceeding with Free
Programming.
Highlight the line containing the program point that is to be edited or
defined and press Edit.
Table 10 Definitions of the program points
Program point Description
Name Name of the analysis parameter
Version An abbreviation or version number assigned by the user is entered here.
Exact definition of the test: the number of wavelengths at which measurements are made, the
Measurement Process
Formula Definition of the formulas with which the test result is calculated.
Variables
Timer 1, Timer 2,
Timer 3, Timer 4
number of absorbance measurements needed, the keys to be used, any waiting periods between
measurements, etc.
The number of variables shown in the display depends on the definition of the measurement
process and the formulas. Input of the numerical values of the wavelengths, factors, constants,
etc.
Used to enter abbreviations and defined times for up to four timers. Highlight the appropriate line
and press Edit. The timers are activated or deactivated with the control boxes on the left of the
display. In the next column, a selection can be made from a list of names that describe the
corresponding work step. In the third column, the times for each active timer are entered.
6.1.2.1 Measurement process
The measurement process defines the handling and the
measurements of the test:
• At which and how many wavelengths should measurements be
completed
76
• How many absorbance measurements must be completed?
• When should the zero measurement and the sample
measurement be completed?
• Are waiting times necessary between measurements?
• Should individual program sequences be repeated?
Page 77

The elements of a measuring sequence, such as zero and sample
measurements and the timer(s) (reaction times, waiting times, etc.)
are individually defined.
6.1.2.2 Enter a new element of a measuring sequence
Important Note: Each component of the measurement process
must be entered in the order in which it will be completed.
1. Highlight the Measurement Process line in the data overview
and press Edit.
2. Press Edit again and then New.
Advanced Operations
Content and definition of the keys
[Z] key / Zeroing
1. Press the [Z] key to program a zero measurement. Confirm
with OK.
2. Press New and then Zeroing... and use the alphanumeric
keypad to enter the wavelength at which the zero measurement
is to be completed. Press OK and confirm the input by pressing
OK again.
3. If zero measurements are to be carried out at a number of
wavelengths, repeat the above two steps for each wavelength.
Note: The entered measurement sequence is displayed.
Process Timer key
1. Press the Process Timer key to enter any waiting, reaction or
handling times that have to be taken into account. Use the
alphanumeric keypad to enter the time. Press OK and confirm
the input by pressing OK again.
Note: This time is integrated into the measurement process.
Note: The entered measurement sequence is displayed.
77
Page 78

Advanced Operations
[R] key / Reading...
1. Press the [R] key to program a measurement of the substance
that is to be analyzed. Confirm with OK.
2. Press New and then Reading... and use the alphanumeric
keypad to enter the wavelength at which the measurement is to
be completed. Press OK and confirm the input by pressing OK
again.
3. If measurements are to be completed at a number of
wavelengths, repeat the above two steps for each wavelength.
Note: The entered measurement sequence is displayed.
{ } key
Elements of the measurement sequence that are to be repeated
are placed in
brackets.
The left bracket "{"marks the start of the sequence that is to be
repeated and the right bracket "}" marks the end.
Note: The key showing the right bracket remains inactive until a left bracket
is entered.
1. Press {.
2. Press the key that defines the sequence that is to be repeated:
[Z] or [R]. Confirm with OK.
3. Press New and then press Zeroing... or Reading... and use
the alphanumeric keypad to enter the wavelength at which the
measurement should be completed. Press OK and confirm the
input by pressing OK again.
4. Press } to end the sequence.
Note: If an action such as a zero measurement recurs at different
stages of a measurement sequence, the series of actions is numbered
sequentially (e.g. Z1, Z2, etc.).
Deleting an element of a measuring sequence
Select the appropriate line and press Delete. The element is
deleted.
78
Inserting an element of a measuring sequence
Select the line in the measuring sequence where the insertion is be
made and press New.
A new element can be entered at the selected position.
When the input is complete, press OK in the "Measurement
Process" display. The data overview is then displayed.
Page 79

6.1.2.3 Enter the calibration formula (evaluation formula)
The calibration formula (evaluation formula) defines the calculation
and display of intermediate and final results. The previously defined
elements of the measuring sequence are the basis for calculating
the concentrations.
Enter calibration formula C1
1. Highlight the Formula line in the data overview and press Edit.
Advanced Operations
2. Highlight the line C1: Off and press Edit.
3. Select C1: Off again and press Edit. The display changes to
C1: On.
4. Highlight the next line C1 = to define the formula and press
Edit.
Refer to Table 11 for detailed information on the Edit
formula keys.
Note: The evaluation formula is built up successively in the display in
accordance with the input.
Note: The arrow key deletes the most recently entered element of the
formula.
79
Page 80

Advanced Operations
Screen Key Description
Table 11 Edit formula key descriptions
Press the Abs/Variables key to select, from the
displayed list, the required element of the defined
Abs/Variables
measuring sequence and therefore the corresponding
measurement wavelength, so that this can be taken into
account in the formula.
New Number Press New Number to enter a new factor or constant.
Press +– ÷x, to enter a mathematical operation.
Select the operation and press OK to confirm.
The available choice of mathematical operations
depends on the defined formula.
This means that functions such as "( )" or "ln"/"log" etc.
are only active if a term in parentheses or the calculation
of a logarithm is mathematically permissible in the
defined formula (this also applies to the basic
mathematical operations).
The following mathematical operations are available:
+– ÷x
• + (Addition)
• – (Subtraction)
• ÷ (Division)
• x (Multiplication)
• ^ (Exponent)
80
• Ln (Natural logarithm)
• Log (Common logarithm)
Page 81

Table 11 Edit formula key descriptions (continued)
Screen Key Description
Press >=< to include logic statements/links/conditions in
the formula. The following functions are available:
= (Equal to), < (Less than), > (Greater than), <= (Less
than or equal to), >= (Greater than or equal to), IF,
THEN, ELSE
>=<
When the evaluation formula C1 has been entered
completely, press OK to confirm. Press OK again to
return to the Formula display.
When the formula C1 has been entered and confirmed,
the parameter name, upper and lower limits of the
measuring range and display result (yes, no) can be
entered.
Entering the next calibration formula (C2 or Cn)
1. Highlight C2: Off and press Edit.
Advanced Operations
2. Select C2: Off again and press Edit. The display switches to
C2: On.
3. Highlight the next line C2 = to define the formula and press
Edit.
In addition to the keys described in Table 11, only one other
function is available:
Select Conc. key
If an already defined formula, in this case C1, is to be taken into
account in the formula for C2, press Select conc.
Enter the number of the formula (e.g. 1 for C1) and press OK to
confirm.
Cn can now be linked with a mathematical operation.
Note: The Cn concentrations that are to be calculated are numbered in
sequence: C1, C2, C3, etc.
Note: When the first Cn formula has been defined, the Formula list is
automatically extended by Cn+1.
81
Page 82

Advanced Operations
6.1.2.4 Enter variables
1. Highlight the Variables line in the data overview and press
Edit.
2. Select the variable to be edited, press Edit and use the
alphanumeric keypad to enter the data specified in the working
procedure (for F1, F2, λ1, U1 etc.). Press OK to confirm each
entry.
Abbreviation of Variables:
F1: Factor 1
F2: Factor 2
λ1: Wavelength 1
U1: Conversion Factor 1 for the first chemical form
U2: Conversion Factor 2 for the further chemical form etc.
6.1.2.5 Save a free programming user program
1. Press Store to save the entered data. The data can be stored
under any data point (Measurement sequence, Formula, Timer,
etc.).
6.1.3 Select a user program
1. Press User Programs in the Main Menu to view an
alphabetical list of user programs with program numbers.
The User Programs list will appear.
Note: Use the scroll bar to scroll through the list quickly.
Note: Highlight the selection by pressing it or press Select by
Number to search for the program by number.
2. Press Start to run the program.
6.1.4 Add, edit and delete user programs from the favorites list
The most frequently used tests/methods in the User Program menu
can also be added to the list of favorites to simplify their selection.
82
Page 83

Advanced Operations
1. Press User Programs in the Main Menu.
The User Programs list will appear.
2. Highlight the selection by pressing it or press Select by
Number to search for the program by number.
Note: Use the scroll bar to scroll through the list quickly. Use the
alphanumeric keypad to enter the test number (program number) and
press OK to confirm.
3. Press Program Options.
4. Press Add to Favorites, Edit or Delete and press OK to
confirm.
Note: If the stored program is deleted in User Programs, it will also be
deleted in Favorites Programs.
6.1.4.1 Add to Favorites
1. Press Add to Favorites and press OK to confirm.
The program is added to the Favorites.
83
Page 84

Advanced Operations
6.1.4.2 Edit
6.1.4.3 Delete
1. Press Edit and press OK to confirm.
An overview of the specifications of the programmed test is
displayed. More information about the input options is provided
in the section 6.1.2 on page 76.
1. Press Delete and press OK to confirm.
The program is deleted from the list of User Programs.
Note: If the stored program is deleted in User Programs, it will also be
deleted in Favorites Programs.
84
Page 85

6.2 Favorite Programs
6.2.1 Recall a favorite program
Advanced Operations
The most frequently used tests/methods in the Stored Programs
menu and the User Programs menu can also be added to the list
of favorites to simplify their selection.
To add Stored Programs and/or User Programs to the favorites
list or the favorite programs, see section 6.1.4 on page 82.
1. Press Favorite Programs in the Main Menu.
The Favorite Programs list will appear.
2. Highlight the selection by pressing it.
Note: Use the scroll bar to scroll through the list quickly.
Note: Press Select by Number to search for the program by number.
Use the alphanumeric keypad to enter the test number (program
number) and confirm the input by pressing OK.
6.2.2 Delete a favorite program
3. Press Start.
1. Press Favorite Programs in the Main Menu.
The Favorite Programs list will appear.
2. Highlight the selection by pressing it.
Note: Use the scroll bar to scroll through the list quickly.
Note: Press Select by Number to search for the program by number.
Use the alphanumeric keypad to enter the test number (program
number) and confirm the input by pressing OK.
3. Press Remove Program and press OK to confirm.
Note: If a Favorite Programs is deleted, it will stay in the User
Programs or Stored Programs.
Note: If the stored program is deleted in User Programs, it will also be
deleted in Favorites Programs.
85
Page 86

Advanced Operations
6.3 Standard Addition – monitoring/checking results
The accuracy of measured values (their correspondence with the
actual concentration of the parameter in the sample) and their
precision (correspondence of the measurement results obtained
from several samples containing the same concentration of the test
parameter) can be determined or improved using the standard
addition method.
This method (also referred to as spiking) serves to identify
sample-specific interference factors, e.g. substances in the sample
that falsify the analysis (sample matrix effect), a defective
measuring instrument or contaminated reagents.
Method:
A defined amount (concentration) of a standard solution of the test
substance is added to the sample. The detection rate
(concentration of the added standard solution) should be close to
100%.
Detection rate Conclusion
100%
< 100%
Probability that the measurement results are correct
is high.
Assumption: The analysis was falsified by
substances in the sample (sample matrix effect)
Test to determine whether a sample matrix effect
is present:
Use distilled water instead of the sample. Add
standard solution as described in the procedure.
Detection rate Conclusion
Ions in the sample are
100%
interfering with the
analysis, causing false
results to be obtained.
≠ 100% No interference ions.
Measures to identify other interference factors:
Checklist:
1. Check if the procedure is completed correctly:
a. Are the reagents added in the correct order?
b. Is enough time allowed for color development?
c. Is the correct glassware in use?
d. Is the glassware clean?
e. Does the test require the sample to be at a certain
temperature?
f. Was the pH of the sample in the correct range?
g. Is the pipette volume correct?
86
Page 87

6.3.1 Complete a standard addition
Advanced Operations
2. Check the used reagents by repeating the standard addition
procedure with freshly prepared reagents.
Detection rate Conclusion
The originally used reagents were defective.
100%
If none of these measures resolves the problem, please contact the
manufacturer or a sales representative.
Carry out the standard addition in accordance with the
corresponding procedure.
There are two different methods:
Check the standard solution:
Repeat the standard addition procedure with a
freshly prepared standard solution.
Detection rate Conclusion
The originally used
100%
standard solution was
defective.
Peak volume (Standard addition):
Defined volumes of a standard solution are added step by step to
an already analyzed sample. The sample is measured again after
each addition.
Sample volume:
A defined volume of a standard solution of known concentration is
added to the volume of sample specified in the procedure and the
sample is measured after each addition. In most cases three
different standard solutions are prepared and the procedure is
repeated for each of them.
Note: The units and chemical forms used for the sample are used for the
standard solutions. Be careful to ensure that to use the correct units for
subsequent entries.
Peak volume/sample volume methods
1. Select Stored Programs in the main menu. Select the required
program.
2. Press Start.
3. Analyze a sample without added standard solution in
accordance with the instructions in the Procedures Manual.
When the measurement is complete, leave the sample
cuvette/cell in the cuvette/sample cell holder.
87
Page 88

Advanced Operations
4. Press Options>More>Standard Addition.
An overview of the data of the standard addition procedure is
displayed.
5. Press OK to accept the standard values for standard
concentration, sample volume (total) and standard addition
volume. Press Edit to change any of these values.
6. Press the key of the value to change it. Use the alphanumeric
keypad to change the value. Press OK to confirm.
88
Page 89

Advanced Operations
7. Press the keys to enter the standard addition volumes. Use the
alphanumeric keypad to enter the new data and press OK.
Description of the table of readings
• The first column shows the standard addition volume. 0 ml
stands for a sample containing no added standard.
• The second column shows the reading of the samples with and
without added standard.
• The third column shows the detection rate of the added
standard.
Note: The black highlighted line is active.
8. The reading of the sample in the instrument, without added
standard, is automatically shown under 0 ml.
9. Prepare the standard addition solution as described in the
procedure.
10. Use the arrow keys to select the first standard addition volume
in the table and insert the cuvette with the corresponding
volume of added standard into the cell compartment.
Press Read.
Repeat the procedure from point 8 with all the other standard
addition solutions.
11. After all the standard addition solutions have been measured,
press Graph.
The regression line through the standard addition data points is
displayed.
The correlation coefficient r
2
indicates how close the data
points are to the line.
If the correlation coefficient = 1, the curve is linear.
89
Page 90

Advanced Operations
The concentration shown above the curve is the estimated
concentration of the sample without the added standard.
Note: In the curve menu, the name on the Curve key switches to
Table. Press Table to display all the data in the table again.
12. Press Ideal line to display the relationship between the added
standard solutions and the ideal line (detection rate 100%).
90
Page 91

Advanced Operations
6.4 Single Wavelength (absorbance, concentration and transmittance measurements)
The Single Wavelength mode can be used in three ways. For
sample measurements at a single wavelength, the instrument can
be programmed to measure the absorbance, % transmittance or
concentration of the analyte.
Absorbance measures the amount of light absorbed by the sample,
in units of Absorbance.
% transmittance measures the percent of the original light that
passes through the sample and reaches the detector.
Turn the concentration factor on to select a specific multiplier for
converting absorbance readings to concentration. In a graph of
concentration versus the absorbance, the concentration factor is
the slope of the line.
6.4.1 Set up single wavelength mode
Press Single Wavelength in the Main Menu. Press Options for
Parameter Setup.
Table 12 Single wavelength setup options
Options Description
More For further Options
Store Off/On
% Trans/Abs To switch to % transmittance, concentration or absorbance readings
λ Wavelength
Timer icon
Concentration Factor Multiplication factor for converting absorbance values into concentration values.
Concentration
Resolution
With the Store On setting, all measurement data are stored automatically. With the Store Off
setting, no measurement data are stored.
To enter the measurement wavelength. Use the alphanumeric keypad to enter the measurement
wavelength. The entered wavelength must be in the range from
320–1100 nm.
This functions as a stopwatch. It helps to ensure that the steps of an analysis are correctly timed
(e.g. reaction times, wait times, etc., can be exactly specified). When the specified time has
elapsed, an acoustic signal is emitted. The use of the timer has no influence on the measurement
program.
To select the position of the decimal point in the calculated concentration readings.
91
Page 92

Advanced Operations
Table 12 Single wavelength setup options (continued)
Options Description
Single Reading Mode: A reading is only displayed after a measurement has been carried out
Reading Mode
Save as User Program To store the selected parameters as a User Program, see section 6.1 on page 65
(press Read; standard setting) (see section 6.4.2 on page 93).
Continuous Reading Mode: After the zero measurement, all readings are displayed
automatically and continuously (see section 6.4.3 on page 93).
Recall Data
Instrument Setup Basic data of the instrument, see section 5.2 on page 25.
Call up saved measurement data, wavelength scans or time courses, see section 5.3 on
page 35.
Concentration factor:
1. Press Concentration Factor: Off in the Options menu. Press
On to highlight this feature.
2. Press the ”Factor“ key and use the alphanumeric keypad to
enter the factor by which absorbance readings are to be
multiplied. Press the ”Unit“ key to select the units for
concentration measurements or to create a new unit.
3. Press OK to confirm.
Concentration resolution:
1. Press Concentration Resolution in the Options menu.
92
2. Select the resolution and press OK to confirm.
Page 93

Reading mode:
1. To highlight the required mode, start by pressing Reading
mode.
2. Select the required mode, then press OK, then Return to return
to the result display.
6.4.2 Take single wavelength measurements (single reading)
1. Insert the blank cuvette/cell into the cuvette/sample cell holder.
Press Zero.
Note: The Read key is only active after the zero measurement has
been completed.
Advanced Operations
2. Insert the sample cuvette/cell into the cuvette/sample cell
holder. Press Read.
3. For data storage, see section 5.3.1 on page 35.
6.4.3 Take single wavelength measurements (continuous readings)
1. Insert the blank cuvette/cell into the cuvette/sample cell holder.
Press Zero.
Note: In the reading mode ”Continuous“ only the Zero key is shown to
start the reading. The reading sequence is started automatically.
2. Insert the sample cuvette/cell into the cuvette/sample cell
holder.
3. Press Options and then the Store icon to store the displayed
data in the Data Log.
Note: For data storage, see section 5.3.1 on page 35.
93
Page 94

Advanced Operations
6.5 Multi-Wavelength mode – measurements at more than one wavelength
In the multi-wavelength mode, absorbance values can be
measured at up to four wavelengths and the results can be
mathematically processed to obtain sums, differences and
relationships.
Absorbance measures the amount of light absorbed by the sample,
in units of Absorbance.
% Transmittance measures the percent of the original light that
passes through the sample and reaches the detector.
Turning on the concentration factor allows selection of a specific
multiplier for converting absorbance readings to concentration. In a
graph of concentration versus the absorbance, the concentration
factor is the slope of the line. Concentration is calculated using a
single factor for each wavelength, which is input by the user.
6.5.1 Set the reading mode at different wavelengths
Press Multi Wavelength in the Main Menu. Press Options for
Parameter Setup.
Table 13 Multi-wavelength setup options
Options Description
More For further Options
Store Off/On
% Trans/Abs To switch to % transmittance, concentration or absorbance readings
λ Wavelength
Timer icon
Concentration Factor Multiplication factor for converting absorbance values into concentration values.
Concentration
Resolution
Absorbance Formula Calculation basis for evaluating samples
Save as User Program To store the selected parameters as a User Program, see section 6.1 on page 65
With the Store On setting, all measurement data are stored automatically. With the Store Off
setting, no measurement data are stored.
To enter the measurement wavelength. Use the alphanumeric keypad to enter the measurement
wavelength. The entered wavelength must be in the range from 320–1100 nm.
This functions as a stopwatch. It helps to ensure that the steps of an analysis are correctly timed
(e.g. reaction times, wait times, etc., can be exactly specified). When the specified time has
elapsed, an acoustic signal is emitted. The use of the timer has no influence on the measurement
program.
To select the position of the decimal point in the calculated concentration readings.
94
Page 95

Table 13 Multi-wavelength setup options (continued)
Options Description
Recall Data
Instrument Setup Basic data of the instrument, see section 5.2 on page 25.
Call up saved measurement data, wavelength scans or time courses, see section 5.3 on
page 35.
Advanced Operations
λ / Absorbance formula:
1. Press Absorbance Formula.
2. The formula selected in the top key determines the number of
wavelength and coefficent keys that will appear below. To
change the absorbance formula, press the top key, select a
formula from the displayed list and press OK. When a new
formula is selected, the number of variables below changes to
match.
The following formulas are available:
K
A 1 + K 2 A
1
K 1 A 1 + K 2 A 2 + K 3 A
K 1 A 1 + K 2 A 2 + K 3 A 3 + K 4 A
K 1 A 1 / K 2 A
(K 1 A 1 + K 2 A 2 ) / K 3 A
2
3
4
2
3
(K 1 A 1 + K 2 A 2 ) / (K 3 A 3 + K 4 A 4 )
A
refers to the absorbance at wavelength 1
1
A
refers to the absorbance at wavelength 2, etc.
2
K
refers to the coefficient at wavelength 1
1
K
refers to the coefficient at wavelength 2, etc.
2
Coefficients can be set negative where subtraction is required.
95
Page 96

Advanced Operations
3. To change a wavelength, press one of the ”λx:“ keys. Enter the
desired wavelength coefficient into the numeric keypad.
Press OK to confirm.
4. To change a coefficient, press one of the ”K
:“ keys. Enter the
X
desired coefficient into the numeric keypad.
Press OK to confirm.
Note: The instrument allows entry of up to 5 significant digits, with a
maximum of 4 significant digits after the decimal point.
Concentration factor:
1. Press Concentration Factor: Off in the Options menu. Press
On to highlight this feature.
2. Press the ”Factor“ key to enter the factor by which
absorbance readings are to be multiplied. Press the ”Unit“ key
to select the units for concentration measurements or to create
a new unit.
3. Press OK to confirm.
Concentration resolution:
1. Press Concentration Resolution in the Options menu.
2. Select the resolution and press OK to confirm.
96
Page 97

6.5.2 Complete a measurement in the multi wavelength mode
1. Insert the blank cuvette/cell into the cuvette/sample cell holder.
Press Zero.
Note: The Read key does not become active until the zero
measurement has been completed.
2. Insert the sample cuvette/cell into the cuvette/sample cell
holder. Press Read.
3. For data storage, see section 5.3.1 on page 35.
Advanced Operations
97
Page 98

Advanced Operations
6.6 Wavelength Scan mode – recording of absorbance and transmission
spectrums
In the wavelength scan mode, the absorbance of the light in a
solution over a defined wavelength spectrum is measured.
The measurement results can be displayed as a curve, as
percentage transmittance (%T) or as Absorbance (Abs). The
collected data can be printed as a table or a curve.
The data are available for formatting changes. These include
automatic scaling and zoom functions. Maximum and minimum
values are determined and shown as a table.
The cursor can be moved to any point on the curve for the purpose
of reading off the absorbance or transmittance value and the
wavelength. The data associated with each data point can also be
shown as a table.
6.6.1 Set up the wavelength scan
Press Wavelength Scan in the Main Menu. Press Options for
Parameter Setup.
Table 14 Wavelength scan setup options
Option Description
More For further Options
Store icon To store the scan data
From the displayed list of stored scans, a record is selected for use as a reference
scan/superimposed scan. This can be highlighted or shown in the background in comparison
Reference Off/On
with the actual measured scan.
Note: This option is only available when there are stored scans with the same wavelength range
and step.
λ To enter the wavelength spectrum and the scan interval
Enables the user to switch the display back and forth between the scan data tables
Select View
Cursor Mode
Send Data To send Data to a printer, computer or USB memory stick (Type A)
Integral: On/Off The integral gives the area and the derivative of the integral gives the original function
(wavelength/absorbance) and the graph of the curve.
Note: Select View will be activated after the first reading.
To select Track or Peak/Valley. The selection for this menu item determines to which points on
the graph the cursor moves.
98
Page 99

Table 14 Wavelength scan setup options (continued)
Option Description
Scale: In the automatic scaling mode, the y-axis is automatically adjusted so that the total scan is
Scale & Units
Recall Data
displayed.
The manual scaling mode allows sections of the scan to be displayed.
Units: Choice of absorbance or transmittance.
Call up saved measurement data, wavelength scans or time courses, see section 5.3 on
page 35.
Advanced Operations
Instrument Setup Basic data of the instrument, see section 5.2 on page 25.
λ Setting wavelength
1. Press the λ key in the Options menu to select the wavelength
range and the wavelength step.
2. Press the upper left key to open the numeric keypad and select
the minimum wavelength. Press OK to confirm.
3. Press the upper right key to open the numeric keypad and
select the maximum wavelength. Press OK to confirm.
Note: Do not select the same wavelength for minimum and maximum.
4. Highlight the required wavelength step.
Note: Scan recordings of high resolution data take a longer time than
recordings of low resolution data.Selecting a larger step allows the
instrument to scan faster, but decreases the resolution of the collected
data.
99
Page 100

Advanced Operations
5. According to the selected wavelength range, select the interval
from the actively displayed wavelength steps. In summery
maximally 780 measuring steps can be accomplished during a
Scan.
Note: The maximum wavelength adjust automatically if the difference
between the maximum and minimum wavelength is not a multiple of
the interval.
6. Press OK to return to the scan mode. Selected parameters are
displayed along the graph‘s x-axis.
Select view (displaying table)
1. Press Select View in the Options menu after a reading is
taken.
2. A table with the results is displayed.
3. To return to the graph press Options and then View Graph.
Cursor mode
1. Press Cursor Mode: Track in the Options menu.
2. The selection for this menu item determines what data are
displayed in the table. Highlight Track or Peak/Valley.
3. Press OK to confirm.
4. Press Return to return to the scan mode.
Integral
The Integral applies to the whole wavelength range of the scan.
1. Press Integral: Off in the Options menu.
2. Highlight On to show the Integral. To find the integral of other
wavelength ranges, change the wavelength range and scan
again.
3. Press OK to confirm.
100
 Loading...