

Page 1
49300-22
DR/2010
SPECTROPHOTOMETER
PROCEDURES MANUAL
© Hach Company, 1996–2000. All rights reserved. Printed in the U.S.A. ap/dk 12/99 7ed
jnb/dk 10/00 rev2
Page 2

2
Page 3

TABLE OF CONTENTS
INTRODUCTION .............................................................................................................. 11
Sample Procedure Explained .................................................................................................. 13
SECTION I CHEMICAL ANALYSIS INFORMATION......................................... 17
Abbreviations .......................................................................................................................... 17
Converting Chemical Species ................................................................................................. 18
Hardness Conversion ........................................................................................................... 19
Dissolved Oxygen................................................................................................................ 20
Sample Collection, Preservation and Storage ...................................................................... 22
Collecting Water Samples ................................................................................................ 25
Acid Washing Bottles....................................................................................................... 25
Correcting for Volume Additions ........................................................................................ 26
Boiling Aids ......................................................................................................................... 26
Sample Filtration.................................................................................................................. 27
Temperature Considerations ................................................................................................ 29
Sample Dilution Techniques................................................................................................ 29
Sample Dilution and Interfering Substances .................................................................... 30
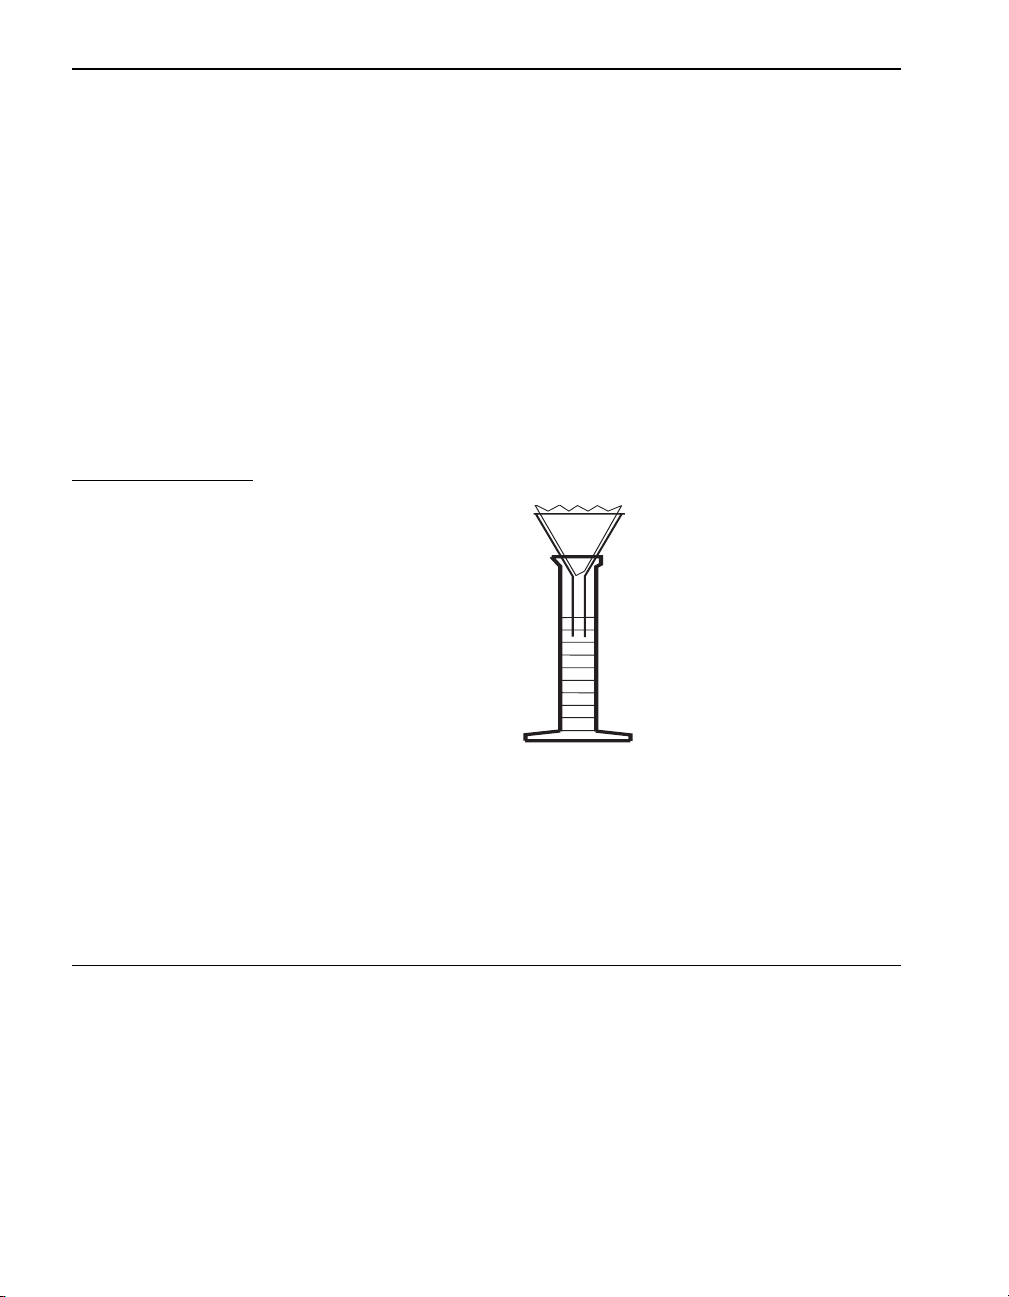
Using Pipets and Graduated Cylinders ................................................................................ 31
Using the TenSette Pipet...................................................................................................... 32
Operating the TenSette Pipet............................................................................................ 32
Mixing Water Samples ........................................................................................................ 33
Using Sample Cells.............................................................................................................. 35
Orientation of Sample Cells.............................................................................................. 35
Care of Hach 1-inch Sample Cells.................................................................................... 35
Cleaning Sample Cells...................................................................................................... 35
Sample Cell Matching ...................................................................................................... 36
Volume Measurement Accuracy ...................................................................................... 37
Using AccuVac Ampuls ...................................................................................................... 37
Using Reagent Powder Pillows............................................................................................ 38
Using PermaChem Pillows .................................................................................................. 39
Using the Pour-Thru Cell..................................................................................................... 39
Reagent and Standard Stability............................................................................................ 40
Interferences............................................................................................................................ 41
pH Interference .................................................................................................................... 41
Accuracy and Precision........................................................................................................... 42
Standard Additions............................................................................................................... 43
3
Page 4

TABLE OF CONTENTS, continued
Method Performance............................................................................................................... 50
Estimated Detection Limit................................................................................................... 50
Precision .............................................................................................................................. 53
Estimating Precision......................................................................................................... 53
Selecting the Best Wavelength ............................................................................................... 54
Adapting HACH Procedures to Other Spectrophotometers................................................... 57
Preparing a Calibration Curve............................................................................................. 57
%T Versus Concentration Calibration ............................................................................. 57
Absorbance Versus Concentration Calibration ................................................................ 59
USEPA Approved and Accepted Definitions ......................................................................... 60
SECTION II SAMPLE PRETREATMENT ............................................................... 61
Digestion................................................................................................................................. 61
EPA Mild Digestion with Hot Plate for Metals Analysis Only........................................... 61
EPA Vigorous Digestion with Hot Plate for Metals Analysis Only ................................... 62
General Digesdahl Digestion (Not USEPA accepted) ........................................................ 63
Distillation .............................................................................................................................. 63
SECTION III WASTE MANAGEMENT AND SAFETY........................................ 65
Waste Management................................................................................................................. 65
Waste Minimization ............................................................................................................ 65
Regulatory Overview........................................................................................................... 65
Hazardous Waste Definition................................................................................................ 66
Characteristic Hazardous Waste Codes ............................................................................... 67
How to Determine if Waste is Hazardous ........................................................................... 67
Examples of Hazardous Waste............................................................................................ 68
Hazardous Waste Disposal.................................................................................................. 68
Management of Specific Wastes ......................................................................................... 69
Special Considerations for Cyanide Containing Materials .............................................. 69
Resources............................................................................................................................. 70
Material Safety Data Sheets.................................................................................................... 71
How to Obtain an MSDS..................................................................................................... 71
Sections of an MSDS........................................................................................................... 72
4
Page 5

TABLE OF CONTENTS, continued
Safety....................................................................................................................................... 74
Material Safety Data Sheet .................................................................................................. 74
Reading Labels Carefully .................................................................................................... 74
Protective Equipment........................................................................................................... 75
First Aid Equipment and Supplies ....................................................................................... 75
General Safety Rules............................................................................................................ 75
OSHA Chemical Hygiene Plan............................................................................................ 76
SECTION IV PROCEDURES ........................................................................................ 77
ALUMINUM, Aluminon Method........................................................................................... 79
ALUMINUM, Eriochrome Cyanine R Method...................................................................... 87
ARSENIC, Silver Diethyldithiocarbamate Method ................................................................ 95
BARIUM, Turbidimetric Method ......................................................................................... 103
BENZOTRIAZOLE, UV Photolysis Method ....................................................................... 111
BORON, Carmine Method.................................................................................................... 117
BORON, Low Range, Azomethine-H Method .................................................................... 121
BROMINE, DPD Method..................................................................................................... 129
CADMIUM, Dithizone Method............................................................................................ 137
CHLORIDE, Mercuric Thiocyanate Method........................................................................ 145
CHLORINE, FREE, DPD Method ....................................................................................... 149
CHLORINE, FREE, DPD Rapid Liquid Method ................................................................ 157
CHLORINE, FREE, HIGH RANGE, DPD Method............................................................. 163
CHLORINE, FREE, DPD Test ‘N Tube™ Method ............................................................. 169
CHLORINE, TOTAL, Ultra Low Range, DPD Method ...................................................... 175
CHLORINE, TOTAL, Ultra Low Range, DPD Method ..................................................... 183
CHLORINE, TOTAL, DPD Method .................................................................................... 191
CHLORINE, TOTAL, DPD Rapid Liquid Method ............................................................. 199
CHLORINE, TOTAL, HIGH RANGE, DPD Method ........................................................ 205
CHLORINE, TOTAL, DPD Test ‘N Tube™ Method.......................................................... 211
CHLORINE DIOXIDE, LR, Chlorophenol Red Method..................................................... 217
CHLORINE DIOXIDE, HR, Direct Reading Method.......................................................... 221
CHLORINE DIOXIDE, DPD Method.................................................................................. 223
5
Page 6

TABLE OF CONTENTS, continued
CHROMIUM, HEXAVALENT, 1,5-Diphenylcarbohydrazide Method.............................. 233
CHROMIUM, TOTAL, Alkaline Hypobromite Oxidation Method ................................... 239
COBALT, 1-(2-Pyridylazo)-2-Naphthol (PAN) Method ..................................................... 245
COLOR, NCASI 253, Platinum-Cobalt Method.................................................................. 249
COLOR, TRUE AND APPARENT, APHA Platinum-Cobalt Standard Method ............... 253
COPPER, Bicinchoninate Method........................................................................................ 257
COPPER, Porphyrin Method................................................................................................ 265
COPPER, AUTOCATALYTIC, Colorimetric Method........................................................ 271
CYANIDE, Pyridine-Pyrazalone Method ............................................................................ 277
CYANURIC ACID, Turbidimetric Method......................................................................... 287
FLUORIDE, SPADNS Method............................................................................................ 291
FORMALDEHYDE, MBTH Method .................................................................................. 299
HARDNESS, Calcium and Magnesium; Calmagite Colorimetric Method.......................... 303
HARDNESS, TOTAL, Ultra Low Range, Calcium and Magnesium Chlorophosphonazo
Colorimetric Method ......................................................................................................... 309
HARDNESS, TOTAL, Ultra Low Range, Calcium and Magnesium; Chlorophosphonazo
Rapid Liquid Method ........................................................................................................ 313
HYDRAZINE, p-Dimethylaminobenzaldehyde Method ..................................................... 319
IODINE, DPD Method ......................................................................................................... 325
IRON, FerroZine Method ..................................................................................................... 333
IRON, FerroZine Rapid Liquid Method............................................................................... 339
IRON, FERROUS, 1,10 Phenanthroline Method................................................................. 345
IRON, TOTAL, FerroMo™ Method.................................................................................... 349
IRON, TOTAL, FerroVer Method ....................................................................................... 353
IRON, TOTAL, TPTZ Method............................................................................................. 361
LEAD, Dithizone Method..................................................................................................... 369
LEAD, LeadTrak™ Fast Column Extraction Method.......................................................... 377
MANGANESE, HR, Periodate Oxidation Method .............................................................. 387
MANGANESE, LR, PAN Method....................................................................................... 391
MERCURY, Cold Vapor Mercury Concentration Method.................................................. 397
MOLYBDENUM, MOLYBDATE, HR, Mercaptoacetic Acid Method.............................. 413
MOLYBDENUM, MOLYBDATE, LR, Ternary Complex Method ................................... 421
6
Page 7

TABLE OF CONTENTS, continued
NICKEL, 1-(2 Pyridylazo)-2-Naphthol (PAN) Method ....................................................... 427
NICKEL, Heptoxime Method............................................................................................... 433
NICKEL, AUTOCATALYTIC, Photometric Method ......................................................... 439
NITRATE, LR, Cadmium Reduction Method...................................................................... 443
NITRATE, MR, Cadmium Reduction Method..................................................................... 449
NITRATE, HR, Cadmium Reduction Method...................................................................... 457
NITRATE, HR, Chromotropic Acid Method, Test ‘N Tube™ ............................................ 465
NITRITE, LR, Diazotization Method ................................................................................... 471
NITRITE, LR, Diazotization, NED Rapid Liquid Method................................................... 477
NITRITE, LR, Test ‘N Tube, Diazotization (Chromotropic Acid) Method......................... 483
NITRITE, HR, Ferrous Sulfate Method................................................................................ 487
NITROGEN, TOTAL, HR, Test ’N Tube™, TNT Persulfate Digestion Method................ 491
NITROGEN, AMMONIA, Nessler Method......................................................................... 499
NITROGEN, AMMONIA, Salicylate Method ..................................................................... 505
NITROGEN, AMMONIA, High Range, Test ’N Tube, Salicylate Method......................... 511
NITROGEN, AMMONIA, Low Range Test ‘N Tube, Salicylate Method .......................... 517
NITROGEN, MONOCHLORAMINE and FREE AMMONIA, Salicylate Method............ 523
NITROGEN, TOTAL, Test ’N Tube, TNT Persulfate Digestion Method ........................... 531
NITROGEN, TOTAL KJELDAHL, Nessler Method .......................................................... 539
NITROGEN, TOTAL INORGANIC, Test ‘N Tube, Titanium Trichloride Reduction ....... 549
ORGANIC CARBON, TOTAL, Low Range, Direct Method.............................................. 557
ORGANIC CARBON, TOTAL, High Range, Direct Method ............................................. 565
ORGANIC MATTER, Dichromate Method......................................................................... 573
OXYGEN, DISSOLVED, LR, Indigo Carmine Method...................................................... 579
OXYGEN, DISSOLVED, HR, HRDO Method ................................................................... 583
OXYGEN, DISSOLVED, SHR, Super High Range Method............................................... 587
OXYGEN DEMAND, CHEMICAL, Reactor Digestion Method........................................ 591
Colorimetric Determination, 0 to 150 mg/L COD ............................................................. 593
Colorimetric Determination, 0 to 1,500 and 0 to 15,000 mg/L COD................................ 595
OXYGEN DEMAND, CHEMICAL (COD), Dichromate Reflux Method .......................... 601
Colorimetric Determination............................................................................................... 603
Buret Titration.................................................................................................................... 605
OXYGEN DEMAND, CHEMICAL, Manganese III Digestion Method ............................. 611
7
Page 8

TABLE OF CONTENTS, continued
OXYGEN DEMAND, CHEMICAL, Manganese III Digestion Method............................. 615
OXYGEN SCAVENGERS, Iron Reduction Method for Oxygen Scavengers .................... 623
OZONE, Indigo Method....................................................................................................... 627
PALLADIUM, N,N'-Dimethyldithiooxamide Method ........................................................ 631
PCB IN SOIL, Immunoassay Method.................................................................................. 635
PHENOLS, 4-Aminoantipyrine Method .............................................................................. 645
PHOSPHONATES, Persulfate UV Oxidation Method........................................................ 651
PHOSPHORUS, REACTIVE, PhosVer 3 Method, Test ’N Tube Procedure ...................... 657
PHOSPHORUS, REACTIVE, (Also called Orthophosphate) Amino Acid Method ........... 663
PHOSPHORUS, REACTIVE, (Also called Orthophosphate) Molybdovanadate Method.. 669
PHOSPHORUS, REACTIVE, PhosVer 3 (Ascorbic Acid) Method.................................... 677
PHOSPHORUS, REACTIVE, LOW RANGE, Ascorbic Acid Rapid Liquid Method........ 685
PHOSPHORUS, REACTIVE, HIGH RANGE, Molybdovanadate Rapid Liquid Method . 691
PHOSPHORUS, REACTIVE, HR, Molybdovanadate Method, Test ’N Tube™ ............... 697
PHOSPHORUS, TOTAL, Acid Persulfate Digestion Method............................................. 703
PHOSPHORUS, TOTAL, PhosVer 3 with Acid Persulfate Digestion Test ‘N Tube.......... 707
PHOSPHORUS, TOTAL, HR, Molybdovanadate Method with Acid Persulfate Digestion,
Test ’N Tube™.................................................................................................................. 715
PHOSPHORUS, ACID HYDROLYZABLE, PhosVer3 with Acid Hydrolysis,................. 723
Test ’N Tube...................................................................................................................... 723
PHOSPHORUS, ACID HYDROLYZABLE, Hydrolysis to Orthophosphate Method........ 729
POLYACRYLIC ACID, Absorption-Colorimetric Method ................................................ 733
POTASSIUM, Tetraphenylborate Method........................................................................... 741
QUATERNARY AMMONIUM COMPOUNDS, Direct Binary Complex Method ........... 747
SELENIUM, Diaminobenzidine Method ............................................................................. 753
SILICA, HR, Silicomolybdate Method ................................................................................ 761
SILICA, LR, Heteropoly Blue Method ................................................................................ 767
SILICA, ULTRA LOW RANGE, Heteropoly Blue Method ............................................... 773
SILICA, ULR, Heteropoly Blue Rapid Liquid Method ....................................................... 779
SILVER, Colorimetric Method............................................................................................. 785
SODIUM CHROMATE, Direct Colorimetric Method ........................................................ 791
8
Page 9

TABLE OF CONTENTS, continued
SULFATE, SulfaVer 4 Method ............................................................................................ 795
SULFIDE, Methylene Blue Method* ................................................................................... 803
SURFACTANTS, ANIONIC, Crystal Violet Method.......................................................... 807
SUSPENDED SOLIDS, Photometric Method...................................................................... 811
TANNIN AND LIGNIN, Tyrosine Method ......................................................................... 815
THM Plus™: Trihalomethanes, ........................................................................................... 819
TOXTRAK TOXICITY TEST, Colorimetric Method ......................................................... 829
TPH IN SOIL, Immunoassay Method................................................................................... 835
TPH IN WATER, Immunoassay Method ............................................................................. 845
TURBIDITY, Attenuated Radiation Method (direct reading) .............................................. 853
VOLATILE ACIDS, Esterification Method......................................................................... 857
ZINC, Zincon Method........................................................................................................... 861
SECTION V GENERAL INFORMATION ............................................................... 867
HOW TO ORDER............................................................................................................ 869
REPAIR SERVICE .......................................................................................................... 870
WARRANTY ..................................................................................................................... 871
9
Page 10

10
Page 11

INTRODUCTION
This manual is divided into five sections:
Section I Chemical Analysis Information
This section applies to all the procedures. It provides background
information and reference/review material for the technician or chemist.
Commonly used techniques are explained in detail.
Section II Sample Pretreatment
This section provides a brief overview of sample pretreatment and three
digestion procedures. Two are USEPA digestions. The Hach Digesdahl
method is also included.
Section III Waste Management and Safety
Section 3 includes information an waste management, regulations, waste
disposal and resources on waste management. The Safety portion covers
reading an MSDS and general safety guidelines.
Section IV Procedures
Section 4 contains step-by-step illustrated instructions for measuring over
120 parameters. The steps also include helpful notes. Each procedure
contains information on sample collection, storage and preservation,
accuracy checks, possible interferences, summary of method and a list of
the reagents and apparatus necessary to run the test.
Section V Ordering Information
This section provides information needed for ordering, shipping, return of
items and Hach trademarks.
Before attempting the analysis procedures the analyst
should read the instrument manual to learn about the
spectrophotometer’s features and operation.
11
Page 12

INTRODUCTION, continued
Hach Company Trademarks
AccuGrow
AccuVac
AccuVer™
AccuVial™
Add-A-Test™
AgriTrak™
AluVer
AmVer™
APA 6000™
AquaChek™
AquaTrend
BariVer
BODTrak™
BoroTrace™
BoroVer
C. Moore Green™
CA 610™
CalVer
ChromaVer
ColorQuik
CoolTrak
CuVer
CyaniVer
Digesdahl
DithiVer
Dr. F. Fluent™
Dr. H. Tueau™
DR/Check™
EC 310™
FerroMo
FerroVer
FerroZine
FilterTrak™ 660
Formula 2533™
Formula 2589™
Gelex
®
®
®
®
®
®
®
®
®
®
®
®
®
®
®
®
®
®
H2O University™
H2OU™
Hach Logo
Hach One
Hach Oval
Hach.com™
HachLink™
Hawkeye The Hach Guy™
HexaVer
HgEx™
HydraVer
ICE-PIC™
IncuTrol
Just Add Water™
LeadTrak
M-ColiBlue24
ManVer
MolyVer
Mug-O-Meter
NetSketcher™
NitraVer
NitriVer
NTrak
OASIS™
On Site Analysis.
Results You Can Trust
OptiQuant™
OriFlow™
OxyVer™
PathoScreen™
PbEx
PermaChem
PhosVer
Pocket Colorimeter™
Pocket Pal™
Pocket Turbidimeter™
®
®
®
®
®
®
®
®
®
®
®
®
®
®
SM
®
®
®
Pond In Pillow™
®
ion
√
®
®
®
®
™
SM
®
®
®
®
®
®
SM
®
®
®
®
PourRite
PrepTab™
ProNetic™
Pump Colorimeter™
QuanTab
Rapid Liquid™
RapidSilver™
Ratio™
RoVer
sens
Simply Accurate
SINGLET™
SofChek™
SoilSYS™
SP 510™
Spec ™
StablCal
StannaVer
SteriChek™
StillVer
SulfaVer
Surface Scatter
TanniVer
TenSette
Test ‘N Tube™
TestYES!
TitraStir
TitraVer
ToxTrak™
UniVer
VIScreen™
Voluette
WasteAway™
ZincoVer
12
Page 13
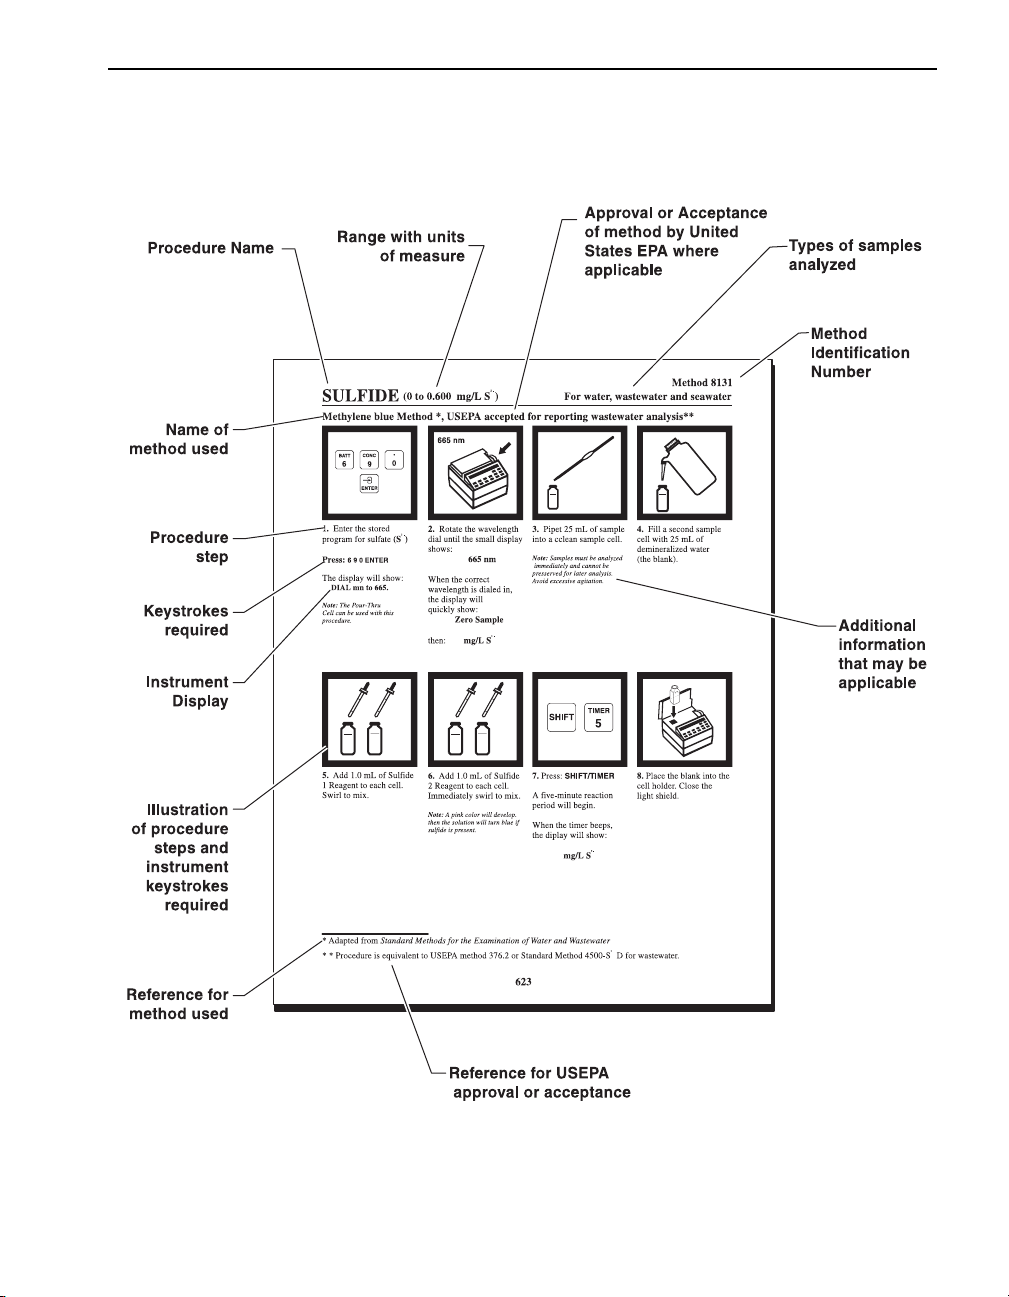
Sample Procedure Explained
13
Page 14
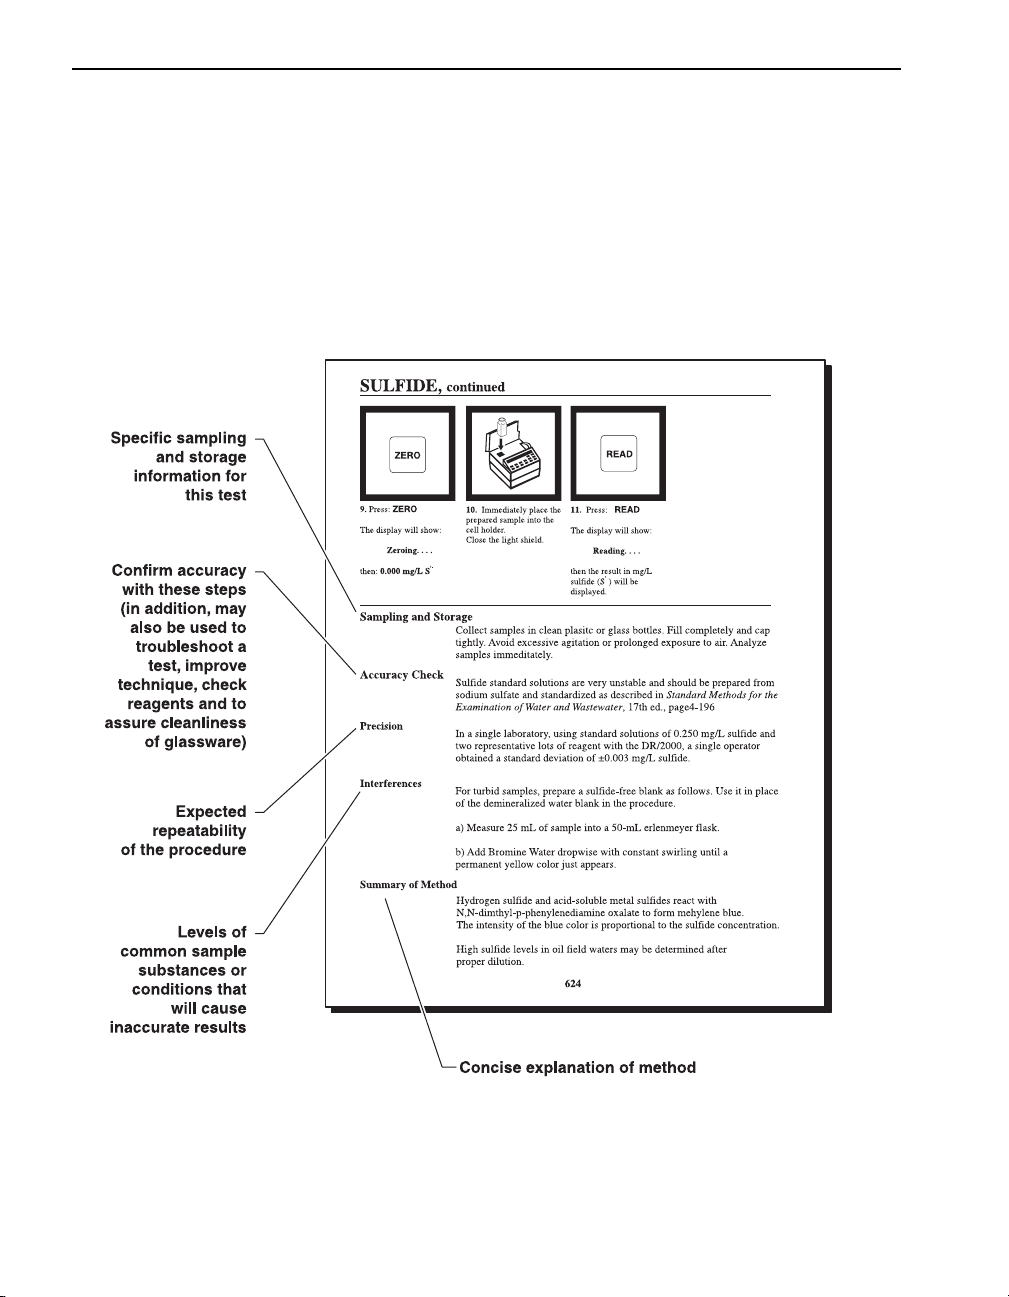
Sample Procedure Explained, continued
14
Page 15
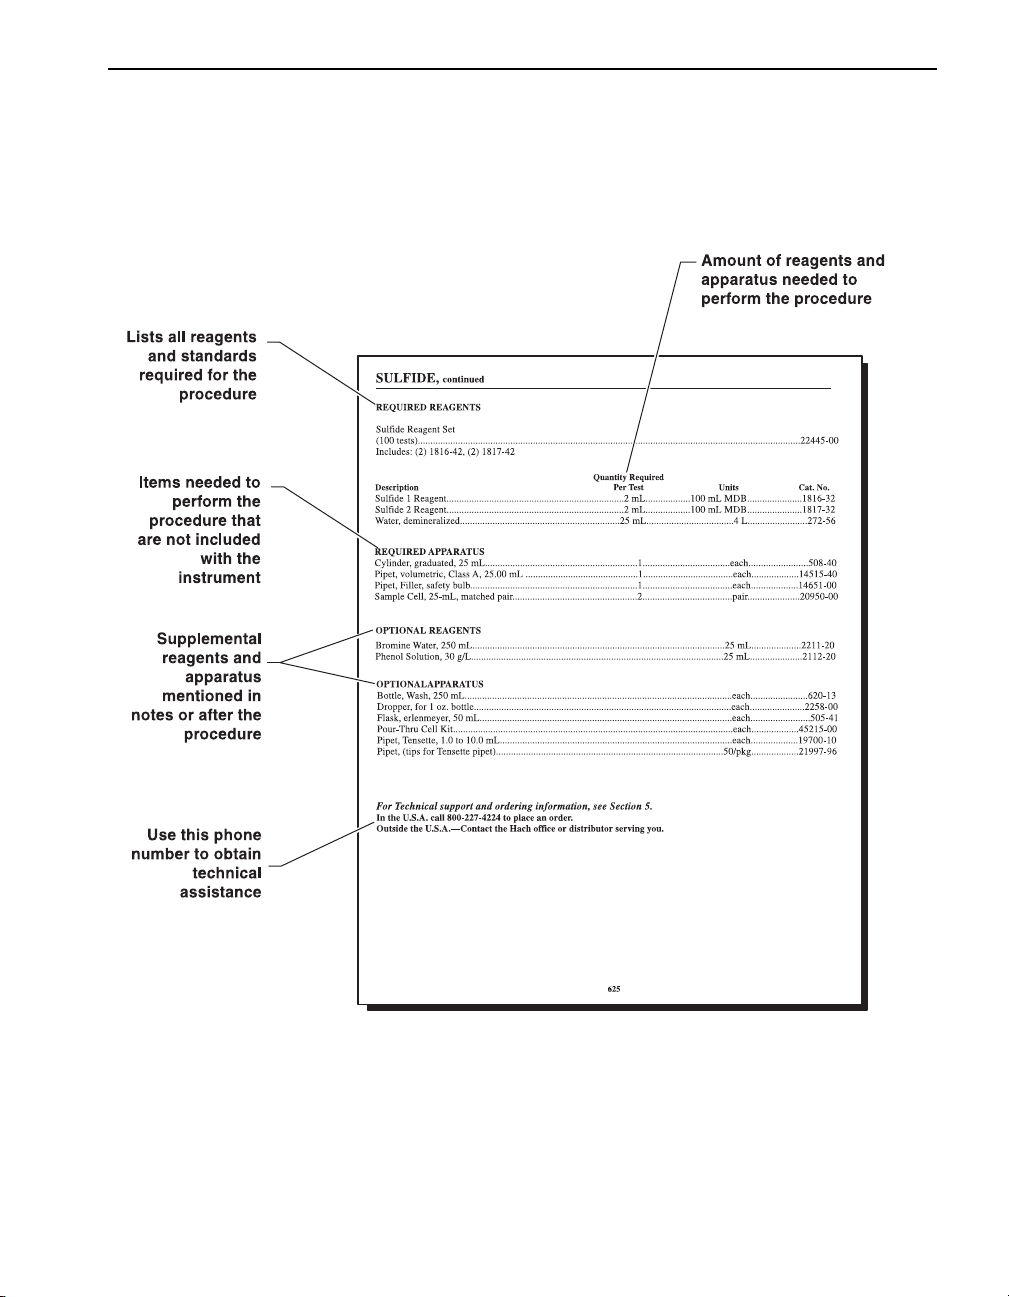
Sample Procedure Explained, continued
15
Page 16

16
Page 17
SECTION I CHEMICAL ANALYSIS INFORMATION
Abbreviations
The following abbreviations are used throughout the text of the
procedure section:
Abbrev-
iation
°C degree(s) Celsius (Centigrade) HR high range
°F degree(s) Fahrenheit kg/ha kilograms per hectare
ACS
APHA
Standard
Methods
AV AccuVac MR medium range
Bicn bicinchoninate NIPDWR
CFR Code of Federal Regulations NPDES
conc concentrated P phosphorus
DB dropping bottle PCB Poly chlorinated biphenyl
EDL Estimated detection limit PV PhosVer
F&T free and total RL Rapid Liquid™
FAU
FM FerroMo
FV FerroVer
FZ FerroZine
gr/gal grains per gallon (1 gr/gal = 17.12 mg/L) USEPA
American Chemical Society reagent
grade purity
Standard Methods for the Examination of
Water and Wastewater, published jointly by
the American Public Health Association
(APHA), the American Water Works
Association (AWWA), and the Water
Environment Federation (WEF). Order from
Hach requesting Cat. No. 22708-00 or from
the Publication Office of the American Public
Health Association. This book is the
standard reference work for water analysis.
Many procedures contained in this manual
are based on Standard Methods.
Formazin Attenuation Units. Turbidity unit
of measure based on a Formazin stock
suspension.
g grams ULR Ultra low range
Definition
®
®
®
Abbrev-
iation
l or L
lbs/Ac pounds per acre
LR low range
MDL Method detection limit
MDB marked dropping bottle
mg/L milligrams per liter (ppm)
µg/L micrograms per liter (ppb)
ml or mL
SCDB self-contained dropping bottle
TNT Te s t ‘N Tube™
TPH Total petroleum hydrocarbons
TPTZ (2,4,6-Tri-(2-Pyridyl)-1,3,5-Triazine)
Liter. Volume equal to one cubic
decimeter (dm
(milliliter)-approximately the same as a
cubic centimeter (cc) or 1/1000 of a liter.
Also known as a “cc”.
National Interim Primary Drinking
Water Regulations
National Pollutant Discharge
Elimination System
United States Environmental
Protection Agency
®
Definition
3
)
17
Page 18

SECTION I, continued
Converting Chemical Species
Species conversion factors for many commonly used substances are
preprogrammed into the DR/2010 (see Table 1). Conversions are method
specific and are viewable after taking the reading by pressing
Table 1 Conversion Factors
To Convert From... To... Multiply By... Conversion used in program #
mg/L Al mg/L Al2O
mg/L B mg/L H
mg/L Ca-CaCO
mg/L CaCO
mg/L CaCO
3
3
3
3BO3
mg/L Ca 0.4004 220
mg/L Ca 0.4004 227
mg/L Mg 0.2428 227
3
1.8895 9, 10
5.7 45
µg/L Carbo. µg/L Hydro. 1.92 182
µg/L Carbo. µg/L ISA 2.69 182
µg/L Carbo. µg/L MEKO 3.15 182
mg/L Cr
mg/L Cr
mg/L Mg-CaCO
6+
6+
3
mg/L CrO
mg/L Na2CrO
mg/L Mg 0.2428 225
mg/L Mn mg/L KMnO
mg/L Mn mg/L MnO
mg/L Mo
mg/L Mo
6+
6+
mg/L MoO
mg/L Na2MoO
mg/L N mg/L NH
mg/L N mg/L NO
mg/L Na
mg/L Na
mg/L NH
mg/L NH
mg/L NH
mg/L NH
mg/L NO
mg/L NO
mg/L NO
µg/L NO
mg/L NO
µg/L NO
mg/L NO
mg/L PO
µg/L PO
mg/L PO
µg/L PO
mg/L SiO
µg/L SiO
CrO
2
4
CrO
2
4
Cl-N mg/L Cl
2
Cl-N mg/L NH2Cl 3.6750 386
2
-N mg/L NH
3
-N mg/L NH
3
-
2
-
2
-
-N mg/L NaNO
2
-
-N µg/L NaNO
2
-
-N mg/L NO
2
-
-N µg/L NO
2
-
-N mg/L NO
3
3-
4
3-
4
3-
4
3-
4
2
2
mg/L Cr
mg/L CrO
mg/L NaNO
mg/L NO
mg/L P 0.3261 480, 482, 485, 490, 492, 535
µg/L P 0.3261 488
mg/L P2O
µg/L P2O
mg/L Si 0.4674 651, 656
µg/L Si 0.4674 645
2-
4
4
4
-
4
2-
4
4
3
-
3
6+
2-
4
2
3
+
4
2
-
-N 0.3045 373
2
2
2
-
2
-
2
-
3
5
5
2.231 90, 95
3.115 90, 95
2.876 290, 295
2.165 290, 295
1.667 315, 320, 322
2.146 315, 320, 322
1.216 342, 343, 346, 347, 348
4.427 346, 347, 348
0.321 670
0.72 670
5.0623 386
1.216 380, 385, 387
1.288 380, 385, 387
1.5 373
4.926 345, 371, 375
4.926 376
3.284 345, 371, 375
3.284 376
4.427 344, 351, 353, 355, 359, 361
0.7473 480, 482, 485, 490, 492, 535
0.7473 488
18
CONC.
Page 19

SECTION I, continued
Hardness Conversion
Table 2 lists the factors for converting one unit of measure for hardness to
another unit of measure. For example, to convert mg/L CaCO
parts/100,000 CaO, multiply the value in mg/L x 0.056.
Table 2 Hardness Conversion Factors
Units of
Measure
mg/L
CaCO
English
British
3
gr/gal
(Imperial)
mg/L
CaCO
CaCO
1.0 0.07 0.058 0.1 0.056 0.02 5.6x10
3
14.3 1.0 0.83 1.43 0.83 0.286 8.0x10
3
American
gr/gal (US)
CaCO
gr/gal
CaCO
3
US gr/gal
CaCO
Fr. p/
17.1 1.2 1.0 1.72 0.96 0.343 9.66x10
3
10.0 0.7 0.58 1.0 0.56 0.2 5.6x10
100,000
CaCO
3
Ger. p/
17.9 1.25 1.04 1.79 1.0 0.358 1x10
100,000
CaO
meq/L 50.0 3.5 2.9 5.0 2.8 1.0 2.8x10
g/L CaO 1790.0 125.0 104.2 179.0 100.0 35.8 1.0 0.112
lbs./cu ft
CaCO
16,100.0 1,123.0 935.0 1,610.0 900.0 321.0 9.0 1.0
3
1 ‘epm/L, or ‘mval/L’
Note: 1 meq/L = 1N/1000
French
parts/
100,000
3
CaCO
3
German
Parts/
100,000
CaO
meq/L
1
g/L CaO
to German
3
lbs./cu ft
-4
6.23x10
-3
-3
1.07x10
-3
6.23x10
-2
1.12x10
-2
3.11x10
CaCO
8.9x10
3
-5
-4
-3
-4
-3
-2
19
Page 20
SECTION I, continued
Dissolved Oxygen
Table 3 lists the mg/L dissolved oxygen in water at saturation for various
temperatures and atmospheric pressures. The table was formulated in a
laboratory using pure water. The values given are only approximations for
estimating the oxygen content of a particular body of surface water.
Table 3 Dissolved Oxygen Saturation in Water
Pressure in Millimeters and Inches Hg
mm
775 760 750 725 700 675 650 625
Temp inches
°F °C 30.51 29.92 29.53 28.45 27.56 26.57 25.59 24.61
32.0 0 14.9 14.6 14.4 13.9 13.5 12.9 12.5 12.0
33.8 1 14.5 14.2 14.1 13.6 13.1 12.6 12.2 11.7
35.6 2 14.1 13.9 13.7 13.2 12.9 12.3 11.8 11.4
37.4 3 13.8 13.5 13.3 12.9 12.4 12.0 11.5 11.1
39.2 4 13.4 13.2 13.0 12.5 12.1 11.7 11.2 10.8
41.0 5 13.1 12.8 12.6 12.2 11.8 11.4 10.9 10.5
42.8 6 12.7 12.5 12.3 11.9 11.5 11.1 10.7 10.3
44.6 7 12.4 12.2 12.0 11.6 11.2 10.8 10.4 10.0
46.4 8 12.1 11.9 11.7 11.3 10.9 10.5 10.1 9.8
48.2 9 11.8 11.6 11.5 11.1 10.7 10.3 9.9 9.5
50.0 10 11.6 11.3 11.2 10.8 10.4 10.1 9.7 9.3
51.8 11 11.3 11.1 10.9 10.6 10.2 9.8 9.5 9.1
53.6 12 11.1 10.8 10.7 10.3 10.0 9.6 9.2 8.9
55.4 13 10.8 10.6 10.5 10.1 9.8 9.4 9.1 8.7
57.2 14 10.6 10.4 10.2 9.9 9.5 9.2 8.9 8.5
59.0 15 10.4 10.2 10.0 9.7 9.3 9.0 8.7 8.3
60.8 16 10.1 9.9 9.8 9.5 9.1 8.8 8.5 8.1
62.6 17 9.9 9.7 9.6 9.3 9.0 8.6 8.3 8.0
64.4 18 9.7 9.5 9.4 9.1 8.8 8.4 8.1 7.8
66.2 19 9.5 9.3 9.2 8.9 8.6 8.3 8.0 7.6
68.0 20 9.3 9.2 9.1 8.7 8.4 8.1 7.8 7.5
69.8 21 9.2 9.0 8.9 8.6 8.3 8.0 7.7 7.4
71.6 22 9.0 8.8 8.7 8.4 8.1 7.8 7.5 7.2
73.4 23 8.8 8.7 8.5 8.2 8.0 7.7 7.4 7.1
75.2 24 8.7 8.5 8.4 8.1 7.8 7.5 7.2 7.0
77.0 25 8.5 8.4 8.3 8.0 7.7 7.4 7.1 6.8
78.8 26 8.4 8.2 8.1 7.8 7.6 7.3 7.0 6.7
80.6 27 8.2 8.1 8.0 7.7 7.4 7.1 6.9 6.6
20
Page 21
SECTION I, continued
Table 3 Dissolved Oxygen Saturation in Water (continued)
Pressure in Millimeters and Inches Hg
mm
775 760 750 725 700 675 650 625
Temp inches
°F °C 30.51 29.92 29.53 28.45 27.56 26.57 25.59 24.61
82.4 28 8.1 7.9 7.8 7.6 7.3 7.0 6.7 6.5
84.2 29 7.9 7.8 7.7 7.4 7.2 6.9 6.6 6.4
86.0 30 7.8 7.7 7.6 7.3 7.0 6.8 6.5 6.2
87.8 31 7.7 7.5 7.4 7.2 6.9 6.7 6.4 6.1
89.6 32 7.6 7.4 7.3 7.0 6.8 6.6 6.3 6.0
91.4 33 7.4 7.3 7.2 6.9 6.7 6.4 6.2 5.9
93.2 34 7.3 7.2 7.1 6.8 6.6 6.3 6.1 5.8
95.0 35 7.2 7.1 7.0 6.7 6.5 6.2 6.0 5.7
96.8 36 7.1 7.0 6.9 6.6 6.4 6.1 5.9 5.6
98.6 37 7.0 6.8 6.7 6.5 6.3 6.0 5.8 5.6
100.4 38 6.9 6.7 6.6 6.4 6.2 5.9 5.7 5.5
102.2 39 6.8 6.6 6.5 6.3 6.1 5.8 5.6 5.4
104.0 40 6.7 6.5 6.4 6.2 6.0 5.7 5.5 5.3
105.8 41 6.6 6.4 6.3 6.1 5.9 5.6 5.4 5.2
107.6 42 6.5 6.3 6.2 6.0 5.8 5.6 5.3 5.1
109.4 43 6.4 6.2 6.1 5.9 5.7 5.5 5.2 5.0
111.2 44 6.3 6.1 6.0 5.8 5.6 5.4 5.2 4.9
113.0 45 6.2 6.0 5.9 5.7 5.5 5.3 5.1 4.8
114.8 46 6.1 5.9 5.9 5.6 5.4 5.2 5.4 4.8
116.6 47 6.0 5.9 5.8 5.6 5.3 5.1 4.8 4.7
118.4 48 5.9 5.8 5.7 5.5 5.3 5.0 4.8 4.6
120.2 49 5.8 5.7 5.6 5.4 5.2 5.0 4.7 4.5
122.0 50 5.7 5.6 5.5 5.3 5.1 4.9 4.7 4.4
21
Page 22

SECTION I, continued
Sample Collection, Preservation and Storage
Correct sampling and storage are critical for accurate testing. For greatest
accuracy, thoroughly clean sampling devices and containers to prevent
carryover from previous samples. Preserve the sample properly; each
procedure has information about sample preservation.
• The least expensive containers are polypropylene or polyethylene.
• The best and most expensive containers are quartz or PTFE
(polytetrafluoroethylene, Teflon).
• Avoid soft glass containers for metals in the
microgram-per-liter range.
• Store samples for silver determination in light absorbing containers,
such as amber bottles.
Avoid contaminating the sample with metals from containers, distilled
water or membrane filters. Thoroughly clean sample containers as
described under Acid Washing Bottles.
Preservation slows the chemical and biological changes that continue
after collection. These changes may change the amount of a chemical
species available for analysis. Normally, analyze the samples as soon as
possible after collection, especially when the analyte concentration is
expected to be low. This also reduces the chance for error and
minimizes labor.
Preservation methods include pH control, chemical addition, refrigeration
and freezing. Table 4 gives the recommended preservation for various
substances. It also includes suggested types of containers and the
maximum recommended holding times for properly preserved samples.
Preserve aluminum, cadmium, chromium, cobalt, copper, iron, lead,
nickel, potassium, silver and zinc samples for at least 24 hours by adding
one Nitric Acid Solution Pillow 1:1 (Cat. No. 2540-98) per liter of
sample. Check the pH with pH indicator paper or a pH meter to assure
the pH is 2 or less. Add additional pillows if necessary. Adjust the sample
pH prior to analysis by adding an equal number of Sodium Carbonate
Anhydrous Powder Pillows (Cat. No. 179-98). Or raise the pH to 4.5
with Sodium Hydroxide Standard Solution, 1 N or 5 N.
22
Page 23
SECTION I, continued
Table 4 Required Containers, Preservation Techniques and Holding Times
Parameter No./Name Container
2
Preservation
3,4
1
Maximum
Holding Time
5
Table 1A - Bacterial Tests
1-4. Coliform, fecal and total P,G Cool, 4°C, 0.008%, Na
5. Fecal streptococci P,G Cool, 4°C, 0.008%, Na
2S2O3
2S2O3
6
6
6 hours
6 hours
Table 1B - Inorganic Tests
1. Acidity P, G Cool, 4°C 14 days
2. Alkalinity P, G Cool, 4°C 14 days
4. Ammonia P, G Cool, 4°C, H
9. Biochemical oxygen demand
P, G Cool, 4°C 48 hours
to pH<2 28 days
2SO4
(BOD)
10. Boron P, PFTE or quartz HNO
to pH<2 6 months
3
11. Bromide P, G None required 28 days
14. Biochemical oxygen demand,
P, G Cool, 4°C 48 hours
carbonaceous
15. Chemical oxygen demand P, G Cool, 4°C, H
to pH<2 28 days
2SO4
16. Chloride P, G None required 28 days
17. Chlorine, total residual P, G None required Analyze immediately
21. Color P, G Cool, 4°C 48 hours
23-24. Cyanide, total and amenable
to chlorination
P, G Cool, 4°C, NaOH to pH>12, 0.6 g
ascorbic acid
6
14 days
7
25. Fluoride P None required 28 days
27. Hardness P, G HNO
to pH<2, H2SO4 to pH<2 6 months
3
28. Hydrogen ion (pH) P, G None required Analyze immediately
31, 43. Kjeldahl and organic
P, G Cool 4°C, H
to pH<2 28 days
2SO4
nitrogen
8
Metals
18. Chromium VI P, G Cool, 4°C 24 hours
35. Mercury P, G HNO
to pH<2 28 days
3
Metals, except boron, chromium VI
and mercury: 3, 5-8, 12, 13, 19, 20,
22, 26, 29, 30, 32-34, 36, 37, 45,
47, 51, 52, 58-60, 62, 63, 70-72, 74,
9
.
75
P, G HNO
to pH<2 6 months
3
38. Nitrate P, G Cool, 4°C 48 hours
39. Nitrate-nitrite P, G Cool 4°C, H
to pH<2 28 days
2SO4
40. Nitrite P, G Cool, 4°C 48 hours
41. Oil and grease G Cool, 4°C, HCl or H
42. Organic Carbon
P, G Cool, 4°C, HCl or H
to pH<2
H
3PO4
to pH<2 28 days
2SO4
SO4 or
2
28 days
44. Orthophosphate P, G Filter immediately; Cool, 4°C 48 hours
46a. Oxygen, dissolved probe G Bottle and top None required Analyze immediately
46b. Oxygen, dissolved, Winkler Do Fix on site and store in dark 8 hours
48. Phenols G only Cool 4°C, H
to pH<2 28 days
2SO4
23
Page 24

SECTION I, continued
Table 4 Required Containers, Preservation Techniques and Holding Times1 (continued)
Parameter No./Name Container
49. Phosphorus, elemental G Cool, 4°C 48 hours
50. Phosphorus, total P, G Cool, 4°C, H
53. Residue, total P, G Cool, 4°C7 days
54. Residue, filterable P, G Cool, 4°C7 days
55. Residue, Nonfilterable (TSS) P, G Cool, 4°C7 days
56. Residue, Settleable P, G Cool, 4°C 48 hours
57. Residue, volatile P, G Cool, 4°C7 days
61. Silica P, PFTE or quartz Cool, 4°C 28 days
64. Specific conductance P, G Cool, 4°C 28 days
65. Sulfate P, G Cool, 4°C 28 days
66. Sulfide
67. Sulfite P, G none required Analyze immediately
68. Surfactants P, G Cool, 4°C 48 hours
69. Temperature P, G None required Analyze immediately
73. Turbidity P, G Cool, 4°C 48 hours
1 This table was adapted from Table II published in the Federal Register, July 1, 1997, 40 CFR, Part 136.3,
pages 26-27. Organic tests are not included.
2 Polyethylene (P) or glass (G).
3 Sample preservation should be performed immediately upon sample collection. For composite chemical samples
each aliquot should be preserved at the time of collection. When use of an automated sampler makes it impossible
to preserve each aliquot, then chemical samples may be preserved by maintaining at 4°C until compositing and
sample splitting is completed.
4 When any sample is to be shipped by common carrier or sent through United States Mails, it must comply with the
Department of Transportation Hazardous Material Regulations (49 CFR Part 172). The person offering such
material for transportation is responsible for ensuring such compliance. For the preservation requirements of Table
II, the Office of Hazardous Materials, Materials Transportation Bureau, Department of Transportation has
determined that the Hazardous Materials Regulations do not apply to the following materials: Hydrochloric acid
(HCl) in water solutions at concentrations of 0.04% by weight or less (pH about 1.96 or greater); Nitric acid (HNO
in water solutions at concentrations of 0.15% by weight or less (pH about 1.62 or greater); Sulfuric acid (H
water solutions at concentrations of 0.35% by weight or less (pH about 1.15 or greater); and Sodium hydroxide
(NaOH) in water solutions at concentrations of 0.080% by weight or less (pH about 12.30 or less).
5 Samples should be analyzed as soon as possible after collection. The times listed are the maximum times that
samples may be held before analysis and still be considered valid. Samples may be held for longer periods only if
the permitee, or monitoring laboratory, has data on file to show that the specific types of samples under study are
stable for the longer time, and has received a variance from the Regional Administer under §136.3(e). Some
samples may not be stable for the maximum time period given in the table. A permitee, or monitoring laboratory, is
obligated to hold the sample for a shorter time if knowledge exists to show that this is necessary to maintain sample
stability. See §136.3(e) for details. The term “analyze immediately” usually means within 15 minutes or less after
sample collection.
6 Should only be used in the presence of residual chlorine.
7 Maximum holding time is 24 hours when sulfide is present. Optionally all samples may be tested with lead acetate
paper before pH adjustments in order to determine if sulfide is present. If sulfide is present, it can be removed by the
addition of cadmium nitrate powder until a negative spot test is obtained. The sample is filtered and then NaOH is
added to pH 12.
8 Samples should be filtered immediately on-site before adding preservative for dissolved metals.
9 Numbers refer to parameter number in 40 CFR, Part 136.3, Table 1B.
2
P, G Cool 4°C, add zinc acetate plus
Preservation
sodium hydroxide to pH>9
3,4
to pH<2 28 days
2SO4
Maximum
Holding Time
7 days
2SO4
5
) in
)
3
24
Page 25

SECTION I, continued
Collecting Water Samples
Obtain the best sample by careful collection. In general, collect samples
near the center of the vessel or duct and below the surface. Use only clean
containers (bottles, beakers). Rinse the container several times first with
the water to be sampled.
Take samples as close as possible to the source of the supply. This lessens
the influence the distribution system has on the sample. Let the water run
long enough to flush the system. Fill sample containers slowly with a
gentle stream to avoid turbulence and air bubbles. Collect water samples
from wells after the pump has run long enough to deliver water
representative of the ground water feeding the well.
It is hard to obtain a truly representative sample when collecting surface
water samples. Obtain best results by testing several samples. Use
samples taken at different times from several locations and depths. The
results can be used to establish patterns for that particular body of water.
Generally, as little time as possible should elapse between collecting the
sample and analyzing it.
Depending on the test, special precautions in handling the sample may be
necessary. This prevents natural interferences such as organic growth or
loss or gain of dissolved gases. Each procedure describes sample
preservatives and storage techniques for samples that are held for testing.
Acid Washing Bottles
If a procedure suggests acid-washing, use the following procedure:
Use chromic acid or chromium-free substitutes to remove organic
deposits from glass containers. Rinse containers thoroughly with water
to remove traces of chromium.
a) Clean the glassware or plasticware with laboratory detergent
(phosphate-free detergent is recommended).
b) Rinse well with tap water.
c) Rinse with a 1:1 Hydrochloric Acid Solution or 1:1 Nitric Acid
Solution. The nitric acid rinse is important for testing for lead.
d) Rinse well with deionized water. Up to 12-15 rinses may be
necessary if chromium is being determined.
e) Air dry.
25
Page 26

SECTION I, continued
Wash glassware for phosphate determinations with phosphate-free
detergents and acid-wash with 1:1 HCl. Thoroughly rinse the glassware
with deionized water. For ammonia and Kjeldahl nitrogen, rinse with
ammonia-free water.
Correcting for Volume Additions
If you use a large volume of preservative, correct for the volume of
preservative added. This accounts for dilution due to the acid added to
preserve the sample and the base used to adjust the pH to the range of the
procedure. This correction is made as follows:
1. Determine the volume of initial sample, the volume of acid and base
added, and the total final volume of the sample.
2. Divide the total volume by the initial volume.
3. Multiply the test result by this factor.
Example:
A one-liter sample was preserved with 2 mL of nitric acid. It was
neutralized with 5 mL of 5 N sodium hydroxide. The result of the analysis
procedure was 10.00 mg/L. What is the volume correction factor and
correct result?
Boiling Aids
Total Volume 1000 mL 2 mL 5 mL++ 1007 mL==
1.
1007
------------- 1.007 volume correction factor==
2.
1000
10.0 mg/L 1.007× 10.07 mg/L correct result==
3.
Hach 1:1 Nitric Acid Pillows contain 2.5 mL of acid: correct for this
volume. The addition of a Sodium Carbonate Power Pillow neutralizes the
1:1 Nitric Acid Pillow does not need to be corrected for.
Boiling is necessary in some procedures. Using a boiling aid such as
boiling chips (Cat. no. 14835-31) reduces bumping. Bumping is caused
by the sudden, almost explosive conversion of water to steam as it is
heated. Avoid bumping; it may cause sample loss or injury.
Make sure the boiling aids will not contaminate the sample. Do not use
boiling aids (except glass beads) more than once. Loosely covering the
sample during boiling will prevent splashing, reduce the chances of
contamination and minimize sample loss.
26
Page 27

SECTION I, continued
Sample Filtration
Filtering separates particles from the aqueous sample. Filtration uses a
medium, usually filter paper, to retain particles but pass solution. This is
especially helpful when sample turbidity interferes with analysis. Two
general methods of filtration are gravity and vacuum. Gravity filtration
uses gravity to pull the sample though the filter paper. Vacuum filtration uses
suction and gravity to move the sample through the filter. An aspirator or
vacuum pump creates the suction. Vacuum filtration is faster than gravity
filtration. Vacuum filter (see Figure 1) as follows:
1. Using tweezers, place a filter paper into the filter holder.
2. Place the filter holder assembly in the filtering flask. Wet the filter
with deionized water to ensure adhesion to the holder.
3. Position the funnel housing on the filter holder assembly.
4. While applying a vacuum to the filtering flask, transfer the sample to
the filtering apparatus.
5. Slowly release the vacuum from the filtering flask and transfer the
solution from the filter flask to another container.
Figure 1 Vacuum Filtration
REQUIRED APPARATUS FOR VACUUM FILTRATION
Description Unit Cat. No.
Filter Discs, glass 47 mm.................................................................. 100/pkg................2530-00
Filter Holder, membrane ......................................................................... each..............13529-00
Flask, filter, 500 mL ................................................................................ each..................546-49
Pump, vacuum, hand operated ................................................................each..............14283-00
OR
Pump, vacuum, portable, 115 V ..............................................................each..............14697-00
Pump, vacuum, portable, 230 V ..............................................................each..............14697-02
27
Page 28
SECTION I, continued
Many of the procedures in this manual use gravity filtration. The only
labware required is filter paper, a conical funnel and a receiving flask.
This labware is included under Optional Equipment and Supplies at the
end of a procedure. Gravity filtration is better for retaining fine particles.
For faster filtering, add solution until the filter paper cone is three-fourths
filled. Never fill the cone completely. Gravity filter (see Figure 2)
as follows:
1. Place a filter paper into the funnel.
2. Wet the filter with deionized water to ensure adhesion to the funnel.
3. Place the funnel into an erlenmeyer flask or graduated cylinder.
4. Pour the sample into the funnel.
Figure 2 Gravity Filtration
REQUIRED APPARATUS FOR GRAVITY FILTRATION
Description Unit Cat No.
Cylinder, graduated, 100 mL ...................................................................each ................. 508-42
Funnel, poly, 65 mm ................................................................................each ............... 1083-67
Filter Paper, 12.5 cm ................................................................................each ............... 1894-57
Flask, erlenmeyer, 125 mL ......................................................................each ................. 505-43
Testing for metals requires acid and heat to pretreat the sample. Since
these conditions destroy filter paper, vacuum filtration with glass fiber
filter discs is recommended. Also, glass filter discs, unlike paper, do not
retain colored species.
28
Page 29
SECTION I, continued
Temperature Considerations
For best results, most tests in this manual should be performed with
sample temperatures between 20 °C (68 °F) and 25 °C (77 °F). If a
test requires closer temperature control, notes in the procedure will
indicate this.
Sample Dilution Techniques
Ten and 25 mL are the volumes used for most colorimetric tests.
However, in some tests, the color developed in the sample may be too
intense to be measured. Unexpected colors may develop in other tests.
In both cases, dilute the sample to determine if interfering substances
are present.
To dilute the sample easily, pipet the chosen sample portion into a clean
graduated cylinder (or volumetric flask for more accurate work). Fill the
cylinder (or flask) to the desired volume with deionized water. Mix well.
Use the diluted sample when running the test.
To help with dilutions, Table 5 shows the amount of sample used, the
amount of deionized water used to bring the volume up to 25 mL and the
multiplication factor.
The concentration of the sample is equal to the diluted sample reading
multiplied by the multiplication factor.
More accurate dilutions can be done with a pipet and a 100-mL
volumetric flask (see Table 6 for more information). Pipet the sample and
dilute to volume with deionized water. Swirl to mix.
Table 5 Sample Dilution Volumes
Sample
Volume (mL)
25.0 0.0 1
12.5 12.5 2
1
10.0
1
5.0
1
2.5
1
1.0
1
0.250
1 For sample sizes of 10 mL or less, use a pipet to measure the sample into the graduated
cylinder or volumetric flask.
mL deionized Water Used
to Bring the Volume to 25 mL
15.0 2.5
20.0 5
22.5 10
24.0 25
24.75 100
Multiplication
Factor
29
Page 30

SECTION I, continued
Table 6 Multiplication Factors for Diluting to 100 mL
Sample Volume (mL) Multiplication Factor
1 100
250
520
10 10
25 4
50 2
Sample Dilution and Interfering Substances
Sample dilution may influence the level at which a substance may
interfere. The effect of the interferences decreases as the dilution
increases. In other words, higher levels of an interfering substance can be
present in the original sample if it is diluted before analysis.
An Example:
Copper does not interfere at or below 100 mg/L for a 25.00 mL sample in a
procedure. If the sample volume is diluted with an equal volume of water, what is
the level at which copper will not interfere?
Total volume
------------- ----------------- ----------- Dilution factor=
Sample volume
25
----------- 2=
12.5
Interference Level Dilution Factor× Interference level in sample=
100 2× 200=
The level at which copper will not interfere in the undiluted sample is at or below
200 mg/L.
30
Page 31
SECTION I, continued
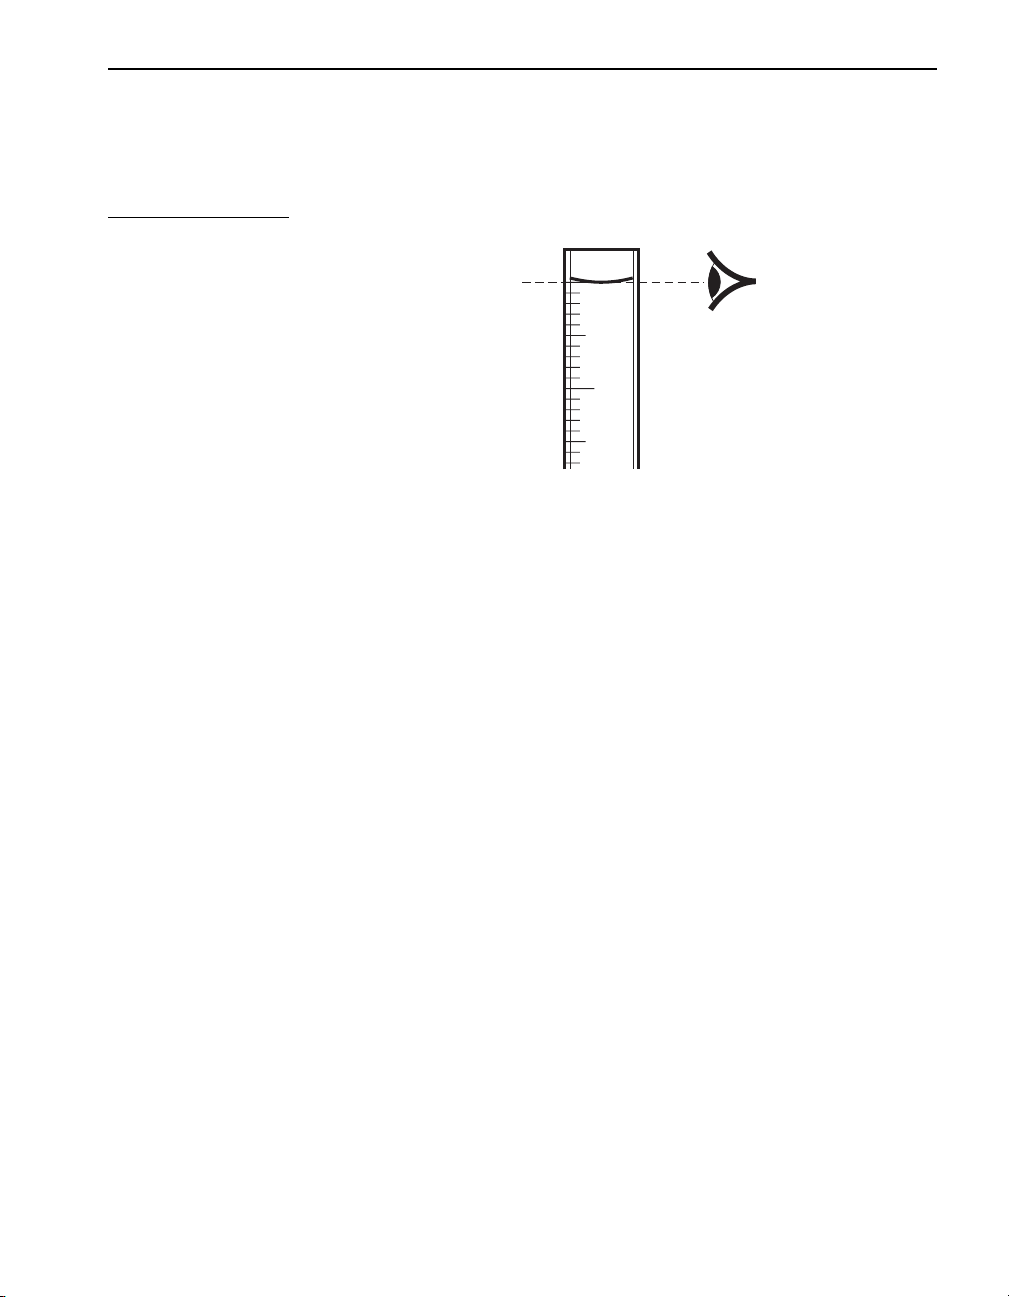
Using Pipets and Graduated Cylinders
When small sample quantities are used, the accuracy of measurements is
important. Figure 3 illustrates the proper way of reading the sample level
or the meniscus formed when the liquid wets the cylinder or pipet walls.
Figure 3 Reading the Meniscus
Rinse the pipet or cylinder two or three times with the sample to be tested
before filling. Use a pipet filler or pipet bulb to draw the sample into the
pipet. Never pipet chemical reagent solutions or samples by mouth. When
filling a pipet, keep the tip of the pipet below the surface of the sample as
the sample is drawn into the pipet.
50
45
40
35
Serological pipets have marks that indicate the volume of liquid delivered
by the pipet. The marks may extend to the tip of the pipet or may be only
on the straight portion of the tube. If the marks are only on the straight
part of the tube, fill serological pipets to the zero mark and discharge the
sample by draining the sample until the meniscus is level with the desired
mark. If the serological pipet has marks extended to the tip of the pipet,
fill the pipet to the desired volume and drain all the sample from the pipet.
Then blow the sample out of the pipet tip for accurate measurements.
Volumetric (transfer) pipets have a bulb in the middle and a single ring
above the bulb to indicate the volume of liquid when it is filled to the
mark . To discharge a volumetric pipet, hold the tip of the pipet at a slight
angle against the container wall and drain. Do not attempt to discharge the
solution remaining in the tip of the pipet after draining. Volumetric pipets
are designed to retain a small amount of sample in the pipet tip.
If sample drops stay on the walls of the pipet, the pipet is dirty and is not
delivering the correct amount of sample. Wash the pipet thoroughly with a
laboratory detergent or cleaning solution and rinse several times with
deionized water.
31
Page 32

SECTION I, continued
Using the TenSette Pipet
For best results use a new tip each time you pipet. After several uses, the
pipet tip may retain some liquid, causing inaccurate delivery. Each pipet is
supplied with 100 tips; order Hach replacement tips for best results.
Always use careful, even hand movements for best reproducibility. If the
pipet does not operate smoothly, disassemble and coat the piston and
retainer with high-quality stopcock grease. Also coat the metering turret
lightly with grease. Refer to the TenSette Pipet manual.
For best pipetting accuracy, the solution and the room temperature should
be between 20-25 °C.
Never lay the pipet down with the liquid in the tip. Solution could leak
into the pipet and cause corrosion.
Operating the TenSette Pipet
1. Attach a clean tip by holding the pipet body in one hand and gently
pressing the large end of the pipet tip onto the tapered end of the
pipet. Be sure a good seal is obtained.
2. Turn the turret cap to align the desired volume with the mark on the
pipet body.
3. Using a smooth motion, press down on the turret cap until it reaches
the stop. Immerse the tip about 5 mm (1/4 inch) below the solution
surface to avoid drawing air into the pipet. Do not insert the tip any
deeper or the delivery volume may be affected.
4. While maintaining a constant pressure, allow the turret to return
slowly to the extended position. A rapid return may affect the
delivery volume.
5. With the turret up, take the tip out of the solution and move it to the
receiving vessel. Do not press on the turret cap while moving the pipet.
STEP 3 STEP 4 STEP 5
32
Page 33

SECTION I, continued
6. Use the thumb and forefinger to twist the turret cap to the next higher
volume position to ensure quantitative transfer of the sample.
The “F” position provides full blowout.
7. With the tip in contact with the side of the receiving vessel, slowly
and smoothly press down on the turret cap until it reaches the stop and
the solution is completely discharged.
Mixing Water Samples
The following two methods may be helpful in tests that require mixing
sample with chemicals (usually indicated by “swirl to mix” instructions).
1. When mixing sample in a square sample cell, swirl with a simple
2. Swirling is recommended when mixing samples in a graduated
This swirling procedure is the most gentle and offers the least interference
from the atmosphere when testing for carbon dioxide and other gases.
Both methods are simple but take a bit of practice in order to obtain the
best results.
STEP 6
STEP 7
twisting motion; see Figure 4. Grasp the neck of the cell with the
thumb and index finger of one hand. Rest the concave bottom of the
cell on the tip of the index finger of other hand. Mix by rotating the
cell quickly one way and then in the reverse direction.
cylinder or a titration flask. Grip the cylinder (or flask) firmly with the
tips of three fingers; see Figure 5. Hold the cylinder at a 45-degree
angle and twist the wrist. This should move the cylinder in an
approximately 12-inch circle, creating enough rotation to complete
the mixing in a few turns.
33
Page 34

SECTION I, continued
Figure 4 Swirling a Sample Cell
Figure 5 Swirling a Graduated Cylinder
34
Page 35

SECTION I, continued
Using Sample Cells
Orientation of Sample Cells
Two types of matched sample cells are shipped with the DR/2010; a
matched pair of taller 25 mL sample cells and a shorter matched pair of
10 mL sample cells. Both types are matched with the spectrophotometer
light beam passing through the side with the fill mark and the opposite
side. Matched pairs have been tested and paired so that significant error
will not be introduced because of variations in the glass. A solution in
both cells should give the same absorbance (±0.002 Abs). For more
information, see Sample Cell Matching, below.
To minimize variability of measurements using a particular cell, always
place the cell into the cell holder with the same orientation. The cells are
placed in the instrument with the fill marks facing left (viewer’s left).
In addition to proper orientation, the sides of the cells should be
free of smudges, fingerprints, etc. to ensure accurate readings. Wipe
the sides of the cells with a soft cloth to clean the surface before
taking measurements.
Care of Hach 1-inch Sample Cells
Store sample cells in their boxes when not in use to protect them from
scratching and breaking. It is good laboratory practice to empty and
clean sample cells after analyses are complete--avoid leaving colored
solutions in the cells for extended periods of time. Finish the cleaning
procedure with a few rinses of deionized water and allow to dry.
Individual procedures often recommend specific cleaning methods
for special circumstances.
Cleaning Sample Cells
Most laboratory detergents can be used at recommended concentrations.
Neutral detergents such as Neutracon are safer if regular cleaning is
required, as in the case of protein residues.
If using a detergent, you can speed cleaning by increasing the temperature
or using an ultrasonic bath.
Rinsing is more efficient when using distilled water.
35
Page 36

SECTION I, continued
Sample Cell Matching
Sample cells shipped with the DR/2010 are matched and distortion-free.
Nicks and scratches from normal use can cause an optical mismatch
between two sample cells and introduce error in the test results. This type
of error can sometimes be avoided by optically re-matching the sample
cells as follows:
1. Turn the instrument on and select the constant-on mode. Wait 5
minutes for the lamp to warm up.
2. Enter the stored program for absorbance. Press
will show:
Abs.
0 ENTER. The display
3. Rotate the wavelength dial until the small display shows 510 nm or
the wavelength commonly used.
4. Pour at least 25 mL (10 mL for 10-mL cells) of deionized water into
each of two sample cells.
5. Place one sample cell into the cell holder. Orient the fill mark to the
left. Close the light shield.
6. Press:
ZERO. The display will show: 0.000 Abs.
7. Place the other sample cell into the cell holder using the same
orientation as in step 5. Close the light shield.
8. Wait about 3 seconds for the reading to stabilize. Record the result.
Two sample cells are matched when their absorbance readings are within
0.002 Abs of each other. If the cells do not match, there are two
alternative options to purchasing a new set.
If more than two sample cells are on hand, repeat steps 7-8 for with these
cells to determine if any match the original cell. If two cells match, mark
them appropriately and keep them as a set.
As a last option, change the orientation of the cells to find a matched
configuration. Repeat the steps above for two sample cells, placing both
cells in the cell compartment with the fill marks facing forward. If the
absorbance reading of the second cell is within +/- 0.002, the cells can be
used as a matched set in that particular orientation. All future work with
this particular set would require the same orientation. If necessary, repeat
matching process with different orientations as needed.
36
Page 37

SECTION I, continued
If the sample cells cannot be matched within ±0.002 Abs, they may still
be used by compensating for the difference. For example, if the second
cell reads 0.003 absorbance units higher than the first cell, correct future
readings (when using these two cells) by subtracting 0.003 absorbance
units (or the equivalent concentration) from the reading. Likewise, if the
second cell reads -0.003 absorbance units, add that value to the reading.
Volume Measurement Accuracy
The 10-and 25-mL sample cells supplied with the spectrophotometer have
fill marks to indicate either 10 mL or 25 mL. The fill marks are intended
to measure the volume to be analyzed. Do not use these fill marks to
perform sample dilutions.
If a sample must be diluted, use a pipet, graduated mixing cylinder and/or
a volumetric flask for accurate measurement. When diluting, accuracy is
important because a slight mistake in measuring a small sample will cause
a substantial error in the result. For instance, a 0.1-mL mistake in the
dilution of a 1.0-mL final volume produces a 10% error in the test result.
Volumes for standard additions can be measured in the 25-mL cells, but
it is not recommended for the 10-mL cells due to a potentially excessive
relative error. An error of 0.5 mL in 25 mL is only 2%, while a 0.5 mL
error in 10 mL is 5%.
For 10 mL standard additions, follow this procedure:
1. Pipet 10.0 mL of sample into a clean, dry 10 mL cell
2. Add the standard (spike) to a 25 mL portion of sample in a 25-mL
3. Transfer 10 mL to another 10-mL cell (use fill mark) for analysis.
Using AccuVac Ampuls
AccuVac ampuls contain pre-measured powder or liquid in optical-quality
glass ampuls.
1. Collect the sample in a beaker or other open container.
2. Place the ampul tip well below the sample surface and break the tip
(the unspiked sample).
mixing cylinder. Stopper and mix thoroughly.
off (see Figure 6) against the beaker wall. The break must be far
enough below the surface to prevent air from being drawn in as the
level of the sample lowers (the AccuVac Breaker may be used instead
of breaking the ampul against the beaker side).
37
Page 38
SECTION I, continued
3. Invert the ampul several times to dissolve the reagent. Do not place
your finger over the broken end; the liquid will stay in the ampul
when inverted. Wipe the ampul with a towel to remove fingerprints,
and other marks.
4. Insert the ampul into the AccuVac adapter in the DR/2010 and read
the results directly.
Figure 6 Using AccuVac Ampuls
1. 2.
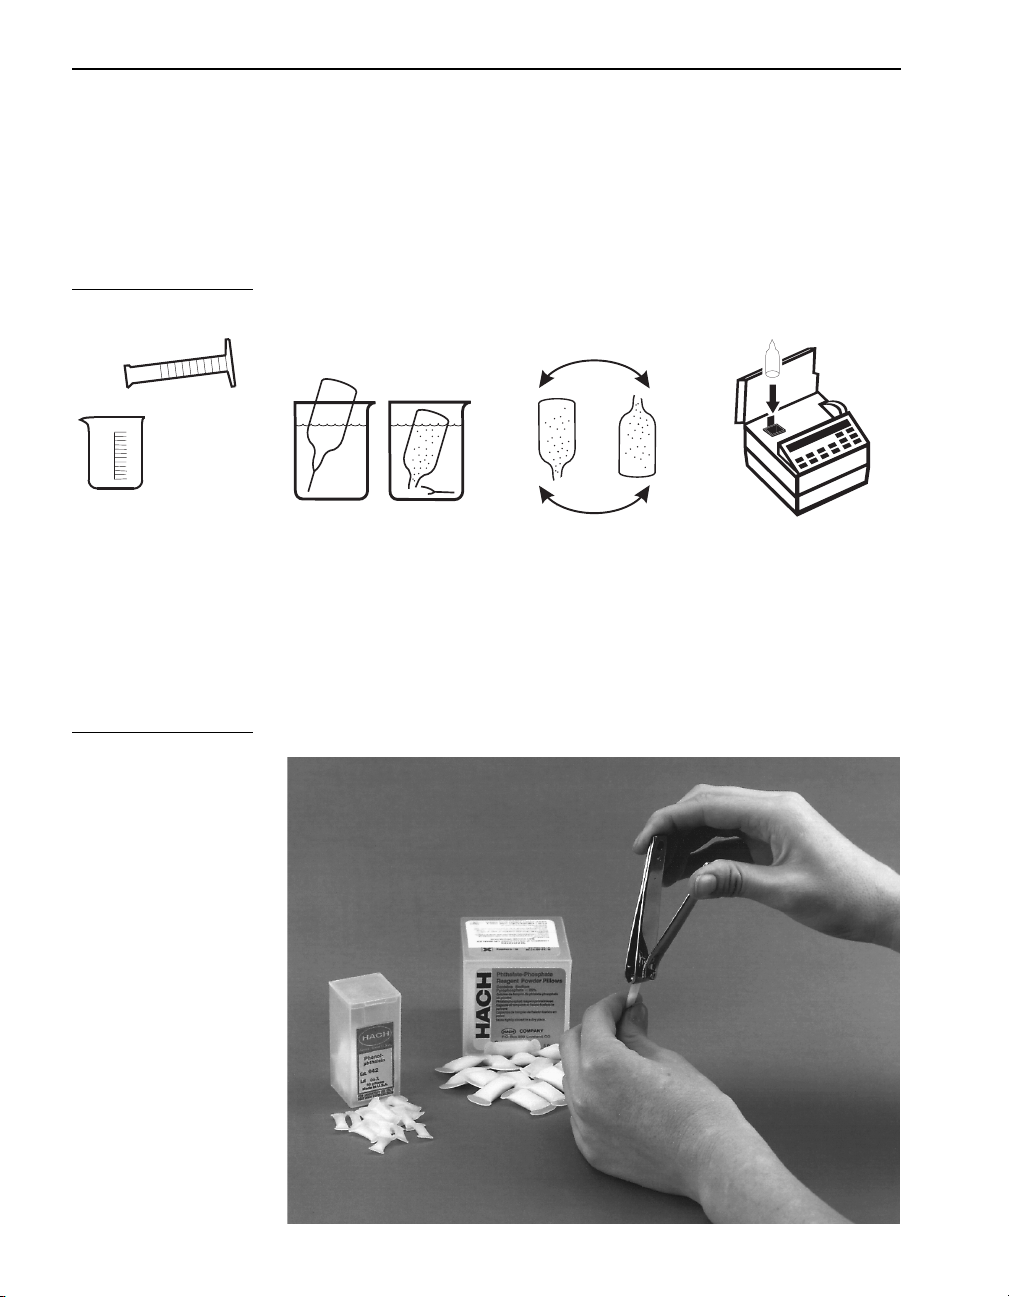
Using Reagent Powder Pillows
Hach uses dry powdered reagents when possible. This minimizes leakage
and deterioration problems. Some powders are packaged in individual,
pre-measured, polyethylene “powder pillows” or foil pillows called
PermaChem
Open the powder pillows with nail clippers or scissors; see Figure 7.
®
3.
4.
pillows. Each pillow contains enough reagent for one test.
Figure 7 Opening Powder Pillows
38
Page 39

SECTION I, continued
Using PermaChem Pillows
1. Tap the pillow on a hard surface to collect the powdered reagent in
the bottom.
2. Tear (or cut) across, from A to B, holding the pillow away from
your face.
3. Using two hands, push both sides toward each other to form a spout.
4. Pour the pillow contents into the sample cell and continue the
procedure according to the instructions.
Figure 8 Opening PermaChem Pillows
1. Tear 2. Push 3. Pour
BA
Using the Pour-Thru Cell
The Pour-Thru Cell is an optional accessory that improves accuracy and
makes measuring more convenient. It gives better results when measuring
at very low levels because it avoids any error that may result between
optical differences from single sample cells. Installation instructions for
the Pour-Thru Cell are given in the Instrument Manual. Each procedure
notes if the Pour-Thru Cell can be used; some procedures will not allow
the use of a Pour-Thru cell.
The DR/2010 offers many methods that use 10-mL sample sizes. The
Pour-Thru Cell cannot be used for procedures that use 10-mL sample
sizes and reagents. This volume does not flush the cell well enough to
avoid sample carryover errors. When possible, 25-mL reagents are listed
for those who prefer to use the Pour-Thru Cell.
When the procedure instructs you to place a 25-mL sample cell into the
cell holder, pour the solution into the funnel of the installed Pour-Thru
Cell Assembly (unless noted in the procedure).
Avoid spilling solution onto the instrument. The funnel height and
orientation may be adjusted for easier pouring.
39
Page 40

SECTION I, continued
The funnel height also determines the speed of sample flow through the
cell. The higher the funnel, the faster the flow. When properly adjusted,
the funnel drains completely with the final level of liquid in the tube about
5 cm (2 inches) below the tip of the funnel. This adjustment minimizes air
bubbles in the cell.
Measurement or instrument commands should only be made after the
solution has stopped flowing through the cell.
Occasionally, remove the Pour-Thru Cell to check for accumulation
of film on the windows. If the windows appear hazy, soak the cell in a
detergent bath and rinse thoroughly with deionized water. The cell may
be dissembled for cleaning. Do not over-tighten the screws during reassembly as the threads are easily stripped.
Always rinse thoroughly with deionized water after each series of tests,
or more often if specified in the procedure.
Caution:
Do not use or clean the Pour-Thru Cell with organic solvents such as acetone,
chloroform, toluene or cyclohexanone.
Reagent and Standard Stability
Hach always strives to make stable formulations and package them to
provide maximum protection. Most chemicals and prepared reagents do
not deteriorate after manufacture. However, the way they are stored and
the packaging can affect how long the reagents are stable. Light, bacterial
action, and absorption of moisture and gases from the atmosphere can
affect shelf life. Some chemicals may react with the storage container
or they may react with other chemicals.
Chemicals supplied with the DR/2010 Spectrophotometer have an
indefinite shelf life when stored under average room conditions, unless
the packaging says something different. Product labels state any special
storage conditions required. Otherwise, store reagents in a cool, dry, dark
place for maximum life. It is always good practice to date chemicals when
you receive them. Use older supplies first. If in doubt about the reagent
shelf life, run a standard to check its effectiveness.
40
Page 41

SECTION I, continued
Interferences
Substances in the sample may interfere with a measurement. Hach
mentions common interferences in the test procedures. The reagent
formulations eliminate many interferences. You can remove others with
sample pretreatments described in the procedure.
If you get an unusual answer, a color that you don’t expect, or you notice
an unusual odor or turbidity, the result may be wrong. Repeat the test on a
sample diluted with deionized water; see Sample Dilution Techniques.
Compare the result (corrected for the dilution) with the result of the
original test. If these two are not close, the original result may be wrong
and you should make an additional dilution to check the second test (first
dilution). Repeat this process until you get the same corrected result twice
in a row.
More information about interferences and methods to overcome them is
contained in Standard Additions and the General Introduction section of
APHA Standard Methods. Hach urges the analyst to obtain this book and
refer to it when problems are encountered.
pH Interference
Many of the procedures in this manual only work within a certain pH
range. Hach reagents contain buffers to adjust the pH of the typical
sample to the correct pH range. However, the reagent buffer may not be
strong enough for some samples. This occurs most often with highly
buffered samples or samples with extreme sample pH.
The Sampling and Storage section of each procedure gives the proper pH
range for the sample.
Adjust the sample to the proper pH range before testing. If this
information is not given, follow these steps:
1. Measure the pH of your analyzed sample with a pH meter. For
measuring K
2. Prepare a reagent blank using deionized water as the sample. Add all
reagents called for in the procedure. Timer sequences, etc., may be
ignored. Mix well.
3. Measure the pH of the reagent blank with a pH meter.
4. Compare the pH values of your analyzed sample with the
reagent blank.
+
or Cl- , use pH paper.
41
Page 42
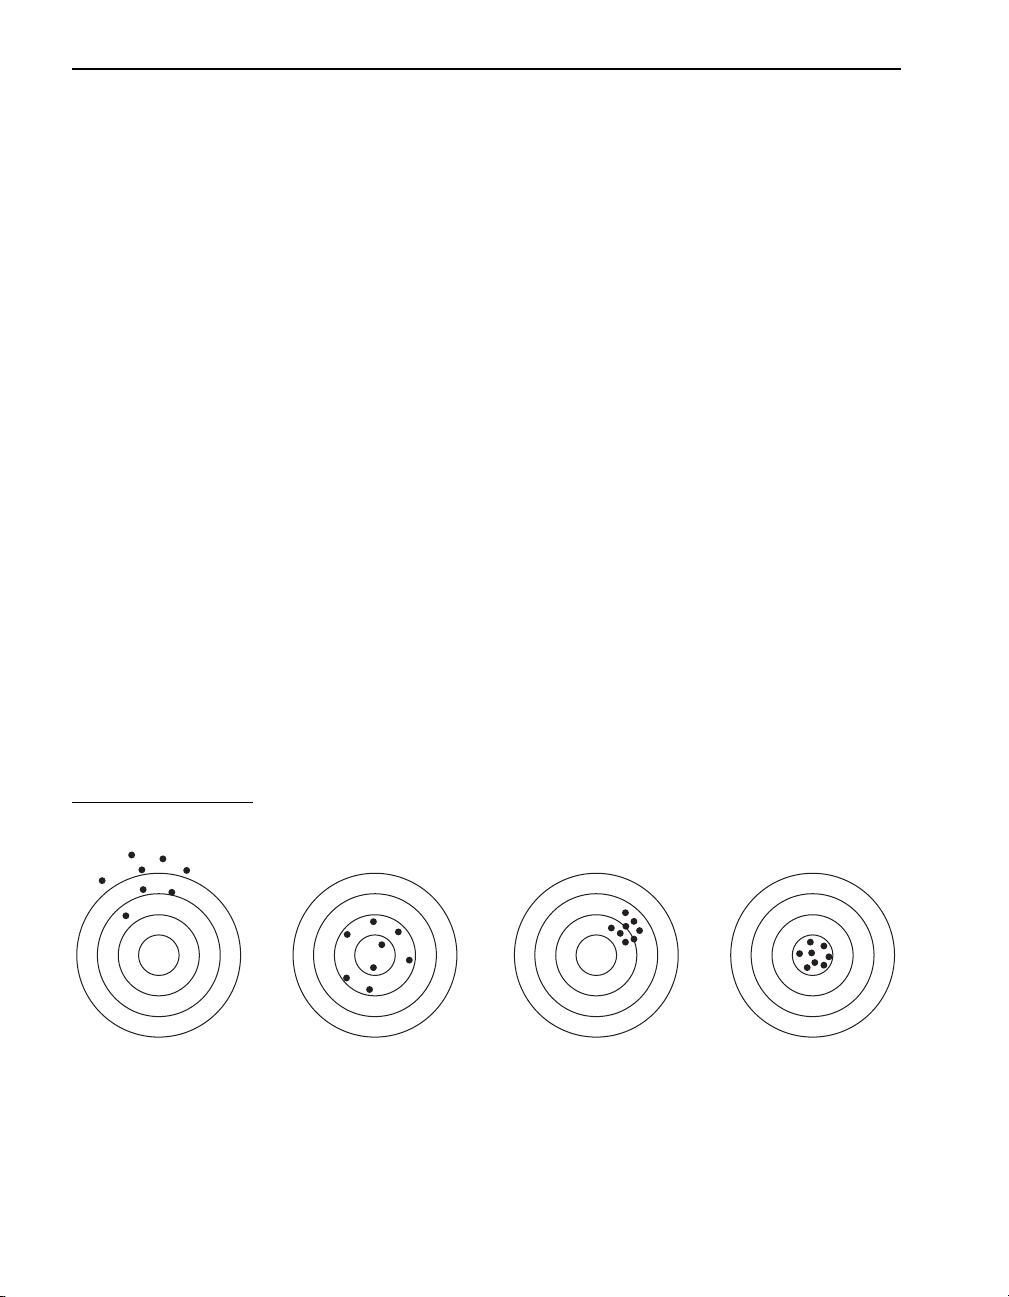
SECTION I, continued
5. If there is little difference in the values of your analyzed sample
and the reagent blank, then pH interference is not the problem. Follow
the Accuracy Check given in the procedure to more clearly identify
the problem.
6. If there is a large difference between the value of your analyzed
sample and the reagent blank, adjust the sample pH to the value of the
reagent blank. Adjust the sample pH to this same pH for all future
samples before analysis. Use the appropriate acid, usually nitric acid,
to lower the pH. Use the appropriate base, usually sodium hydroxide,
to raise the pH. Adjust the final result for any dilution caused by
adding acid or base; see Correcting for Volume Additions.
7. Analyze the sample as before.
8. Some purchased standards may be very acidic and will not work
directly with Hach procedures. Adjust the pH of these standards as
described above. Adjust the final concentration of the standard for the
dilution. The Hach standard solutions suggested in the procedures are
formulated so that no pH adjustment is necessary.
Accuracy and Precision
Accuracy is the nearness of a test result to the true value. Precision is how
closely repeated measurements agree with each other. Although good
precision suggests good accuracy, precise results can be inaccurate. The
following paragraphs describe how to improve accuracy and precision of
analyses by using Standard Additions.
Figure 9 Precision and Accuracy Illustrated
Not accurate,
not precise
One of the greatest aids is knowing what is in the sample. You don’t need
to know exactly what is in each sample, but be aware of substances that
are likely to interfere in the analysis method you use. When using a
method, it may be helpful to determine if those interferences are present.
Accurate,
not precise
Precise,
not accurate
Accurate and
precise
42
Page 43

SECTION I, continued
Standard Additions
Standard Additions is a common technique for checking test results.
Other names are “spiking” and “known additions.” The technique
can test for interferences, bad reagents, faulty instruments, and
incorrect procedures.
Perform Standard Additions by adding a small amount of a standard
solution to your sample and repeating the test. Use the same reagents,
equipment, and technique. You should get about 100% recovery. If not,
you have an identifiable problem.
If Standard Additions works for your test, a Standard Additions Method
section will be in the procedure under Accuracy Check. Follow the
detailed instructions given.
If you get about 100% recovery for each addition, everything is working
right and your results are correct.
If you don’t get about 100% recovery for each addition, a problem exists.
You can tell if you have an interference. Repeat the Standard Additions
using deionized water as your sample. If you get about 100% recovery for
each addition, you have an interference. If you didn’t get good recoveries
with the deionized water, the following checklist may help to find the
problem quickly:
1. Check to see that you are following the procedure exactly:
a) Are you using the proper reagents in the proper order? Are you
using 10-mL reagents with a 10-mL sample or 25-mL reagents
with a 25-mL sample?
b) Are you waiting the necessary time for color to develop?
c) Are you using the correct glassware?
d) Is the glassware clean?
e) Does the test need a specific sample temperature?
f) Is the sample’s pH in the correct range?
Hach’s written procedure should help you to answer these questions.
2. Check your reagents. Repeat the Standard Additions using new, fresh
reagents. If your results are good, the original reagents were bad.
43
Page 44

SECTION I, continued
3. Check the performance of your instrument. Follow the instructions in
the Maintenance section of the DR/2010 Instrument Manual.
4. If nothing else is wrong, the standard is almost certainly bad. Repeat
the Standard Additions with a new standard.
If the check list does not determine the problem, use the decision
tree (Figure 10) and explanation of each branch, below, to identify
the problem.
Branch A
Suppose a single standard addition to the sample did not give the correct
concentration increase. A possible cause could be interferences. Other
causes include defective reagents, incorrect technique, a defective
instrument/apparatus or defective standard used for the standard addition.
If interferences are known or assumed to be absent, proceed to Branch B.
If interferences are known to be present, proceed to Branch C.
Branch B
Perform multiple standard additions on a sample of deionized water as in
the following example using iron as the analyte of interest:
1. Pour 25 mL of deionized water into a 25-mL sample cell.
2. Add 0.1 mL of a 50-mg/L iron standard solution to a second 25 mL
sample of deionized water.
3. Add 0.2 mL of the same standard to a third 25 mL sample of
deionized water.
4. Add 0.3 mL of the same standard to a fourth 25 mL sample of
deionized water. Analyze all these samples for iron.
5. Tabulate the data as shown below:
mL of standard Added mg/L of Standard Added mg/L of Iron Found
000
0.1 0.2 0.2
0.2 0.4 0.4
0.3 0.6 0.6
44
Page 45

SECTION I, continued
Figure 10 Standard Additions Decision Tree
Did a Single Standard Addition Give the Correct Recovery?
No
D
Is the Procedure in
Use Correct?
No
Use Correct
Procedure and
Repeat B
A
No
Are
Interferences
Present?
No
B
Do Multiple
Standard Additions
On DI Water Give
Correct Recovery?
Yes
Yes
C
Do Multiple Standard
Additions On Sample
Give Uniform Increments?
No
F
Analysis
Is Incorrect
G
Analysis May
be Correct
Yes
J
Are
Interferences
Present?
No
K
Analysis
Is Correct
Yes
Yes
E
Yes
Are the Reagents Working Properly?
No
H
Repeat B with
New Reagents
Is Instrument Apparatus Working Properly?
No Yes
Repair/Replace
Instrument Apparatus
and Repeat B
Yes
I
Standards Defective
Repeat B with New
Standards
45
Page 46

SECTION I, continued
The data show several points:
• The chemicals, instrument, procedure/technique and standards are
working correctly because the iron added to the water sample was
completely recovered in the same uniform steps that match the
standard addition increments.
• Because iron added to the deionized water was recovered, but iron
added to an actual sample was not recovered (Branch A), the sample
contains an interference which prevents the test reagents from
working properly.
• An iron analysis previously done on the actual sample using this
method gave an inaccurate result.
If the results of multiple standard additions give the correct increment for
each addition, proceed to Branch C.
If the results of multiple standard additions do not give the correct
increment for each addition, go to Branch D.
Branch C
If interfering substances are present, the analysis may be incorrect.
However, with multiple standard additions, it may be possible to arrive at
an approximate result if the increases are uniform.
Suppose the sample result for iron was 1.0 mg/L. Because interferences
may be present, a standard addition of 0.1 mL of a 50 mg/L iron
standard to a 25 mL sample is made. The expected increase in the iron
concentration is 0.2 mg/L, but the actual increase is 0.1 mg/L. Then 0.2
and 0.3 mL of the same standard are added to two more 25 mL samples
and analyzed for iron.
If there is a uniform increase in concentration between each addition
(i.e., 0.1 mg/L difference between each addition), use Branch G. If the
increase in concentration is not uniform (i.e., 0.1, 0.08, 0.05), go to
Branch F.
Branch D
Carefully check the instructions for the test. Make sure to use the correct
reagents in the correct order. Be sure the colorimeter is adjusted to the
correct wavelength and the glassware in use is what is required. Be sure
time for color development and the sample temperature are as specified. If
the procedure technique was incorrect, repeat Branch B. If the procedure
was correctly followed, proceed to Branch E.
46
Page 47
SECTION I, continued
Branch E
Check the reagent performance. This may be done by obtaining a fresh lot
of reagent or by using a known standard solution to run the test. Make
sure the color development time given in the procedure is equal to the
time required for the reagent in question. If the reagent(s) is defective,
repeat Branch B with new reagents. If the reagents are good, proceed with
Branch H.
Branch F
Examples of non-uniform increments between standard additions are
shown below.
Example A
mL of Standard Added mg/L Standard Added mg/L Found
Example B
001.0
0.1 0.2 1.10
0.2 0.4 1.18
0.3 0.6 1.23
mL of Standard Added mg/L Standard Added mg/L Found
000
0.1 0.2 0
0.2 0.4 0.2
0.3 0.6 0.4
These examples show the effect of interferences on the standard addition.
Data plotted on the graph in Figure 10 for samples A and B show that the
four data points do not lie on a straight line.
The plot for sample A illustrates an interference that becomes
progressively worse as the concentration of the standard increases.
This type of interference is uncommon and may be caused by an error or
malfunction of the procedure, reagents or instrument. It is recommended
Branch B be performed to verify the supposed interference.
The plot for sample B shows a common chemical interference which
becomes less or even zero as the concentration of standard increases.
The graph shows the first addition was consumed by the interference
and the remaining additions gave the correct increment of 0.2 mg/L.
47
Page 48

SECTION I, continued
The apparent interference in Example B could be the result of an error
made in the standard addition. Repeat the analysis to see if an error was
made during standard addition. If not, the method is not appropriate for
the sample matrix. When these two types of interferences occur, try to
analyze the sample with another method which uses a different type
of chemistry.
Figure 11 Multiple Standard Additions Graph
48
Page 49

SECTION I, continued
Branch G
Examples of uniform increments between standard additions are
given below.
Example C
mL of Standard Added mg/L Standard Added mg/L Found
The plot for sample C illustrates a common interference with a uniform
effect on the standard and the substances in the sample. The four data
points form a straight line which may be extended back through the
horizontal axis. The point where the line meets the axis can be used to
determine the concentration of the substance you are measuring.
In this example, the first analysis gave 0.4 mg/L. After extrapolating the
line to the horizontal axis, the graph shows the result should be much
closer to the correct result: 0.8 mg/L.
000.4
0.1 0.2 0.5
0.2 0.4 0.6
0.3 0.6 0.7
Apparent interferences may also be caused by a defect in the
instrument or standards. Before assuming the interference is chemical,
check Branch B.
Example D
mL of Standard Added mg/L Standard Added mg/L Found
000
0.1 0.2 0.2
0.2 0.4 0.4
0.3 0.6 0.6
The plot for sample D illustrates a problem for the analyst. The
increments are uniform and the recovery of the standard was complete.
The result of the first analysis was 0 mg/L and the line extrapolates
back through 0 mg/L. If interferences are known to be present, the
interferences may be present in an amount equal to the substance in
question, preventing the analyst from finding the substance. This would
be an uncommon situation.
49
Page 50

SECTION I, continued
Branch H
Check operation of the instrument and/or apparatus used to perform the
test. Perform the wavelength and linearity checks in the instrument
manual. Check glassware used in the procedure and make sure it is
extremely clean. Dirty pipets and graduated cylinders can cause
contamination and will not deliver the correct volume.
If a defect is found in the instrument and/or apparatus, repeat Branch B
after repair or replacement. If the instrument and apparatus are working,
proceed with Branch I.
Branch I
After determining the procedure, reagents, instrument and/or apparatus
are correct and working properly, you may conclude the only possible
cause for standard additions not functioning correctly in deionized water
is the standard used for performing standard additions. Obtain a new
standard and repeat Branch B.
Branch J
If the standard additions gives the correct result, the analyst must then
determine if an interfering substance(s) is present. If interfering
substances are present, proceed to Branch C. If they are not present, the
analysis is correct.
If you still cannot identify the problem, extra help is available. Please call
our Technical Support Group at 800-227-4224 (U.S.A.) or 970-669-3050.
A representative will be happy to help you.
Method Performance
Estimated Detection Limit
Ranges for chemical measurements have limits. The lower limit is
important because it determines whether a measurement is different from
zero. Many experts disagree about the definition of this detection limit,
and determining it can be difficult. The Code of Federal Regulations
(40 CFR, Part 136, Appendix B) provides a procedure to determine the
“Method Detection Limit” or MDL. The MDL is the lowest concentration
that is different from zero with a 99% level of confidence. A measurement
below this MDL may be useful, but there is a greater chance that it is
actually zero.
The MDL is not fixed; it varies for each reagent lot, instrument, analyst,
sample type, etc. Therefore, a published MDL may be a useful guide, but
is only accurate for a specific set of circumstances. Each analyst should
50
Page 51

SECTION I, continued
determine a more accurate MDL for each specific sample matrix using
the same equipment, reagents and standards that will routinely be used
for measurements.
Hach provides a value called the Estimated Detection Limit (EDL) for
USEPA accepted and approved programs. It is the calculated lowest
average concentration in a deionized water matrix that is different from
zero with a 99% level of confidence. Specifically, it is the upper 99%
confidence limit for zero concentration based on the calibration data used
to prepare the pre-programmed calibration curve. Do not use the EDL as
a MDL. The conditions for MDL determination must be exactly the same
as the conditions used for analysis. The EDL may be useful to the analyst
as a starting point in determining a MDL or as a way to compare methods.
Measurements below the EDL may also be valuable because they can
show a trend, indicate the presence of analyte and/or provide statistical
data. However, these values have a large uncertainty.
Method Detection Limit (MDL)
This method is in accordance with the USEPA definition in 40 CFR,
Part 136, Appendix B in the 7-1-94 edition.
The USEPA defines the method detection limit (MDL) as the minimum
concentration that can be determined with 99% confidence that the true
concentration is greater than zero. Since the MDL will vary from analyst
to analyst, it is important that analysts determine the MDL based on their
unique operating conditions.
The procedure for determining MDL is based on replicate analyses at a
concentration 1 to 5 times the estimated detection limit. The MDL value
is calculated from the standard deviation of the replicate study results
multiplied by the appropriate Student’s t value for a 99% confidence
interval. For this definition, the MDL does not account for variation in
sample composition and can only be achieved under ideal conditions.
1. Estimate the detection limit. Use the Hach estimated detection
limit (EDL) value stated in the Method Performance section of the
analysis procedure.
2. Prepare a laboratory standard of the analyte in deionized water which
is free of the analyte that is 1 to 5 times the estimated detection limit.
3. Analyze at least 7 portions of the laboratory standard and record
each result.
4. Calculate the average and standard deviation (s) of the results.
51
Page 52

SECTION I, continued
5. Compute the MDL using the appropriate Student’s t value (see table
below) and the standard deviation value:
MDL = Student’s t x s
Number of Test Portions Student’s t Value
For example:
The EDL for measuring iron using the FerroZine method is 0.003 mg/L.
An analyst accurately prepared 1 liter of a 0.010 mg/L (about 3x the EDL)
laboratory standard by diluting a 10-mg/L iron standard in iron-free
deionized water.
Eight portions of the standard were tested according to the FerroZine
method with the following results:
73.143
82.998
92.896
10 2.821
Sample # Result (mg/L)
10.009
20.010
30.009
40.010
50.008
60.011
70.010
80.009
Using a calculator program, the average concentration = 0.010 mg/L and
the standard deviation (s) = 0.0009 mg/L
Based on the USEPA’s definition, calculate the MDL as follows:
MDL for FerroZine method = 2.998 (Student’s t ) x 0.0009 (s)
MDL = 0.003 mg/L (agrees with initial estimate)
Note: Occasionally, the calculated MDL may be very different than Hach’s
estimate of the detection limit. To test how reasonable the calculated MDL is,
repeat the procedure using a standard near the calculated MDL. The average
result calculated for the second MDL derivation should agree with the initial
52
Page 53

SECTION I, continued
calculated MDL. Refer to 40 CFR, Part 136, Appendix B (7-1-94), pages 635-637
for detailed procedures to verify the MDL determination.
Note: Run a laboratory blank, containing deionized water without analyte,
through the test procedure to confirm that the blank measurement is less than the
calculated MDL. If the blank measurement is near the calculated MDL, repeat the
MDL procedure using a separate blank for analysis for each standard solution
portion analyzed. Subtract the average blank measurement from each standard
and use the corrected standard values to calculate the average and standard
deviation used in the MDL.
Precision
Every measurement has a degree of uncertainty. Just as a ruler with
0.1-mm markings leaves some doubt as to the exact length of a
measurement, chemical measurements also have some degree of
uncertainty. The quality of the entire calibration curve determines
the precision.
Uncertainty in chemical measurements may be due to systematic errors
and/or random errors. A systematic error is a mistake that is always the
same for every measurement made. For example, a blank can add to each
measurement for a specific compound, giving consistently high results
(a positive bias). Random errors are different for every test and add either
positive or negative bias. Random errors may be caused by variation in
analytical technique and cause response variation. Hach chemists work
hard to eliminate systematic errors in Hach procedures using Hach
reagents, but response variation occurs in all chemical measurements.
Estimating Precision
The method performance section in each procedure provides an estimate
of the procedure’s precision. Two types of estimates are used throughout
this manual. Most of the procedures use a “replicate analysis” estimate,
based on real data. Some newer procedures use a 95% or 99% confidence
interval, which is based on the calibration generated data for that
particular chemistry.
In replicate analysis, a Hach chemist prepares a specific concentration
of the analyte in a deionized water matrix. The standard is then analyzed
seven individual times with the two reagent lots used in the calibration (14
total samples). A standard deviation of the two sets of seven values is
calculated. The larger value is reported in the method. The reported value
provides an estimate of the “scatter” of results at a particular point in the
calibration curve.
In the confidence interval technique, an estimate is obtained from the
calibration data itself, with no additional replicate analyses. In this case,
53
Page 54

SECTION I, continued
the precision is the 95 or 99% confidence interval for the stated
concentrations. The precision range is an estimate of the average response
variation and is based on multiple reagent lots and instruments used in the
calibration. Therefore, it will not exactly predict the true precision range
for each reagent lot, but does provide a useful estimate.
In either case, it is important to stress that the estimates are based on the
deionized water matrix. Precision on real samples with varying matrices
can be quite different than these estimates.
Selecting the Best Wavelength
When developing a new procedure or using procedures that are sensitive
to wavelength, it is normal to select the wavelength where the instrument
gives the greatest absorbance (see Figure 12). Because Hach chemists
have selected the best wavelength for the procedures in this manual,
selecting the wavelength is not necessary for most procedures.
Figure 12 Selecting the Best Wavelength
1.0
500 505 510 515 520
Absorbance
400 450 500 550 600 650 700
0.0
Wavelength (nm)
54
Page 55

SECTION I, continued
To select the best wavelength on the DR/2010:
1. Turn the instrument ON. Select the constant-on mode. Wait 5 minutes
for the instrument to warm up.
2. Enter the stored program for absorbance. Press:
0 ENTER.
The display will show: Abs
3. Rotate the wavelength dial until the small display shows the
approximate wavelength of interest.
Note: Sample color provides a good indication of what wavelength region to
use. A yellow solution absorbs light in the 400-500 nm region. A red solution
absorbs light between 500-600 nm. A blue solution absorbs light in the
600-700 nm range.
4. Prepare the sample and blank for analysis. FIll the appropriate sample
cells with the blank and the sample solutions (cells can be 10- or
25-mL cells, COD vial, 1-cm vials, etc.).
5. Place the blank in the cell holder. Orient the fill mark to your right.
Close the light shield.
6. Press:
ZERO. The display should read: 0.000 Abs
7. Place the prepared sample into the cell holder. Close the light shield.
Read the absorbance.
8. Increase the wavelength so it is at least 100 nm greater than the range
of interest. Re-zero as in Steps 5-6. Measure and record the
absorbance of the sample.
9. Repeat, decreasing the wavelength by 50 nm. Re-zero, then measure
and record the absorbance at each increment. Continue this process
through the wavelength range of interest. Note the wavelength of
greatest absorbance (see Tabl e 7 as an example).
Table 7 Example of Initial Wavelength Search
Wavelength Absorbance
550 nm 0.477
500 nm 0.762
450 nm 0.355
400 0.134
1 This indicates 500 nm as the region to search for the best wavelength.
1
55
Page 56

SECTION I, continued
10. Adjust the wavelength to 50 nm more than the highest absorbance
point on the initial search (step 9). Re-zero as in Steps 5 and 6.
11. Measure and record the absorbance. Repeat, decreasing the
absorbance in 5-nm steps. Re-zero, then measure and record the
absorbance at each increment. Continue until the entire range of
interest is measured (see Tab le 8 as an example).
Table 8 Example of Intermediate Wavelength Search
Wavelength Absorbance
520 0.748
515 0.759
510 0.780
505 0.771
500 0.771
495 0.651
490 0.590
1 This indicates the best wavelength to use is around 510 nm.
1
12. Increase the wavelength to 10 nm above the highest absorbance in
Step 11. Re-zero as in Steps 5 and 6. Measure and record the
absorbance. Repeat the measuring process (re-zeroing is not
necessary at each increment), decreasing the wavelength by 1 nm
each time.
Table 9 Example of Detailed Wavelength Search
Wavelength Absorbance
512 0.769
511 0.773
510 0.780
509 0.787
508 0.781
597 0.764
1 The optimum wavelength is 509 nm.
1
13. Check to be sure there is enough difference in absorbance between
samples with low and high analyte concentrations by measuring
two sample solutions that contain the expected low and high
concentrations of analyte at the optimum wavelength. The change in
absorbance caused by increases/decreases in concentration depends
on the sensitivity of the procedure and chemistry. Chemistries with
56
Page 57

SECTION I, continued
small absorbance changes are less sensitive, but tend to have larger
ranges. Chemistries with large absorbance changes are more
sensitive, but tend to have smaller ranges.
Adapting HACH Procedures to Other Spectrophotometers
Hach procedures may be used with other spectrophotometers if
calibration curves that convert absorbance or %T to concentration are
made. Regardless of the spectrophotometer used, prepare the sample and
calibration standards following the Hach procedure and use the optimum
wavelength used in the Hach procedure.
The example below describes a calibration for iron in the 0-2.4 mg/L
range. A series of iron standards are prepared and measured to establish
the calibration curve. The absorbance vs. concentration is plotted on
linear graph paper (as in Figure 11, Multiple Standard Additions Graph)
or %T vs. concentration is plotted on semi-logartihmic paper. Points on
the graph are connected with a smooth line (curved or straight). If
necessary, use the curve to make a calibration table.
Preparing a Calibration Curve
1. Prepare five or more standards of known concentration that cover the
expected range of the test. Run tests as described in the procedure on
each prepared standard. Then pour the customary volume of each
known solution into a separate clean sample cell of the type specified
for your instrument.
2. Select the proper wavelength. Standardize (zero) the instrument using
an untreated water sample or a reagent blank, whichever the
procedure instructs you to use.
3. Measure and record the %T or absorbance of the known solutions.
To use %T vs. concentration see section %T Versus Concentration
Calibration. To use absorbance vs. concentration, see section
Absorbance Versus Concentration Calibration.
%T Versus Concentration Calibration
If measuring %T, use semilogarithmic graph paper and plot %T (vertical
scale) versus concentration (horizontal scale). For Figure 13, iron
standard solutions of 0.1, 0.2, 0.4, 0.8, 1.2, 1.6 and 2.0 mg/L were
measured on a Spectronic 20 at 500 nm using half-inch test tubes. Results
were plotted and the calibration table values were extrapolated from the
curve (Table 10).
57
Page 58
SECTION I, continued
Figure 13 Logarithmic Calibration Curve
100
PERCENT TRANSMITTANCE
80
60
50
40
30
20
10
0.00
0.20
0.40
0.60
0.80
1.00
1.20
1.40
1.60
1.80
2.00
2.20
2.40
mg/L IRON
To convert %T readings to concentration, prepare a table such as Tabl e 10
and select the appropriate line from the “%T Tens” column and the
appropriate column from the %T Units columns. The %T Ten value is
the first number of the %T reading and the %T Units value is the second
number of the %T reading. For example, if the instrument reading was
46%, the 40 line in the %T Tens column and the 6 column in the %T
Units would be selected. The cell where these two intersect (0.78 mg/L)
is the iron concentration of the sample.
58
Page 59

SECTION I, continued
Table 10 Calibration Table
%T
Tens
0
10 2.30 2.21 2.12 2.04 1.97 1.90 1.83 1.77 1.72 1.66
20 1.61 1.56 1.51 1.47 1.43 1.39 1.35 1.31 1.27 1.24
30 1.20 1.17 1.14 1.11 1.08 1.04 1.02 0.99 0.97 0.94
40 0.92 0.89 0.87 0.84 0.82 0.80 0.78 0.76 0.73 0.71
50 0.69 0.67 0.65 0.64 0.62 0.60 0.58 0.56 0.55 0.53
60 0.51 0.49 0.48 0.46 0.45 0.43 0.42 0.40 0.39 0.37
70 0.36 0.34 0.33 0.32 0.30 0.29 0.28 0.26 0.25 0.24
80 0.22 0.21 0.20 0.19 0.17 0.16 0.15 0.14 0.13 0.12
90 0.11 0.09 0.08 0.07 0.06 0.05 0.04 0.03 0.02 0.01
01234567 8 9
% Units
Absorbance Versus Concentration Calibration
If absorbance values are measured, plot the results on linear graph paper.
Plot the absorbance value on the vertical axis and the concentration on the
horizontal axis.
Plot increasing absorbance values from bottom to top. Plot increasing
concentration values from left to right. Values of 0.000 absorbance units
and 0 concentration will begin at the bottom left corner of the graph. A
calibration table can be extrapolated from the curve or the concentration
values can be read directly from the graph. Or determine an equation for
the line using the slope and y-intercept.
59
Page 60

SECTION I, continued
USEPA Approved and Accepted Definitions
The United States Environmental Protection Agency (USEPA) establishes
limits for maximum contamination levels of certain constituents in water.
It also requires that specific methodology be used to analyze for these
constituents. These methods originate from several sources. The USEPA
has developed some of these methods. In other cases, the USEPA has
evaluated and approved methods developed by manufacturers,
professional groups and public agencies such as:
• American Public Health Association
• American Water Works Association
• Water Environmental Federation
• American Society for Testing and Materials
• United States Geological Survey
• Associates of Official Analytical Chemists
All USEPA-approved methods are cited in the Federal Register and
compiled in the Code of Federal Regulations (CFR). USEPA approved
methods may be used for reporting results to the USEPA and other
regulatory agencies.
USEPA Accepted
Hach has developed several procedures that are equivalent to USEPA
approved methods. Even though minor modifications exist, the USEPA
has reviewed and accepted certain procedures for reporting purposes.
These methods are not published in the Federal Register, but are
referenced to the equivalent USEPA method in the procedure.
60
Page 61

SECTION II SAMPLE PRETREATMENT
Digestion
Several procedures require sample digestion. Digestion uses chemicals
and heat to break down a substance into components that can be analyzed.
This section has three different digestion procedures.
The Hach Digesdahl system is a process that yields a digest suitable for
the determination of metals, total phosphorus and total kjeldahl nitrogen
(TKN). It is rapid, convenient and the method of choice.
For USEPA reporting purposes, USEPA-approved digestions are required.
USEPA presents two digestions (mild and vigorous) for metals analysis.
These are much more inconvenient and time consuming compared to the
Hach Digesdahl system. Other digestion procedures are required for
mercury, arsenic, phosphorus and TKN.
EPA Mild Digestion with Hot Plate for Metals Analysis Only
1. Acidify the entire sample at the time of collection with concentrated
nitric acid by adding 5 mL of acid per liter (or quart) of sample.
2. Transfer 100 mL of well-mixed sample to a beaker or flask. Add 5 mL
of distilled 1:1 hydrochloric acid (HCl).
3. Heat using a steam bath or hot plate until the volume has been reduced to
15-20 mL. Make certain the sample does not boil.
4. After this treatment, the sample may be filtered to remove any
insoluble material.
5. Adjust the digested sample to pH 4 by drop-wise addition of 5.0 N
Sodium Hydroxide Standard Solution. Mix thoroughly and check the
pH after each addition.
6. Quantitatively transfer the sample with deionized water to a 100-mL
volumetric flask and dilute to volume with deionized water. Continue
with the procedure. This mild digestion may not suffice for all sample
types. A reagent blank also should be carried through the digestion and
measurement procedures.
61
Page 62

SECTION II, continued
EPA Vigorous Digestion with Hot Plate for Metals Analysis Only
A vigorous digestion can be followed to ensure all organo-metallic bonds
are broken.
1. Acidify the entire sample with redistilled 1:1 Nitric Acid Solution to a
pH of less than two. Do not filter the sample before digestion.
2. Transfer an appropriate sample volume (see Table 11) into a beaker
and add 3 mL of concentrated redistilled nitric acid.
3. Place the beaker on a hot plate and evaporate to near dryness, making
certain the sample does not boil.
4. Cool the beaker and add another 3 mL of the concentrated redistilled
nitric acid.
5. Cover the beaker with a watch glass and return it to the hot plate.
Increase the temperature of the hot plate so that a gentle reflux occurs.
Add additional acid, if necessary, until the digestion is complete
(generally indicated when the digestate is light in color or does not
change color or appearance with continued refluxing).
6. Again, evaporate to near dryness (do not bake) and cool the beaker. If
any residue or precipitate results from the evaporation, add redistilled
1:1 hydrochloric acid (5 mL per 100 mL of final volume). See Table 11.
7. Warm the beaker. Add 5 mL of 5.0 N sodium hydroxide and
quantitatively transfer the sample with deionized water to a volumetric
flask. See Table 11 below for the suggested final volume.
8. Adjust the sample to pH 4 by drop-wise addition of 5.0 N Sodium
Hydroxide Standard Solution; mix thoroughly and check the pH after
each addition. Dilute to volume with deionized water. Multiply the
result by the correction factor in Table 11. A reagent blank also should
be carried through the digestion and measurement procedures.
Table 11 Vigorous Digestion Volumes
Expected Metal
Concentration
1 mg/L 50 mL 10 mL 200 mL 4
10 mg/L 5 mL 10 mL 200 mL 40
100 mg/L 1 mL 25 mL 500 mL 500
Suggested Sample
Vol. for Digestion
Suggested Volume
of 1:1 HCl
Suggested Final
Volume After
Digestion
Correction Factor
62
Page 63

SECTION II, continued
General Digesdahl Digestion (Not USEPA accepted)
Many samples may be digested using the Digesdahl Digestion Apparatus
(Cat. No. 23130). It is designed to digest many types of samples such as
oils, wastewater, sludges, feeds, grains, plating baths, food, and soils. In
this procedure the sample is oxidized by a mixture of sulfuric acid and
hydrogen peroxide. Digestion of a dry sample requires less than ten
minutes, while liquid samples require about 1 minute/mL. The digestion is
done in a special flat-bottomed 100-mL volumetric flask. Aliquots (sample
portions) are taken for analysis using colorimetric methods.
Procedures for digestion and using the Digesdahl Digestion Apparatus are
based on the type and form of the sample, and are found in the Digesdahl
Digestion Apparatus Instruction Manual, which is included with each
Digesdahl Digestion Apparatus.
Distillation
Distallation Applications for the General Purpose Distillation Apparatus include:
• fluoride • phenols
• albuminoid nitrogen • selenium
• ammonia nitrogen • volatile acids
Arsenic and cyanide require specialty glassware sets in addition to the
General Purpose Set (the Arsenic Distillation Apparatus and the Cyanide
Distillation Apparatus). All connecting glassware is manufactured with
threaded connectors for ease and safety. The General Purpose Heater provides
efficient heating and the Support Apparatus anchors the glassware.
63
Page 64

SECTION II, continued
Figure 14 General Purpose Distillation Apparatus with Heater and Support Apparatus
64
Page 65

SECTION III WASTE MANAGEMENT AND SAFETY
Waste Management
This section provides guidelines for laboratory waste management. It
should assist you in complying with USEPA regulations governing waste
management. It summarizes basic requirements, but does not contain all
USEPA regulations. It does not relieve people from complying with all
regulations contained in the Code of Federal Regulations. Regulations
change regularly and additional state and local laws may apply to you.
Each waste generator is responsible for knowing and obeying these laws.
Waste Minimization
Waste minimization is the foundation of good waste management.
Minimizing waste greatly reduces the disposal problems and expense.
If possible, try to generate less waste rather than recycle or re-use it.
For laboratories, ways to reduce waste include:
• Use the smallest sample size possible.
• Choose methods that use non-hazardous or “less” hazardous reagents
when possible.
• Buy chemicals in small quantities which will be used before they
expire. This eliminates disposal of out-dated materials.
• Clean glassware and laboratory apparatus with non-hazardous soaps
Regulatory Overview
Federal waste disposal regulations were issued in accordance with the
Resource Conservation and Recovery Act (RCRA). They are given in
Title 40 Code of Federal Regulations (CFR) part 260. The Act controls all
forms of solid waste disposal and encourages recycling and alternative
energy sources. The major emphasis is controlling hazardous waste
disposal. The regulations create a system to identify wastes and track
waste generation, transport, and ultimate disposal. Each facility involved
in managing hazardous waste must be registered with the USEPA. This
includes the generator, transporters, and treatment, storage, and disposal
facilities (TSDF).
Under federal regulations, there are three categories of generators with
increasingly more strict regulation for larger quantity generators. The
categories are based on the amount of hazardous waste generated in any
given month.
when possible, rather than solvents or acids which may be hazardous.
65
Page 66

SECTION III, continued
The categories are as follows:
• Conditionally Exempt Small Quantity Generator - less than 100 kg
(220 lb.) per month
• Small Quantity Generator - between 100 kg (220 lb.) and 1,000 kg
(2,200 lb.) per month
• Large Quantity Generator - greater than 1,000 kg (2,200 lb.)
per month
Note: If a laboratory generates acutely hazardous waste (as defined on 40 CFR
261) or accumulates more than a certain amount of waste, the facility may be
moved into a larger generator status. Check with your environmental compliance
manager or state and local officials to determine which category your facility is in.
Hazardous Waste Definition
For regulatory purposes, a “hazardous waste” is a material which is
subject to special laws by the USEPA under 40 CFR 261. In addition,
many states or local authorities regulate additional materials as hazardous
waste. Be aware that many very toxic compounds are not regulated by this
definition of hazardous waste. However, improper management or
disposal of these compounds may lead to legal problems under other laws
such as CERCLA (Superfund) or common law tortes.
The 40 CFR 261 defines a hazardous waste as a solid waste which is not
excluded from regulation and meets any of the following criteria:
• It is a discarded commercial chemical product, off-specification
species, container residue, or spill residue of materials specifically
listed in 40 CFR 261.33;
• It is a waste from a specific source listed in 40 CFR 261.32;
• It is a waste from a non-specific source listed in 40 CFR 261.31; or
• It displays any of the following characteristics of hazardous waste
defined in 40 CFR 261.20-24:
• ignitability
• corrosivity
• reactivity
• toxicity
There are many exceptions to these regulations, and each generator should
review the regulations and determine if they are excluded from the regulations.
66
Page 67

SECTION III, continued
Characteristic Hazardous Waste Codes
Hazardous wastes are managed by specific codes assigned in 40 CFR
261.20-261.33. These codes are provided to help you identify hazardous
waste. The generator is responsible for making the actual waste code
determination.
Selected characteristic waste codes for chemicals which may be generated
using Hach methods for water analysis are given in the following table.
A complete list of waste codes is found in 40 CFR 261.24.
USEPA Code Characteristic CAS No.
D001 Ignitability na na
D002 Corrosivity na na
D003 Reactivity na na
D004 Arsenic 6440-38-2 5.0
D005 Barium 6440-39-3 100.0
D018 Benzene 71-43-2 0.5
D006 Cadmium 7440-43-9 1.0
D022 Chloroform 67-66-3 6.0
D007 Chromium 7440-47-3 5.0
D008 Lead 7439-92-1 5.0
D009 Mercury 7439-97-6 0.2
D010 Selenium 7782-49-2 1.0
D011 Silver 7440-22-4 5.0
How to Determine if Waste is Hazardous
Federal laws do not require you to test a material to decide if it is a
hazardous waste. You may apply product knowledge to decide if a
material is hazardous. Often, information on a material safety data sheet
(MSDS) is enough to decide. If the product is specifically listed in the
regulation, it is a hazardous waste.
Regulatory Level
(mg/L)
You also need to decide if it has any characteristics of a hazardous waste.
Physical information on the MSDS may help you decide. If the flash point
is below 60 °F (15 °C) or is classified by DOT as an oxidizer, the material
may be ignitable. If the pH of the material is ≤2 or ≥12.5, the material
may be corrosive. If the material is unstable, reacts violently with water,
or may generate toxic gases, vapors, or fumes when mixed with water, it
may be reactive.
67
Page 68

SECTION III, continued
Use the chemical composition data to decide if a material is toxic. This
decision is based on the concentration of certain contaminants (heavy
metals and a number of organic compounds). If the waste is a liquid,
compare the concentration of the contaminants in the liquid to the
concentrations listed in 40 CFR 261.24. If the waste is a solid, analyze
the sample by the Toxicity Characteristic Leachability Procedure (TCLP)
and compare the results to the concentration listed in the 40 CFR 261.24.
Levels above the threshold amount listed in the table are
considered hazardous.
See the description of an MSDS (page 71) for help in finding information
for making hazardous waste determinations.
Examples of Hazardous Waste
A number of chemicals used in and final solutions created from Hach
procedures are hazardous wastes when they are disposed. In addition,
substances in the sample matrix may be a hazardous waste. Sometimes,
reagents which would be hazardous are neutralized or changed during the
analytical procedure. In that case, the final solutions are not regulated.
Finally, many reagents and final solutions may be non-regulated. The
generator must either use their knowledge of the materials used or conduct
analytical tests to determine if the final material is a hazardous waste.
Examples of tests using Hach reagents that generate hazardous waste
include those containing mercury or mercury compounds such as COD
tests or Nessler’s reagent. Conversely, a test using Hach reagents such as
ManVer 2 Hardness Indicator Powder Pillows and EDTA Titration
Cartridges does not produce a hazardous waste.
Hazardous Waste Disposal
Hazardous waste must be managed and disposed of according to federal,
state, and local regulations. The waste generator is responsible for making
hazardous waste determinations. Analysts should check with the facility’s
environmental compliance people for specific instructions.
Hazardous wastes should be handled by treatment, storage, and disposal
facilities (TSDF) that have USEPA permits. In some cases, the generator
may treat the hazardous waste. In most cases, a permit from the USEPA is
required to treat hazardous waste. Laboratories are not exempt from these
regulations. If your facility is a “Conditionally Exempt Small Quantity
Generator,” special rules may apply. Check 40 CFR 261 to determine if
you have to comply with all the laws.
68
Page 69

SECTION III, continued
The most common allowed treatment is elementary neutralization. This
refers to neutralizing wastes that are hazardous only because they are
corrosive or are listed only for that reason. Neutralize acidic solutions by
adding a base such as sodium hydroxide; neutralize basic solutions by
adding an acid such as hydrochloric acid. Slowly add the neutralizing
agent while stirring. Monitor the pH. When it is at or near 7, the material
is neutralized and may be flushed down the drain. Many wastes generated
from Hach procedures may be treated in this manner.
Other chemical or physical treatments such as cyanide destruction or
evaporation may require a permit. Check with your environmental
department or local regulators to determine which rules apply to
your facility.
Laboratory chemicals may be mixed and disposed of with other
hazardous wastes generated at your facility. They may also be
accumulated in accordance with 40 CFR 262.34 satellite accumulation
rules. After collection they may be disposed of in a “labpack.” A number
of environmental and hazardous waste companies offer labpacking
services. They will inventory, sort, pack, and arrange proper disposal for
hazardous waste. Find companies offering these services in the Yellow
Pages under "Waste Disposal - Hazardous" or contact state and local
regulators for assistance.
Management of Specific Wastes
Hach has several documents to assist customers in managing waste
generated from our products. You can obtain the following documents by
calling 1-800-227-4224 or 970-669-3050 and requesting the literature
codes given:
Literature Code Title
1321 Waste Reduction: A Primer
9323 Mercury Waste Disposal Firms
9325 COD Waste Management
9326 COD Heavy Metal Total Concentrations
Special Considerations for Cyanide Containing Materials
Several procedures in this manual use reagents that contain cyanide
compounds. These materials are regulated as reactive (D003) waste by the
Federal RCRA. Waste disposal instructions provided with each procedure
tell you how to collect these materials for proper disposal. It is imperative
that these materials be handled safely to prevent the release of hydrogen
cyanide gas (an extremely toxic material with the smell of bitter
69
Page 70

SECTION III, continued
almonds). Most cyanide compounds are stable and can be safely stored
for disposal in highly alkaline solutions (pH >11) such as 2 N sodium
hydroxide. Never mix these wastes with other laboratory wastes that may
contain lower pH materials such as acids or even water.
If a cyanide-containing compound is spilled, you must be careful not to be
exposed to hydrogen cyanide gas. Take the following steps to destroy the
cyanide compounds in an emergency:
a) Use a fume hood, supplied air or self-contained breathing apparatus.
b) While stirring, add the waste to a beaker containing a strong
solution of sodium hydroxide and either calcium hypochlorite or
sodium hypochlorite (household bleach).
c) Add a lot of hydroxide and hypochlorite. Let the solution stand for
24 hours.
d) Neutralize the solution and flush it down the drain with a large
amount of water. If the solution contains other regulated materials
such as chloroform or heavy metals, it may still need to be
collected for hazardous waste disposal. Never flush hazardous
wastes down the drain.
Resources
Many sources of information on proper waste management are available.
The USEPA has a hotline number for questions about the Resource
Conservation and Recovery Act (RCRA). The RCRA Hotline number is
1-800-424-9346. You may also get a copy of the appropriate regulations.
Federal hazardous waste regulations are found in 40 CFR 260- 99. Obtain
this book from the U.S. Government Printing Office or a number of other
vendors. Other documents which may be helpful to the laboratory
hazardous waste manager include:
1. Task Force on Laboratory Waste Management. Laboratory Waste
Management, A Guidebook; American Chemical Society, Department
of Government Relations and Science Policy: Washington, DC 1994.
2. Task Force on Laboratory Waste Management. Waste Management
Manual for Laboratory Personnel; American Chemical Society,
Department of Government Relations and Science Policy:
Washington, DC 1990.
3. Task Force on Laboratory Waste Management. Less is Better; 2nd ed.;
American Chemical Society, Department of Government Relations
and Science Policy: Washington, DC 1993.
70
Page 71

SECTION III, continued
4. Committee on Chemical Safety. Safety in Academic Chemistry
Laboratories, 5th ed.; American Chemical Society:
Washington, DC, 1990.
5. Armour, Margaret-Ann. Hazardous Laboratory Chemicals Disposal
Guide; CRC Press: Boca Raton, FL, 1991.
6. Environmental Health and Safety Manager’s Handbook; Government
Institutes, Inc.: Rockville, MD, 1988.
7. Lunn, G.; Sansone, E.B. Destruction of Hazardous Chemicals in the
Laboratory; John Wiley and Sons: New York, 1990.
8. National Research Council. Prudent Practices for Disposal of
Chemicals from Laboratories; National Academy Press: Washington,
DC, 1983.
9. National Research Council. Prudent Practices for Handling
Hazardous Chemicals in Laboratories; National Academy Press:
Washington, DC, 1981.
10. Environmental Protection Agency, Office of Solid Waste and
Emergency Response. The RCRA Orientation Manual; U.S.
Government Printing Office: Washington, DC, 1991.
11. Environmental Protection Agency, Office of Solid Waste and
Emergency Response. Understanding the Small Quantity Generator
Hazardous Waste Rules: A Handbook for Small Business; U.S.
Government Printing Office: Washington, DC, 1986.
Material Safety Data Sheets
Material safety data sheets (MSDS) describe the hazards of chemical
products. This section describes the information provided on a Hach
MSDS and how to locate important information for safety and waste
disposal. The information provided on the MSDS applies to the product as
sold by Hach. The properties of any mixtures obtained by using this
product will be different.
How to Obtain an MSDS
Hach ships a MSDS to each customer with the first order of any chemical
product. A new MSDS may be sent when the information on the data
sheet is updated. Please review all new MSDSs for new information.
If you need another copy of an MSDS, simply call 1-800-227-4227.
71
Page 72

SECTION III, continued
Sections of an MSDS
Each MSDS has ten sections. The sections and the information found in
them are described below.
Header Information
The Hach catalog number, MSDS date, change number, company address
and telephone number, and emergency telephone numbers are listed at the
top of the MSDS.
1 Product Identification
This section contains:
• Hach product name
• Chemical Abstract Services (CAS) number
• Chemical name
• Chemical formula, if appropriate
• Chemical family to which the material belongs
2 Ingredients
This section lists each component in the product. It contains the following
information for each component:·
• PCT: Percent by weight of this component
• CAS NO.: Chemical Abstract Services (CAS) registry number for
this component
• SARA: Superfund Amendments and Reauthorization Act, better
known as the “Community Right to Know Law.” Says if the
component is listed in SARA 313. If the component is listed and you
use more than the amount listed, you must report this to the USEPA
every year.
• TLV: Threshold Limit Value. The maximum airborne concentration
for an 8 hour exposure that is recommended by the American
Conference of Governmental Industrial Hygienists (ACGIH).
• PEL: Permissible Exposure Limit. The maximum airborne
concentration for an 8 hour exposure that is regulated by the
Occupational Safety and Health Administration (OSHA).
• HAZARD: Physical and health hazards of the component
are explained.
72
Page 73

SECTION III, continued
3 Physical Data
The physical properties of the product are given in this section. They
include the physical state, color, odor, solubility, boiling point, melting
point, specific gravity, pH, vapor density, evaporation rate, corrosivity,
stability, and storage precautions.
4 Fire, Explosion Hazard And Reactivity Data
This section contains the flash point and flammable limits of the material.
It also includes how to fight fires if the material catches on fire. Key terms
in this section include:
• Flashpoint: The temperature at which a liquid will give off enough
flammable vapor to ignite.
• Flammability and ignitability are usually defined by the flash point.
• Lower Flammable Limit (LFL or LEL): The lowest concentration that
will produce a fire or flash when an ignition source is present.
• Upper Flammable Limit (UFL or UEL): The vapor concentration in
air above which the concentration is too rich to burn.
• NFPA Codes: The National Fire Protection Association (NFPA) has a
system to rate the degree of hazards presented by a chemical. These
codes are usually placed in a colored diamond. The codes range from
0 for minimal hazard to 4 for extreme hazard. They are grouped into
the following hazards: health (blue), flammability (red), reactivity
(yellow), and special hazards (white).
5 Health Hazard Data
This section describes different ways the chemical can enter your body
(ingestion, inhalation, skin contact). It also gives acute (immediate) and
chronic (long-term) health effects. If the material causes cancer or genetic
damage, it is identified in this section.
6 Precautionary Measures
This section contains special precautions for the material. These may
include special storage instructions, handling instructions, conditions to
avoid, and protective equipment required to use this material safely.
7 First Aid
First aid instructions for exposures to the chemical are given in this
section. Be sure to read this section before inducing vomiting in a victim.
Some chemicals are better treated by not inducing vomiting. Seek prompt
medical attention for all chemical exposures.
73
Page 74

SECTION III, continued
8 Spill And Disposal Procedures
This section tells about safe work practices for cleaning up and disposing
of spilled material. Please refer to the Waste Management section of this
manual. Final determination of proper and legal disposal options is the
responsibility of the waste generator. Be sure you know the federal, state,
and local laws that apply to your facility.
9 Transportation Data
Domestic and International shipping information is provided in this section.
It gives shipping name, hazard class, and ID number of the product.
10 References
This section lists the reference materials used to write the MSDS.
Following the Reference section, the product is listed as having SARA
313 chemicals or California Proposition 65 List Chemicals, if applicable.
Also found here is any special information about the product.
Safety
Safety is the responsibility of each person performing analytical
procedures. Because many of the procedures in this methods manual use
potentially hazardous chemicals and equipment, it is important to prevent
accidents by practicing good laboratory techniques. The following
guidelines apply to water analysis. These guidelines do not cover
every aspect of safety, but they are important for preventing injuries.
Material Safety Data Sheet
A material safety data sheet (MSDS) comes with the first shipment of all
products. The MSDS provides environmental and safety information about
the products. Always read the MSDS before using a new product.
Reading Labels Carefully
Read each reagent label carefully. Pay particular attention to the precautions
given. Never remove or block the label on a reagent container while it
contains reagent. Do not put a different reagent into a labeled container
without changing the label. When preparing a reagent or standard solution,
label the container clearly. If a label is hard to read, re-label promptly
according to your facility’s hazard communication program.
Warning labels also appear on some of the apparatus used with the
test procedures. The protective shields with the COD Reactor and the
Digesdahl Digestion Apparatus point out potential hazards. Be sure these
shields are in place during use and observe the precautions on the label.
74
Page 75

SECTION III, continued
Protective Equipment
Use the right protective equipment for the chemicals and procedures. The
MSDS contains this information. Protective equipment may include:
• Eye protection such as safety glasses or goggles to protect from flying
objects or chemical splashes.
• Gloves to protect skin from toxic or corrosive materials, sharp
objects, very hot or very cold materials, or broken glass. Use tongs or
finger cots when transferring hot apparatus.
• Laboratory coats or splash aprons to protect skin and clothing
from splashes.
• Footwear to protect feet from spills. Open toed shoes should not be
worn in chemistry settings.
• Respirators may be needed to protect you from breathing toxic vapors
if adequate ventilation, such as fume hoods, are not available.
• Use fume hoods as directed by the procedure or as recommended in
the MSDS.
• For many procedures, adequate ventilation is enough. Be sure there is
enough fresh air and air exhaust to protect against unnecessary
exposure to chemicals.
First Aid Equipment and Supplies
Most first aid instructions for chemical splashes in eyes or on skin call for
thorough flushing with water. Laboratories should have eyewash and
shower stations. For field work, carry a portable eyewash unit.
Laboratories should also have appropriate fire extinguishers and
fume hoods.
General Safety Rules
Follow these rules to make work with toxic and hazardous
chemicals safer:
1. Never pipet by mouth. Always use a mechanical pipet or pipet bulb to
avoid ingesting chemicals.
2. Follow test procedures carefully and observe all precautionary
measures. Read the entire procedure carefully before beginning.
75
Page 76

SECTION III, continued
3. Wipe up all spills promptly. Get proper training and have the right
response equipment to clean up spills. See your safety director for
more information.
4. Do not smoke, eat, or drink in an area where toxic or irritating
chemicals are used.
5. Use reagents and equipment only as directed in the test procedure.
6. Do not use damaged labware and broken equipment.
7. Minimize all chemical exposures. Do not breathe vapors or let
chemicals touch your skin. Wash your hands after using chemicals.
8. Keep work areas neat and clean.
9. Do not block exits or emergency equipment.
OSHA Chemical Hygiene Plan
The Occupational Safety and Health Administration (OSHA) enforces
laws about the control exposure to hazardous chemicals in laboratories.
These regulations are in Title 29 CFR 1910.1450. They apply to all
employers who use hazardous chemicals. They require employers to
develop and use a written Chemical Hygiene Plan and appoint a qualified
person as the Chemical Hygiene Officer.
76
Page 77

SECTION IV PROCEDURES
77
Page 78

78
Page 79
Method 8012
ALUMINUM (0 to 0.80 mg/L) For water and wastewater
Aluminon Method*
522 nm
1. Enter the stored
program number for
aluminum (Al).
Press:
The display will show:
Note: The Pour-Thru Cell
can be used if rinsed well
with deionized water
between the blank and
prepared sample.
1 0 ENTER
Dial nm to 522
2. Rotate the
wavelength dial until the
small display shows:
522 nm
When the correct
wavelength is dialed in,
the display will quickly
show:
Zero Sample
then: mg/L Al
Note: Total aluminum
determination needs a
prior digestion; use any of
the three procedures given
in Digestion (Section II).
3+
3. Fill a 50-mL
graduated mixing
cylinder to the 50-mL
mark with sample.
Note: Rinse cylinder with
1:1 Hydrochloric Acid and
deionized water before use
to avoid errors due to
contaminants absorbed on
the glass.
Note: The sample
temperature must be
between 20-25 °C
(68-77 °F) for
accurate results.
4. Add the contents of
one Ascorbic Acid
Powder Pillow. Stopper.
Invert several times to
dissolve powder.
* Adapted from Standard Methods for the Examination of Water and Wastewater.
79
Page 80

ALUMINUM, continued
:30
5. Add the contents of
one AluVer 3 Aluminum
Reagent Powder Pillow.
Stopper. Invert
repeatedly for one
minute to dissolve.
Note: A red-orange color
develops if aluminum
is present.
Note: Inconsistent results
will be obtained if any
powder is undissolved.
9. Press:
SHIFT TIMER
A 15-minute reaction
period will begin.
When the timer beeps,
the display will show:
mg/L Al
3+
6. Pour 25 mL of
mixture into a 25-mL
sample cell (the
prepared sample).
10. Within five minutes
after the timer beeps,
place the blank into the
cell holder. Close the
light shield.
7. Add contents of one
Bleaching 3 Reagent
Powder Pillow to the
remaining 25 mL in the
mixing graduated
cylinder. Stopper.
Vigorously shake for
30 seconds.
Note: This solution should
turn a light to medium
orange upon bleaching. It
will not become colorless.
11. Press: ZERO
The display will show:
Zeroing. . . .
then: 0.00 mg/L Al
3+
8. Pour the remaining
25 mL of mixture in the
cylinder into a second
25-mL sample cell
(the blank).
12. Immediately place
the prepared sample into
the cell holder. Close
the light shield.
80
Page 81

ALUMINUM, continued
Press: READ
13.
The display will show:
Reading. . . .
then the result in
mg/L aluminum will be
displayed.
Note: Clean the graduated
cylinder and sample cells
with soap and brush
immediately following the
test.
Note: For most accurate
results, analyze a reagent
blank (deionized water)
and subtract the amount
determined on each lot of
reagents from the sample
reading.
Sampling and Storage
Collect samples in a clean glass or plastic container. Preserve the sample
by adjusting the pH to 2 or less with nitric acid (about 1.5 mL per liter).
Preserved samples can be stored up to six months at room temperature.
Before analysis, adjust the pH to 3.5–4.5 with 5.0 N Sodium Hydroxide.
Correct the test result for volume additions; see Correcting for Volume
Additions in Section I for more information.
81
Page 82

ALUMINUM, continued
Accuracy Check
Standard Additions Method
a) Snap the neck off an Aluminum Voluette Ampule Standard
Solution, 50 mg/L as Al.
b) Use the TenSette Pipet to add 0.1 mL, 0.2 mL, and 0.3
mLof standard, respectively, to three fresh 50-mL samples.
Mix each thoroughly.
c) Analyze each sample as described above. The aluminum
concentration should increase 0.1 mg/L for each 0.1 mL of
standard added.
d) If these increases do not occur, see Standard Additions (Section I)
for more information.
Standard Solution Method
Prepare a 0.4-mg/L aluminum standard solution by pipetting 1.00 mL
of Aluminum Standard Solution, 100 mg/L as Al
volumetric flask. Dilute to the mark with deionized water. Prepare this
solution immediately before use. Perform the aluminum procedure as
described above. The mg/L Al reading in Step 13 should be 0.4 mg/L Al.
3+
, into a 250-mL
Precision
Or, using the TenSette Pipet, add 0.8 mL of solution from an Aluminum
Voluette Ampule Standard Solution (50 mg/L as Al) into a 100-mL
volumetric flask. Dilute to volume with deionized water. Prepare this
standard immediately before use.
In a single laboratory, using a standard solution of 0.2 mg/L Al and two
representative lots of reagent with the DR/2010, a single operator
obtained a standard deviation of ±0.016 mg/L Al
3+
.
82
Page 83

ALUMINUM, continued
Interferences
The following do not interfere up to the indicated concentrations.
Alkalinity 1000 mg/L as CaCO
Iron 20 mg/L
Phosphate 50 mg/L
3
Interferences from higher alkalinity concentrations can be eliminated by
the following pretreatment:
a) Add one drop of m-Nitrophenol Indicator Solution to the sample
taken in Step 3. A yellow color indicates excessive alkalinity.
b) Add one drop of 5.25 N Sulfuric Acid Standard Solution.
Stopper the cylinder. Invert to mix. If the yellow color persists,
repeat until the sample changes to colorless. Continue with
the test.
Polyphosphate causes a negative interference at all levels and must
be absent. Before testing, polyphosphate must be converted to
orthophosphate by acid hydrolysis as described under the
phosphorus procedures.
Acidity interferes at greater than 300 mg/L as CaCO
greater than 300 mg/L acidity as CaCO
must be treated as follows:
3
. Samples with
3
a) Add one drop of m-Nitrophenol Indicator Solution to the sample
taken in Step 3.
b) Add one drop of 5.0 N Sodium Hydroxide Standard Solution.
Stopper the cylinder. Invert to mix. Repeat as often as necessary
until the color changes from colorless to yellow.
c) Add one drop of Sulfuric Acid Standard Solution, 5.25 N, to
change the solution from yellow back to colorless. Continue with
the test.
Calcium does not interfere.
Fluoride interferes at all levels by complexing with aluminum. The
actual aluminum concentration can be determined using the Fluoride
Interference Graph when the fluoride concentration is known. To use the
fluoride interference graph:
83
Page 84

ALUMINUM, continued
1. Select the vertical grid line along the top of the graph that represents
the aluminum reading obtained in Step 13.
2. Locate the point of the vertical line (DR/2010 reading) where it
intersects with the horizontal grid line that indicates how much
fluoride is present in the sample.
3. Extrapolate the true aluminum concentration by following the
curved lines on either side of the intersect point down to the true
aluminum concentration.
For example, if the aluminum test result was 0.7 mg/L Al
fluoride present in the sample was 1.0 mg/L F
grid line intersects with the 1.0 mg/L F
and 1.3 mg/L Al curves. In this case, the true aluminum content would be
1.27 mg/L.
Fluoride Interference Graph
-
-
grid line falls between the 1.2
mg/L Al3+ (Reading from DR/2010)
, the point where the 0.7
3+
and the
mg/L
Summary of Method
Aluminon indicator combines with aluminum in the sample to form a
red-orange color. The intensity of color is proportional to the aluminum
concentration. Ascorbic acid is added to remove iron interference. The
AluVer 3 Aluminum Reagent, packaged in powder form shows
exceptional stability and is applicable for fresh water samples.
True Aluminum concentration (mg/L Al3+)
84
Page 85

ALUMINUM, continued
REQUIRED REAGENTS
Cat. No.
Aluminum Reagent Set (100 Tests) ..............................................................................22420-00
Includes: (4) 14290-99, (1) 14577-99, (1) 14294-49
Description Per Test Unit Cat. No.
AluVer 3 Aluminum Reagent Powder Pillow ......... 1 pillow............ 100/pkg..............14290-99
Ascorbic Acid Powder Pillow ................................. 1 pillow............ 100/pkg..............14577-99
Bleaching 3 Reagent Powder Pillow ....................... 1 pillow............ 100/pkg..............14294-49
REQUIRED APPARATUS
Cylinders, graduated mixing, 50 mL.................................. 1.................. each................1896-41
Sample Cell, 25 mL, matched pair..................................... 2 ................... pair..............20950-00
OPTIONAL REAGENTS
Aluminum Standard Solution, 100 mg/L...........................................100 mL..............14174-42
Aluminum Standard Solution, Voluette ampule,
50 mg/L as Al, 10 mL...................................................................... 16/pkg..............14792-10
Hydrochloric Acid Solution, 6N (1:1)................................................500 mL..................884-49
m-Nitrophenol Indicator Solution, 10 g/L..........................................100 mL................2476-32
Nitric Acid, ACS ................................................................................500 mL..................152-49
Nitric Acid Solution, 1:1.................................................................... 500 mL................2540-49
Sodium Hydroxide Standard Solution, 5.0 N...........................100 mL MDB................2450-32
Sodium Hydroxide Standard Solution, 5.0 N.............................50 mL MDB................2450-26
Sulfuric Acid Standard Solution, 5.25 N..................................100 mL MDB................2449-32
Water, deionized........................................................................................ 4 L..................272-56
Quantity Required
OPTIONAL APPARATUS
Ampule Breaker Kit ................................................................................ each..............21968-00
Brush ....................................................................................................... each..................690-00
Flask, volumetric, 100 mL ......................................................................each..................547-42
Flask, volumetric, 250 mL ......................................................................each..................547-46
Fluoride Combination Electrode ............................................................. each..............50265-00
pH Indicator Paper, 1 to 11 pH...................................................... 5 rolls/pkg..................391-33
pH Meter, sens
ion™1, portable............................................................. each..............51700-10
Pipet, TenSette, 0.1 to 1.0 mL ................................................................. each ..............19700-01
Pipet Tips, for 19700-01 TenSette Pipet ............................................. 50/pkg..............21856-96
Pour-Thru Cell Assembly Kit .................................................................each ..............45215-00
Thermometer, -20 to 105 °C....................................................................each................1877-01
For technical support and ordering information, see Section V.
In the U.S.A. call 800-227-4224 to place an order.
Outside the U.S.A.—Contact the Hach office or distributor serving you.
85
Page 86

86
Page 87

Method 8326
ALUMINUM (0 to 0.220 mg/L) For water
Eriochrome Cyanine R Method*
535 nm
1. Enter the stored
program number for
aluminum (Al),
Eriochrome Cyanine R
(ECR) method.
Press:
9 ENTER
The display will show:
Dial nm to 535
Note: The Pour-Thru Cell
cannot be used.
5. Add the contents of
one ECR Reagent
Powder Pillow. Stopper.
Invert several times to
dissolve powder, then
wait 30 seconds.
2. Rotate the
wavelength dial until the
small display shows:
535 nm
When the correct
wavelength is dialed in,
the display will quickly
show:
Zero Sample
then: mg/L Al ECR
6. Add the contents of
one Hexamethylenetetramine Buffer
Reagent Powder Pillow.
Stopper. Invert several
times to dissolve
powder.
Note: An orange to purple
color develops if aluminum
is present.
3. Insert the 10-mL Cell
Riser into the cell
compartment
7. Put 1 drop of ECR
Masking Reagent
Solution into a 10-mL
sample cell.
4. Fill a 25-mL
graduated mixing
cylinder to the 20-mL
mark with sample.
Note: Rinse cylinder with
1:1 hydrochloric acid and
deionized water before use
to avoid errors.
Note: The sample
temperature must be
20-25 °C (68-77 °F).
8. Pour 10 mL from
the mixing graduated
cylinder into the 10-mL
sample cell. Swirl to mix
(the blank.)
Note: The solution will
start to turn yellow.
* Adapted from Standard Methods for the Examination of Water and Wastewater.
87
Page 88

ALUMINUM, continued
9. Pour the remaining
10 mL of mixture into a
second 10-mL sample
cell to make the
prepared sample.
13. Immediately place
the prepared sample into
the cell holder. Close the
light shield.
10. Press:
SHIFT TIMER
A 5-minute reaction
period will begin.
When the timer beeps,
the display will show:
mg/L Al ECR
14. Press: READ
The display will show:
Reading. . . .
11. Within five minutes
after the timer beeps,
place the blank into the
cell holder. Close the
light shield.
12. Press: ZERO
The display will show:
Zeroing. . . .
then:
0.000 mg/L Al ECR
then the result in mg/L
aluminum will be
displayed.
Note: If fluoride (F-) is
present, it needs to be
measured and the actual
value determined
(see Table 2).
88
Page 89

ALUMINUM, continued
Sampling and Storage
Collect samples in a clean glass or plastic container. Preserve samples by
adjusting the pH to 2 or less with nitric acid (about 1.5 mL per liter).
Preserved samples can be stored up to six months at room temperature.
Before analysis, adjust the pH to 2.9 to 4.9 with 12.0 N Potassium
Hydroxide Standard Solution and/or 1 N Potassium Hydroxide Solution.
Correct the test result for volume additions; see Corrections for Volume
Additions in Section I.
Accuracy Check
Standard Solution Method
Prepare a 0.100 mg/L aluminum standard solution by pipetting 1.00 mL
of Aluminum Standard Solution, 100 mg/L as Al
volumetric flask. Dilute to the mark with deionized water. Prepare this
solution daily. Perform the aluminum procedure as described above. The
mg/L Al should be 0.10 mg/L Al.
Or, using the TenSette pipet, add 0.2 mL of solution from an Aluminum
Voluette Ampule Standard Solution (50 mg/L as Al) into a 100-mL
volumetric flask. Dilute to volume with deionized water. Perform the
aluminum procedure as described above. The mg/L Al reading should be
0.10 mg/L.
3+
, into a 1000-mL
Method Performance
Precision
In a single laboratory, using a standard solution of 0.100 mg/L Al and two
representative lots of reagent with the DR/2010, a single operator
obtained a standard deviation of ±0.004 mg/L Al.
Interferences
Table 1 lists common interferences and the amount of interference that
can be expected.
A sample pH between about 4.9 and 7.5 causes dissolved aluminum to
partially convert to colloidal and insoluble forms. This method measures
much of that hard-to-detect aluminum without any pH adjustment as is
necessary in some other methods.
Polyphosphate interference can be reduced by converting polyphosphate
to orthophosphate by the following steps:
a) Rinse a 50-mL mixing graduated cylinder and a 125-mL
erlenmeyer flask containing a magnetic stir bar with 6 N
89
Page 90

ALUMINUM, continued
Hydrochloric Acid. Rinse again with deionized water. These
rinses will remove any aluminum present.
Table 1 Interferences
Substance Concentration Error
Acidity 0-62 mg/L as CaCO
Alkalinity 0-750 mg/L as CaCO
Ca
Cr
Cu
Fe
Fe
Cl
2+
-
6+
2+
2+
3+
-
F
0-1000 mg/L as CaCO
0-1000 mg/L 0%
0.2 mg/L -5% of reading
2 mg/L -5% of reading
0-4 mg/L + mg/L Fe2+ X 0.0075
0-4 mg/L + mg/L Fe3+ X 0.0075
see Table 2
Hexametaphosphate 0.1 mg/L as PO
Mg
Mn
NO
NO
2+
2+
2-
3-
0-1000 mg/L as CaCO
0-10 mg/L 0%
0-5 mg/L 0%
0-20 mg/L 0%
3
3
3
3-
4
3
pH 2.9-4.9 0%
7.5-11.5 0%
3-
(ortho) 4 mg/L -5% of reading
PO
4
SO
Zn
2-
4
2+
0-1000 mg/L 0%
0-10 mg/L 0%
0%
0%
0%
-5% of reading
0%
Note: Rinse two erlenmeyer flasks if a reagent blank is used;
seeStepbbelow.
b) Measure 50 mL of deionized water into the 125-mL erlenmeyer
flask using the graduated cylinder. This is the reagent blank.
Because of the test sensitivity, this step must be done only when
any of the reagents used in the following pretreatment are
replaced even if the new reagent has a matching lot number.
When the pretreated sample has been analyzed, subtract the
aluminum concentration of the reagent blank from the
sample results.
c) Measure 50 mL of sample into the 125-mL erlenmeyer flask
using the graduated cylinder. Use a small amount of deionized
water to rinse the cylinder contents into the flask.
90
Page 91

ALUMINUM, continued
d) Add 4.0 mL of 5.25 N Sulfuric Acid Solution.
e) Use a combination hot plate/stirrer to stir and boil the sample for
at least 30 minutes. Add deionized water as needed to maintain a
sample volume of 20-40 mL. Do not boil dry.
f) Cool the solution to near room temperature.
g) Add 2 drops of Bromphenol Blue Indicator Solution.
h) Add 1.5 mL of 12.0 N Potassium Hydroxide Standard Solution
using the calibrated, plastic dropper provided. Swirl to mix. The
solution color should be yellow or green but not purple. If the
color is purple, begin with Step a again using an additional 1 mL
of Sulfuric Acid Solution in Step d.
i) While swirling the flask, add 1.0 N Potassium Hydroxide
Solution, a drop at a time, until the solution turns a dirty green
color.
j) Pour the solution into the 50-mL graduated cylinder. Rinse the
flask contents into the graduated cylinder with deionized water to
bring the total volume to 50 mL.
Fluoride interference can be corrected by using Table 2.
An Example: If the fluoride concentration is known to be 1.00 mg/L F
and the ECR method gives a DR/2010 reading of 0.060 mg/L aluminum,
what is the true mg/L aluminum concentration?
Answer: 0.183 mg/L
Intermediate values can be found by interpolation. Do not use correction
graphs or charts found in other publications.
Summary of Method
Eriochrome cyanine R combines with aluminum in a sample to produce
an orange-red color. The intensity of color is proportional to the
aluminum concentration.
k) Use 20 mL this solution in Step 3 of the ECR method.
91
-
Page 92

ALUMINUM, continued
Table 2 True aluminum concentration (mg/L) vs. DR/2010 reading (mg/L) and fluoride
concentration (mg/L) when the Eriochrome cyanine R method is used.
Fluoride Concentration (mg/L)
DR/2010
Reading
(mg/L)
0.000 0.000 0.000 0.000 0.000 0.000 0.000 0.000 0.000 0.000 0.000 0.000
0.010 0.010 0.019 0.030 0.040 0.052 0.068 0.081 0.094 0.105 0.117 0.131
0.020 0.020 0.032 0.046 0.061 0.077 0.099 0.117 0.137 0.152 0.173 0.193
0.030 0.030 0.045 0.061 0.077 0.098 0.124 0.146 0.166 0.188 0.214 0.243
0.040 0.040 0.058 0.076 0.093 0.120 0.147 0.174 0.192 0.222
0.050 0.050 0.068 0.087 0.109 0.135 0.165 0.188 0.217
0.060 0.060 0.079 0.100 0.123 0.153 0.183 0.210 0.241
0.070 0.070 0.090 0.113 0.137 0.168 0.201 0.230
0.080 0.080 0.102 0.125 0.152 0.184 0.219
0.090 0.090 0.113 0.138 0.166 0.200 0.237
0.100 0.100 0.124 0.150 0.180 0.215
0.120 0.120 0.146 0.176 0.209 0.246
0.140 0.140 0.169 0.201 0.238
0.160 0.160 0.191 0.226
0.180 0.180 0.213
0.200 0.200 0.235
0.220 0.220
0.240 0.240
0.00 0.20 0.40 0.60 0.80 1.00 1.20 1.40 1.60 1.80 2.00
True Aluminum Concentration (mg/L) Al
REQUIRED REAGENTS
Cat No.
Aluminum Reagent Set (100 tests)............................................................................... 26037-00
Includes: (1) 26038-49, (2) 26039-46, (1) 23801-23
Description Per Test Unit Cat. No.
Quantity Required
ECR Reagent Powder ..............................................1 pillow ............100/pkg ............. 26038-49
Hexamethylenetetramine Buffer Reagent ...............1 pillow ............100/pkg ............. 26039-99
ECR Masking Reagent Solution............................... 1 drop .............. 25 mL ............. 23801-23
REQUIRED APPARATUS
Cell Riser, 10 mL sample cell.............................................1 ..................each .............45282-00
Cylinder, 25 mL, mixing graduated ....................................1 ..................each .............20886-40
Sample Cell, with 10-mL mark, matched pair....................2 ...................pair ............. 24954-02
92
Page 93

ALUMINUM, continued
OPTIONAL REAGENTS
Description Unit Cat. No.
Aluminum Standard Solution, 100 mg/L...........................................100 mL..............14174-42
Aluminum Standard Solution, Voluette ampule,
50 mg/L as Al, 10 mL...................................................................... 16/pkg..............14792-10
Bromphenol Blue Indicator Solution .......................................100 mL MDB..............14552-32
Hydrochloric Acid Solution, 6 N (1:1)...............................................500 mL..................884-49
Nitric Acid, ACS ................................................................................500 mL..................152-49
Nitric Acid Solution, 1:1.................................................................... 500 mL................2540-49
Potassium Hydroxide Solution, 1 N ......................................... 50 mL SCDB..............23144-26
Potassium Hydroxide Standard Solution, 12.0 N...............................100 mL..................230-32
Potassium Hydroxide Standard Solution, 12.0 N...............................500 mL..................230-49
SPADNS Fluoride Reagent AccuVac Ampules .................................. 25/pkg..............25060-25
Sulfuric Acid Standard Solution, 5.25 N .................................100 mL MDB................2449-32
Water, deionized........................................................................................ 4 L..................272-56
OPTIONAL APPARATUS
Ampule Breaker Kit ................................................................................ each..............21968-00
Brush ....................................................................................................... each..................690-00
Cylinder, graduated, mixing, 50 mL ....................................................... each................1896-41
Flask, erlenmeyer, glass, 125 mL............................................................each..................505-43
Flask, volumetric, 100 mL ......................................................................each..............14574-42
Flask, volumetric, 1000 mL ....................................................................each..............14574-53
Fluoride Combination Electrode ............................................................. each..............50265-00
Hot Plate, Stirrer, 120 V ..........................................................................each..............23442-00
Hot Plate, Stirrer, 240 V ..........................................................................each..............23442-02
Pad, cooling, 4" x 4"................................................................................ each..............18376-00
pH Indicator Paper, 1 to 11 pH...................................................... 5 rolls/pkg..................391-33
pH Meter, sens
Pipet Filler, safety bulb............................................................................ each ..............14651-00
Pipet, serological, 2 mL........................................................................... each ..................532-36
Pipet, TenSette, 0.1 to 1.0 mL ................................................................. each ..............19700-01
Pipet Tips, for 19700-01 TenSette Pipet ............................................. 50/pkg..............21856-96
Pipet, volumetric, Class A, 1.00 mL ....................................................... each ..............14515-35
Pipet, volumetric, Class A, 4.00 mL ....................................................... each ..............14515-04
Stir Bar, Octagonal, 25.4 x 7.9 mm......................................................... each..............20953-52
Thermometer, -20 to 105 °C....................................................................each................1877-01
ion™1, portable............................................................. each..............51700-10
For technical support and ordering information, see Section V.
In the U.S.A. call 800-227-4224 to place an order.
Outside the U.S.A.—Contact the Hach office or distributor serving you.
93
Page 94

94
Page 95
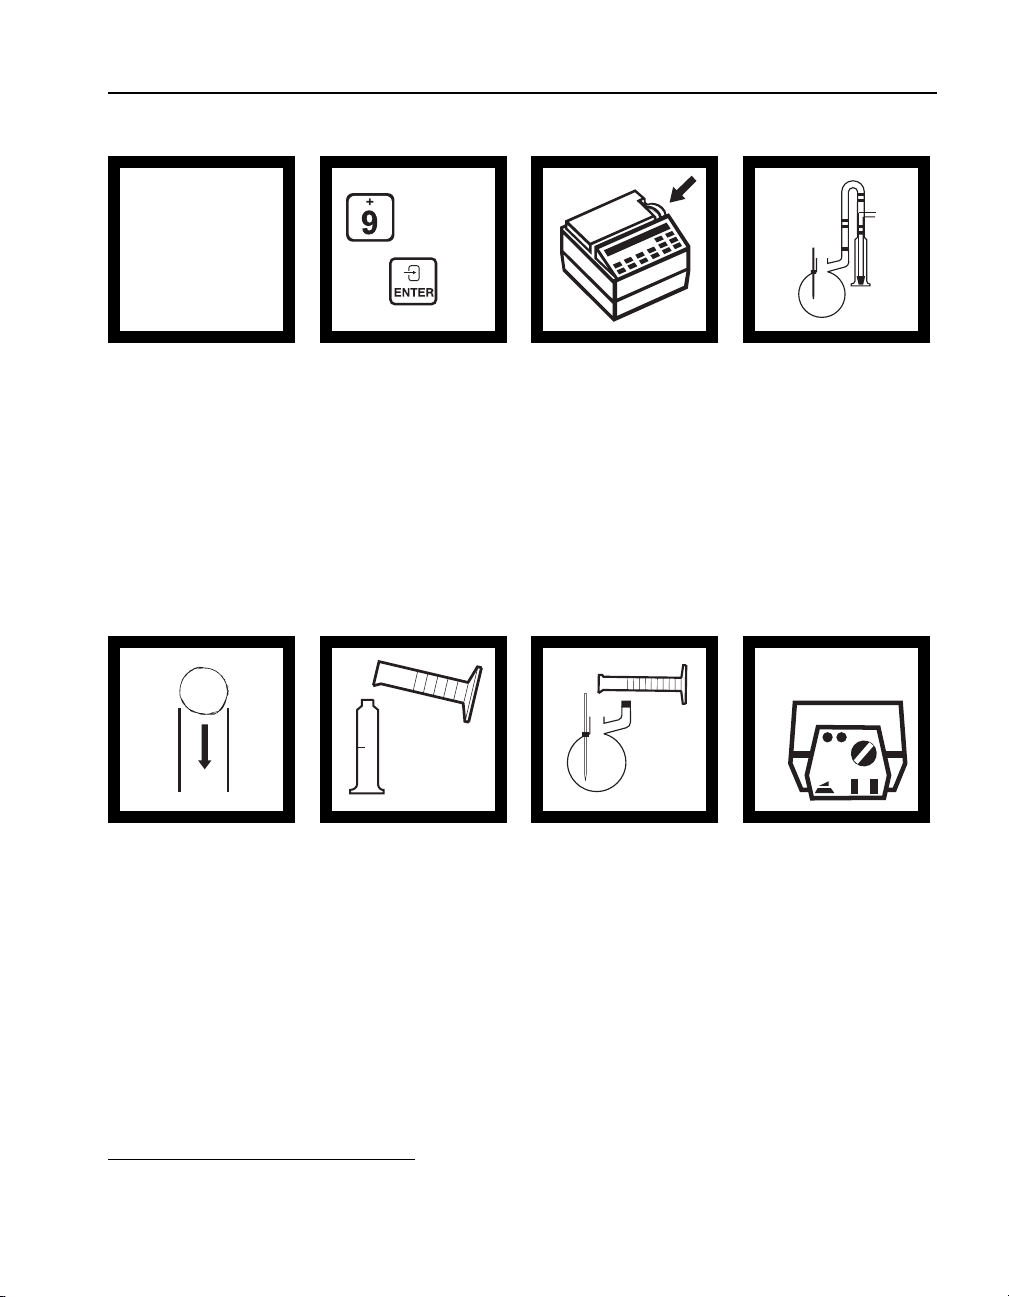
Method 8013
ARSENIC (0 to 0.200 mg/L) For water, wastewater, and seawater
Silver Diethyldithiocarbamate Method*
USEPA accepted for reporting (distillation required)**
520 nm
User
Calibration
1. This procedure
requires a user-entered
calibration before
sample measurement.
See the steps in the User
Calibration section to set
up and calibrate a
program for arsenic.
? ?
2. Enter the user stored
program number for
arsenic (As).
9 ? ? ENTER
Press:
The display will show:
Dial to 520 nm
Note: The Pour-Thru Cell
cannot be used.
3. Rotate the
wavelength dial until the
small display shows:
520 nm
When the correct
wavelength is dialed in
the display will quickly
show: Zero Sample
then: mg/L As
4. Prepare the Hach
distillation apparatus for
arsenic recovery. Place it
under a fume hood to
vent toxic fumes.
Note: See the Hach
Distillation Manual for
assembly instructions.
Stir control: 5
Heat control: 0
5. Dampen a cotton ball
with 10% Lead Acetate
Solution. Place it in the
gas scrubber. Be certain
the cotton seals against
the glass.
* Adapted from Standard Methods for the Examination of Water and Wastewater.
** Equivalent to USEPA method 206.4 for wastewater and Standard Method 3500-As for drinking water.
6. Measure 25 mL
of prepared arsenic
absorber solution into
the cylinder/gas bubbler
assembly with a
graduated cylinder.
Attach it to the
distillation apparatus.
Note: Prepare the arsenic
absorber solution as
directed under Reagent
Preparation below.
7. Measure 250 mL
of sample into the
distillation flask using a
graduated cylinder.
8. Turn on the power
switch. Set the stir
control to 5. Set the heat
control to 0.
95
Page 96

ARSENIC, continued
9. Measure 25 mL of
hydrochloric acid, ACS,
into the flask using a
graduated cylinder.
13. When the timer
beeps, add 6.0 g of 20mesh zinc to the flask.
Cap immediately.
10. Measure 1 mL of
Stannous Chloride
Solution into the flask.
Note: Use a serological
pipet to measure the
solution.
Heat control: 3
14. Set the heat control
to 3.
Press:
SHIFT TIMER
A second 15-minute
reaction period will
begin.
11. Add 3 mL of
Potassium Iodide
Solution to the flask.
Cap.
Note: Use a serological
pipet to measure the
solution.
Heat control: 1
15. When the timer
beeps, set the heat
control to 1.
SHIFT TIMER
Press:
A third 15-minute reaction period will begin.
12. Press: SHIFT TIMER
A 15-minute reaction
period will begin.
Heat control: 0
16. When the timer
beeps, the display will
show: mg/L As
Turn off the heater.
Remove the cylinder/gas
bubbler assembly as
a unit.
96
Page 97

ARSENIC, continued
17. Rinse the gas
bubbler by moving it up
and down in the arsenic
absorber solution.
21. Pour the reacted
arsenic absorber solution
into a sample cell (the
prepared sample).
Stopper.
Note: If the solution
volume is less than 25 mL,
add pyridine to bring the
volume to exactly the
25-mL mark. Swirl to mix.
18. Fill a dry sample
cell with unreacted
arsenic absorber solution
(the blank). Stopper.
Place it into the cell
holder.
22. Place the prepared
sample into the cell
holder. Close the light
shield.
19. Place the blank
into the cell holder.
Close the light shield.
23. Press: READ
The display will show:
Reading. . .
then the result in
mg/L arsenic (As) will
be displayed.
20. Press: ZERO
The display will show:
Zeroing. . .
then: 0.000 mg/L As
97
Page 98

ARSENIC, continued
Sampling and Storage
Collect samples in acid washed glass or plastic bottles. Adjust the pH to 2
or less with sulfuric acid (about 2 mL per liter). Preserved samples may be
stored up to six months at room temperature. Correct the test result for
volume additions; see Correction for Volume Additions in Section I.
Reagent Preparation
Prepare the arsenic absorber solution as follows:
1. Weigh 1.00 g of silver diethyldithiocarbamate on an
analytical balance.
2. Transfer the powder to a 200-mL volumetric flask. Dilute to volume
with pyridine. (Use pyridine only in a fume hood.)
3. Mix well to dissolve. Store the reagent, tightly sealed, in an amber
bottle. The reagent is stable for one month if stored in this manner.
Larger volumes of reagent can be prepared if the reagent is used
within one month.
User Calibration
Standard Preparation
a) Prepare a 10.0-mg/L arsenic working standard by pipetting
1.00 mL of Arsenic Standard Solution, 1000 mg/L As, into a
100-mL volumetric flask. Dilute to volume with deionized water.
b) Prepare standards of 0.04, 0.08, 0.12, and 0.16 mg/L arsenic by
diluting 1.0, 2.0, 3.0, and 4.0 mL, respectively, of the working
standard into four 250-mL volumetric flasks. Dilute to volume
with deionized water.
Initial Setup of Arsenic Program
A one-time setup of a program for arsenic is required. An arsenic program
template is pre-programmed into memory to make the process easier.
After the setup is complete, the calibration can be entered for each new
lot of reagents used or as necessary.
Note: The templates within User Program cannot be run directly. They
must be copied into a usable program number (greater than 950) as in
ste c and d. Then, calibrate the program.
a) Press SHIFT USER PRGM. Use the UP arrow key to scroll to
Copy Program. Press ENTER.
98
Page 99

ARSENIC, continued
b) Scroll to or enter the template number for arsenic (900).
c) Scroll to or enter the desired user program number for arsenic
ENTER.
Press
(>950). Press
ENTER. Record the program number for reference.
d) The display will show:
e) Press EXIT. The program is now ready to be calibrated.
User Calibration of Arsenic Program
a) Use the test procedure to develop color in the standards just
before recording the absorbance values for the calibration.
b) Press
SHIFT USER PRGM. Use the UP arrow to scroll to Edit
Program
. Press ENTER.
c) Scroll to or enter the program number for arsenic (from step c in
Setup). Press
d) Use the
DOWN arrow to scroll down to Calib Table:X (X= denotes
a number which indicates the number of data points in the table).
ENTER.
Press
e) The instrument will prompt
(unreacted arsenic absorber) in the cell holder. Close the light
shield. Press
the proper wavelength if necessary.
f) The first concentration point will be displayed. Press
display the stored absorbance value of the first
concentration point.
Program Copied.
ENTER.
Zero Sample. Place the blank solution
ZERO. The instrument will prompt you to adjust to
ENTER to
g) Place the first developed standard solution (same concentration
as the value displayed) in the cell holder. Close the light shield.
READ to display the measured absorbance of the standard.
Press
ENTER to accept the displayed absorbance value.
Press
h) The second concentration point will be displayed. Press
ENTER to
display the stored absorbance value of the second concentration
point. Place the second developed standard solution in the cell
holder. Close the light shield. Press
READ to display the measured
absorbance value of the standard.
i) Press
ENTER to accept the absorbance reading. The next
concentration point will then be displayed.
99
Page 100

ARSENIC, continued
j) Repeat steps h and i as necessary for the remaining standards.
k) When you are finished reading the absorbance values of the
l) Scroll down to Calib Formula. Press ENTER twice or until only
Note: Other calibration fits may be used if appropriate.
m) Press EXIT twice. The display will show Store Changes? Press
standards, press
change the setting. Change to
ENTER.
press
0 in F(0) is flashing. Press DOWN arrow to select F1 (linear
the
calibration). Press
ENTER to confirm.
EXIT. Scroll down to Force Zero. Press ENTER to
ON by pressing the arrow key, then
ENTER to select F1.
Interferences
Antimony salts may interfere with color development.
Summary of Method
Arsenic is reduced to arsine gas by a mixture of zinc, stannous chloride,
potassium iodide and hydrochloric acid in a specially equipped
distillation apparatus. The arsine is passed through a scrubber containing
cotton saturated with lead acetate and then into an absorber tube
containing silver diethyldithiocarbamate in pyridine. The arsenic reacts
to form a red complex which is read colorimetrically. This procedure
requires a manual calibration.
n) Press
EXIT. The program is now calibrated and ready for use. Start
on step 2 of the iconed procedure.
100
 Loading...