

Page 1
Operator Quick Guide
ORBISPHERE 3650 ATEX
Revision D - 18/03/2008
Page 2
Operating Information
About this Guide
The information in this guide has been carefully
checked and is believed to be accurate. However,
Hach Ultra assumes no responsibility for any
inaccuracies that may be contained in this guide.
In no event will Hach Ultra be liable for direct,
indirect, special, incidental, or consequential
damages resulting from any defect or omission in
this guide, even if advised of the possibility of
such damages. In the interest of continued
product development, Hach Ultra reserves the
right to make improvements in this guide and the
products it describes at any time, without notice or
obligation.
Before Taking Measurements
IMPORTANT: Before taking any measurements,
please ensure that the conditions of use
correspond to the certification of the instrument
and the installation was performed as described
in the Operator’s Manual.
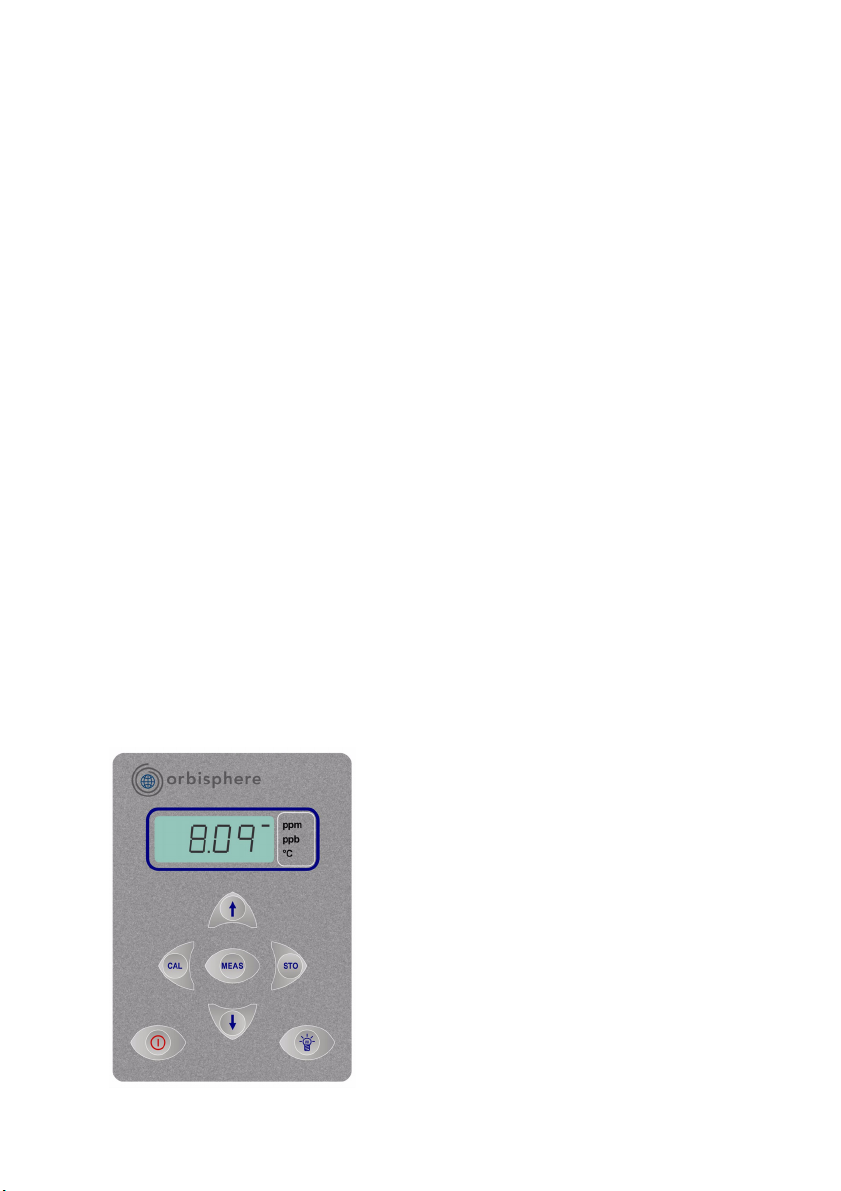
Instrument Controls
The front panel of the instrument has a three-digit
liquid crystal display (LCD).
The LCD includes a right-side marker to
distinguish between gas concentration and
temperature display. This marker also indicates
the measurement display units (ppm, ppb, or %)
depending on the instrument model.
To the LCD's right is a label showing the
measurement units configured at the factory for
your application.
In addition to the controls indicated on the front
panel, there is also a pressure relief valve switch
on top of the instrument to enable atmospheric
pressure equilibrium for sensor calibration, or for
measurements in gaseous samples in % units.
The button in the bottom right corner backlights
the LCD for approximately three minutes. The
other push-button controls are:
• POWER turns instrument power on or
off. The instrument starts in
measurement mode
• MEAS places the instrument in
measurement mode
• CAL calibrates the analyzer against a
reference sample. This button can be
locked out from the WinLog97 PC
program
• STO stores a measurement value into
memory
• The × Ø keys toggle between gas
concentration and temperature
measurement displays in measurement
mode, increases or decreases the
storage number during storage or
memory view, or sets a calibration value
during calibration
• POWER + CAL sensor calibration
• POWER + STO starts automatic data
acquisition.
• POWER + × starts memory storage view
Page 2
Startup
To start the instrument, press the keyboard
POWER switch. When you turn power on, the
instrument displays its model number briefly, and
then starts in measurement mode.
The instrument can be operated independently,
making measurements as a portable analyzer.
You may store these measurement values for
later analysis via the WinLog97 program (on your
personal computer) or the memory view mode (on
the instrument).
Page 3
Measurement
Taking Measurements
Connect the top-mounted inlet to accept your
sample, typically this is accomplished by
connection to a sampling valve. The sample flow
can be regulated by the knurled stainless steel
knob on top of the flow chamber.
The LCD includes a right-side marker to
distinguish between gas concentration
measurements and temperature. To switch
between gas measurement and temperature
measurement, press the × Ø buttons. To
backlight the LCD for approximately three
minutes, press the Backlight button.
The analyzer will store up to 500 gas
measurement values, labeled by numbers 0
through 499, along with the current date and time
of each measurement. You have the choice of
acquiring this information manually or
automatically, as described below.
Automatic Data Acquisition
Before starting automatic measurement storage,
first select the sampling rate desired using the
Sampling Rate menu of the WinLog97 program.
Gas concentration measurements are displayed
for about two minutes. After two minutes the
instrument displays the sample number (starting
at 000), then the gas concentration measurement
value followed by [---] to indicate the
measurement is being stored.
This storage sequence repeats automatically, at
the rate specified.
To end automatic storage, switch the instrument
OFF (by pressing the POWER key) while it is in
normal measurement mode. Switching ON again
without holding down the STO button returns the
instrument to measurement mode.
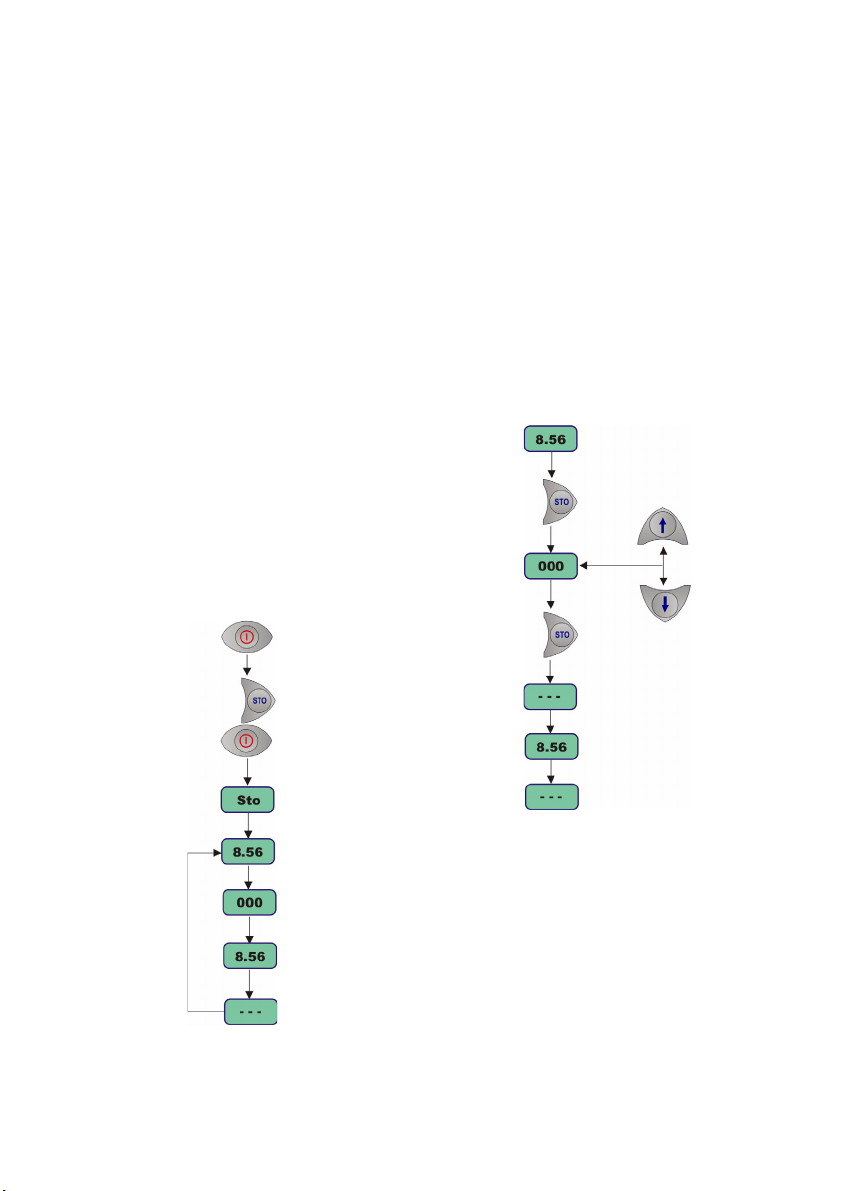
Manual Data Acquisition
Switch the instrument OFF (by pressing the
POWER key). Then hold down the STO button
while switching the instrument back ON. The LCD
displays the message Sto for about one second.
For the first measurement you wish to store, press
the STO button once to display a sample number.
The default sample number is 000 (for first time
access), or the last used memory position where
data was stored, incremented by a value of 1.
You can increase or decrease this number by
pressing the × Ø buttons within three seconds.
Press STO a second time, within five seconds of
the first. The instrument then displays the gas
concentration measurement value for about three
seconds, followed by a clearing message as the
value is stored.
Repeat the above steps to store additional
measurements.
Page 3
Page 4
Measurement (cont)
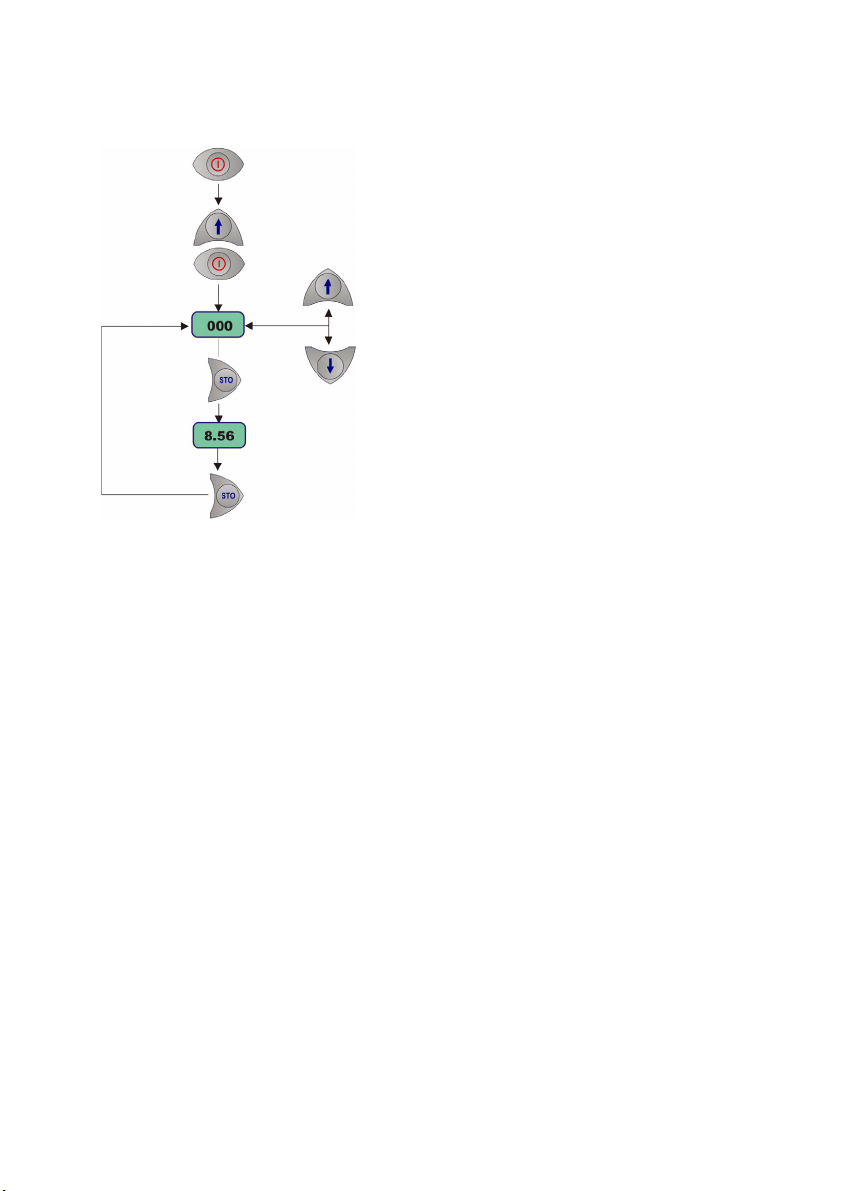
Viewing Stored Measurements
Switch the instrument OFF (by pressing the
POWER key). Hold down the × button while
switching the instrument back ON. The LCD
displays a sample location number.
Scroll through the numbered sample locations of
all the stored values using the × Ø buttons.
To view the actual gas concentration
measurement value at a particular sample
number, press the STO button. The LCD now
displays the stored value for that sample number.
Press STO a second time to return to the next
numbered location display, to continue scrolling
or view another stored value.
To return to the measurement mode, switch the
instrument OFF and then back ON again without
holding down any additional buttons.
Downloading Data
If you have made measurements and stored them
in the instrument, you should be ready to bring
them into the WinLog97 program for viewing,
copying, saving and printing. To download stored
data from the instrument to the PC, choose the
DownLoad data command from the Logger
menu.
The window displays the stored measurements
from the instrument showing the sample number,
gas concentration, a date and time stamp, and a
sample description.
Sample Description
For help in identifying the locations of various
sampling points that are stored by the analyzer,
you may choose the Sampling Point
Description command from the Logger menu.
The measurement values to be placed in
positions 0 through 499 can be described
however you wish. Double-click on a particular
position (or click Modify), then type a description
in the box.
Copy Data
To copy the results to the Windows Clipboard, so
that the data can be pasted into a spreadsheet,
word processor or other Windows program that
accepts tabular text information, choose the
Clipboard command from the Export menu.
Save Data
To save this list of measurements as a text file,
capable of being recalled by the WinLog97
program or imported as a file into other Windows
programs, choose the Save As command from
the File menu and enter the device and file name.
Print Data
To place this list of measurements into a tabular
format and send it to the printer, choose the Print
command from the File menu.
Clear Data
To clear all the values stored in the instrument,
choose the Clear Data command from the
Logger menu. Since this action will clear the
storage memory of the instrument, a warning
appears which you must confirm. Choose Clear
to start the memory clear operation.
Page 4
Page 5

Measurement (cont)
Timebase Updating Rate Max.
Samples
30 Seconds/Division 5 Secs/Sample 60
1 Minute/Division 5 Secs/Sample 120
10 Minutes/Division 5 Secs/Sample 1,200
30 Minutes/Division 9 Secs/Sample 2,000
1 Hour/Division 18 Secs/Sample 2,000
2.5 Hours/Division 45 Secs/Sample 2,000
Monitor Measurements in Real-Time
You may wish to analyze a particular sampling point via the WinLog97 program's Monitoring menu. To
use this Monitoring chart, the instrument must be connected to your PC.
Choose Monitoring from
the WinLog97 menu to
bring up a chart display.
The chart shows the gas concentration (in blue), temperature (in red), and pressure (in green) as the sample is being measured by the instrument. The chart is updated directly from instrument measurements, at a rate determined by the time scale set in the TIMEBASE box at the lower right corner of the chart.
Click the TIMEBASE up/
the time scale of the divisions of the chart. Each division mark along the baseline (1, 2, ...10) can be
made to represent from 30 seconds to 2½ hours, providing from 5 minutes to 25 hours of continuously
displayed samples (as illustrated in the table).
Click on the Continuous box to enable or
disable continuous charting. When this box is
checked, the chart scrolls continuously after
reaching the 10 division, and the oldest
samples are lost off the left of the chart.
When Continuous is not checked, the chart
stops displaying new results after reaching
the 10 division, and all subsequent
measurements are lost.
Click the up/down pointers for each
measurement variable (GAS,
TEMPERATURE and PRESSURE) to
change the scaling of that value on the chart. The display of each measurement variable may be turned
on or off by choosing the appropriate On or Off switch.
A running display of latest sample Gas, Temperature and Pressure is also shown in the bottom-right
corner of the chart.
Use the buttons at the bottom of the chart to control real-time monitoring. Choose Go to clear the chart
and start real-time monitoring, Stop to stop monitoring and Copy to copy the data from the chart as text
information to the Windows Clipboard. This information can be pasted from the clipboard into any
Windows application, such as a spreadsheet or word processor.
Choose Close to close the Monitoring window.
down pointers to change
Page 5
Page 6

Instrument Configuration
The following commands are all available from
the Configuration menu in the WinLog97
software installed on your PC.
The instrument must be connected to your PC in
order to change its configuration.
INSTRUMENT - PC CONNECTION
The Serial port menu lets you choose one of four
serial communication ports. Usually, COM1 is
used to connect to a mouse, so try COM2 first.
SETTING SAMPLING INTERVALS
The analyzer can perform as a standalone data
acquisition device, automatically recording gas
measurements with the date and time, and storing
up to 500 of these values.
MEMBRANE SELECTION
You may find it necessary to use a different type
of membrane for different applications.
To re-configure the analyzer, choose Membrane
to bring up the box which reveals the membrane
models available.
CALIBRATION MODE
Use the Calibration mode command to select
how the sensor is to be calibrated.
Choose In Air to allow calibration of the sensor in
air, In Line to calibrate the sensor directly in the
sampling line, or In a Span Gas to calibrate in a
source of gas of known concentration.
Choosing Sampling Rate lets you select time
intervals (acquisition rate) for this storage
capability.
Page 6
CALIBRATION KEY STATUS
You can use the Calibration Key Status menu to
prevent an accidental sensor re-calibration from
the instrument keyboard.
Enable or Disable the instrument front panel
CAL button. Disabling the button will prevent
accidental sensor re-calibration.
Page 7

Instrument Configuration (cont)
CALIBRATION RANGE CHECKING
When calibration is performed for In Air and In a
Span Gas calibration modes, the sensor
measurement current is compared to an ideal
current for the selected membrane to determine
whether or not to complete the calibration. You
can use the Calibration Range Checking menu
to enable or disable sensor calibration range
checking in the instrument.
Choose Disabled to calibrate without checking
the value of the measurement current, within a
range of 0% to 999% of the ideal current. When
set to Enabled, at calibration the measurement
current should be between 25% and 175% of the
ideal current; if the value is outside of these limits,
the calibration fails and Err is displayed on the
instrument LCD.
INSTRUMENT CONFIGURATION REVIEW
To review if the instrument is set up as expected, choose the Configuration view command.
SPAN GAS
When calibrating the sensor in a span gas, use
the Span Gas menu to enter the span gas
concentration (as a %age) when using a span gas
as a calibration medium.
DUAL USE (MODEL 3650Ex/113 ONLY)
Use the Dual Use menu to change the
measurement phase (either dissolved or
gaseous) for the model 3650Ex/113 dual-use
analyzer.
Choose ppm (dissolved) to set the instrument for
dissolved measurement in liquids, or %
(gaseous) to set the instrument to gas phase
measurement.
Page 7
Page 8

Calibration
BAROMETRIC PRESSURE SENSOR
The instrument internal barometric pressure
sensor is calibrated at the factory, and normally
requires no further attention. However, you may
wish to calibrate it against your own
instrumentation, or simply check the instrument
for accuracy.
Select Troubleshooting, Pressure Calibration
from the WinLog97 program, and enter the
current atmospheric pressure, in mbars, in the
calibration pressure entry box.
GAS SENSOR
The sensor can be calibrated either in air or
directly in line in a liquid sample. Additionally,
oxygen sensors can be calibrated using a span
gas.
To perform a calibration, you must first choose
which method you wish to use. The mode of
calibration may be selected using the WinLog97
program. Alternatively, you can select the mode
of calibration using the instrument front panel
buttons.
Switch the instrument power OFF. Switch the
instrument on by holding down the CAL button,
and then pressing the POWER button at the same
time. The instrument display will show either Air
for in air calibration, LI for in line calibration, or
SPA for span gas calibration
Use the × Ø buttons to change the mode to your
choice and press the STO button to set the
selected mode.
In a Span Gas Calibration
The span gas calibration procedure may be used
if you have a source of gas with a known
concentration of O
type of calibration, the instrument must be set for
calibration In a Span Gas. The Windows
WinLog97 program must also be used in this
procedure.
displayed.
When the reading is stable, press CAL again.
If the new calibration current is within 25% to
175% of the ideal current, the instrument displays
CAL and returns to the measurement mode.
Calibration is now complete, the sensor is
calibrated, and you can proceed with your
measurements.
If the new calibration current is not within this
range, the instrument displays Err and returns to
measurement mode. The system will not
calibrate, and it is likely that a sensor service will
be required.
(in% units). To perform this
2
Switch on the instrument, if
necessary, and wait a minute or
so for the displayed
measurement to settle. Then
expose the sensor to a span gas
sample with a known oxygen
concentration. Enter the
percentage of oxygen in the
span gas using the WinLog97
program.
Press the CAL button.
Remember, this button may
have been locked out to prevent
an accidental reset.
A brief clearing [---] message
appears. Press CAL again
within a 3 second period. The
percentage of the measured
current to the ideal one is
Page 8
Page 9

Calibration (cont)
In Line Calibration
The in line calibration procedure can be used to
calibrate the sensor directly in line, against a
liquid sample with a known dissolved oxygen
concentration.
To perform this type of calibration, the instrument
must be set for calibration In line. Switch on the
instrument, if necessary, and wait a minute or so
for the displayed measurement to settle.
Expose the sensor to a liquid sample with a
known gas concentration.
In Air Calibration (oxygen sensors only)
The oxygen sensor can be accurately calibrated
in air. To perform this type of calibration, the
instrument must be set for calibration In air.
You can perform this procedure with the sensor
connected to the instrument, but without the flow
chamber mounted.
The membrane must be dry, and prior to
calibrating it may be necessary to remove the
screw-on protection cap and its optional grill to
make sure that the components are not damp.
Switch on the instrument, if necessary, and wait a
minute or so for the displayed measurement to
settle.
Press the CAL button. Remember, this button
may have been locked out to prevent an
accidental reset.
A brief clearing [---] message appears. Press
CAL again within a 3 second period. A
measurement will flash on the LCD, showing the
oxygen concentration of the calibration sample.
Assuming you know the gas content to be a
certain value, you can adjust the displayed value
with the × Ø keys.
When the reading is adjusted to the known
concentration, press CAL again. The instrument
displays CAL and returns to the measurement
mode.
The process is then exactly the same as for
calibration in a span gas, detailed previously.
Page 9
Page 10

Troubleshooting
You may wish to use the Troubleshooting menu
to make sure that the instrument is configured
correctly for your application, and is in good
working order.
The instrument must be connected to your PC to
perform these tests.
SERIAL LINK TEST
Normally, the instrument will inform you of a
disconnected RS-232 (serial) link when
appropriate. However, you can confirm a good
connection using the Serial Link Test option, and
echoing a test message via the instrument.
Enter text characters in the Text to be sent box,
then click Send. If the serial link is operating
correctly, the exact same text will be displayed
back from the instrument in the Echo box.
KEYBOARD TEST
The Keyboard Test option will reveal whether all
the instrument buttons are functioning correctly.
Type a number in the Number box (you may also
select one of three units positions for the LCD's
rightmost indicator bar as well). Then choose
Send. The number and indicator bar placement
should appear on your instrument LCD.
CLOCK SETTINGS
Choose the Clock settings option to set the date
and time in the instrument.
ANALOG VOLTAGES VIEW
The Analog Voltage View option gives a realtime look at voltages used by the system to
transmit information about sensor current,
temperature and pressure. This is useful when
trying to identify an instrument problem with an
Orbisphere service representative either on-site
or over the phone.
Press any one of the instrument's buttons (except
the on/off button) for a full second or more. The
appropriate square on-screen should darken.
DISPLAY TEST
Choosing the Display Test option lets you
perform a one-way communication between
computer and instrument.
Page 10
The voltage limits for normal operation are:
• Current channel: -1.5 V to +1.5 V
• Temperature channel: +10 mV to +4 V
• Pressure channel: -100 mV to +100 mV
MEASUREMENTS VIEW
The Measurements View option confirms, on
your PC monitor, what your instrument should be
displaying on the LCD for gas concentration and
sample temperature.
Page 11

Page 11
Page 12

 Loading...