

GW Instek MDO-2000A Series, MDO-2000AG Series, MDO-2202AG, MDO-2302A, MDO-2302AG User Manual
...Page 1

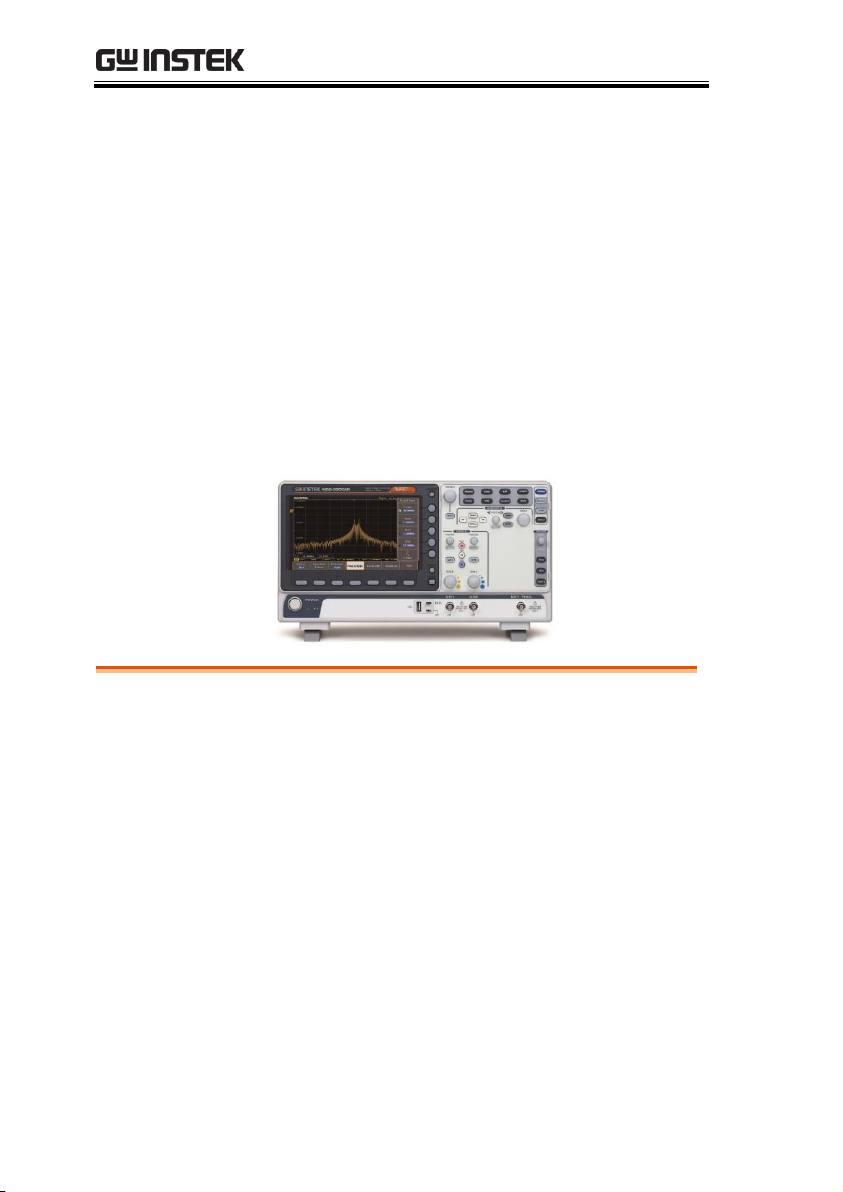
Mixed-Domain Oscilloscope
MDO-2000A Series
USER MANUAL
ISO-9001 CERTIFIED MANUFACTURER
Page 2

June 2019
This manual contains proprietary information, which is protected by
copyright. All rights are reserved. No part of this manual may be
photocopied, reproduced or translated to another language without
prior written consent of Good Will company.
The information in this manual was correct at the time of printing.
However, Good Will continues to improve products and reserves the
rights to change specification, equipment, and maintenance
procedures at any time without notice.
Good Will Instrument Co., Ltd.
No. 7-1, Jhongsing Rd., Tucheng Dist., New Taipei City 236, Taiwan
Page 3

TABLE OF CONTENTS
Table of Contents
SAFETY INSTRUCTIONS .................................................. 3
GETTING STARTED .......................................................... 8
MDO-2000A Series Overview ....................................... 9
Appearance ................................................................ 12
Set Up ....................................................................... 23
Built-in Help .............................................................. 32
MEASUREMENT ............................................................ 33
Basic Measurement ................................................... 34
Automatic Measurement ............................................ 41
Cursor Measurement ................................................. 55
Math Operation ......................................................... 62
ADVANCED CONFIGURATION ....................................... 72
Acquisition ................................................................ 75
Segmented Memory Acquisition ................................ 80
Display ...................................................................... 92
Horizontal View ......................................................... 97
Vertical View (Channel) .............................................105
Bus Key Configuration ..............................................113
Trigger ......................................................................131
Search.......................................................................162
System Settings and Miscellaneous Settings ............171
ARBITRARY WAVE GENERATOR .................................... 176
Arbitrary Wave Generator Operation .........................177
SPECTRUM ANALYZER .................................................. 210
Spectrum Analyzer operation ....................................211
1
Page 4

MDO-2000A series User Manual
APPLICATIONS ............................................................. 228
Introduction ............................................................. 229
Go-NoGo application ............................................... 232
DVM application ...................................................... 237
Data Log application ................................................ 239
Digital Filter application .......................................... 241
Mask application ..................................................... 243
FRA application ....................................................... 253
SAVE/RECALL ............................................................... 268
File Format/Utility ................................................... 269
Create/Edit Labels .................................................... 275
Save ......................................................................... 278
Recall ....................................................................... 285
Reference Waveforms ............................................... 291
FILE UTILITIES ............................................................. 293
HARDCOPY KEY ........................................................... 299
REMOTE CONTROL CONFIG ........................................ 303
Interface Configuration ............................................ 304
MAINTENANCE ............................................................ 314
FAQ .............................................................................. 320
APPENDIX .................................................................... 322
Updating the Firmware ............................................ 323
MDO-2000A Series Specifications ............................ 325
Probe Specifications ................................................ 330
Dimensions ............................................................. 332
Declaration of Conformity ........................................ 333
INDEX .......................................................................... 334
2
Page 5
SAFETY INSTRUCTIONS
WARNING
Warning: Identifies conditions or practices that
could result in injury or loss of life.
CAUTION
Caution: Identifies conditions or practices that
could result in damage to the equipment or to
other properties.
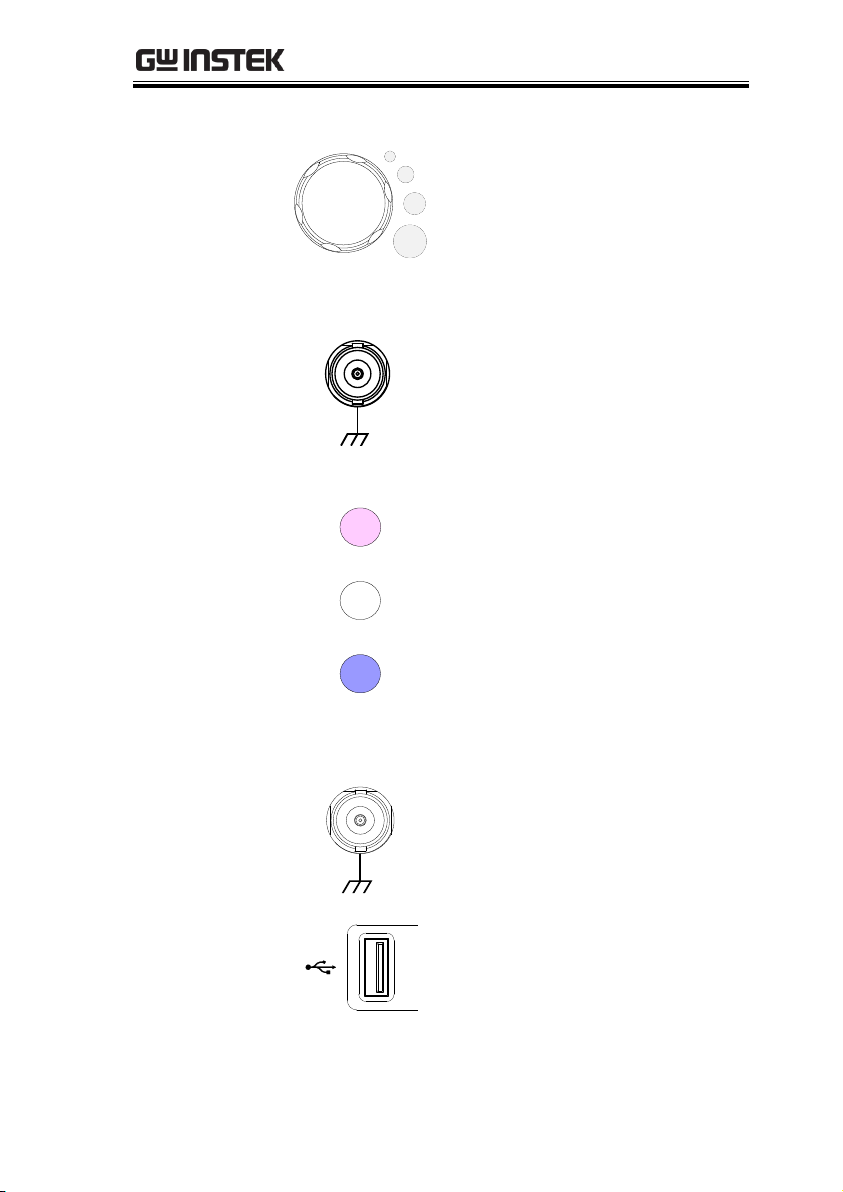
DANGER High Voltage
(Note)
Attention required
Refer to the Manual
Protective Conductor Terminal
Earth (ground) Terminal
SAFETY INSTRUCTIONS
This chapter contains important safety
instructions that you must follow during
operation and storage. Read the following before
any operation to insure your safety and to keep
the instrument in the best possible condition.
Safety Symbols
These safety symbols may appear in this manual or on the Product
name.
3
Page 6
MDO-2000A series User Manual
Do not dispose electronic equipment as unsorted
municipal waste. Please use a separate collection
facility or contact the supplier from which this
instrument was purchased.
General Guideline
WARNING
CAUTION
Make sure the BNC input voltage does not
exceed 300Vrms.
Never connect a hazardous live voltage to the
ground side of the BNC connectors. It might
lead to fire and electric shock.
Do not place any heavy object on the MDO-
2000A series.
Avoid severe impact or rough handling that
leads to damaging the MDO-2000A series.
Do not discharge static electricity to the MDO-
2000A series.
Use only mating connectors, not bare wires, for
the terminals.
Do not block the cooling fan opening.
Do not perform measurement at a power source
or building installation (Note below).
Do not disassemble the MDO-2000A series
unless you are qualified.
Note
(Measurement categories) EN 61010-1:2010 specifies the
measurement categories and their requirements as follows. The
MDO-2000A series falls under category I.
Measurement category IV is for measurements performed at the
source of low-voltage installation.
Measurement category III is for measurements performed in the
building installation.
Measurement category II is for measurements performed on
circuits directly connected to the low voltage installation.
Measurement category I is for measurement performed on
circuits not directly connected to Mains.
Safety Guidelines
4
Page 7

SAFETY INSTRUCTIONS
Power Supply
WARNING
AC Input voltage: 100 - 240V AC, 50 - 60Hz,
auto selection. Power consumption: 40W for
MDO-2000A series.
Connect the protective grounding conductor of
the AC power cord to an earth ground, to avoid
electrical shock.
Cleaning the
MDO-2000A
Series
Disconnect the power cord before cleaning.
Use a soft cloth dampened in a solution of mild
detergent and water. Do not spray any liquid.
Do not use chemicals containing harsh materials
such as benzene, toluene, xylene and acetone.
Operation
Environment
Location: Indoor, no direct sunlight, dust free,
almost non-conductive pollution (Note below)
Relative Humidity: ≤80%, 40°C or below; ≤45%,
41°C ~ 50°C
Altitude: < 2000m
Temperature: 0°C to 50°C
Note
(Pollution Degree) EN 61010-1:2010 specifies the pollution degrees
and their requirements as follows. The MDO-2000A series falls
under degree 2.
Pollution refers to “addition of foreign matter, solid, liquid, or
gaseous (ionized gases), that may produce a reduction of dielectric
strength or surface resistivity”.
Pollution degree 1: No pollution or only dry, non-conductive
pollution occurs. The pollution has no influence.
Pollution degree 2: Normally only non-conductive pollution
occurs. Occasionally, however, a temporary conductivity caused
by condensation must be expected.
Pollution degree 3: Conductive pollution occurs, or dry, non-
conductive pollution occurs which becomes conductive due to
condensation which is expected. In such conditions, equipment
is normally protected against exposure to direct sunlight,
precipitation, and full wind pressure, but neither temperature
nor humidity is controlled.
5
Page 8

MDO-2000A series User Manual
Storage
environment
Location: Indoor
Temperature: -10°C to 60°C
Humidity: Up to 93% RH (non-condensing) /
≤40ºC, up to 65% RH (non-condensing) / 41ºC
~ 60 ºC
Disposal
Do not dispose this instrument as unsorted
municipal waste. Please use a separate collection
facility or contact the supplier from which this
instrument was purchased. Please make sure
discarded electrical waste is properly recycled to
reduce environmental impact.
6
Page 9
SAFETY INSTRUCTIONS
Green/ Yellow:
Earth
Blue:
Neutral
Brown:
Live (Phase)
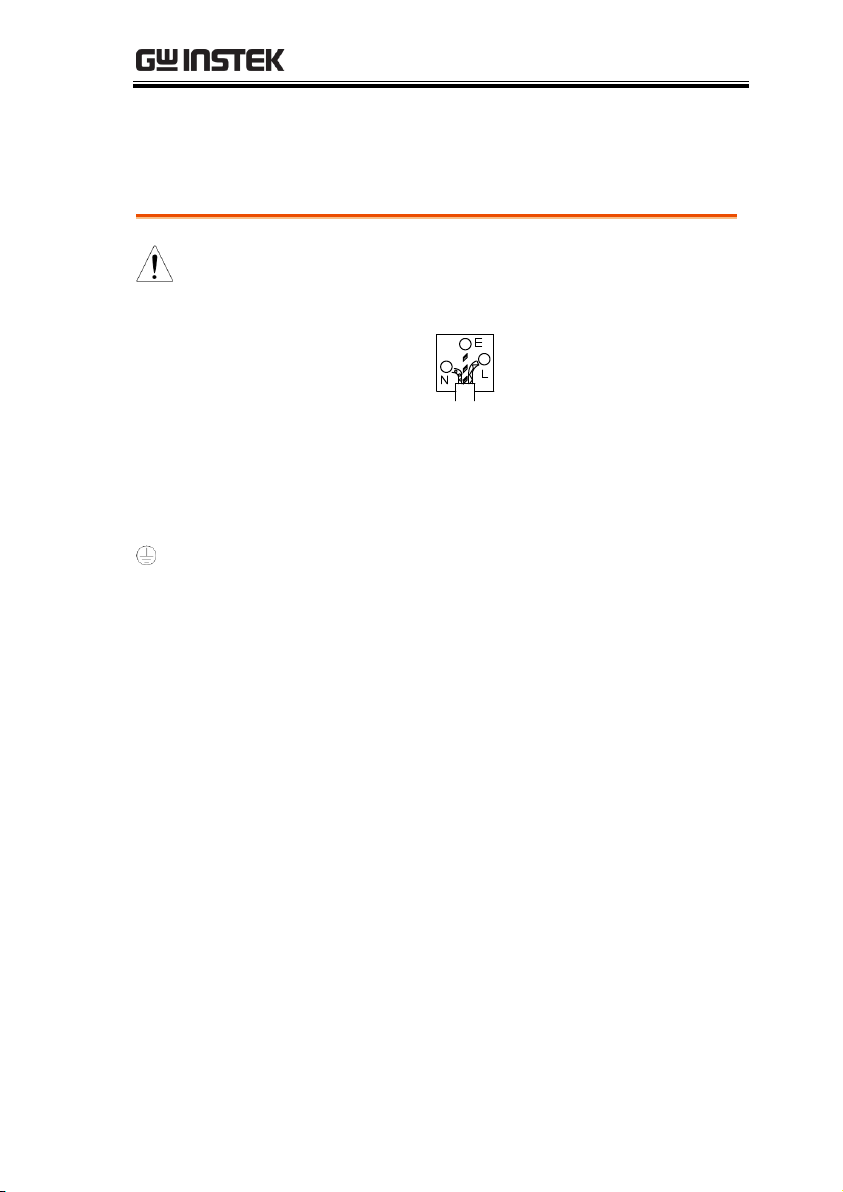
Power cord for the United Kingdom
When using the oscilloscope in the United Kingdom, make sure the
power cord meets the following safety instructions.
NOTE: This lead/appliance must only be wired by competent persons
WARNING: THIS APPLIANCE MUST BE EARTHED
IMPORTANT: The wires in this lead are coloured in accordance with the
following code:
As the colours of the wires in main leads may not correspond with
the coloured marking identified in your plug/appliance, proceed
as follows:
The wire which is coloured Green & Yellow must be connected to
the Earth terminal marked with either the letter E, the earth symbol
or coloured Green/Green & Yellow.
The wire which is coloured Blue must be connected to the terminal
which is marked with the letter N or coloured Blue or Black.
The wire which is coloured Brown must be connected to the
terminal marked with the letter L or P or coloured Brown or Red.
If in doubt, consult the instructions provided with the equipment
or contact the supplier.
This cable/appliance should be protected by a suitably rated and
approved HBC mains fuse: refer to the rating information on the
equipment and/or user instructions for details. As a guide, a cable
of 0.75mm2 should be protected by a 3A or 5A fuse. Larger
conductors would normally require 13A types, depending on the
connection method used.
Any exposed wiring from a cable, plug or connection that is
engaged in a live socket is extremely hazardous. If a cable or plug is
deemed hazardous, turn off the mains power and remove the cable,
any fuses and fuse assemblies. All hazardous wiring must be
immediately destroyed and replaced in accordance to the above
standard.
7
Page 10
MDO-2000A series User Manual
MDO-2000A Series Overview ....................................... 9
Integrated instruments and series lineup .............................................. 9
Main Features ............................................................................................ 9
Accessories ............................................................................................... 10
Appearance ................................................................ 12
Front panel .............................................................................................. 12
Rear Panel ................................................................................................ 19
MDO-2000A series ................................................................................... 19
MDO-2000AG series ................................................................................ 19
Display ...................................................................................................... 20
Set Up ........................................................................ 23
Tilt Stand .................................................................................................. 23
Power Up ................................................................................................. 23
First Time Use ......................................................................................... 24
How to Use This Manual ...................................................................... 26
Built-in Help .............................................................. 32
GETTING STARTED
This chapter describes the MDO-2000A series in a
nutshell, including its main features and front /
rear panel. After going through the overview,
follow the Set Up section to properly set up the
device for first time use. The Set Up section also
includes an introduction on how to use this
manual effectively.
8
Page 11

GETTING STARTED
Model name
AWG
(1)
SA
(2)
MDO-2000A
✗
✓
MDO-2000AG
✓
✓
Model name
Frequency
bandwidth
Input
channels
Max. Real-time
Sampling Rate
MDO-2102A/AG
100MHz
2
2GSa/s
MDO-2202A/AG
200MHz
2
2GSa/s
MDO-2302A/AG
300MHz
2
2GSa/s
Features
8 inch, 800 x 480, WVGA TFT display.
Available from 100MHz to 300MHz.
Real-time sampling rate of 2GSa/s max.
Deep memory: 20M points record length.
Waveform capture rate of 120,000 waveforms
per second.
Vertical sensitivity: 1mV/div~10V/div.
MDO-2000A Series Overview
Integrated instruments and series lineup
The MDO-2000A series have different hardware implemented
instruments:
(1) Arbitrary Wave Generator
(2) Spectrum Analyzer
The MDO-2000A series consists of 6 models. Note that throughout
the user manual, the term “MDO-2000A series” refers to all models
of the series, unless stated otherwise.
Main Features
9
Page 12

MDO-2000A series User Manual
Segmented Memory: Optimizes the acquisition
memory to selectively capture only the
important signal details. Up to 29,000 successive
waveform segments can be captured with a
time-tag resolution of 4ns.
Waveform Search: Allows the scope to search
for a number of different signal events.
Arbitrary Wave generator: Full-function dual
channel arbitrary waveform generator.
Spectrum Analyzer: A handy tool to perform
signal analysis in the frequency domain.
Powerful embedded applications such as: Data
Logging, Digital Voltmeter, Go-No Go, Mask,
Digital filter, FRA etc..
On-screen Help.
32 MB internal flash disk.
Interface
USB host port: front panel, for storage devices.
USB device port: rear panel, for remote control
or printing.
Ethernet port as standard.
Probe compensation output with selectable
output frequency (1kHz ~ 200kHz).
Calibration output.
Standard
Accessories
Part number
Description
N/A region dependent
Power cord
GTP-100B-4, for MDO2102A/AG
Passive probe; 100 MHz
GTP-200B-4, for MDO2202A/AG
Passive probe; 200 MHz
Accessories
10
Page 13

GETTING STARTED
GTP-300B-4, for
MDO-2302A/AG
Passive probe; 300 MHz
GTL-110
Test lead for AWG.
Standard Apps
Name
Description
Go-NoGo
Go-NoGo testing app.
DataLog
Waveform or image data logging
app.
DVM
Digital Voltmeter app.
Digital Filter
High ,low or band pass digital
filter for analog inputs.
Mask
Creates shape templates for signal
comparison.
Remote Disk
network share drive.
Demo mode
with the GDB-03 demo board.
FRA
(For MDO-2000AG series only)
Optional
Accessories
Part number
Description
GDB-03
Demo board.
Drivers, others
USB driver
LabVIEW driver
11
Page 14
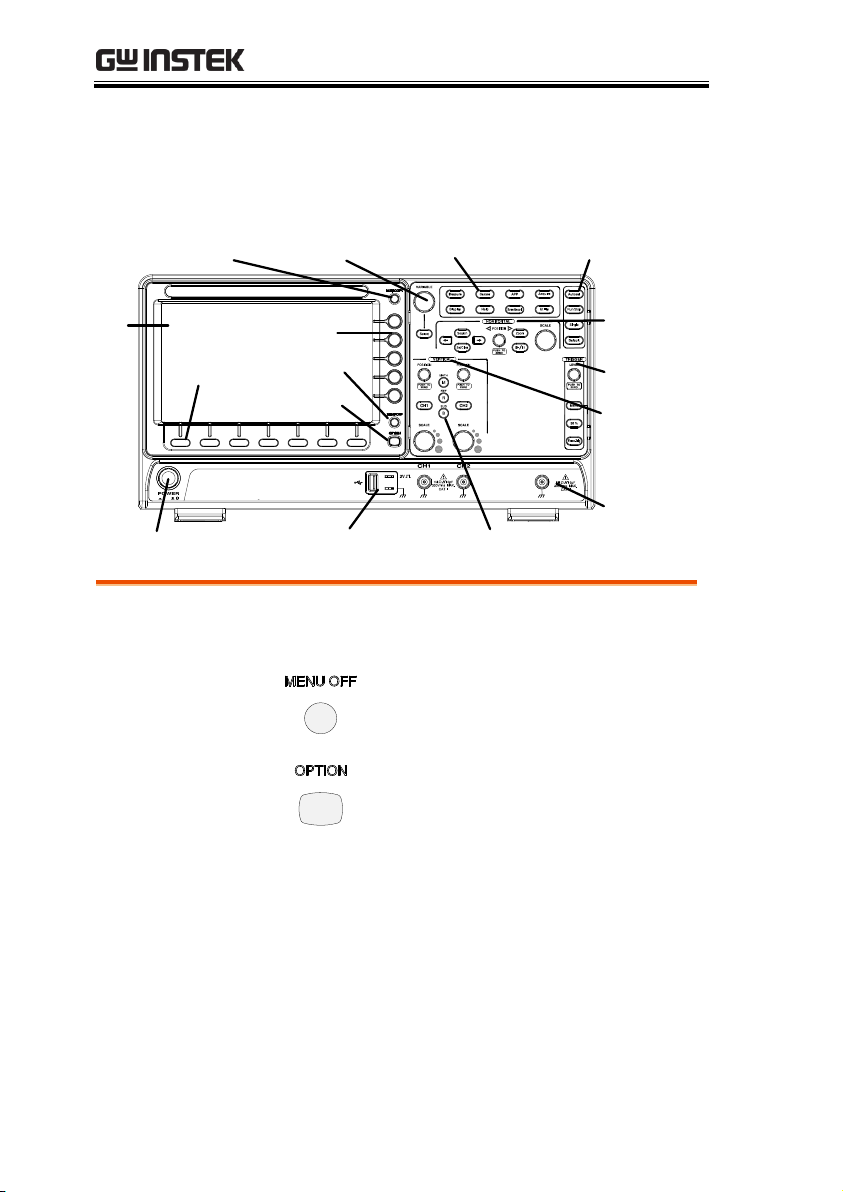
Appearance
LCD
Variable knob
and Select key
Autoset, Run/Stop,
Single and Default
settings
CH1~CH2,
EXT TRIG
Trigger
controls
Function
keys
USB Host port, Probe
Compensation terminals
Hardcopy key
Math, Reference
and Bus keys
Bottom
menu keys
Vertical
controls
Option key
Menu key
Side
menu keys
Power
button
Horizontal
controls
EXT TRIG
LCD Display
8” WVGA TFT color LCD. 800 x 480 resolution,
wide angle view display.
Menu Off Key
Use the Menu Off key to hide the
onscreen menu system.
Option Key
The Option key is used to access
installed options.
Front panel
MDO-2000A series User Manual
12
Page 15
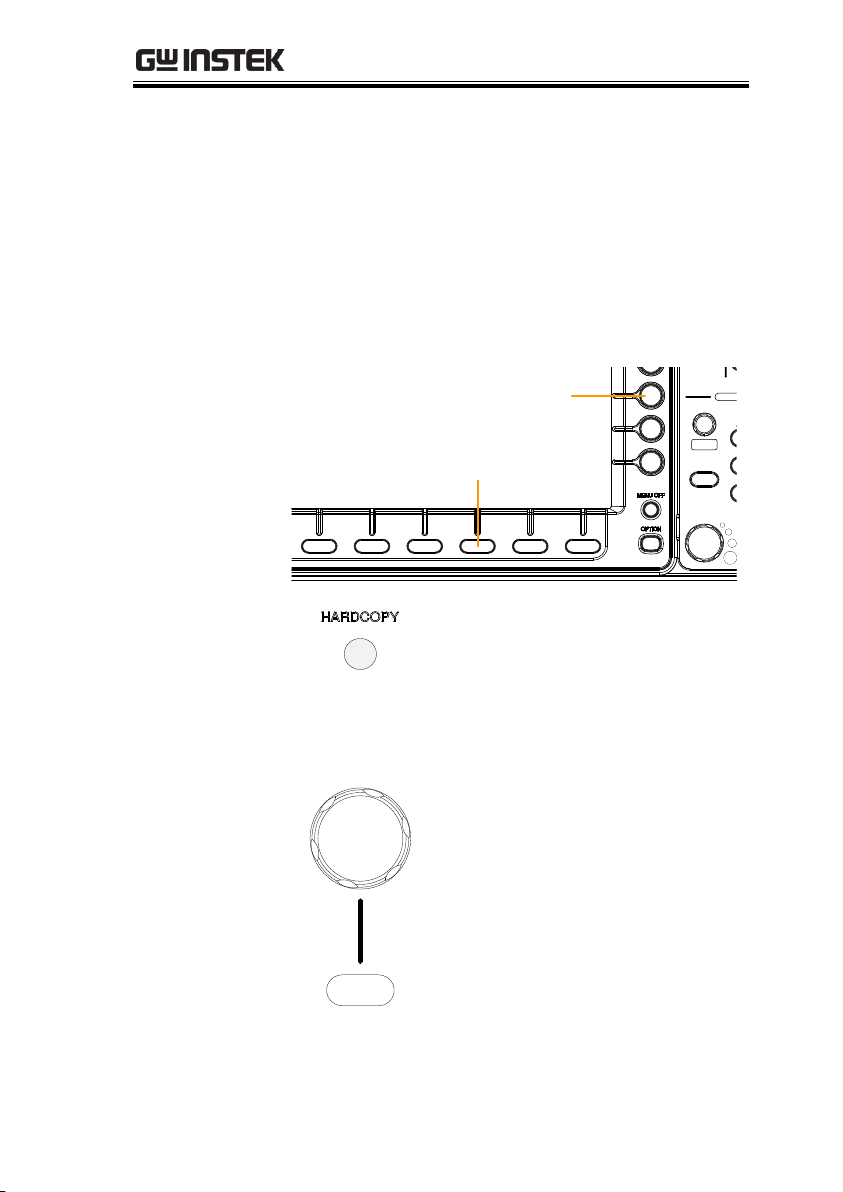
GETTING STARTED
Menu Keys
The side menu and bottom menu keys are used to
make selections from the soft-menus on the LCD
user interface.
To choose menu items, use the 7 Bottom menu
keys located on the bottom of the display panel.
To select a variable or option from a menu, use the
side menu keys on the side of the panel. See page
26 for details.
VARIABLE
POSITION
HORIZONTAL
TRIGGER
LEVEL
PUSH TO
ZERO
PUSH TO
ZERO
SCALE
Measure
Display
Cursor
Help
Test
Save/Recall
Acquire
Utility
Autoset
Run/Stop
Single
Default
Select
Search
Set/Clear
Zoom
Menu
50 %
Force-Trig
POSITION
POSITION
VERTICAL
MATH
REF
BUS
SCALESCALE
PUSH TO
ZERO
PUSH TO
ZERO
M
R
B
Digital Storage Oscilloscope
GDS-2202E
200 MHz 1 GS/s
Visual Persistence Oscilloscope
Side menu keys
Bottom menu keys
Hardcopy Key
The Hardcopy key is a quick-save
or quick-print key, depending on
its configuration. For more
information see pages 300 (save)
or 300 (print).
Variable Knob
and Select Key
Select
VARIABLE
The Variable knob is used to
increase/decrease values or to
move between parameters.
The Select key, when lit up, is
used to make selections.
13
Page 16

MDO-2000A series User Manual
Function Keys
The Function keys are used to enter and configure
different functions on the MDO-2000A series.
Measure
Measure
Configures and runs automatic
measurements.
Cursor
Cursor
Configures and runs cursor
measurements.
APP
APP
Configures and runs GW Instek
applications.
Acquire
Acquire
Configures the acquisition mode,
including Segmented Memory
acquisition.
Display
Display
Configures the display settings.
Help
Help
Shows the Help menu.
Save/Recall
Save/Recall
Used to save and recall
waveforms, images, panel
settings.
Utility
Utility
Configures the Hardcopy key,
display time, language, probe
compensation and calibration. It
also accesses the file utilities
menu.
Autoset
Autoset
Press the Autoset key to
automatically set the trigger,
horizontal scale and vertical scale.
14
Page 17
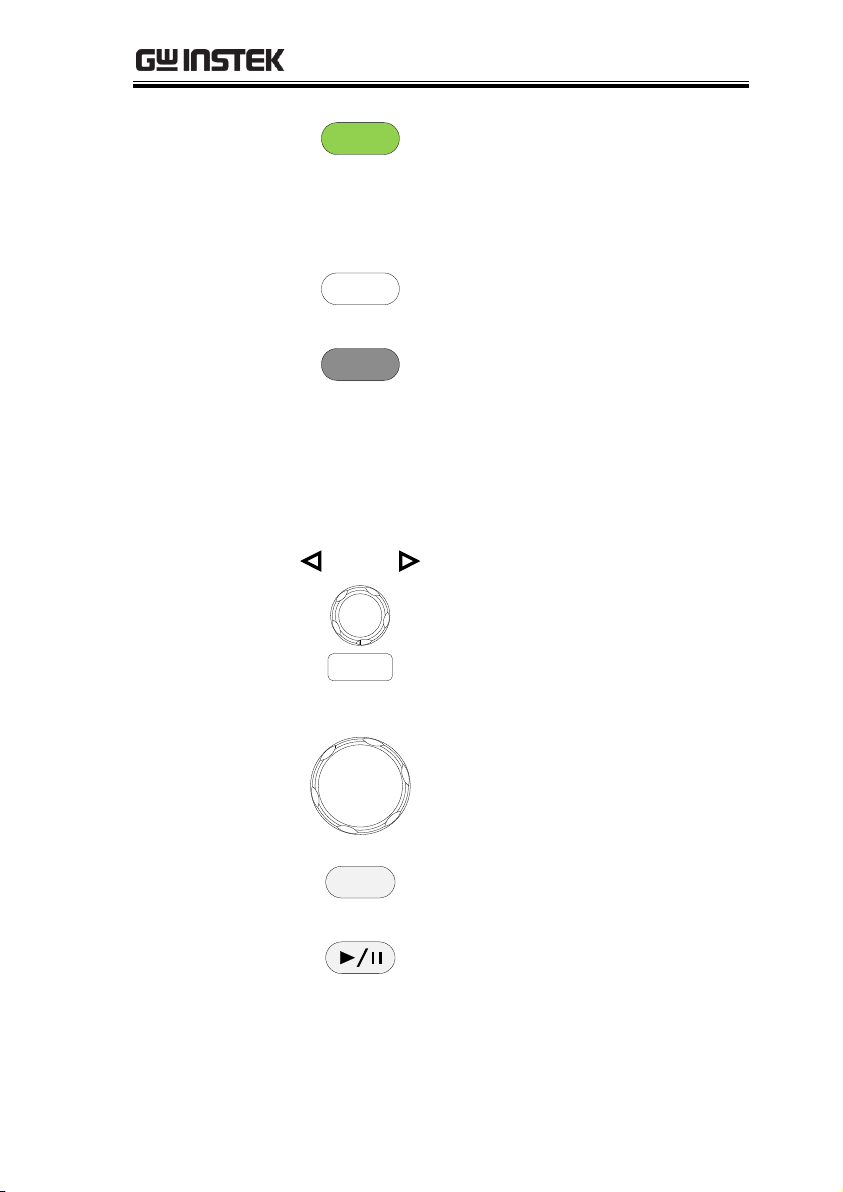
GETTING STARTED
Run/Stop Key
Run/Stop
Press to Freeze (Stop) or continue
(Run) signal acquisition (page 37).
The run stop key is also used to
run or stop Segmented Memory
acquisition (page 83).
Single
Single
Sets the acquisition mode to
single triggering mode.
Default Setup
Default
Resets the oscilloscope to the
default settings.
Horizontal
Controls
The horizontal controls are used to change the
position of the cursor, set the time base settings,
zoom into the waveforms/traces and search for
events.
Horizontal
Position
POSITION
PUSH TO
ZERO
The Position knob is used to
position the waveforms/traces
horizontally on the display
screen. Pressing the knob will
reset the position to zero.
SCALE
SCALE
The Scale knob is used to change
the horizontal scale (TIME/DIV).
Zoom
Zoom
Press Zoom in combination with
the horizontal Position knob.
Play/Pause
The Play/Pause key allows you to
view each search event in
succession – to effectively “play”
through each search event. It is
also used to play through a
waveform/trace in zoom mode.
15
Page 18
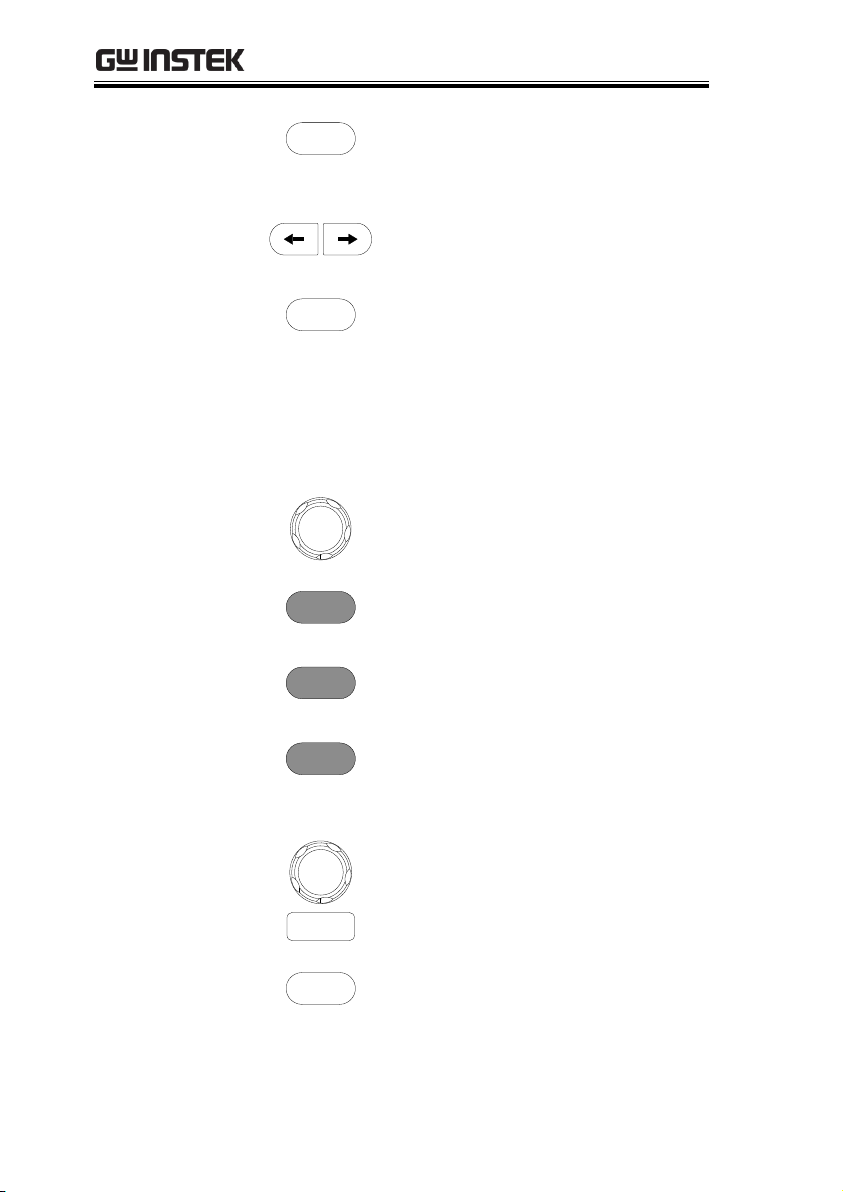
MDO-2000A series User Manual
Search
Search
The Search key accesses the
search function menu to set the
search type, source and threshold.
Search Arrows
Use the arrow keys to navigate
the search events.
Set/Clear
Set/Clear
Use the Set/Clear key to set or
clear points of interest when
using the search function.
Trigger Controls
The trigger controls are used to control the trigger
level and options.
Level Knob
LEVEL
Used to set the trigger level.
Pressing the knob will reset the
level to zero.
Trigger Menu Key
Menu
Used to bring up the trigger
menu.
50% Key
50 %
Sets the trigger level to the half
way point (50%).
Force - Trig
Force-Trig
Press to force an immediate
trigger of the waveform.
Vertical
POSITION
POSITION
PUSH TO
ZERO
Sets the vertical position of the
waveform/trace. Push the knob
to reset the vertical position to
zero.
Channel Menu
Key
CH1
Press the CH1~4 key to set and
configure the corresponding
channel.
16
Page 19
GETTING STARTED
(Vertical)SCALE
Knob
SCALE
Sets the vertical scale of the
channel (TIME/DIV).
External Trigger
Input
EXT TRIG
Accepts external trigger signals
(page 131). Only on 2 channel
models.
Input impedance: 1MΩ
Voltage input: ±15V (peak), EXT
trigger capacitance: 16pF.
Math Key
MATH
M
Use the Math key to set and
configure math functions.
Reference Key
REF
R
Press the Reference key to set or
remove reference waveforms.
BUS Key
BUS
B
The Bus key is used for serial bus
(UART, I2C, CAN, LIN)
configuration.
Channel Inputs
CH1
Accepts input signals.
Input impedance: 1MΩ.
Capacitance: 16pF
CAT I
USB Host Port
2V
Type A, 1.1/2.0 compatible. Used
for data transfer.
17
Page 20
MDO-2000A series User Manual
Ground Terminal
2V
Accepts the DUT ground lead for
common ground.
Probe
Compensation
Output
2V
The probe compensation output is
used for probe compensation. It
also has an adjustable output
frequency.
By default this port outputs a
2Vpp, square wave signal at 1kHz
for probe compensation.
Please see page 173 for details.
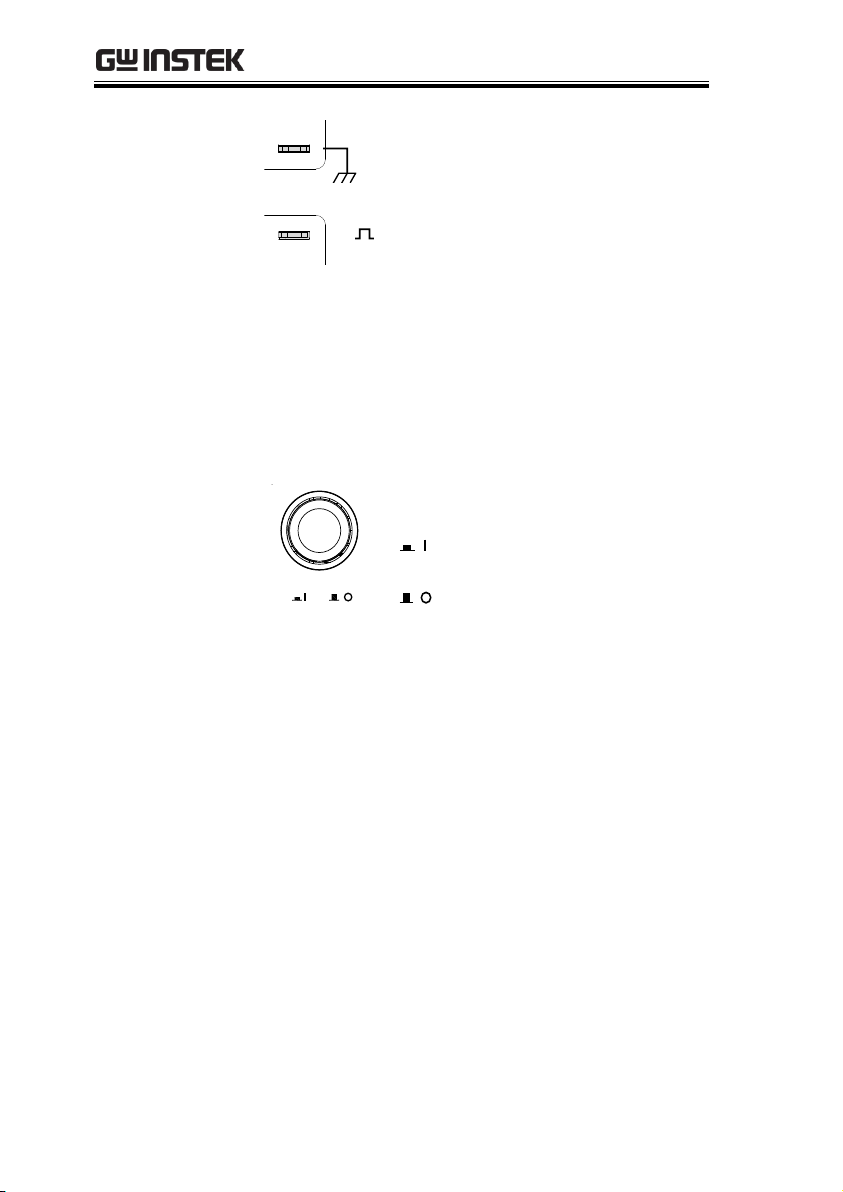
Power Switch
POWER
Used to turn the power on/off.
: ON
: OFF
18
Page 21
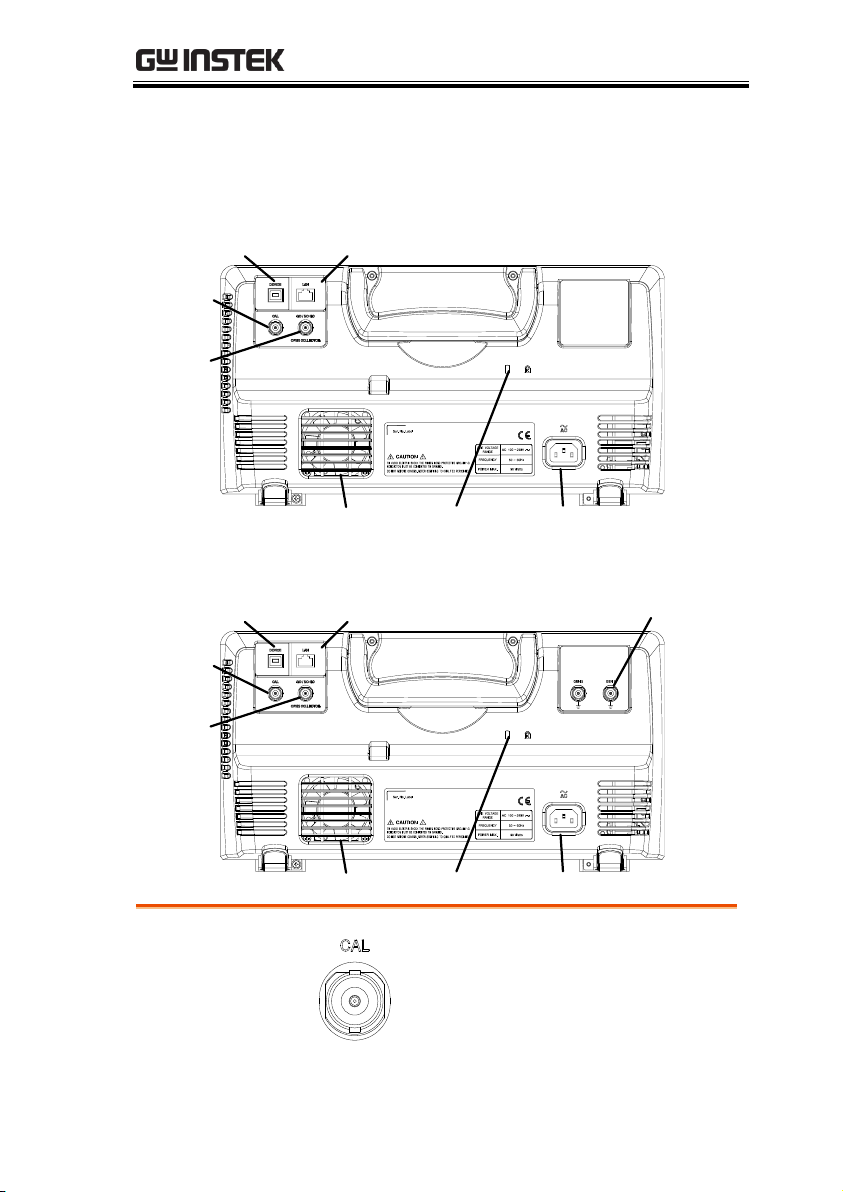
GETTING STARTED
Calibration
output
Key lock Power input socket
Fan
Go/No Go
output
LAN portUSB Device port
Calibration
output
Key lock Power input socket
Fan
Go/No Go
output
LAN portUSB Device port
AWG channels
output
Calibration
Output
Outputs the signal for vertical scale
accuracy calibration (page 315).
Rear Panel
MDO-2000A series
MDO-2000AG series
19
Page 22
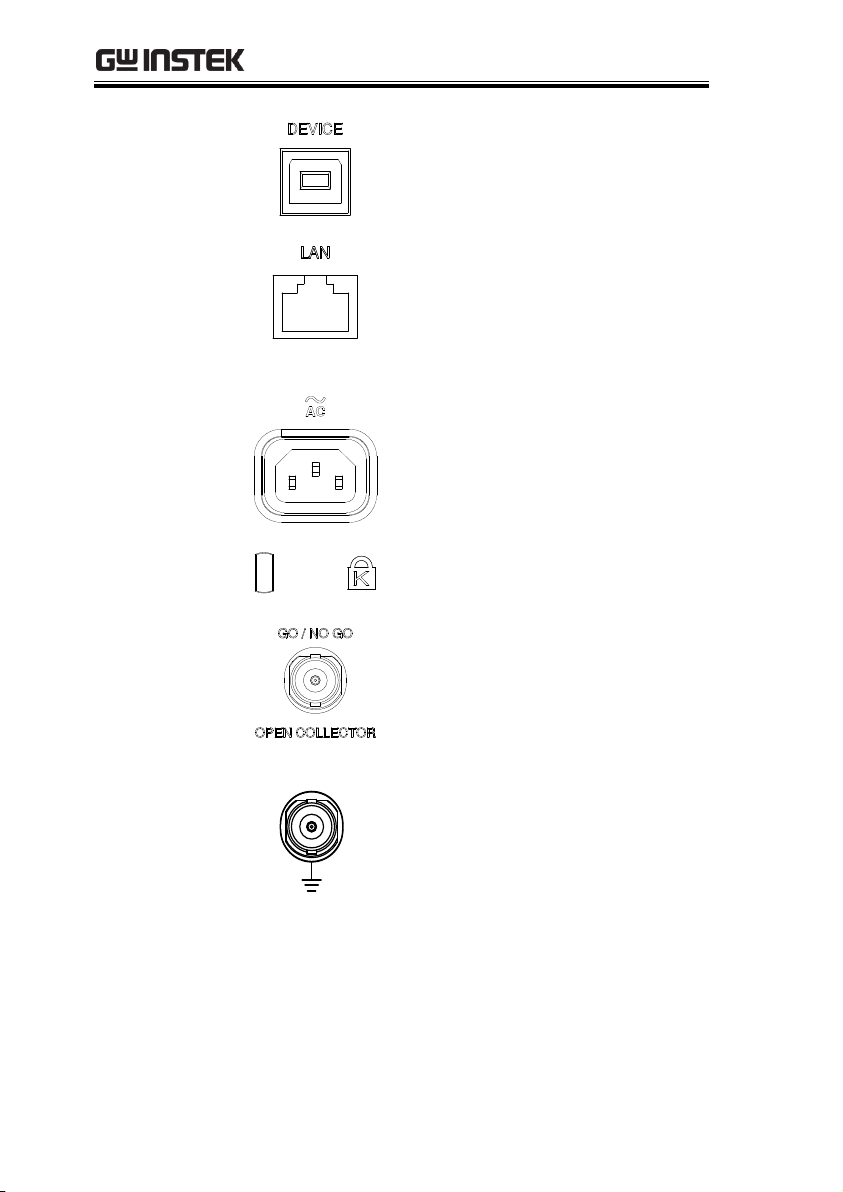
MDO-2000A series User Manual
USB Device Port
The USB Device port is used for
remote control.
LAN (Ethernet)
Port
The LAN port is used for remote
control over a network or when
combined with the Remote Disk
app, allows the scope to be
mounted to a share disk.
Power Input
Socket
Power cord socket accepts AC
mains, 100 ~ 240V, 50/60Hz.
For power up sequence, see page
23.
Security Slot
Kensington security slot
compatible.
Go-No Go
Output
Outputs Go-No Go test results
(page 232) as a 500us pulse signal.
AWG Output
GEN 1
Output the GEN1 or GEN2 signal
from the Arbitrary Wave Generator
function. (see page 178).
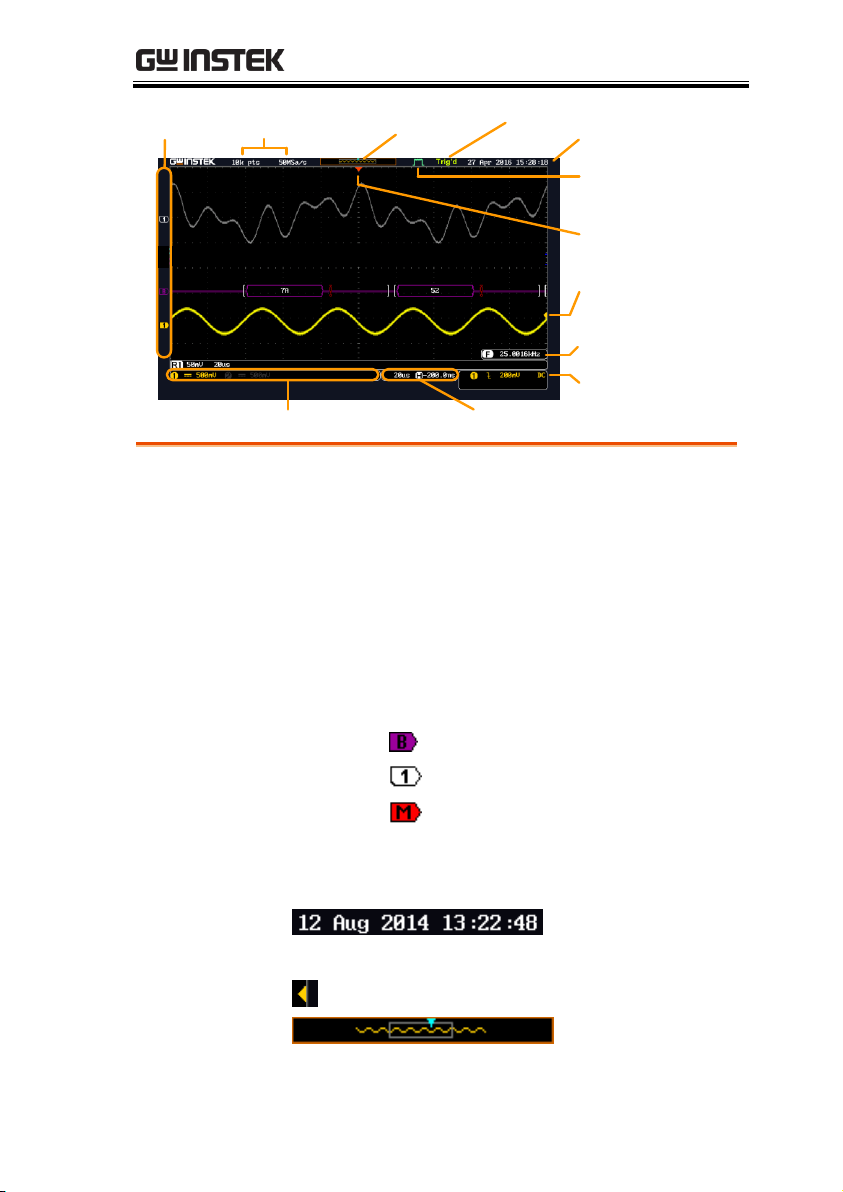
Display
Below is a general description of the main display. As the display
changes while activating the different functions of the MDO2000A/AG, please refer to each function sub-chapters of this user
manual for more details.
20
Page 23
GETTING STARTED
Memory
bar
Reference
waveform
Analog
Waveform
Bus
decoding
Channel status Horizontal status
Trigger
configuration
Waveform
frequency
Date and time
Trigger
position
Trigger status
Acquisition
mode
Trigger level
Channel
Indicators
Memory length
and sample rate
Analog
Waveforms
Shows the analog input signal waveforms.
Channel 1: Yellow
Channel 2: Blue
Bus decoding
Shows serial bus data decoding. The values are
displayed in hex or binary.
Reference
waveform
Reference waveform(s) can be displayed for
reference, comparison or other operations.
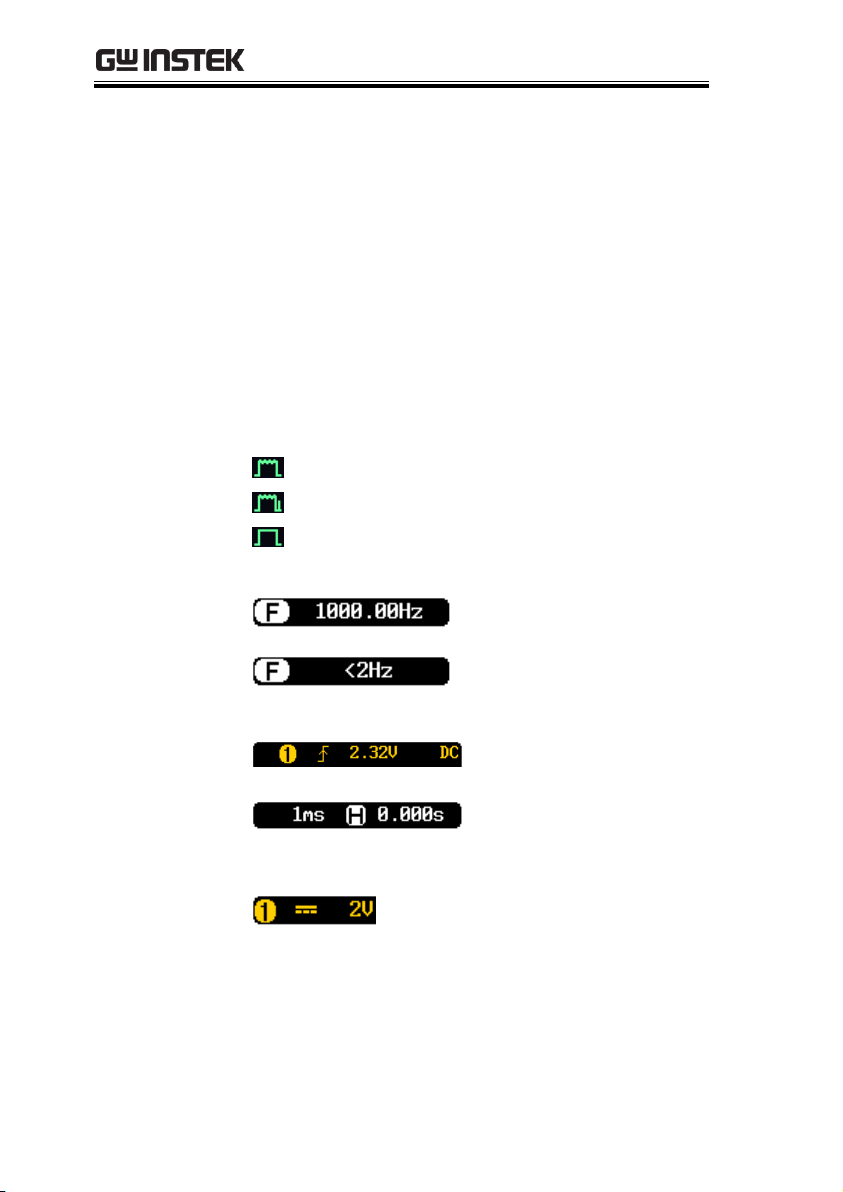
Channel
Indicators
The channel indicators for each activated channels
are located at the zero volt level of each signals.
Any active channel is shown with a solid color.
Example:
Bus indicator(B)
Reference waveform indicator
Math indicator
Trigger Position
Shows the position of the trigger.
Horizontal Status
Shows the horizontal scale and position.
Date and Time
Current date and time (page 173).
Trigger Level
Shows the trigger level on the graticule.
Memory Bar
21
Page 24
MDO-2000A series User Manual
The ratio and the position of the displayed
waveform compared to the internal memory (page
97).
Trigger Status
Trig’d
Triggered.
PrTrig
Pre-trigger.
Trig?
Not triggered, display not updated.
Stop
Trigger stopped. Also appears in
Run/Stop (page 37).
Roll
Roll mode.
Auto
Auto trigger mode.
For trigger details, see page 131.
Acquisition Mode
Normal mode
Peak detect mode
Average mode
For acquisition details, see page 75.
Signal Frequency
Shows the trigger source
frequency.
Indicates the frequency is
less than 2Hz (lower
frequency limit).
Trigger
Configuration
Trigger source, slope,
voltage and coupling.
Horizontal Status
Horizontal scale,
horizontal position.
For trigger details, see page 131.
Channel Status
Channel 1, DC coupling,
2V/Div.
For channel details, see page 105.
22
Page 25
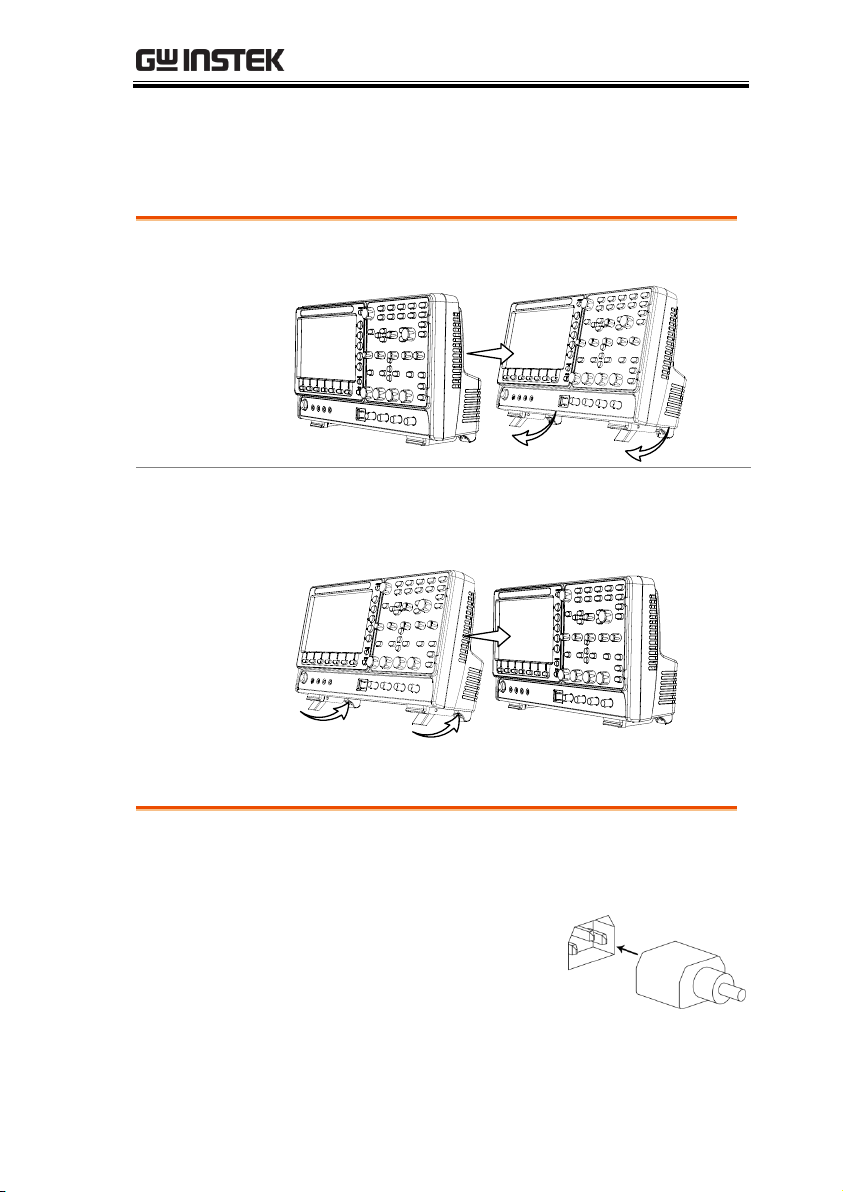
Set Up
Tilt
To tilt, pull the legs forward, as shown below.
Stand
To stand the scope upright, push the legs back
under the casing as shown below.
Requirements
The MDO-2000A series accepts line voltages of 100
~ 240V at 50 or 60Hz.
Step
1. Connect the power cord to
the rear panel socket.
Tilt Stand
GETTING STARTED
Power Up
23
Page 26

2. Press the POWER key. The
display becomes active in
~ 30 seconds.
: ON
: OFF
POWER
Note
The MDO-2000A series recovers the state right before
the power is turned OFF. The default settings can be
recovered by pressing the Default key on the front
panel. For details, see page 285.
First Time Use
Background
This section describes how to connect, adjust the
scale and compensate the probe. Before operating
the MDO-2000A series in a new environment, run
these steps to make sure the instrument performs
at its full potential.
1. Power On
Follow the procedures on the previous page.
2. Firmware
Update to the latest firmware.
Page 323
3. Set the Date
and Time
Set the date and time.
Page 173.
4. Reset System
Reset the system by recalling the
factory settings. Press the Default key
on the front panel. For details, see
page 285.
Default
5. Connect the
probe
Connect the probe that you will use for
measurements to the Channel 1 input and to the
probe compensation output. This output provides
by default a 2V peak to peak, 1kHz square wave
for signal compensation.
Set the probe attenuation to x10 if the probe has
adjustable attenuation.
MDO-2000A series User Manual
24
Page 27

GETTING STARTED
EXT TRIG
x1
x10
X
10
X
1
CH1
2V
6. Capture Signal
(Autoset)
Press the Autoset key. A square
waveform appears on the center of
the screen. For Autoset details, see
page 35.
Autoset
7. Select Vector
Waveform
Press the Display key, and set the
display to Vector on the bottom menu.
Display
25
Page 28
MDO-2000A series User Manual
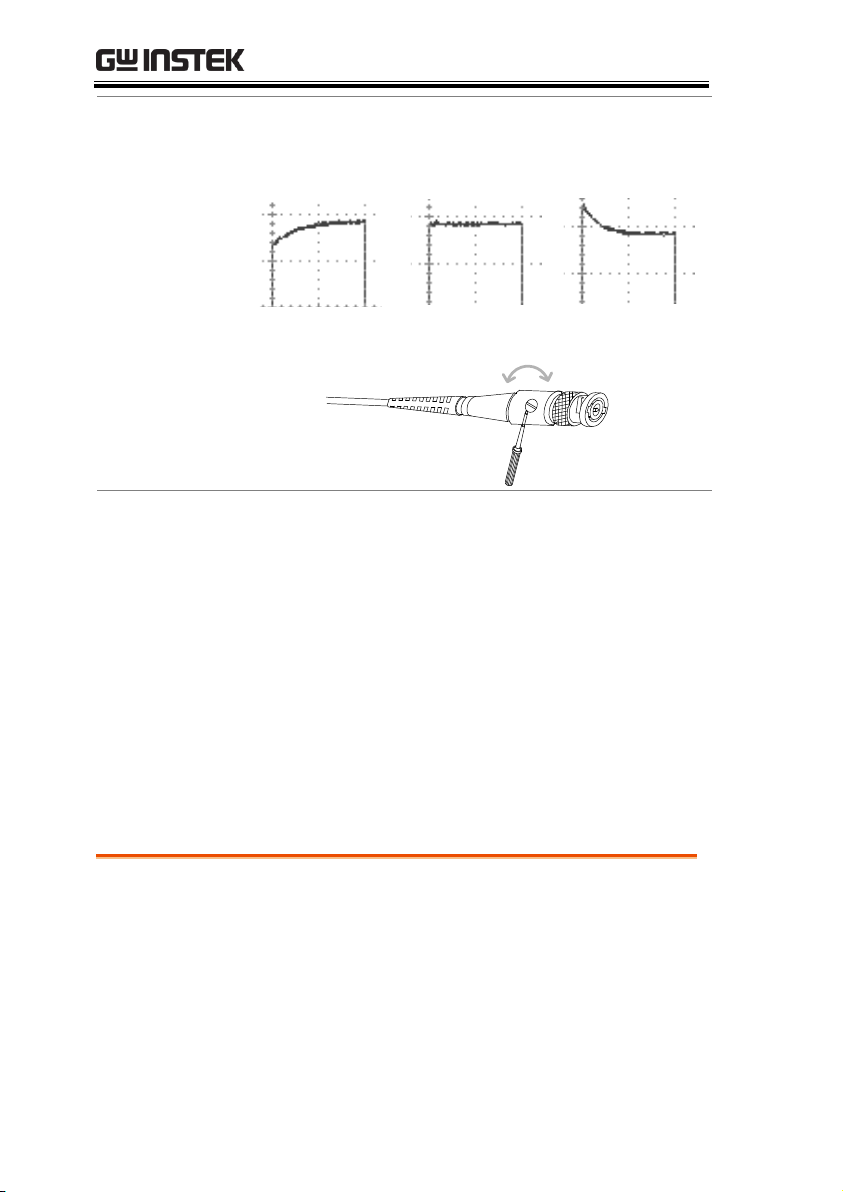
8. Compensate
the probe
Turn the adjustment point on the probe to make
the square waveform as flat as possible.
9. Start operations
Continue with the other operations.
Measurement: page 33
Configuration: page 72
Using the Spectrum
Analyzer: page 210.
Applications: page 228
Save/Recall: page 268
File Utilities: page 293
Hardcopy key: page 299
Remote Control: page
303
Maintenance: page 314
Background
This section describes the conventions used in this
manual to operate the MDO-2000A series.
Throughout the manual any reference to pressing
a menu key refers to the keys directly below or
beside any menu icons or parameters.
Under
Compensation
Normal
Over
Compensation
How to Use This Manual
26
Page 29
GETTING STARTED
When the user manual says to “toggle” a value or
parameter, press the corresponding menu item.
Pressing the item will toggle the value or
parameter.
Active parameters are highlighted for each menu
item. For example in the example below, Coupling
is currently set to DC.
If a menu item can be toggled from one value or
parameter to another, the available options will be
visible, with the current option highlighted. In the
example below the slope can be toggled from a
rising slope to a falling slope or either slope.
Menu item
Parameter
Menu item
Active
parameter
Optional
parameters
Menu item
Selecting a Menu
Item, Parameter
or Variable
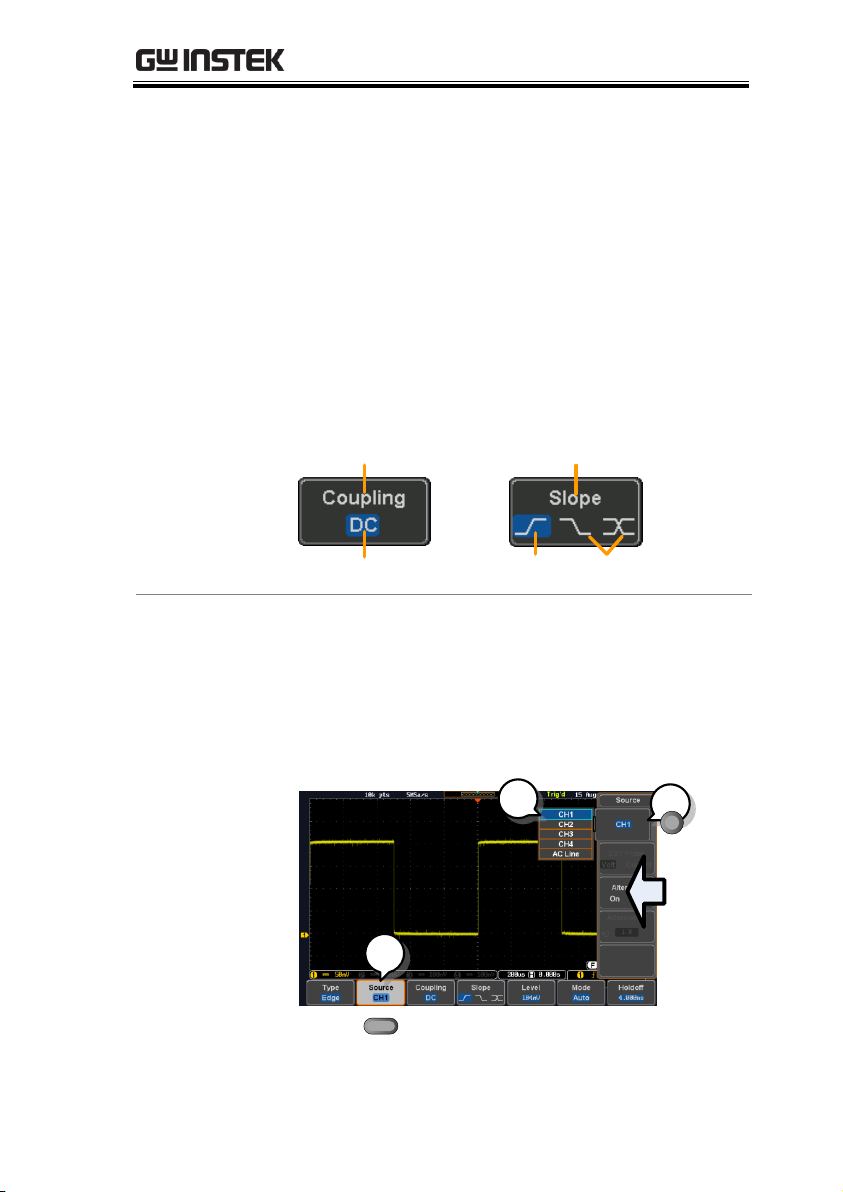
When the user manual says to “select” a value
from one of the side menu parameters, first press
the corresponding menu key and use the Variable
knob to either scroll through a parameter list or to
increase or decrease a variable.
Example 1
1
2
3
27
Page 30
MDO-2000A series User Manual
3. Press a bottom menu key to access
the side menu.
4. Press a side menu key to either set
a parameter or to access a sub
menu.
5. If accessing a sub menu or setting
a variable parameter, use the
Variable knob to scroll through
menu items or variables. Use the
Select key to confirm and exit. The
Select key is lit-up when such
selection can be made.
Select
VARIABLE
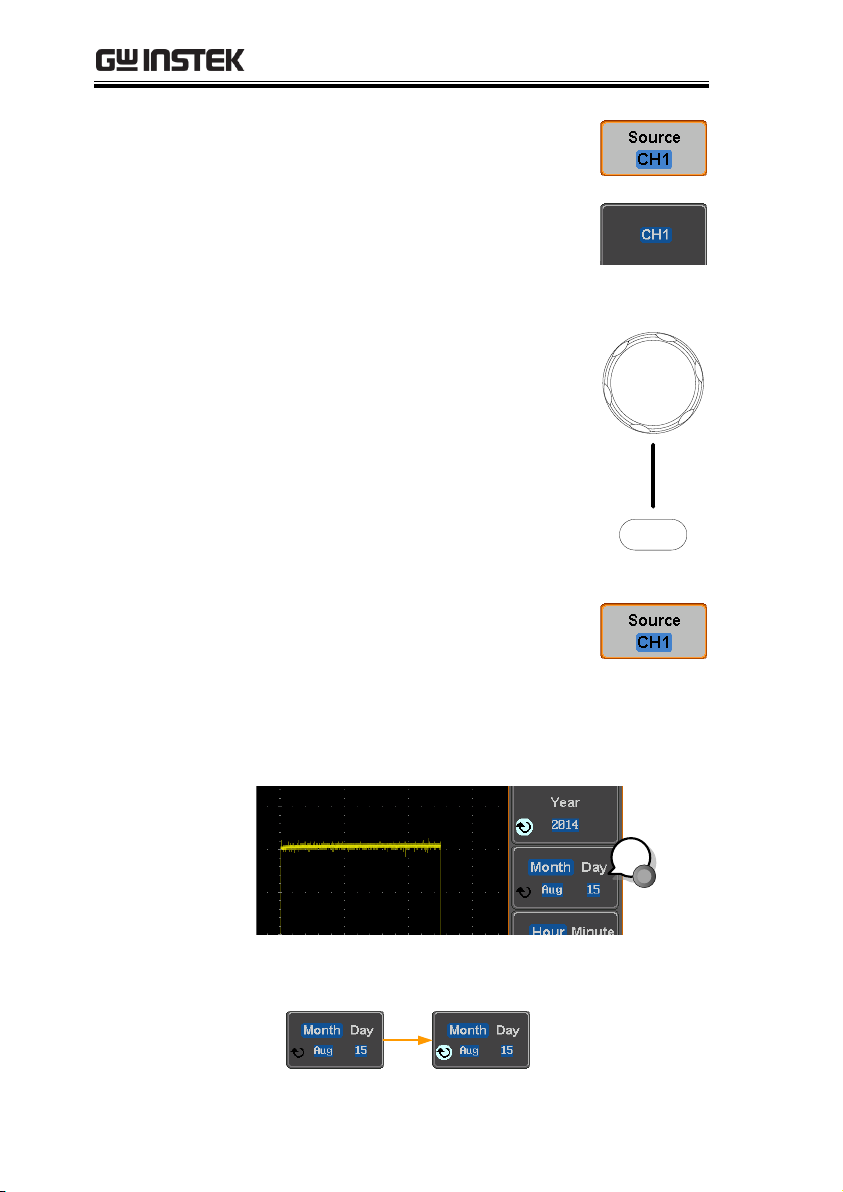
6. Press the same bottom menu key
again to reduce the side menu.
Example 2
For some variables, a circular arrow icon indicates
that the variable for that menu key can be edited
with the Variable knob.
1
7. Press the desired menu key to select it. The
circular arrow will become highlighted.
28
Page 31

GETTING STARTED
8. Use the Variable knob to edit the value.
Toggling a Menu
Parameter
1
9. Press the bottom menu key
to toggle the parameter.
Reduce Side
Menu
1
10. To reduce the side menu, press the
corresponding bottom menu that brought up
the side menu.
For example: Press the Source soft-key to
reduce the Source menu.
29
Page 32

MDO-2000A series User Manual
Reduce Lower
Menu
11. Press the relevant function
key again to reduce the
bottom menu. For example:
press the Trigger Menu key
to reduce the trigger menu.
POSITION
SCALE
TRIGGER
LEVEL
ZERO
PUSH TO
ZERO
PUSH TO
ZERO
SCALE
Test
Save/Recall
Acquire
Utility
Autoset
Run/Stop
Single
Default
Zoom
Menu
50 %
Force-Trig
1
Remove All
Menus
12. Press the Menu Off key to
reduce the side menu, press
again to reduce the bottom
menu.
VARIABLE
POSITION
HORIZONTAL
POSITION
POSITION
POSITION
POSITION
VERTICAL
MATH
REF
BUS
SCALE
TRIGGER
LEVEL
PUSH TO
ZERO
SCALESCALESCALE
PUSH TO
ZERO
PUSH TO
ZERO
PUSH TO
ZERO
PUSH TO
ZERO
PUSH TO
ZERO
SCALE
CH1 CH2 CH3 CH4
2V
Measure
Display
Cursor
Help
Test
Save/Recall
Acquire
Utility
Autoset
Run/Stop
Single
Default
Select
Search
Set/Clear
Zoom
CH1 CH2 CH3 CH4
M
R
B
Menu
50 %
Force-Trig
1
30
Page 33

GETTING STARTED
Remove OnScreen Messages
13. The Menu Off key can also be
used to remove any on
screen messages.
VARIABLE
POSITION
HORIZONTAL
POSITION
POSITION
POSITION
POSITION
VERTICAL
MATH
REF
BUS
SCALE
TRIGGER
LEVEL
PUSH TO
ZERO
SCALESCALESCALE
PUSH TO
ZERO
PUSH TO
ZERO
PUSH TO
ZERO
PUSH TO
ZERO
PUSH TO
ZERO
SCALE
CH1 CH2 CH3 CH4
2V
Measure
Display
Cursor
Help
Test
Save/Recall
Acquire
Utility
Autoset
Run/Stop
Single
Default
Select
Search
Set/Clear
Zoom
CH1 CH2 CH3 CH4
M
R
B
Menu
50 %
Force-Trig
1
31
Page 34

MDO-2000A series User Manual
Panel Operation
1. Press the Help key. The display
changes to Help mode.
Help
2. Use the Variable knob to scroll up and down
through the Help contents. Press Select to view
the help on the selected item.
Example: Help on
the Display key
Home Key
Press the Home key to return to the
main help screen.
Go Back
Press the Back key to go to the previous
menu page.
Exit
Press the Help key again or press the
Exit key to exit the Help mode.
Help
Built-in Help
The Help key accesses a context sensitive help menu. The help
menu contains information on how to use the front panel keys.
32
Page 35

MEASUREMENT
Basic Measurement ................................................... 34
Channel Activation ................................................................................. 34
Autoset ..................................................................................................... 35
Run/Stop ................................................................................................. 37
Horizontal Position/Scale .................................................................... 38
Vertical Position/Scale .......................................................................... 39
Automatic Measurement ............................................ 41
Measurement Items ................................................................................ 41
Add Measurement .................................................................................. 45
Remove Measurement ........................................................................... 46
Gated mode ............................................................................................. 47
Display All mode .................................................................................... 49
High Low Function ................................................................................ 50
Statistics .................................................................................................... 51
Reference Levels ..................................................................................... 53
Cursor Measurement ................................................. 55
Use Horizontal Cursors ......................................................................... 55
Use Vertical Cursors .............................................................................. 58
Math Operation ......................................................... 62
Basic Math Overview & Operators ..................................................... 62
Addition/Subtraction/Multiplication/Division ............................... 62
FFT Overview & Window Functions ................................................ 64
FFT Operation ........................................................................................ 65
Advanced Math Overview .................................................................... 67
Advanced Math Operation ................................................................... 68
MEASUREMENT
33
Page 36

MDO-2000A series User Manual
Activate Channel
To activate an input channel,
press a channel key.
When activated, the channel
key will light up. The
corresponding channel menu
will also appear.
CH1 CH1
Each channel is associated with the color shown
beside each channel’s vertical SCALE dial: CH1:
yellow, CH2: blue
When a channel is activated, it is shown above the
bottom menu system.
CH1 CH3CH2 CH4
Basic Measurement
This section describes the basic operations required in capturing,
viewing and measuring the input signal. For more detailed or more
specific operations, see the following chapters.
Advanced Configuration → from page 72
Arbitrary Wave Generator → from page 176
Spectrum Analyzer→ from page 210
Applications→ from page 228
Before operating the oscilloscope, please see the Getting Started
chapter, page 8.
Channel Activation
34
Page 37

De-activate
Channel
To de-activate a channel, press
the corresponding channel key
again. If the channel menu is
not open, press the channel key
twice (the first press shows the
Channel menu).
CH1 CH1
Default Setup
To activate the default state,
press Default (this will reset the
system and recall the factory
defaults, see page 285).
Default
Autoset
Background
The Autoset function automatically configures the
panel settings to position the input signal(s) to the
best viewing condition. The MDO-2000A Series
automatically configures the following parameters:
Horizontal scale
Vertical scale
Trigger source channel
There are two operating modes for the Autoset
function: Fit Screen Mode and AC Priority Mode.
Fit Screen Mode will fit the waveform to the best
scale, including any DC components (offset). AC
priority mode will scale the waveform to the
screen by removing any DC component.
Panel Operation
1. Connect the input signal to the
MDO-2000A series and press the
Autoset key.
Autoset
2. The waveform appears in the center of the
display.
MEASUREMENT
35
Page 38

MDO-2000A series User Manual
Before
After
3. To undo Autoset, press Undo
Autoset from the bottom menu.
Change modes
4. Choose between Fit Screen Mode
and AC Priority Mode from the
bottom menu.
5. Press the Autoset key again to use
Autoset in the new mode.
Autoset
Fit Screen Mode
AC Priority
Limitation
Autoset does not work in the following situations:
Input signal frequency is less than 20Hz
Input signal amplitude is less than 10mV
Note
The Autoset key does NOT automatically activate the
channels to which input signals are connected.
36
Page 39

Run/Stop
Background
By default, the waveform on the display is
constantly updated (Run mode). Freezing the
waveform by stopping signal acquisition (Stop
mode) allows flexible observation and analysis. To
enter Stop mode, two methods are available:
pressing the Run/Stop key or using the Single
Trigger mode.
Stop mode icon
When in Stop mode, the
Stop icon appears at the
top of the display.
Triggered icon
Freeze Waveform
using the
Run/Stop Key
Press the Run/Stop key once.
The Run/Stop key turns red.
The waveform and signal
acquisition freezes.
Stop:
Run/Stop Run/Stop
To unfreeze, press the Run/Stop
key again. The Run/Stop key
turns green again.
Run:
Run/Stop Run/Stop
Freeze Waveform
by Single Trigger
Mode
Press the Single key to go into
the Single Trigger mode. The
Single key turns bright white.
In the Single Trigger mode, the
scope will be put into the pretrigger mode until the scope
encounters the next trigger
point. After the scope has
triggered, it will remain in Stop
mode, until the Single key is
pressed again or the Run/Stop
key is pressed.
SingleSingle
Waveform
Operation
The waveform can be moved or scaled in both Run
and Stop mode, but in different manners. For
details, see page 97 (Horizontal position/scale)
and page 105 (Vertical position/scale).
MEASUREMENT
37
Page 40

MDO-2000A series User Manual
Set Horizontal
Position
The horizontal position knob
moves the waveform left and
right.
POSITION
PUSH TO
ZERO
Set Horizontal
Position to 0
Pressing the horizontal position
knob will reset the horizontal
position to 0.
POSITION
PUSH TO
ZERO
Alternatively, pressing the Acquire
key and then pressing Reset H
Position to 0s from the bottom menu
will also reset the horizontal position.
Acquire
As the waveform moves, the display bar on the top
of the display indicates the portion of the
waveform currently shown on the display and the
position of the horizontal marker on the
waveform.
Position Indicator
The horizontal position is shown at the bottom of
the display grid to the right of the H icon.
Select Horizontal
Scale
To select the timebase, turn the
horizontal SCALE knob; left (slow) or
right (fast).
SCALE
Horizontal Position/Scale
For more detailed configuration, see page 97.
38
Page 41

MEASUREMENT
Range
1ns/div ~ 100s/div, 1-2-5 increments
The scale is displayed to the left of the H icon at
the bottom of the screen.
Display bar
The display bar indicates how much
of the waveform is displayed on the
screen at any given time. Changes to
timebase will be reflected on the
display bar.
Fast
Medium
Slow
Stop mode
In the Stop mode, the waveform size
changes according to the scale.
Note
The Sample rate changes according to the timebase
and record length. See page 78.
Set Vertical
Position
To move the waveform up or down, turn
the vertical position knob for each channel.
POSITION
PUSH TO
ZERO
Vertical Position/Scale
For more detailed configuration, see page 105.
39
Page 42

MDO-2000A series User Manual
Push the vertical position knob to
reset the position to 0.
As the waveform moves, the
vertical position of the channel
indicator appears on the display.
POSITION
PUSH TO
ZERO
Run/Stop
mode
The waveform can be moved
vertically in both Run and Stop
mode.
Select Vertical
Scale
To change the vertical scale, turn
the vertical SCALE knob; left
(down) or right (up).
SCALE
Range
1mV/div ~ 10V/div
1-2-5 increments
The vertical scale indicator for
each channel on the bottom of
the display changes
accordingly.
40
Page 43

MEASUREMENT
V/I Measurements
Time Meas.
Delay Meas.
Overview
FPREShoot
RPREShoot
FOVShoot
ROVShoot
Cycle Area
Area
Cycle RMS
RMS
Cycle Mean
Mean
Low
High
Amplitude
Min
Max
Pk-Pk
Frequency
Dutycycle
-Width
+Width
FallTime
RiseTime
Period
-Edges
+Edges
-Pulses
+Pulses
% Flicker
Flicker Idx
A
B
(A-B)
(A+B)
A1
A1
A1+A2
A2
Voltage/Current
Measurement
Pk-Pk
(peak to
peak)
Difference between positive
and negative peak.
(=max − min)
Max
Positive peak.
Min
Negative peak.
FRR
FRF
FFR
Phase
LFF
LFR
LRF
LRR
FFF
Automatic Measurement
The automatic measurement function measures and updates major
items for Voltage/Current, Time, and Delay type measurements.
Measurement Items
41
Page 44

MDO-2000A series User Manual
Amplitude
Difference between the
global high value and the
global low value, measured
over the entire waveform or
gated region. (=high − low)
High
Global high voltage. See
page 50 for details.
Low
Global low voltage. See page
50 for details.
Mean
The arithmetic mean value is
calculated for all data
samples as specified by the
Gating option.
Cycle Mean
The arithmetic mean value is
calculated for all data
samples within the first cycle
found in the gated region.
RMS
The root mean square of all
data samples specified by the
Gating option.
Cycle RMS
The root mean square value
is calculated for all data
samples within the first cycle
found in the gated region.
Area
Measures the positive area of
the waveform and subtracts
it from the negative area. The
ground level determines the
division between positive
and negative areas.
Cycle Area
The Summation based on all
data samples within the first
cycle found in the gated
region.
ROVShoot
Rise overshoot
42
Page 45

MEASUREMENT
FOVShoot
Fall overshoot
RPREShoot
Rise preshoot
FPREShoot
Fall preshoot
Time
Measurement
Frequency
Frequency of the waveform.
Period
Waveform cycle time.
(=1/Freq)
RiseTime
The time required for the
leading edge of the first
pulse to rise from the low
reference value to the high
reference value.
FallTime
The time required for the
falling edge of the first pulse
to fall from the high
reference value to the low
reference value.
+Width
Positive pulse width.
–Width
Negative pulse width.
Duty Cycle
Ratio of signal pulse
compared with whole cycle.
=100x (Pulse Width/Cycle)
+Pulses
Measures the number of
positive pulses.
-Pulses
Measures the number of
negative pulses.
+Edges
Measures the number of
positive edges.
43
Page 46

MDO-2000A series User Manual
-Edges
Measures the number of
negative edges.
% Flicker
A
B
(A-B)
(A+B)
Ratio in percentage of the
peak-to-peak value to the
sum of peak values.
Flicker Idx
A1
A1
A1+A2
A2
Ratio of the area above the
average to the total area
during one cycle.
Delay
Measurement
FRR
Time between:
Source 1 first rising edge and
Source 2 first rising edge.
FRF
Time between:
Source 1 first rising edge and
Source 2 first falling edge.
FFR
Time between:
Source 1 first falling edge
and Source 2 first rising
edge.
FFF
Time between:
Source 1 first falling edge
and Source 2 first falling
edge.
LRR
Time between:
Source 1 first rising edge and
Source 2 last rising edge.
LFR
Time between:
Source 1 first rising edge and
Source 2 last falling edge.
LRF
Time between:
Source 1 first falling edge
and Source 2 last rising edge.
44
Page 47

MEASUREMENT
LFF
Time between:
Source 1 first falling edge
and Source 2 last falling
edge.
Phase
The phase difference of two
signals, calculated in
degrees.
360x
t2
t1
Note
The in-built help system can be used to see detailed
automatic measurement definitions.
Add
Measurement
Item
1. Press the Measure key.
Measure
2. Press Add Measurement from the
bottom menu.
3. Choose either a V/I, Time or Delay
measurement from the side menu
and choose the type of
measurement you wish to add.
V/I
(Voltage/
Current)
Pk-Pk, Max, Min, Amplitude, High,
Low, Mean, Cycle Mean, RMS,
Cycle RMS, Area, Cycle Area,
ROVShoot, FOVShoot, RPREShoot,
FPREShoot
Add Measurement
The Add Measurement function allows you to add up to eight
automatic measurement items on the bottom of the screen from any
channel source.
45
Page 48

MDO-2000A series User Manual
Time
Frequency, Period, RiseTime,
FallTime, +Width, –Width, Duty
Cycle, +Pulses, -Pulses, +Edges, Edges, %Flicker, FlickerIndex
Delay
FRR, FRF, FFR, FFF, LRR, LRF, LFR,
LFF, Phase
4. All of the chosen automatic measurements will
be displayed in a window on the bottom of the
screen. The channel number and channel color
indicate the measurement source.
For the analog inputs: yellow = CH1, blue =
CH2,
Choose a Source
The channel source for measurement items can be
set either before or when selecting a measurement
item.
5. To set the source, press either the
Source1 or Source2 key from the
side menu and choose the source.
Range
Source1: CH1~CH2, Math,
Source2: CH1~CH2, Math
Note
Source 2 is only applicable to Delay
measurements.
Remove Measurement
Individual measurements can be removed at any time using the
Remove Measurement function.
46
Page 49

MEASUREMENT
Remove
Measurement
Item
1. Press the Measure key.
Measure
2. Press Remove Measurement from the
bottom menu.
3. Press Select Measurement and select
the item that you want to remove
from the measurement list.
Remove All Items
Press Remove All to remove all the
measurement items.
Set Gating Mode
1. Press the Measure key.
Measure
2. Press Gating from the bottom
menu.
3. Choose one of the gating modes
from the side menu: Off (full
record), Screen, Between Cursors.
Gated mode
Some automatic measurements can be limited to a “gated” area
between cursors. Gating is useful for measuring a magnified
waveform or when using a fast time base. The Gated mode has
three possible configurations: Off (Full Record), Screen and
Between Cursors.
47
Page 50

MDO-2000A series User Manual
Cursors On
Screen
If Between Cursors is selected, the
cursor positions can be edited by
using the cursor menu.
Page 55
48
Page 51

MEASUREMENT
View
Measurement
Results
1. Press the Measure key.
Measure
2. Press Display All from the bottom
menu.
3. Press Source from the side menu
and choose a measurement source.
Range
CH1~CH2, Math
4. The results of Voltage and Time type
measurements appear on the display.
Remove
Measurements
To remove the measurement results,
press OFF.
Delay
Measurements
Delay type measurements are not available in this
mode as only one channel is used as the source.
Use the individual measurement mode (page 45)
instead.
Display All mode
Display All mode shows and updates all items from Voltage and
Time type measurements.
49
Page 52

MDO-2000A series User Manual
Background
The High-Low function is used to select the
method for determining the value of the High-Low
measurement values.
Auto
Automatically chooses the best
high-low setting for each
waveform when measuring.
Histogram
Uses histograms to determine the
high-low values. This mode
ignores any pre-shoot or
overshoot values. This mode is
particularly useful for pulse-type
waveforms
low
high
Min-max
Sets the high-low values as the
minimum or maximum measured
values.
low
high
Set High-Low
1. Press the Measure key.
Measure
2. Press High-Low from the bottom
menu.
High Low Function
50
Page 53

3. Select the type of High-Low settings from the
side menu.
High-Low Settings:
Histogram, Min-Max,
Auto
Restore Default
High-Low
Settings
To return to the default High-Low
settings, press Set to Defaults.
Statistics
Background
The Statistics function can be used to view a
number of statistics for the selected automatic
measurements. The following information is
displayed with the Statistics function:
Value
Currently measured value
Mean
The mean value is calculated from
a number of automatic
measurement results. The number
of samples used to determine the
mean can be user-defined.
Min
The minimum value observed
from a series of measured results
for the selected automatic
measurement items.
MEASUREMENT
51
Page 54

MDO-2000A series User Manual
Max
The maximum value observed
from a series of measured results
for the selected automatic
measurement items.
Standard
Deviation
The variance of the currently
measured value from the mean.
The standard deviation equals the
squared root of the variance value.
Measuring the standard deviation
can, for example, determine the
severity of jitter in a signal.
The number of samples used to
determine the standard deviation
can be user-defined.
Panel Operation
1. Press the Measure key.
Measure
2. Select at least one automatic
measurement.
Page 45
3. Press Statistics from the bottom
menu.
4. Set the number of samples to be
used in the mean and standard
deviation calculations.
Samples:
2~1000
5. Press Statistics and turn Statistics
on.
6. The statistics for each automatic measurement
will appear at the bottom of the display in a
table.
52
Page 55

MEASUREMENT
Reset Statistics
To reset the standard deviation
calculations, press Reset Statistics.
Background
The reference level settings determine the
measurement threshold levels for some
measurements like the Rise Time measurement.
High Ref: Sets the high reference
level.
Mid Ref: Sets the middle reference
for the first and second
waveforms.
Low Ref: Sets the low reference
level.
Panel Operation
1. Press the Measure key.
Measure
2. Press Reference Levels from the
bottom menu.
Reference Levels
53
Page 56

MDO-2000A series User Manual
3. Set the reference levels from the side menu.
Ensure the reference levels do not cross over.
High Ref
0.0% ~ 100%
Mid Ref
0.0% ~ 100%
0.0% ~ 100%
Low Ref
0.0% ~ 100%
Default Settings
4. Press Set to Defaults to set the
reference levels back to the default
settings.
54
Page 57

MEASUREMENT
Panel Operation
1. Press the Cursor key once.
Cursor
2. Press H Cursor from the bottom
menu if it is not already selected.
3. When the H Cursor is selected,
repeatedly pressing the H Cursor
key or the Select key will toggle
which cursor is selected.
OR
Select
Range
Description
Left cursor ( ) movable, right
cursor position fixed
Right cursor ( ) movable, left
cursor position fixed
Left and right cursor ( + )
movable together
4. The cursor position
information appears on the
top left hand side of the
screen
Cursor
Hor. position, Voltage/Current
Cursor
Hor. position, Voltage/Current
Delta (difference between cursors)
dV/dt or dI/dt
Cursor Measurement
Horizontal or vertical cursors are used to show the position and
values of waveform measurements and math operation results.
These results cover voltage, time, frequency and other math
operations. When the cursors (horizontal, vertical or both) are
activated, they will be shown on the main display unless turned off.
Use Horizontal Cursors
55
Page 58

MDO-2000A series User Manual
5. Use the Variable knob to move the
movable cursor(s) left or right.
VARIABLE
(Note)
The selected cursor(s) will move
along the active waveform. To
move along another waveform,
select its corresponding channel
and press the cursor key again to
re-enter the cursor menu.
Select Units
6. To change the units of the
horizontal position, press H Unit.
Units
S, Hz, % (ratio), ˚(phase)
Phase or Ratio
Reference
7. To set the 0% and 100% ratio or the
0˚ and 360˚ phase references for the
current cursor positions, press Set
Cursor Positions As 100%.
Example
Horizontal
cursors
56
Page 59

MEASUREMENT
FFT
FFT cursors can use different
units. For FFT details, see page
64.
Cursor
Hor. position, dB/Voltage
Cursor
Hor. Position, dB/Voltage
Delta (difference between cursors)
dV/dt or d/dt
Example
Horizontal
cursors
XY Mode
XY mode cursors measure a number of X by Y
measurements. See page 76.
Cursor
Time, rectangular, polar coordinates, product, ratio.
Cursor
Time, rectangular, polar coordinates, product, ratio.
Delta (difference between cursors)
57
Page 60

MDO-2000A series User Manual
Example
Horizontal
cursors
Panel Operation/
Range
1. Press the Cursor key twice.
Cursor
x2
2. Press V Cursor from the bottom
menu if it is not already selected.
3. When the V Cursor is selected,
repeatedly pressing the V Cursor
key or the Select key will toggle
which vertical cursor is selected.
OR
Select
Range
Upper cursor movable, lower
cursor position fixed
Lower cursor movable, upper
cursor position fixed
Upper and lower cursor movable
together
Use Vertical Cursors
58
Page 61

MEASUREMENT
4. The cursor position
information appears on the
top left hand side of the
screen.
,
Time: cursor 1, cursor 2
,
Voltage/Current: cursor1, cursor2
Delta (difference between cursors)
dV/dt or dI/dt
5. Use the Variable knob to move the
cursor(s) up or down.
VARIABLE
Select Units
6. To change the units of the vertical
position, press V Unit.
Units
Base (source wave units), % (ratio)
Base or Ratio
Reference
7. To set the 0% and 100% ratio
references for the current cursor
position, press Set Cursor Positions
As 100%.
Example
Horizontal
cursors
Vertical
cursors
59
Page 62

MDO-2000A series User Manual
FFT
FFT has different content. For
FFT details, see page 64.
,
Frequency/Time: cursor1, cursor2
,
dB/V: cursor1, cursor2
Delta (difference between cursors)
d/dt
Example
Horizontal
cursors
Vertical
cursors
XY Mode
XY mode cursors measure a number of X by Y
measurements. See page 76.
Cursor
Rectangular, polar co-ordinates,
product, ratio.
Cursor
Rectangular, polar co-ordinates,
product, ratio.
Delta (difference between cursors)
60
Page 63

MEASUREMENT
Example
Horizontal
cursors
Vertical
cursors
61
Page 64

MDO-2000A series User Manual
Background
The Math function performs basic math functions
(addition, subtraction, multiplication, division) on
the input signals or the reference waveforms. The
resultant waveform will be shown on the screen in
real-time.
Addition (+)
Adds the amplitude of two signals.
Source
CH1~2, Ref1~4
Subtraction (–)
Extracts the amplitude difference between two
signals.
Source
CH1~2, Ref1~4
Multiplication (×)
Multiplies the amplitude of two signals.
Source
CH1~2, Ref1~4
Division (÷)
Divides the amplitude of two signals.
Source
CH1~2, Ref1~4
Panel Operation
1. Press the Math key.
MATH
M
2. Press the Math key on the lower
bezel.
3. Select Source 1 from the side menu
Range
CH1~2, Ref1~4
Math Operation
Basic Math Overview & Operators
Addition/Subtraction/Multiplication/Division
62
Page 65

MEASUREMENT
4. Press Operator to choose the math
operation.
Range
+, -, ×, ÷
5. Select Source 2 from the side menu.
Range
CH1~2, Ref1~4
6. The math measurement result appears on the
display. The vertical scale of the math
waveform appears at the bottom of the screen.
From left: Math function, source1, operator,
source2, Unit/div
Example
Math
Source 2
Source 1
Position and Unit
To move the math waveform
vertically, press the Position key from
the side menu and use the Variable
knob to set the position.
Range
–12.00 Div ~ +12.00 Div
63
Page 66

MDO-2000A series User Manual
To change the unit/div settings, press
Unit/div, then use the Variable knob to
change the unit/div.
The units that are displayed depend
on which operator has been selected,
and whether the probe for the selected
channel has been set to voltage or
current.
Operator:
Unit/div:
Multiplication
Division
Addition/Subtraction
VV, AA or W
V/V, A/A
V or A
Turn Off Math
To turn off the Math result from the
display, press the Math key again.
MATH
M
Background
The FFT function performs a Fast Fourier
Transform on one of the input signals or the
reference waveforms. The resultant spectrum will
be shown on the screen in real-time. Four types of
window function are available: Hanning,
Hamming, Rectangular, and Blackman, as
described below.
Hanning
Frequency resolution
Good
Amplitude resolution
Not good
Suitable for....
Frequency measurement on
periodic waveforms
Hamming
Frequency resolution
Good
Amplitude resolution
Not good
FFT Overview & Window Functions
64
Page 67

Suitable for....
Frequency measurement on
periodic waveforms
Rectangular
Frequency resolution
Very good
Amplitude resolution
Bad
Suitable for....
Single-shot phenomenon
(this mode is the same as
having no window at all)
Blackman
Frequency resolution
Bad
Amplitude resolution
Very good
Suitable for....
Amplitude measurement on
periodic waveforms
(Note)
For more complete measures and functions in the
frequency domain of a signal, please also refer to
the Spectrum Analyzer section of the MDO-2000A
series on page 210.
FFT Operation
Panel Operation
1. Press the Math key.
MATH
M
2. Press FFT from the bottom menu.
3. Select the Source from the side
menu.
Range
CH1~2, Ref~4
4. Press the Vertical Units key from
the side menu to select the vertical
units used.
Range
Linear RMS, dBV RMS
MEASUREMENT
65
Page 68

MDO-2000A series User Manual
5. Press the Window key from the side
menu and select the window type.
Range
Hanning, Hamming, Rectangular,
and Blackman.
6. The FFT result represents the frequency-
domain representation of a signal. Hence, the
horizontal scale changes from time to
frequency, and the vertical scale from
voltage/current to dB/RMS.
Math
Source
Position and
Scale
To move the FFT waveform vertically,
press Vertical until the Div parameter
is highlighted and then use the
Variable knob.
Range
–12.00 Div ~ +12.00 Div
To select the vertical scale of the FFT
waveform, press Vertical until the dB
or voltage parameters are highlighted
and then use the Variable knob.
Range
2mV~1kV RMS (Linear RMS),
1~20 dB (dB VRMS)
66
Page 69

MEASUREMENT
Horizontal
Position and
Scale
To move the FFT waveform
horizontally, press Horizontal until the
Frequency parameter is highlighted
and then use the Variable knob.
Range
0Hz ~ half of the sampling
frequency
To select the horizontal scale of the
FFT waveform, press Horizontal
repeatedly until the Hz/div parameter
is highlighted and then use the
Variable knob.
Background
The advanced math function allows complex math
expressions to be created based on the input
sources, reference waveforms or even the
automatic measurements available from the
Measure menu (see page 41).
An overview of each of the major parameters that
can be used in the advanced math function are
shown below:
Expression
Displays the function expression as it is created.
Source
Selects the source signal.
Source
CH1~2, Ref1~4
Function
Adds a mathematical function to the expression.
Function
Intg, Diff, log, Ln, Exp, Sqrt, Abs,
Rad, Deg, Sin, Cos, Tan, Asin,
Acos, Atan
Variable
Adds a user-specified variable to the expression.
Source
CH1~2, Ref1~4
Advanced Math Overview
67
Page 70

MDO-2000A series User Manual
Operator
Adds an operator or parenthesis to the function
expression.
Operator
+, -, *, /, (, ), !(, <, >, <=, >=, ==, !=,
||, &&
Figure
Adds a value to the expression.
Figure
Integers, floating point, or floating
point with exponent values.
Measurement
Adds automatic measurements to the expression.
Not all automatic measurements are supported.
Measurement
Pk-Pk, Max, Min, Amp, High,
Low, Mean, CycleMean, RMS,
CycleRMS, Area, CycleArea,
ROVShoot, FOVShoot, Freq,
Period, Rise, Fall, PosWidth,
NegWidth, Dutycycle, FRR, FRF,
FFR, FFF, LRR, LRF, LFR, LFF,
Phase, RPRFShoot, FPREShoot,
+Pulses, -Pulses, +Edges, -Edges
Panel Operation
1. Press the Math key.
M
MATH
2. Press Advanced Math from the
bottom menu.
3. Press Edit Expression.
4. The Edit f(x) screen appears. CH1 + CH2 is
shown in the expression box as an example at
startup.
Advanced Math Operation
68
Page 71

MEASUREMENT
5. Press Clear to clear the expression
entry area.
6. Use the Variable knob and the Select
key to create an expression.
Use the Variable knob to highlight a
source, function, variable,
operator, figure or measurement in
orange.
Press the Select key to make the
selection.
If a particular parameter is grayed
out, it indicates that the particular
parameter is not available at that
time.
Select
VARIABLE
Back Space
7. To delete the last parameter press
Back Space.
8. When the expression is complete,
press OK Accept.
69
Page 72

MDO-2000A series User Manual
Example:
CH1 + CH2
Advanced Math
Source1
Source2
Set the VAR1 &
VAR2
9. Press VAR1 or VAR2 to set
VAR1/VAR2 if they were used in
the expression created previously.
10. Press Mantissa.
Use the Left and Right arrow keys
to select a digit and use the
variable knob to set the value of
the selected digit.
11. Press Exponent.
Use the Variable knob to set the
exponent of the variable.
12. Press Go Back to finish editing
VAR1 or VAR2.
Vertical Position
and Scale
13. Press Unit/div and use the Variable
knob to set the vertical scale of the
math waveform.
14. Press Position and use the Variable
knob to set the vertical position of
the math waveform on the display.
70
Page 73

MEASUREMENT
Clear Advanced
Math
To clear the advanced math result
from the display, press the Math key
again.
MATH
M
71
Page 74

MDO-2000A series User Manual
Acquisition ................................................................ 75
Select Acquisition Mode ........................................................................ 75
Show Waveform in XY Mode .............................................................. 76
Set the Record Length ........................................................................... 78
Segmented Memory Acquisition ................................ 80
Segments Display .................................................................................... 81
Set the Number of Segments ............................................................... 82
Run Segmented Memory ....................................................................... 83
Navigate Segmented Memory .............................................................. 85
Play Through Each Segment ................................................................ 85
Measurement on Segments ................................................................... 86
Segment Info ........................................................................................... 90
Display ....................................................................... 92
Display Waveform as Dots or Vectors ............................................... 92
Set the Level of Persistence .................................................................. 92
Set the Intensity Level ........................................................................... 93
Select Display Graticule ......................................................................... 94
Freeze the Waveform (Run/Stop) ....................................................... 95
Turn Off Menu ....................................................................................... 96
Horizontal View ......................................................... 97
Move Waveform Position Horizontally ............................................. 97
Select Horizontal Scale .......................................................................... 98
Select Waveform Update Mode ........................................................... 99
Zoom Waveform Horizontally .......................................................... 100
Play/Pause ............................................................................................. 102
Vertical View (Channel) ............................................ 105
Move Waveform Position Vertically ................................................. 105
Select Vertical Scale .............................................................................. 106
Select Coupling Mode .......................................................................... 106
Input Impedance .................................................................................. 107
Invert Waveform Vertically ................................................................ 107
ADVANCED
CONFIGURATION
72
Page 75

ADVANCED CONFIGURATION
Limit Bandwidth ................................................................................... 108
Expand by Ground/Center ................................................................ 109
Select Probe Type ................................................................................. 110
Select Probe Attenuation Level ......................................................... 111
Set the Deskew ..................................................................................... 111
Bus Key Configuration ..............................................113
Bus Display ............................................................................................ 113
Serial Bus Overview ............................................................................. 114
UART Serial Bus Configuration ........................................................ 116
I2C Serial Bus Interface ....................................................................... 118
CAN Serial Bus Interface .................................................................... 119
LIN Serial Bus Interface ..................................................................... 120
Bus Encoding ........................................................................................ 122
Threshold configuration ...................................................................... 122
Serial Bus Event Tables ....................................................................... 123
Event Tables Format ........................................................................... 126
Adding a Label to a Bus ...................................................................... 127
Using Cursors with the Serial Bus ..................................................... 129
Trigger ......................................................................131
Trigger Type Overview ....................................................................... 131
Trigger: types and sources................................................................... 133
Trigger Parameter Overview .............................................................. 133
Setup Holdoff Level............................................................................. 140
Setup Trigger Mode ............................................................................. 141
Using the Edge Trigger ....................................................................... 141
Using Advanced Delay Trigger .......................................................... 143
Using Pulse Width Trigger .................................................................. 144
Using Video Trigger ............................................................................. 145
Pulse Runt trigger ................................................................................. 147
Using Rise and Fall Trigger ................................................................ 148
Using the Timeout Trigger ................................................................. 150
Using the Bus Trigger .......................................................................... 151
UART BUS Trigger Settings ................................................................. 152
I2C Bus Trigger Settings ......................................................................... 153
CAN Bus Trigger ..................................................................................... 157
LIN Bus Trigger ...................................................................................... 159
Search.......................................................................162
Configuring Search Events ................................................................. 162
Copying Search Event To/From Trigger Events .......................... 164
Search Event Navigation..................................................................... 164
Save Search Marks ................................................................................ 165
Setting/Clearing Single Search Events ............................................. 166
FFT Peak................................................................................................ 167
73
Page 76

MDO-2000A series User Manual
System Settings and Miscellaneous Settings............ 171
Select Menu Language ......................................................................... 171
View System Information ................................................................... 171
Erase Memory ....................................................................................... 172
Set Date and Time ................................................................................ 173
Probe Compensation Frequency ....................................................... 173
QR Code Reader Function ................................................................. 174
74
Page 77

ADVANCED CONFIGURATION
Background
The acquisition mode determines how the samples
are used to reconstruct a waveform.
Sample
This is the default acquisition
mode. Every sample from each
acquisition is used.
Peak detect
Only the minimum and maximum
value pairs for each acquisition
interval (bucket) are used. This
mode is useful for catching
abnormal glitches in the signal.
Average
Multiple acquired data is
averaged. This mode is useful for
drawing a noise-free waveform.
To select the average number, use
the Variable knob.
Average number: 2, 4, 8, 16, 32, 64,
128, 256
Panel Operation
1. Press the Acquire key.
Acquire
2. To set the Acquisition mode, press
Mode on the bottom menu.
Acquisition
The Acquisition process samples the analog input signals and
converts them into digital format for internal processing.
Select Acquisition Mode
75
Page 78

MDO-2000A series User Manual
3. Select an acquisition mode from
the side menu.
4. If Average was chosen, set the
number of samples to be used for
the average function.
Mode
Sample, Peak Detect,
Average
Average
sample
2, 4, 8, 16, 32, 64, 128,
256
Example
Sample
Peak Detect
Average (256 times)
Background
The XY mode maps the input of channel 1 to the
input of channel 2.
Connection
1. Connect the signals to Channel 1
(X-axis) and Channel 2 (Y-axis)
CH2CH1
YX
Show Waveform in XY Mode
76
Page 79

ADVANCED CONFIGURATION
2. Make sure a channel pair is
active (CH1 & CH2). Press
the Channel key if necessary.
A channel is active if the
channel key is lit.
CH1 CH1
CH2 CH2
Panel Operation
3. Press the Acquire menu key.
Acquire
4. Press XY from the bottom menu.
5. Choose Triggered XY from the side
menu.
X-Y mode is split into two windows. The top window
shows the signals over the full time range. The bottom
window shows XY mode.
77
Page 80

MDO-2000A series User Manual
To move the XY waveform position, use the
vertical position knob: Channel 1 knob moves the
XY waveform horizontally and Channel 2 knob
moves the XY waveform vertically.
POSITION
CH1
POSITION
CH2
The horizontal position knob and horizontal Scale
knob can still be used under the XY mode.
Turn Off XY Mode
To turn off XY mode, choose OFF (YT)
mode.
Cursors and XY
Mode
Cursors can be used with XY mode.
See the Cursor chapter for details.
Page 55
Background
The number of samples that can be stored is set by
the record length. Record length is important in an
oscilloscope as it allows longer waveforms to be
recorded.
The maximum record length for the MDO-2000A
SERIES depends on operating mode. The table
below describes the record lengths that are
available for each mode.
Limitations
Record
Length
Normal
Zoom
FFT
FFT in Zoom
Window
1k
✓ ✗ ✓
✗
10k
✓ ✓ ✓
✓
Set the Record Length
78
Page 81

ADVANCED CONFIGURATION
100k
✓ ✓ ✓
✓
1M
✓ ✓ ✓
✓
10M
✓ ✓ ✗
✗
20M
✓ ✓ ✗
✗
Panel Operation
1. Press the Acquire key.
Acquire
2. Press the Record Length key on the
bottom menu and choose the
record length.
Record length
1000, 10k, 100k, 1M, 10M, 20M
points
Note
The sampling rate may also be changed when the
record length is changed.
79
Page 82

MDO-2000A series User Manual
Normal memory acquisition period Rearm time Next trigger
Segmented Memory Acquisition
The advanced segmented memory utility allows the scope memory
to be divided into different segments. Each time the scope is
triggered, it only acquires data for one segment of memory at a
time. This allows you to optimize the scope memory to only
perform signal acquisition during important signal events.
For example, for a signal with a number of pulses, normally the
oscilloscope will acquire the signal until the acquisition memory of
the scope is filled up and then it will re-arm the trigger and then
capture again. This could result in a number of events not being
captured or captured at a less-than-desired resolution (depending
on the horizontal scale and sampling rate). However, the
segmented memory function would effectively allow you to
capture more of the signal than you would otherwise. The
diagrams below illustrate this point.
Normal acquisition mode example:
80
Page 83

ADVANCED CONFIGURATION
SegmentnSegment
n+1
Segment
n+2
Segment
n+3
Segment
n+4
Segment
n+5
Run/Stop Indicator
Progress Indicator
Segmented memory acquisition example:
As shown above, the memory is divided into segments to increase
the number of events that can be effectively captured with the same
acquisition memory. Also notice that the scope doesn’t need to
rearm the trigger between each segment, this makes the segmented
memory function especially useful for high speed signals. The time
between each segment is also recorded so that accurate signal
timing can also be measured.
The segmented memory function also supports automatic
measurements for each segment or statistics for all the captured
segments.
The advanced Segment Memory Utility is available for both analog
and digital channels.
Segments Display
81
Page 84

MDO-2000A series User Manual
Progress Indicator
Indicates the number of segments that have to
been captured relative to the set number of
segments.
Run/Stop Indicator
Stop: The segments have finished
acquiring or have been stopped.
Run: The scope is ready to acquire
segments.
Note
Before the Segment function can be used, set the
trigger settings as appropriate for the signal you
wish to use. The number of segments that can be
used depends wholly on the record length. See
page 78 to set the record length.
Record length
Number of segments
1000 pt.
1 ~ 29000
10k pt.
1 ~ 2900
100k pt.
1 ~ 290
1M pt.
1 ~ 20
Panel Operation
1. Press the Acquire key.
Acquire
2. Press Segments on the bottom
menu.
3. Press Select Segments and set the
number of segments from the side
menu.
Num of Seg
1~29000 (record length
dependant)
Set to Maximum
Sets to the maximum number
Set the Number of Segments
82
Page 85

ADVANCED CONFIGURATION
Set to Minimum
Sets to 1 segment
Note
The Select Segments icon is only available when
Segments = OFF or when Segments is in the STOP
mode (see the section below).
Background
Before the Segmented Memory function can be
used, set the trigger settings as appropriate for the
signal you wish to use. See page 131 for
configuring the trigger settings.
Run Segments
1. Toggle Segments On from the bottom menu.
Note
The first time Segmented memory is turned on the
segments will automatically be run. Each segment
will be automatically captured.
2. The scope will automatically start acquiring
segments. The progress of the segmented
memory capture is shown in the Progress
Indicator.
3. The Run Indicator will be shown when in the
Run mode and the Segments icon will also
indicate that the function is in run mode.
Run Indicator
Progress Indicator
Segment (Run )icon
Run Segmented Memory
83
Page 86

MDO-2000A series User Manual
4. When the scope has finished acquiring
segments, press Segments Run to toggle the
mode to the Segments Stop mode.
Alternatively, the Run/Stop key can
be pressed.
Run/Stop
5. The Stop Indicator will be shown when in the
Stop mode.
Stop Indicator
Progress Indicator
Segment (Stop )icon
The scope is now ready to navigate or analyze the
acquired segments.
Rerun Segmented
Acquisition
6. To rerun the segments, press the Segments Stop
key to toggle the mode back to the Segments
Run mode.
Alternatively, press the Run/Stop
key again.
Run/Stop
7. Repeat steps 3 and 4 in the section above when
the segmented acquisition has completed.
84
Page 87

ADVANCED CONFIGURATION
Background
After the segmented memory acquisitions have
been captured you can navigate through each
segment one at a time.
Operation
1. Press Select Segments from the
bottom menu. This key will be
available in the Stop mode.
2. To navigate to the segment of
interest, press Current Seg from the
side menu and use the Variable
knob to scroll to the segment of
interest.
Alternatively, the Set to Minimum
and Set to Maximum keys can be
used to jump to the first and last
segment respectively.
3. The position in time of the selected
segment relative to the time of the
first segment is shown in the
Segments Time key.
Background
When all the segments have been acquired, the
play/pause key can be used to play back through
each segment.
Operation
1. Make sure the scope is in Segments Stop mode.
See page 83 for details.
Navigate Segmented Memory
Play Through Each Segment
85
Page 88

MDO-2000A series User Manual
2. Press the Play/Pause key to run
through the acquired segments in
numerical order.
Press the Play/Pause key again
to pause the playback.
When the scope has played
through to the last segment,
pressing the Play/Pause key
again will play through each
segment again in reverse order.
Background
The Segmented memory function can be used in
conjunction with the automatic measurements
configured in the Measurement menu (see page
41).
Please note that Digital channels measurements
cannot be used in conjunction with the segmented
memory.
Modes
Segments
Measure
This function will either perform
statistics calculations on the
segments or tabulate a list of the
measurement results for all the
segments.
Segments
Info
Provides configuration information
common for all the acquired memory
segments.
Segments
Measure
The Segments Measure function allows you to
view automatic measurements for the segments in
statistical bins or as a list displaying the result of
each automatic measurement.
Measurement on Segments
86
Page 89

ADVANCED CONFIGURATION
Statistics
This function will bin the
measurement results of a single
automatic measurement into a
user-defined number of bins.
This allows you to easily view
statistics for a large number of
segments. For example, the
statistics function will display
the number of results for each
bin and the measurement range
of each bin for the selected
automatic measurement.
Measurement
List
Puts all the measurement
results for a segment in a list.
All the currently selected
automatic measurement results
are listed. A maximum of 8
automatic measurements can be
used with this function.
Note
To use automatic measurements with the
segmented memory, automatic measurements
must first be selected from the Measure menu
before the segmented memory function is run.
Note that Digital channels cannot use this function.
Setup
Press the Measure key and select
any single source measurement
from the Add Measurement menu.
See page 45 for details on how to
add automatic measurements.
Measure
87
Page 90

MDO-2000A series User Manual
Operation
1. Press Analyze Segments from the
Segments menu.
Note: This key will only be available in
the Stop mode.
2. Press Segments Measure.
3. Select either the
statistics or the
measurement list from
the side menu.
Statistics
List
4. The statics table or measurement list appears on
the display.
Note that the more segments that you have, the
longer it will take to calculate the statics or list
the measurement results.
5. For statistic measurements,
press Plot Source to choose
which automatic
measurement to use for the
statistics calculations. The
statistics for only one
automatic measurement
can be viewed at a time.
6. For the measurement list, press
Source and select the source
channel for measurement.
Range
CH1 ~ CH2
88
Page 91

ADVANCED CONFIGURATION
Statistics Results
This function will bin the measurement results of
the selected automatic measurement into a userdefined number of bins.
Setup
7. To select the number of bins for the
statistics, press Divided by and
select the number of bins with the
Variable knob.
Range
1~20 bins
8. Press Select and use the Variable
knob to view the measurement
results for each bin.
89
Page 92

MDO-2000A series User Manual
Example:
Statistics
Statistics of currently
selected bin
Cursor/selected bin
Bin count
Measurement
List
Puts all the measurement results for a segment in a
list.
Setup
9. Press Select and use the variable
knob to scroll through each
segment.
Example:
Measurement
List
Select
cursor
Measurement results
Measurement types
Operation
1. Press Analyze Segments from the
bottom menu.
Note: This key will only be available in
the Stop mode.
Segment Info
90
Page 93

ADVANCED CONFIGURATION
2. Press Segments Info.
3. A table showing all general setting information
for the segmented memory acquisitions is
shown on the display.
Info:
Sample rate, Record length,
Horizontal, Vertical
91
Page 94

MDO-2000A series User Manual
Background
When the waveform is displayed on the screen, it
can be displayed as dots or vectors.
Panel Operation
1. Press the Display menu key.
Display
2. Press Dot / Vector to toggle between
Dot and Vector mode.
Range
Dots
Only the sampled dots are
displayed.
Vectors
Both the sampled dots and the
connecting line are displayed.
Example:
Vectors
Dots
Background
The persistence function allows the MDO-2000A
SERIES to mimic the trace of a traditional analog
oscilloscope. A waveform trace can be configured
to “persist” for a designated amount of time.
Panel Operation
1. Press the Display menu key.
Display
Display
The Display menu defines how the waveforms and parameters
appear on the main LCD display.
Display Waveform as Dots or Vectors
Set the Level of Persistence
92
Page 95

ADVANCED CONFIGURATION
2. To set the persistence time, press
the Persistence menu button on the
bottom bezel.
3. Use the Variable knob to select a
persistence time.
Time
16ms, 30ms, 60ms, 120ms, 240ms,
0.5s, 1s, 2s,~4s, Infinite, Off
Clear
To clear persistence, press Clear
Persistence.
Background
The intensity level of a signal can also be set to
mimic the intensity of an analog oscilloscope by
setting the digital intensity level.
Panel Operation
1. Press the Display menu key.
Display
2. Press Intensity from the bottom
menu.
Waveform
Intensity
3. To set the waveform intensity, press Waveform
Intensity and edit the intensity.
Range
0~100%
Example
Waveform Intensity 50%
Waveform Intensity 100%
Set the Intensity Level
93
Page 96

MDO-2000A series User Manual
Graticule
Intensity
4. To set the graticule intensity, press Graticule
Intensity from the side menu and edit the
intensity value.
Range
10~100%
Example
Graticule Intensity 100%
Graticule Intensity 10%
Backlight
Intensity
5. To set the LCD backlight intensity, press
Backlight Intensity from the side menu and edit
the intensity value.
Range
2~100%
Backlight AutoDim
6. To automatically dim the backlight after a set
duration, set Backlight Auto-Dim to On and then
set Time to the appropriate time.
After the set amount of time with no panel
activity, the screen will dim until a panel key is
pressed again. This function will prolong the
life of the LCD display.
Range
1~180 min
Panel Operation
1. Press the Display menu key.
Display
2. Press Graticule from the bottom
menu.
Select Display Graticule
94
Page 97

ADVANCED CONFIGURATION
3. From the side menu choose the
graticule display type.
Full
: Shows the full grid; X and Y axis
for each division.
Grid
: Show the full grid without the X
and Y axis.
Cross Hair
: Shows only the center X
and Y frame.
Frame
: Shows only the outer frame.
Panel Operation
1. Press the Run/Stop key. The
Run/Stop key turns red and
waveform acquisition is
paused.
Run/Stop Run/Stop
2. The waveform and the trigger
freezes. The trigger indicator on
the top right of the display shows
Stop.
3. To unfreeze the waveform,
press the Run/Stop key
again. The Run/Stop key
turns green again and
acquisition resumes.
Run/Stop Run/Stop
Freeze the Waveform (Run/Stop)
For more details about Run/Stop mode, see page 37.
95
Page 98

Turn Off Menu
Panel Operation
1. Press the Menu Off key
below the side menu keys to
reduce a menu. The menu
key needs to be pressed
each time to reduce one
menu.
See page 26 for more
information.
VARIABLE
POSITION
HORIZONTAL
POSITION
POSITION
POSITION
POSITION
VERTICAL
MATH
REF
BUS
SCALE
TRIGGER
LEVEL
PUSH TO
ZERO
SCALESCALESCALE
PUSH TO
ZERO
PUSH TO
ZERO
PUSH TO
ZERO
PUSH TO
ZERO
PUSH TO
ZERO
SCALE
Measure
Display
Cursor
Help
Test
Save/Recall
Acquire
Utility
Autoset
Run/Stop
Single
Default
Select
Search
Set/Clear
Zoom
CH1 CH2 CH3 CH4
M
R
B
Menu
50 %
MDO-2000A series User Manual
96
Page 99

ADVANCED CONFIGURATION
Panel Operation
The horizontal position knob moves
the waveform left/right.
POSITION
PUSH TO
ZERO
As the waveform moves, a position indicator on
the top of the display indicates the horizontal
position of the waveform in memory.
Reset Horizontal
Position
1. To reset the horizontal position,
press the Acquire key and then
press Reset H Position to 0s from the
bottom menu.
Alternatively, pushing the
horizontal position knob will also
reset the position to zero.
Acquire
POSITION
PUSH TO
ZERO
Run Mode
In Run mode, the memory bar keeps its relative
position in the memory since the entire memory is
continuously captured and updated.
Horizontal View
This section describes how to set the horizontal scale, position, and
waveform display mode.
Move Waveform Position Horizontally
97
Page 100

MDO-2000A series User Manual
Select Horizontal
Scale
To select the timebase (time/div), turn
the horizontal Scale knob; left (slow)
or right (fast).
SCALE
Range
1ns/div ~ 100s/div, 1-2-5 increment
The timebase indicator updates as the horizontal
scale is adjusted.
Horizontal
position
Timebase
Run Mode
In Run mode, the memory bar and waveform size
keep their proportion. When the timebase becomes
slower, roll mode is activated (if the trigger is set
to Auto).
Stop Mode
In Stop mode, the waveform size changes
according to the scale.
Select Horizontal Scale
98
 Loading...