

Page 1
iControl Edge Version 1.20
Operator’s Overview
Part Number: M867-0700-101 18 November 2009
Page 2

Copyright Notice
Copyright © 2009 Miranda Technologies Inc. All rights reserved.
ATTENTION: please read the following terms and conditions carefully. By using iControl Edge
documentation, you agree to the following terms and conditions:
Miranda Technologies Inc. hereby grants permission and license to owners of iControl Edge to use
their product manuals for their own internal business use. Manuals for Miranda Technologies Inc.
products may not be reproduced or transmitted in any form or by any means, electronic or
mechanical, including photocopying and recording, for any purpose unless specifically authorized
in writing by Miranda Technologies Inc.
A Miranda Technologies Inc. manual may have been revised to reflect changes made to the
product during its manufacturing life. Thus, different versions of a manual may exist for any given
product. Care should be taken to ensure that one obtains the proper manual version for a specific
product serial number.
Information in this document is subject to change without notice and does not represent a
commitment on the part of Miranda Technologies Inc.
Warranty Policies
Warranty information is available in the Support section of the Miranda Web site
(www.miranda.com).
Title iControl Edge Version 1.20 Operator’s Overview
Part Number M867-0700-101
Revision November 18, 2009 4:47 pm
Page 3

Table of Contents
1 Introduction to iControl Edge 1
Overview . . . . . . . . . . . . . . . . . . . . . . . . . . . . . . . . . . . . . . . . . . . . . . . . . . . . . . . . . . . . . . . . . . . . . . . . . . . . . . . . . . . . . . . . . . . . . . . . . . . . . . 1
Operational Overview . . . . . . . . . . . . . . . . . . . . . . . . . . . . . . . . . . . . . . . . . . . . . . . . . . . . . . . . . . . . . . . . . . . . . . . . . . . . . . . . . . . . . . 3
User Interface. . . . . . . . . . . . . . . . . . . . . . . . . . . . . . . . . . . . . . . . . . . . . . . . . . . . . . . . . . . . . . . . . . . . . . . . . . . . . . . . . . . . . . . . . . . . . 3
Reference Material . . . . . . . . . . . . . . . . . . . . . . . . . . . . . . . . . . . . . . . . . . . . . . . . . . . . . . . . . . . . . . . . . . . . . . . . . . . . . . . . . . . . . . . . . . . . . . 6
2 iControl Edge Web Monitoring 9
Overview of the Monitoring Web Page . . . . . . . . . . . . . . . . . . . . . . . . . . . . . . . . . . . . . . . . . . . . . . . . . . . . . . . . . . . . . . . . . . . . . . . . . . . . . 9
Monitoring Web Page Elements . . . . . . . . . . . . . . . . . . . . . . . . . . . . . . . . . . . . . . . . . . . . . . . . . . . . . . . . . . . . . . . . . . . . . . . . . . . . . . . . . 12
Channel Selector . . . . . . . . . . . . . . . . . . . . . . . . . . . . . . . . . . . . . . . . . . . . . . . . . . . . . . . . . . . . . . . . . . . . . . . . . . . . . . . . . . . . . . . . . 13
Audible Alarm Buttons . . . . . . . . . . . . . . . . . . . . . . . . . . . . . . . . . . . . . . . . . . . . . . . . . . . . . . . . . . . . . . . . . . . . . . . . . . . . . . . . . . . . 14
Alarm Panels . . . . . . . . . . . . . . . . . . . . . . . . . . . . . . . . . . . . . . . . . . . . . . . . . . . . . . . . . . . . . . . . . . . . . . . . . . . . . . . . . . . . . . . . . . . . 14
Audio Mute Button . . . . . . . . . . . . . . . . . . . . . . . . . . . . . . . . . . . . . . . . . . . . . . . . . . . . . . . . . . . . . . . . . . . . . . . . . . . . . . . . . . . . . . . 17
Frame Rate Button . . . . . . . . . . . . . . . . . . . . . . . . . . . . . . . . . . . . . . . . . . . . . . . . . . . . . . . . . . . . . . . . . . . . . . . . . . . . . . . . . . . . . . . 17
Configure Button . . . . . . . . . . . . . . . . . . . . . . . . . . . . . . . . . . . . . . . . . . . . . . . . . . . . . . . . . . . . . . . . . . . . . . . . . . . . . . . . . . . . . . . . . 18
Clock . . . . . . . . . . . . . . . . . . . . . . . . . . . . . . . . . . . . . . . . . . . . . . . . . . . . . . . . . . . . . . . . . . . . . . . . . . . . . . . . . . . . . . . . . . . . . . . . . . . 18
Application Selector . . . . . . . . . . . . . . . . . . . . . . . . . . . . . . . . . . . . . . . . . . . . . . . . . . . . . . . . . . . . . . . . . . . . . . . . . . . . . . . . . . . . . . 18
Remote . . . . . . . . . . . . . . . . . . . . . . . . . . . . . . . . . . . . . . . . . . . . . . . . . . . . . . . . . . . . . . . . . . . . . . . . . . . . . . . . . . . . . . . . . . . . . . . . . 19
DVR Recording Mode Buttons . . . . . . . . . . . . . . . . . . . . . . . . . . . . . . . . . . . . . . . . . . . . . . . . . . . . . . . . . . . . . . . . . . . . . . . . . . . . . . 20
DVR Info Panel . . . . . . . . . . . . . . . . . . . . . . . . . . . . . . . . . . . . . . . . . . . . . . . . . . . . . . . . . . . . . . . . . . . . . . . . . . . . . . . . . . . . . . . . . . . 20
Multi-Channel Monitoring Area . . . . . . . . . . . . . . . . . . . . . . . . . . . . . . . . . . . . . . . . . . . . . . . . . . . . . . . . . . . . . . . . . . . . . . . . . . . . 21
Alarm Browser . . . . . . . . . . . . . . . . . . . . . . . . . . . . . . . . . . . . . . . . . . . . . . . . . . . . . . . . . . . . . . . . . . . . . . . . . . . . . . . . . . . . . . . . . . . 22
Log Viewer . . . . . . . . . . . . . . . . . . . . . . . . . . . . . . . . . . . . . . . . . . . . . . . . . . . . . . . . . . . . . . . . . . . . . . . . . . . . . . . . . . . . . . . . . . . . . . 23
Service-Specific Log Viewer . . . . . . . . . . . . . . . . . . . . . . . . . . . . . . . . . . . . . . . . . . . . . . . . . . . . . . . . . . . . . . . . . . . . . . . . . . . . . . . . 24
Reports . . . . . . . . . . . . . . . . . . . . . . . . . . . . . . . . . . . . . . . . . . . . . . . . . . . . . . . . . . . . . . . . . . . . . . . . . . . . . . . . . . . . . . . . . . . . . . . . . 26
Navigator . . . . . . . . . . . . . . . . . . . . . . . . . . . . . . . . . . . . . . . . . . . . . . . . . . . . . . . . . . . . . . . . . . . . . . . . . . . . . . . . . . . . . . . . . . . . . . . 28
Menus . . . . . . . . . . . . . . . . . . . . . . . . . . . . . . . . . . . . . . . . . . . . . . . . . . . . . . . . . . . . . . . . . . . . . . . . . . . . . . . . . . . . . . . . . . . . . . . . . . . . . . . 29
Alarm Action Menu . . . . . . . . . . . . . . . . . . . . . . . . . . . . . . . . . . . . . . . . . . . . . . . . . . . . . . . . . . . . . . . . . . . . . . . . . . . . . . . . . . . . . . . 29
Global Menu. . . . . . . . . . . . . . . . . . . . . . . . . . . . . . . . . . . . . . . . . . . . . . . . . . . . . . . . . . . . . . . . . . . . . . . . . . . . . . . . . . . . . . . . . . . . . 30
Player Menu . . . . . . . . . . . . . . . . . . . . . . . . . . . . . . . . . . . . . . . . . . . . . . . . . . . . . . . . . . . . . . . . . . . . . . . . . . . . . . . . . . . . . . . . . . . . . 32
Detailed Directions . . . . . . . . . . . . . . . . . . . . . . . . . . . . . . . . . . . . . . . . . . . . . . . . . . . . . . . . . . . . . . . . . . . . . . . . . . . . . . . . . . . . . . . . . . . . . 33
iii
Page 4

toc
Viewing the Application Selector . . . . . . . . . . . . . . . . . . . . . . . . . . . . . . . . . . . . . . . . . . . . . . . . . . . . . . . . . . . . . . . . . . . . . . . . . . . 33
Controlling Set-Top Boxes and DVRs from a Soft Remote . . . . . . . . . . . . . . . . . . . . . . . . . . . . . . . . . . . . . . . . . . . . . . . . . . . . . . . 34
Configuring Probes . . . . . . . . . . . . . . . . . . . . . . . . . . . . . . . . . . . . . . . . . . . . . . . . . . . . . . . . . . . . . . . . . . . . . . . . . . . . . . . . . . . . . . . 38
Configuring an Allégro System from the Detail View . . . . . . . . . . . . . . . . . . . . . . . . . . . . . . . . . . . . . . . . . . . . . . . . . . . . . . . . . . . 39
Disabling Alarms . . . . . . . . . . . . . . . . . . . . . . . . . . . . . . . . . . . . . . . . . . . . . . . . . . . . . . . . . . . . . . . . . . . . . . . . . . . . . . . . . . . . . . . . . 40
Snoozing Alarms . . . . . . . . . . . . . . . . . . . . . . . . . . . . . . . . . . . . . . . . . . . . . . . . . . . . . . . . . . . . . . . . . . . . . . . . . . . . . . . . . . . . . . . . . 44
Scheduling Operational Mode Changes . . . . . . . . . . . . . . . . . . . . . . . . . . . . . . . . . . . . . . . . . . . . . . . . . . . . . . . . . . . . . . . . . . . . . . 49
Appendix A: Glossary 55
Contact Us! 57
iv
Page 5

Introduction to iControl Edge
iControl Edge enables television service providers to cost-effectively monitor hundreds of
television signals spread across multiple remote locations, using remotely controlled set-
top boxes and receiver/decoders. It consists of a suite of existing Miranda products that
have been specifically packaged into an “off-the-shelf” monitoring solution.
Summary
Overview . . . . . . . . . . . . . . . . . . . . . . . . . . . . . . . . . . . . . . . . . . . . . . . . . . . . . . . . . . . . . . . . . . . . . . . . . . . . 1
Operational Overview . . . . . . . . . . . . . . . . . . . . . . . . . . . . . . . . . . . . . . . . . . . . . . . . . . . . . . . . . . . . . . . . . 3
User Interface . . . . . . . . . . . . . . . . . . . . . . . . . . . . . . . . . . . . . . . . . . . . . . . . . . . . . . . . . . . . . . . . . . . . . . . . 3
Reference Material . . . . . . . . . . . . . . . . . . . . . . . . . . . . . . . . . . . . . . . . . . . . . . . . . . . . . . . . . . . . . . . . . . . . 6
Overview
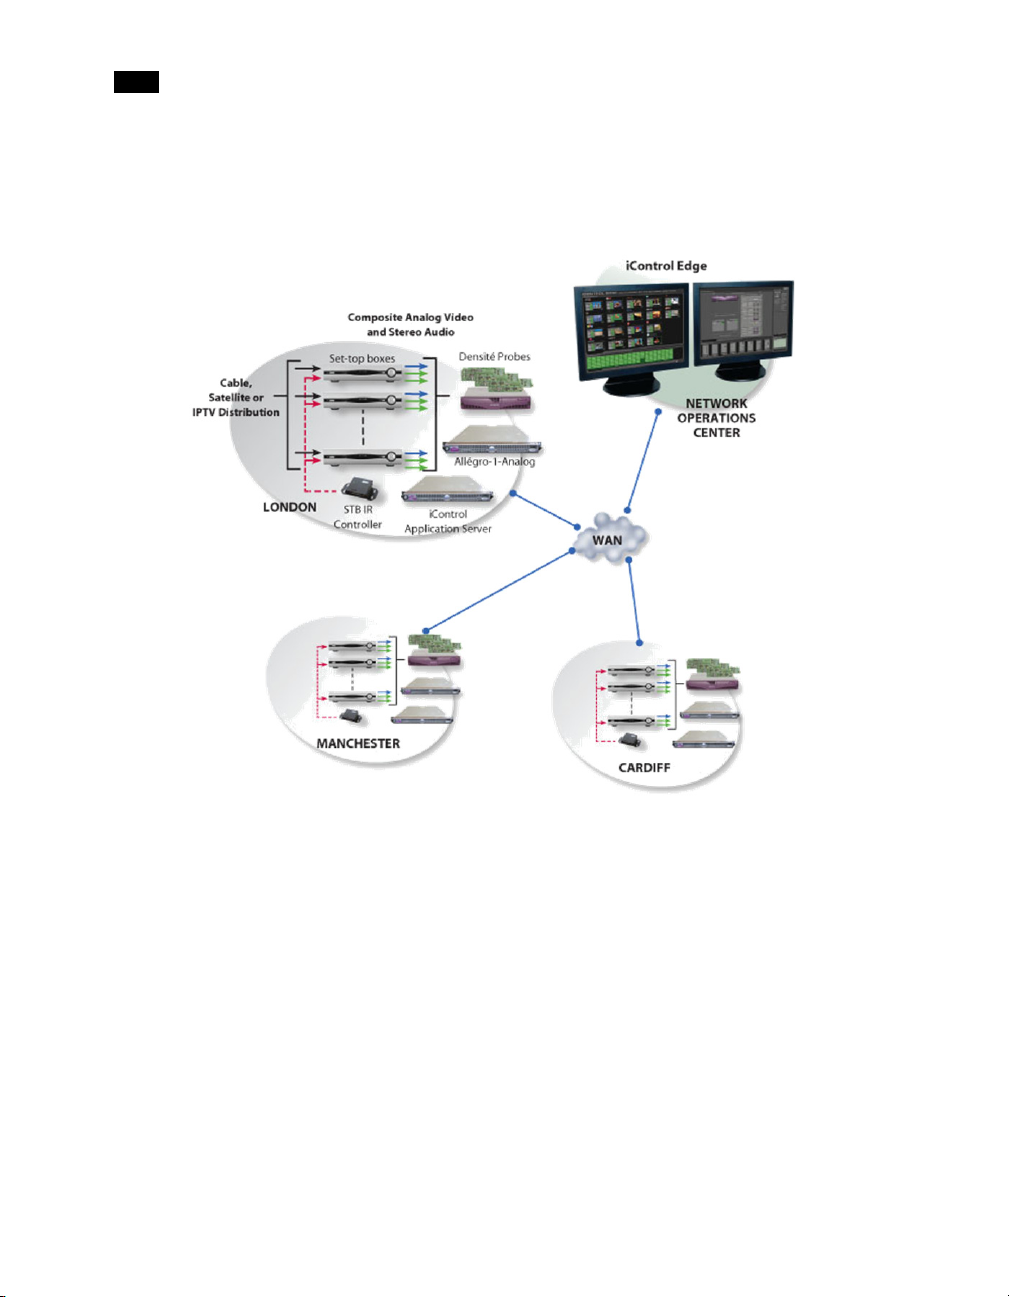
An iControl Edge system is a combination of various quantities and models of Miranda iControl, Allégro
(optional), and Densité products as well as third-party set-top box infrared interface units. At each remote
head-end, the set-top box signals are fed into Densité control probes or to an Allégro-1 Analog encoder/
server. The signals are then streamed back to the Network Operations Center’s iControl Edge monitoring
system. The iControl Edge system can be easily expanded to offer set-top box monitoring of up to 16 head
ends from a central Network Operations Center.
Combining the flexibility of iControl Web and the advanced processing and alarm capabilities of Densité
probes, iControl Edge allows any television service provider to perform comprehensive monitoring by
exception of all its important video and audio signals. Using LAN and WAN connectivity, iControl Edge
allows complete monitoring of multiple signals, across wide geographical areas.
1
Page 6
11
Introduction to iControl Edge
The system can include one or more Allégro encoders for streaming remote signals in the form of fullmotion video and audible audio. This allows operators, from their desktop, to listen to audio programs and
to view high-quality video streams featuring multiple video images, closed captioning, audio level meters
and metadata.
As a multi-signal monitoring system, iControl Edge performs simultaneous verification on multiple remote,
multi-format video, audio and ancillary signals from set-top boxes, while cycling through channels. The
system provides signal probing on an extensive set of signal parameters, including:
• video signal loss
•video black
• video freeze
• video luma
• macroblocking (optional)
•audio silence
• audio overload
In the event of a signal fault, the system generates alarms and provides telemetry information, which is
automatically logged for reports.
2
Page 7
Operational Overview
Customizable elements (e.g. station names, signal paths) are stored in spreadsheets that can be edited
using the Microsoft® Excel® spreadsheet software. By adding elements to (or removing them from) a
spreadsheet, you can dynamically update your monitoring system.
Operational Overview
The diagram below shows the relationship between the elements of an iControl Edge system, and how they
work together to provide real-time monitoring of signals.
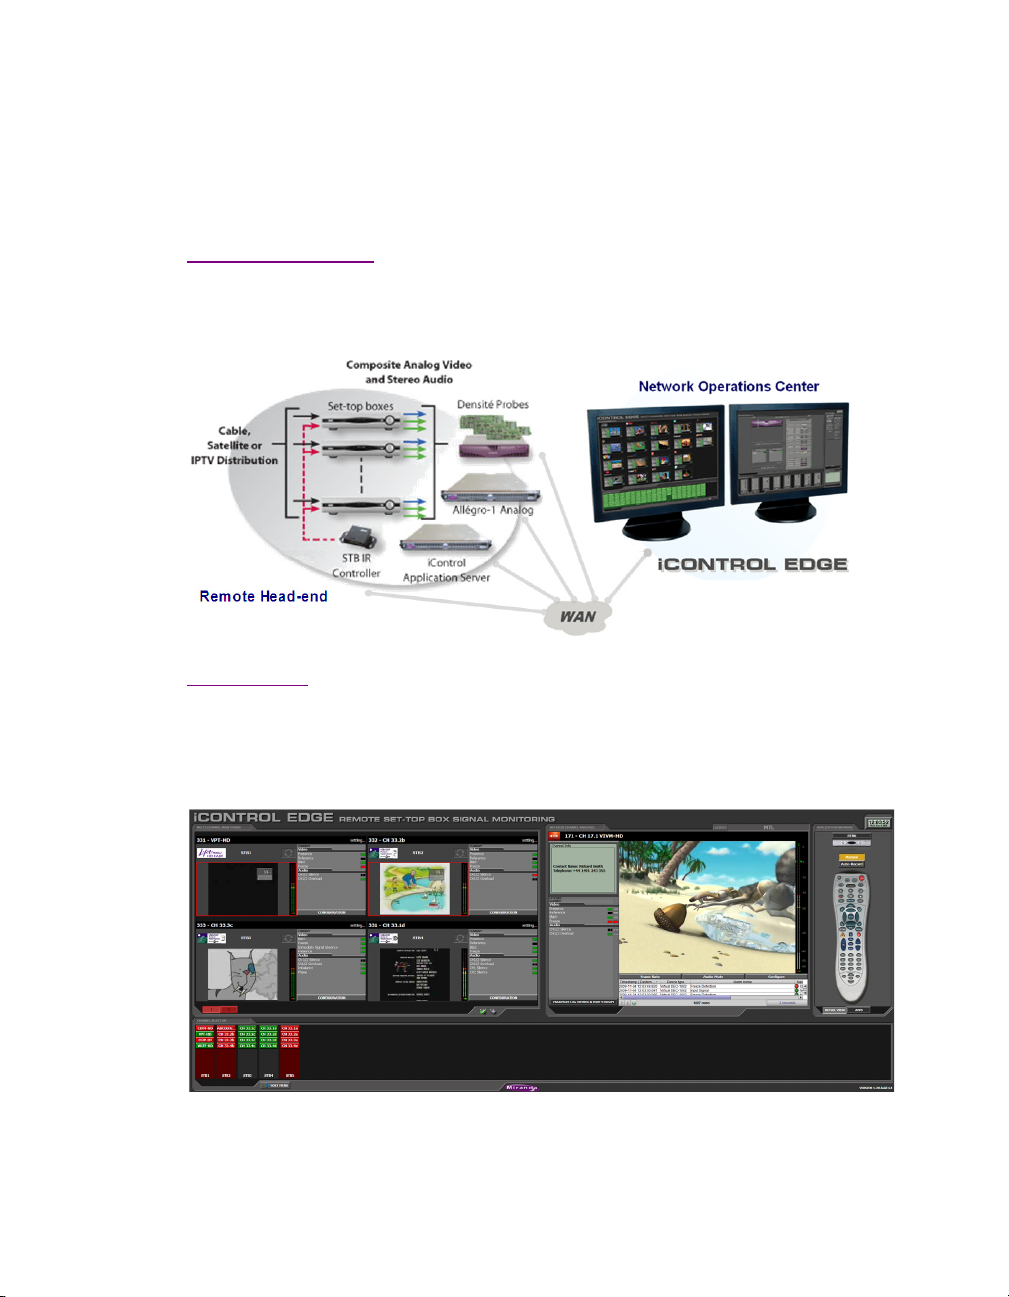
User Interface
Once the iControl Edge system is up and running, monitoring data and live audio/video streams are
automatically presented to operators within a Web page. The operator has easy access to current and
historical information on every device and signal being monitored.
iControl Edge user interface (initial view)
3
Page 8
11
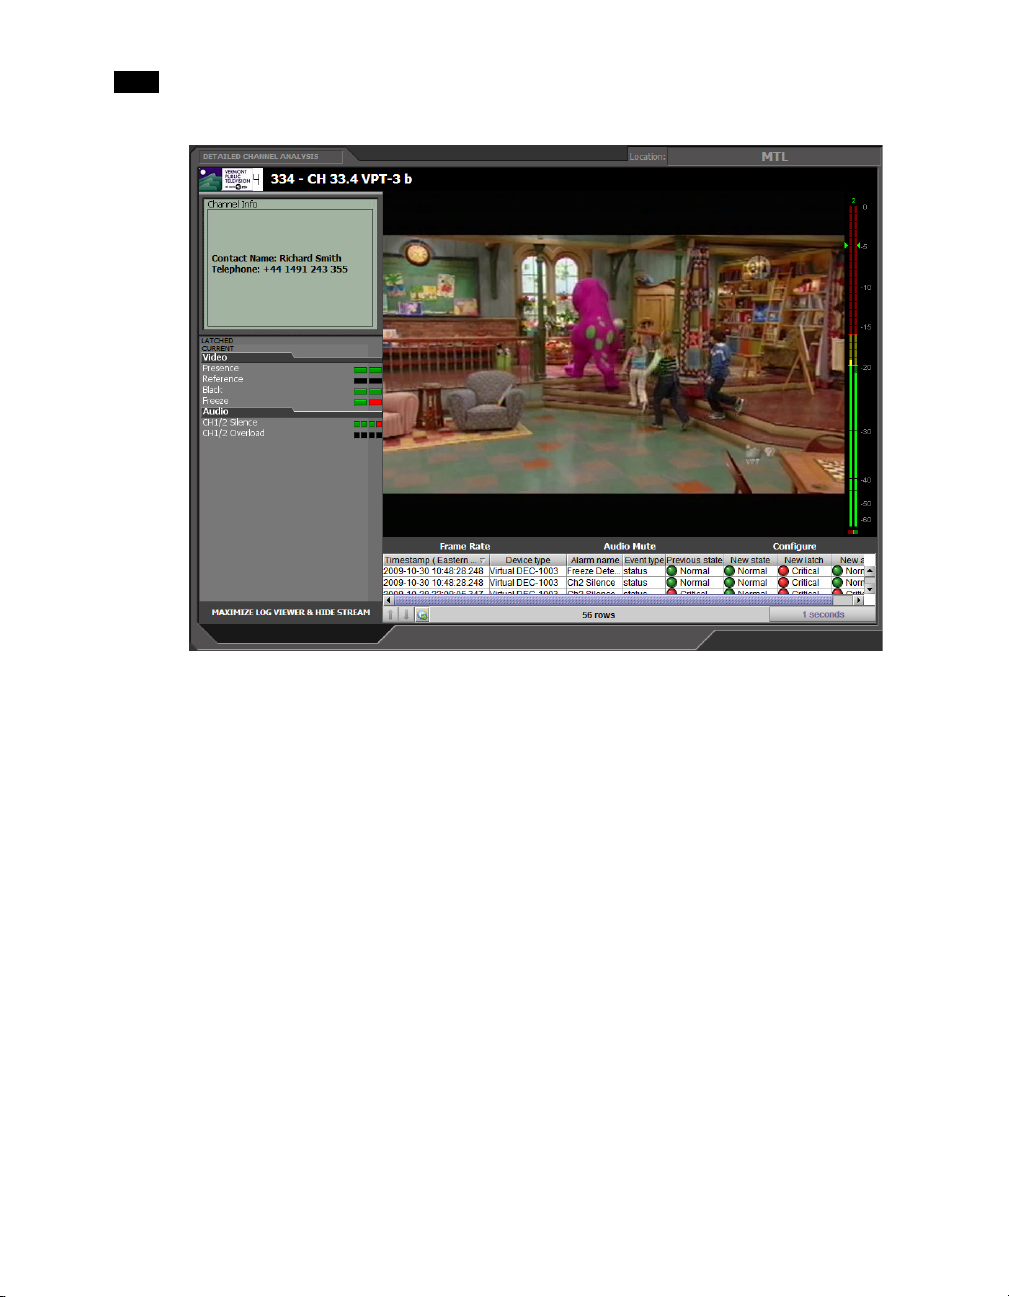
Introduction to iControl Edge
iControl Edge user interface (Detailed Channel Analysis area)
4
Page 9
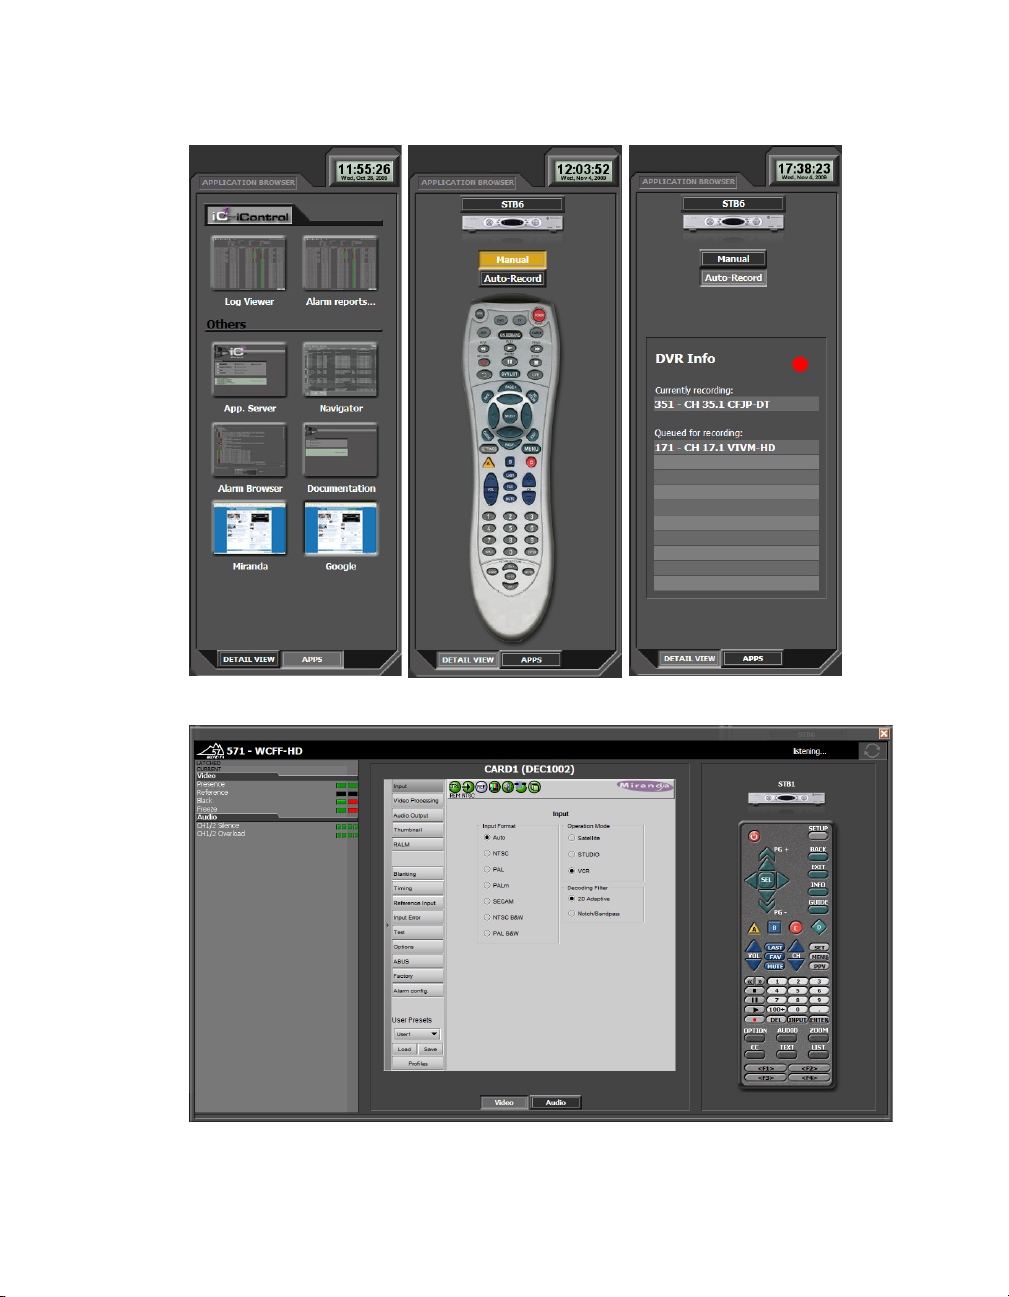
User Interf ace
iControl Edge user interface (Application Browser area: Application Selector, Soft Remote, and DVR Info)
iControl Edge user interface (probe configuration window, with detailed alarm panel and soft remote)
5
Page 10

11
Introduction to iControl Edge
Reference Material
The table below contains a list of some of the documentation available with your iControl Edge system.
Each device also ships with a set of release notes that contain important information.
Part number Description
M867-0602-101 iControl Edge Installation & Setup Guide
M867-0700-101 iControl Edge Operator’s Overview
M659-9900-100 Densité CPU-ETH2 Enhanced Ethernet Controller Card
M262-9900-101 Densité Housing Frame
-OR-
M844-9900-100 Densité3 Housing Frame
— Global Caché GC-IRL IR Learner Quick Start Guide
— Global Caché GC-100-12 Network Adapter Quick Start Guide
Guide to Installation and Operation
Guide to Installation and Operation
Guide to Installation and Operation
1
1
M226-9900-270 iControl User’s Guide
(available by clicking the Documentation link on the iControl Startup Page)
— iControl v3.X User’s Guide [PRELIMINARY]
(available by clicking the Documentation link on the iControl Startup Page)
M719-9900-280 Miranda Allégro-1 User Guide
(available from the Allégro Startup page)
1. Available from the “Support Documents and Files” section of Global Caché’s Web site
(see http://www.globalcache.com/support/support_docs.html)
6
Page 11

Reference Material
You may also need to refer to the documentation received with the set of Densité probes you ordered for
your monitoring purposes.
Video probe Audio probe
Part number Description Part number Description
M667-9900-100 VCP-1021 Composite Video Control Probe
Guide to Installation and Operation
M649-9900-104 ACP-1721 Digital Audio Control Probe
Guide to Installation and Operation
...or any of the following: ...with any of the following:
M761-9300-102 DEC-1002 10-Bit Composite to SDI Decoder
Guide to Installation and Operation
M761-9400-100 DEC-1003 10-Bit Composite to SDI Decoder
Guide to Installation and Operation
M761-9900-101 DEC-1021 12-Bit Composite to SDI Decoder
Guide to Installation and Operation
M761-9500-100 DEC-1023 12-Bit Composite to SDI Decoder
Guide to Installation and Operation
M768-9900-101 UAP-1781 –Eight Channel Universal
Audio Processor
Installation and Operation Manual
M768-8900-101 UAP-1783 Eight Channel Universal
Audio Processor
Guide to Installation and Operation
M768-8200-100 AAP-1741 Four Channel Analog Audio
Processor
Guide to Installation and Operation
...or the following probe: ...with the following converter:
M813-9900-110 HCP-1801HD/SD SDI Control Probe
Guide to Installation and Operation
M666-9900-100 SCP-1121 Digital Video Control Probe w.
Embedded Audio
Guide to Installation and Operation
M822-9900-101 ADC-800 CAM
HDV Camera HD/SD A-to-D Converter
Guide to Installation and Operation
Note: When referring to the documents listed above, keep in mind that the constituent
products of an iControl Edge system may have features that are not supported in the context of
iControl Edge.
7
Page 12

11
Introduction to iControl Edge
8
Page 13

iControl Edge Web Monitoring
This section provides a tour of the elements (panels, buttons, menus, etc.) that are part of
the iControl Edge monitoring application’s user interface.
Summary
Overview of the Monitoring Web Page . . . . . . . . . . . . . . . . . . . . . . . . . . . . . . . . . . . . . . . . . . . . . . . . . . . 9
Monitoring Web Page Elements . . . . . . . . . . . . . . . . . . . . . . . . . . . . . . . . . . . . . . . . . . . . . . . . . . . . . . . . 12
Menus . . . . . . . . . . . . . . . . . . . . . . . . . . . . . . . . . . . . . . . . . . . . . . . . . . . . . . . . . . . . . . . . . . . . . . . . . . . . . 29
Detailed Directions . . . . . . . . . . . . . . . . . . . . . . . . . . . . . . . . . . . . . . . . . . . . . . . . . . . . . . . . . . . . . . . . . . . 33
Overview of the Monitoring Web Page
When your iControl Edge system is up and running, the Application Server makes available a monitoring
Web page to clients connected via the iControl Web browser window. This Web page is actually a
sophisticated Java-based interface that gives you all the functionality you need to monitor your
configuration.
9
Page 14
2
iControl Edge Web Monitoring
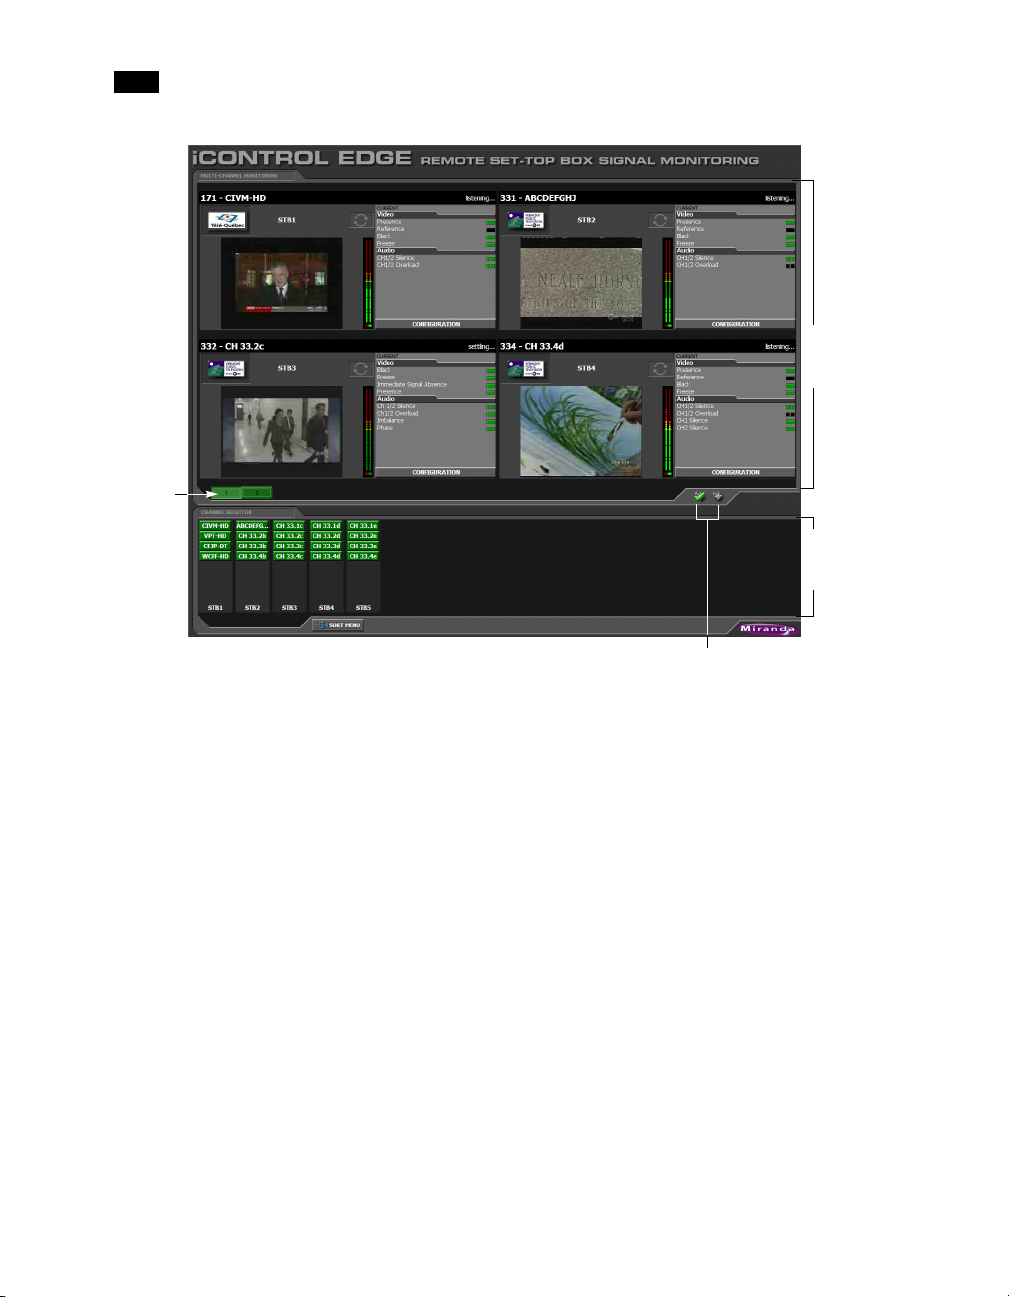
Up to
five tabs
Multi-Channel
Monitoring
area
Channel
Selector
area
Audible alarm buttons
10
Left side of iControl Edge window (initial view)
Page 15
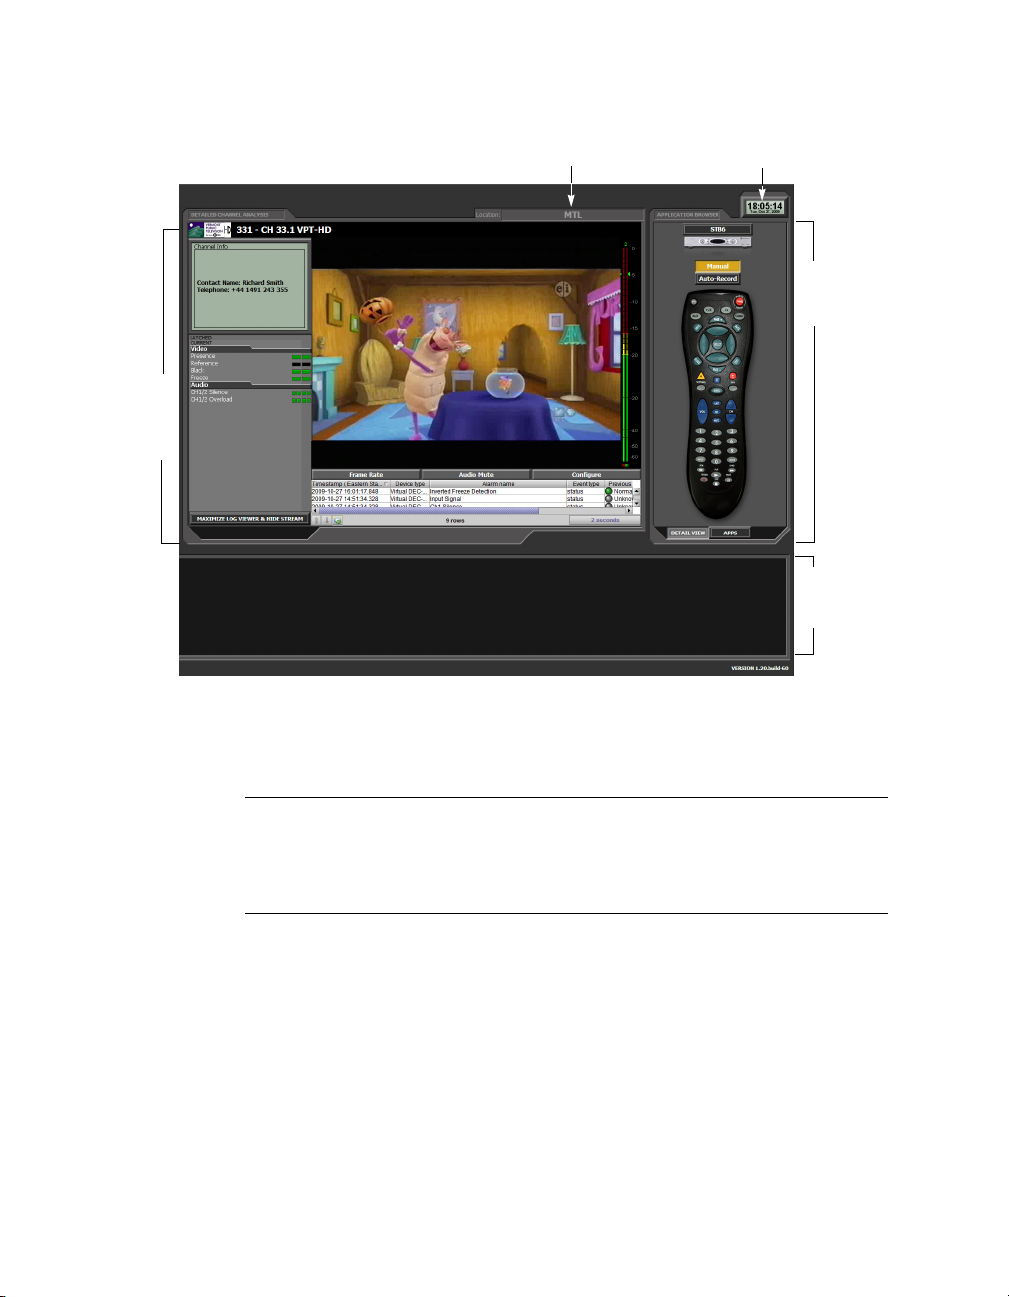
Detailed
Channel
Analysis
area
Overview of the Monitoring Web Page
Location indicator Clock
Application
Browser
Channel
Selector
area
Right side of iControl Edge window (initial view)
The default layout measures 3200 pixels wide by 1200 pixels high, and is meant to be displayed across two
equal-sized monitors set to a resolution of 1600 × 1200.
Note: In single-screen layouts, the Detailed Channel Analysis and Application Browser areas
are not labelled as such. The detail view, the cycler view and the application view appear in
Multi-Channel Monitoring area. The Remote Control/DVR Info area appear with the detail view,
and the Application Selector appears with the cycler view.
You can view a larger video preview and more detailed information about a specific channel by clicking the
corresponding Channel Selector button, or by clicking the station’s logo or name above a player.
The detail view includes a Log Viewer that automatically displays all alarms and events associated with the
selected channel.
11
Page 16
2
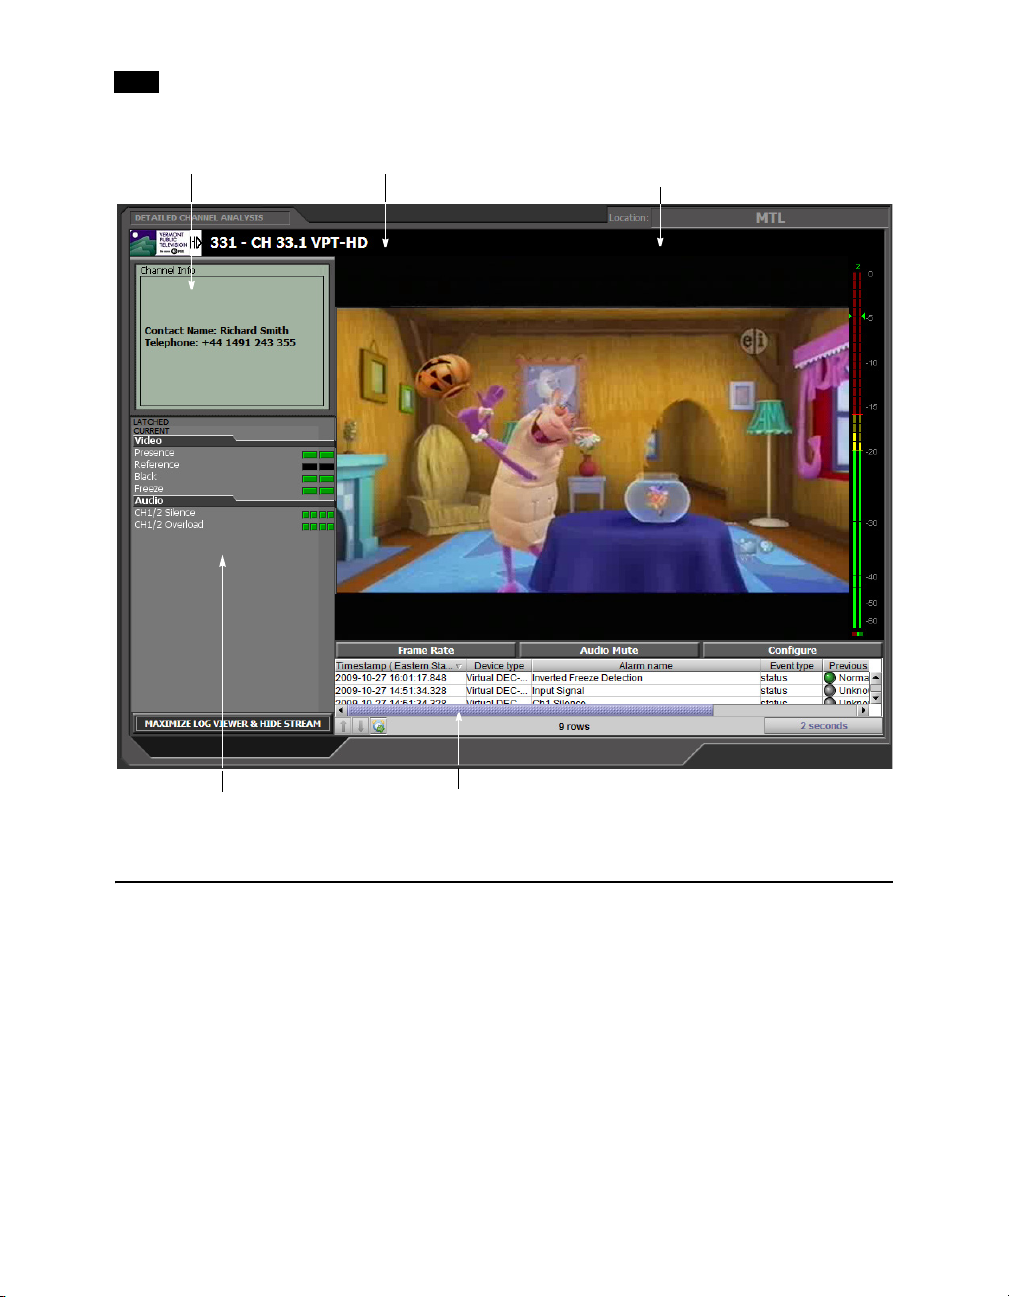
iControl Edge Web Monitoring
Description (from spreadsheet)
Full-resolution video thumbnail
of selected signal/feed
Detailed alarm panel Log Viewer
Monitoring Web Page Elements
Channel Selector . . . . . . . . . . . . . . . . . . . . . . . . . . . . . . . . . . . . . . . . . . . . . . . . . . . . . . . . . . . . . . . . . . . . . 13
Audible Alarm Buttons . . . . . . . . . . . . . . . . . . . . . . . . . . . . . . . . . . . . . . . . . . . . . . . . . . . . . . . . . . . . . . . 14
Alarm Panels . . . . . . . . . . . . . . . . . . . . . . . . . . . . . . . . . . . . . . . . . . . . . . . . . . . . . . . . . . . . . . . . . . . . . . . . 14
Audio Mute Button . . . . . . . . . . . . . . . . . . . . . . . . . . . . . . . . . . . . . . . . . . . . . . . . . . . . . . . . . . . . . . . . . . . 17
Frame Rate Button . . . . . . . . . . . . . . . . . . . . . . . . . . . . . . . . . . . . . . . . . . . . . . . . . . . . . . . . . . . . . . . . . . . 17
Configure Button . . . . . . . . . . . . . . . . . . . . . . . . . . . . . . . . . . . . . . . . . . . . . . . . . . . . . . . . . . . . . . . . . . . . 18
Clock . . . . . . . . . . . . . . . . . . . . . . . . . . . . . . . . . . . . . . . . . . . . . . . . . . . . . . . . . . . . . . . . . . . . . . . . . . . . . . . 18
Application Selector . . . . . . . . . . . . . . . . . . . . . . . . . . . . . . . . . . . . . . . . . . . . . . . . . . . . . . . . . . . . . . . . . . 18
12
Page 17
Channel Selector
Remote . . . . . . . . . . . . . . . . . . . . . . . . . . . . . . . . . . . . . . . . . . . . . . . . . . . . . . . . . . . . . . . . . . . . . . . . . . . . 19
DVR Recording Mode Buttons . . . . . . . . . . . . . . . . . . . . . . . . . . . . . . . . . . . . . . . . . . . . . . . . . . . . . . . . . . 20
DVR Info Panel . . . . . . . . . . . . . . . . . . . . . . . . . . . . . . . . . . . . . . . . . . . . . . . . . . . . . . . . . . . . . . . . . . . . . . 20
Multi-Channel Monitoring Area . . . . . . . . . . . . . . . . . . . . . . . . . . . . . . . . . . . . . . . . . . . . . . . . . . . . . . . . 21
Probe Configuration Button . . . . . . . . . . . . . . . . . . . . . . . . . . . . . . . . . . . . . . . . . . . . . . . . . . . . . . . . . . . 21
Alarm Browser . . . . . . . . . . . . . . . . . . . . . . . . . . . . . . . . . . . . . . . . . . . . . . . . . . . . . . . . . . . . . . . . . . . . . . 22
Log Viewer . . . . . . . . . . . . . . . . . . . . . . . . . . . . . . . . . . . . . . . . . . . . . . . . . . . . . . . . . . . . . . . . . . . . . . . . . 23
Service-Specific Log Viewer . . . . . . . . . . . . . . . . . . . . . . . . . . . . . . . . . . . . . . . . . . . . . . . . . . . . . . . . . . . 24
Reports . . . . . . . . . . . . . . . . . . . . . . . . . . . . . . . . . . . . . . . . . . . . . . . . . . . . . . . . . . . . . . . . . . . . . . . . . . . . 26
Navigator . . . . . . . . . . . . . . . . . . . . . . . . . . . . . . . . . . . . . . . . . . . . . . . . . . . . . . . . . . . . . . . . . . . . . . . . . . 28
Alarm Action Menu . . . . . . . . . . . . . . . . . . . . . . . . . . . . . . . . . . . . . . . . . . . . . . . . . . . . . . . . . . . . . . . . . . 29
Global Menu . . . . . . . . . . . . . . . . . . . . . . . . . . . . . . . . . . . . . . . . . . . . . . . . . . . . . . . . . . . . . . . . . . . . . . . . 30
Player Menu . . . . . . . . . . . . . . . . . . . . . . . . . . . . . . . . . . . . . . . . . . . . . . . . . . . . . . . . . . . . . . . . . . . . . . . . 32
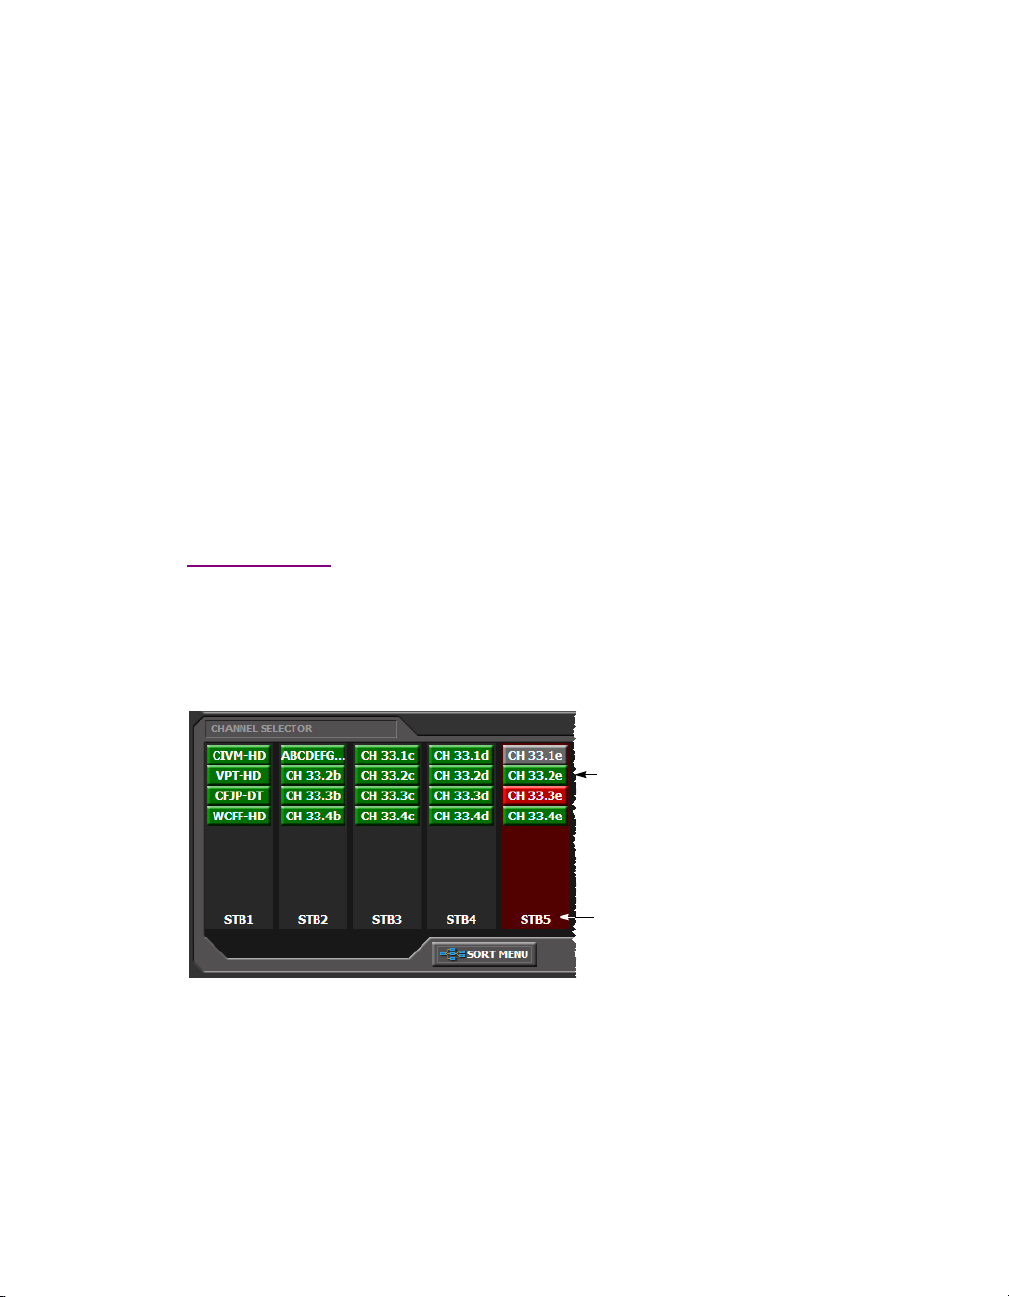
Channel Selector
The Channel Selector panel contains blocks of feeds (audio/visual signals), each associated with a location.
The number, order, and naming of these blocks is determined by the iControl Edge Configuration
Spreadsheets (see “Modifying the iControl Edge Configuration Spreadsheets” in the iControl Edge
Installation & Setup Guide).
Channel
Position pointer over channel
to view long signal name
(from configuration
spreadsheet)
Group
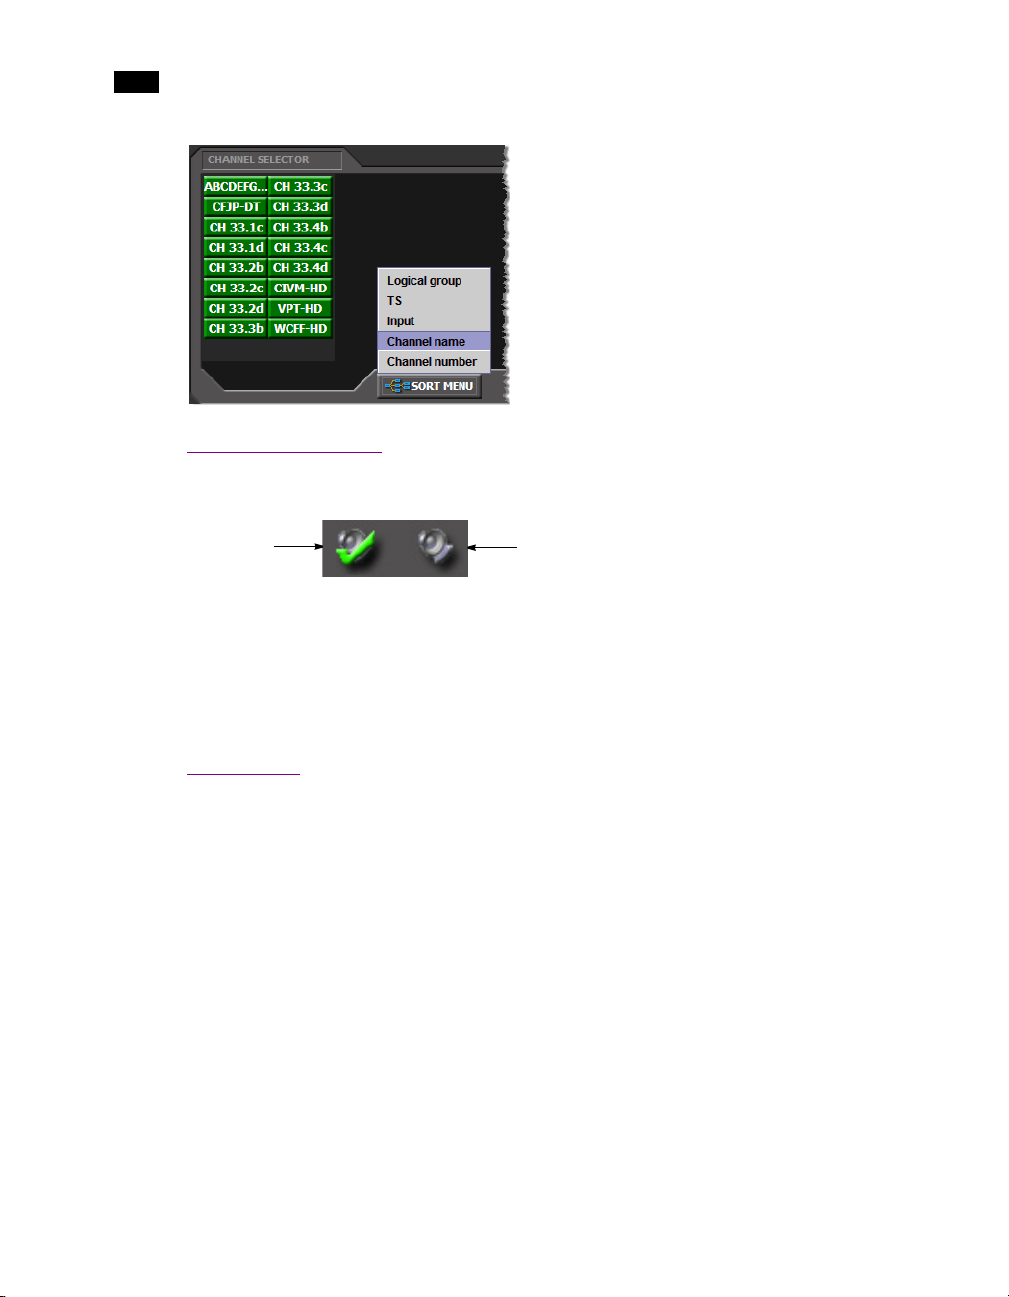
Visual patterns in the Channel Selector can help identify the likely cause of multiple alarms. Click the SORT
MENU button to select different grouping criteria for the Channel Selector:
13
Page 18
2
iControl Edge Web Monitoring
Audible Alarm Buttons
The Acknowledge and Mute/unmute sound buttons are used to manage audible alarms.
Acknowledge
Mute/unmute sound
• Click the Acknowledge button to acknowledge the current audible alarm.
This turns off the alarm sound until a new alarm condition is detected.
• Click the Mute/unmute sound button to turn off the sound for all current and future alarms. Click again
to enable alarm sounds.
• The audible alarm buttons can be disabled or enabled in the iControl Edge Configuration spreadsheets.
Alarm Panels
Alarm Panels display the overall status of audio and video alarms for each feed in the currently active
Location (highlighted in the Channel Selector panel). The alarms and their names are configured and
defined in the iControl Edge Configuration Spreadsheets.
14
Page 19
Alarm Panels
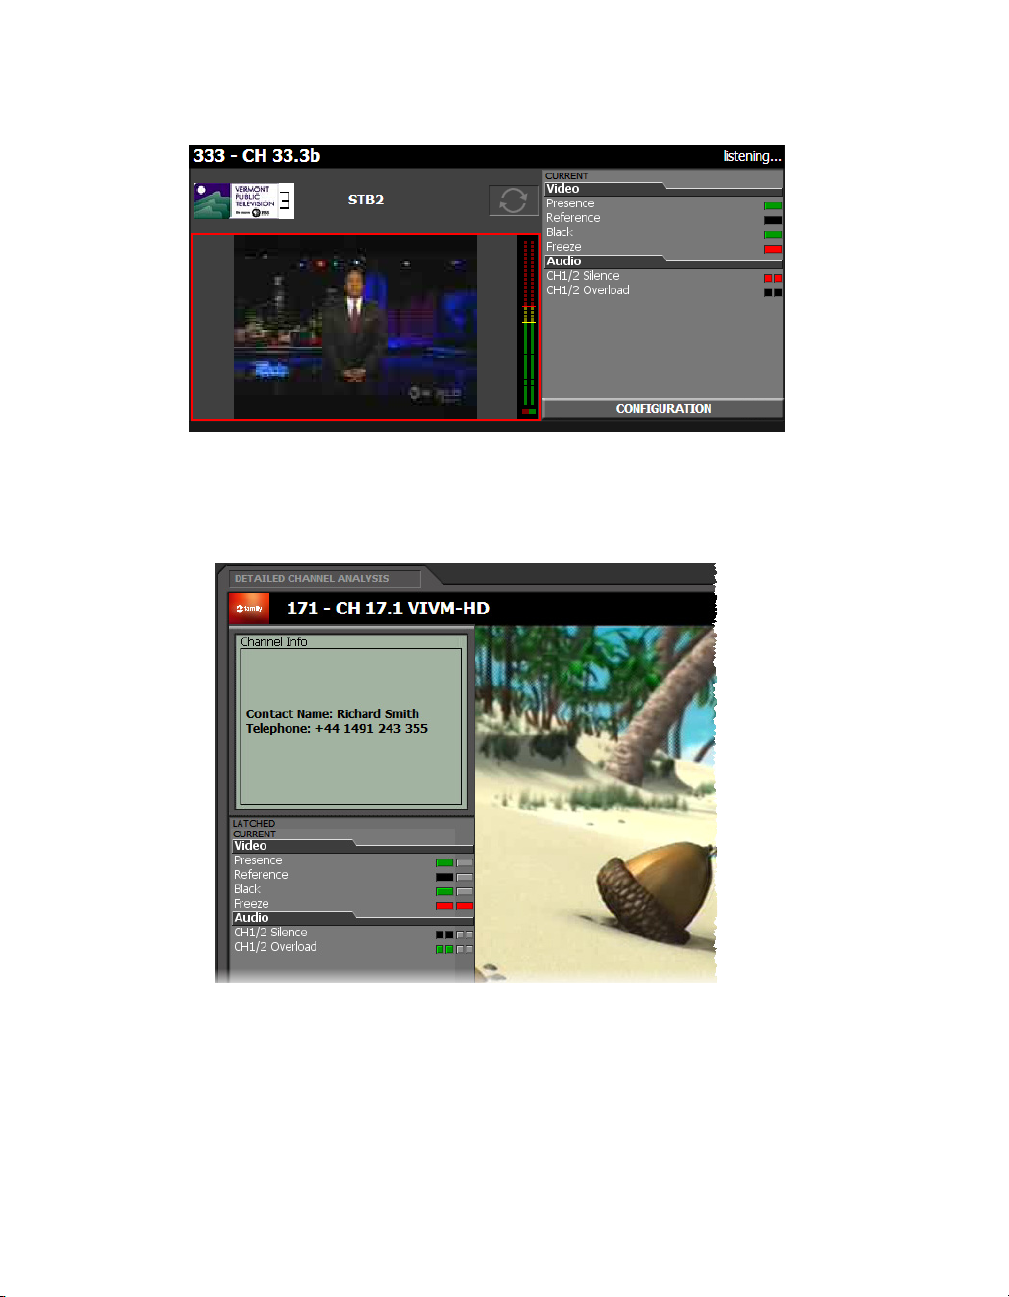
Summary alarm panel (in Multi-Channel Monitoring area)
• Right-click an alarm to display the Alarm Action menu.
• Click a Channel name or logo to display more detailed information in the Detailed Channel Analysis
area.
Detailed alarm panel (in Detailed Channel Analysis area)
15
Page 20

2
iControl Edge Web Monitoring
Alarm Color Legend
The following table describes the color scheme used by iControl Edge to display alarm statuses:
Color Status Description
White
Green
Yellow
Orange
Red
Gray
Blue
Pending Alarm exists but has not yet been reported. iControl is waiting for the hardware
or driver to update the alarm. White is the default status for a new alarm that has
been added to a GSM, before its current status is known. This status should be
replaced very quickly as iControl is updated, though it might persist as the result
of a slow VPN connection. If a GSM service is stopped, then all alarms originating
from this GSM will revert to pending status.
Normal The device, service, or signal being monitored is operating within allowable
parameters.
Minor Warning that an error of low importance has occurred.
Major Warning that an error of intermediate importance has occurred.
Critical Warning that an error of critical importance has occurred.
Unknown Failure to get the status of an alarm provider, even though the source device has
been detected. This could happen, for example, as the result of (1) a lost network
connection, or (2) a loss of signal that would trigger a critical alarm for signal
presence but leave all other related alarms in an unknown status (e.g. the freeze
or black status is unknown if a signal is not present).
Non-existent A pseudo-status representing an alarm that has been removed (or was never
added). When an alarm has been registered in the GSM, its associated URI
becomes “known” in the iControl system. The URI may be used by the iControl
log viewer, and possibly by one or more virtual alarms, to poll an alarm provider
for the alarm status. If the alarm provider is removed — for example, if a card is
removed from a frame — the log viewer or virtual alarm will be unable to detect
an alarm status, and will therefore report the “non-existent” status as blue.
16
Black
Disabled Alarm exists but is disabled at the source by the user. Some devices have the
ability to deactivate certain alarms on the hardware itself, resulting in these
alarms appearing black.
Note: When an alarm has been set to In Maintenance, Offline, or Snooze mode, its color turns to
a darker shade, and any text associated with the alarm becomes orange. For information on alarm
management, please refer to the iControl User Guide, available from the Documentation link on
the Application Server’s Startup page.
Page 21

Audio Mute Button
Audio Mute Button
The Audio Mute button is used to turn the sound associated with the current video stream on and off.
To turn the sound off:
• Click Audio Mute, and then click Mute on the shortcut menu.
To turn the sound on:
• Click Audio Mute, and then click Unmute on the shortcut menu.
Frame Rate Button
Click Frame Rate to set the current video stream’s frame rate.
To set the current stream’s frame rate:
• Click Frame Rate, and then click the frame rate you wish to use on the shortcut menu.
17
Page 22

2
iControl Edge Web Monitoring
Configure Button
Click Configure to view the Allégro system’s status and configure the streaming features associated with
the larger viewer (see “Configuring an Allégro System from the Detail View” on page 39).
Clock
The Clock displays the local time. The clock is synchronized to the client PC. If the Station Clock is desired,
the client PC must be configured to use the Network Time (NTP Server).
Application Selector
The Application Selector allows you to choose among several iControl applications to display in the Detailed
Channel Analysis area (see “Viewing the Application Selector” on page 33).
18
Page 23

Button Function
Log Viewer Click to display an embedded version of the iControl Log Viewer.
Alarm reports Click to open the Alarm reports menu:
• Channel alarms: Queries the iControl Incident Log and returns the overall
alarms for all channels.
• DVR recording: Lists the history of all DVR recording events (e.g. showing
when a channel was recorded or queued for recording).
• DVR detailed events: Shows a detailed history of DVR recording events,
including the alarm conditions that triggered the recording, and transitions
between the Manual and Auto-Record modes.
Remote
App. Server Click to display an embedded version of the iControl Startup Web page.
Navigator Click to display an embedded version of the iControl Navigator Web page.
Documentation Opens the iControl Edge Documentation page, from which you can access
installation and user manuals for this product release.
Alarm Browser Click to display an embedded version of the iControl Alarm Browser Web page.
Custom buttons You may have defined and configured up to two custom Application Selector
buttons linked to Web pages or iC Web pages (refer to the “Config worksheet”
section of the Installation & Setup Manual for more information).
Remote
The Application Browser area and the Probe Configuration window feature a soft remote that can be used
to control the set-top boxes and DVRs that are part of your iControl Edge system (see “Controlling Set-Top
Boxes and DVRs from a Soft Remote” on page 34).
19
Page 24

2
iControl Edge Web Monitoring
DVR Recording Mode Buttons
In the Remote Control area associated with the Detail Channel Analysis view, if the current device is a DVR,
then the Remote Control area also includes two buttons, used to set the recording mode for this device:
either Manual or Auto-Record (see “Controlling a Manual Set-Top Box or DVR” on page 36).
Note: Setting the recording mode to Manual stops the current recording (if any is in progress)
and clears the recording queue.
DVR Info Panel
In the Remote Control area associated with the Detail Channel Analysis view, if the current device is a DVR
in Auto-Record mode, the area shows information about the current channel being recorded and any
channel pending recording.
Click to select a manual set-top box (or DVR)
20
Click to switch to manual mode
Red dot indicates recording in progress
Currently recorded channel (number and long name)
Channel pending recording
Page 25

Multi-Channel Monitoring Area
Multi-Channel Monitoring Area
The Multi-Channel Monitoring area is the area of the monitoring Web page where streaming video is
displayed. Output from cycling set-top boxes at the current location is streamed concurrently to multiple
players. Each player corresponds to the current video signal from a particular set-top box and its associated
audio (if any), which is represented in the audio level meter.
Channel
number
Channel
name
Channel
logo
Audio level
meter (ALM)
Cycler P lay/
Pause button
Summary alarm
panel
Current
alarms
Red border indicates channel in alarm
Probe Configuration button
You can view a high-quality video preview and more detailed information about a specific channel by
clicking the corresponding channel selector button, or by clicking the channel’s logo or name above a
player. The selected channel is streamed to the larger player associated with the Allégro system within your
iControl Edge configuration.
Probe Configuration Button
In the Viewport, click a player’s Configuration button to display the control panels for the video probe and
audio probe connected to the cycling set-top box associated with the selected player.
Probe Configuration button
The control panels appear in a separate window (on top of the monitoring Web page), where you can view
current probe settings and make configuration changes (see “Configuring Probes” on page 38).
21
Page 26

2
iControl Edge Web Monitoring
Note: Depending on your setup, you may have one or two probes connected to a set-top box.
When separate probes are used to process the audio and video signals (e.g. a DEC-1023 for the
video, and an AAP-1741 for the audio), then there are two control panels available from the
configuration window. In other cases (e.g. HCP-1801), there is only one panel.
22
Probe Configuration window
Alarm Browser
The Alarm Browser is used to view details about an alarm condition.
Page 27

Log Viewer
For information on how to use the Alarm Browser, please refer to the iControl User Guide, available from the
Documentation link on the Application Server’s Startup page.
Log Viewer
The Log Viewer is used to view and search a history of alarms and other events recorded on the Application
Server.
In the context of iControl Edge, the relevant Log Viewer columns are:
• Timestamp
•Alarm Name
•New State
•Text
•Label
•Source ID
All other columns can be removed.
23
Page 28

2
iControl Edge Web Monitoring
Note: Once you have selected your preferred column configuration, it will be saved to your
client PC (or laptop).
24
For more information on how to use the Log Viewer, refer to the Event Log Viewer topics, in the iControl
User Guide, available from the Documentation link on the Application Server’s Startup page.
Service-Specific Log Viewer
If your iControl Edgeconfiguration includes an Allégro streaming server, the Detailed Channel Analysis area
includes a small log viewer at the bottom of the large player showing alarms and other events recorded on
the Application Server for the currently monitored service.
Note: If your iControl Edge configuration does not include any Allégro streaming server, the
Detailed Channel Analysis area is occupied by a large in-context log viewer.
Page 29

Click the MAXIMIZE LOG VIEWER & HIDE STREAM button to see more log entries:
Service-Specific Log Viewer
Click the MINIMIZE LOG VIEWER & SHOW STREAM button to show the large player again.
25
Page 30

2
iControl Edge Web Monitoring
Reports
If your system includes at least one DVR device, then the Application Selector includes an Alarm reports
button. By clicking this button you can extract different reports from the Application Server’s Event Log.
Note: If your system does not include any DVR device, click the Application Selector’s Channel
alarms button to view the report in the Detailed Channel Analysis area.
Channel Alarms
A report of channel alarms is a subset of the Application Server’s Event Log, listing the overall alarm status
information for all channels in your iControl Edge configuration.
26
In this context, the relevant log viewer columns are the following:
Column Description
Timestamp Date and time of the event.
Text Alarm condition detected by the associated probe. No text when
returning from an error condition to the Normal state.
Label Channel name (long name from Services worksheet).
Short label Channel number
DVR Recordings
A report of DVR recordings is a subset of the Application Server’s Event Log, providing a summary of
recording events for channels in your iControl Edge configuration.
Page 31

Reports
Click the Application Selector’s Alarm reports button, and then click DVR recordings on the shortcut
menu, to view the report in the Detailed Channel Analysis area. In this context, the relevant log viewer
columns are Timestamp and Te xt . In this report, you can review what happened over a certain time period,
see when an alarm condition was detected that caused the channel to be queued for recording, when the
associated DVR started recording a sample for this channel, and when the recording stopped. This report
includes the following event types:
[channel] in alarm: [alarm text]. Queued for recording on [device].
Start recording [channel] on [device].
Stop recording [channel] on [device].
DVR Detailed Events
A report of DVR detailed events is a subset of the Application Server’s Event Log, listing transitions between
the Auto-record and Manual operational modes, in addition to alarm states that triggered or stopped
recording on a DVR for any channel in your iControl Edge configuration.
27
Page 32

2
iControl Edge Web Monitoring
Click the Application Selector’s Alarm reports button, and then click DVR detailed events on the shortcut
menu, to view the report in the Detailed Channel Analysis area. In this context, the relevant log viewer
columns are Timestamp and Te xt . This report includes the following event types:
[channel] in alarm: [alarm text]. Queued for recording on [device].
[channel] in alarm: [alarm text]. Ignored because [device] is in manual mode.
[channel] no longer in alarm. Not recorded on [device].
Manual mode set on [device].
Auto-record mode set on [device].
Start recording [channel] on [device].
Stop recording [channel] on [device].
Navigator
The Navigator is used to view the statuses of the various devices and components of your iControl Edge
system.
28
For more information, please refer to the iControl User Guide, available from the Documentation link on
the iControl Startup Page.
Page 33

Menus
Menus
Alarm Action Menu
The Alarm Action menu is displayed any time you right-click an alarm in an Alarm Panel, or in the Channel
Selector.
Menu Option Description
Properties Opens a dialog box that allows you to view an alarm’s URI.
The URI can be used for filtering searches in the Event Log Viewer.
Show status log Opens an “in-context” Log Viewer filtered for the selected alarm.
Reset server latch Resets the alarm’s latched status on the server side (i.e. all clients monitoring this
alarm will see the alarm latch reset).
Acknowledge Will acknowledge a flashing alarm (alarms flash when changing state). The alarm
will go steady on after it has been acknowledged. Right-click a Location name to
acknowledge all alarms on that site.
29
Page 34

2
iControl Edge Web Monitoring
Menu Option Description
Operational mode
Choose In Maintenance to set an alarm to In Maintenance status, which is generally employed in
the execution of a manual task.
In a typical scenario, a technician might want to effect repairs on a device in the path of a signal
being monitored by iControl Edge. Before beginning, the technician would manually set the
corresponding alarms to In Maintenance status, to avoid having iControl Edge report a sudden
flood of alarms. Once the repairs are done, the operator would then manually put the alarms back
in Online status.
Choosing Offline to set an alarm to Offline status has a similar effect, except that each latch is
also reset when an Offline alarm is restored to Online status.
Alarms in
Maintenance Mode
(dark green/red
status, orange text)
Active alarms
Note: Changing an alarm status to either Offline or In Maintenance does not interrupt
monitoring. All alarm events are still log ged and can be viewed using the Log Viewer.
Snooze Turns off an alarm temporarily. When dealing with unscheduled events, operators
sometimes need the ability to quickly suppress alarms for a certain period.
Desnooze Restores a snoozed alarm’s actual status.
Create schedule Sets an alarm-suppression schedule. For instance, if your organization performs a
sign-off at the end of the broadcast day, many signals monitored by
iControl Edge
therefore switch to an invalid format. Because sign-off is a normal, and predictable,
event, it is useful for
iControl Edge operators to configure their system for alarms to be
automatically suppressed during specified periods, and revert to their normal
behavior outside of those periods.
30
Copy alarm URI Copies the alarm’s URI address to the clipboard.
Show status in GSM
Opens a separate Alarm Browser window with the selected alarm highlighted.
browser
Global Menu
The Global Menu is displayed any time you right-click an empty area of the iControl Edge Web page:
Page 35

Global Menu
This option is only appears when two displays are available
Menu Option Description
Refresh Refreshes the display of the iControl Edge Web page.
Reset all latches Resets all alarm latches to the current state.
Page source Opens a window showing the page’s XML source code.
Note: The iControl Edge Web page is composed of several pages, so that where you
click determines what page source will be displayed.
Toggle full screen Toggles the display of the iControl Edge Web page between full screen display and
display within a window.
Toggle total full screen Toggles the display of the iControl Edge Web page between full screen display across
more than one screen, and display within a window.
Page properties Opens a window allowing you to view page properties.
31
Page 36

2
iControl Edge Web Monitoring
Player Menu
The Player Menu is displayed any time you right-click one of the players in the Multi-Channel Monitoring
area or Detailed Channel Analysis area.
Menu Option Description
Restart Streaming Re-establishes the streaming connection between the client PC and the Allégro.
Aspect Ratio Choose an aspect ratio of either 4:3 or 16:9. The layout in the player is resized
accordingly. Choose Automatic to display the signal in its native aspect ratio.
Note: It is the client PC that changes the aspect ratio of the player display. The native
aspect ratio is determined by the settings and inputs on the associated set-top box.
Console The Console is a window superimposed upon the Viewport that displays system
messages related to streaming operations. For example:
[2:34:02 PM] Stream stopped
[2:34:02 PM] tryStopStream - error in
RTSPSession[rtsp://10.12.120.15/c1]: Server NOK: RTSP/
1.0 460 Only Aggregate Option Allowed will retry
automatically
From the Console menu, you can configure various settings associated with the
console output. These settings are described in detail below.
32
Copy to clipboard Copies latest player console message to clipboard.
Show/Hide Toggles between showing and hiding the player console messages on top of the
player image.
Clear Clears the player console.
Page 37

Menu Option Description
Color Allows you to choose a color for the console text: white, black, green, blue, or red.
Level Allows you to set the level of detail for the messages reported in the player console.
Buffer Allows you to set an upper limit to the number of lines of text stored in the player
Detailed Directions
There are many tasks you can perform within the iControl Edge Web monitoring interface, including the
following:
• using iControl applications (see page 33)
• controlling set-top boxes and DVRs (see page 34)
• verifying and configuring probe settings (see page 38)
• configuring the Allégro system in a manual path (see page 39)
• disabling an alarm (see page 40)
Detailed Directions
console buffer.
• snoozing an alarm (see page 44)
• scheduling an operational mode change for an alarm (see page 49)
Viewing the Application Selector
To view the Application Selector:
• Click APPS at the bottom of the Application Browser area:
33
Page 38

2
iControl Edge Web Monitoring
Click APPS to show the Application Selector
34
Controlling Set-Top Boxes and DVRs from a Soft Remote
Controlling a Cycling Set-Top Box
To view the soft remote associated with a cycling set-top box:
1. Click CONFIGURATION at the bottom of the corresponding player in the Channel Monitoring area:
Click to open the probe
configuration window
The Probe Configuration window appears, including a soft remote from which you can control the settop box associated with the selected player:
Page 39

Controlling Set-Top Boxes and DVRs from a Soft Remote
2. In the soft remote pane, click the active buttons in the same way you would use the equivalent physical
remote, to change channels, adjust the sound volume, etc., while reviewing changes reported in the
detailed alarm panel, if any.
35
Page 40

2
iControl Edge Web Monitoring
Currently controlled set-top box
Image reflects model of selected set-top box
Next/Previous channel
Menu
Numeric keypad
36
3. Click the button in the upper right corner of the Probe Configuration window when you have
finished using the soft remote for controlling this set-top box.
Controlling a Manual Set-Top Box or DVR
To view the Remote Control area associated with a set-top box or DVR in a manual path:
• Click DETAIL VIEW at the bottom of the Application Browser area:
Page 41

Controlling Set-Top Boxes and DVRs from a Soft Remote
Remote Control area (Manual
mode active)
Click DETAIL VIEW to show the Remote Control area
Remote Control area (Auto-record
mode active)
The Remote Control area appears, including a menu from which you can select the manual set-top box
or DVR you wish to control, if your system includes more than one manual path:
If the selected device is a DVR, then the Remote Control area also includes two buttons, used to set the
recording mode for this device: either Manual or Auto-Record:
37
Page 42

2
iControl Edge Web Monitoring
Notes
• Setting the recording mode to Manual stops the current recording (if any) and clears the
recording queue.
• The pictures of the remote and set-top box change according to the make and model of the
associated set-top box, and also depending on the television service provider.
• Consult the manufacturer’s documentation for your specific set-top box or DVR for detailed
information about its functions.
Configuring Probes
To access the control panels for a Densité probe:
1. In the Multi-Channel Monitoring area, click the CONFIGURATION button next to the player associated
with the probe you wish to configure:
38
Probe Configuration button
The probe configuration window appears on top of the Detailed Channel Analysis area, showing the
control panel for the corresponding video probe.
2. If there are separate audio and video probes in the selected signal path, click the Audio button at the
bottom of the window to access the audio probe’s control panel. Alternatively, click the Video button
to access the video probe’s control panel.
Page 43

Configuring an Allégro System from the Detail View
Probe control panel in the Configuration window (panel for a DEC-1002 video probe shown)
3. View the current settings and modify them as needed.
4. Click the button at the top-right corner of the window to close it. Alternatively, click a Channel
Selector button or another CONFIGURATION button in the Multi-Channel Monitoring Area.
See also: For more information about video and audio probe configuration, see the documentation
packaged with your specific Densité probes.
Configuring an Allégro System from the Detail View
To configure the Allégro system associated with the Detailed Channel Analysis area:
• On the toolbar below the large viewer, click Configure.
The Allégro-1 System Status page appears in the Detailed Channel Analysis area:
39
Page 44

2
iControl Edge Web Monitoring
Note: Refer to “Configuring Allégro systems” in the iControl Edge Installation & Setup Guide for
details on the appropriate settings. For more information click User manual at the bottom of the
page’s navigation pane.
Allégro documentation
40
Disabling Alarms
Perform either of these procedures to change the operational mode of an alarm to either offline or in
maintenance. You can do this either directly, from any alarm status icon on the Web monitoring page, or in
the Alarm Browser.
Disabling an Alarm from an Alarm Icon
Note: You can perform this procedure using alarm status icons anywhere in the iControl
EdgeWeb monitoring page, including the Multi-Channel Monitoring area, the Channel Selector,
and the Detailed Channel Analysis area.
To disable an alarm directly from an alarm icon:
• Right-click the alarm status icon of the alarm you wish to disable, point to Operational mode on the
shortcut menu, and then click either Offline or In maintenance:
Page 45

Disabling Alarms
Right-click alarm
status icon
The icon and text of the alarm change color, indicating that a special operational mode is in effect:
Note: When you wish to return the alarm to an online status, perform this procedure again,
clearing all operational mode check marks.
41
Page 46

2
iControl Edge Web Monitoring
Disabling an Alarm from the Alarm Browser
To disable an alarm from the Alarm Browser:
1. Click the APPS button at the bottom of the Application Browser area to display the Application Selector.
2. In the Application Selector, click Alarm Browser:
42
The Alarm Browser appears in the Detailed Channel Analysis area:
Page 47

Disabling Alarms
3. In the Alarm Browser, right-click the appropriate status icon, point to Operational mode on the
shortcut menu, and then click either Offline or In maintenance:
In the Alarm Browser, the icon and text of the alarm change color, indicating that a special operational
mode is in effect:
43
Page 48

2
iControl Edge Web Monitoring
44
Note: When you wish to return the alarm to an online status, perform this procedure again,
clearing all operational mode check marks.
Snoozing Alarms
Perform either of these procedures to suppress an alarm for a designated period of time. You can do this
either directly, from any alarm status icon on the Web monitoring page, or in the Alarm Browser.
Snoozing an Alarm From an Alarm Icon
Note: You can perform this procedure using alarm status icons anywhere in the iControl
EdgeWeb monitoring page, including the Multi-Channel Monitoring area, the Channel Selector,
and the Detailed Channel Analysis area.
To snooze an alarm directly from an alarm icon:
1. Right-click the alarm status icon of the alarm you wish to snooze, and then click Snooze on the shortcut
menu:
Page 49

The Snooze window appears:
Snoozing Alarms
Right-click the
alarm status icon
2. Type the appropriate time interval in the Duration boxes.
3. Click OK.
The icon and text of the alarm change color, indicating that a special operational mode is in effect:
45
Page 50

2
iControl Edge Web Monitoring
Snoozing an Alarm from the Alarm Browser
To snooze an alarm from the Alarm Browser:
1. Click the APPS button at the bottom of the Application Browser area to display the Application Selector.
46
2. In the Application Selector, click Alarm Browser:
Page 51

Snoozing Alarms
The Alarm Browser appears in the Detailed Channel Analysis area:
3. In the Alarm Browser, right-click the appropriate status in dicator, and the n click Snooze on the shortcut
menu:
47
Page 52

2
iControl Edge Web Monitoring
The Snooze window appears:
48
4. Type the appropriate time interval in the Duration boxes.
5. Click OK.
In the Alarm Browser, the status indicator and the text of the snoozed alarm change color, indicating
that a special operational mode is in effect:
Page 53

Scheduling Operational Mode Changes
Scheduling Operational Mode Changes
Perform either of these procedures to schedule an operational mode change for an alarm. You can do this
either directly, from any alarm status icon on the Web monitoring page, or in the Alarm Browser.
Scheduling an Operational Mode Change from an Alarm Icon
Note: You can perform this procedure using alarm status icons anywhere in the iControl
EdgeWeb monitoring page, including the Multi-Channel Monitoring area, the Channel Selector,
and the Detailed Channel Analysis area.
To schedule an operational mode change from an alarm icon:
1. Right-click the alarm status icon of the alarm for which you wish to schedule a change, and then click
Create schedule on the shortcut menu:
49
Page 54

2
iControl Edge Web Monitoring
The Schedule Entry Details window appears:
Right-click the alarm
status icon
50
Page 55

Scheduling Operational Mode Changes
2. Type a name for the schedule, and set the appropriate options such as the start date and time,
recurrence pattern, and the end date.
3. In the Action details section, select the appropriate action in the list, and specify the length of the
period during which the specified action will apply.
The selected alarm already appears in the Selected alarms list. To add other alarms to this schedule,
select them in the Available alarms list, and click the down arrow button to add them to the Selected
alarms list.
Note: Multiple alarms can be selected at once by holding down the Shift or Ctrl key while
clicking.
4. To remove alarms from the Selected alarms list, select them and click the up arrow button.
5. Click OK.
51
Page 56

2
iControl Edge Web Monitoring
Scheduling an Operational Mode Change from the Alarm Browser
To schedule an operational mode change from the Alarm Browser:
1. Click the APPS button at the bottom of the Application Browser area to display the Application Selector.
2. In the Application Selector, click Alarm Browser:
The Alarm Browser appears in the Detailed Channel Analysis area:
52
3. In the Alarm Browser, right-click the appropriate status icon, and then click Create schedule on the
shortcut menu:
Page 57

Scheduling Operational Mode Changes
The Schedule Entry Details window appears:
53
Page 58

2
iControl Edge Web Monitoring
54
4. In the Schedule Entry Details window, type a name for the schedule, and set the appropriate options
such as the start date and time, recurrence pattern, and the end date.
5. In the Action details section, select the appropriate action in the list, and specify the length of the
period during which the specified action will apply.
The selected alarm already appears in the Selected alarms list. To add other alarms to this schedule,
select them in the Available alarms list, and click the down arrow button to add them to the Selected
alarms list.
Note: Multiple alarms can be selected at once by holding down the Shift or Ctrl key while
clicking.
6. To remove alarms from the Selected alarms list, select them and click the up arrow button.
7. Click OK.
Page 59

Glossary
Term Definition
Alarm Alarms are the central feature of monitoring in iC ontrol Edge. There are three types of alarms
in the General Status Manager (GSM): events, statuses, and text alarms. Each alarm is a
status report on a specific condition within a site, triggered by equipment interfaced with the
iControl Edge system, or by scripts. Alarms can appear on an iControl Web page, in the Alarm
Browser, in iC Navigator, and in system logs.
Allégro Miranda’s Allégro is a line of 1 RU streaming encoders/servers that enables real-time
conf idenc e monit oring o f remot e sign als by u sing low latency streaming of video, audio and
data over a standard IP network. Allégro combines encoder and server functions to allow
streaming audio, video and data to be sent over standard IP networks for monitoring of
critical broadcast signals. It integrates telemetry such as signal presence, VBI extraction and
audio level metering.
Allégro encoders can be remotely managed from a central location, and numerous local and
remote player clients can monitor the same signal. Streaming video for Allégro can be fully
integrated into Miranda’s iControl or Kaleido products.
Application Server The iControl Edge Application Server is a compact server that interfaces to audio, video, and
other hardware through a variety of configurable ports (RS-232, RS-422, Ethernet). The
Application Server hosts the various software modules that make up iControl Edge. Users
connect to an Application Server from any desktop or portable computer, using a Web
browser.
GSM The General Status Manager is an iControl service responsible for central management of all
alarm conditions and error logging.
iC Navigator iControl Navigator is an application that lets operators view, control and monitor devices on
an iControl Edge network. It gives operators direct access to the control windows of both
Miranda Technologies an d third-party equipment. It shows the status of devices and services
in a hierarchical view, so that a system problem can quickly be pinpointed. It also supports
administrative tasks such as status reporting and logging.
55
Page 60

A
Glossary
Term Definition
iC Web iControl Web is a Web-based device-monitoring module made up of two applications:
• iControl Web Creator (iC Creator) is a tool for creating sites to provide a user-friendly
interface for operators to control and monitor devices connected throughout the iControl
environment.
• iControl Web allows you to view and access sites available on the iControl Edge
Application Server.
iControl Miranda’s iControl is a high-level Element Management System which operates with
sophisticated telemetry probes to provide advanced facility monitoring over IP. The system
leverages industry standard SNMP protocols, and can fully integrate third-party control
applications to create a complete facility monitoring environment. With automated
reactions to failures, and guided operator response, the system can deliver dramatically
reduced down times.
iControl Webmin Webmin is a popular system configuration tool for Unix systems. iControl employs a
customized version of Webmin to facilitate Web-based administration of Application
Servers. iControl Webmin provides the administrative functionality required to control both
system and user options such as system maintenance and security.
RMI daemon Remote Method Invocation daemon, a service that enables Java objects to communicate with
each other remotely. This service is necessary for iControl applications.
URI A Uniform Resource Identifier is a string of characters used to identify a resource. In iControl
Edge, URIs are used to identify each and every element of a network—from hardware
devices, such as cards and frames, to logical resources, such as services, alarms, Web pages
and user interface elements.
Virtual Alarm A virtual alarm is a special type of alarm that allows a logical combination of multiple
arbitrary alarms. A virtual alarm is ma de up of one or more sub-alarms. Technically a virtual
alarm is an alarm provider that provides a single alarm. Any alarms in iControl Edge—
including other virtual alarms—can be combined to form a new, higher-level alarm
(provided the new virtual alarm does not create a cyclical dependency).
56
Page 61

Contact Us!
Miranda Technical Support
For technical assistance, please contact the Miranda Technical Support centre nearest you:
Americas
Office hours: 9:00 a.m. – 9:00 p.m. (EST)
Telephone: +1-800-224-7882
Fax: +1-514-335-1614
E-mail: techsupp@miranda.com
Europe, Middle East, Africa, UK
Office hours: 9:00 a.m. – 6:00 p.m. (GMT)
Telephone: +44 (0) 1491 820222
Fax: +44 (0) 1491 820002
E-mail: eurotech@miranda.com
France
Office hours: 9:00 a.m. – 5:00 p.m. (GMT+1)
Telephone: +33 1 55 86 87 88
Fax: +33 1 55 86 00 29
E-mail: eurotech@miranda.com
Corporate Head Office
Miranda Technologies Inc.
3499 Douglas-B.-Floreani, St-Laurent, Quebec, Canada H4S 1Y6
Telephone: 514-333-1772
Fax: 514-333-9828
Web : www.miranda.com
Asia
Office hours: 9:00 a.m. – 5:00 p.m. (GMT+8)
Telephone: +852-2539-6987
Fax: +852-2539-0804
E-mail: asiatech@miranda.com
China
Telephone: +86-10-5873-1814
E-mail: asiatech@miranda.com
Page 62

 Loading...