

Page 1
Operating Instructions
GL SpectroSoft
Operation And Evaluation Software 1/06.14
Page 2

Thank you for selecting this state of the art GOSSEN product. We hope you are
enjoying the easy operation, the high quality, precision and wide functionality.
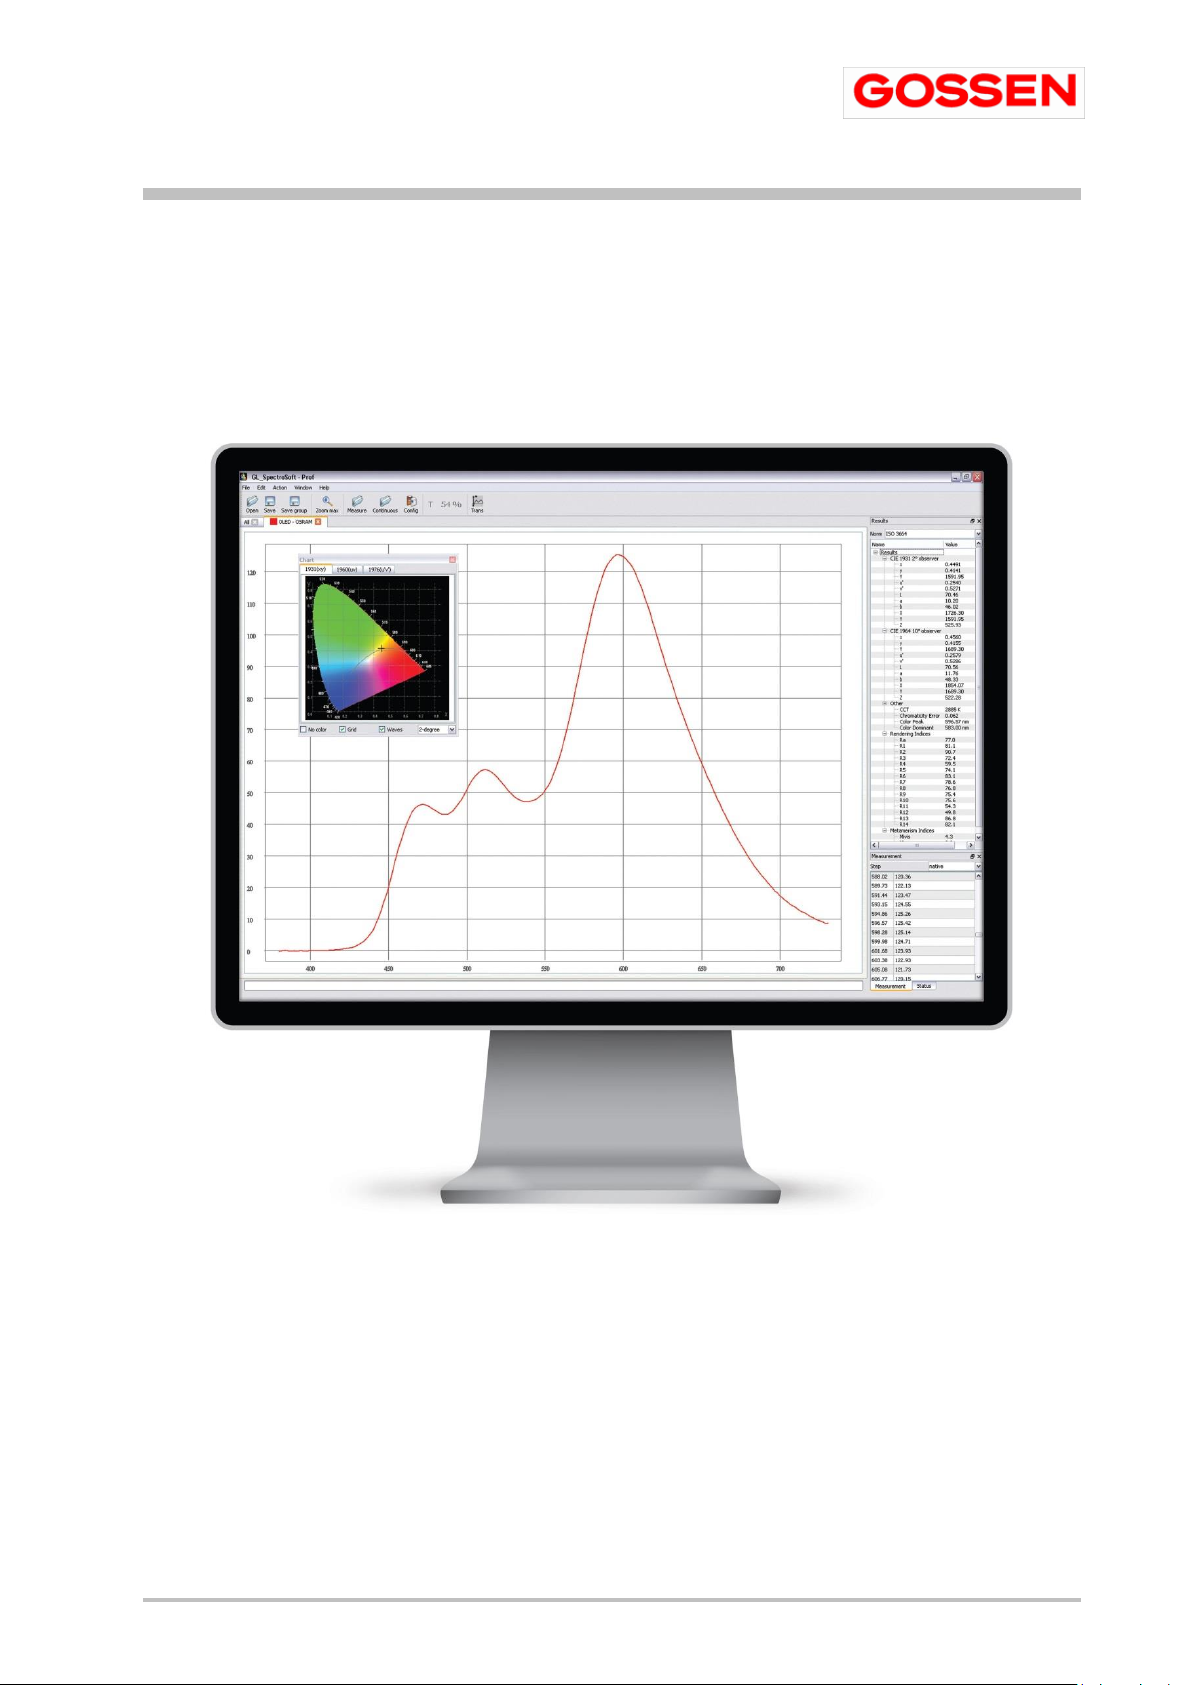
GL SPECTROSOFT BASIC is an operation and evaluation software for MAVOSPEC
with standard functionalities.
GL SPECTRASOFT BASIC standard functionality:
Spectral power distribution – graphic display of the spectrum with scaling function
and assignment of colors to wavelengths.
Tabular measured value display – table with spectral data in native or calculated
step sizes of 1, 2 or 5 nm
Evaluation of the spectra – calculation of photometric and colorimetric quantities,
chromaticity (XYZ; x,y; u',v'; CIELab), correlated color temperature, chromaticity
error, peak wavelength and value, dominant wavelength, color rendering index Ra
and individual indices R1 through R14
Chromaticity display – in in the CIE standard color table, CIE 1931 [x,y], CIE 1960
[u,v] or CIE 1976 [u', v'] with a selectable standard observer of 2° or 10°
Basic photometric quantities – depending on utilized accessories, illuminance,
luminance or luminous flux is calculated from the spectrum.
Personalized measurement reports – can be generated in HTML format for the
momentarily displayed measurement for the purpose of documentation.
Remote control of and data transfer – for the MAVOSPEC via USB or WiFi
interface. Individual, continuous and interval controlled measurements are
supported.
Universal exchange of spectra – externally generated spectra can be imported
from TXT files and subsequently evaluated. Internal data can be exported via TXT
files or the clipboard and processed with other applications.
Individually configurable desktop – individual windows can be arranged and
scaled as desired, and saved as a configuration.
International use – selectable user interface language: German, English, French,
Italian or Polish
GOSSEN Foto- und Lichtmesstechnik GmbH 2
Page 3
GL SPECTROSOFT PRO is an operation and evaluation software for MAVOSPEC with
i
If you have further requirements for the GL SPECTROSOFT, like special functions for your
measuring and testing process, specific reports or further measurands that can be calculated
from the spectrum, please ask us for customer specific adaptations.
an enhanced range of functions. It includes all of the GL SPECTROSOFT BASIC
functions.
GL SPECTRASOFT PRO enhanced functionality:
LED binning – brightness and color bins can be set up with the integrated editor.
LEDs are assigned to the predefined classes during measurement.
Indices of metamerism – are ascertained for the UV and visible ranges.
Approval of color matching stations – measured quantities required in
accordance with ISO 3664 are ascertained during the course of a test run and an
approval report is generated.
Candle power (cd) – calculation of candle power via the illuminance measurement
with standard diffuser and specified distance.
Transmission and reflection – of optical components can be implemented with an
external light source and optical measuring accessories.
Measured values at a glance – selectable measured quantities can be displayed in
a special window.
Clear-cut comparison – selectable measured quantities from various
measurements can be summarized in a table and displayed in a special window.
MacAdam ellipse – in preparation
GOSSEN Foto- und Lichtmesstechnik GmbH 3
Page 4

Contents
Page
1
Introduction
5
1.1
System Requirements
5
1.2
License Types
6
2
Installation
7
2.1
Connecting Devices
8
2.1.1
GL SPECTROSOFT for GL SPECTIS
9
2.1.2
GL SPECTROSOFT for MAVOSPEC
9
2.1.3
GL SPECTROSOFT with many Devices
9
2.2
Changing or Extending License
12
3
Startup
15
4
Basic Functions Tool Bar
16
4.1
Serial Measurements
17
5
Top Menu Options
19
5.1
File
19
5.2
ISO 3664 Assessment
20
5.3
Edit
21
5.4
Action
22
5.5
Window
22
6
Measurement Results Windows
23
6.1
Measurement
23
6.2
Status
23
6.3
Results
24
6.4
Chart
25
6.5
Selected Results
25
6.6
Comparison Table
7
Tools
29
7.1
Bin Editor
29
7.2
Pass/Fail Editor
33
8
Reports
35
9
Practical Notes
35
GOSSEN Foto- und Lichtmesstechnik GmbH 4
Page 5

1 Introduction
GL SpectroSoft is optional evaluation software with an intuitive user interface and
extensive measuring functions for the spectral analysis of light sources, as well as
transmission and reflection measurements. Spectral values measured with the
MAVOSPEC and the respectively required accessories, as well as externally generated
spectra, can be evaluated in accordance with current CIE standards. The software
calculates colorimetric magnitudes such as chromaticity in accordance with various CIE
standards, correlated color temperature, chromaticity error, peak wavelength, dominant
wavelength, color rendering index and index of metamerism. Extensions such as
scotopic and photopic values, PAR and PPFD values and MacAdam ellipses can be
implemented upon request.
The software is extremely well suited for general light assessments, for laboratory
applications and for quality assurance in production. The configurable desktop can be
adapted to the respective measuring task, and displays only the required information in
a clear-cut fashion. Various program versions are available to match different
requirements.
1.1 System Requirements
The following prerequisites must be fulfilled in order to use GL SpectroSoft at your PC:
IBM or 100% IBM compatible PC
Your PC must be equipped with an USB port
Microsoft Windows operating system (all service packs have to be installed)
Windows XP and XP x64
Windows Server 2003 and Server 2003 x64
Windows Vista and Vista x64
Windows Server 2008 and Server 2008 x64
Windows 7 und 7 x64
Windows Server 2008 R2
Windows 8 and 8 x64
Installation is not possible under all other operating systems.
Approximately 4 MB of free hard disk space for GOSSEN software
GOSSEN Foto- und Lichtmesstechnik GmbH 5
Page 6
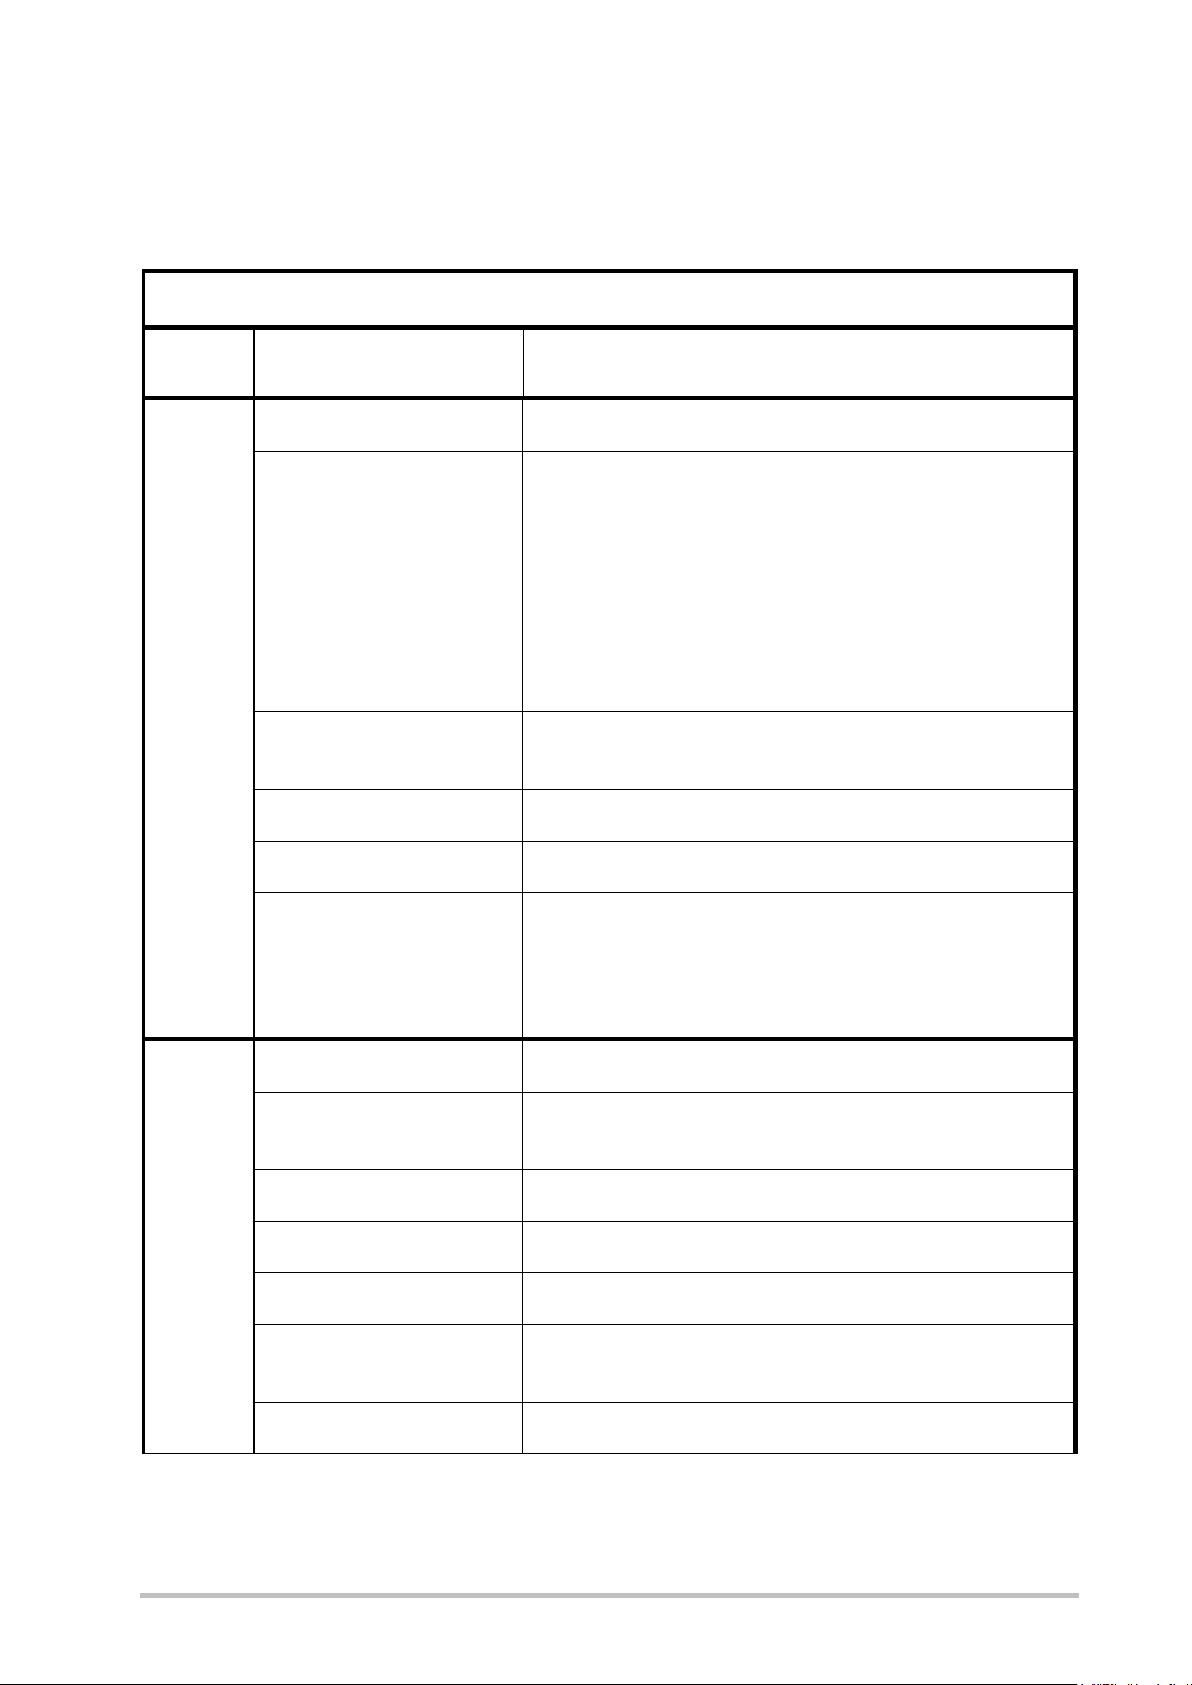
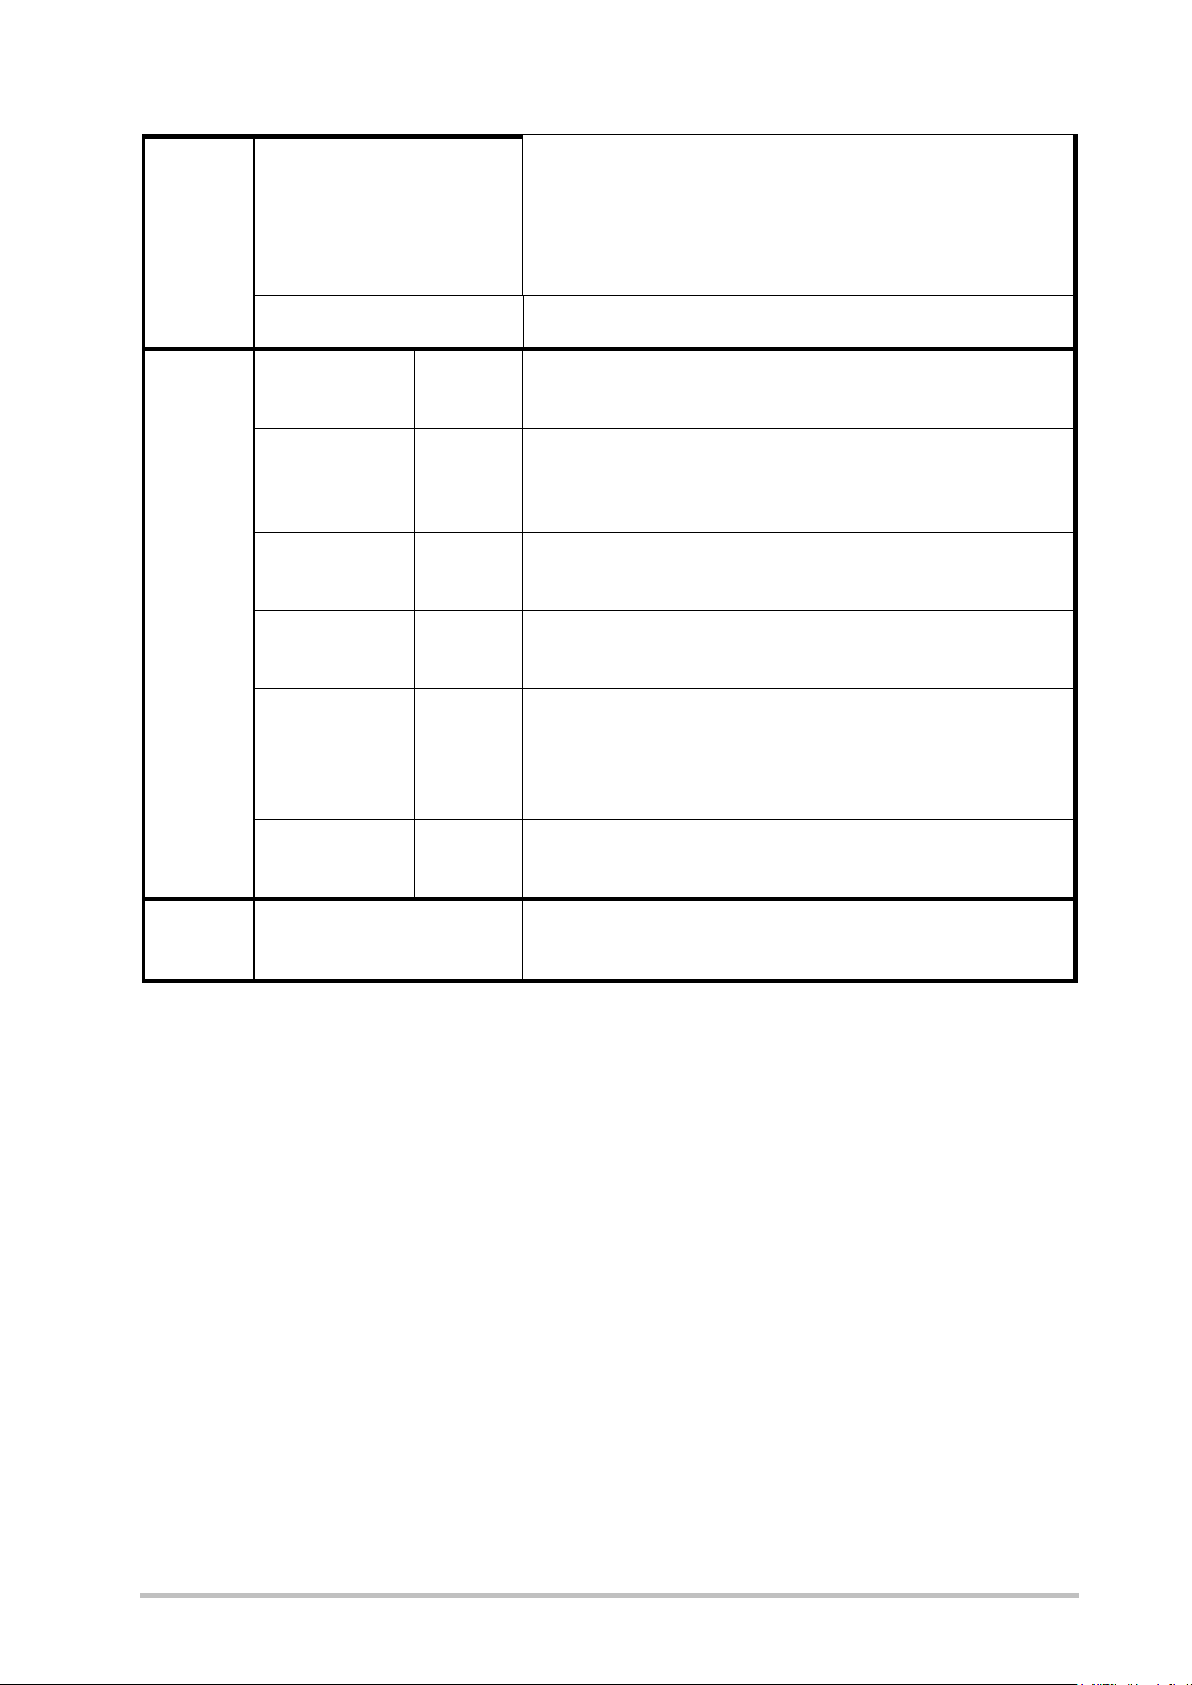
1.2 License Types
GL SPECTROSOFT license list and software options
Licence
name
Options
Description
BASIC
(CRI)
SPD
Graphical respresentation of spectra
Results Window
Calculation of the following photometric results:
- Color coordinates according to CIE 1931 2ᵒ observer
- Color coordinates according to CIE 1964 10ᵒ observer
- Color Rendering Indices Ra , R1 – R14
- Chromaticity error
- Color Peak
- Color Dominant
- Lambda 2 ( FWHM )
- Purity
Measurement Window
Including spectra data in Native, 1nm , 2nm and 5nm step
incremental.
Export / import
Function to export and import data in TXT format
Report
Editor to generate report after the measurement.
Chromaticity charts
Color diagrams according to CIE
- 1931 (x y)
- 1960 (u v)
- 1976 (u’v’)
PRO1
SELECTED RESULTS
Additional window displaying selected results.
COMPARISON WINDOW
Additional window showing the complete set of
measurements
BINING TOOL
Editor to set the brightness and color bins.
ISO evaluation
Measurement protocol according to ISO 3664 standard
MI calculation
Metamerism indices in UV and VIS range
INTENSITY [cd]
Allows to calculate intensity values using the standard
diffusor and distance value setting.
MacAdam
comming soon
The GL SPECTROSOFT software is available in three versions: BASIC, PRO and LAB.
You can also extend the PRO version with individual functionalities available in the LAB
version. You can extend and change versions by adding appropriate licence keys.
GOSSEN Foto- und Lichtmesstechnik GmbH 6
Page 7
Transmission, Reflection
This software option can be used for transmission or
reflection measurements of optical components. Enables to
take reference measurement and then make T or R
measurement of the sample with the use of external light
source and optical accessories.
Scotopic / Photopic
Option for calculating S/P values
LAB
2
TIMER/SERIAL
Product –
No.
Setting of the automatic measurements schedule. Set
RELATIVE
measurements
comparison
Product –
No.
Allows to choose a reference measurements and compare
other measurements to the reference one. Option to show
percentage or real values change.
PASS/FAIL
Product –
No.
Editor to choose the set of parameters as criteria for pass /
fail selection
RANGE
Product –
No.
Allows to change the spectral range in which measurement
results are calculated.
AMBIENT
Product –
No.
This function compensates the influence of the ambient
light where the measurements are mad. The ambient light
measurement can be detected before the test
measurement.
PPFD/PAR
[µmol]
Product –
No.
Calculations of photon flux density and photosynthetically
active radiation
CALIB
Available only as ad-on for
PRO or LAB license
Software for Illuminance, Luminous Flux and Lumiance
calibration of GL Optic instruments.
1
PRO license is an upgrade of BASIC and includes all features of BASIC and a
complete set of additional functions described.
2
Individual functions from LAB can be ordered separately and add-on to PRO license or
a complete LAB license is offered as a bundle.
2 Installation
This is a laboratory software for complete spectral analysis. Depending on the version
you have purchased you have the access to a number of specific data of the spectral
measurements.
Before starting the installation, please ensure that
the operating system oft he computer is at the latest state, that means all
service packs and updates should be installed
you have administrator rights
the virus scan is disabled during the installation process
GOSSEN Foto- und Lichtmesstechnik GmbH 7
Page 8
To start the installation simply run setup GL_SpectroSoft v----.exe program from
your CD. The installation program will guide you through the installation process. The
installation path is determined to enable remote upgrades in the future.
HASP Key
After successful installation of the software you should put the HASP key to USB socket
in your PC. This unit contains the key for your software and you cannot use
GL_SpectroSoft without that. Wait several seconds after connecting to you PC while
Windows is installing the device. The LED will go on when the HASP key is installed.
2.1 Connecting Devices
GL SPECTROSOFT software allows to connect to different types of devices using
drivers:
- SPX Driver (GL SPECTIS 1.0, GL SPECTIS 8.0)
- Androdi USB Driver (MAVOSPEC, GL SPECTIS 1.0 touch, GL SPECTIS 5.0 touch)
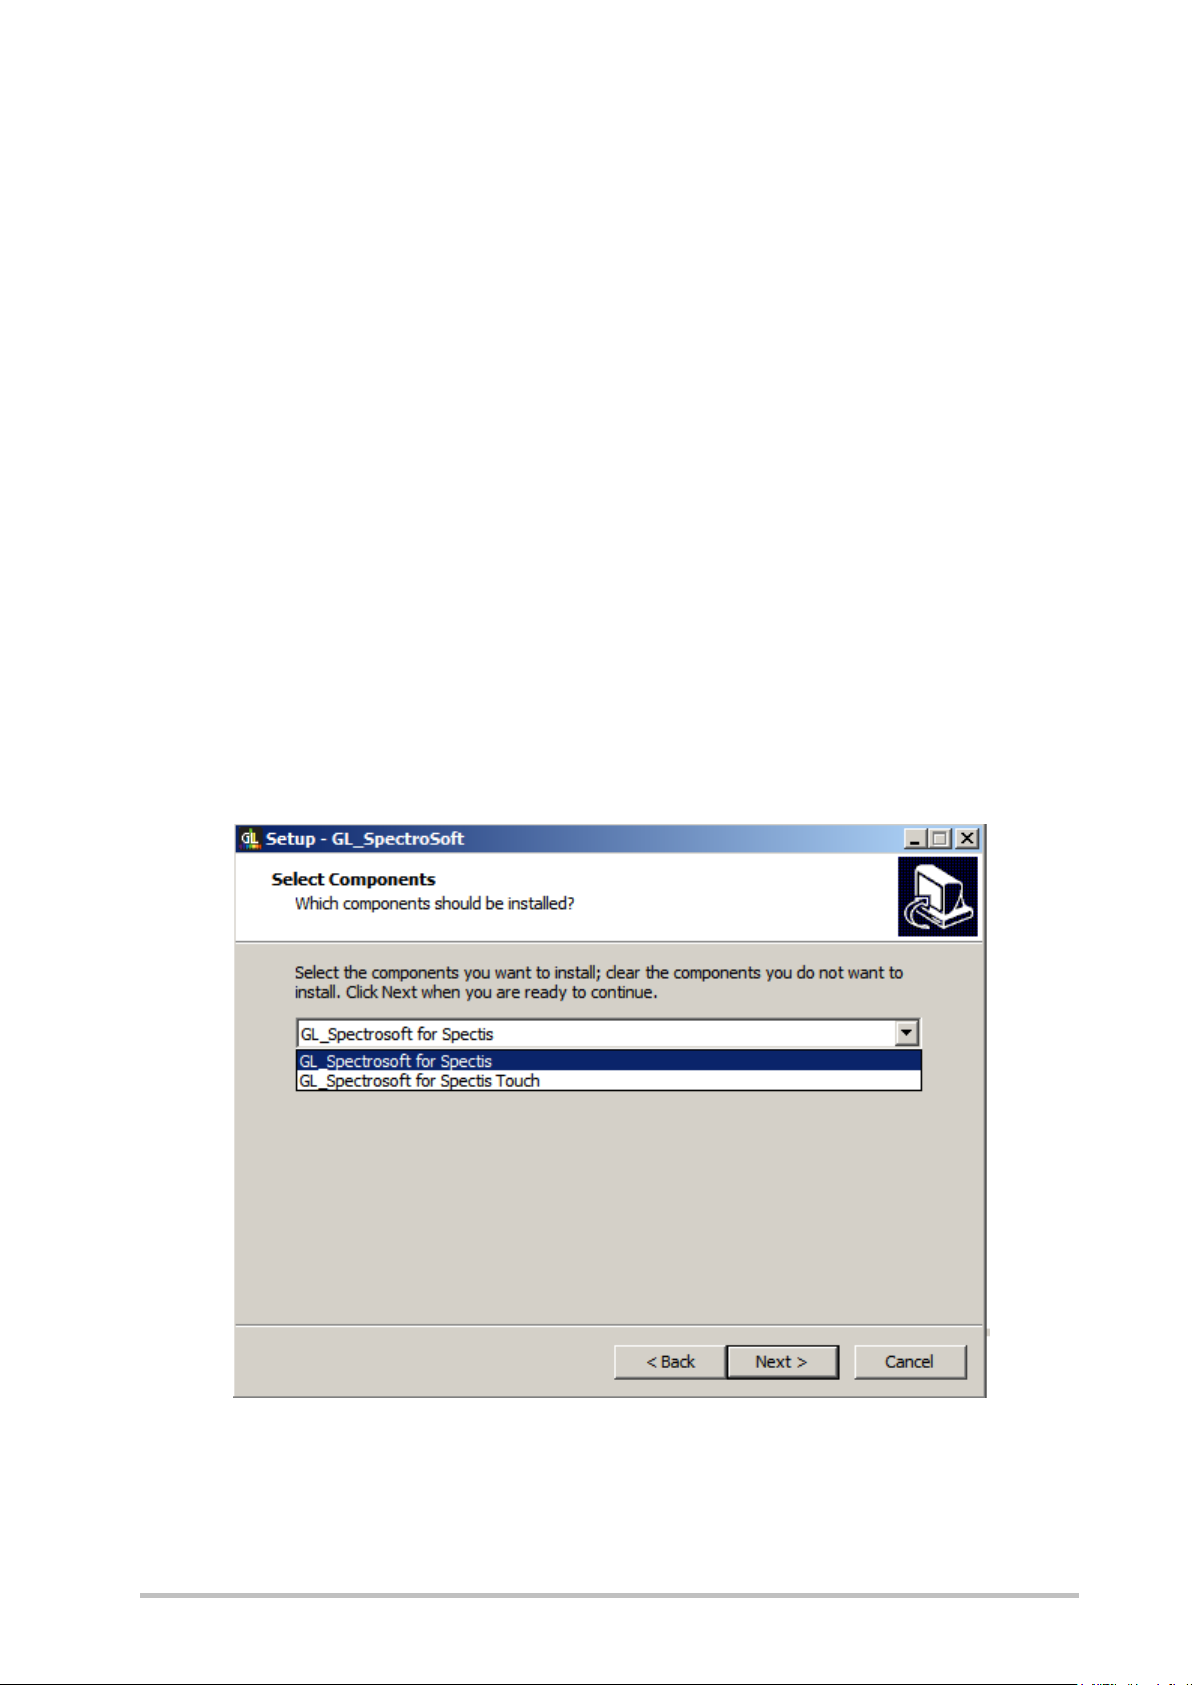
During an installation process user can chooose one of installation types in Select
Components screen:
- GL SPECTROSOFT for GL SPECTIS
- GL SPECTROSOFT for GL SPECTIS touch
GOSSEN Foto- und Lichtmesstechnik GmbH 8
Page 9
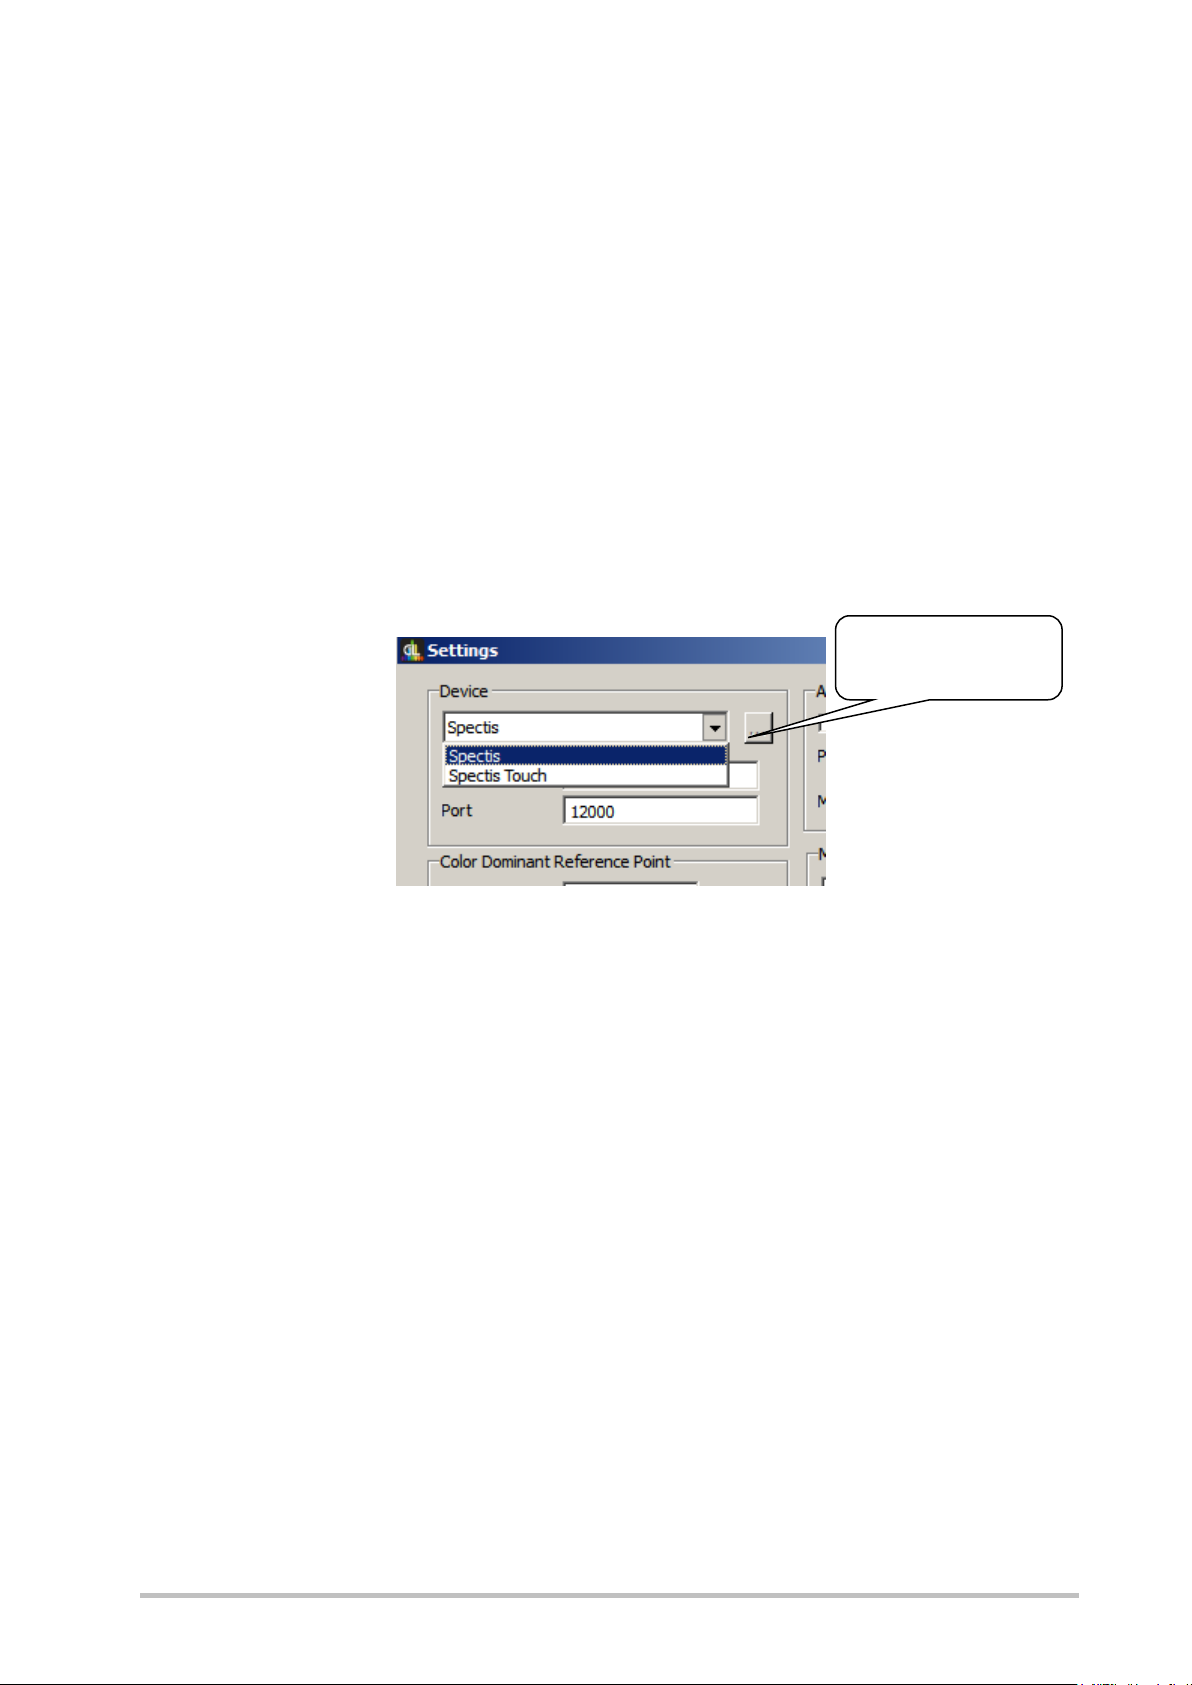
2.1.1 GL SPECTROSOFT for GL SPECTIS
Selected device
preferences button
Only GL_Spectrosoft is installed when you want to use devices using SPX Driver (GL
SPECTIS 1.0, GL SPECTIS 8.0). SPX driver must be installed in addition. Software is
set to work with SPX Driver devices.
2.1.2 GL SPECTROSOFT for MAVOSPEC
GL_Spectrosoft and Androdi USB Driver is installed. This instalation type set software
to work with Androdi USB Driver devices MAVOSPEC via USB cable.
2.1.3 GL SPECTROSOFT with many Devices
When you need to work with different devices using SPX and Android drivers
alternately:
1. Install GL SPECTROSOFT for GL SPECTIS touch.
2. Install SPX Driver.
3. Select Device in GL SPECTROSOFT main menu File->Settings
Types of connection:
1. Spectis - connect via SPX Driver (Spectis 1.0, Spectis 8.0).
TCP connection via SPX Driver. SPX driver must be installed and started. Set IP
address of a PC with SPX and device connected. Use default settings to connect on the
same PC.
2. MAVOSPEC - connect to android device
MAVOSPEC connection type can be set using a device preferences window.
GOSSEN Foto- und Lichtmesstechnik GmbH 9
Page 10

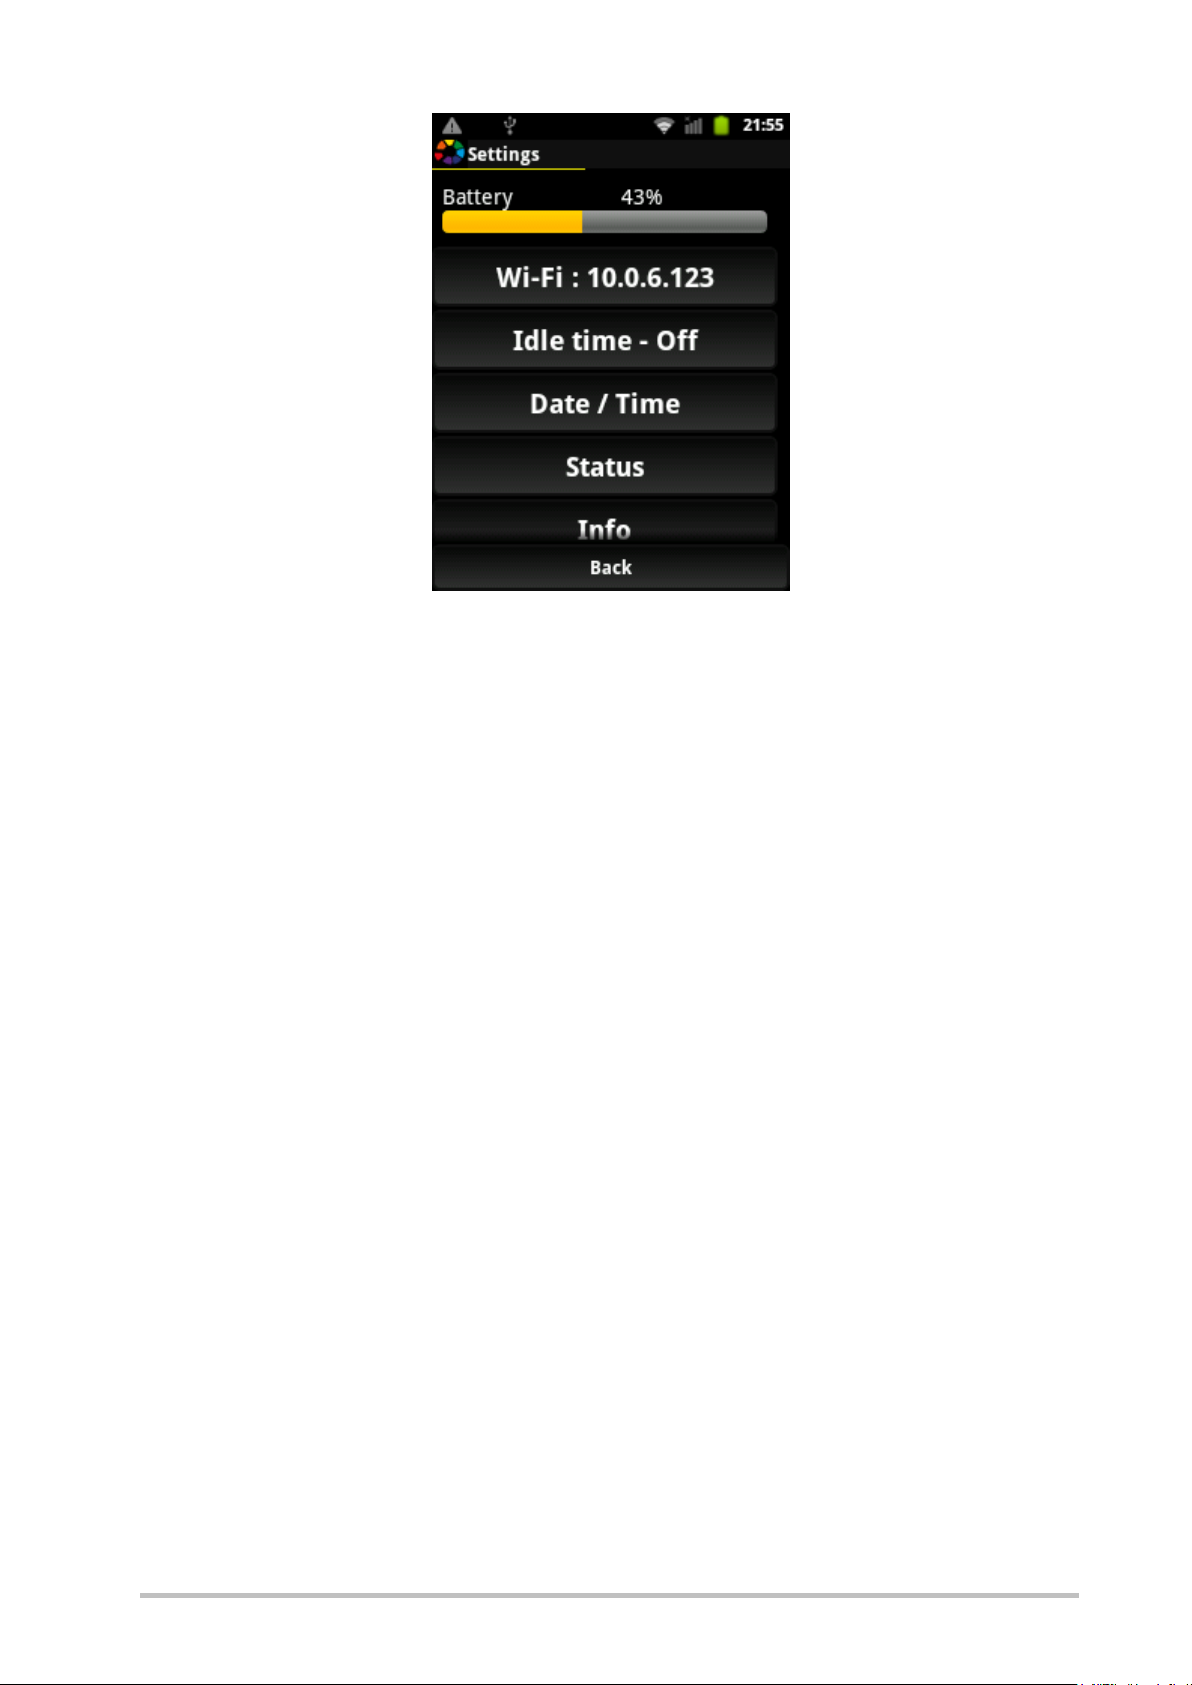
3. MAVOSPEC - WiFi - connect via WiFi Driver
TCP connection via WiFi. Set IP address of a MAVOSPEC device from Settings (e.g
10.0.6.123 on the screen below).
GOSSEN Foto- und Lichtmesstechnik GmbH 10
Page 11
4. MAVOSPEC - USB - connect via Android USB Driver
The connection is done via USB cable. Android USB driver must be installed.
GOSSEN Foto- und Lichtmesstechnik GmbH 11
Page 12

2.2 Changing or Extending License
Select File->Licence from main menu to extend software functionality with a licence
key.
Change License Version
To change the version of your software (e.g. when you want extend from the Basic
version to Pro) :
1. Copy the license version code to the License key field or load it from a file using
Load from file button.
2. Press OK button below to accept.
3. Restart the software.
After the software restarts, the new version is available.
GOSSEN Foto- und Lichtmesstechnik GmbH 12
Page 13

Additional Function License
To add new functionality to your software:
1. Connect the device and make at least one measurement.
2. Generate a request code - request code appears in the Request code field.
3. Save the request code with the Save to file button and send it to your reseller.
4. Get an additional function code from your reseller and load it with Load licence from
file (a code should appear in the Additional function code field)
5. Add a licence key with the Add licence keybutton.
6. Restart the software.
After the software restarts, the new functionality is available.
GOSSEN Foto- und Lichtmesstechnik GmbH 13
Page 14

3 Startup
Measurement and analysis using GL SPECTROSOFT
Startup
1. Connect your measuring instrument with USB cable to your computer.
2. Start the SPX driver Software (only when use Spectis touch 1.0 or 8.0).
3. Select a device type in File->Settings (default device depends on the device you
choose during installation).
4. Insert the HASP USB Key, and wait several seconds for the system to install the
key.
5. Now you can run the GL SPECTROSOFT.
In the upper left corner there is a description of the currently running program options.
Below you will find the icons bar for all functions of the program.
GOSSEN Foto- und Lichtmesstechnik GmbH 14
Page 15

4 Basic Function Tool Bar
The different functions are accessible depend on the version / license of the program.
1. 2. 3. 4 . 5. 6. 7. 8. 9. 10. 11. 12. 13. 14. 15.
1. Open: previously saved measurements can be open,
2. Save group: all currently open / active measurements can be saved in one file
3. Zoom max optimizes the view of the whole spectrum chart in the
current window size.
a) Using the mouse wheel you can zoom image spectrum +/ b) Hold Y and move the wheel to change the view in the Y-axis
c) Hold X and move the wheel to change the view of the X-axis
d) Click twice on the chart box and the view options set to max zoom
4. Measure To make measurements, or simply press the space bar. Additionally, the
GL SPECTIS 1.0 is equipped with a trigger button located on the side of the body.
5. Continuous sets the measurement procedure in continuous mode according
to preset parameters, integration time and number of
repetitions. This allows for continuous monitoring of changes in the spectrum under
certain conditions. To stop click Continuous again.
6. Serial measurement interval. Allows you to performa series of measurements with a
programmed time interval (see serial measurements chapter).
7. Serial measurement count. Allows you to performa programmed count of
measurements (see serial measurements chapter).
8. Config button allows access to set the basic parameters of measurements such as:
a) integration time;
b) number of repetitions of the measurement
c) data save path
d) range of spectral measurement
9. Indication of the temperature.
10. Indication of the signal level.
GOSSEN Foto- und Lichtmesstechnik GmbH 15
Page 16

11. Transmition/Refectance mode
This mode allows to make comparative measurements. Reference mesurement is
triggered using REF button. Next measure triggered with M button is compared with
the reference measurement and signal data are shown as a percent of referens
signal.
12. Background mark a current measurement as a ambient light measurement. Next
user can using context menu substract selected background signal from another
measurement to compensate ambient light. In result next tab is created with the
signal after an ambient light substraction. Thistoolisusefulwhen you can
notcompletelyeliminate an ambient lightduring the measurements.
13. Background const works in smilar way like background but marked ambient light is
substracted after measurement and final signal after substruction is presented
immediately.
14. Relative mark a current measurement as a reference signal. Next using Relative
View button user can trace how photometric and radiometric parameters of the
signal are changing. Results windows shows parameter differences.
15. Relative view turn on/off relative view in results window when relative mode in
active.
GOSSEN Foto- und Lichtmesstechnik GmbH 16
Page 17

4.1 Serial measurements
1. Start/stop serial
measurements
2. Interval between
measurements
3. Measurements
count
GL_SpectroSoft allows to program the serial measurements with defined interval
and measurements count.
1. Continuous button starts/stops continuous and serial measurements.
Continuous measurement (when interval and count is set to 0) triggers the
measurements one after the other and shows spectrum on the same chart. The
function is useful to trace change of spectrum and chromaticity parameters of a light
source.
Serial measurements are also triggered by continuous button but when interval or
count is set to a value other than 0. In this case results are shown in separate
graphs.
2. Interval - interval between measurements in seconds. Measurements are triggered
one after the other when interval is set to 0.
3. Count - number of measurements to do. When set to 0, measurements loop can be
stopped by continuous button. During serial measurements Count filed shows the
current number of measurements to do.
The program allows also to set the start time of series measurements with interval
and measurements count.
It can be set from Action->Set continuous start menu:
GOSSEN Foto- und Lichtmesstechnik GmbH 17
Page 18

GOSSEN Foto- und Lichtmesstechnik GmbH 18
Page 19

5 Top Menu Options
In the upper left corner of the screen you will find the access to remaining menu
functions.
5.1 File
Open - to open a previously saved measurements
Open - to open only one measurement of a previously saved measurements
group
Save group - saves the currently open group of measurements
Save - saves only the current open measurement
Import - you can also open measurements made in other programs
providing it is saved in a text format where the first column shows the wavelength and
the second column measured values separated by tabulator sign
Export - allows to save the data in a text format.
Export >Clipboard - saves to the data in the system Clipboard
Report - generate measurement report for the currently displayed measurement
Language - language change
Licence - allows to change the software version type or add a new functionality (se
Types of licenses section)
Settings- gives access to additional system settings.
GOSSEN Foto- und Lichtmesstechnik GmbH 19
Page 20

5.2 ISO 3664 Assessment
ISO 3664 assessment - it is a measuring procedure according to ISO 3664:2000 norm
for Viewing Conditions in the Graphic technology and photography.
Note: before you start this procedure set the measurements parameters
for integration time and number of repetitions
1. To start the procedure go to top menu and click File, ISO 3664 and the following
dialog box will appear:
2. Accept this box and proceed to determine the illuminated surface area.
3. Once you select the proper Norm following window will appear:
GOSSEN Foto- und Lichtmesstechnik GmbH 20
Page 21

4. Place the GL SPECTIS 1.0 in the shown place and Click the icon twice to make
measurement. The program sets the next measurement location in which to place
the spectrometer and measure. Proceed untill the procedure is finished.
5. After completing the measurements in all set locations the result dialog box will
appear with indication of test results.
6. After completion of the measurement procedure you can generate the report. To do
this, click the Report at the bottom of the measurement.
5.3 Edit
Zoom in - zoom in a spectrum chart
Zoom out - zoom out a spectrum chart
Zoom max - optimizes the view of the whole spectrum chart in the
current window size.
Switch to left - switch spectrum chart view to the previous measurement
Switch to right - switch spectrum chart view to the next measurement
Switch to the end - switch spectrum chart view to the last measurements
Switch to all - switch spectrum chart view to the all measurements view
Always zoom max - a new measurement always openes in the optimized view of the
whole spectrum chart
PPFD view - turn on/off photosynthetic photon flux density view (spectrum chart
background changes to light green colour in this mode). PPFD is the measure of the the
number of photons (in the photosynthetically active range of 400nm-700nm) that fall on
1 square meter per second.
Paint wavelengths - turn on/off spectrum chart coloring.
GOSSEN Foto- und Lichtmesstechnik GmbH 21
Page 22

5.4 Action
See basic functions tool bar
5.5 Window
Save desktop - save a current desktop layout
Open desktop - open previously saved desktop layout
Measurement, Status, Results, CIE Chart, Comparision, Quick config, Selected
results, Toolbar - show/hide measurement views
GOSSEN Foto- und Lichtmesstechnik GmbH 22
Page 23

6 Measurements Result Windows
6.1 Measurement
Measurement includes the results for each wavelength. Use the drop-down menu
to select the presentation of results at specific intervals: Native – the source data as
1nm, 2nm and 5nm;
6.2 Status
Status window shows the system data: the current calibration files, a connected
device, the coefficients and other
GOSSEN Foto- und Lichtmesstechnik GmbH 23
Page 24

6.3 Results
Results window contains the results of measurement in accordance with
CIE 1931 2 ° observer and CIE 1964 10 ° observer
It also presents:
Correlated Color Temperature of a light source CCT - Kelvin value
Chromaticity Error
Peak Color
Color dominants
Depending on the software options following calculations are also available:
Color rendering index CRI
MI metameryzmu factor
Luminous intensity
Purity
Radiometric
PPFD
PAR
Binning group
Brightness group
GOSSEN Foto- und Lichtmesstechnik GmbH 24
Page 25

6.4 Chart
Chart window is a set of graphs representing chromacity diagrams determined by
the CIE. Bookmarks allow you to select a particular chart type.
6.5 Selected results
A very convenient perspective of results preview is selected results window. To make
this window visible right click on the tool bar and check "Selected results".
Now selected results window is visible and you can see a set of the most important
measurement parameters. To change a template set of a parameters or font, right click
on the selected results window - context menu appears.
GOSSEN Foto- und Lichtmesstechnik GmbH 25
Page 26

Now you can select template containing set of parameter which will be shown in the
selected results window.
Templates are stored in "C:\GL Optic\GL_Spectrosoft\tables\results" directory and are
standard text files with codes of parameters which have to be presented each in a new
line. A separator empty lines are allowed. Sample "XYZ.txt" file might look something
like this:
GOSSEN Foto- und Lichtmesstechnik GmbH 26
Page 27

X2
Y2
Z2
X10
Y10
Z10
The list of codes which can be used in selected results template file (depending on
version):
x2, y2, u2', v2', L2, a2, b2, X2, Y2, Z2, x10, y10, y10, u10',v10', L10, a10, b10, X10,
Y10, CCT, ChErr, ColPeak, ColPeakVal, ColDom, Purity, Radiometric, PAR, Ra, R1,
R2, R3, R4, R5, R6, R8, R9, R10, R11, R12, R13, R14, Mivis, Miuv, Binning,
Brightness.
Codes corresponds with parameters which are presented in results window.
For instance:
x2 - x CIE 1931 2˚observer,
Y2 - Y CIE 1931 2˚ observer,
x10 - x CIE 1964 10˚ observer,
Y10 - Y CIE 1964 10˚ observer, etc.
GOSSEN Foto- und Lichtmesstechnik GmbH 27
Page 28

6.6 Comparison Table
Comparison table allow to compare spectrometric values of many measurements in one
table. This useful tool equips user with standard functions as designing custom sets of
values, data sorting, export to text file (tab-separated values format) to use in a thirdparty software (e.g. a calculation sheet ).
Context menu (right mouse button) allows to call functions connected with the
comparison table.
Export comparison - > txt - export table to a text file (tab-separated values format)
Export comparison - > Clipboard - export table to system clipboard
Load table template - load previously saved table layout template from a file
Save table template - save table layout template to file
Remove columns - remove selected columns from the table layout
Add column - add column to the table layout
Default arrangement - set default table layout
GOSSEN Foto- und Lichtmesstechnik GmbH 28
Page 29

7 TOOLS
7.1 Bin Editor
Binning groups can be defined by Bin Editor tool (Tools->Bin Editor)
In the first tab user can defain xy criterions. Each row is definition for one polygon which
determines location of x, y parameters.
Columns meaning:
1. Name of a group.
2. x coordinate of the first point of the polygon.
3. y coordinate of the first point of the polygon.
4. x coordinate of the second point of the polygon.
5. y coordinate of the second point of the polygon, and so on.
6,7. The third point.
8,9. The forth point.
You can specify more points if it's needed.
GOSSEN Foto- und Lichtmesstechnik GmbH 29
Page 30

Definition of binning groups may be saved to or load form a text file. Software always
use the last used group which path is shown above the table.
Sometimes it's easier to edit or import binning groups directly to a text file.
Sample text file structure is presented below:
5U 0.437 0.389
0.442 0.398
0.448 0.400
0.443 0.391
6U 0.442 0.398
0.447 0.408
0.453 0.409
0.448 0.400
7U 0.447 0.408
0.451 0.417
0.458 0.418
0.453 0.409
8U 0.451 0.417
0.456 0.426
0.462 0.427
0.458 0.418
Names and values in the file are separated by the tab character. Last selected set is
stored in the file C:\GL Optic\GL_Spectrosoft\default\binning.pbp.
GOSSEN Foto- und Lichtmesstechnik GmbH 30
Page 31

Brightness groups are stored in similar way. You can edit them, save and load using the
second tab in Bin Editor.
Columns meaning:
1. Name of a group.
2. Brigthness minimum value.
3. Brigthness maximum value.
Sample text file structure is presented below:
JZ 61 71
KX 71 82
KY 82 97
KZ 97 112
Names and values in the file are separated by the tab character. Last selected set is
stored in the file C:\GL Optic\GL_Spectrosoft\default\brightness.plp.
GOSSEN Foto- und Lichtmesstechnik GmbH 31
Page 32

When binning and brightness groups are defined, the appropriate names are presented
in results window and comparison table for each measurement.
GOSSEN Foto- und Lichtmesstechnik GmbH 32
Page 33

7.2 Pass/Fail Editor
Turn on/off pass/fail check
Selectsthe parametersto
Setrange (min-max )
Use current
tolerance.
Binning and
monitoring
Pass/Fail tool (Tools->Pass/Fail Editor) allows to define user conditions which light
should meet and should be checked after a measurement.
Prepare conditions or open previously prepared and turn on pass/fail function.
measurement
as a reference
signal and find
similar with
defined
brightness
GOSSEN Foto- und Lichtmesstechnik GmbH 33
Page 34

After measurement in results window and comparison table pass/fail check results are
presented.
Each parameter which was selected to monitoring is shown as a:
- green - when meets conditions,
- red - when does not meet conditions,
what provides user with detailed information which parameters do not meet selected
conditions.
Additionally Pass/Fail parameter shows the overall result of the test (PASS/FAIL). Using
this parameter and the comparison table user can divide or compare measurements in
an easy way.
GOSSEN Foto- und Lichtmesstechnik GmbH 34
Page 35

8 Reports
A report template is a text file in HTML format. It can be created in any text or HTML. A
generated report is opened in default HTML browser.
9 Practical Notes
Make sure that the integration time is properly matched to the level of the tested
source. The best results are obtained by measuring between 40% and 90% signal
level. The value of the signal is visible on the top bar after each measurement.
If recommended conditions and time of measurement allows set repeated measure-
ments. This helps to reduce the impact of noise on the measurement results.
When measuring narrow band light sources like LEDs set limited spectral range of
the measurement. This significantly reduces the influence of stray light on the
measurement results.
GOSSEN Foto- und Lichtmesstechnik GmbH 35
Page 36

Printed in Germany – Subject changed without note
GOSSEN Foto- und Lichtmesstechnik GmbH I Lina-Ammon-Str.22 I D-90471 Nürnberg I Germany
Telefon: +49 911 8602-181 I Fax: +49 911 8602-142 I E-Mail: info@gossen-photo.de
www.gossen-photo.de
GOSSEN Foto- und Lichtmesstechnik GmbH 36
 Loading...