

GE HEALTHCARE Biacore T100 Handbook

GE Healthcare
Biacore T100
Software Handbook


Contents
1Introduction
1.1 System overview ............................................................................ 9
1.2 Support for use in regulated environments ............................ 10
1.3 Associated documentation ........................................................ 10
1.4 Biacore terminology .................................................................... 10
2 Control Software – general features
2.1 Operational modes ...................................................................... 15
2.2 User interface ............................................................................... 16
2.2.1 On-line help.................................................................................................17
2.3 Basic operation ............................................................................. 17
2.3.1 Selecting cycles and sensorgrams.................................................... 17
2.3.2 File menu...................................................................................................... 17
2.3.3 Edit menu ..................................................................................................... 19
2.3.4 View menu................................................................................................... 19
2.3.5 Run menu..................................................................................................... 21
2.3.6 Tools menu.................................................................................................. 21
2.3.7 Right-click menus ..................................................................................... 22
2.4 File storage .................................................................................... 23
2.4.1 Wizard templates and methods......................................................... 23
2.4.2 Result files.................................................................................................... 23
3Manual run
3.1 Preparing for a manual run ........................................................ 25
3.1.1 Instrument preparations ....................................................................... 25
3.2 Starting a manual run ................................................................. 26
3.3 Controlling a manual run ........................................................... 27
3.4 Ending a manual run ................................................................... 29
4 Application wizards
4.1 Wizard templates ......................................................................... 31
4.1.1 Creating and editing wizard templates .......................................... 31
4.1.2 Running wizards ....................................................................................... 32
4.2 Common wizard components .................................................... 32
4.2.1 Injection sequence ...................................................................................32
4.2.2 Assay setup ................................................................................................. 34
4.2.3 Injection parameters............................................................................... 35
4.2.4 Sample and control sample tables ...................................................36
4.2.5 System preparations............................................................................... 37
4.2.6 Rack positions............................................................................................ 39
4.2.7 Prepare Run protocol.............................................................................. 43
Biacore T100 Software Handbook BR-1006-48 Edition AE 3

4.3 Surface preparation wizards ......................................................44
4.3.1 Immobilization pH scouting................................................................. 44
4.3.2 Immobilization........................................................................................... 46
4.4 Assay development wizards ....................................................... 52
4.4.1 Regeneration scouting........................................................................... 52
4.4.2 Buffer scouting........................................................................................... 55
4.4.3 Surface performance .............................................................................. 58
4.5 Assay wizards ................................................................................59
4.5.1 Binding analysis ........................................................................................ 59
4.5.2 Concentration analysis .......................................................................... 62
4.5.3 Kinetics/Affinity.......................................................................................... 66
4.5.4 Thermodynamics...................................................................................... 70
4.6 Control experiment wizards .......................................................72
4.6.1 Mass transfer control.............................................................................. 73
4.6.2 Linked reactions control........................................................................ 73
4.6.3 Evaluation of control experiments.................................................... 74
5Methods
5.1 Opening methods .........................................................................77
5.2 Method structure ..........................................................................78
5.3 Method overview ..........................................................................79
5.4 General settings ............................................................................80
5.5 Assay steps ....................................................................................81
5.5.1 Base settings .............................................................................................. 82
5.5.2 Number of replicates............................................................................... 84
5.5.3 Recurrence................................................................................................... 84
5.5.4 Assay step preparations........................................................................ 85
5.6 Cycle types .....................................................................................85
5.6.1 Commands.................................................................................................. 86
5.6.2 Variables....................................................................................................... 92
5.6.3 Report points.............................................................................................. 95
5.7 Variable settings ...........................................................................96
5.8 Verification .................................................................................... 97
5.9 Setup Run .......................................................................................97
5.9.1 Detection ...................................................................................................... 97
5.9.2 Variables....................................................................................................... 98
5.9.3 Cycle run list................................................................................................ 99
5.9.4 System preparations............................................................................... 99
5.9.5 Rack positions..........................................................................................100
5.9.6 Prepare Run Protocol............................................................................100
5.9.7 Starting the run .......................................................................................100
5.10 Requirements for assay-specific evaluation .........................100
5.10.1 Concentration analysis ........................................................................100
5.10.2 Kinetics/Affinity........................................................................................101
5.10.3 Thermodynamics....................................................................................101
5.10.4 Affinity in solution...................................................................................101
4 Biacore T100 Software Handbook BR-1006-48 Edition AE

5.10.5 Other requirements................................................................................102
6 Evaluation software – general features
6.1 User interface ............................................................................. 105
6.1.1 Organization .............................................................................................105
6.1.2 The Evaluation Explorer.......................................................................106
6.2 Opening files ............................................................................... 106
6.3 Common display functions ....................................................... 107
6.3.1 Zooming the display..............................................................................107
6.3.2 Right-click menus ...................................................................................107
6.4 Predefined evaluation items .................................................... 109
6.4.1 Sensorgram...............................................................................................109
6.4.2 Plots..............................................................................................................109
6.5 Custom report points ................................................................110
6.5.1 Adding report points .............................................................................111
6.5.2 Editing and deleting report points...................................................112
6.6 Keywords ..................................................................................... 113
6.7 Solvent correction ...................................................................... 115
6.7.1 Background...............................................................................................115
6.7.2 When solvent correction should be used.....................................116
6.7.3 How solvent correction works..........................................................116
6.7.4 Applying solvent correction................................................................117
6.8 Evaluation methods ...................................................................119
6.8.1 Creating evaluation methods............................................................119
6.8.2 Applying evaluation methods ...........................................................120
7 Data presentation tools
7.1 Sensorgram items ...................................................................... 121
7.1.1 Selecting sensorgrams for display..................................................122
7.1.2 Removing data ........................................................................................122
7.1.3 Sensorgram adjustment......................................................................123
7.1.4 Markers .......................................................................................................124
7.2 Plot items ..................................................................................... 125
7.2.1 Selector functions...................................................................................126
7.2.2 Table functions.........................................................................................127
7.2.3 Sorting the plot........................................................................................128
7.2.4 Fitting curves to points.........................................................................128
7.2.5 Adjusting plots for controls ................................................................130
7.2.6 Ranking .......................................................................................................132
7.3 Bar chart items ........................................................................... 133
7.3.1 Selector functions...................................................................................133
7.3.2 Display options ........................................................................................134
7.4 Report point table ......................................................................134
7.4.1 Displaying the report point table.....................................................134
8 Concentration analysis
Biacore T100 Software Handbook BR-1006-48 Edition AE 5

8.1 Requirements for concentration evaluation .........................139
8.1.1 Calibrated measurements..................................................................139
8.1.2 Calibration-free measurements.......................................................139
8.2 Evaluating calibrated concentration analyses .....................140
8.2.1 Calibration curves...................................................................................140
8.2.2 Control samples ......................................................................................142
8.2.3 Samples ......................................................................................................143
8.2.4 Custom models for calibration curves ..........................................144
8.2.5 Evaluating combined result sets.....................................................144
8.3 Evaluating calibration-free measurements ..........................145
8.3.1 Selecting samples...................................................................................146
8.3.2 Removing disturbed data....................................................................149
8.3.3 Performing the evaluation..................................................................149
8.3.4 Interpreting the results.........................................................................150
8.3.5 Fitting model.............................................................................................151
9 Kinetics and affinity analysis
9.1 Requirements for kinetics and affinity evaluation ...............154
9.2 Evaluating kinetics and affinity in single mode ....................155
9.2.1 Basic procedure ......................................................................................155
9.2.2 Multiple ligand densities......................................................................162
9.3 Batch mode evaluation .............................................................163
9.4 Quality assessment for kinetics evaluation ..........................164
9.4.1 The Quality Control tab........................................................................164
9.4.2 Statistical parameters ..........................................................................168
9.4.3 Components of the fit...........................................................................170
9.4.4 Check kinetic data..................................................................................170
9.5 Quality assessment for affinity evaluation ...........................172
9.6 Summarizing kinetics and affinity results .............................173
9.6.1 Creating kinetic summaries...............................................................173
9.6.2 Basic summary presentation ............................................................173
9.6.3 On-off rate maps.....................................................................................176
9.7 Curve fitting principles ..............................................................177
9.7.1 Fitting procedure ....................................................................................177
9.7.2 Local and global parameters ............................................................178
9.8 Predefined models ......................................................................179
9.8.1 Kinetics – 1:1 binding............................................................................180
9.8.2 Kinetics – Bivalent Analyte .................................................................181
9.8.3 Kinetics – Heterogeneous Analyte ..................................................182
9.8.4 Kinetics – Heterogeneous Ligand....................................................184
9.8.5 Kinetics – Two State Reaction...........................................................186
9.8.6 Affinity – Steady State 1:1...................................................................188
9.9 Creating and editing models ....................................................188
9.9.1 Interaction models for kinetics .........................................................189
9.9.2 Equation models for kinetics .............................................................194
9.9.3 Models for steady state affinity ........................................................195
6 Biacore T100 Software Handbook BR-1006-48 Edition AE

10 Thermodynamic analysis
10.1 Background ................................................................................. 197
10.1.1 Equilibrium thermodynamics ............................................................197
10.1.2 Transition state thermodynamics ...................................................198
10.2 Performing thermodynamic analysis ..................................... 199
11 Affinity in solution
11.1 Conventions and background ..................................................203
11.1.1 Experimental setup................................................................................203
11.1.2 Evaluation principles.............................................................................203
11.2 Requirements for affinity in solution ...................................... 204
11.3 Evaluation of affinity in solution .............................................205
Appendix A Data import and export
A.1 Exporting data ............................................................................ 209
A.1.1 Export functions......................................................................................209
A.2 Importing data ............................................................................210
A.2.1 Control Software.....................................................................................210
A.2.2 Evaluation Software..............................................................................213
Appendix B Method examples and recommendations
B.1 Affinity in solution ...................................................................... 215
B.2 Calibration-free concentration analysis ................................216
B.2.1 Assay steps and general settings....................................................216
B.2.2 Cycle types.................................................................................................216
B.2.3 Variable settings......................................................................................217
B.2.4 Setup Run...................................................................................................218
B.3 GST kinetics ................................................................................. 219
B.4 Inject and Recover .....................................................................221
B.5 Kinetics heterogeneous analyte .............................................. 223
B.6 L1 liposome capture .................................................................. 223
B.7 LMW kinetics and LMW Screen ................................................ 224
B.8 NTA kinetics ................................................................................. 226
B.9 Single-cycle kinetics ..................................................................227
Index.............................................................................................. 229
Biacore T100 Software Handbook BR-1006-48 Edition AE 7

8 Biacore T100 Software Handbook BR-1006-48 Edition AE

1 Introduction
Biacore™ T100 is a high performance system for analysis of biomolecular
interactions, based on GE Healthcare’s surface plasmon resonance (SPR)
technology. The Control Software supplied with the system offers easy-to-use
wizards for assay development and common applications together with flexible
facilities for designing custom analysis methods using a graphical interface
called Method Builder. Results are evaluated in separate Evaluation Software
designed for efficient and flexible evaluation, with dedicated functions for
common applications.
This Handbook describes in detail how to use the Control and Evaluation
Software.
1.1 System overview
Instrumentation in the Biacore T100 system is described in full in the
Biacore T100 Instrument Handbook. Important features relevant to software
operation include:
Introduction 1
• Biacore T100 supports simultaneous analysis in up to four flow cells
connected in series. The flow cells are arranged in pairs (Fc1-2 and Fc3-4)
with minimum dead volume between the flow cells in a pair to provide
accurate reference subtraction.
• The sample compartment accommodates one microplate (96- or 384-well,
regular or deep-well capacity) and one reagent rack for reagent vials. A
combined sample and reagent rack can be used in place of the separate
microplate and reagent rack.
• Material that binds to the sensor surface during sample injection can be
recovered in a small volume of liquid for further analysis by e.g. mass
spectrometry.
• The temperature in the sample compartment is controlled separately from
the analysis temperature, allowing samples to be kept at one temperature
while analysis is performed at another. Samples equilibrate to the analysis
temperature during injection into the flow cell. The analysis temperature
can be varied during a run, and the sample compartment temperature
can be set to follow the analysis temperature if desired.
• The system includes a buffer selector valve, allowing analysis to be
performed in up to four different buffers in the same unattended run.
Biacore T100 Software Handbook BR-1006-48 Edition AE 9

1 Introduction
1.2 Support for use in regulated environments
1.2 Support for use in regulated environments
Support for use in regulated (GxP1) environments is provided in an optional
package that adds appropriate functionality to the Biacore T100 software.
Functions for GxP support are described in a separate Biacore T100 GxP
Handbook. Descriptions of software in the current Handbook apply to
installations both with and without the GxP package unless otherwise stated.
1.3 Associated documentation
This Handbook describes Biacore T100 Control Software and Evaluation
Software, version 2.0. Any functionality that is added in optional add-on
modules is described in separate documentation.
Biacore T100 Instrument Handbook describes the instrumentation in the
Biacore T100 system, with instructions for operation, maintenance and
troubleshooting.
Biacore T100 GxP Handbook describes functionality added with the optional
GxP package, together with some recommendations for using the system in a
regulated environment.
Other general handbooks and documentation describing the technology are
available from GE Healthcare. Information may also be found on the Internet at
www.biacore.com.
1.4 Biacore terminology
Biacore monitors the interaction between two molecules, of which one is
attached to the sensor surface and the other is free in solution. The following
terms are used in the context of work with Biacore systems (see Figure 1-1):
• The partner attached to the surface is called the ligand. Attachment may
be covalent or through high affinity binding to another molecule which is
in turn covalently attached to the surface. In the latter case the molecule
attached to the surface is referred to as the capturing molecule.
Note: The term “ligand” is applied here in analogy with terminology used in
affinity chromatography contexts, and does not imply that the
surface-attached molecule is a ligand for a cellular receptor.
•The analyte is the interacting partner in solution for which the
concentration is to be measured. In direct binding assays, the analyte
binds directly to the ligand. In inhibition assays, the concentration of
analyte is measured indirectly through binding of an additional molecule.
1
GxP is used as a generic abbreviation for GLP (Good Laboratory Practice), GMP (Good
Manufacturing Practice) and GCP (Good Clinical Practice).
10 Biacore T100 Software Handbook BR-1006-48 Edition AE

Introduction 1
Figure 1-1. Ligand, analyte and capturing molecule in relation to the sensor surface.
• Regeneration is the process of removing bound analyte from the surface
after an analysis cycle without damaging the ligand, in preparation for a
new cycle.
• Response is measured in resonance units (RU). The response is directly
proportional to the concentration of biomolecules on the surface.
•A sensorgram is a plot of response against time (see Figure 1-2), showing
the progress of the interaction. This curve is displayed directly on the
computer screen during the course of an analysis. Sensorgrams may be
analyzed to provide information on the rates of the interaction.
• In many assay situations, sample passes over two or more flow cells in
series, where one flow cell (usually the first) serves as a reference while
ligand is attached in the other flow cell(s). Surfaces with ligand are referred
to as active: blank surfaces used for reference purposes are reference.
• A particular sensorgram is referred to as a curve in several contexts in the
software. This terminology is used to distinguish between different classes
of sensorgram that recur within a run: for example, measurements on one
active and one reference surface can generate separate curves for each
of the two flow cells and a third reference-subtracted curve (active minus
reference)
•A report point records the response on a sensorgram at a specific time
averaged over a short time window, as well as the slope of the sensorgram
over the window. The response may be absolute (above a fixed zero level
determined by the detector) or relative to the response at another
specified report point.
Biacore T100 Software Handbook BR-1006-48 Edition AE 11

1 Introduction
1.4 Biacore terminology
Figure 1-2. Schematic illustration of a sensorgram. The bars below the sensorgram
curve indicate the solutions that pass over the sensor surface.
12 Biacore T100 Software Handbook BR-1006-48 Edition AE

Control Software
Biacore T100 Software Handbook BR-1006-48 Edition AE 13

14 Biacore T100 Software Handbook BR-1006-48 Edition AE

Control Software – general features 2
2 Control Software – general features
2.1 Operational modes
Biacore T100 Control Software offers three modes of operation:
• Manual run provides interactive control of the instrument operation,
executing commands singly as they are issued. This mode is most useful
for ad hoc experiments involving one or a few injections, such as testing
the response obtained from injection of a single sample.
• Application wizards provide guidance in setting up experiments for assay
development and execution. Separate wizards are offered for different
purposes such as ligand immobilization, concentration determination or
measurement of kinetic constants. Each wizard consists of an ordered
series of dialog boxes, ensuring that the essential features of the
application setup are correctly defined.
• Methods provide greater flexibility (and conversely less guidance) in setting
up applications, allowing customized applications that are not covered by
wizards. Methods are defined in a graphical interface called Method
Builder, which is designed to provide full flexibility in method definition
while retaining a simple interface for running assays based on established
methods. Application wizard templates may be opened in Method Builder
to provide a starting point for further refinement of application setup.
Predefined methods are also provided as help in defining methods for
selected purposes (see Appendix B).
Each of these modes of operation is described in more detail in the following
chapters.
Biacore T100 Software Handbook BR-1006-48 Edition AE 15

2 Control Software – general features
2.2 User interface
2.2 User interface
The main screen in the control software is divided into the following areas
Menu and toolbar
Event log
Sensorgram window
Report point table
Keyword table
Status bar
•The menu and toolbar provide access to control commands.
•The event log records settings at the start of the run and instrument
control events during the run. The event log is displayed in a separate
window, opened by clicking on the Event Log button at the right of the
toolbar.
•The sensorgram window displays the sensorgrams for the current run or
the currently open file.
•The report point table lists report points for the currently displayed cycle.
Report points record the response at a set time and are defined
automatically: custom report points can also be added in methods, or
after the run in either the Control Software or the Evaluation Software.
•The keyword table lists keywords for the currently displayed cycle.
Keywords are defined automatically in wizard runs, or in the method for
method runs.
•The status bar displays the instrument status, including the temperature of
the detector and the sample compartment. The content of the status bar
varies between different situations: for wizard- and method-based runs,
the elapsed run time and the estimated total run time are included.
16 Biacore T100 Software Handbook BR-1006-48 Edition AE

2.2.1 On-line help
On-line help is available at any time from the Help menu. Context-specific help
for dialog boxes is provided through Help buttons in the boxes.
2.3 Basic operation
2.3.1 Selecting cycles and sensorgrams
During a run, the current cycle is displayed by default. You can choose which
cycle to display in the Cycle selector, but the display will revert to the current
cycle when a new cycle is started. For a completed run, choose which cycle to
display with the Cycle selector in the toolbar:
The Curve selector determines which curve in the cycle is current in the display.
Options in the View menu (Section 2.3.4) control which curves are displayed in
the sensorgram window.
Control Software – general features 2
2.3.2 File menu
The Open/New options for wizard templates and methods create new wizard
templates and methods, and open existing templates and methods for editing
or for starting a run.
Open opens result files. Most result files just display the sensorgrams and tables.
Files from immobilization and regeneration scouting wizards also display a
summary window showing the results of the run (see Sections 4.3.2 and 4.4.1).
Save and Save As save the results as a Biacore results file (extension .blr).
Export exports the current results to a file in Microsoft Excel or XML format, or
exports the contents of the report point table to a tab-separated file. See
Appendix A for details of the export format.
Biacore T100 Software Handbook BR-1006-48 Edition AE 17

2 Control Software – general features
2.3 Basic operation
Print prints a hard-copy of the results. Select the printer to use and check the
items you wish to print.
Sensorgrams may be printed as follows:
None No sensorgrams will be printed.
Current cycle The current cycle will be printed with the View:Show… setting
and scale as shown on the screen.
Range and
All cycles
Note: In order to maintain report layout, the print orientation is fixed regardless
of the printer settings in Windows.
Properties shows detailed properties of the currently opened run, including the
properties of the sensor chip used in the run.
When you close the software with Exit while the instrument is still switched on,
you may choose to shut down the instrument for a shorter or longer period if
required. See the Biacore T100 Instrument Handbook or the on-line help for
more details.
Multiple cycles will be printed. For Range, enter a range or
cycle numbers separated by commas (e.g. 4-16,19,22).
All curves will be included in each cycle regardless of the
View:Show… setting. Sensorgrams will be printed at full scale
unless the Lock Scale box is checked in the sensorgram
window, in which case the current scaling will be applied to
all cycles (with this setting, some sensorgrams may appear to
be empty).
18 Biacore T100 Software Handbook BR-1006-48 Edition AE

Control Software – general features 2
2.3.3 Edit menu
Options in the Edit menu allow you to add, edit and delete report points. Report
points are created automatically and are used in various evaluation contexts.
You should in general avoid editing or deleting report points that are created
automatically.
Editing operations for report points in the Control Software may be applied to
single report point instances or to all instances of the report point in the current
cycle. Note that editing operations are not applied to multiple cycles.
Report points created in the Control Software cannot be edited in the Evaluation
Software. The Evaluation Software offers functions for creating and editing
custom report points that can be applied to all cycles in the run in a single
operation. This is usually preferable to adding report points in the Control
Software.
2.3.4 View menu
Chip Properties opens a dialog box that displays the properties of the currently
docked sensor chip. The Ligand column is empty for flow cells that have not
been used, and shows [Blank] for flow cells that have been prepared as a blank
reference surface by activation and deactivation. The text [Incomplete results]
indicates that the immobilization run was interrupted (by for instance user
intervention or power failure) before it could be completed.
Biacore T100 Software Handbook BR-1006-48 Edition AE 19

2 Control Software – general features
2.3 Basic operation
Properties for the sensor chip used in a currently open run may be found under
File:Properties (Section 2.3.2).
Title sets a title in the sensorgram window. The default title is the assay step
name.
Scale sets the scale of the sensorgram window:
If you set Auto scale, the scale will be adjusted if necessary to accommodate
the full data range of the currently displayed cycle. During a run, the scale is
adjusted at intervals as more data is collected. Check the Lock scale box in the
top right corner of the sensorgram window to lock the scale to the current
settings.
Adjust Scale sets the scale to the full data range. This will not affect the Auto
scale setting in the Scale dialog. Adjust Scale overrides but does not turn off the
Lock scale setting.
To scale the sensorgram display interactively, drag with the cursor over the area
to be scaled. Double-clicking in the display or choosing View:Unzoom restores
the previous zoom setting.
Reference line toggles display of a movable vertical line in the sensorgram
window, together with a separate small window that shows the response and
time coordinates at the reference line for the current curve. Use the Curve
selector in the toolbar (see Section 2.3.1) to set the current curve. Drag the
reference line to move it. When the reference line is displayed, choosing
Baseline sets a baseline at the current reference line position, and the
coordinates window shows the response relative to that baseline.
20 Biacore T100 Software Handbook BR-1006-48 Edition AE

Control Software – general features 2
The options Show Only Current Curve, Show Curves of Same Type and Show
All Curves control which curves are displayed in the sensorgram window. Curve
types distinguish between unsubtracted and reference-subtracted curves.
Choose the Event Log option or click on the Event Log button at the right of the
toolbar to display the event log window.
Choose the Wizard Template or Method options to display the wizard or
method definition for the run. You can edit the definition and save it as a new
wizard template or method. You cannot however change the original definition
that is saved together with the result file.
Notebook opens a notebook window where details of the run may be recorded.
The notebook is only available during a run or for a completed result file. The run
notebook is saved with the result file and can be viewed in the Evaluation
Software.
For some wizard runs and for test tools, the Wizard Results option opens a
window showing the results of the run. All other runs are evaluated in the
Evaluation Software.
Sensorgram Markers controls display of report point and event markers and
labels in the sensorgram window.
2.3.5 Run menu
The options in the Run menu are used to start the different types of runs (see
Chapter 3 and Sections 4.1.2 and 5.9.7).
2.3.6 Tools menu
Options in the Tools menu control instrument operations outside the context of
runs.
Prime flushes the flow system with fresh buffer. There is an option to include
Prime at the beginning of each wizard- or method-based run. Use the menu
option when you want to flush the system at other times (e.g. before a manual
run).
Shutdown starts the procedure for shutting down the instrument for long
periods of time (more than 4 days). The procedure displays necessary
instructions on the screen. Details of the shutdown procedure are given in the
Biacore T100 Instrument Handbook.
Standby puts the instrument in standby mode, which maintains a low buffer or
water flow through the flow system for up to 4 days. Leaving the instrument in
standby mode when not in use is generally recommended. The instrument is
Biacore T100 Software Handbook BR-1006-48 Edition AE 21

2 Control Software – general features
2.3 Basic operation
automatically put in standby mode at the end of a run. Use the menu option if
standby has been stopped and you want to restart it.
Stop Standby stops standby mode.
Eject Rack ejects the rack tray from the sample compartment . The rack may be
ejected during setup for wizard- and method-based runs, and at any time
durin g a manual r un. Use the menu opt ion or the toolbar button when you want
to eject the rack at any other time.
WARNING! The rack tray automatically moves into the instrument 60
seconds after it has been ejected. A timer in the dialog indicates when the
rack tray will be automatically moved into the instrument.
Rack Illumination switches the blue illumination in the sample compartment on
or off. The illumination helps you to see in the sample compartment but does not
otherwise affect instrument function.
Insert Chip and Eject Chip are used for docking and undocking the sensor chip
respectively. More details are given in Chapter 3 of the Biacore T100 Instrument
Handbook.
Set Temperature sets the sample compartment and analysis temperature.
More details are given in Chapter 3 of the Biacore T100 Instrument Handbook.
Preferences controls aspects of file storage and data import (see Section 2.4).
More Tools provides access to maintenance, test and service tools. Details are
given in Appendix B of the Biacore T100 Instrument Handbook.
2.3.7 Right-click menus
Right-clicking with the mouse in some windows opens context menus specific
for the window.
Sensorgram window
Scale opens the same dialog as the View:Scale option (Section 2.3.4).
Copy Graph copies the sensorgram window exactly as displayed to the
Windows clipboard. Use this option to insert a copy of the sensorgram window
into other programs such as presentation software.
Export Curves exports data for the currently displayed curves to a text file.
Entire curves are exported regardless of the scale of the display. The exported
data includes report points and event marker times if these are displayed in the
sensorgram window. See Appendix A for more details of the export format .
Gridlines controls display of gridlines in the sensorgram window.
22 Biacore T100 Software Handbook BR-1006-48 Edition AE

2.4 File storage
Control Software – general features 2
Report point table
The right-click menu options for the report point table correspond to the
Edit:Report Points menu options.
Notebook
Right-click menu options in the notebook represent standard Windows editing
functions.
2.4.1 Wizard templates and methods
Wizard templates are saved in files with a file name extension .bw**, where **
represents an abbreviation that identifies the wizard (e.g. a wizard template for
concentration analysis has the extension .bwConc).
Methods are saved in files with the file name extension .Method.
Note: The extension will not be displayed if the default setting Hide file
extensions for known file types is selected in the Windows Explorer
folder options. Turning this setting off can help you to identify file types in
dialog boxes.
Templates and methods may be saved in any location. A folder structure under
the default location as specified in Tools:Preferences is however recommended,
since files in this location are handled preferentially in the Open/New dialog
boxes for wizards and templates (see Section 4.1.1).
Click on the browse button to change the folder setting.
2.4.2 Result files
Results are saved in files with the file name extension .blr. Result files from
wizard- or method-based runs contain a copy of the wizard template or method
as well as the results of the run.
Biacore T100 Software Handbook BR-1006-48 Edition AE 23

2 Control Software – general features
2.4 File storage
24 Biacore T100 Software Handbook BR-1006-48 Edition AE

3 Manual run
Manual run allows you to control a run interactively. All settings except
temperature and choice of microplate and/or reagent rack can be changed
during the run. Commands are placed in a queue if the instrument is busy when
a command is issued: queued commands that have not yet been started can be
edited or deleted from the queue.
The results of a manual run are saved in a normal result file, and can be
evaluated in the Evaluation Software. There are however no predefined
keywords associated with the run, and the results cannot be evaluated with the
Evaluation Software tools for concentration, kinetics/aff inity, thermodynamics
or affinity in solution.
3.1 Preparing for a manual run
3.1.1 Instrument preparations
The integrated instrument preparation steps that are included with wizard- and
method-based runs are not supported for manual run. The instrument should
therefore be prepared using options from the Tools menu.
Manual run 3
1 Dock the chip that you want to use, and immobilize ligand on the surface
(see Section 4.3.2) if this has not already been done.
2Choose Tools:Prime to flush the flow system with fresh buffer.
3Choose Normalize from the Maintenance Tools section of Tools:More
Tools if the detector has not been normalized since the chip was docked. (In
many cases, the detector will have been normalized in connection with
ligand immobilization. However, you may need to perform the operation
again if the chip has been undocked and re-docked after immobilization.)
4Choose Tools:Set Temperature and set the analysis and sample
compartment temperatures. Wait until the analysis temperature is stable
(as shown in the status bar) before starting the run.
5 Prepare your samples and reagents in the microplate and/or reagent rack.
Note the rack positions and volumes of samples that you prepare: there is
no software support in manual run for identifying samples or monitoring
the volume of liquid in the autosampler positions. You insert the samples as
part of the starting procedure for the run. You can also add samples during
the run.
Biacore T100 Software Handbook BR-1006-48 Edition AE 25

3Manual run
3.2 Starting a manual run
3.2 Starting a manual run
Choose Run:Manual Run to start a manual run.
Choose the initial settings for flow rate, flow path and reference subtraction. You
can change the flow rate at any time during the run. You can change the flow
path at any time: during a cycle, the available options are restricted by the
choice made when the cycle is started.
Choose the rack and microplate settings. These will apply throughout the run
and cannot be changed.
Click Eject Rack to eject the rack tray so that you can load your samples.
Click Start to start the run. You will be asked to specify a result file name before
the run actually starts.
26 Biacore T100 Software Handbook BR-1006-48 Edition AE

3.3 Controlling a manual run
Control the manual run from the command buttons in the main window or the
options in the Command menu:
Manual run 3
Commands are executed immediately if the instrument is idle. With a few
exceptions (noted in the detailed descriptions below), commands issued when
the instrument is busy are placed at the end of a queue. The queue is listed in
the left-hand panel, with commands that have been executed in gray text and
those that are pending in black text. The command currently being executed is
marked with a “working” icon.
Right-click on a pending command for a menu with options for:
• editing the command
• inserting a new command before the selected command (you choose the
command to insert from a dialog box)
• deleting the command
You can also use the right-click menu to copy selected command or commands
and paste them elsewhere in the queue. The Copy function works with both
completed and pending commands.
Biacore T100 Software Handbook BR-1006-48 Edition AE 27

3Manual run
3.3 Controlling a manual run
Flow rate
Sets the flow rate to a new value.
Flow path
Changes the flow path. During a cycle, you can only select a flow path within a
range allowed by the setting chosen when the cycle was started (for example, if
the current setting is Flow path 1-2, you cannot extend it to Flow path 1-2-3-4).
Sample injection
Injects sample. Choose the position from which the sample will be taken and
specify a contact time. Positions that can be chosen are determined by the rack
settings in the manual run start-up dialog. Make sure that the chosen position
contains enough sample for the injection. The required volume for the specified
contact time is indicated in the dialog box.
Regeneration injection
Injects regeneration solution. Choose the position from which the solution will be
taken and specify a contact time. Positions that can be chosen are determined
by the rack settings in the manual run start-up dialog. Make sure that the
chosen position contains enough solution for the injection. The required volume
for the specified contact time is indicated in the dialog box.
Check High viscosity solution if your regeneration solution has a relative
viscosity higher than about 3 (corresponding to about 35% glycerol or 40%
ethylene glycol at 20°C). This will adjust the injection procedure to ensure correct
handling of viscous solutions, and will limit the maximum contact time that can
be specified.
Wait
Inserts a Wait command in the queue, causing the instrument operation to
pause for the specified time period. Buffer continues to flow over the sensor
surface during the Wait period and data collection continues.
Eject Rack Tray
Ejects the rack tray so that you can load more samples. Do not change the type
of microplate or reagent rack on the tray.
This command is inserted immediately after the command currently under
execution, rather than at the end of the queue, so that the rack tray will be
ejected as soon as the current command is completed. If you want to place the
command later in the queue, use the right-click menu in the queue panel to
insert the command at the appropriate place.
28 Biacore T100 Software Handbook BR-1006-48 Edition AE
Manual run 3
WARNING! The rack tray automatically moves into the instrument 60
seconds after it has been ejected. A timer in the dialog indicates when the
rack tray will be automatically moved into the instrument.
New Cycle
Starts a new cycle. You can choose a new flow path and reference subtraction
setting for the new cycle, independently of the setting in the current cycle.
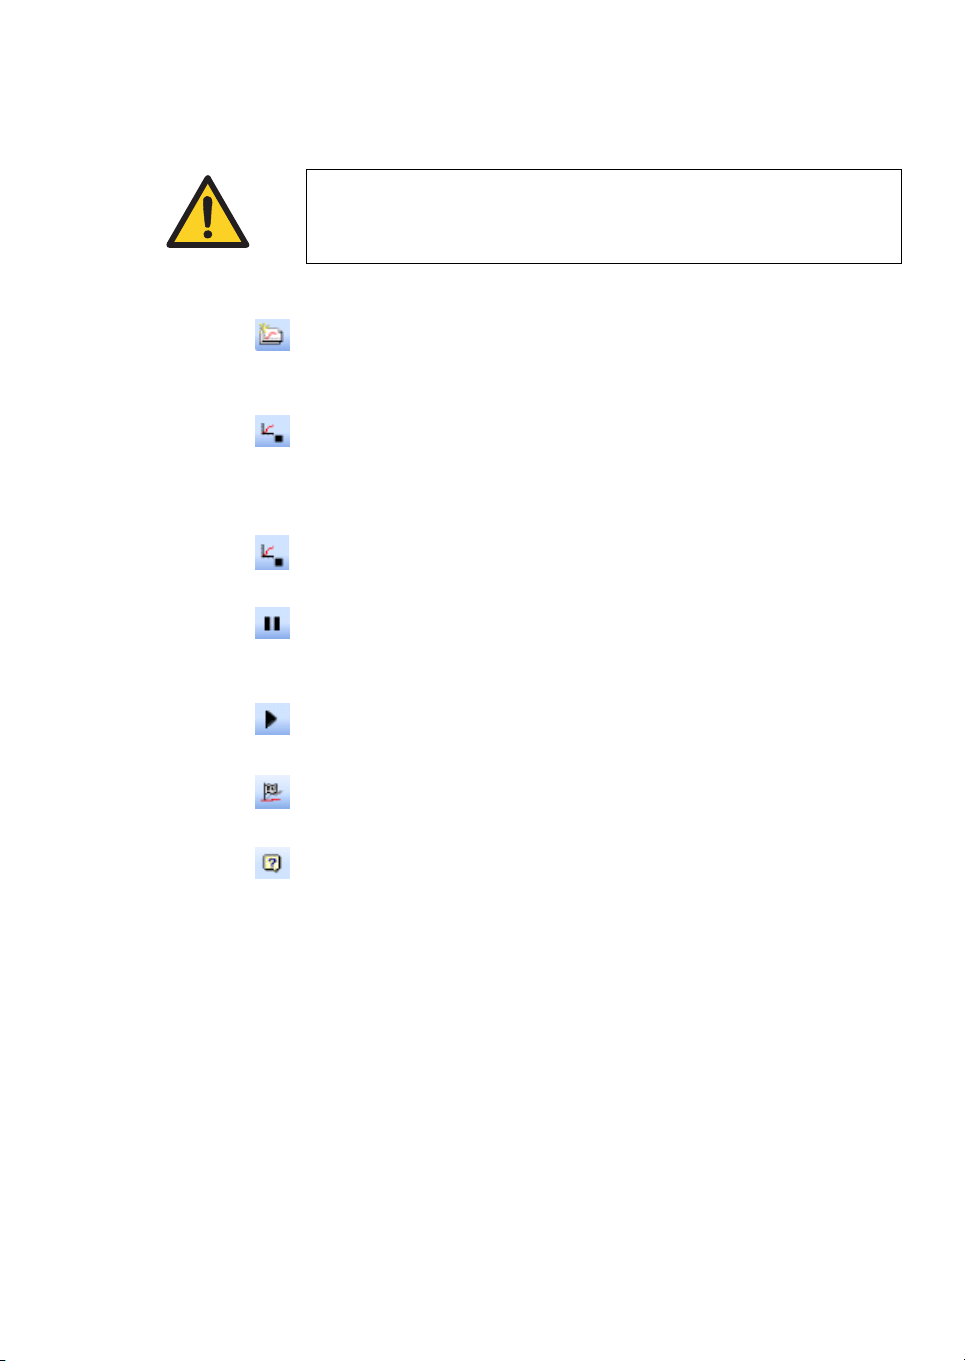
Stop <command>
Stops the command currently being executed. The icon changes to show the
command that will be stopped, or is gray if the current command cannot be
stopped (e.g. it is not possible to stop an Eject Rack Tray command).
Stop Run
Finishes the run.
Pause Run
Pauses the run until a Resume Run command is issued. Buffer continues to flow
over the sensor surface while the run is paused.
Resume Run
Resumes a run that is paused.
Add report point
Adds a report point to the sensorgram.
Help
Displays help for the manual run.
3.4 Ending a manual run
To end a manual run:
1Issue a Stop Run command. The command will normally be placed at the
end of the queue. If you want to stop the run before the queue is completed,
use the right-click menu in the queue panel to delete commands from the
queue or to insert the Stop Run command in the appropriate position.
2Choose Tools:Eject Rack to eject the rack tray and remove your samples
and reagents.
3Choose Tools:Eject Chip to undock the chip if desired.
Biacore T100 Software Handbook BR-1006-48 Edition AE 29

3Manual run
3.4 Ending a manual run
30 Biacore T100 Software Handbook BR-1006-48 Edition AE
 Loading...