

Page 1
Page 2
IMPORTANT NOTICES
General
• This manual has been authored with simplified grammar, to meet the needs of international users.
• The operator of this equipment must read and follow the descriptions in this manual. Wrong operation or maintenance can cancel the warranty or cause injury.
• Do not copy any part of this manual without written permission from FURUNO.
• If this manual is lost or worn, contact your dealer about replacement.
• The contents of this manual and equipment specifications can change without notice.
• The example screens (or illustrations) shown in this manual can be different from the screens you
see on your display. The screens you see depend on your system configuration and equipment
settings.
• Save this manual for future reference.
• Any modification of the equipment (including software) by persons not authorized by FURUNO will
cancel the warranty.
• All brand and product names are trademarks, registered trademarks or service marks of their respective holders.
• SD, SDHC Logos are trademarks of SD-3C, LLC.
• RotoKey is a registered trademark or trademark of FURUNO Electric Co., Ltd.
How to discard this product
Discard this product according to local regulations for the disposal of industrial waste. For disposal
in the USA, see the homepage of the Electronics Industries Alliance (http://www.eiae.org/) for the
correct method of disposal.
How to discard a used battery
Some FURUNO products have a battery(ies). To see if your product has a battery, see the chapter
on Maintenance. Follow the instructions below if a battery is used. Tape the + and - terminals of
battery before disposal to prevent fire, heat generation caused by short circuit.
In the European Union
The crossed-out trash can symbol indicates that all types of batteries
must not be discarded in standard trash, or at a trash site. Take the
used batteries to a battery collection site according to your national
legislation and the Batteries Directive 2006/66/EU.
In the USA
The Mobius loop symbol (three chasing arrows) indicates that Ni-Cd
and lead-acid rechargeable batteries must be recycled. Take the used
batteries to a battery collection site according to local laws.
Ni-Cd Pb
In the other countries
Cd
There are no international standards for the battery recycle symbol. The number of symbols can
increase when the other countries make their own recycle symbols in the future.
i
Page 3
SAFETY INSTRUCTIONS
Read these safety instructions before you operate the equipment.
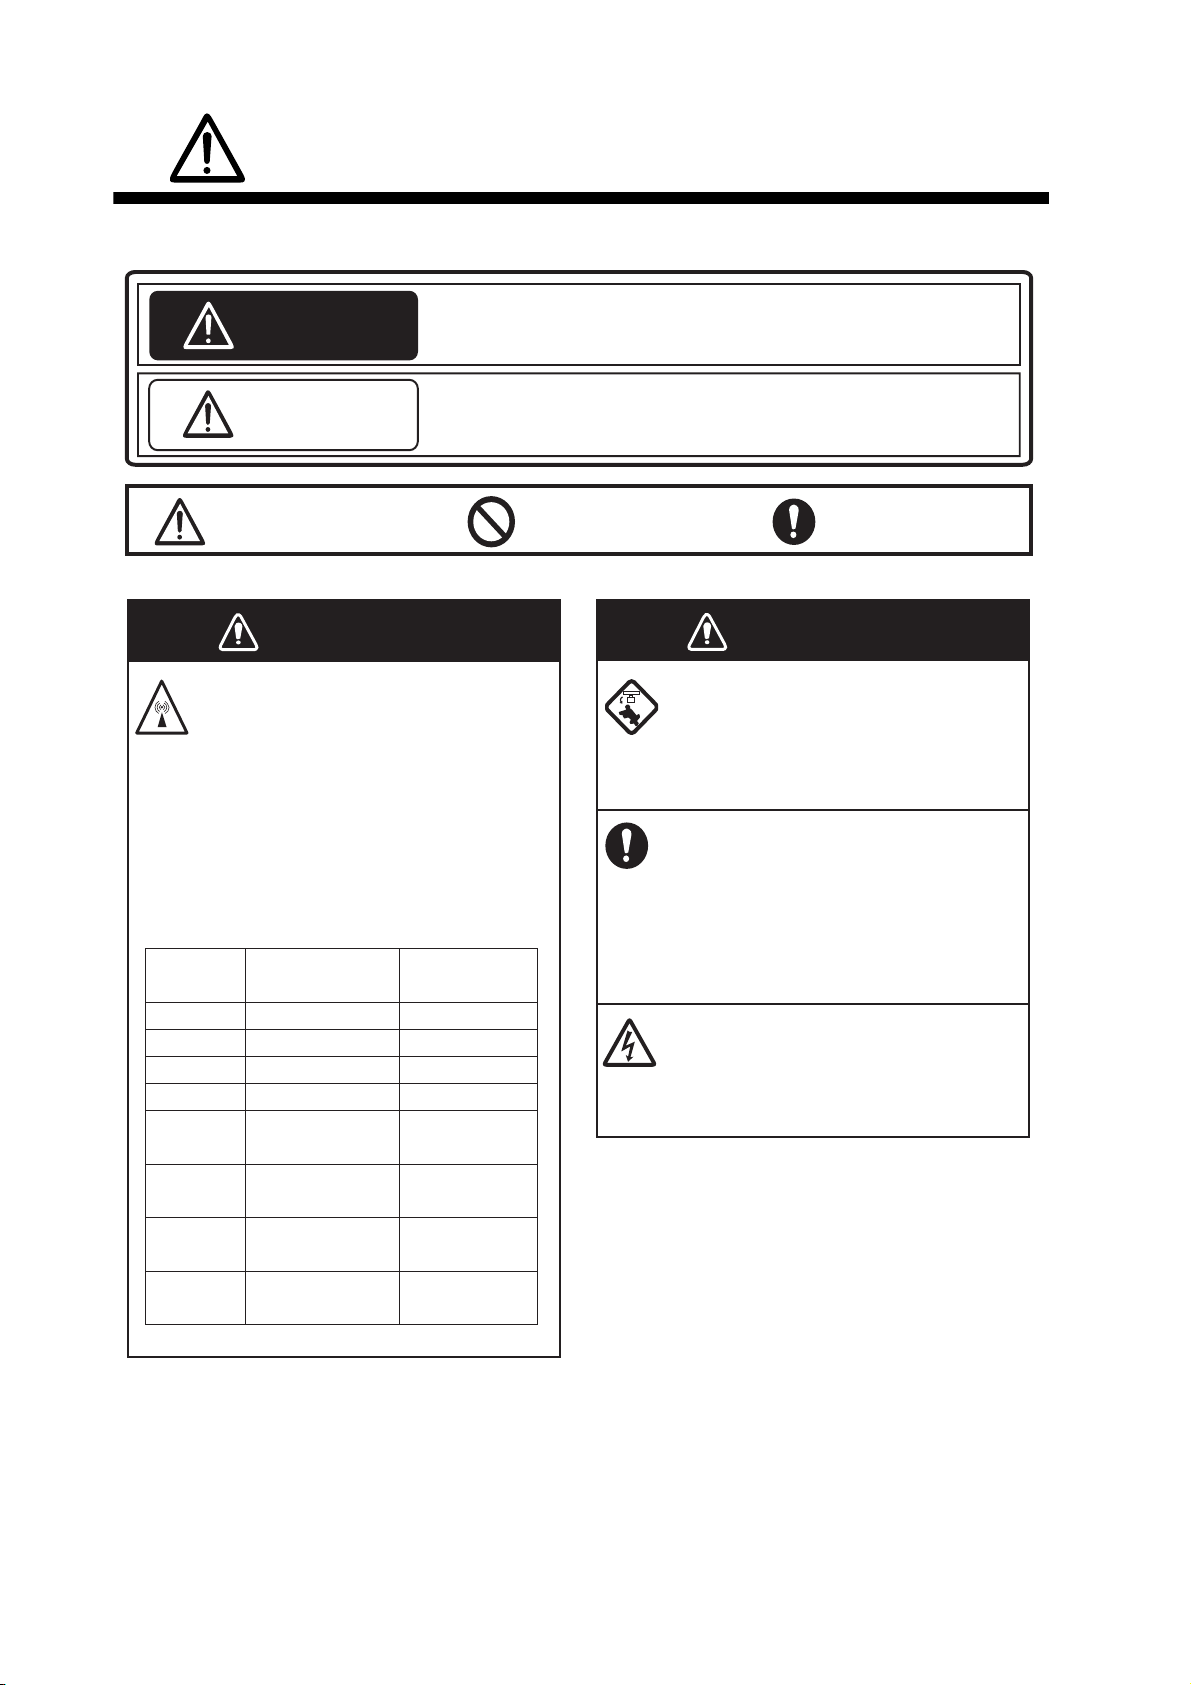
Indicates a condition that can cause death or serious injury if
WARNING
CAUTION
not avoided.
Indicates a condition that can cause minor or moderate injury if
not avoided.
Warning, Caution
Prohibitive Action
WARNING
The radar antenna sends the electromagnetic radio frequency (RF) energy.
This energy can be dangerous to you,
especially your eyes. Do not look at the
radiator or near the antenna when the
antenna is rotating.
The distances at which RF radiation
levels of 100 W/m2 and 10 W/m
exist are shown in the table.
Antenna
Model
DRS2D - 0.4
DRS4D 0.1 1.4
DRS4A - 1.2
DRS6A - 1.2
DRS12A
w/XN12A
DRS12A
w/XN13A
DRS25A
w/XN12A
DRS25A
w/XN13A
Distance to
100 W/m
2
0.2
0.2
0.5
0.4
point
2
Distance to
10 W/m2 point
2.4
1.9
5.3
4.4
Mandatory Action
WARNING
Check that no person is near the radar
antenna before you turn on the radar.
Serious injury or death can occur if a
person is hit by a rotating radar antenna.
Turn off the power immediately at the
switchboard if water leaks into the
equipment or smoke or fire is coming
from the equipment.
Failure to turn off the equipment can cause
fire or electrical shock.
Do not open the equipment.
Only qualified persons can work inside
the equipment.
ii
Page 4
SAFETY INSTRUCTIONS
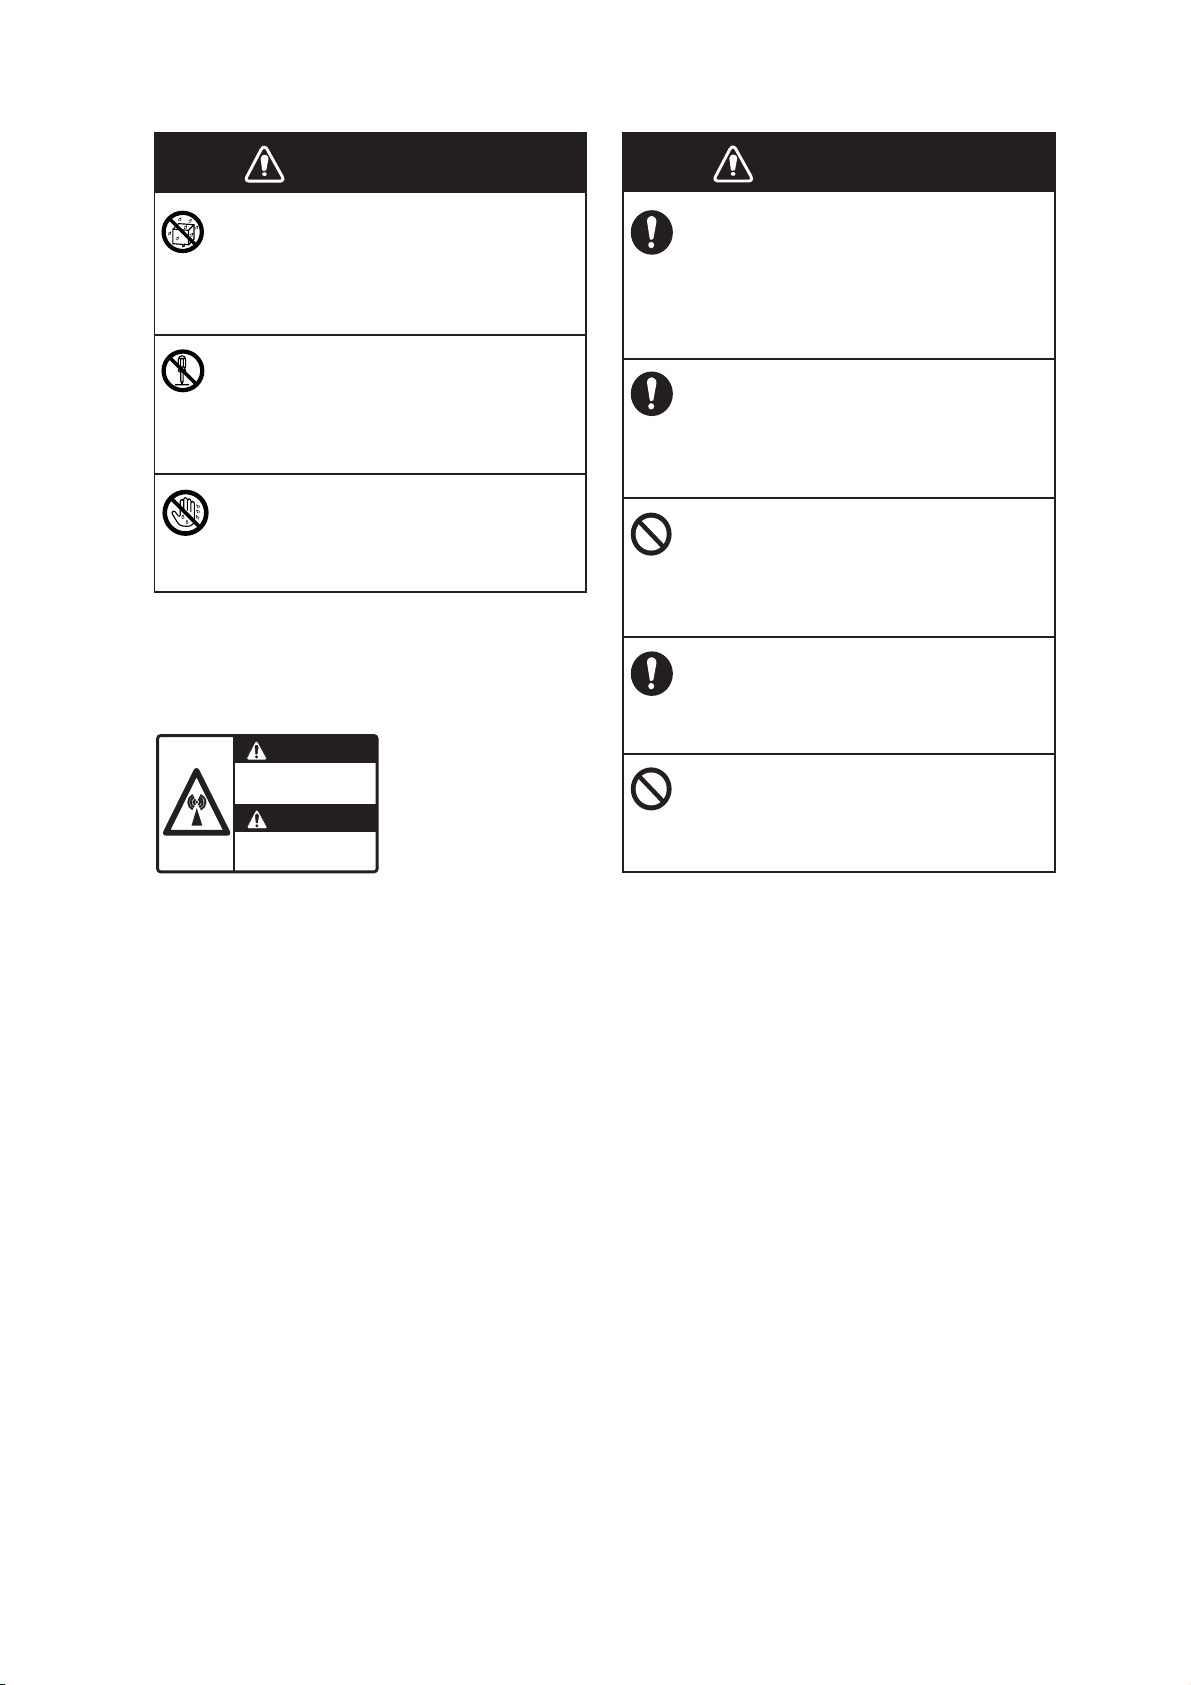
WARNING
Keep units other than the radar antenna
away from the rain and water.
Fire or electrical shock can occur if water
gets inside the equipment.
Do not disassemble or modify the
equipment.
Fire or electrical shock can occur if the
equipment is disassembled or modified.
Do not operate the equipment with wet
hands.
Electrical shock can occur.
Radiation hazard. Only qualified
personnel should work inside scanner.
Confirm that TX has stopped before
opening scanner.
WARNING
WARNING
Name: Warning Sticker
Type: 3-142-3201-0
Code No.: 100-266-890
WARNING
Do not depend on one navigation device
for the navigation of the vessel.
Always check your position against all
available aids to navigation, for the safety
of vessel and crew.
A radar is an excellent anti-collision aid,
but remember to keep watch for possible
collision conditions.
Always keep a watch while underway.
Do not leave any objects near the radar
antenna.
Fire, electrical shock or injury can occur if
something gets caught in the radar antenna.
Use the correct fuse.
A wrong fuse can cause fire or serious
damage to the equipment.
Do not maneuver the vessel only from the
depth indication.
Grounding can occur.
iii
Page 5

TABLE OF CONTENTS
FOREWORD ...................................................................................................................xi
SYSTEM CONFIGURATION ........................................................................................xiii
1. SYSTEM INTRODUCTION ....................................................................................1-1
1.1 The NavNet 3D System .............................................................................................1-1
1.1.1 How to sleep the equipment...........................................................................1-2
1.2 Controls...................................................................................................................... 1-2
1.2.1 Control Description.........................................................................................1-3
1.3 Power ON and OFF ...................................................................................................1-5
1.4 Panel Dimmer, Display Brilliance ..............................................................................1-5
1.5 How to Select a Display .............................................................................................1-6
1.6 SD Cards....................................................................................................................1-7
1.7 Chart Plotter Introduction ...........................................................................................1-8
1.8 Radar Introduction......................................................................................................1-9
1.9 Fish Finder Introduction ...........................................................................................1-10
1.10 The Cursor ...............................................................................................................1-11
1.11 Status Bar ................................................................................................................1-12
1.12 RotoKey and Soft Controls.......................................................................................1-13
1.13 Pop-up Menus ..........................................................................................................1-14
1.14 Data Boxes...............................................................................................................1-15
1.15 Menu Introduction ....................................................................................................1-16
1.16 Language .................................................................................................................1-19
1.17 Boat Icon ..................................................................................................................1-20
1.18 Man Overboard (MOB).............................................................................................1-21
1.19 Facsimile Receiver FAX-30......................................................................................1-23
1.20 AIS Transponder FA-30, FA-50 ...............................................................................1-24
1.21 DSC Message Information .......................................................................................1-25
1.21.1 How to Show, Hide DSC Message Information ........................................... 1-25
1.21.2 How to Find DSC Information ......................................................................1-25
1.21.3 Operations Available with the DSC Marker.................................................. 1-26
1.21.4 The DSC List................................................................................................1-26
2. CHART PLOTTER .................................................................................................2-1
2.1 Charts......................................................................................................................... 2-1
2.1.1 Chart Description ...........................................................................................2-1
2.1.2 How to Select a Chart Type ...........................................................................2-1
2.2 Chart Scale ................................................................................................................2-4
2.3 Orientation Mode........................................................................................................2-5
2.4 How to Move the Chart ..............................................................................................2-5
2.5 The Boat Icon.............................................................................................................2-6
2.6 How to Find the Range and Bearing to a Location ...................................................2-8
2.7 Chart Object Information ............................................................................................2-8
2.8 Multiple Chart Plotter Displays ................................................................................... 2-9
2.9 Cartographic Text and Objects on Vector Charts .................................................... 2-10
2.9.1 Control Visibility of Text and Object Information ..........................................2-10
2.9.2 Control Visibility of Cartographic Objects..................................................... 2-11
2.10 Alarms ......................................................................................................................2-13
2.10.1 XTE Alarm.................................................................................................... 2-13
2.10.2 Anchor Watch Alarm .................................................................................... 2-13
2.10.3 Proximity Alarm............................................................................................ 2-14
2.10.4 Depth Alarm ................................................................................................. 2-14
2.10.5 SST Alarm.................................................................................................... 2-14
iv
Page 6

TABLE OF CONTENTS
2.10.6 Speed ...........................................................................................................2-14
2.10.7 Trip Log Alarm..............................................................................................2-14
2.10.8 Countdown Timer .........................................................................................2-14
2.10.9 Alarm Clock ..................................................................................................2-14
2.10.10How to Set an Alarm ....................................................................................2-15
2.10.11Internal/External Alarm.................................................................................2-16
2.10.12Alarm Audio Options ....................................................................................2-16
2.10.13Alarm Log .....................................................................................................2-17
2.11 Track.........................................................................................................................2-18
2.11.1 How to Show or Hide the Track Display.......................................................2-18
2.11.2 Track Recording Method, Interval ................................................................2-18
2.11.3 Track Thickness ...........................................................................................2-19
2.11.4 Track Color...................................................................................................2-20
2.11.5 How to Clear the Active Track......................................................................2-22
2.11.6 How to Save Active Track ............................................................................2-22
2.11.7 How to Replay a Saved Track......................................................................2-23
2.11.8 How to Remove a Replayed Track...............................................................2-23
2.11.9 How to Find Information About a Track........................................................2-24
2.11.10Track Pop-up Menu......................................................................................2-24
3. 3D DISPLAY, OVERLAYS ....................................................................................3-1
3.1 3D Display ..................................................................................................................3-1
3.1.1 Aerial View .....................................................................................................3-1
3.1.2 Underwater Display ........................................................................................3-3
3.1.3 Highway Display.............................................................................................3-3
3.1.4 How to Make the 3D View Clearer .................................................................3-4
3.2 Overlays .....................................................................................................................3-5
3.2.1 Depth Shading Overlay ..................................................................................3-5
3.2.2 Weather Overlays...........................................................................................3-6
3.2.3 Satellite Photo Overlay.................................................................................3-10
3.2.4 Animation Overlay ........................................................................................3-10
3.2.5 Radar Overlay ..............................................................................................3-11
3.2.6 Tidal Information Overlay .............................................................................3-12
3.2.7 Tidal Current Overlay ...................................................................................3-14
4. POINTS ..................................................................................................................4-1
4.1 About Points ...............................................................................................................4-1
4.2 How to Mark a Point ...................................................................................................4-2
4.2.1 How to Mark a Point at Current Position ........................................................4-2
4.2.2 How to Mark a Point at Cursor Position .........................................................4-2
4.2.3 How to Mark a Point from the Points List .......................................................4-3
4.3 How to Find Information About an On-screen Point...................................................4-4
4.4 Default Point Settings.................................................................................................4-5
4.5 How to Move a Point ..................................................................................................4-6
4.5.1 How to Move an On-screen Point ..................................................................4-6
4.5.2 How to Move a Point from the Points List ......................................................4-6
4.6 How to Delete a Point.................................................................................................4-7
4.6.1 How to Delete a Point on the Screen .............................................................4-7
4.6.2 How to Delete a Point from the Points List.....................................................4-7
4.6.3 How to Delete All Points.................................................................................4-7
4.7 How to Edit a Point from the Points List .....................................................................4-8
4.8 How to Find a Point ..................................................................................................4-10
4.8.1 How to Show a Point at the Center of the Screen........................................4-10
4.8.2 How to Find the Location of a Point from the Points Menu ..........................4-10
4.9 Point Groups.............................................................................................................4-10
4.10 How to Show or Hide All Points................................................................................4-11
v
Page 7

TABLE OF CONTENTS
4.11 How to Go to a Point ................................................................................................4-12
4.11.1 How to go to an On-screen Point................................................................. 4-12
4.11.2 How to go to Cursor Position ....................................................................... 4-13
4.11.3 How to go to a Point Selected from the Points List...................................... 4-15
4.11.4 How to Extend a Route Made with a Single Point........................................4-15
4.12 How to Restart and Cancel Navigation to a Point ....................................................4-16
4.12.1 Restart Navigation........................................................................................4-16
4.12.2 How to Cancel Navigation to a Point............................................................4-16
5. ROUTES.................................................................................................................5-1
5.1 What is a Route?........................................................................................................5-1
5.2 How to Create a Route...............................................................................................5-2
5.2.1 How to Create a New Route .......................................................................... 5-2
5.2.2 How to Insert a Point on a Route ................................................................... 5-3
5.2.3 How to Delete a Point ....................................................................................5-3
5.2.4 How to Extend a Route .................................................................................. 5-4
5.2.5 How to Split a Route ......................................................................................5-4
5.2.6 How to Join Two Routes ................................................................................ 5-5
5.3 Routes List .................................................................................................................5-6
5.4 How to Find Information About a Route on the Screen..............................................5-7
5.5 How to Find a Route on the Chart..............................................................................5-7
5.6 How to Change the Name of a Route ........................................................................5-8
5.7 How to Delete a Route ............................................................................................... 5-8
5.7.1 How to Delete an Individual Route................................................................. 5-8
5.7.2 How to Delete All Routes ...............................................................................5-8
5.8 How to Show or Hide All Routes ................................................................................5-9
5.9 How to Follow a Route............................................................................................... 5-9
5.9.1 How to Follow an On-screen Route ............................................................... 5-9
5.9.2 How to Follow a Route Selected from the Routes List................................. 5-10
5.9.3 How to Start Navigation from a Point........................................................... 5-10
5.9.4 How to Show Information About a Route..................................................... 5-11
5.9.5 Flyover .........................................................................................................5-11
5.10 Operations When You Follow a Route .....................................................................5-12
5.10.1 Restart Navigation........................................................................................5-12
5.10.2 Follow a Route in the Reverse Direction...................................................... 5-12
5.10.3 Stop Following a Route................................................................................ 5-13
5.10.4 Skip a Leg on a Route.................................................................................. 5-13
5.10.5 Waypoint Switching Mode............................................................................ 5-14
5.10.6 Route Auto Zoom......................................................................................... 5-15
5.10.7 XTE Alarm Lines .......................................................................................... 5-15
5.10.8 Waypoint Arrival Notification ........................................................................ 5-16
5.11 Navigation Calculator ..............................................................................................5-16
6. RADAR...................................................................................................................6-1
6.1 How to Transmit, Set the Radar in Stand-by..............................................................6-1
6.2 How to Adjust the Gain ..............................................................................................6-2
6.3 How to Reduce Sea Clutter........................................................................................6-3
6.4 How to Reduce Rain Clutter.......................................................................................6-4
6.5 Range Scale...............................................................................................................6-5
6.6 Orientation Mode........................................................................................................6-6
6.6.1 Description of Orientation Modes................................................................... 6-6
6.7 How to Measure the Range to a Target ..................................................................... 6-8
6.7.1 How to Display the Range Rings ................................................................... 6-8
6.7.2 How to Measure the Range with a VRM........................................................ 6-8
6.7.3 How to Deactivate a VRM.............................................................................. 6-9
6.8 How to Measure the Bearing to a Target .................................................................6-10
vi
Page 8

TABLE OF CONTENTS
6.8.1 How to Measure the Bearing with an EBL....................................................6-10
6.8.2 How to Erase an EBL ...................................................................................6-11
6.8.3 How to Select True or Relative Bearing .......................................................6-11
6.9 How to Off-center the Picture ...................................................................................6-12
6.10 Heading Line ............................................................................................................6-13
6.11 How to Reduce Radar Interference..........................................................................6-14
6.12 Guard Alarm .............................................................................................................6-15
6.12.1 How to Set a Guard Zone.............................................................................6-15
6.12.2 How to Activate or Deactivate a Guard Zone ...............................................6-16
6.12.3 How to Erase a Guard Zone.........................................................................6-16
6.13 Watchman ................................................................................................................6-16
6.14 Echo Trails................................................................................................................6-17
6.14.1 How to Hide or Show Echo Trails.................................................................6-17
6.14.2 How to Clear Echo Trails to Start New Trails ...............................................6-17
6.14.3 Echo Trail Time ............................................................................................6-17
6.14.4 Echo Trail Reference....................................................................................6-18
6.14.5 Echo Trail Color............................................................................................6-18
6.14.6 Echo Trail Style ............................................................................................6-18
6.15 Echo Stretch.............................................................................................................6-19
6.16 Echo Average...........................................................................................................6-19
6.17 Automatic Shift .........................................................................................................6-20
6.17.1 How to Set Auto Shift Speed........................................................................6-20
6.17.2 How to Activate or Deactivate Auto Shift......................................................6-20
6.18 Sweep Fade .............................................................................................................6-20
6.19 How to Show, Hide, Cancel an Active Route ...........................................................6-21
6.20 How to Show or Hide the Boat Icon..........................................................................6-21
6.21 Echo Color................................................................................................................6-22
6.22 Background Color.....................................................................................................6-22
6.23 Radar Overlay Range Link .......................................................................................6-22
6.24 Dual-Range Display..................................................................................................6-23
6.25 FAR-2107 Radar Series and NavNet 3D..................................................................6-24
6.26 How to Understand the Radar Display .....................................................................6-25
6.26.1 False Echoes................................................................................................6-25
6.26.2 Search and Rescue Transponder (SART) ...................................................6-27
6.27 ARPA Operation.......................................................................................................6-29
6.27.1 How to Show or Hide the ARPA Display ......................................................6-29
6.27.2 How to Manually Acquire a Target ...............................................................6-30
6.27.3 How to Display Target Data .........................................................................6-31
6.27.4 How to Stop Tracking Targets......................................................................6-31
6.27.5 How to Clear a Lost Target ..........................................................................6-31
6.27.6 CPA/TCPA Alarm .........................................................................................6-32
6.27.7 How to Set an ARPA Acquisition Area .........................................................6-33
6.27.8 Track History Display ...................................................................................6-34
7. FISH FINDER .........................................................................................................7-1
7.1 How the Fish Finder Operates....................................................................................7-1
7.2 How to Select a Display..............................................................................................7-2
7.2.1 Single Frequency Display...............................................................................7-2
7.2.2 Dual Frequency Display .................................................................................7-3
7.2.3 Zoom Displays................................................................................................7-4
7.2.4 A-scope Display (display only) .......................................................................7-6
7.2.5 Bottom Discrimination Display........................................................................7-7
7.3 Automatic Fish Finder Operation................................................................................7-9
7.3.1 How the Automatic Fish Finder Operates ......................................................7-9
7.3.2 How to Select an Automatic Fish Finder Mode ..............................................7-9
7.4 Manual Fish Finder Operation..................................................................................7-10
vii
Page 9

TABLE OF CONTENTS
7.4.1 How to Select the Manual Mode ..................................................................7-10
7.4.2 How to Select a Display Range....................................................................7-10
7.4.3 How to Shift the Range ................................................................................ 7-10
7.4.4 How to Adjust the Gain ................................................................................ 7-11
7.4.5 How to Reduce Clutter................................................................................. 7-11
7.5 Picture Advance Speed............................................................................................7-12
7.6 How to Reduce Interference ....................................................................................7-13
7.7 How to Measure Depth, Time Between Locations................................................... 7-14
7.8 How to Erase Weak Echoes .................................................................................... 7-15
7.9 How to Balance Echo Strength ................................................................................7-16
7.10 White Marker ............................................................................................................7-17
7.11 Fish Finder Alarms ...................................................................................................7-17
7.11.1 How to Set an Alarm ....................................................................................7-17
7.11.2 How to Activate or Deactivate an Alarm.......................................................7-18
7.11.3 Alarm Sensitivity...........................................................................................7-18
7.12 ACCU-FISH
7.12.1 How to Set ACCU-FISH
7.12.2 Fish Size Correction..................................................................................... 7-21
7.13 Water Temperature Graph .......................................................................................7-21
7.14 Fish Finder Menu Operation ....................................................................................7-22
7.14.1 Fish Finder-General Menu ...........................................................................7-22
7.14.2 Fish Finder-DFF1/BBDS1/DFF1-UHD, -DFF3/FCV, -ETR-6/10N and
7.15 NavNet 3D and LCD Color Sounder FCV-1150 ....................................................... 7-25
7.16 Interpreting the Display ............................................................................................7-27
TM
.........................................................................................................7-19
-ETR-30N Menus .........................................................................................7-23
TM
...........................................................................7-20
8. FILE OPERATIONS ...............................................................................................8-1
8.1 How to Format SD Cards ........................................................................................... 8-1
8.2 Files Menu Operation.................................................................................................8-1
8.2.1 Files Menu Description................................................................................... 8-2
8.3 How to Export Tracks, Points and Routes, User Setup ............................................. 8-3
8.4 How to Import Tracks, Points and Routes, User Setup.............................................. 8-4
8.5 How to Delete Files ....................................................................................................8-4
8.6 How to Update the System Software .........................................................................8-6
9. CAMERA/VIDEO....................................................................................................9-1
9.1 How to Display a Video Image ...................................................................................9-1
9.2 How to Set the Video Display.....................................................................................9-2
9.2.1 How to Select the Input Source......................................................................9-2
9.2.2 How to Cycle Your Video Inputs .................................................................... 9-2
9.2.3 How to Set the Cycle Period ..........................................................................9-3
9.3 How to Show Video ID ...............................................................................................9-3
9.4 How to Adjust the Video Image..................................................................................9-4
9.5 How to Control an Axis IP Camera ............................................................................9-4
10. INSTRUMENT DISPLAY......................................................................................10-1
10.1 How to Prepare the Hot Page ..................................................................................10-2
10.2 How to Show the Instrument Display ....................................................................... 10-2
10.3 How to Select an Instrument Display ....................................................................... 10-3
10.4 Instrument Displays..................................................................................................10-3
10.4.1 Steering Display........................................................................................... 10-3
10.4.2 Engine Display ............................................................................................. 10-4
10.4.3 Wind and Weather Display...........................................................................10-5
10.4.4 True Wind Display........................................................................................10-6
10.4.5 Apparent Wind Display.................................................................................10-6
viii
Page 10

TABLE OF CONTENTS
11. SIRIUS WEATHER RECEIVER...........................................................................11-1
11.1 Weather Display Introduction ...................................................................................11-1
11.2 Weather Icons ..........................................................................................................11-2
11.3 Weather Menu..........................................................................................................11-3
11.3.1 How to Display the Weather Menu...............................................................11-3
11.3.2 Weather Menu Description...........................................................................11-4
11.4 Weather Reports ....................................................................................................11-12
11.4.1 Marine Zone Forecast ................................................................................11-12
11.4.2 Marine Warning ..........................................................................................11-13
11.4.3 Tropical Weather Statement.......................................................................11-13
11.4.4 Marine WatchBox .......................................................................................11-14
11.5 Sirius Satellite Radio ..............................................................................................11-15
12. AUTOMATIC IDENTIFICATION SYSTEM (AIS).................................................12-1
12.1 AIS Introduction........................................................................................................12-1
12.2 How to Show or Hide the AIS Display ......................................................................12-1
12.3 AIS Target Symbols..................................................................................................12-2
12.4 Proximity AIS Target Alarm ......................................................................................12-2
12.5 How to Ignore AIS Targets .......................................................................................12-3
12.6 How to Display Target Data......................................................................................12-4
12.7 Track History Display................................................................................................12-4
12.8 How to Show and Hide Target IDs ...........................................................................12-4
13. HOW TO ADJUST SETTINGS ............................................................................13-1
13.1 RotoKey....................................................................................................................13-2
13.1.1 How to Select the RotoKey Set to Use.........................................................13-5
13.1.2 How to Set the RotoKey ...............................................................................13-6
13.2 Data Boxes...............................................................................................................13-7
13.2.1 How to Set the Data Boxes ..........................................................................13-7
13.2.2 How to Show or Hide all Data Boxes ...........................................................13-9
13.2.3 How to Adjust Transparency of Data Boxes.................................................13-9
13.3 How to Set the Display Selection Window................................................................13-9
13.3.1 How to Set the Number of Hotpages to Show..............................................13-9
13.3.2 How to Set a Hotpage ................................................................................13-10
13.4 Global Menu ...........................................................................................................13-12
13.4.1 Global-General Menu .................................................................................13-12
13.4.2 Global-Units Menu......................................................................................13-14
13.5 System Menu..........................................................................................................13-15
13.5.1 System-General Menu ...............................................................................13-15
13.5.2 System-Calibration Menu ...........................................................................13-16
13.5.3 System-Radar Menu ..................................................................................13-17
13.5.4 System-DFF1/BBDS1/DFF1-UHD, -DFF3/FCV Menu ...............................13-18
13.5.5 System-ETR-6/10N Menu ..........................................................................13-19
13.5.6 System-ETR-30N Menu .............................................................................13-20
13.6 My NavNet-General Menu......................................................................................13-21
13.7 How to Control Charts ............................................................................................13-23
13.7.1 How to View Your Charts ...........................................................................13-23
13.7.2 How to Update Charts ................................................................................13-24
13.7.3 How to Add a Chart ...................................................................................13-25
13.7.4 How to Delete a Chart ................................................................................13-25
14. MAINTENANCE, TROUBLESHOOTING ............................................................14-1
14.1 Maintenance.............................................................................................................14-1
14.2 Fuses........................................................................................................................14-2
14.3 The Magnetron .........................................................................................................14-2
14.4 Troubleshooting........................................................................................................14-3
ix
Page 11

TABLE OF CONTENTS
14.4.1 General Troubleshooting..............................................................................14-3
14.4.2 Radar Troubleshooting.................................................................................14-3
14.4.3 Chart Plotter Troubleshooting ...................................................................... 14-4
14.4.4 Fish Finder Troubleshooting ........................................................................ 14-4
14.5 GPS Status Display..................................................................................................14-5
APPENDIX 1 MENU TREE .......................................................................................AP-1
SPECIFICATIONS .....................................................................................................SP-1
INDEX..........................................................................................................................IN-1
x
Page 12

FOREWORD
A Word to the Owner of the MFD8, MFD12
Congratulations on your choice of the MFD8, MFD12 Multi Function Display, an integral part of
our new NavNet 3D series of multi-function displays. We are confident you will see why the FURUNO name has become synonymous with quality and reliability.
Since 1948, FURUNO Electric Company has enjoyed an enviable reputation for innovative and
dependable marine electronics equipment. This dedication to excellence is furthered by our extensive global network of agents and dealers.
Your equipment is designed and constructed to meet the rigorous demands of the marine environment. However, no machine can perform its intended function unless properly installed and
maintained. Please carefully read and follow the operation and maintenance procedures set forth
in this manual.
We would appreciate feedback from you, the end-user, about whether we are achieving our purposes.
Thank you for considering and purchasing FURUNO.
Features
The NavNet 3D series is a networked navigation system that gives you radar, chart plotter, fish
finder, AIS receiver, etc. Information is transferred between NavNet 3D units through a lightning
fast Ethernet. The plug and play format allows expansion and you can connect a maximum of 10
NavNet devices.
TM
The RotoKey
fast access to full control of NavNet 3D.
Chart plotter
• TimeZero
• Loaded with full scale, complete Mapmedia NOAA raster and vector charts for all the United
States.
• 3D display with controls for pitch and orientation.
• Way points, routes, tracks, etc. are transferred between NavNet 3D units through the Ethernet.
• Large memory stores 10,000 track points, 2,000 way points, and 200 routes.
• The overlay displays show depth shading, tide, tidal current, and satellite photo (North America
only).
Radar sensor (option)
, a rotary knob that controls an on-screen, turning menu of soft controls, gives you
TM
technology displays charts immediately with no load time.
• The radar antenna are in radome or open-array type.
• The radar echoes appear in color or monochrome.
• Automatic control of sea clutter, tuning and gain for easier operation.
• Guard zone checks for targets within the area you indicate.
• ARPA provided standard.
• Dual-range display for watch on short and long distances at the same time.
xi
Page 13

FOREWORD
• Compliant with IEC 62252 Ed.1:2004 (Clauses 4.33, 5.33, Annex D)
Fish finder (option)
• Measures the depth to the bottom and displays underwater conditions in multi-colors according
to echo strength. A monochrome presentation shows the echoes in shades of gray.
(*Number of colors depends on network sounder, color sounder.)
• The zoom mode enlarges the targets.
• Automatic and manual operation. Auto mode automatically adjusts range, gain and clutter according to purpose, fishing or cruising.
• ACCU-FISH
TM
estimates length and depth of individual fish.
(Requires appropriate transducer and Bottom Discrimination Sounder BBDS1, Network Sounder DFF series, or LCD Color Sounder FCV-1150.)
• The bottom discrimination display helps identify probable bottom composition. (Requires Bottom Discrimination Sounder BBDS1.)
Other
• The AIS function receives AIS data from other vessels, shore stations and navigational aids and
displays this data.
• The DSC (Digital Selective Calling) message information feature provides the MMSI no. and position of ships that have transmitted a DSC message to you. (Requires DSC capable radiotelephone.)
• USB port connects the plug and play USB devices (mouse, etc.).
• Instrument displays (steering, engine, weather, and wind) with connection of the correct sensors:
• The weather information display available with connection of Sirius weather receiver.
• The Sensor data is transferred to units through the Ethernet.
• IP camera (local supply) monitors activity on the vessel.
• NMEA 2000 interface for the connection of GPS receiver, Weather Station, FI-50 (instrument
series), Satellite Compass, etc.
• 100 Megabit per second transfer rate.
NavNet 3D registration
To use all of the features of your NavNet 3D, register your unit at the NavNet web site (www.navnet.com). This site is full of information and news about the NavNet 3D system and has a tutorial
to help you understand your system. Registration is easy and free. When you register, you get a
personalized page where you can access the various benefits. These benefits include online software and chart updates and personalized news services. Go to www.navnet.com and register to
get the most from your NavNet 3D system.
xii
Page 14
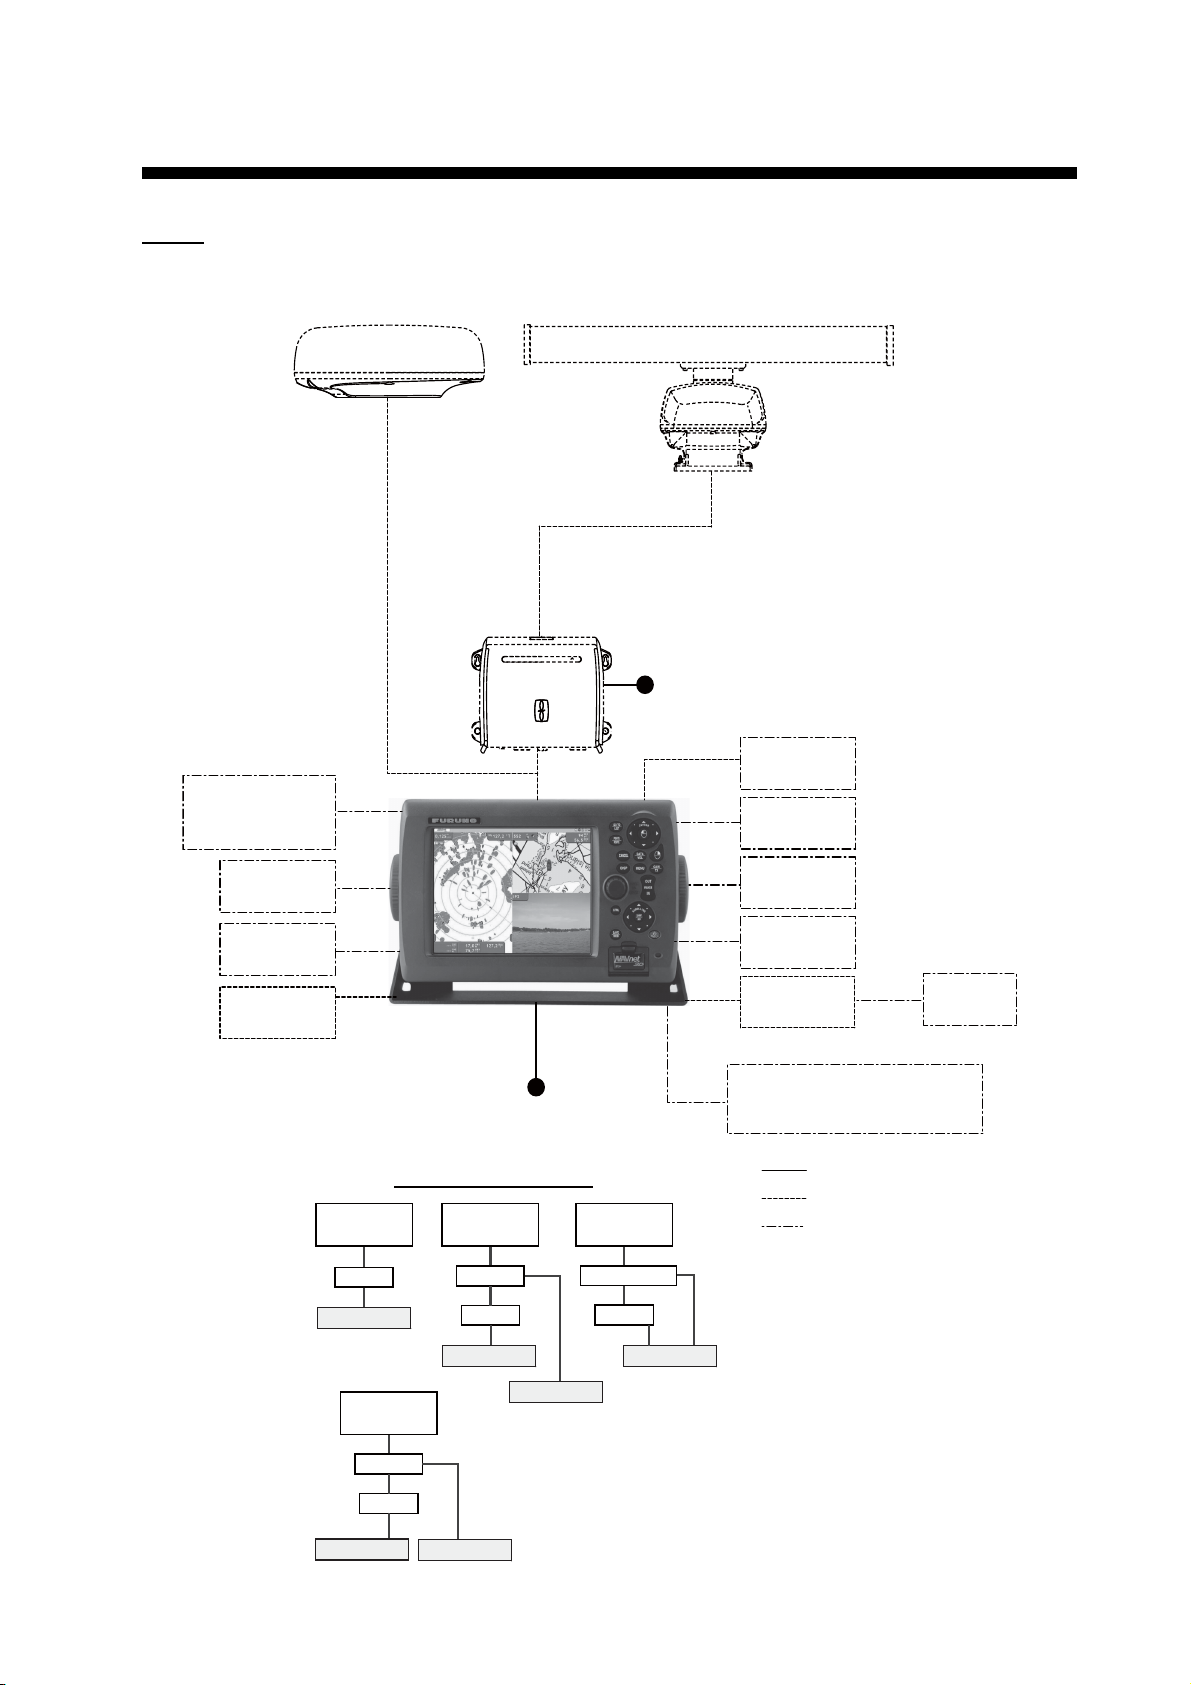
SYSTEM CONFIGURATION
MFD8
RADAR SENSOR
DRS2D/DRS4D
AIS RECEIVER,
HEADING SENSOR or
EXTERNAL BUZZER
DRS4A/DRS6A/DRS12A/DRS25A
OR
POWER SUPPLY UNIT*
PSU-012 or PSU-013
RADAR SENSOR
1
12-24 VDC*
2
MU-155C/170C, etc.
VIDEO IN(CCD
CAMERA, MAX. 2)
MONITOR
GPS NAVIGATOR
GP-320B/330B
USB DEVICE
(MOUSE, KYBD)
NMEA 2000
(GP-330B, ETC.)
*1
PSU-012: w/DRS4A/6A/12A
PSU-013: w/DRS25A
2
*
See the figure below for rectifiers used in the system.
DRS2D/4D
RU-3423
MULTI FUNCTION
DISPLAY MFD8
Rectifiers used in the system
DRS4A/6A/
MFD8
DRS25A
PSU-012
MFD8
PR-62
12-24 VDC*
12A
RU-3423
2
DRS4A/6A/
12A/25A
PSU-012/013
MFD8
RU-1746B
LINE OUT
(SPKR, ETC.)
LINE IN(MIC,
FUTURE USE)
HUB -101
FISH FINDER
FAX-30
FA- 50
BOTTOM DISCRIMINATION SOUNDER BBDS1,
NETWORK SOUNDER DFF ser. or ETR ser., or
COLOR LCD SOUNDER FCV-1150
: Standard Supply
: Optional Supply
: Local Supply
PSU-013
MFD8
PR-62
RU-1746B
xiii
Page 15
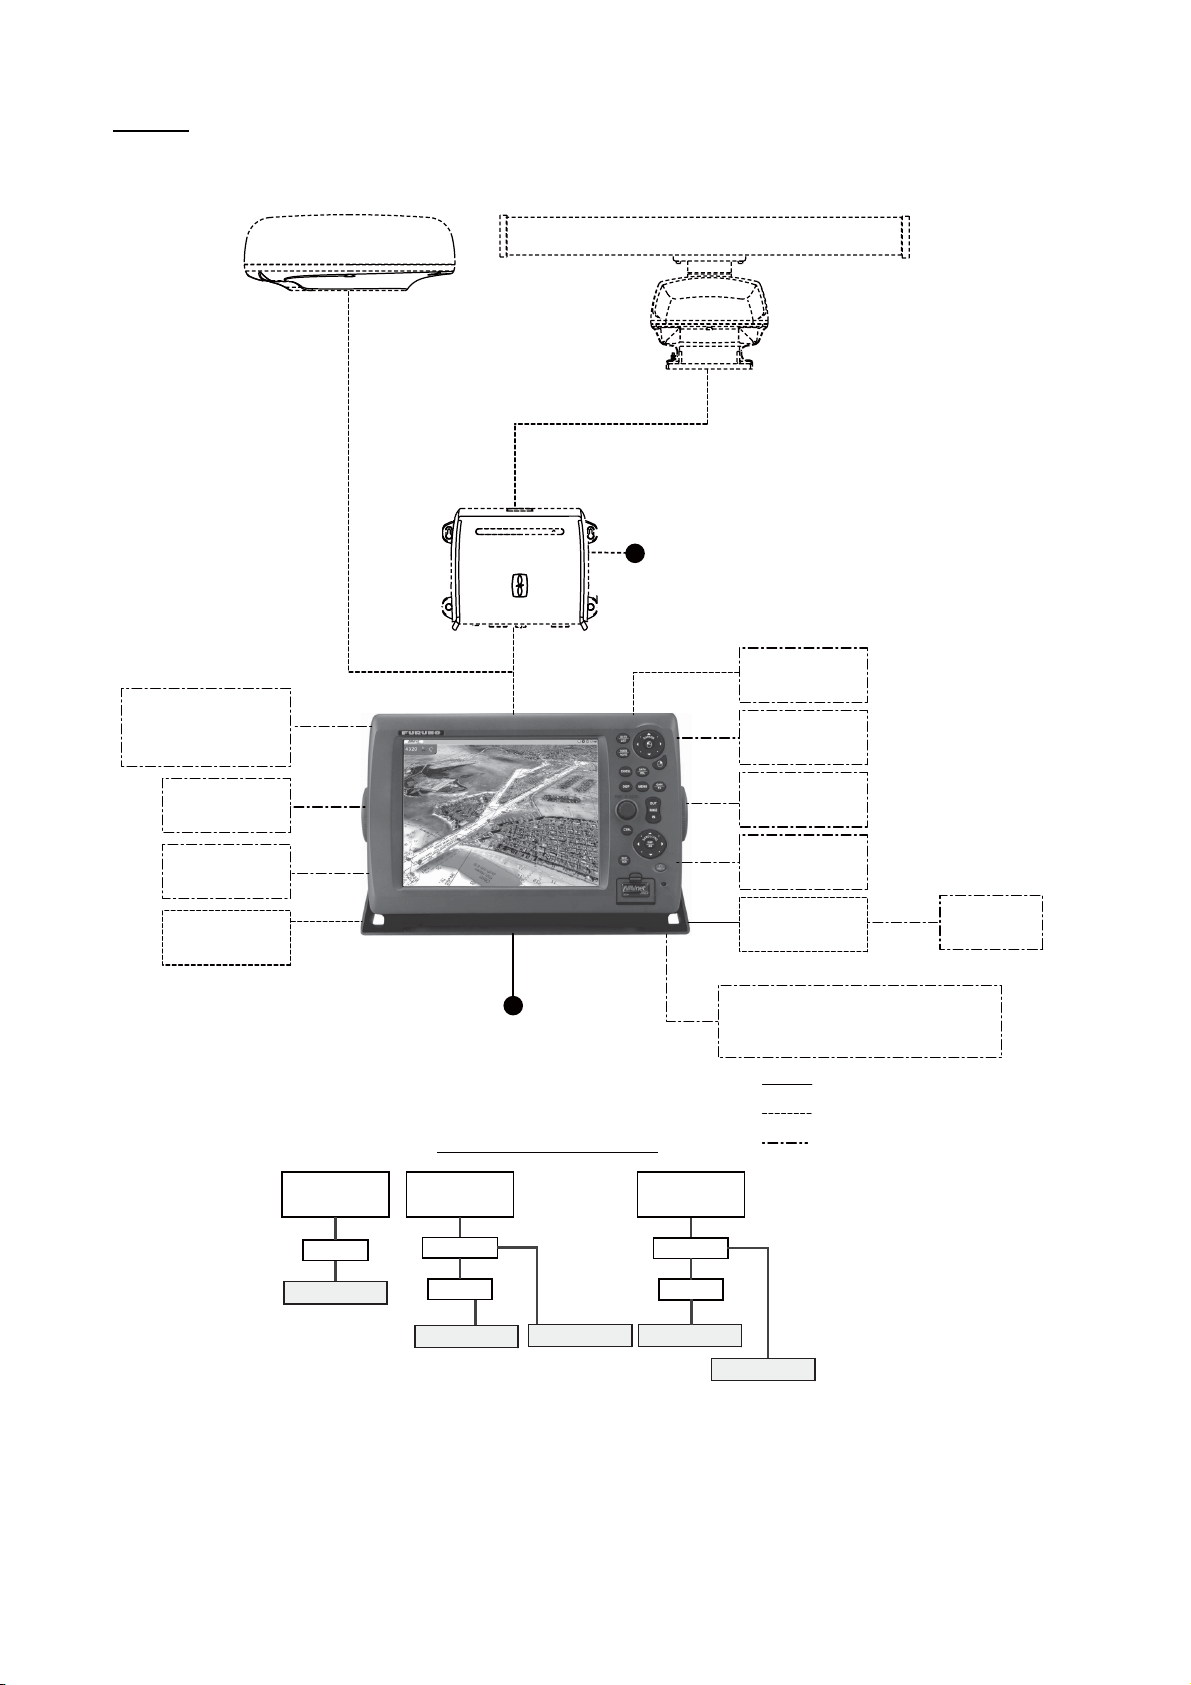
SYSTEM CONFIGURATION
MFD12
RADAR SENSOR
DRS2D/DRS4D
AIS RECEIVER,
HEADING SENSOR or
EXTERNAL BUZZER
OR
RADAR SENSOR
DRS4A/DRS6A/DRS12A/DRS25A
POWER SUPPLY UNIT*
PSU-012 or PSU-013
12-24 VDC*
1
2
MU-155C/170C, etc.
VIDEO IN (CCD
CAMERA, MAX. 2)
MONITOR
GPS NAVIGATOR
GP-320B/330B
USB DEVICE
(MOUSE, KYBD)
NMEA 2000
(GP-330B, ETC.)
*1
PSU-012: w/DRS12A
PSU-013: w/DRS25A
*2 See the table and figure below for
rectifiers used in the system.
DR2D/4D/
RU-3423
MULTI FUNCTION
DISPLAY MFD12
4A/6A
MFD12
12-24 VDC*
Rectifiers used in the system
DRS12A
PSU-012
MFD12
PR-62
RU-3423
2
DRS25A
PSU-013
MFD12
PR-62
LINE OUT
(SPKR, ETC.)
LINE IN(MIC,
FUTURE USE)
HUB-101
FISH FINDER
FAX-30
FA-50
BOTTOM DISCRIMINATION SOUNDER BBDS1,
NETWORK SOUNDER DFF ser. or ETR ser., or
COLOR LCD SOUNDER FCV-1150
: Standard Supply
: Optional Supply
: Local Supply
RU-1746B-2
xiv
Page 16

1. SYSTEM INTRODUCTION
This chapter provides the information necessary to get you started using your system.
Some of the topics are how to turn on the equipment and an introduction to the main
displays.
Standards used in this manual
• The keys and controls on the control panel are shown in bold face, for example the
DISP key. Other items that have a label, for example, the soft controls related to the
RotoKey, are shown in brackets in normal typeface. For example, [Head Up].
• The RotoKey controls the "soft controls", a revolving set of soft controls that gives
you access to full control of the NavNet 3D system. You rotate the RotoKey to select a soft control then push the RotoKey to do the function marked on the soft control. This manual states this operation procedure as "Use the RotoKey to select
[menu item name or soft control name].”
Note: RotoKey is a registered trademark or trademark of FURUNO Electric Co.,
Ltd.
• The menu system has a maximum of 15 menus and related sub menus. When you
are asked to open a menu, the name of the menu and sub menu are given, separated by a hyphen. For example, "Open the [Routes-General] menu".
• There is more than one method to do a function, Key operation, pop-up menu and
RotoKey.
1.1 The NavNet 3D System
The NavNet 3D network is a system where all parts use the same information (navigation data, settings, points, routes, etc.). Each unit in the system displays information
from other units and NMEA devices, like GPS navigator. Information is transferred
between MFDs through a high-speed Ethernet.
Each MFD has a special "sleep mode" that allows each MFD to operate while using
low power. The MFDs can be in three states:
• ON: Normal mode of operation. The screen is on and the user can operate the MFD.
The MFD operates and transfers information across the network.
• Sleep Mode: The screen is turned OFF and only the power switch operates (to turn
the power OFF). The MFD in this state can process controls and transfer information with other MFDs on the network. The MFD uses low current in this state.
• OFF: The MFD is turned OFF and does not control information. The MFD does not
use any current in this state.
When power is applied to an MFD (with the power switch), all the other MFDs start in
the sleep mode. If you operate the power switch on an MFD that is in the sleep mode,
the MFD turns on. If you press the power switch on an MFD more than three seconds,
all MFDs in the network are turned OFF.
Note: If you press a power switch more than 5-7 seconds, all MFDs turn OFF and
power synchronization is lost. To restore power synchronization, first turn off all MFDs.
1-1
Page 17

1. SYSTEM INTRODUCTION
Then, hold down the power switch of the MFD that was responsible for loss of power
synchronization for three seconds.
1.1.1 How to sleep the equipment
You can sleep the equipment when its use is not required continuously. With the Standard or Full RotoKey set active, push the RotoKey, rotate the key to select [Sleep]
then push the key. To un-sleep the equipment, push the power key until the picture
appears.
1.2 Controls
The controller for this system is either the MFD8 or MFD12.
A key that has two text labels separated by a line has two functions. The top label is
the main function and the bottom label, the secondary function. Short-push to access
the main function and long-push (approximately three seconds) to access the secondary function.
You operate the chart plotter, radar, fish finder, etc. with
• Keys
• CursorPad
• ScrollingPad
• RotoKey
• Menus, where you select options
• Pop-up menus, where you select options
• Lists, where you can edit items
When you operate a key, a single beep sounds to tell you correct operation. For wrong
operation, three beeps sound. If you do not need the key beep, deactivate the beep
sound from the [Global-General] menu.
1-2
Page 18
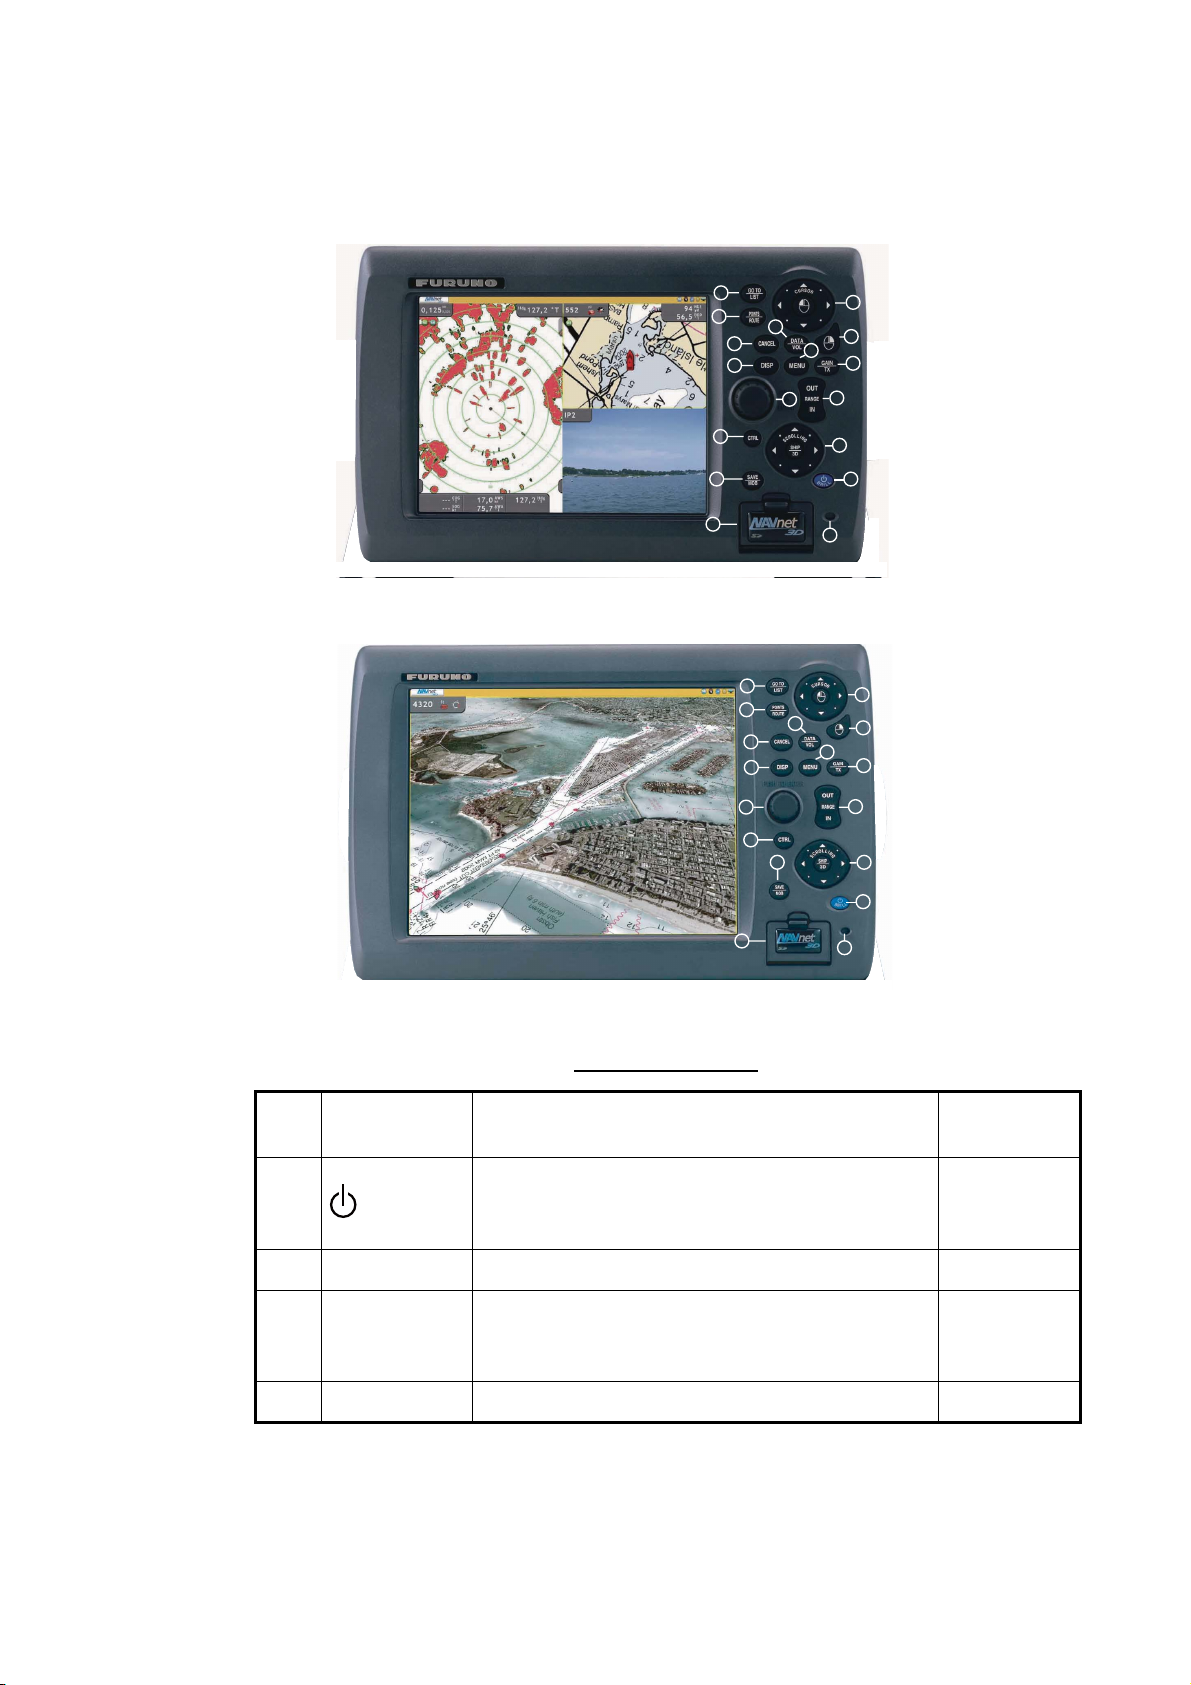
1.2.1 Control Description
The controls of your system are in the figure shown below. Controls are illuminated for
nighttime use.
1. SYSTEM INTRODUCTION
Model MFD8
9
8
12
7
6
5
4
3
2
9
8
7
6
5
4
3
10
11
13
14
15
16
1
17
10
12
11
13
14
15
16
1
2
17
Model MFD12
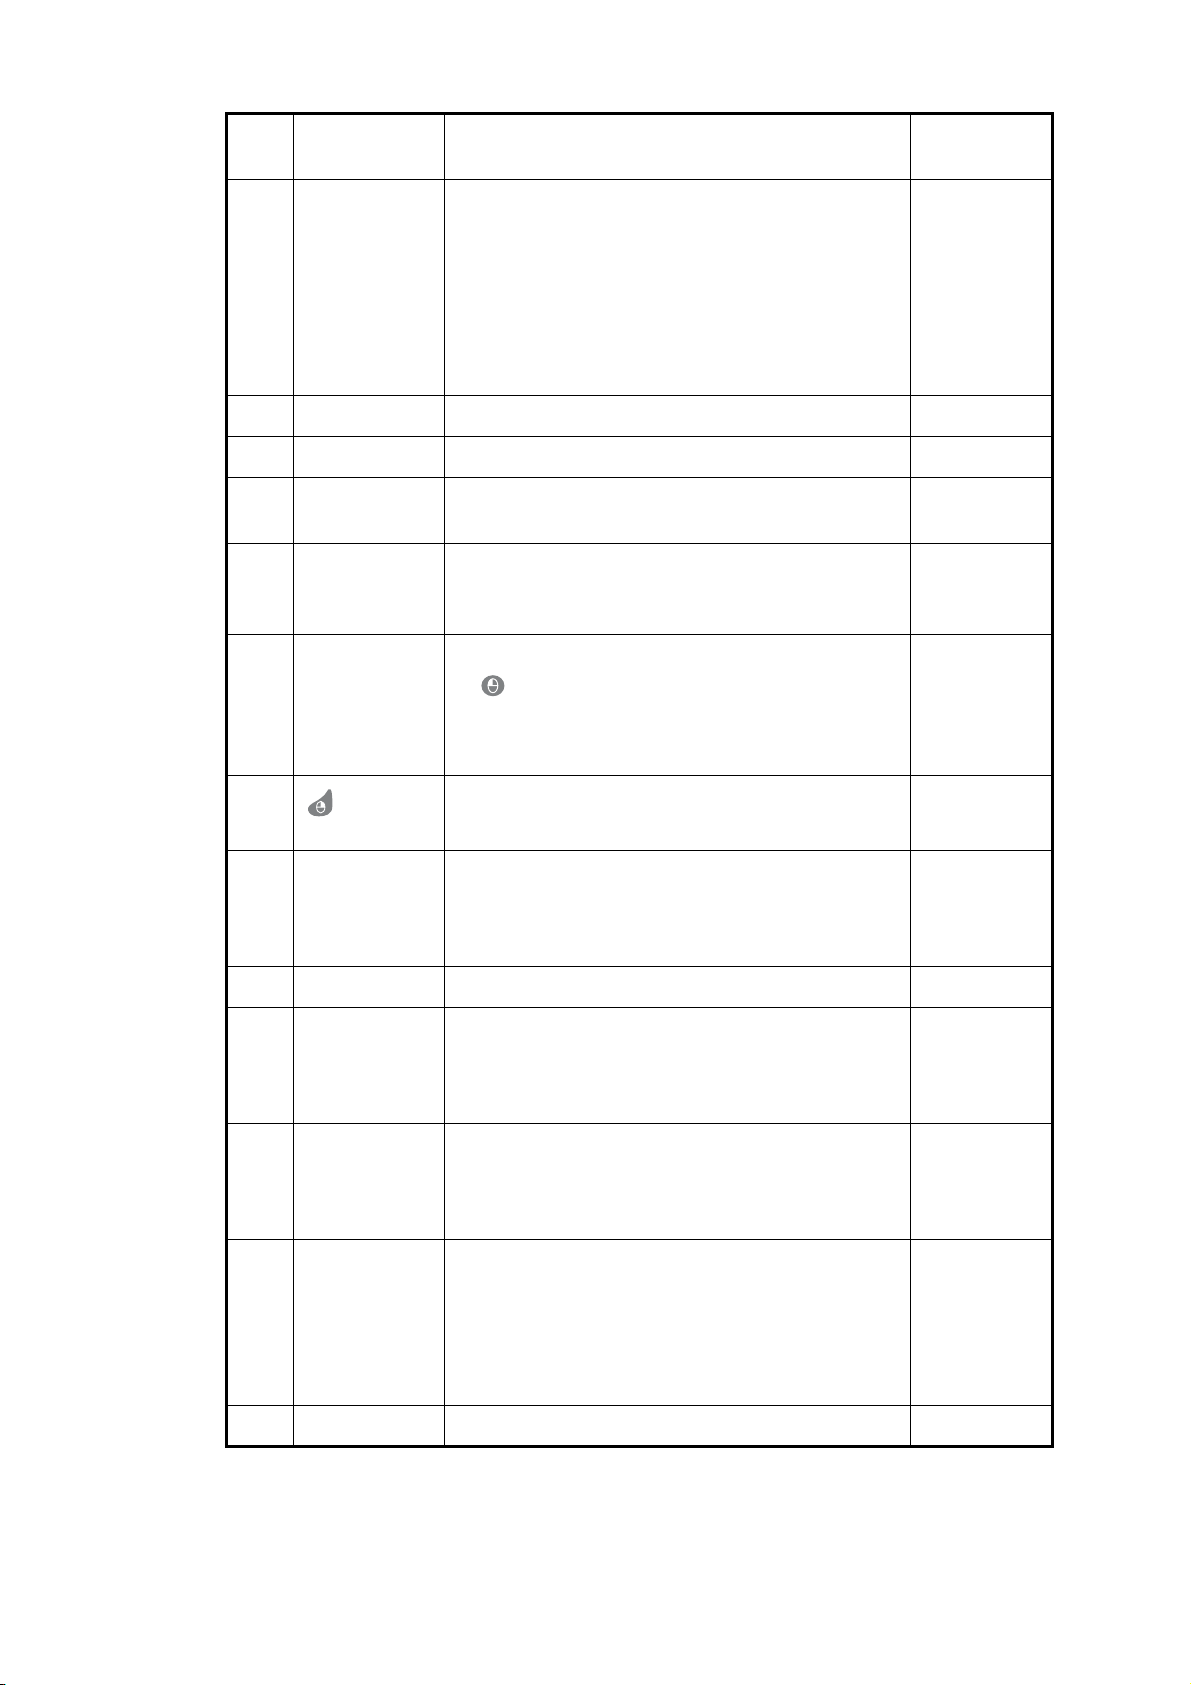
Control description
No. Label Function
1 Short-push: Turn ON the power. Adjust the
panel dimmer.
BRILL
Long-push: Turn the power OFF.
2 Card drive Card drive for memory cards. -
3 SAVE/MOB SAVE: Save the current position as a point.
MOB: Save the current position as a MOB
position.
4 CTRL Select the active display in combination displays. -
Mouse
operation
-
-
1-3
Page 19
1. SYSTEM INTRODUCTION
No. Label Function
5 RotoKey • Rotate to display soft controls, the quantity
(basic, standard, full or custom) of which you
select from the menu, or select the menu item.
• Short-push to display soft controls, the quantity (basic, standard, full or custom) of which is
indicated on the menu, or validate a selection.
• Long-push to display all available soft controls
for the current mode.
6 DISP Select a display. -
7 CANCEL Undo or cancel last operation. -
8POINTS/
ROUTE
9 GO TO/LIST GO TO: Set the cursor position as the destina-
10 CursorPad • Pad: Move the cursor.
POINTS: Save the cursor position as a point.
ROUTE: Activate the route building tool.
tion.
LIST: Open the Points menu.
• Functions like the "left-click" button on a
PC mouse. This button has the name “left-
click” button in this manual.
Mouse
operation
Scrollwheel.
Spin to display soft controls or select
item. Push to
validate selection.
-
-
• Move the
cursor.
• Left
mouse
button
11
12 DATA/VOL DATA: Show and hide the data boxes.
13 MENU Open and close the menu. -
14 GAIN/TX GAIN: Adjust the gain for the radar and the fish
15 RANGE OUT, IN• Select range on the chart, radar and fish
16 ScrollingPad • Pad: Scroll the chart, radar picture and AXIS
(right-click
button)
Show a pop-up menu. This button has the name
“right-click” button in this manual.
VOL: Change audio level. If you have the Sirius
weather receiver, the Sirius satellite radio screen
appears.
finder.
TX: Change between stand-by and transmit on
the radar and fish finder.
finder.
• Zoom in and zoom out the Axis IP camera
image.
IP camera image.
• SHIP/3D button: Short-push to put your vessel at the center of the screen. Long-push to
change between the 3D and 2D displays alternately.
Right mouse
button
-
-
-
-
1-4
17 Power lamp Lights when the power is applied to the system. -
Page 20
1.3 Power ON and OFF
1. SYSTEM INTRODUCTION
Press to turn the power ON. To turn the power OFF, press and hold the same key.
The message "All Network Devices will shut down in Xm XXs" displays the amount of
time remaining until power off.
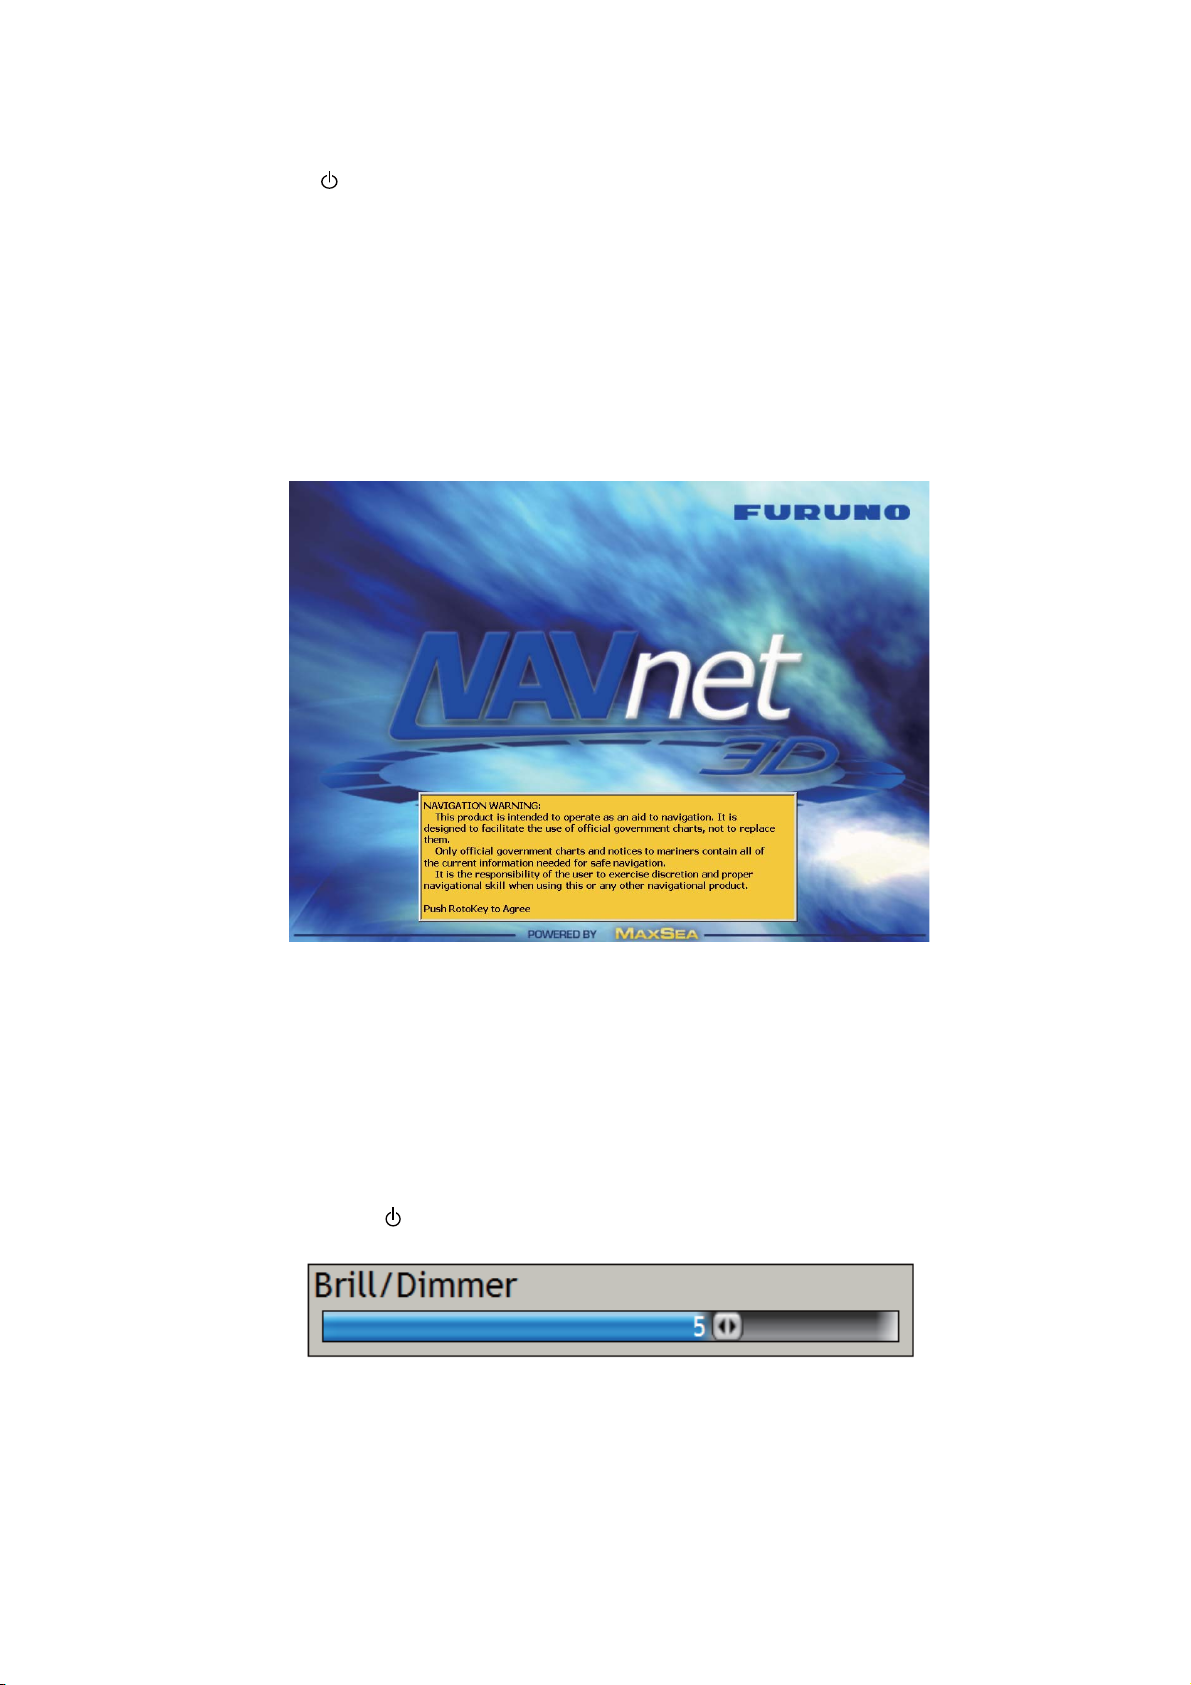
When you turn on the power, two or three beeps sound and the lamp near the power
switch lights. The start-up screen appears with the progress bar (at the bottom of the
screen). The progress bar moves to the right as the procedure continues. Approximately 90 seconds after you apply the power, the Navigation Warning message appears. Read the message then push the RotoKey to begin operation. (There is an
additional message if your NavNet has the Sirius weather feature.)
BRILL
Note: Do not turn off the power during the start-up. Wait until the start-up is completed
before you turn the power OFF.
1.4 Panel Dimmer, Display Brilliance
Adjust the illumination of the panel dimmer and the brilliance of the display as shown
below.
1) Push the key to display the [Brill/Dimmer] adjustment window.
2) Rotate the RotoKey to adjust the panel dimmer and display brilliance. The current
level is shown on the bar.
3) Push the RotoKey to validate the setting and close the window.
BRILL
1-5
Page 21
1. SYSTEM INTRODUCTION
ACTIVE
ACTIVE
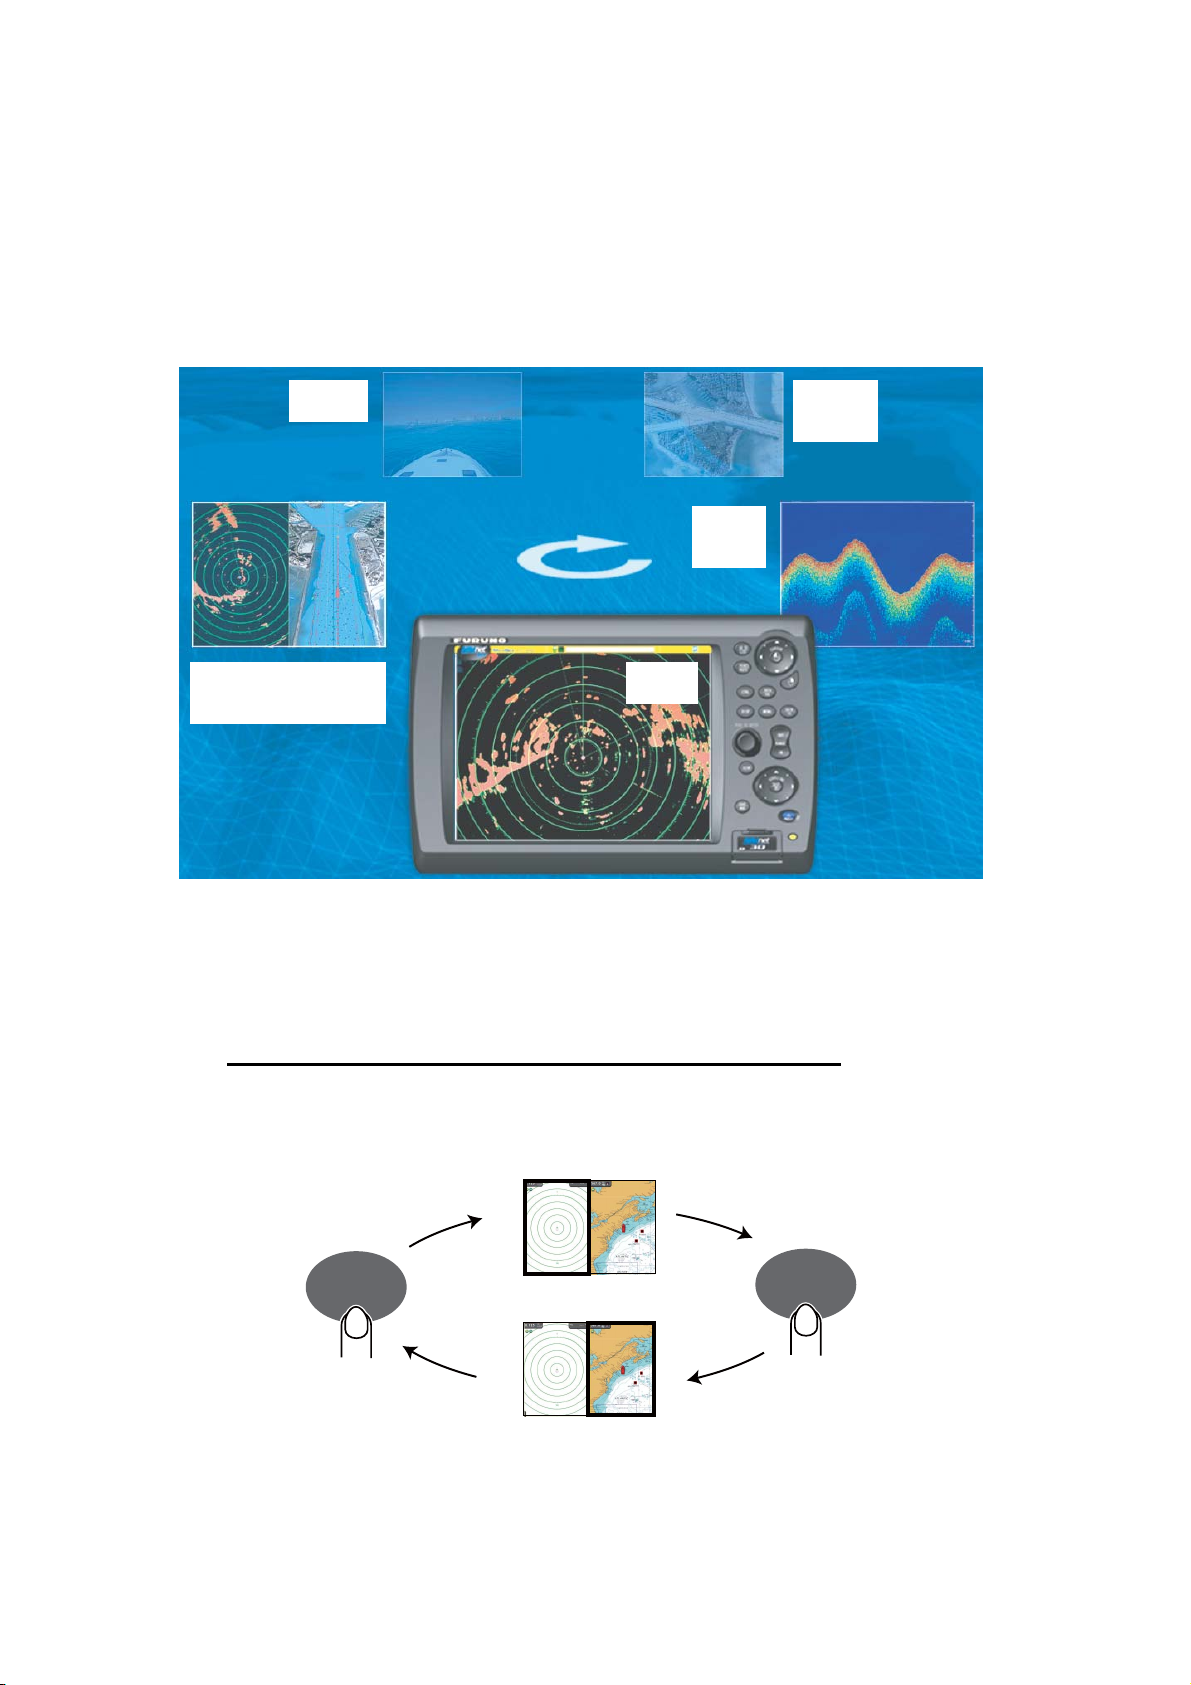
1.5 How to Select a Display
Use the DISP key and the RotoKey to select a display, from the display selection window. The displays available depend on your system configuration and the HotPage
settings on the [My NavNet] menu. (You can change the display selection window according to your needs and system configuration.)
1) Press the DISP key to show the display selection window. (The labels in the illustration below do not appear on the display.)
CAMERA
DISPLAY
FISH
FINDER
DISPLAY
COMBINATION DISPLAY
(radar+chart plotter)
Display selection window (example)
2) Rotate the RotoKey to put the required display in the "monitor" at the bottom of
the screen.
RADAR
DISPLAY
CHART
PLOTTER
DISPLAY
3) Push the RotoKey to validate your selection.
How to select the active display in combination displays
Use the CTRL key to change the active display in combination displays. A thick
red line is around the active display.
ACTIVE
CTRL
CTRL
ACTIVE
1-6
Page 22
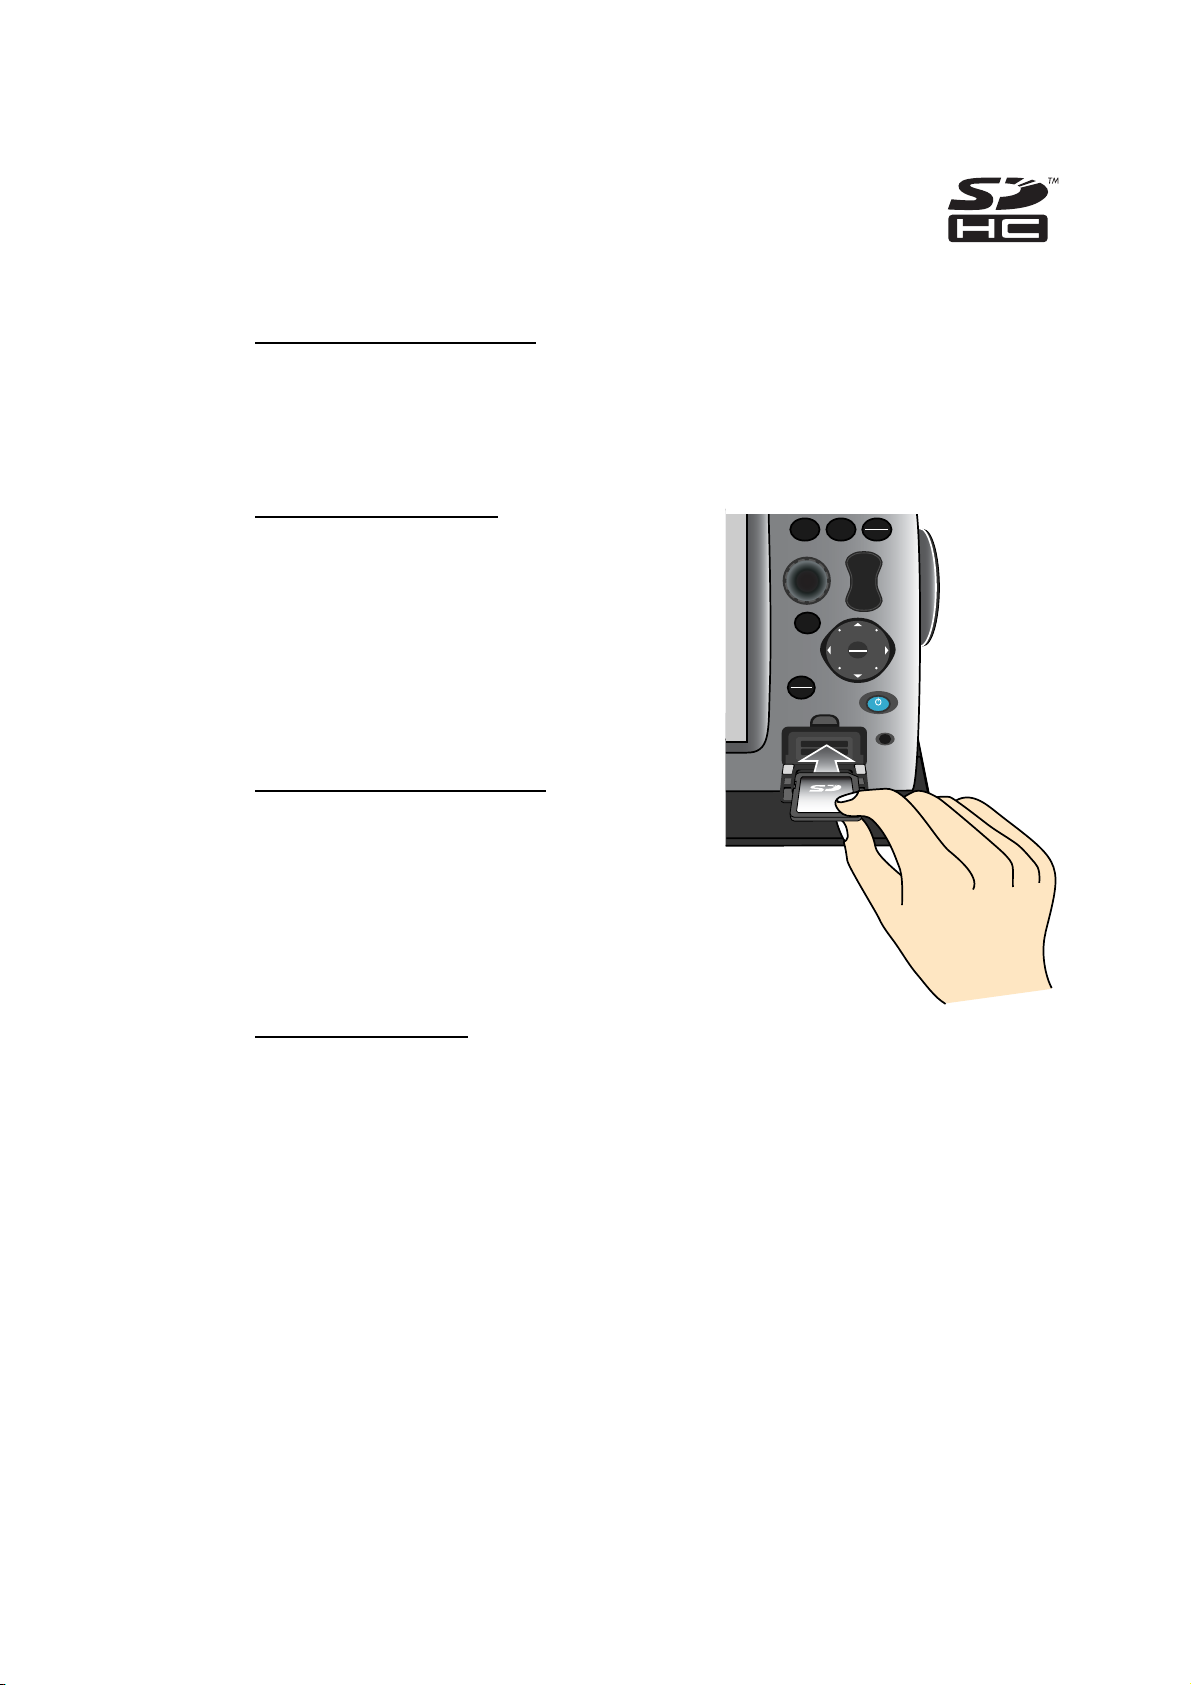
1.6 SD Cards
The SD card stores the tracks, routes, points, settings, etc. Set and
remove SD cards as shown below. The recommended capacity for
the cards is 128 MB to 2 GB. The Secure Digital High Capacity
(SDHC) cards can also be used, and the maximum capacity is 32
GB.
How to format an SD card
You do not normally need to format an SD card for use with the system. If the card
becomes damaged, format the card with a formatting program that is compatible with
the specifications of the SD card. The SD Memory Card Formatting Software made by
Panasonic is an example.
1. SYSTEM INTRODUCTION
How to set an SD card
1) Pull the tab on the card drive cover to open
the card drive.
2) As shown in the right-hand figure, put the
SD card in either card drive with the label
up. If the card does not set easily, do not
use force.
DISP MENU
CTRL
SAVE
MOB
S
OUT
RANGE
L
O
R
C
SHIP
3D
GAIN
TX
IN
L
I
N
G
B
L
R
L
I
3) Push the card until the card is in position.
How to remove an SD card
1) Pull the tab on the card drive cover to open
the card drive.
2) Push the card to release the card from the
card drive.
3) Remove the card with your fingers then
close the cover.
About the SD cards
• Use SD cards carefully. Wrong use can damage the card and destroy its contents.
• Make sure the cover is closed at all times.
• Remove a card with only your fingers. Do not use metal instruments (like tweezers)
to remove the card.
• Do not remove a card during the reading of the card or writing to the card. The pow-
er LED flashes when the system accesses an SD card.
• If there is water at the bottom of the card cover, DO NOT open the cover. Re-
move the water with a dry cloth completely and then open the cover.
1-7
Page 23
1. SYSTEM INTRODUCTION
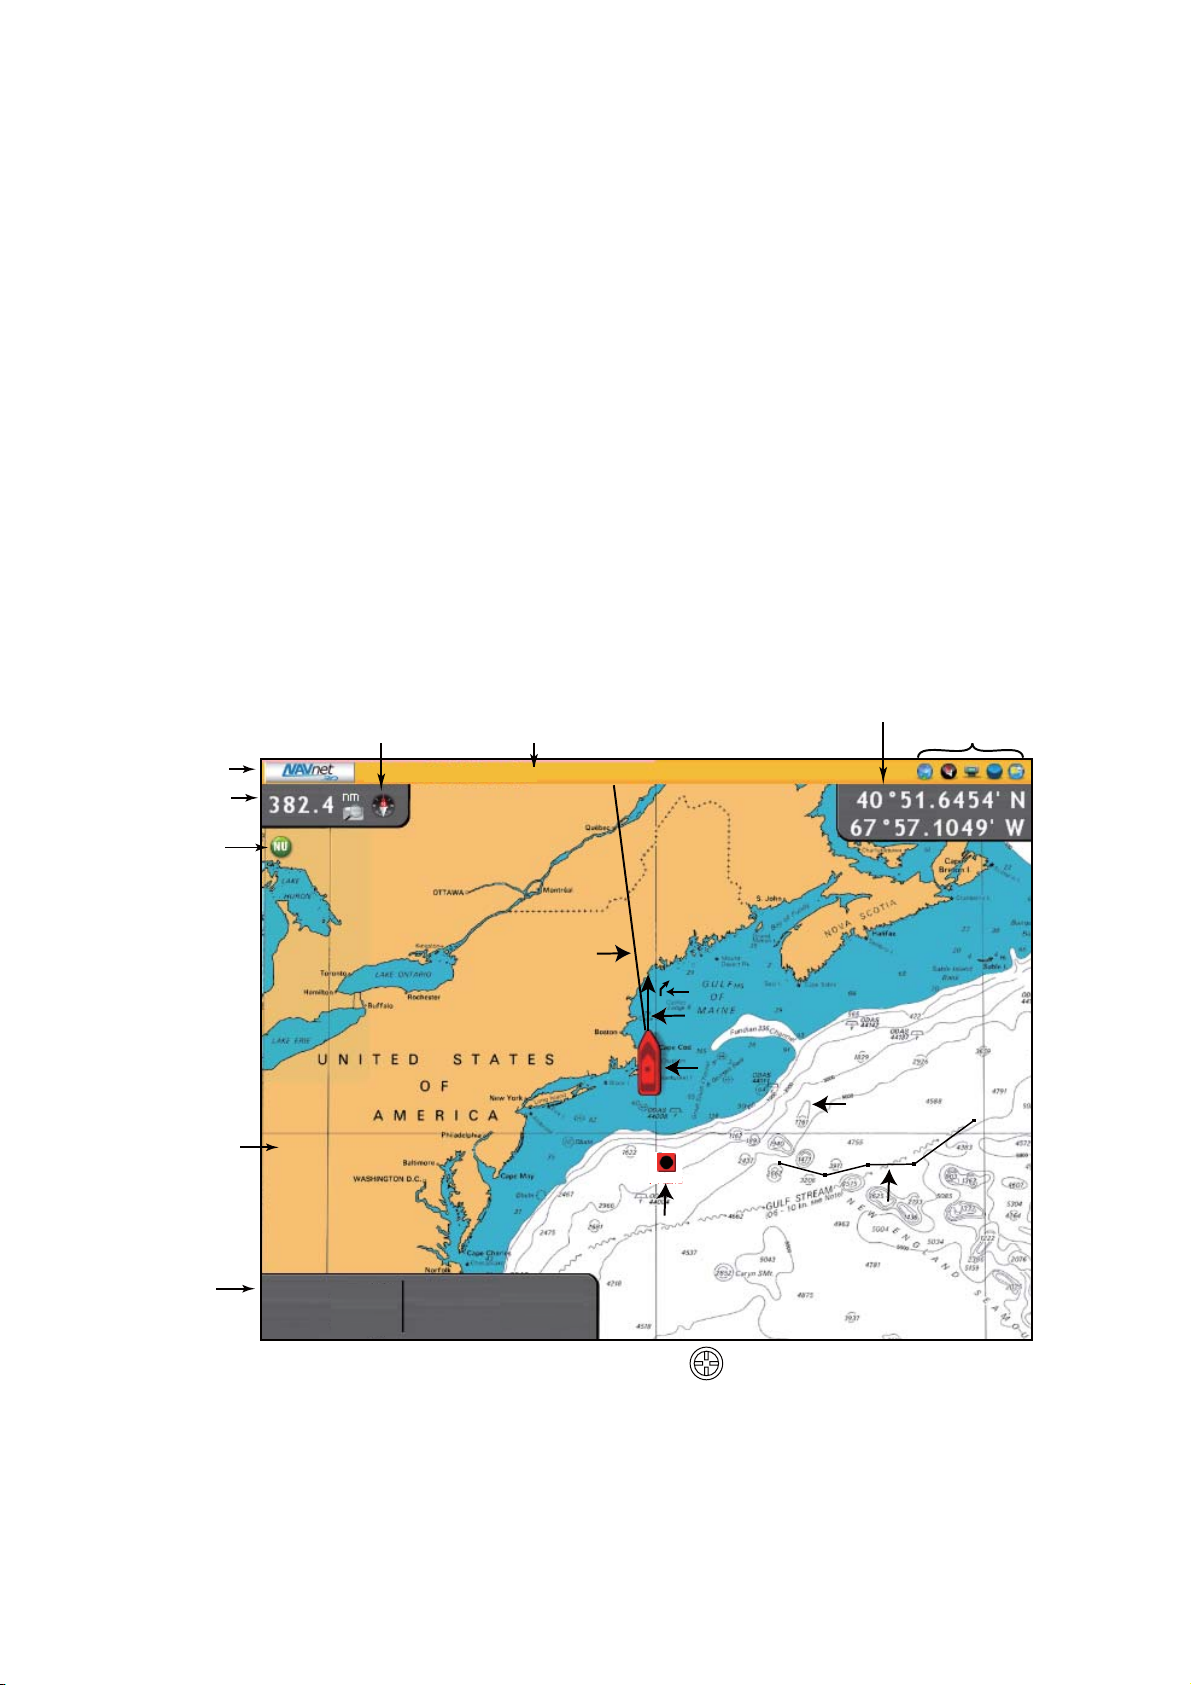
1.7 Chart Plotter Introduction
The chart plotter provides a small world map in raster format. A vector chart for the US
coastline (with Alaska and Hawaii) is provided also. The plotter section has functions
to enter waypoints, and create and plan routes.
The chart plotter receives position information supplied from the position-fixing equipment like GPS or DGPS. Your position is marked on the screen with the boat icon. You
can change the shape of the icon to match that of your vessel.
Waypoints and routes you have entered are shown on the display. You can move, delete and edit the waypoints and routes from a pop-up menu.
The chart plotter also
• Plots the track of your vessel
• Measures distances and bearings
• Marks man overboard (MOB) position
• Controls alarm functions
• Follows routes
Status bar
Chart scale,
scale reminder
Orientation
mode icon
Chart
(raster)
Data
boxes
North indicator
COG
23.2
°
T
SOG
9.2
kt
Text message area
Heading line
(green)
DPT
103
m
Cursor data (position, range and
bearing alternately)
Direction of turn indicator (red)
SOG/COG predictor (red)
Boat icon (red)
+
Cursor*
(red)
PT-0015
Point
(black circle in
red square)
Route
(blue: inactive
red: active)
Sensor icons
1-8
* Inactive cursor. Active cursor looks like this .
Page 24
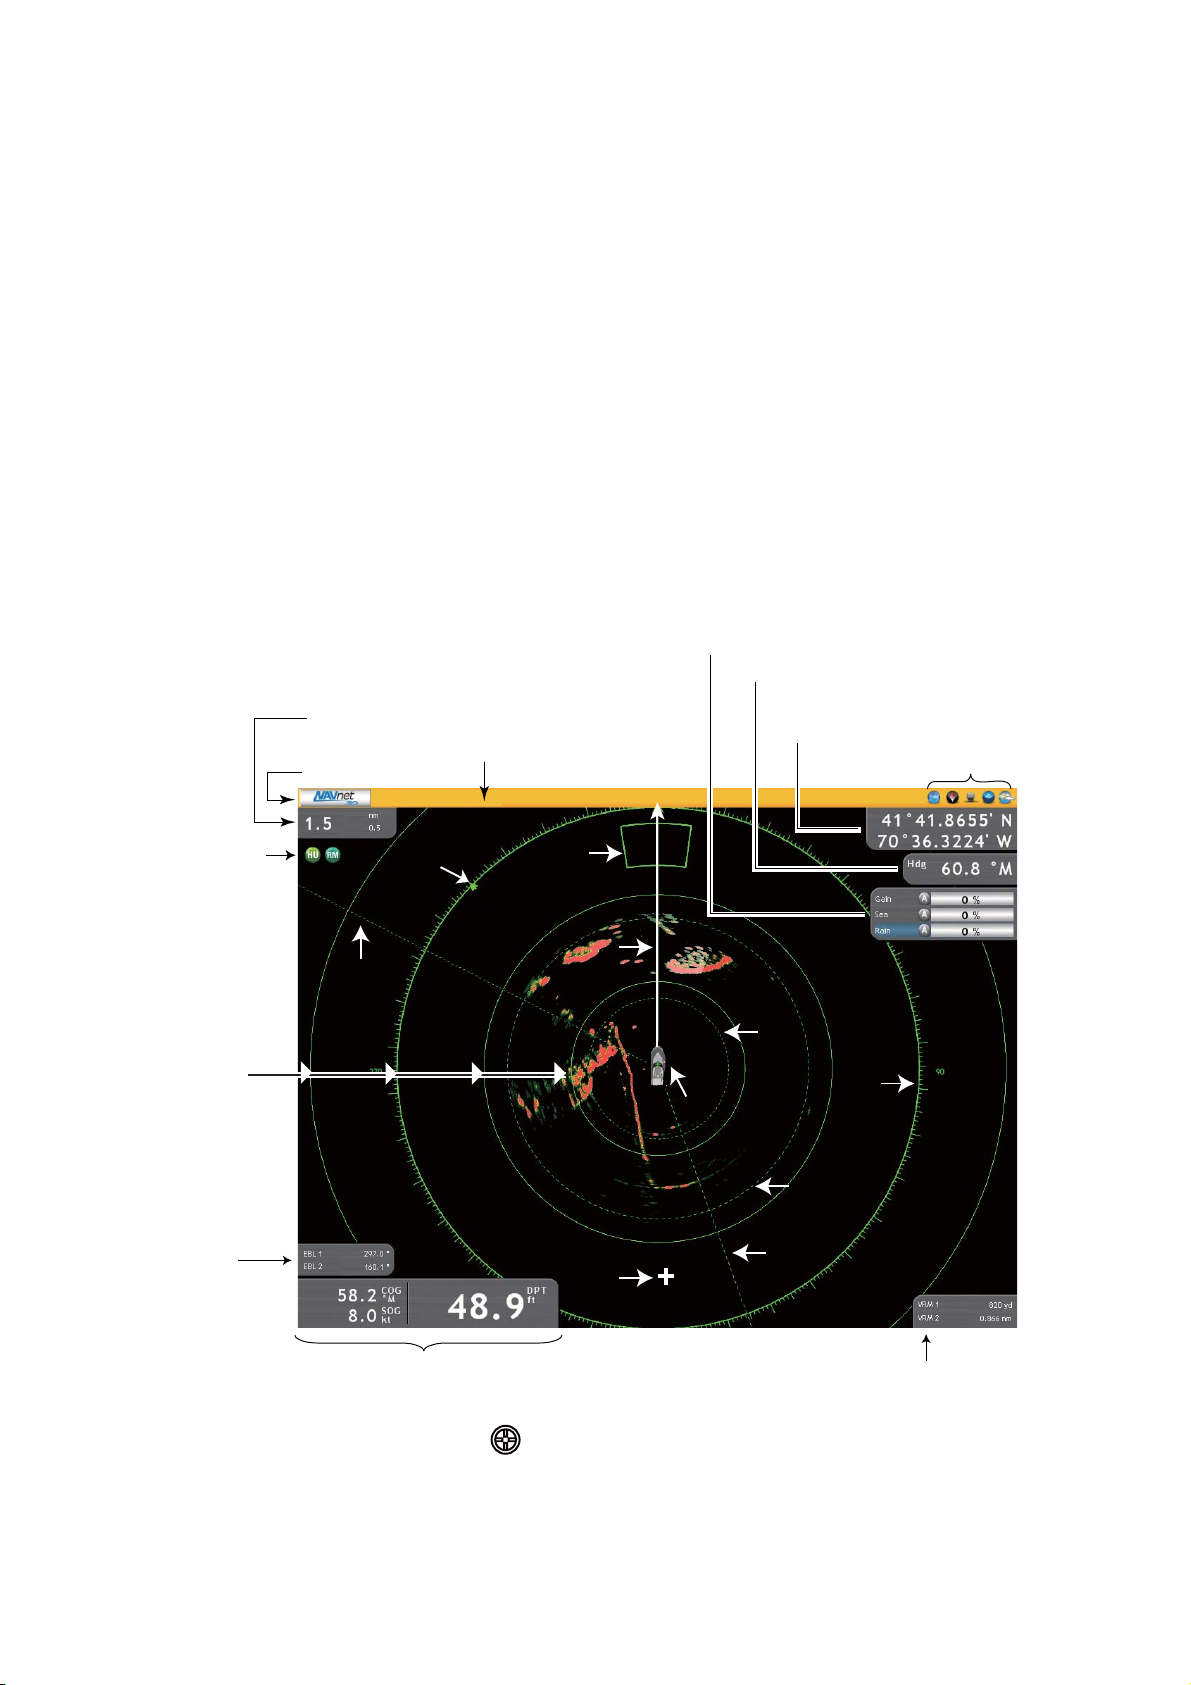
1.8 Radar Introduction
A radar system operates in the microwave part of the radio-frequency (RF) range. The
radar detects the position and movement of objects. Objects are shown on the radar
display at their measured distances and bearings in intensities according to echo
strength.
The radar display is available in head-up, course-up and north-up modes and orientation in true and relative motion. The relative motion display shows other vessels movement relative to your vessel. The true motion display shows your vessel and other
objects in motion according to their true courses and speeds.
Two VRMs measure the range to targets, and two EBLs measure the bearing to targets. A guard zone tells you when the radar targets are in the area you indicate. The
trail of targets can be shown in afterglow to monitor their movements.
The dual-range display scans and displays two different radar ranges at the same
time. This display lets you watch on both short and long ranges at the same time.
1. SYSTEM INTRODUCTION
Window for adjustment of gain,
sea and rain (normally hidden)
Heading
Presentation
mode icon,
Motion mode
icon
Fixed range
rings
EBL box
(hidden when
no EBL is
active)
Range, range ring
interval
Status bar
North
marker
EBL1
Text message area
Guard
zone
Heading
line
Cursor*
+
Own ship
icon
Cursor data (position and
range and bearing alternately)
Sensor icons
VRM1
Bearing
scale
VRM2
EBL2
Data boxes
* Inactive cursor is shown as a plus sign.
Cursor looks like this when in motion.
VRM box
(hidden when
no VRM is active)
1-9
Page 25
1. SYSTEM INTRODUCTION
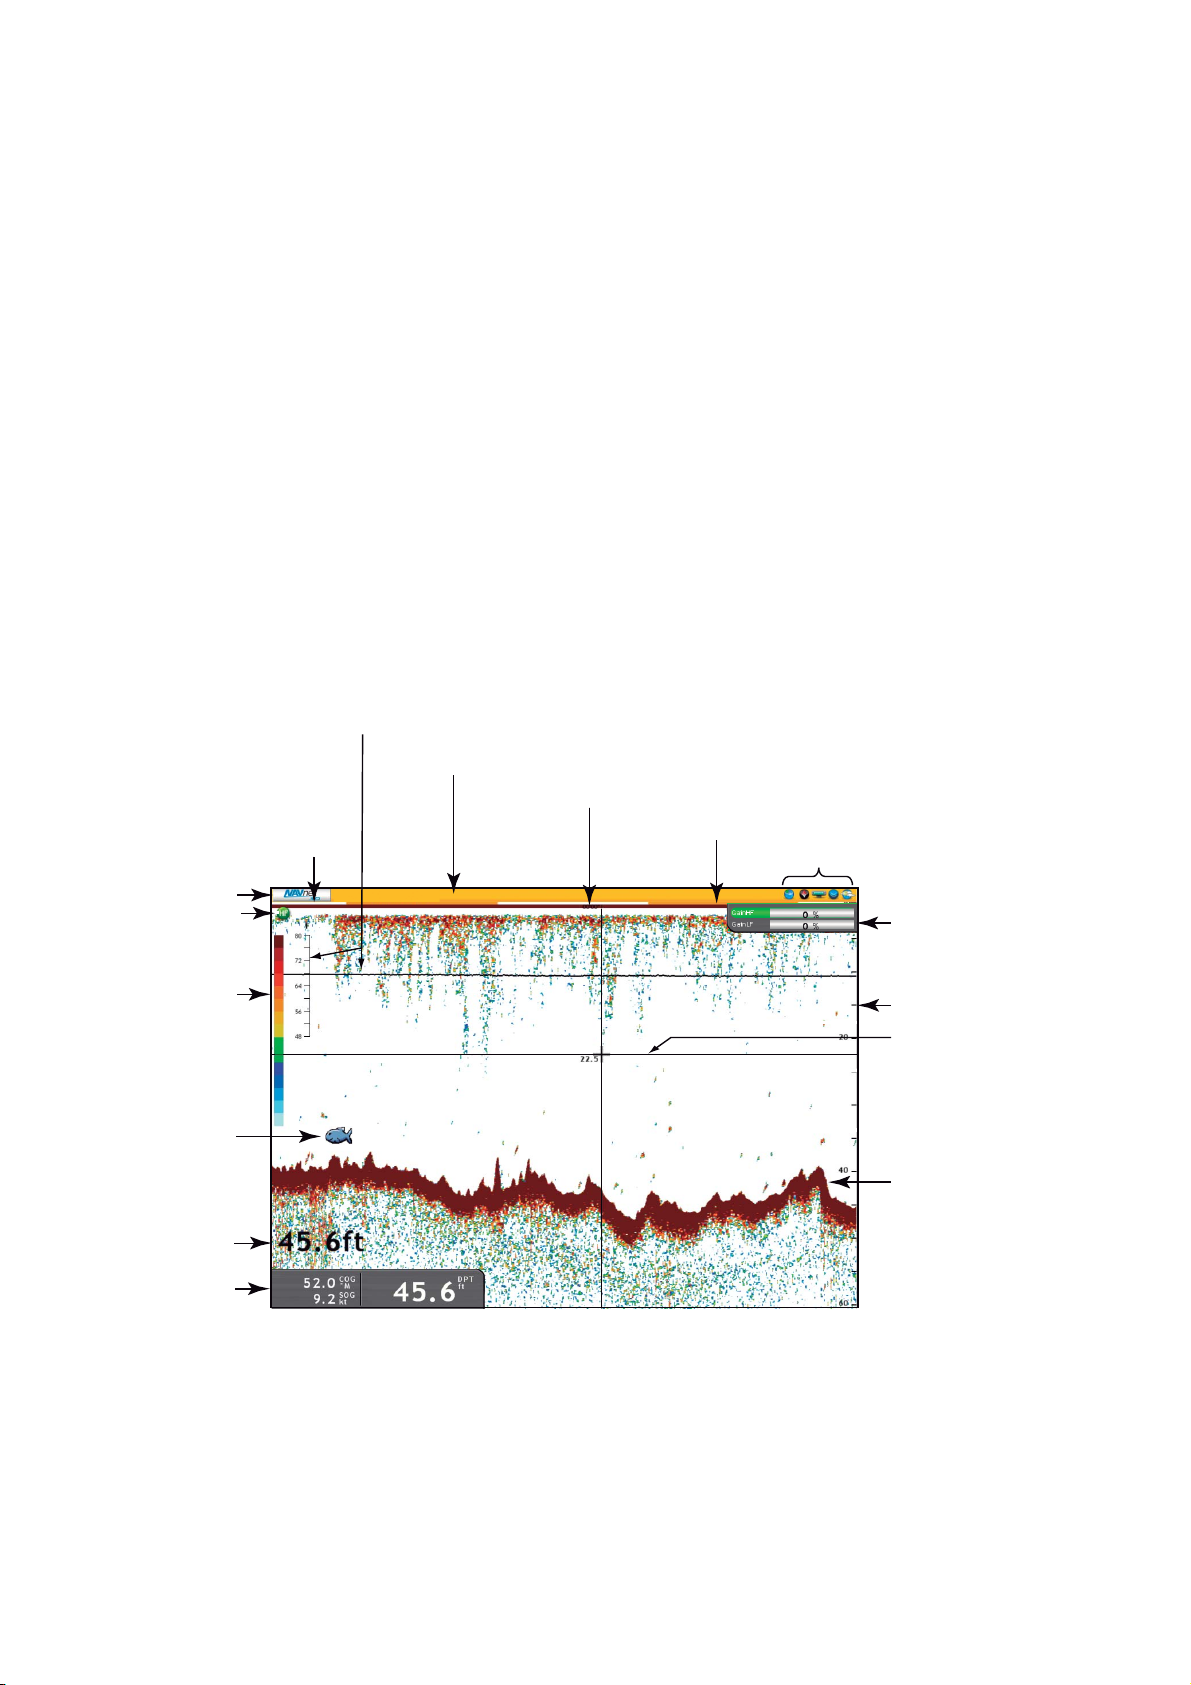
1.9 Fish Finder Introduction
The fish finder screen provides a “picture” of the echoes found by the fish finder. Echoes are scrolled across the screen from the right position to the left position. The number of minutes an echo is displayed on the screen is controlled by the picture advance
speed.
The echoes at the right position are the current echoes. These echoes can be from
separate fish, a school of fish, or the bottom. Depth to the bottom is indicated always,
provided the gain is set correctly.
Both low and high-frequency TX frequencies are provided. (Frequencies depend on
the transducer connected.) The low frequency has a wide detection area, which is for
general detection and understanding bottom conditions. The high frequency has a
narrow beam that helps you inspect fish.
The range, gain, clutter and TVG can be adjusted automatically according to your purpose (cruising or fishing) to let you do other tasks.
The color bar at the left edge of the display shows the range of colors used to display
different echo strengths. Weaker echoes appear in colors near the bottom of the scale,
and stronger echoes appear in colors near the top.
Status bar
Frequency
selector icon
Color bar
Fish symbol**
Depth
Data boxes
Minute marker
(dark yellow
and white
alternately,
30 s each)
34
Water temperature scale and graph*
Text message area
Elapsed time (from right edge to vertical line)
Zero line (reddish brown)
Sensor icons
Gain adjustment
window
(normally hidden)
Depth scale
VRM
Bottom echo
* Requires water temperature sensor.
**ACCU-FISH
(Requires appropriate transducer and Bottom Discrimination Sounder BBDS1, Network
Sounder DFF series, or Color LCD Sounder FCV-1150.)
TM
feature estimates length of individual fish.
1-10
Page 26
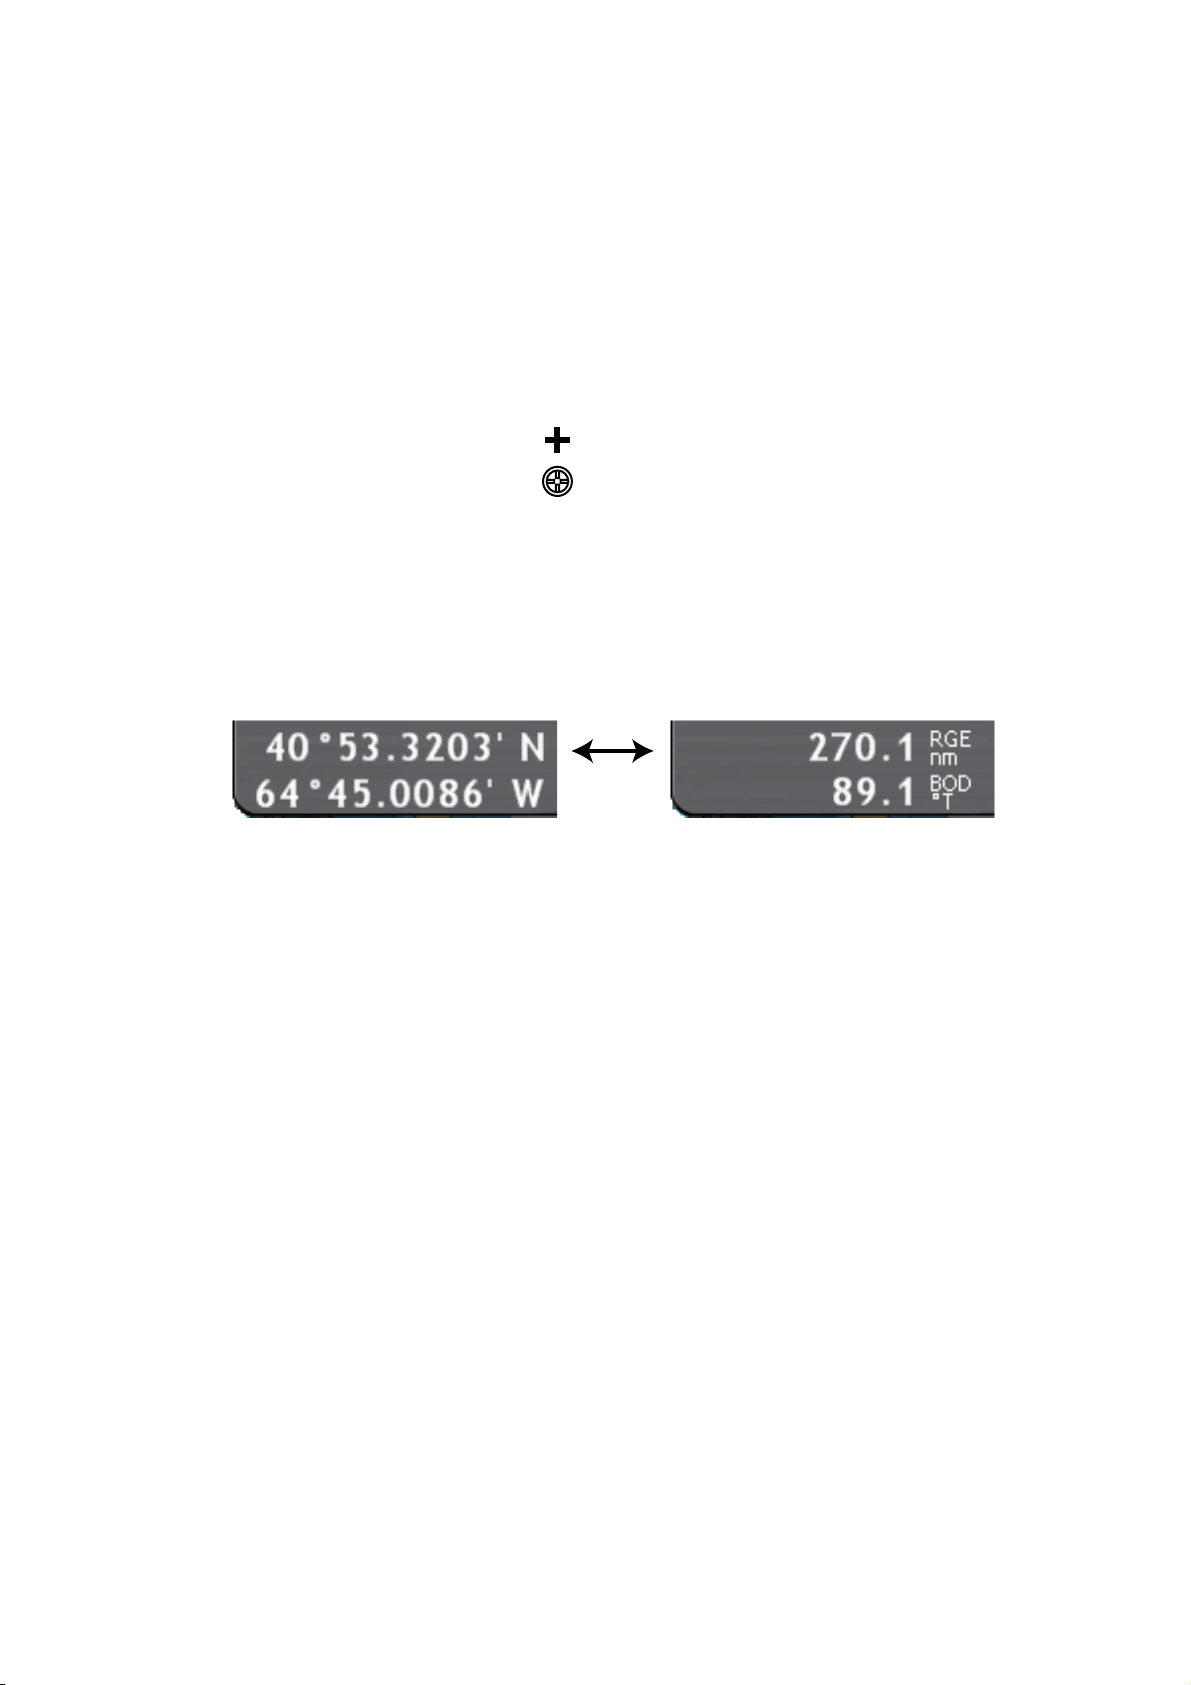
1.10 The Cursor
The cursor is always displayed on the radar, chart plotter and fish finder displays and
has the functions shown below.
• Find the position, range and bearing to an object on the chart plotter and radar dis-
plays
• Find the depth to an object on the fish finder display.
• Select a position for a waypoint on the chart plotter display.
• Select an item. For example, a waypoint on the chart plotter display.
To move the cursor, press any of the four arrows on the CursorPad to the cursor the
direction indicated on the arrow pressed. You can also move the cursor from one corner to the opposite corner when you press any two locations together on the CursorPad. The cursor position and range and bearing from your vessel to the cursor position
are alternately shown in the cursor data box at the upper right corner of the screen.
(The chart plotter and radar displays only).
1. SYSTEM INTRODUCTION
: Inactive
: In motion
Alternately
Cursor position and range and bearing to cursor
On the radar and chart plotter displays the cursor also provides a pop-up menu. For
additional information, see section 1.13 "Pop-up Menus".
1-11
Page 27
1. SYSTEM INTRODUCTION
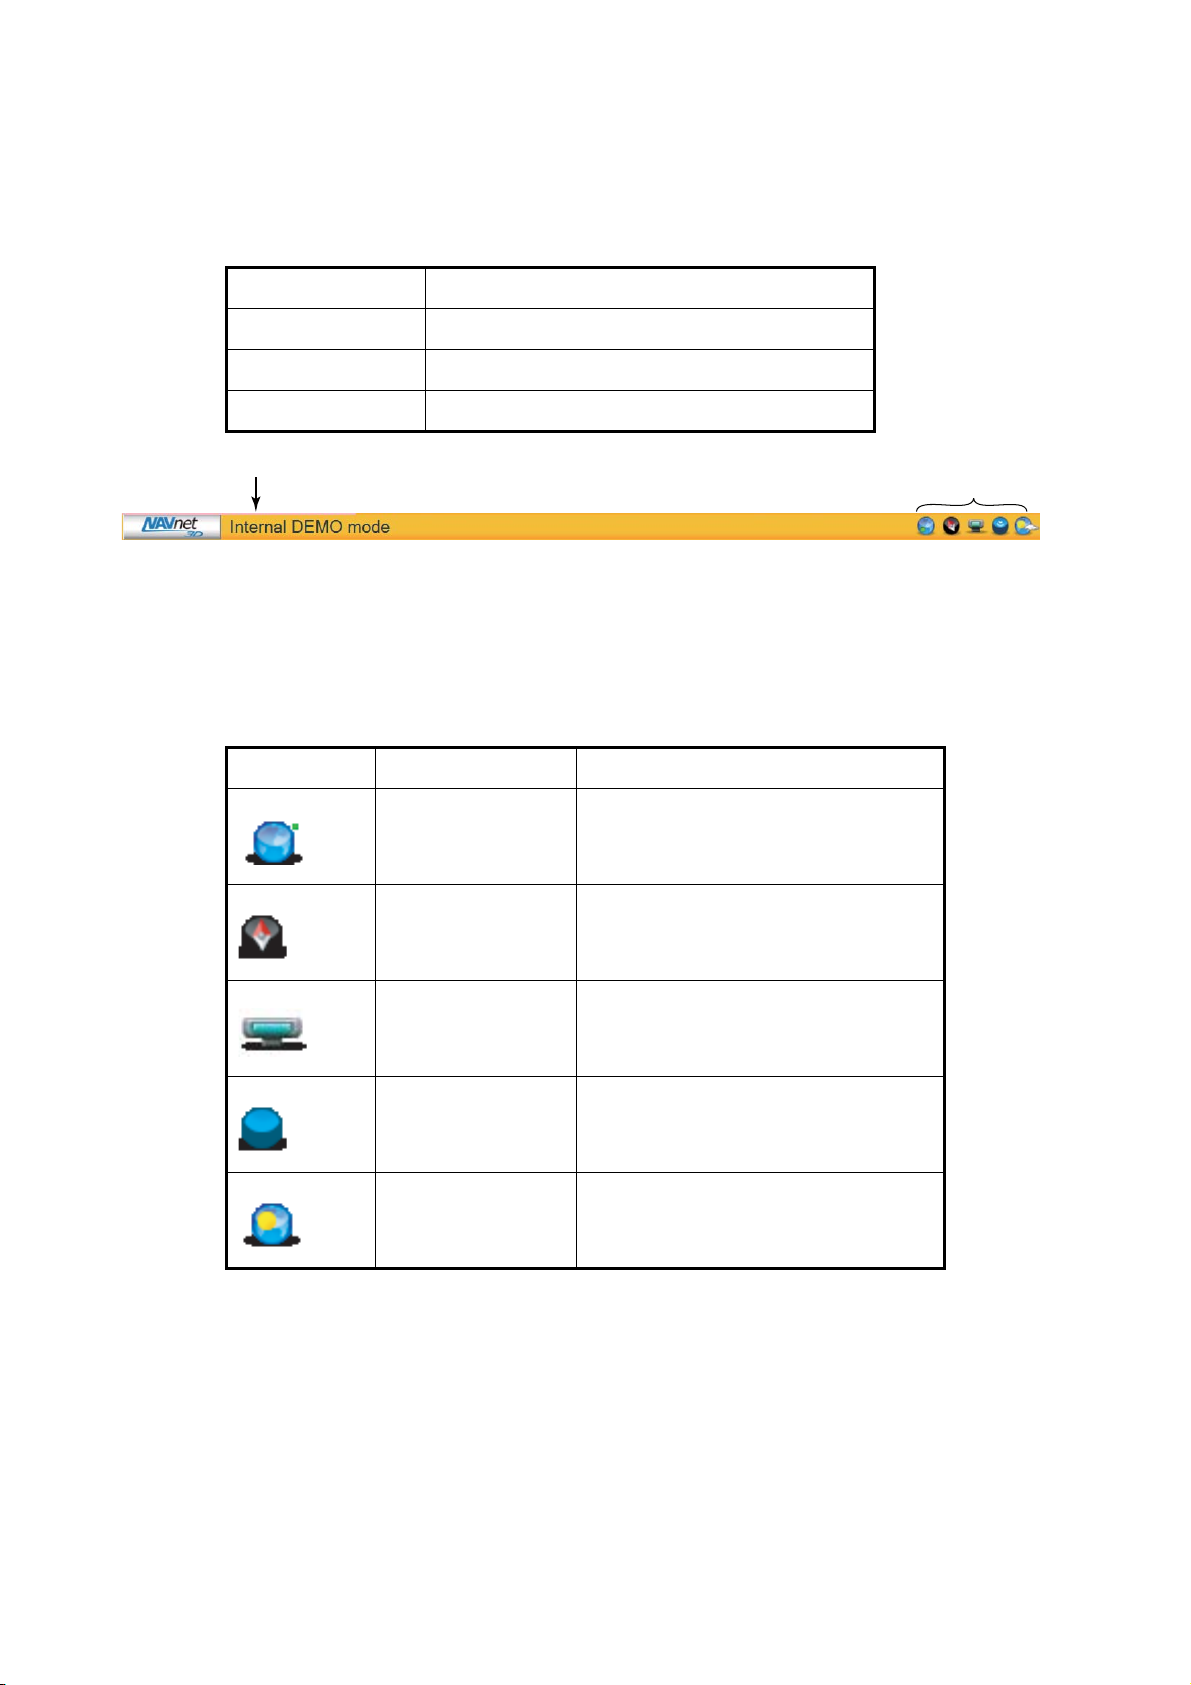
1.11 Status Bar
The status bar is the horizontal bar at the top of any display. This bar shows operation
information with messages, and sensor state with the icons. The color of the bar
changes according to the types of messages as shown below.
Bar color Type of message
Red Alarm messages
Green Operation instructions
Yellow Message of low value, or no message
Text message area
The sensor icons at the far right position on the status bar show the state of the sensors connected. An icon is in “motion” if the related sensor is active. An icon is not
moving and has an X if a sensor is not active or the sensor is not operating correctly.
(The radar and fish finder icons are not in motion when the radar or fish finder is in
stand-by.) The GPS, radar and fish finder icons have a “shortcut” function, Click those
icons to get the shortcuts shown in the table.
Icon Sensor Right-or left-click
GPS Show the GPS status display. (See
the section 14.5.)
Compass
Radar Change between stand-by and TX.
Sensor icons
1-12
Fish Finder Change between stand-by and TX.
Weather
Page 28
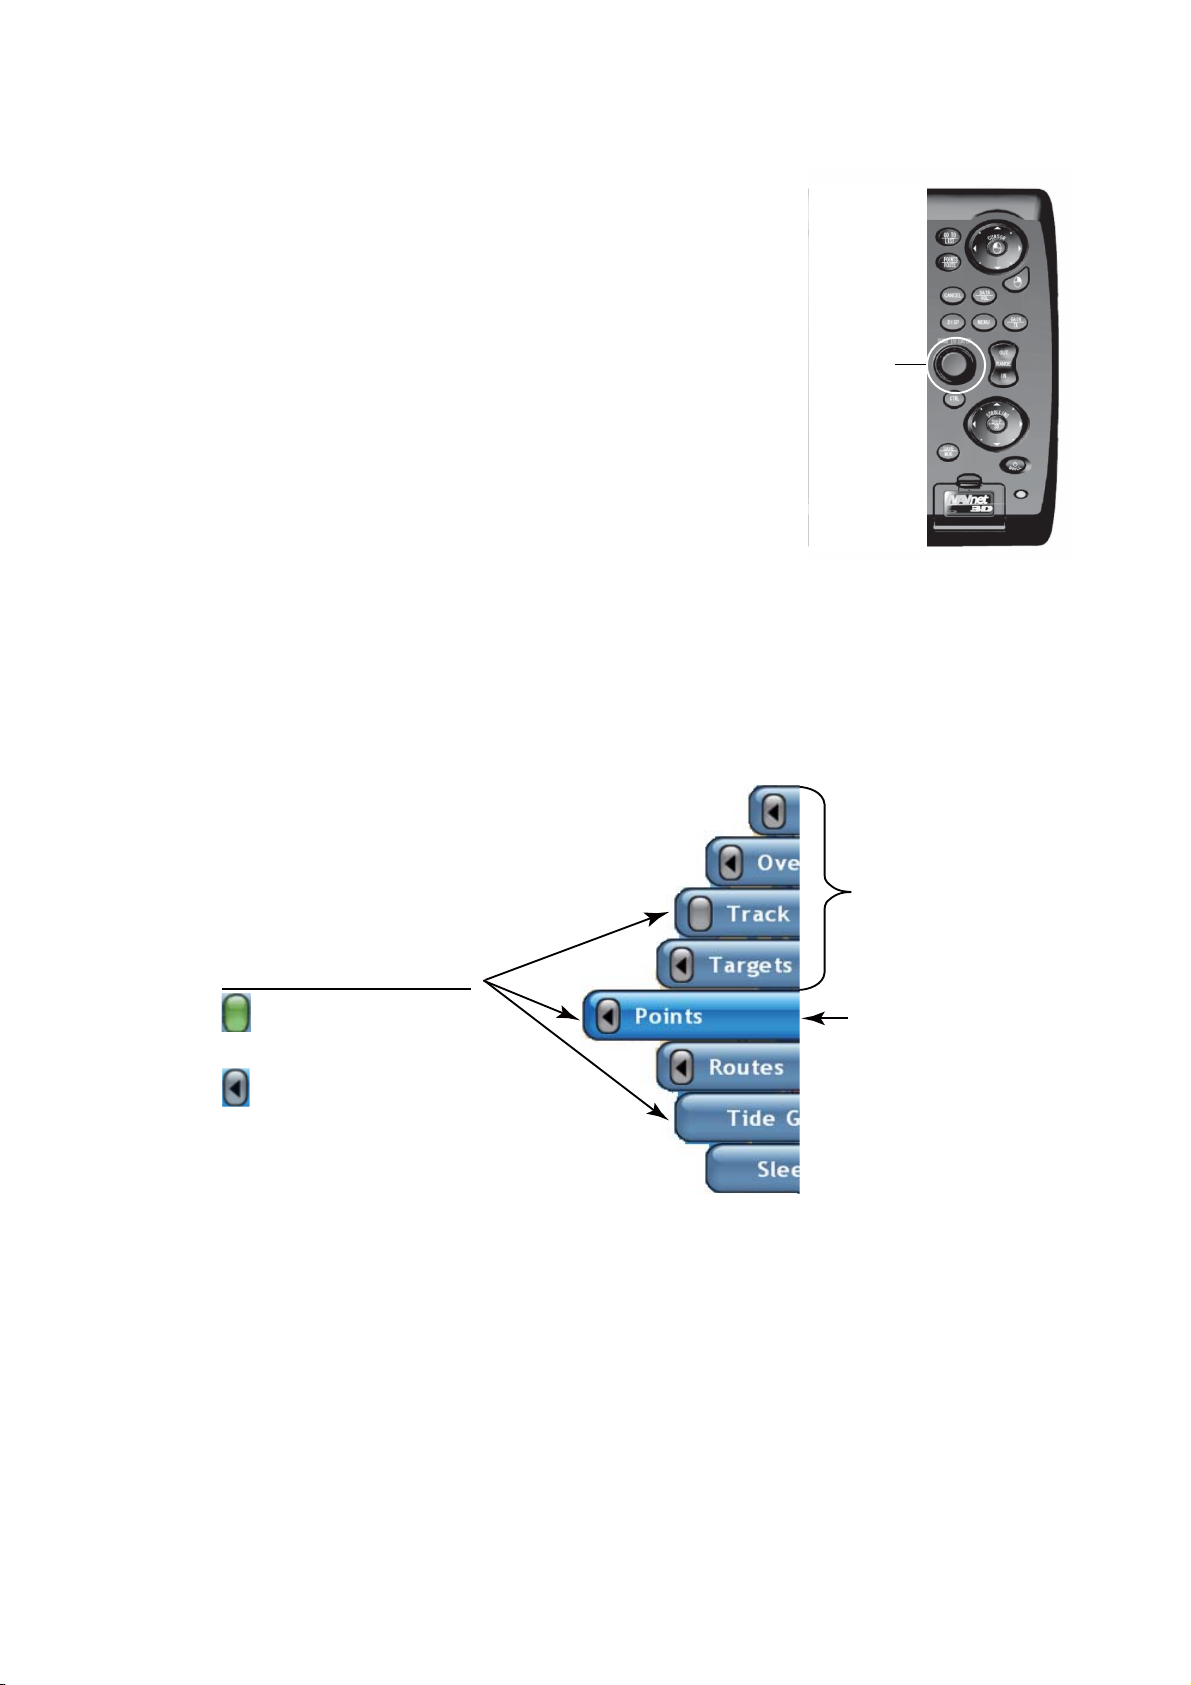
1.12 RotoKey and Soft Controls
The main function of the RotoKey is to display the [soft
controls], a revolving menu of soft controls which change
with operating mode. A short-push or rotation of the key
accesses a set of the functions that you select at the [My
NavNet] menu. The selections are [Basic], [Standard],
[Full] and [Custom]. A long-push displays all of the soft
controls for the current mode.
The soft controls automatically disappear from the
screen if not operated within approximately six seconds.
To erase the soft controls manually, press the CANCEL
key.
The icon at the end of a soft control indicates soft control
category:
• A left arrow within an icon indicates a multi-function
soft control. Push the RotoKey to access the functions.
1. SYSTEM INTRODUCTION
RotoKey
Pictured: MFD12
• An icon without an arrow indicates the ON/OFF status of the item shown on the soft
control. The icon is green when the item is ON and gray when the item is OFF.
• There is no icon on a soft control if the control hides or shows a special display, for
example, the tide graph.
Other soft controls
(Gray-blue)
Soft control category identifier
: Function ON/OFF
Green: ON
Gray: OFF
: Additional functions
No icon: Specialty display
ON/OFF
Selected soft control
(Blue and longest)
Example of soft controls for the chart plotter
To operate the soft controls:
Push or rotate the RotoKey to show the soft controls. Rotate the RotoKey to select a
soft control. When you search through the soft control "menu", the now-selected soft
control is blue and all other soft controls are gray. Push the RotoKey to do the function
shown on the selected soft control.
1-13
Page 29
1. SYSTEM INTRODUCTION
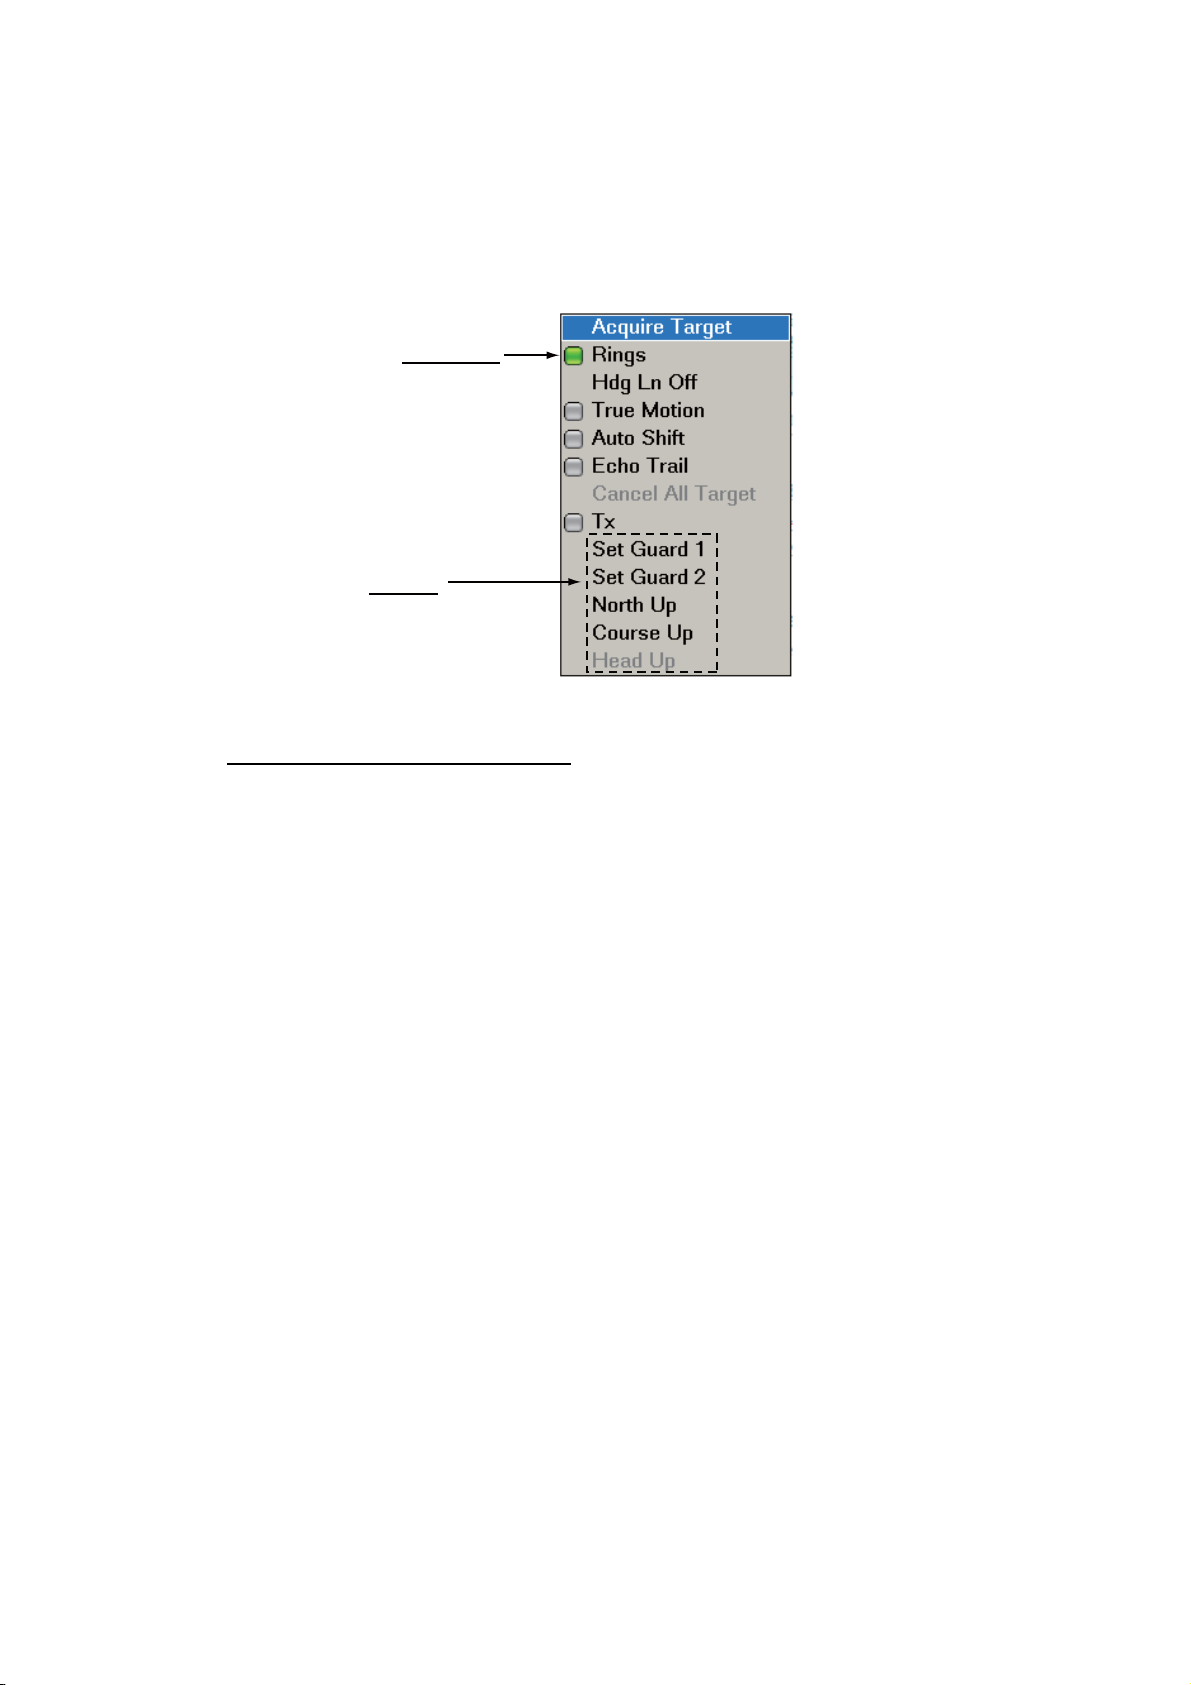
1.13 Pop-up Menus
The pop-up menus let you quickly access the commands according to the selected object or active display. To display a pop-up menu, select an object and hit the right-
click button. A pop-up can also be shown if you push the same button in any position
on the active display. The illustration below shows the Radar pop-up menu.
Status icon
Green: ON
Gray: OFF
No icon
Push RotoKey
to process item.
Radar pop-up menu
How to operate a pop-up menu:
Rotate the RotoKey to select an item. For a status icon, push the RotoKey to show
the status icon in green to activate the function, or gray to deactivate the function. For
items that do not have a status icon, push the RotoKey to go to the next level.
1-14
Page 30
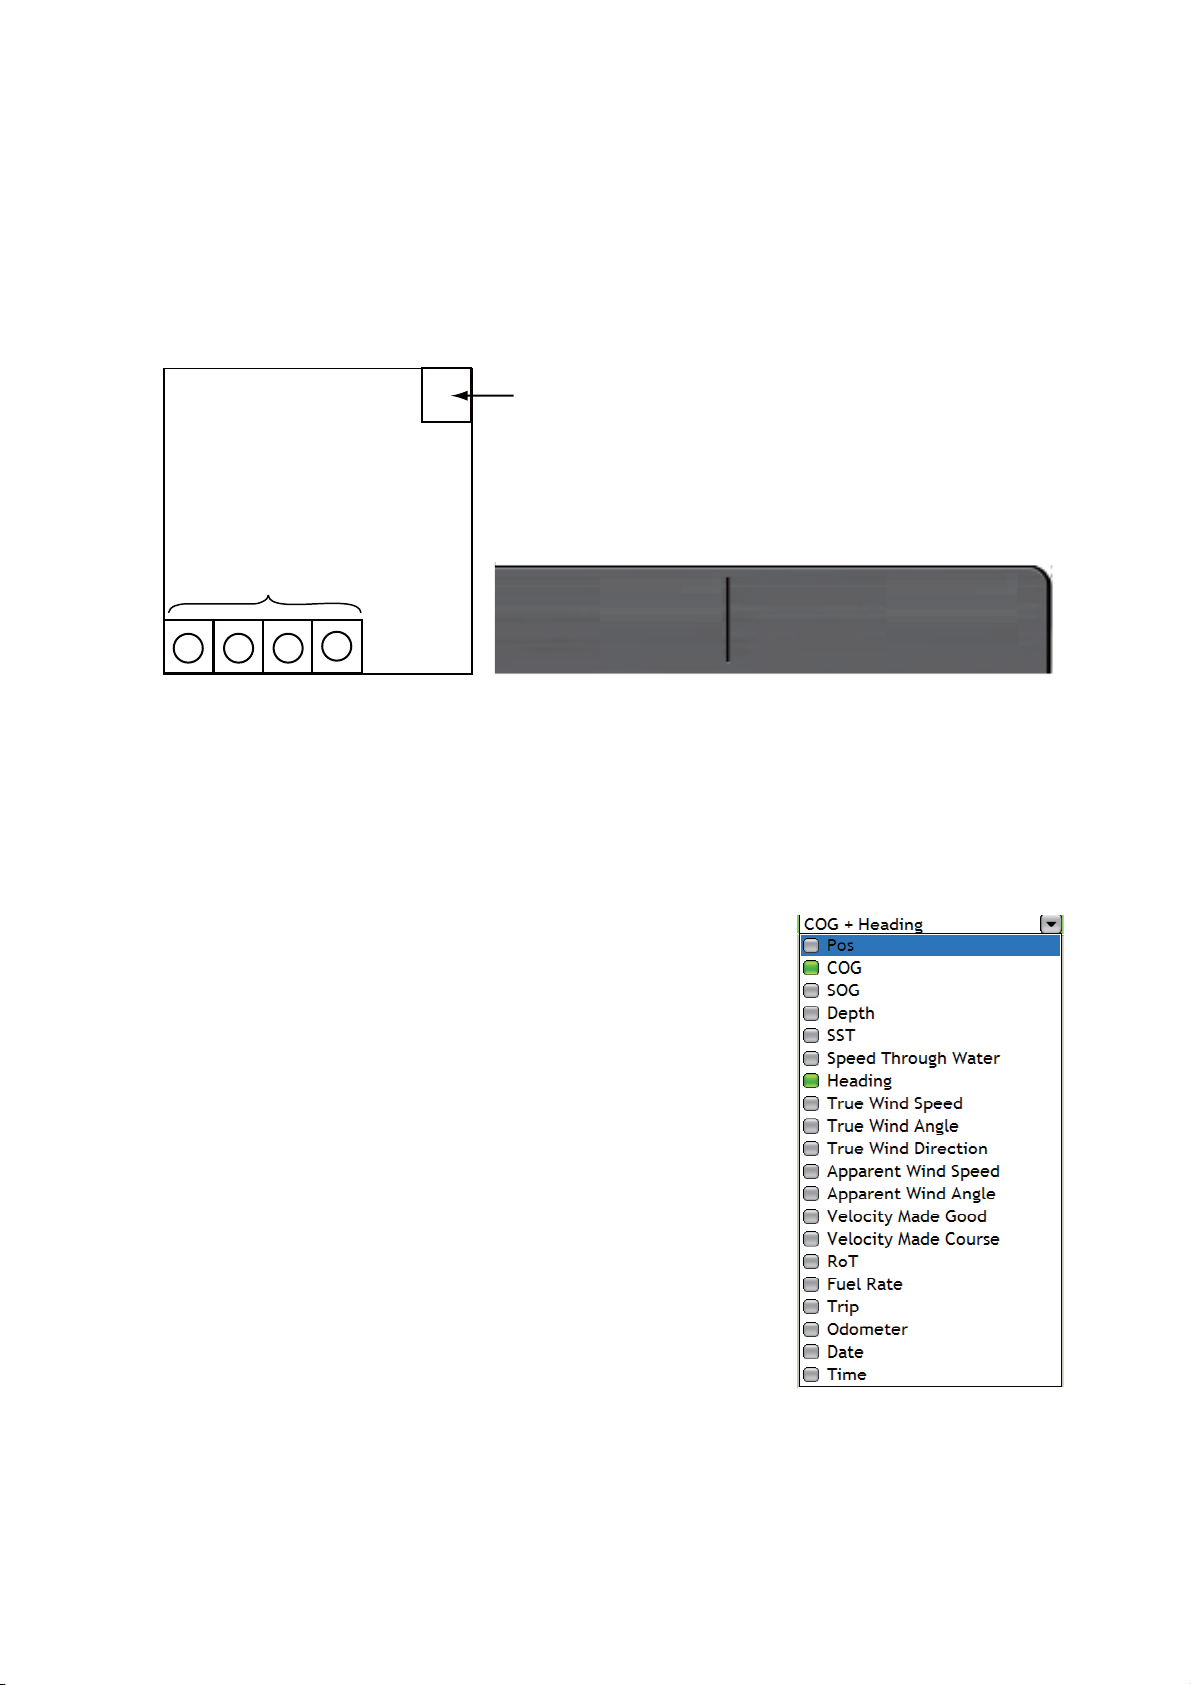
1.14 Data Boxes
The data boxes show the navigation data. You can select the data to display in the
boxes, and show or hide the boxes as necessary. A box can show one or more data.
Multiple data are scrolled according to the scrolling time set on the [DataBox] menu.
The data that you can show depends on your system configuration. You can show a
maximum of five boxes, four at the bottom-left corner and the cursor data box at the
top-right corner. The no. 4 data box only appears if a destination is set.
1. SYSTEM INTRODUCTION
Cursor data box
Data boxes 1-4
1 2 3
Data box location Sample data boxes (lower left corner)
To alternately hide and show the boxes, use the DATA/VOL key.
You can select the data to display in the boxes on the screen, or from the [Data Box
]menu. For additional information, see the section 13.2 "Data Boxes".
To change the contents of a data box:
1. Put the cursor in a data box (the box is blue if cor-
2. Rotate the RotoKey to select the data item to
3. Push the RotoKey to hide or show the item and
6.2
COG
°
T
SOG
kt
23.2
4
rectly selected). Hit the right-click button to
show the Data Box pop-up menu.
show or hide.
close the pop-up menu.
98.7
DPT
m
1-15
Page 31

1. SYSTEM INTRODUCTION
1.15 Menu Introduction
The menu system has a maximum of 15 main menus and related sub menus. The
number of menus depends on equipment connected. To show the menu, press the
MENU key.
How to use the menu
1. Press the MENU key to open the menu.
The last-used menu appears. The Alarm log automatically appears if an alarm
condition is broken.
The icons in the rectangle on the left show all the available menus.
Sub menus
Menu bar
Menu selector
Background of
current selection
is blue.
Status icon
ON: Green
OFF: Gray
Push button
to exit menu.
Slider
bar
Combo
box
Data input
box
Push button to
restore all default
settings for current
menu.
Applicable display
shown so you can
see the result of
certain selections.
1-16
Page 32

1. SYSTEM INTRODUCTION
r
Menu description
Menu icon Function Menu icon Function
Ship & Track
Points
Routes
Chart
Select the shape for the
boat icon, and control the
track of your vessel.
Set the ARPA and AIS targets, and manage the DSC
message information feature.
Targets
Set points. Set the weather display.
Weather
Set routes. Set the alarms.
Alarms
Set the chart plotter
display.
Set the items common to all
modes, for example, key
beep and the size of the
font.
Global
Radar
Fish Finde
Camera
DataBox
Set the radar display. File operations which you
use a SD card.
Files
Set the fish finder display. System-wide settings like
menu language.
System
Set the camera display. Set items like the RotoKey
and the boat icon.
My NavNet
Set the data boxes.
2. Rotate the RotoKey to select a menu with the menu selector at the left of the
screen. Rotate the RotoKey to the right to move the menu bar toward the bottom.
Rotate the RotoKey to the left to move the menu bar toward the top. The back-
1-17
Page 33

1. SYSTEM INTRODUCTION
ground color of the selector is blue, which indicates the menu is selected, but not
active.
3. Do one of the following according to menu type:
• Single sub menu, push the RotoKey to start the menu operation.
• More than one sub menu, push the RotoKey. Rotate the RotoKey to select
a sub menu then push the key to validate selection. Rotate the key right for selection in the left-to-right direction. Rotate the key left for selection in the opposite direction. The active tab is larger than other tabs.
After you push the RotoKey to validate the menu selection, the following occurs:
• The tab selected, the bar below the tabs and the background for the menu selector change from blue to green. This occurrence indicates that you can operate the menu selected.
• The top menu item is blue.
Tab is magnified and green
when selected for operation.
Selected menu
item is highlighted in blue.
Menu selector
(Background is
green for active
menu.)
4. Rotate the RotoKey to select a menu item then push the key to validate selection.
Do one of the following according to the type of menu item selected.
Menu item type Procedure
1-18
Combo box Rotate the RotoKey to select an option
then push the key to save the setting
and close the box. When you turn the
key to the right the cursor moves toward
the bottom.
Page 34

1. SYSTEM INTRODUCTION
Menu item type Procedure
Status icon Items which you can activate or deacti-
Status icon
Alphanumeric data input box Rotate the RotoKey to select alphanu-
Depth Alarm Value
Slider bar Rotate the RotoKey to set level then
vate have a status icon. Push the Ro-
toKey to show the icon in green to
activate the item, or gray to deactivate.
meric character (A-Z, 0-9) then push
the key to validate selection. Rotate the
key right for forward alphanumeric order. Rotate the key left for reverse alphanumeric order. To set the cursor in
a specific location, use W or X on the
CursorPad.
push the key to validate the setting.
• To select a different sub menu or a different menu, rotate the RotoKey to
the left to return control to the menu selector. (You can also return the control
to the menu selector when you press the CANCEL key continuously.)
• To close the menu, press the MENU key, or use the RotoKey to click the [Exit
Menu] button at the bottom of the menu.
1.16 Language
The default interface language is American English. You can select a language to use
as follows:
1. Press the MENU key to open the menu.
2. Select the [System-General] menu.
3. Use the RotoKey to select [Language].
4. Use the RotoKey to select your language.
5. Push the RotoKey. You are asked to make sure you are ready restart. Use the
RotoKey to select Yes.
1-19
Page 35

1. SYSTEM INTRODUCTION
1.17 Boat Icon
The boat icon marks current position, and the default shape is "simplified icon." If your
vessel is different, you can change the shape of the boat icon to match your vessel.
1. Press the MENU key to open the menu.
2. Open the [My NavNet-General] menu.
3. Use the RotoKey to select [Boat Icon].
Simplified icon (default boat icon)
Simplified Icon
Simplified Icon
Commercial Fishing
Sail Boat
Sport Fishing
4. Use the RotoKey to select the boat icon which best matches your vessel.
5. Press the MENU key to close the menu.
1-20
Page 36

1.18 Man Overboard (MOB)
Use the MOB function if a person or object falls overboard. You need either position
data from a navigation device, or heading and speed data to calculate position by
dead reckoning. You activate the MOB from the chart plotter display and MOB position
is marked on both the chart plotter and radar displays.
To mark the MOB position, long-push the SAVE/MOB key on the chart plotter display.
Then, the following occurs:
• The MOB mark is put on the chart plotter and radar, at the position when the
SAVE/MOB key is pressed.
1. SYSTEM INTRODUCTION
MOB
MOB mark on
radar display
MOB mark on
chart plotter display
• The chart scale is automatically set to 0.250 nm.
• The distance and the time to go to the MOB position appear in the far right-hand
side data box. (Chart plotter and radar displays only).
MOB
mark
Distance to MOB
TTG to MOB
• A red dashed line runs between the MOB position and your vessel on the chart plotter and radar displays. This line is the course to take to go to the MOB position.
1-21
Page 37

1. SYSTEM INTRODUCTION
MOB information
There are two types of MOB information, simple and detailed. Simple information includes point name (MOB), and range and bearing to the MOB position. Detailed information includes simple information plus the information shown below.
• Comment (default comment is “time of MOB”)
• Depth at MOB position (requires depth sensor)
• Water temperature at MOB position (requires temperature sensor)
• Group name (if any)
• Avoidance circle radius
To get simple information, put the cursor on the MOB mark on the chart plotter display.
For detailed information, put the cursor on the MOB mark and hit the left-click button.
244 yd
°
229.1
Detailed MOB informationSimple MOB information
M
How to erase a MOB mark
You can erase a MOB mark on the chart plotter display, or at the [Points] list in the
[Points] menu.
Not active MOB mark: Put the cursor on the MOB mark and press the right-click button to show the Points pop-up menu. Use the RotoKey to select [Delete].
Active MOB mark: Before you can erase an active MOB mark, you must cancel navigation. Put the cursor on the MOB mark and press the right-click button to show the
Points pop-up menu. Rotate the RotoKey to select [Cancel Route] then push the Ro-
toKey. Select again the MOB mark, show the Points pop-up menu, and use the RotoKey to select [Delete].
1-22
Points popup menu
(No route active)
Points popup menu
(Route active)
Page 38

1.19 Facsimile Receiver FAX-30
The FURUNO Facsimile Receiver FAX-30 installs in the NavNet network and can be
controlled from a NavNet display. Below are the steps to start fax operation.
1. At installation of this equipment, connect the FAX-30 to the NavNet and check that
the equipment identifies the FAX-30, through the Installation Wizard.
2. Select the "full screen" FAX display. For the procedure, refer to the section 13.3
"How to Set the Display Selection Window". The fax display is available only in the
full-screen display.
3. To operate the FAX-30, use the DISP key to select the fax display icon to show
the fax display. A sample display is shown below. Refer to the Operator’s Manual
of the FAX-30 for operation information.
Use the CursorPad or a PC mouse to operate the fax screens.
The FAX-30 display can be accessed only by one NavNet display. When another NavNet display accesses the FAX-30, control of the FAX-30 is given to that display after
the picture is stopped completely. This sequence takes approximately one minute.
1. SYSTEM INTRODUCTION
1-23
Page 39

1. SYSTEM INTRODUCTION
1.20 AIS Transponder FA-30, FA-50
The FURUNO AIS Transponder FA-30 (FA-50) installs in the NavNet network and can
be controlled from a NavNet display. To access the main menu of the transponder, do
the following:
1. Open the main menu and select the [System] menu.
2. Open the [Other Sensors] sub menu.
3. Use the RotoKey to click the FA-30 (FA-50) button to show the main menu of the
transponder.
1-24
4. Use the CursorPad to operate the menu, referring to the operator’s manual of the
AIS transponder.
Page 40

1.21 DSC Message Information
The DSC (Digital Selective Calling) message information feature provides, on the
chart plotter and radar displays, the MMSI no. and position* of the ships that have
transmitted a DSC message to you. A hexagon-shaped marker marks a ship’s position. The marker is color-coded according to the type of DSC message sent, red for
distress and dark-blue for non-distress.
* Position at the time of message transmission. Position information is not updated.
DSC marker
Red: Distress message
Dark-blue: Non-distress message
1. SYSTEM INTRODUCTION
333336789
This feature requires connection of a DSC capable radiotelephone that outputs the
DSC sentence in NMEA 0183 format.
MMSI no.
1.21.1 How to Show, Hide DSC Message Information
On the chart plotter or radar display, long-push the RotoKey. Rotate the RotoKey to
select [Target] then [DSC]. Push the RotoKey to show or hide the DSC message
information.
When you receive a DSC message, the appropriate DSC marker and the MMSI no. of
the transmitting ship appear on the chart plotter and radar displays.
1.21.2 How to Find DSC Information
Put the cursor on a DSC marker to find the position and MMSI no. of the ship that
transmitted a DSC message. For MMSI no., position, and type of DSC message, push
the left-click button.
Simple DSC information
Detailed DSC information
1-25
Page 41

1. SYSTEM INTRODUCTION
1.21.3 Operations Available with the DSC Marker
With the DSC marker pop-up you can
• Delete the selected DSC marker (and its data from the DSC list).
• Set the position of the DSC marker as your destination. (See section 4.11.)
• Save the position of the DSC marker as a point. (See section 4.2.)
1. Put the cursor on a DSC marker then push the right-click button to show the DSC
marker pop-up.
2. Rotate the RotoKey to select desired item then push the RotoKey.
3. For [Goto] and [Save as Point], refer to the appropriate section indicated above.
1.21.4 The DSC List
The DSC list, found in the [Targets] menu, lets you list the MMSI no. of 10 ships from
which you have received a DSC message. To help you identify a ship quickly on the
chart plotter and radar displays, you can replace the MMSI no. indication with the
name of your choice; for example, ship’s name.
To show the DSC list, open the [Targets] menu and select the [DSC] tab.
1-26
Page 42

1. SYSTEM INTRODUCTION
How to add an MMSI no. to the DSC list
1. Show the DSC list then push the RotoKey twice to select [<New>].
2. Push the RotoKey to show the DSC list pop-up.
3. The cursor is selecting [Edit]; push the RotoKey to show the MMSI and Nick
Name input window.
4. The cursor is selecting [MMSI]; push the RotoKey.
5. Use the RotoKey to enter MMSI no. (See the instructions on page 1-19 for how
to enter data.)
6. Use the RotoKey to select [Nick Name] then push the RotoKey.
7. Use the RotoKey to enter a nickname. Up to 20 alphanumeric characters can be
used.
8. Use the RotoKey to select the OK button then push the RotoKey.
9. Press the MENU key to close the menu.
How to edit an MMSI no. on the DSC list
Show the DSC list then push the RotoKey twice. Rotate the RotoKey to select the
MMSI no. Continue from step 2 in "How to add an MMSI no. to the DSC list".
How to delete an MMSI no.
The DSC list stores 10 MMSI nos. When the list becomes full, no new MMSI no. can
be entered. To enter a new MMSI no., delete unnecessary MMSI nos. as follows:
1. Show the DSC list.
2. Use the RotoKey to select the MMSI no. to delete then push the RotoKey.
3. Use the RotoKey to select [Delete] then push the RotoKey.
4. Press the MENU key to close the menu.
The MMSI no. is deleted from the DSC list and the DSC marker and MMSI no. (or nickname) are deleted from the chart plotter and radar displays.
How to delete all MMSI nos.
Use the RotoKey to “click” the Clear all button on the DSC list. These MMSI nos. and
DSC markers are deleted:
• MMSI nos. on the DSC list
• MMSI nos. (or nicknames) and DSC markers on the chart plotter and radar displays
1-27
Page 43

1. SYSTEM INTRODUCTION
This page is intentionally left blank.
1-28
Page 44

2. CHART PLOTTER
This chapter shows you how to do the following:
• Use and prepare the chart plotter
• Set chart plotter related alarms
• Control the track
2.1 Charts
2.1.1 Chart Description
A world map in raster chart format is included in your unit. A vector chart for the US
coastline (Alaska and Hawaii included) is provided also. To use this chart plotter as a
navigational aid, have electronic charts (stored in the hard disk) for the area you navigate. Contact your dealer about charts for your area. To control the charts stored in
your system, see the section 13.7 "How to Control Charts".
Raster charts are digitized scans of NOAA paper charts. Raster charts have information like notes, source diagrams, tidal diamonds, horizontal and vertical datum, etc.
Vector charts are digital files that contain marine features and information created for
marine navigation. These charts are made according to the International Hydrographic Organization (IHO).
Fishing charts are vector charts that show only detailed depth contours. These are
available for US waters.
See the next two pages for sample charts.
2.1.2 How to Select a Chart Type
Push the RotoKey, rotate the key to select [Chart] followed by [Raster], [Vector] or
[Fishing] then push the key.
2-1
Page 45

2. CHART PLOTTER
Raster chart
2-2
Vector chart
Page 46

NU
2. CHART PLOTTER
Kendale Lakes
Doral
Cutler Ridge
Cooper City
Coral Gables
Dania Beach
Aventura
Carol City
Miami Beach
Fishing chart
2-3
Page 47

2. CHART PLOTTER
2.2 Chart Scale
You can change the chart scale to change the amount of information shown, or zoom
in or out at the location you select. The selected chart scale appears at the top lefthand position on the screen. In the full screen display, the value shown is 1/2 the distance from the top of the screen to the bottom of the screen.
There are two methods to change the chart scale, the RANGE key, and the cursor with
the RotoKey.
Chart scale
Scale suitability indicator
White background: Proper scale
Red background: Unusitable scale
North indicator
Method 1: RANGE key
Use the RANGE key to select a chart scale. When you operate a RANGE key, the
chart scale changes to the next available setting. Push RANGE IN to decrease chart
distance, then push RANGE OUT to increase the chart distance. The current chart
scale is shown in the chart scale indication at the top-left corner. The scale suitability
indicator helps you select an acceptable chart scale. The background of the indicator
is white if the scale is acceptable, and red if the scale acceptable.
Method 2: CursorPad and RotoKey
This method lets you select ranges between 0.0625 and 120 nm. Use the CursorPad
to put the cursor on the chart scale indication. Press the right-click button to show the
Range pop-up menu, shown below. Rotate the RotoKey to select a range then push
the key to validate your selection.
2-4
96 nm
120 nm
Page 48

2.3 Orientation Mode
The chart can be shown in head-up, course-up or north-up orientation. To select an
orientation mode, use the RotoKey to select the [Head Up], [North Up] or [Course Up]
soft control. Another method is to put the cursor on the orientation mode icon at the
top-left position then push the left-click button.
Orientation mode icon
Description of orientation modes
Head-up: Displays the chart with the current compass heading of your vessel at the
top of the screen. The heading data from a compass is required. When the heading
changes, the boat icon remains fixed, and the chart picture rotates according to heading.
2. CHART PLOTTER
North-up: North is at the top of the screen. When your heading changes, the boat icon
moves according to heading. This mode is for long-range navigation.
Course-up: The chart picture is stabilized, and shown with your current course (over
ground) at the top of the screen. The boat icon moves with the heading. If you select
a new course, the picture resets to display the new course at the top of the screen.
2.4 How to Move the Chart
Move the chart in the following conditions.
• Your vessel is not in the current area
• Take a look at another area
• Enter a waypoint at another location
Do the following to move the chart:
• Change the chart scale with zoom in or zoom out at cursor position.
• Use the ScrollingPad to pan the chart.
• Return your vessel to the center of the screen. Use the SHIP/3D button to return
manually, or use the [Auto Shift] soft control to return automatically.
• Activate the 3D display. Long-push the SHIP/3D button to get a simple aerial view
3D display. Use the RotoKey to get an aerial view or underwater view 3D display.
2-5
Page 49

2. CHART PLOTTER
2.5 The Boat Icon
The boat icon appears at current position. The default shape is “simplified icon”. Other
shapes are available, from the menu, like yacht and sailboat. The boat icon has the
functions indicated below also.
• The Heading line is a straight line that runs from your position and this line shows
the current heading.
• The COG/SOG predictor is a vector line that runs from the boat icon. This predictor
shows estimated course and speed of your vessel. The top of the predictor is the
estimated position of your vessel at the end of the selected predictor time (set on
the menu). You can increase the length of the predictor to find the estimated position of your vessel in the future on the current course and speed.
• The Direction of turn indicator points in the direction in which your vessel is now
turning.
• The Track plots the movement of your vessel.
Heading line
Direction of turn indicator
COG/SOG predictor
Track
Want to know your SOG/COG?
Cursor on icon:
Cursor on icon, left-click button:
To close the window, press the
CANCEL key.
Orientation of boat icon
The orientation of the boat icon can be selected to COG or heading. When the heading
data becomes lost, the orientation is automatically set to COG.
To select the orientation, do as follows:
1. Press the MENU key to open the menu.
2. Use the RotoKey to select the [Ship & Track] menu, followed by the [General]
menu.
2-6
3. Use the RotoKey to select [Boat Icon Orientation].
4. Select [Heading] or [COG] then push the RotoKey.
5. Press the MENU key to close the menu.
Page 50

2. CHART PLOTTER
Boat icon pop-up menu
The Boat Icon pop-up menu controls the COG/SOG predictor, heading line and track.
To display this pop-up, put the cursor on the boat icon then push the right-click but-
ton.
Boat icon pop-up menu
Turn on or off
as appropriate.
To set COG/SOG predictor time, select
Set COG/SOG Predictor Time and hit
left-click button to show the
Ship & Track menu.
COG/SOG Predictor Time
Select COG/SOG Predictor Time
and push RotoKey.
Rotate RotoKey to select a time.
Push RotoKey to confirm setting.
The greater the time the longer
the COG/SOG predictor.
2-7
Page 51

2. CHART PLOTTER
2.6 How to Find the Range and Bearing to a Location
The "ruler" feature measures the range and bearing between any two points on your
chart. Range and bearing between the two points are digitally indicated on the screen.
1. Use the CursorPad to put the cursor on the start point.
2. Long-push the RotoKey.
3. Use the RotoKey to select [Ruler].
4. Use the CursorPad to move the cursor to the 2nd point. A dashed line runs be-
tween the start point and the 2nd point. The range and bearing to the cursor position are shown next to the cursor.
5. Push the RotoKey to erase the ruler and the indication.
95.90 nm
+
76.5°M
Starting point
2.7 Chart Object Information
Vector charts show many objects, like buoys and lighthouses, for which you can find
information. Port, tide and current information are available if the chart contains this
information.
Put the cursor on any chart object to find object type. For additional information, push
the left-click button.
Range and bearing
to point
2-8
Simple chart object information Detailed chart object information
Page 52

2.8 Multiple Chart Plotter Displays
A maximum of two chart plotter displays can be shown on one screen. The multiple
chart plotter display lets you see the conditions around your vessel on both short and
long ranges. Also, you can see how your vessel moves toward your destination from
more than one angle. For example, you can show one display in 2D and another in 3D.
The following features can be adjusted individually.
• AIS
• ARPA
• Chart scale
• Chart orientation
• Chart type
• Countdown timer
• Create routes
• Overlays (sat photo, depth shading, tide icon, tidal current, weather)
• Scroll the chart
2. CHART PLOTTER
• 2D and 3D (The 3D displays are adjusted together, but different orientations are
possible.)
Chart plotter display 1
Chart type: Vector
Chart scale: 315 yd
Orientation: Head-up
Perspective: 3D
Overlay: Depth shading
Chart plotter display 2
Chart type: Raster
Chart scale: 0.705 nm
Orientation: North-up
Perspective: 2D
Overlay: Satellite photo
2-9
Page 53

2. CHART PLOTTER
2.9 Cartographic Text and Objects on Vector Charts
This section shows you how to show or hide the cartographic objects and text information that appear on vector charts.
2.9.1 Control Visibility of Text and Object Information
The [Chart-Vector] menu controls the visibility of text and object information, for example, buoy names and light description.
2-10
Chart-vector menu items
Chart Symbols: Select the chart symbol type. [S-52] are the official IMO symbols (al-
so referred to as simplified symbols) library for ECDIS. [International] symbols are the
copy of paper chart symbols of IALA symbols library (US symbols library).
Chart Color Palette: Set the chart color pattern. [Standard] is the NAVNet 3D original
color palette, [S-52] complies with the official S-52 charts, and [Sunlight] provides a
high contrast palette.
Chart Database: Select the chart database to use among [HOs S-57], [Jeppesen],
and [Navionics].
Buoy Names: Show or hide the buoy names.
Light Description: Show or hide the light descriptions.
Display Light Sectors: Show or hide lights sectors for fixed beacons.
Info: Show or hide text information.
Page 54

2. CHART PLOTTER
Name: Show or hide geographic names.
Shallow Contour: Show shallow depth contours in dark blue.
Safety Contour: Show safety depth contours in medium blue.
Deep Contour: Show deep depth contours in light blue. Depths greater than 1800 feet
are shown in white.
Traffic Routes: Show or hide traffic routes.
Display Routes Bearings: Show or hide route bearings.
Soundings: Show or hide depth soundings.
Display Soundings in Red: Spot soundings whose depths are lower than the value
set here are shown in red.
Display Obstructions Depth Below Safety: Show or hide obstruction depths under
the safety depths.
Seabed: Show or hide seabed composition indication, for example, mud, sand, rock.
2.9.2 Control Visibility of Cartographic Objects
The [Chart-Custom Config] menu controls the visibility of cartographic objects, for example, lights, fog signals, etc.
2-11
Page 55

2. CHART PLOTTER
Chart-config menu description
S-52 Vector Chart Display Mode: Set the level of information to show on the chart.
The selections are [Basic], [Standard], [Other], [Fishing], [Custom], and [Default]. The
chart features are turned on or off according to setting.
Unknown Object: Unknown objects that appear on the chart.
Chart Data Coverage: Geographic names and geographic objects.
Bottom Features: Improved seabed presentation.
Traffic Routes: Marine traffic routes.
Cautionary Areas: Cautionary areas that appear on the chart.
Information Areas: Information areas that appear the chart.
Buoys & Beacons: Buoys and beacons.
Lights: The sector of light that a fixed beacon shines.
Fog Signals: A structure that sends a fog signal.
Radar: Radar buoy
Quality of Data: Quality of data indicator.
Obstructions: Obstructions (wrecks, etc.)
Depth Contours & Currents: Lines that indicate depth contours and currents.
Fishing Facilities: Show location of fishing facilities.
Shipping Facilities: Show location of shipping facilities.
Harbour Facilities: Show location of harbour facilities.
Small Craft Services: Services for small craft.
Land Features: Cartographic features that are shown on land.
2-12
Page 56

2.10 Alarms
This section describes the alarms available with the chart plotter:
• XTE alarm
• Anchor watch alarm
• Proximity alarm
• Depth alarm
• Sea surface temperature alarm
• Sea surface temperature shear
• Speed alarm
• Trip log alarm
• Countdown timer
• Alarm clock
2.10.1 XTE Alarm
2. CHART PLOTTER
The XTE alarm tells you when your vessel is not on course by more than the set value.
When the XTE alarm is active, two dashed lines mark the XTE alarm boundaries, red
for starboard, green for port.
Own ship
position
Intended
course
2.10.2 Anchor Watch Alarm
The anchor watch alarm tells you that your vessel has moved a distance greater than
the set value when the vessel must not be moving.
Alarm
Alarm
setting
Alarm
setting
Destination
waypoint
Your ship's position where
you start the anchor watch
alarm.
: Alarm
area
2-13
Page 57

2. CHART PLOTTER
2.10.3 Proximity Alarm
The proximity alarm tells you when your vessel is near a point for which an avoidance
circle, set on the [Points] list, is active. When your vessel is within the set value, audio
and visual alarms are released.
2.10.4 Depth Alarm
The depth alarm tells you when the depth to the bottom is over or under the value you
set. Requires depth data.
2.10.5 SST Alarm
The SST (Sea Surface Temperature) alarms tells you when the sea surface temperature is over, under, within range, or out of range of the temperature you set. “[Shear]”
tells you when the temperature goes higher or lower than the set value within one
minute.
Set the [Over] and [Under] alarm value with "[SST Alarm Value]", and shear with
"[Shear]". For [Within Range] and [Out of Range], set the alarm value with [SST Alarm
Range].
Requires temperature sensor.
2.10.6 Speed
The speed alarm tells you when the speed of your vessel is within range, out of range,
over or under the set value. Set the value at [Speed Alarm Value]. Requires a GPS
navigator or speed sensor.
2.10.7 Trip Log Alarm
The trip log alarm tells you when your vessel has moved some distance. Requires a
GPS navigator.
2.10.8 Countdown Timer
The countdown timer measures the remaining time from a set time, and is available
on the chart plotter display. Set the alarm time on the [Alarm] menu. Start and stop the
timer from the chart plotter display. Long-push the RotoKey to select [Countdown]
then push the RotoKey to start or stop the timer. The timer appears at the center of
the plotter chart display. When the set time is reached, some beeps sound and the
countdown indication is erased from the screen.
2.10.9 Alarm Clock
The alarm clock operates like an standard alarm clock, releasing audio and visual
alarms when the set time comes.
2-14
4m51s
Page 58

2.10.10 How to Set an Alarm
1. Press the MENU key to open the menu.
2. Open the [Alarms-General] menu.
2. CHART PLOTTER
3. Use the RotoKey to select an alarm item then do one of the following:
a) For the alarms which have a status icon, push the RotoKey to activate or
deactivate the alarm. Show the icon in green to activate the alarm, or gray to
deactivate the alarm.
b) For the depth, speed and SST alarms, select the combo box of the item then
push the RotoKey to show the alarm options. Use the RotoKey to select an
option.
SST Alarm
4. Use the RotoKey to select the [Alarm Value] box for the alarm.
2-15
Page 59

2. CHART PLOTTER
5. Use the RotoKey to set a value. Rotate the key to select a value then push the
key to validate the setting.
6. Press the MENU key to close the menu.
2.10.11 Internal/External Alarm
The audio alarm is output from this equipment in the default setting. The alarm can be
output from this equipment, from external equipment or from both this equipment and
external equipment.
1. Press the MENU key to open the menu.
2. Open the [Alarms-General] menu.
3. Use the RotoKey to select and set [Alarm] to select how to output alarms.
[Internal]: Output the audio alarm from this equipment.
[External]: Output the audio alarm from external equipment.
[Internal/External]: Output the audio alarm from both this equipment and external
equipment.
[Off]: No alarm output.
4. Use the RotoKey to select [External Alarm Input]. Select the item to output when
you operate the SAVE/MOB key.
[OFF]: No output
[Save]*: The point saved with the SAVE/MOB key is output.
[MOB]*: The MOB point saved with the SAVE/MOB key is output.
* Do not select when [Alarm] is set for [External] or [Internal/External].
5. Press the MENU key to close the menu.
2.10.12 Alarm Audio Options
When an alarm setting is broken, the equipment releases audio and visual alarms in
the default condition. You can activate or deactivate the audio alarm or release the
alarm according to the speed of your vessel.
1. Press the MENU key to open the menu.
2. Open the [Alarms-General] menu.
3. Use the RotoKey to activate or deactivate the functions shown below.
[Speaker Alarm Output]: Activate or deactivate alarm output (from external
speaker).
[Speed-Based Output]: Activate or deactivate alarm output according to the
speed of your vessel.
[Speed-Based Output Value]: Set the speed at which alarms are output.
4. Press the MENU key to close the menu.
2-16
Page 60

2.10.13 Alarm Log
The [Alarm-Log] menu shows the names, date and time that current and past alarms
were broken.
Active alarm
2. CHART PLOTTER
Past alarms
2-17
Page 61

2. CHART PLOTTER
2.11 Track
The track (or movement) of your vessel is plotted on the screen with position data.
Your track lets you see how your vessel has moved.
The track is saved to the hard disk if the track is active. A line runs between each track
point. The hard disk stores a maximum 10,000 points. When the memory for track
points becomes full, the oldest track points are deleted to get space for new track
points.
Your track remains on the screen when the power is removed. You can delete the
track that you do not need from the menu.
The saved track can be shown on the screen, and you can make a route with the
saved track.
2.11.1 How to Show or Hide the Track Display
1. Push the RotoKey to show the soft controls.
2. Use the RotoKey to select [Track] then push the key to hide or show the track as
necessary.
2.11.2 Track Recording Method, Interval
In drawing the track, the position of your ship is stored into the memory of this unit at
an interval of time or distance. A shorter interval provides better reconstruction of the
track, but the storage time of the track is reduced. When the track memory becomes
full, the oldest track is erased to make room for the latest.
1. Press the MENU key to open the menu.
2. Open the [Ship & Track] menu.
3. Use the RotoKey to select [Track Interval].
Track Interval
Distance
Distance
Time
True
4. Use the RotoKey to select Distance or Time.
5. Use the RotoKey to select [Distance Interval] or [Time Interval], depending on
your selection at step 4.
2-18
6. Use the RotoKey to enter a distance or time.
7. Press the MENU key to close the menu.
Page 62

2.11.3 Track Thickness
You can set the thickness of the track to thin, medium or thick. If you are following the
same track many times, you can show the track in the thinnest width to keep the
screen clear.
1. Press the MENU key to open the menu.
2. Open the [Ship & Track] menu.
2. CHART PLOTTER
3. Use the RotoKey to select [Track Thickness].
4. Use the RotoKey to select a thickness.
5. Press the MENU key to close the menu.
2-19
Page 63

2. CHART PLOTTER
2.11.4 Track Color
Track can be displayed in a single color or multiple colors. For multiple colors, you can
display the track according to the conditions shown below.
• Depth range
• Depth difference
• Sea surface temperature range
• Sea surface temperature difference
• Speed
• Date
To select the track color:
1. Press the MENU key to open the menu.
2. Open the [Ship & Track] menu.
3. Use the RotoKey both to select [Define Track] and open the options menu.
4. Use the RotoKey to select an option.
5. To change the settings, use the RotoKey to select the "color" box below [Define
Track]. One of the menus shown on the next page appears.
2-20
Page 64

2. CHART PLOTTER
6. Use the RotoKey to set values. Refer to the description below and on the next
page.
999 ft
Depth range Sea surface temperature range Speed
Depth variation
Fixed color Date
Sea surface temperature variation
Fixed color: Single-color track in white, blue, purple, cyan, green, yellow and red.
Depth range: Change the color of the track with depth. Set the a depth limit for
each color. For example, the default setting for white is 33 ft. For this setting, the
track is white for depths to a maximum of 33 ft.
Depth variation: Paint the track in a different color when the depth changes by
the figure set here. For example, the setting of 20 ft changes the color of the track
as shown in the illustration when the depth changes by 20 ft.
Own Ship
Depth steadily
increasing.
Purple
Dark blue
Yellow
Green
100 ft
Dark blue
Red
160
140
120
200
180
2-21
Page 65

2. CHART PLOTTER
Sea surface temperature range: Change the color of the track with change in
sea surface temperature. Set a limit for each color. For example, if the default setting for white is 41.0°F, the track is white for temperatures up to 41.0°F.
Sea surface temperature variation: Paint the track in a different color when the
sea surface temperature changes by the figure set here. If the setting is +00.20°F,
for example, the color of the track changes when the temperature of the sea surface changes by +00.20°F.
Date: The track color changes at the turn of a new day.
7. Press the MENU key to close the menu.
Depth steadily
increasing.
Purple
Dark blue
Yellow
Green
18.0
Dark blue
Red
18.6
18.4
18.2
°
F
Own Ship
19.0
18.8
Note: For [Depth range], [Sea surface temperature range] and [Speed], track is shown
in red for values higher than their largest setting.
2.11.5 How to Clear the Active Track
If the screen becomes full of track you can not know which is the newer track. Clear
the track you do not need.
1. Press the MENU key to open the menu.
2. Open the [Ship & Track] menu.
3. Use the RotoKey to select [Clear Active Track] then push the key. You are asked
if you are sure to reset the track.
4. Rotate the RotoKey to select [Yes] then push the key to erase the track.
5. Press the MENU key to close the menu.
2.11.6 How to Save Active Track
Your equipment saves a maximum of 10,000 track points. When the capacity for track
points is reached, the oldest track is erased to clear space for the newest track. For
that reason you can save your track, to the Track list. You can replay saved tracks to
use the tracks to create a route.
2-22
1. Press the MENU key to open the menu.
2. Open the [Ship & Track] menu.
3. Use the RotoKey to select [Save Active Track]. You are asked to enter a name
for the track.
You can select a name you have used, but the data saved under that name is
erased.
Page 66

4. Use the RotoKey to enter name. Rotate the key to select a character then push
the key to validate your selection. You can use a maximum of eight characters for
the name. (To save the track under the name shown in the [Rename] box, push
the RotoKey continuously until the box closes. Use the RotoKey to push the OK
button.)
5. Press the MENU key to close the menu.
2.11.7 How to Replay a Saved Track
You can replay saved track on the display to use the track to create a route. The saved
track appears with the current track. If the screen is full of active track, clear the active
track before you replay the saved track to prevent clutter.
1. Press the MENU key to open the menu.
2. Open the [Ship & Track] menu.
3. Use the RotoKey to select [Open Saved Track]. The saved track list appears, an
example of which is shown below.
FISH1
LOBSTER
CRAB
HOME
2. CHART PLOTTER
4. Use the RotoKey to select the track to replay.
5. Press the MENU key to close the menu and replay the track.
2.11.8 How to Remove a Replayed Track
After you have used a replayed track, you can remove the track from the screen as
follows:
1. Press the MENU key to open the menu.
2. Open the [Ship & Track] menu.
3. Use the RotoKey to select [Close Saved Track].
4. Press the MENU key to close the menu.
2-23
Page 67

2. CHART PLOTTER
2.11.9 How to Find Information About a Track
Simple track information provides the depth and temperature for the location selected
on a track. (Depth and temperature sensors are required.) Put the cursor on any part
of a track to get this information.
Detailed track information includes simple track information plus the information
shown below. Press the left-click button to show detailed track information.
• Name of the track
• The time the track was started
• The time the selected point on the track was made
• Position at the selected location
• Depth and temperature at the position selected
Simple track information
2.11.10 Track Pop-up Menu
The Track pop-up menu provides access to the track functions shown below. To show
the Track pop-up menu, put the cursor on a track and press the right-click button.
Go to most recent track point.
Open Ship & Track menu.
Trackback
The trackback feature creates a route with your current track, and saves the track as
a route, under the youngest empty route number. This feature helps you return along
a previous track to get lobster pots, crab pots, and the like.
To use the trackback feature, put the cursor on a track and press the right-click button to open the Track pop-up menu. Trackback is selected then push the RotoKey.
The trackback starts as shown below.
• A red dashed line runs between your vessel and the destination.
Detailed track information
Save track.
Clear track.
2-24
• A blue solid line connects between route points (automatically created) and your
vessel.
Page 68

• Arrows on the track point in the direction to follow the route.
Activate
Trackback
Track
First
destination
Course to follow
(red dashed line)
2. CHART PLOTTER
Route
point
Trackback route following options
When you are following a route, you can do the following from the Route pop-up menu.
• Cancel the route.
• Restart following the route.
• Reverse the following direction.
• Put a point on the route.
• Change the position of the last point on the route.
• Find route information.
Push the right-click button to show the Route pop-up menu. For additional information, see the chapter 5.
Arrows point in
direction to
follow route
Restart
Reverse
Insert Point
Extend Route
Route Info
2-25
Page 69

2. CHART PLOTTER
This page is intentionally left blank.
2-26
Page 70

3. 3D DISPLAY, OVERLAYS
3.1 3D Display
The 3D display has native 3D chart design that allows full time 3D presentation. This
true 3D environment gives you all of the information you require with no restrictions on
the information you can see. You can plan your routes, enter points, etc. like on the
2D chart.
The 3D display provides a 3D view of land and sea around your vessel. Land is shown
in different shades of light-brown according to height above the sea level. Water is
shown in different shades of blue according to depth. The 3D display has most of the
same information as the 2D display. WIth both presentations available you can see
the conditions around your vessel from different angles. The 3D display helps you navigate when you are in waters that you do not know. Also, most functions of the 2D display, for example, destination setting, are available in the 3D display.
For best results make sure you have accurate position and heading data.
3.1.1 Aerial View
The aerial view is the view you get when you activate the 3D display. Your position is
above and behind your vessel, and your view is in the forward direction. The illustration shown below provides an example of how you can change the orientation of the
aerial view display. This illustration shows the view from port side of the vessel.
Point
Chart symbols
Boat icon (your ship)
3D display, aerial view
3-1
Page 71

3. 3D DISPLAY, OVERLAYS
How to activate and deactivate the aerial view by the SHIP/3D button
Before you do this procedure, open the [Chart-General] menu and activate [3D Pan/
Tilt Mode]. This sequence allows you to adjust the pitch and orientation.
1. Long-push the SHIP/3D button to start the 3D display.
2. Rotate the RotoKey to adjust the pitch, i.e., the vertical angle of view. The range
of adjustment is 1-90°.
3. Push the RotoKey to validate the setting.
4. Rotate the RotoKey to rotate the picture, from 0-360°.
5. Push the RotoKey to validate the setting.
Another method is to use the CursorPad to adjust the display. Use S and T to adjust
the pitch and W and X to set the orientation. After you set the pitch and orientation,
press the left-click button or push the RotoKey.
To readjust the display, first long-push the RotoKey and select the [3D] and [3D Pan/
Tilt] soft controls. Readjust the display as shown in the above procedure.
To return to the 2D display, long-push the SHIP/3D button.
How to activate and deactivate the aerial view with the soft controls
1. Long-push the RotoKey.
2. Select the [3D] and [3D Pan/Tilt] soft controls. (You can also activate the display
if you select the [Aerial View] soft control. Push the RotoKey to select the [3D
Pan/Tilt] soft control.)
3. Adjust the display with the RotoKey, following steps 2-5 in the above procedure.
To readjust the display, long-push the RotoKey then select the [3D] and [3D Pan/Tilt]
soft controls.
To restore the 2D display, push the RotoKey and select the [3D] and [2D View] soft
controls.
3-2
Page 72

3.1.2 Underwater Display
The underwater display provides a look into the water from above the water. This display is available between 7 yards and 1.003 nm.
To activate the underwater display, use the RotoKey to select the [3D] and [Underwater] soft controls. You can rotate the picture with W and X on the ScrollingPad.
Your
ship
Depth to
bottom
3. 3D DISPLAY, OVERLAYS
Land
Underwater
Depth
contour
3.1.3 Highway Display
The highway display provides a 3-D view of own boat’s progress toward destination.
The range is automatically set to twice the value of the current XTE alarm setting. For
example, if the XTE alarm setting is 100 m, the display range for the highway display
is 200 m. To show the highway display, use the RotoKey to select [3D] and [Highway].
Boat icon
Underwater display
XTE alarm marker
Red: port
Green: starboard
3-3
Page 73

3. 3D DISPLAY, OVERLAYS
3.1.4 How to Make the 3D View Clearer
In the 3D display, some topographical features are easier to see if you use the “3D
Exaggeration” feature. This feature expands both objects on the chart and the underwater vertically so that you can easily see the shape of the objects and position. To
adjust the exaggeration feature, open the [Chart-General] menu and set the level with
[3D Exaggeration]. See the available options in the figure shown below. High gives the
highest level of exaggeration. The example below compares the same picture in low
and high exaggerations.
Medium
Very Low
Low
Medium
High
Very High
Land
Low exaggeration High exaggeration
3-4
Page 74

3.2 Overlays
Four chart overlays are available on the chart plotter display. These overlays are
depth shading, weather, satellite photo, and animation.
3.2.1 Depth Shading Overlay
The depth shading overlay shows the depths in red (shallow), yellow (medium) and
green (deep). This overlay is available in both 2D and 3D presentations. Use this overlay to find depths. Transparency levels can be adjusted so that the chart data is visible
under the color shading. To show the depth shading overlay, first use the RotoKey to
select [Overlay] and [Depth Shade]. Push the RotoKey to show or hide the depth
shading overlay.
3. 3D DISPLAY, OVERLAYS
Depth shading
Depth shading settings
The depth shading settings are on the [Chart-General ]menu. Set this menu by following the description shown below.
Show/hide below-the-surface depth shading in the aerial view.
Adjust the transparency of depth color. The higher
the figure the greater the transparency
Turn automatic depth color scale selection on/off.
Select how to display the depth colors.
Classic Hue: Colors of the rainbow
Blue Hue: Shades of blue
Set the depth range for which to show depth shading.
Chart menu, general sub menu
depth shading related items
3-5
Page 75

3. 3D DISPLAY, OVERLAYS
3.2.2 Weather Overlays
The weather overlays put weather information on the 2D and 3D displays. These displays are available only in North America and with connection of a Sirius weather receiver. Four types are available: Wx Radar, Wx Data, and Adv Wx Data, and Marine
Zone. Use the RotoKey to select [Weather] and a weather soft control then push the
RotoKey to hide or show the selected weather display. For detailed information about
weather overlays, see chapter 11.
Weather radar overlay
NOWRAD and Canadian weather radar information are put on your chart. This overlay
lets you see possible storm fronts to help you identify the clouds from possible sea
clutter.
Wx radar
display
3-6
Page 76

3. 3D DISPLAY, OVERLAYS
Weather data overlay
The weather data overlay provides forecast data that includes weather radar, sea surface temperature, storm tracks, pop-up weather alerts, etc.
3-7
Page 77

3. 3D DISPLAY, OVERLAYS
Advanced weather overlay
The advanced weather overlay provides the weather data not included in the standard
weather data overlay, like buoys,
3-8
Page 78

3. 3D DISPLAY, OVERLAYS
Marine zone overlay
The coastal waters are divided into zones for forecasts. These zones can be displayed
on the screen with lines, like in the illustration shown below
Marine
zone
3-9
Page 79

3. 3D DISPLAY, OVERLAYS
3.2.3 Satellite Photo Overlay
You can put the satellite photo for your area on the 2D and 3D displays. Use the RotoKey to select [Overlay] and [Sat Photo] then push the RotoKey to show or hide the
satellite photo.
High-resolution satellite images for the USA coastline are not provided standard, but
are available at no cost (except shipping and handling). Users can install multiple satellite photos on the hard drive of the NavNet 3D. The illustration below shows the vector chart with the satellite photo overlay.
How to set photo transparency on water
You can set the level of transparency for the satellite photo on the water. Open the
[Chart-General] menu. Use the RotoKey to select [Photo Transparency on Water]
then push the RotoKey. Rotate the RotoKey to set the transparency level with the
slider bar then push the key to validate the setting. You can see the results of the setting on the screen.
3.2.4 Animation Overlay
This overlay displays predicted wind, waves, or barometer information for a three-day
period in three-hour intervals. The source for this overlay can be US NOWRAD or
CAN NOWRAD. Select the source with [Weather Radar] on the [Weather-Sirius]
menu. Long-push the RotoKey, select [Animate] then push the RotoKey to activate
or deactivate the animation overlay.
3-10
Page 80

3.2.5 Radar Overlay
The radar overlay display puts the radar picture on the top of the navigation chart. To
display the radar overlay, use the RotoKey to select [Overlay] followed by [Radar].
Push the RotoKey to show or hide the radar overlay.
3. 3D DISPLAY, OVERLAYS
How to set the level of the radar echo transparency
Open the [Radar] menu and use the RotoKey to select [Echo Transparency for Overlay]. Rotate the RotoKey to set the level of transparency then push the RotoKey. You
can see the result of the setting on the right half of the screen.
Echo Transparency for Overlay
How to match the overlay and radar ranges
Open the [Radar] menu, and use the RotoKey to set [Overlay Range Link] for On or
Off.
How to adjust radar gain, sea, rain
The gain and sea and rain clutters can be adjusted from the radar overlay. See
section 6.2, section 6.3 or section 6.4 for the appropriate procedure.
How to control stand-by, TX
Push the RotoKey. Select [Tx] and push the RotoKey to get stand-by and TX alter-
nately.
How to acquire a target for ARPA
A target can be acquired for ARPA. See paragraph 6.27.2 "How to Manually Acquire
a Target" for the procedure.
3-11
Page 81

3. 3D DISPLAY, OVERLAYS
3.2.6 Tidal Information Overlay
The NavNet 3D has worldwide tidal and tidal current information. You can overlay this
information on the chart plotter display.
The tidal information symbol ( ) appears at the locations of tidal recording stations.
When you select a symbol, you get a graph of predicted maximum and minimum tide
heights, and times for sunrise and sunset.
How to display the tidal information overlay
1. Push the RotoKey to show the soft controls.
2. Use the RotoKey to select [Overlay] followed by [Tide Icons].
3. Push the RotoKey to hide or show the tidal information overlay.
Tidal symbol
(yellow and/or
gray, magnfied
when selected)
The arrow on the symbol is up when the tide is high, or is down when the tide is low.
The symbol is gray and yellow according to tide state. The symbol is all yellow when
the tide is high completely and all grey when the tide is low completely.
: Up arrow indicates the tide is going high.
: Down arrow indicates the tide is going low.
: No arrow indicates no change in tide.
3-12
Page 82

3. 3D DISPLAY, OVERLAYS
How to show simple tidal information
You can display simple information (name, local time and tide height) about a tide by
when you put the cursor on a tide icon.
7
How to display the tide graph
The NavNet 3D has worldwide tide and current information. You can show the tide
graph by three methods.
• Use the CursorPad to a tidal symbol then push the left-click button to show the tide
graph.
• Use the CursorPad to select a tidal symbol, push the right-click button then select
[Tide Graph] from the pop-up menu.
• Select the [Tide Graph] soft control to show the tide graph and get tidal information
for the 10 closest tidal stations to current position.
• To return to the chart plotter display, use the RotoKey to select the Exit button on
the tide graph, or press the CANCEL key twice.
3-13
Page 83

3. 3D DISPLAY, OVERLAYS
How to understand the tide graph display
• The information is mostly accurate under moderate weather conditions. However,
storms and weather fronts can influence forecasted tide times and heights.
• The dotted vertical line on the graph functions to select a time for which the tide
height is displayed. To change the time, rotate the RotoKey.
• To find the tide for 10 nearest stations, use the [10 Nearest Stations] combo box.
• To change the date, select [Select a date] and enter a date.
• To erase the tide graph and return to the chart plotter display, press the CANCEL
key twice.
3.2.7 Tidal Current Overlay
The tidal current overlay is made from the tidal current data received from NOAA satellites, available in North America.
1. Push the RotoKey to show the soft controls.
2. Use the RotoKey to select [Overlay] followed by [Currents].
3. Push the RotoKey to show or hide the tidal current display.
Arrows of more than one color and size appear on the screen and are pointing in
different directions.
The arrow indicates the movement of the tidal current. The size and color of the arrow
indicate tidal current speed, Yellow, slow; orange, medium, and red, fast.
Simple and detailed NOAA-created tidal current information is available. For simple
information put the cursor on a tidal current marker. Press the left-click button to get
detailed information.
3-14
Simple tidal current information
Detailed tidal current information
Page 84

4. POINTS
4.1 About Points
In navigation terminology, a point is any location you mark on the chart plotter display.
A point can be a fishing spot, reference point and other important locations. You can
use a point you have entered to set a destination.
This unit has 2,000 points into which you can enter position information. There are
three methods that you can use to mark a point:
• At your current position
• At cursor position
• From a Points list
When you enter a point, the point is put on the screen with the default point symbol
and the youngest empty point number. The position of the point, symbol and navigation information (range, bearing, etc.) are saved to the Points list. You can show or
hide the points, and the default setting shows all points.
Default point symbol
(black circle in red square)
Point number
(black)
You can edit a point on the screen or the Points list. At the Points list you can change
the symbol and its color, change position, etc.
PT 0001
4-1
Page 85

4. POINTS
4.2 How to Mark a Point
You can mark a point
• At current position
• At cursor position
• From the Points list
4.2.1 How to Mark a Point at Current Position
Press the SAVE/MOB key to mark a point at current position. The following occurs.
• The default point symbol is put at current position.
• The point is saved to the Points list under the youngest empty point number
4.2.2 How to Mark a Point at Cursor Position
POINTS/ROUTES key
Use the CursorPad to put the cursor on a location. Press the POINTS/ROUTE key.
The default point symbol is put at the cursor position. The point is saved to the Points
list and marked with the youngest empty point number.
Pop-up menu
You can also put a point at the cursor position with the Cursor Position pop-up menu,
shown below. Use the RotoKey to select [New Point] then push the key to put a point
at the cursor position.
Go To
Go To by Position
New Point
New Route
Center on Boat
Acquire Target
4-2
Page 86

4.2.3 How to Mark a Point from the Points List
A point marked from the Points list is put at the current position. To put the point at a
different location, edit the point data (position, symbol, etc.) before marking a point.
1. Long-push the GO TO/LIST key to show the [Points] menu.
2. Use the RotoKey to select any tab at the top of the menu. (You can select any tab
when you mark a point.)
Sub menus (sort points according to name on tab)
Alpha: Points sorted in alphanumeric order
Local: Points sorted in distance from own ship, from near to far
Group: Points sorted in group alphabetical order
Icon: Points sorted by icon shape number order
Color: Points sorted by color in order of red, yellow, green, cyan,
purple, blue, white
Total no. of points
4. POINTS
Point name, range and bearing
to point and point group name
appear here.
Your chart appears here
4-3
Page 87

4. POINTS
3. The cursor is selecting [Total]. Push the RotoKey twice then the right side of the
display shows the point information like in the illustration shown below.
Total no. of points
Point
settings
Point name, range and bearing
to point and point group name
appear here.
4. If necessary, change the point settings. See section 4.7 "How to Edit a Point from
the Points List".
5. Use the RotoKey to click the OK button.
6. Press the MENU key to close the menu.
4.3 How to Find Information About an On-screen Point
Put the cursor on a point. Simple point information (name, and range and bearing from
your vessel) appears. To find detailed information, hit the left-click button. Detailed
information includes simple information plus comment, depth and temperature at time
of entry, group name and avoidance circle area.
4-4
Simple point information Detailed point information
Page 88

4.4 Default Point Settings
When you save a point, the equipment saves the point according to the shape, color
and group name set on the [Points-General] menu. If those settings do not meet your
requirements, you can the settings as shown below.
1. Long-push the GO TO/LIST key to show the [Points] menu.
2. Select the [General] sub menu, shown below.
4. POINTS
3. Use the RotoKey to select [Point Symbol], [Point Color] or [Group Name].
Point color
Point symbol
Fishing
Navigation
Danger
Entertainment
Group name
4. Use the RotoKey to select an option.
5. Press the MENU key to close the menu.
4-5
Page 89

4. POINTS
4.5 How to Move a Point
You can move a point by two methods:
• Move the symbol to a new location.
• Enter new position manually on the [Points] list.
4.5.1 How to Move an On-screen Point
1. Set the cursor on the point to move. The point becomes larger if the point is se-
lected correctly.
2. Hit the right-click button to show the Point pop-up menu.
Move
Go To
Edit
Rename
Delete
3. [Move] is selected. Push the RotoKey.
4. Use the CursorPad to move the symbol to the new location. Push the RotoKey to
put the symbol at the new location.
4.5.2 How to Move a Point from the Points List
1. Long-push the GO TO/LIST key to open the [Points] menu then open the Alpha
list.
2. Use the RotoKey to select the point to edit.
3. Push the right-click button or the RotoKey to show the Point Edit pop-up menu.
New Point
Edit
Delete
Find on Map
4. Rotate the RotoKey to select [Edit] then push the RotoKey. The point information
replaces the chart.
5. The [Position] combo box is selected. Push the RotoKey.
4-6
Position
6. Enter position with the RotoKey. Push the RotoKey to select the location. Rotate
the RotoKey to select a digit then push the RotoKey to validate your selection.
7. Rotate the RotoKey to select the OK button at the bottom of the display then push
the RotoKey.
Page 90

4.6 How to Delete a Point
You can delete points by two methods, on the screen and from a Points list.
4.6.1 How to Delete a Point on the Screen
Method 1: CANCEL key
Put the cursor on the point to delete and press the CANCEL key.
Method 2: Pop-up menu
1. Put the cursor on the point to delete.
2. Push the right-click button to show the Points pop-up
menu.
3. Rotate the RotoKey to select [Delete].
4. Push the RotoKey to delete the point from both the screen
and the Points list.
Note: An icon something like the shown below appears when two or more points are
near one another and cannot be show separately on the current range. Zoom in to
separate the points then select the point to delete.
4. POINTS
Move
Go To
Edit
Rename
Delete
4.6.2 How to Delete a Point from the Points List
1. Long-push the GO TO/LIST key to show the [Points] menu then open a Points list.
2. Use the RotoKey to select the point to delete then push the RotoKey. The Points
List pop-up menu appears.
3. Rotate the RotoKey to select [Delete].
4. Push the RotoKey to delete the point from both the screen and the Points list.
4.6.3 How to Delete All Points
You can delete all points from the [Points] menu. A point currently used in navigation
cannot be deleted.
1. Press the MENU key to open the menu.
2. Open the [Points-General] menu.
3. Use the RotoKey to select [Delete All Points].
4. Rotate the RotoKey to select [Yes] then push the RotoKey.
4-7
Page 91

4. POINTS
4.7 How to Edit a Point from the Points List
You can edit the points you have entered from the [Points] menu. You can select the
point to edit on-screen, or from a Points list.
1. On the screen, use the CursorPad to select the point to edit, push the right-click
button and select [Edit] from the pop-up menu. (You can also select the point if
you long-push the GOTO/LIST key.) Settings for the point selected appear on the
right-half of the screen.
Point
attributes
DEC1207 125248 AM
2. The [Position] combo box is selected. If necessary, change position.
3. To change the name of the point, select the [Name] box. Change the name as follows:
1) Push the RotoKey to select the character to edit then push the RotoKey.
2) Rotate the RotoKey to select an alphanumeric character then push the Ro-
toKey.
3) Repeat steps 1 and 2 to complete the name. A name can include a maximum
of 13 alphanumeric characters.
4. Select [Point Symbol] to change the point symbol. 32 symbols are available.
4-8
Page 92

4. POINTS
5. Select [Point Color] to change the color of the square part of the point symbol.
Seven colors are available: red, yellow, green, cyan, purple, blue, and white.
6. Select [Group] to put the point in a point group. [Fishing], [Navigation], [Danger]
and [Entertainment] are the default groups.
Navigation
Danger
Entertainment
7. [Depth] and [Water Temperature] are the depth and water temperature at the point
location. (You need depth and water temperature data to show this data.) If necessary you can change this data.
8. [Avoidance Circle Area] sets the distance for the proximity alarm, which tells you
when your vessel is near a point by the distance set here. For additional information about the proximity alarm, see the section on the chart plotter alarms.
9. Use [Comment] to enter a comment about a point. You enter a comment like you
do a Name. A comment can include a maximum of 64 alphanumeric characters.
10. The GoTo button functions to set a point as the GoTo point. Select this button then
push the RotoKey to go to the point.
11. To finish, select the OK button then push the RotoKey.
4-9
Page 93

4. POINTS
4.8 How to Find a Point
4.8.1 How to Show a Point at the Center of the Screen
You can easily move a point to the center of the screen if you select it on the [Points]
menu.
1. In the chart plotter mode, long-push the GO TO/LIST key to open the [Points]
menu then open a Points list.
2. Select a point then push the RotoKey. The Points List pop-up menu appears.
3. Use the RotoKey to select [Find on Map].
4. The menu is closed and the point selected is put at the center of the screen on the
active chart plotter display.
4.8.2 How to Find the Location of a Point from the Points Menu
Select a point from a Points list. The point is put at the center of the chart to the right
of the menu.
4.9 Point Groups
You can put points in point groups according to their purpose. The default point groups
are danger, fishing, navigation, and entertainment. You can delete these groups, or
add new groups. A maximum of 10 groups is available, which includes the default
groups.
1. Press the MENU key to open the menu.
2. Open the [Points-General] menu.
3. Use the RotoKey to select the [Manage Groups] button.
4. Use the RotoKey to select a group name then push the RotoKey.
4-10
5. Select the item related to your purpose then push the RotoKey.
• Rename. Rename the selected group. Use the RotoKey to change the name.
Push the RotoKey to select a location, rotate it to select character then push
the key to validate your selection.
Page 94

• Add new. Add new group. The default group name is GROUP XXX (XXX=next
three-digit group number).
• Delete. Delete selected group name. Points in the group are not deleted.
• Visible. Control visibility of points in a group.
6. Press the MENU key to close the menu.
4.10 How to Show or Hide All Points
You can show or hide all points. A point which is currently used in navigation cannot
be removed from the screen until the navigation is stopped.
1. Long-push the RotoKey to show the soft controls.
2. Use the RotoKey to select [Points].
4. POINTS
3. Select [Show] then push the RotoKey to show or hide all points.
4-11
Page 95

4. POINTS
4.11 How to Go to a Point
Select the point to go to from the three methods shown below.
• Select the point on the screen
• Select the point from a Points list
• Select the point with the cursor
After you have selected a point, you can do the following.
• Restart the cross-track error (XTE) indication.
• Stop and restart Go To.
Before you try to go to a point, make sure that the path to the point is clear. Make sure
to zoom your chart to check for hazards which appear on a smaller scale.
4.11.1 How to go to an On-screen Point
1. Use the CursorPad to select the point.
2. Push the right-click button to show the Points pop-up
menu.
3. Use the RotoKey to select [Go To].
Arrival area
(Marker is a circle or
circle and cross line
depending on setting of
Waypoint Switching Method
in Routes menu.)
XTE
(Cross-track Error)
Boat icon
(current position)
PT 0001
Move
Go To
Edit
Rename
Delete
Go to point
Course to follow
(red and dashed)
4-12
XTE alarm lines
Green: starboard
Red: port
A red dashed line runs between current position and the point. This line is the course
to follow to get to the point. The point arrival area is indicated with a circle, or both circle and line. You can select the arrival area indication method with [Waypoint Switching Mode] in the [Routes-General] menu. To receive an aural alarm when you are
within a preset distance, turn on [Waypoint Notification] and set [Switching Circle Radius] on the [Routes-General] menu. The XTE alarm lines, red for port side, green for
starboard side, show the XTE alarm range. You can show or hide these lines with
[XTE Alarm Lines] in the [Routes-General] menu.
The route is saved to the Routes list under the next route number, but is deleted when
you turn off the system.
Page 96

4.11.2 How to go to Cursor Position
The benefit of using the cursor position as a point to go to is you do not have to save
the point. The point is erased when the navigation is cancelled.
GO TO/LIST key
Put the cursor on the location then push the GO TO/LIST key. Use the RotoKey to
select [Go To] or [Go To by Position]. To set the position accurately, use [Go To by
Position]. Set the position in the [Validate position] box with the RotoKey. Push the
key to select the location in the box, rotate the key to set value, then push the key to
validate the position.
Go To
Go To by Position
Cursor position pop-up menu
Validate position window (position input)
4. POINTS
Pop-up menu
Put the cursor on the location then push the right-click button to show the Cursor Position pop-up menu. Use the RotoKey to select [Go To] or [Go To by Position]. To set
the position accurately, use [Go To by Position]. Set the position in the [Validate position] box with the RotoKey. Push the key to select the location in the box, rotate the
key to set value, then push the key to validate the position.
Go To
Go To by Position
New Point
New Route
Center on Boat
Acquire Target
Cursor position pop-up menu
Validate position window (position input)
4-13
Page 97

4. POINTS
A
A red dashed line runs between current position and the point. This line is the course
to follow to get to the point. The point arrival area is indicated with a circle, or both circle and line. You can select the arrival area indication method with [Waypoint Switching Mode] in the [Routes-General] menu. To receive an aural alarm when you are
within a preset distance, turn on [Waypoint Notification] and set [Switching Circle Radius] on the [Routes-General] menu. The XTE alarm lines, red for port side, green for
starboard side, show the XTE alarm range. You can show or hide these lines with
[XTE Alarm Lines] in the [Routes-General] menu.
rrival area
(Appears when Waypoint
Switching Mode in the
Routes menu is set for
Circle, or Cross Line and
Circle.
Cross-track
error
Destination point
Course to destination
(dashed red line)
Boat icon
(your ship)
XTE alarm lines (red, left, green, right)
How arrival is “judged”
Arrival area
Circle Cross line and Circle Cross line
Cross line
Cross line
4-14
Ship arrives to
arrival area.
Ship arrives to
arrival area or
ship passes
an imaginary
perpendicular
line passing
through center
of destination
waypoint.
Ship passes an
imaginary
perpendicular
line passing
through center
of destination
waypoint.
Page 98

4.11.3 How to go to a Point Selected from the Points List
1. Long-push the GO TO/LIST key to open the [Points] menu then open the Alpha
list.
2. Use the RotoKey to select a point.
3. Push the RotoKey to show the [Points] Menu pop-up. The cursor selects [Go To].
Push the RotoKey.
New Point
Edit
Delete
Find on Map
The menu is erased and the chart plotter display appears. A red dashed line runs between current position and the point. This line is the course to follow to get to the point.
The point arrival area is indicated with a circle, or both circle and line. You can select
the arrival area indication method with [Waypoint Switching Mode] in the [RoutesGeneral] menu. To receive an aural alarm when you are within a preset distance, turn
on [Waypoint Notification] and set [Switching Circle Radius] on the [Routes-General]
menu. The XTE alarm lines, red for port side, green for starboard side, show the XTE
alarm range. You can show or hide these lines with [XTE Alarm Lines] in the [RoutesGeneral] menu.
4. POINTS
4.11.4 How to Extend a Route Made with a Single Point
If you have made a route with a single point and you need to go other locations, you
can easily extend the route as follows.
1. Use the CursorPad to put the cursor on the dashed line of the route.
2. Push the right-click button to show the Route Follow pop-up menu.
3. Use the RotoKey to select [Extend Route].
4. Set the cursor on a new location and push the left-click button.
5. Repeat step 4 to add additional points.
6. Push the RotoKey to finish.
4-15
Page 99

4. POINTS
4.12 How to Restart and Cancel Navigation to a Point
4.12.1 Restart Navigation
When you go to a point, you can restart
the navigation to the point from current
location.
When you steer to keep away from an
obstruction or the vessel drifts, you go
off course as shown in Line 1 in the figure. If you do not need to return to the
original course, you can go to the point
from the current position as shown in
Line 2 in the figure.
1. Use the CursorPad to put the cursor on the dashed line of the route.
2. Push the right-click button to show the Route Follow pop-up menu.
Original course
Obstacle
Line 2
Line 1
Restart
Extend Route
Route Info
3. Use the RotoKey to select [Restart].
The route start position for the route moves to the current position and the XTE
becomes zero.
4.12.2 How to Cancel Navigation to a Point
1. Use the CursorPad to put the cursor on the dashed line of the route.
2. Push the right-click button to show the Route Follow pop-up menu.
3. Use the RotoKey to select [Cancel Route].
The dotted line from your vessel to the point is erased from the screen. To again go to
the point:
1) Select the point on the screen.
2) Open the Points pop-up menu.
3) Select [Go To] then push the RotoKey.
Navigation is then restarted from the point at which the navigation was stopped.
4-16
Page 100

5. ROUTES
5.1 What is a Route?
A route is a series of points entered in the order to use for navigation. A route can contain up to a maximum of 100 points, and this equipment stores 200 routes.
You create a route by pointing and clicking geographical positions on the screen.
These positions are marked with blue solid circles.
You can follow a route that you have created if you use the GOTO feature. When you
follow a route, the current leg is shown as a dotted line and previous legs are erased
from the screen.
On-screen routes can be edited from the Routes pop-up menu. With this pop-up
menu, you can
• Enter points in a route
• Move points in a route
• Delete points from a route
• Extend a route a route
• Split routes
• Find information about a route
• Set a route as destination
• Delete a route
• Follow a route in reverse direction
• Ignore a route point when following a route
5-1
 Loading...