

Page 1
GPS PLOTTER/SOUNDER
OPERATOR'S MANUAL
Model
GP-1670F/GP-1870F
www.furuno.com
Page 2

The paper used in this manual
9-52 Ashihara-cho,
A:JUN
2012
.
C:FEB.15, 2013
Pub. No.
(
)
*00017659312*
Nishinomiya, 662-8580, JAPAN
is elemental chlorine free.
・FURUNO Authorized Distributor/Dealer
All rights reserved.
TAHA
GP-1670F/GP-1870F
Printed in Japan
OME-44770-C
*00017659312*
* 0 0 0 1 7 6 5 9 3 1 2 *
Page 3

IMPORTANT NOTICES
General
• This manual has been authored with simplified grammar, to meet the needs of international users.
• The operator of this equipment must read and follow the descriptions in this manual. Wrong operation or maintenance can cancel the warranty or cause injury.
• Do not copy any part of this manual without written permission from FURUNO.
• If this manual is lost or worn, contact your dealer about replacement.
• The contents of this manual and equipment specifications can change without notice.
• The example screens (or illustrations) shown in this manual can be different from the screens
you see on your display. The screens you see depend on your system configuration and equipment settings.
• Save this manual for future reference.
• Any modification of the equipment (including software) by persons not authorized by FURUNO
will cancel the warranty.
• SDHC is a registered trademark of SD-3C, LLC.
• All brand and product names are trademarks, registered trademarks or service marks of their
respective holders.
How to discard this product
Discard this product according to local regulations for the disposal of industrial waste. For disposal
in the USA, see the homepage of the Electronics Industries Alliance (http://www.eiae.org/) for the correct method of disposal.
How to discard a used battery
Some FURUNO products have a battery(ies). To see if your product has a battery, see the chapter
on Maintenance. Follow the instructions below if a battery is used. Tape the + and - terminals
of battery before disposal to prevent fire, heat generation caused by short circuit.
In the European Union
The crossed-out trash can symbol indicates that all types of batteries
must not be discarded in standard trash, or at a trash site. Take the
used batteries to a battery collection site according to your national
legislation and the Batteries Directive 2006/66/EU.
In the USA
Cd
The Mobius loop symbol (three chasing arrows) indicates that Ni-Cd
and lead-acid rechargeable batteries must be recycled. Take the used
batteries to a battery collection site according to local laws.
In the other countries
There are no international standards for the battery recycle symbol. The number of symbols can
increase when the other countries make their own recycle symbols in the future.
Ni-Cd Pb
i
Page 4
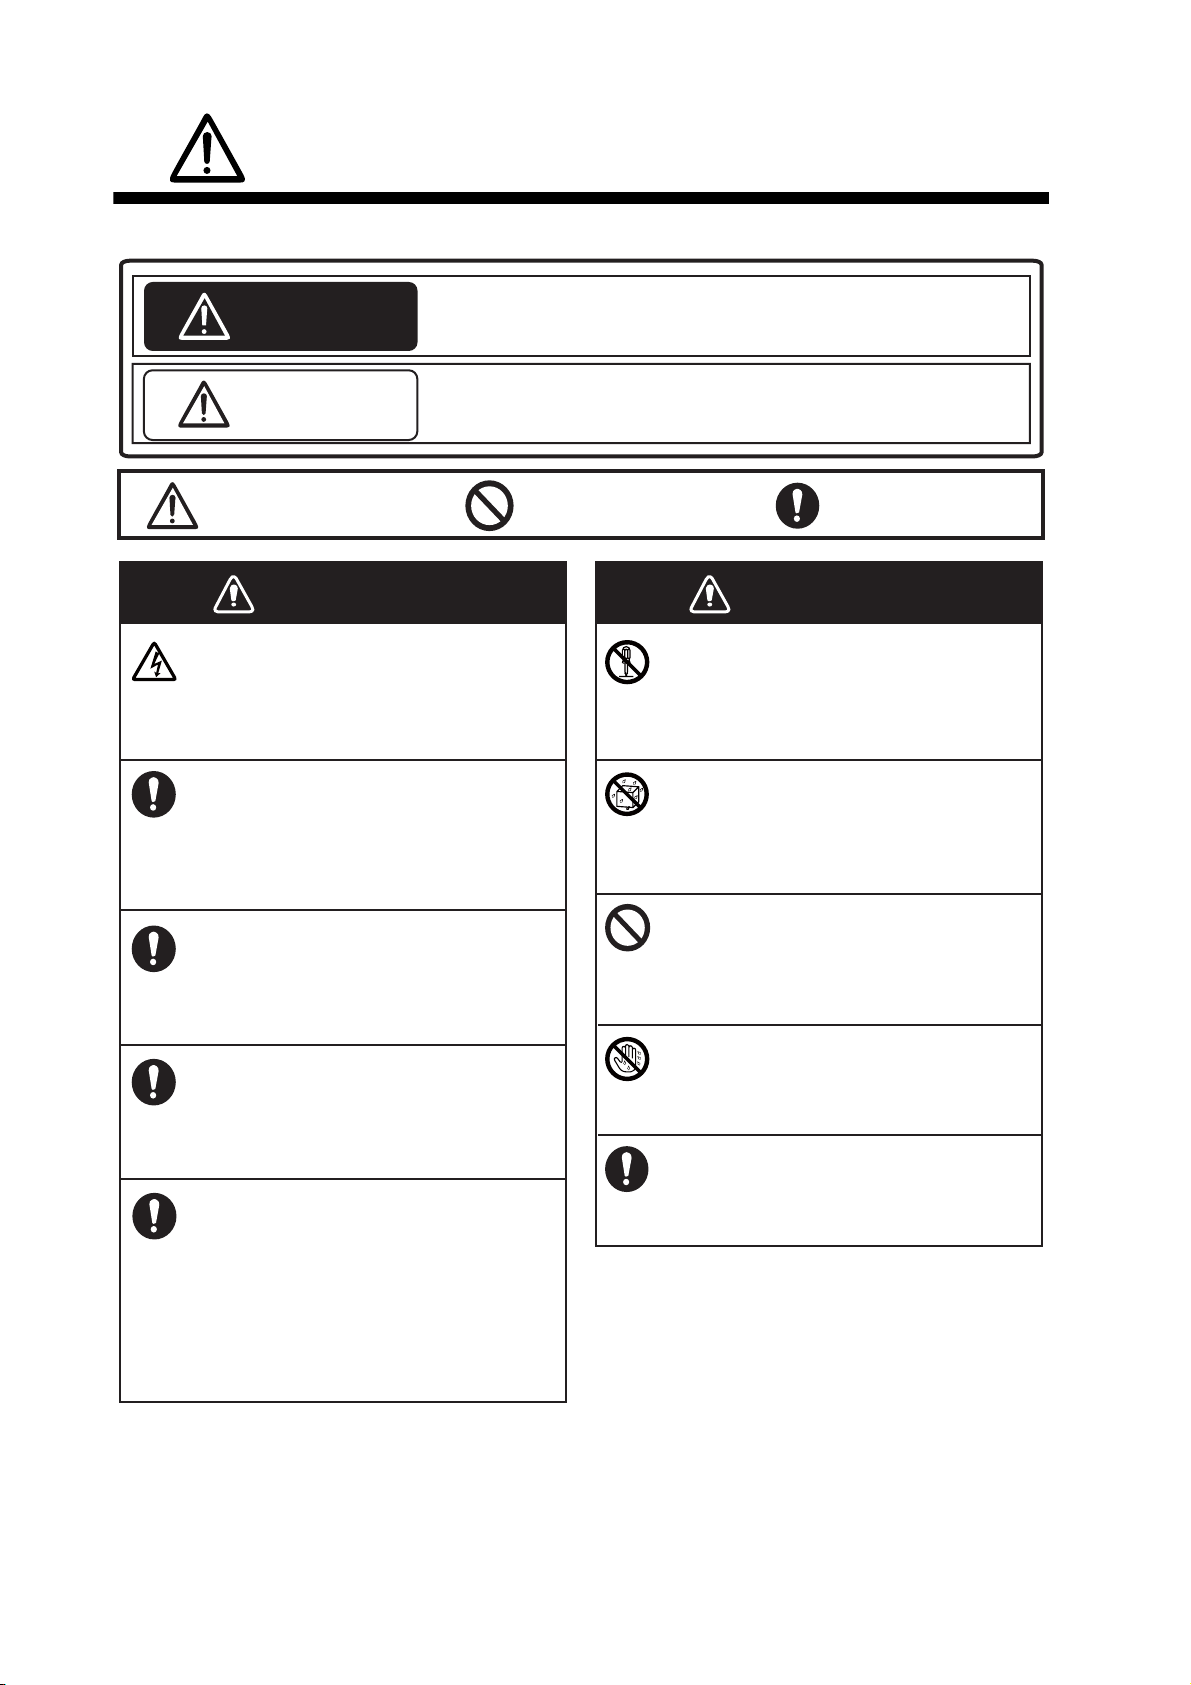
SAFETY INSTRUCTIONS
The operator must read the safety instructions before attempting to operate the equipment.
WARNING
CAUTION
Warning, Caution
Indicates a potentially hazardous situation which, if not avoided,
could result in death or serious injury.
Indicates a potentially hazardous situation which, if not avoided,
could result in minor or moderate injury.
Prohibitive Action
WARNING
Do not open the equipment.
The equipment uses high voltage that
can cause electrical shock. Refer any
repair work to a qualified technician.
If water leaks into the equipment or
something is dropped into the equipment, immediately turn off the power
at the switchboard.
Fire or electrical shock can result.
If the equipment is giving off smoke
or fire, immediately turn off the power
at the switchboard.
WARNING
Fire or electrical shock can result.
If you feel the equipment is acting
abnormally or giving off strange
noises, immediately turn off the
power at the switchboard and contact
a FURUNO service technician.
Mandatory Action
WARNING
Do not disassemble or modify the
equipment.
Fire, electrical shock or serious injury
can result.
Make sure no rain or water splash
leaks into the equipment.
Fire or electrical shock can result if
water leaks into the equipment.
Do not place liquid-filled containers
on or near the equipment.
Fire or electrical shock can result if a
liquid spills into the equipment.
Do not operate the equipment with
wet hands.
Electrical shock can result.
Use the proper fuse.
WARNING
Electrical current flows to the pins of
the transducer connector when the
power is on, regardless of whether
the transducer cable is connected or
not.
If the transducer cable is not connected,
cover the transducer connector with the
supplied cap to prevent electrical shock.
Use of the wrong fuse can cause fire or
electrical shock.
ii
Page 5
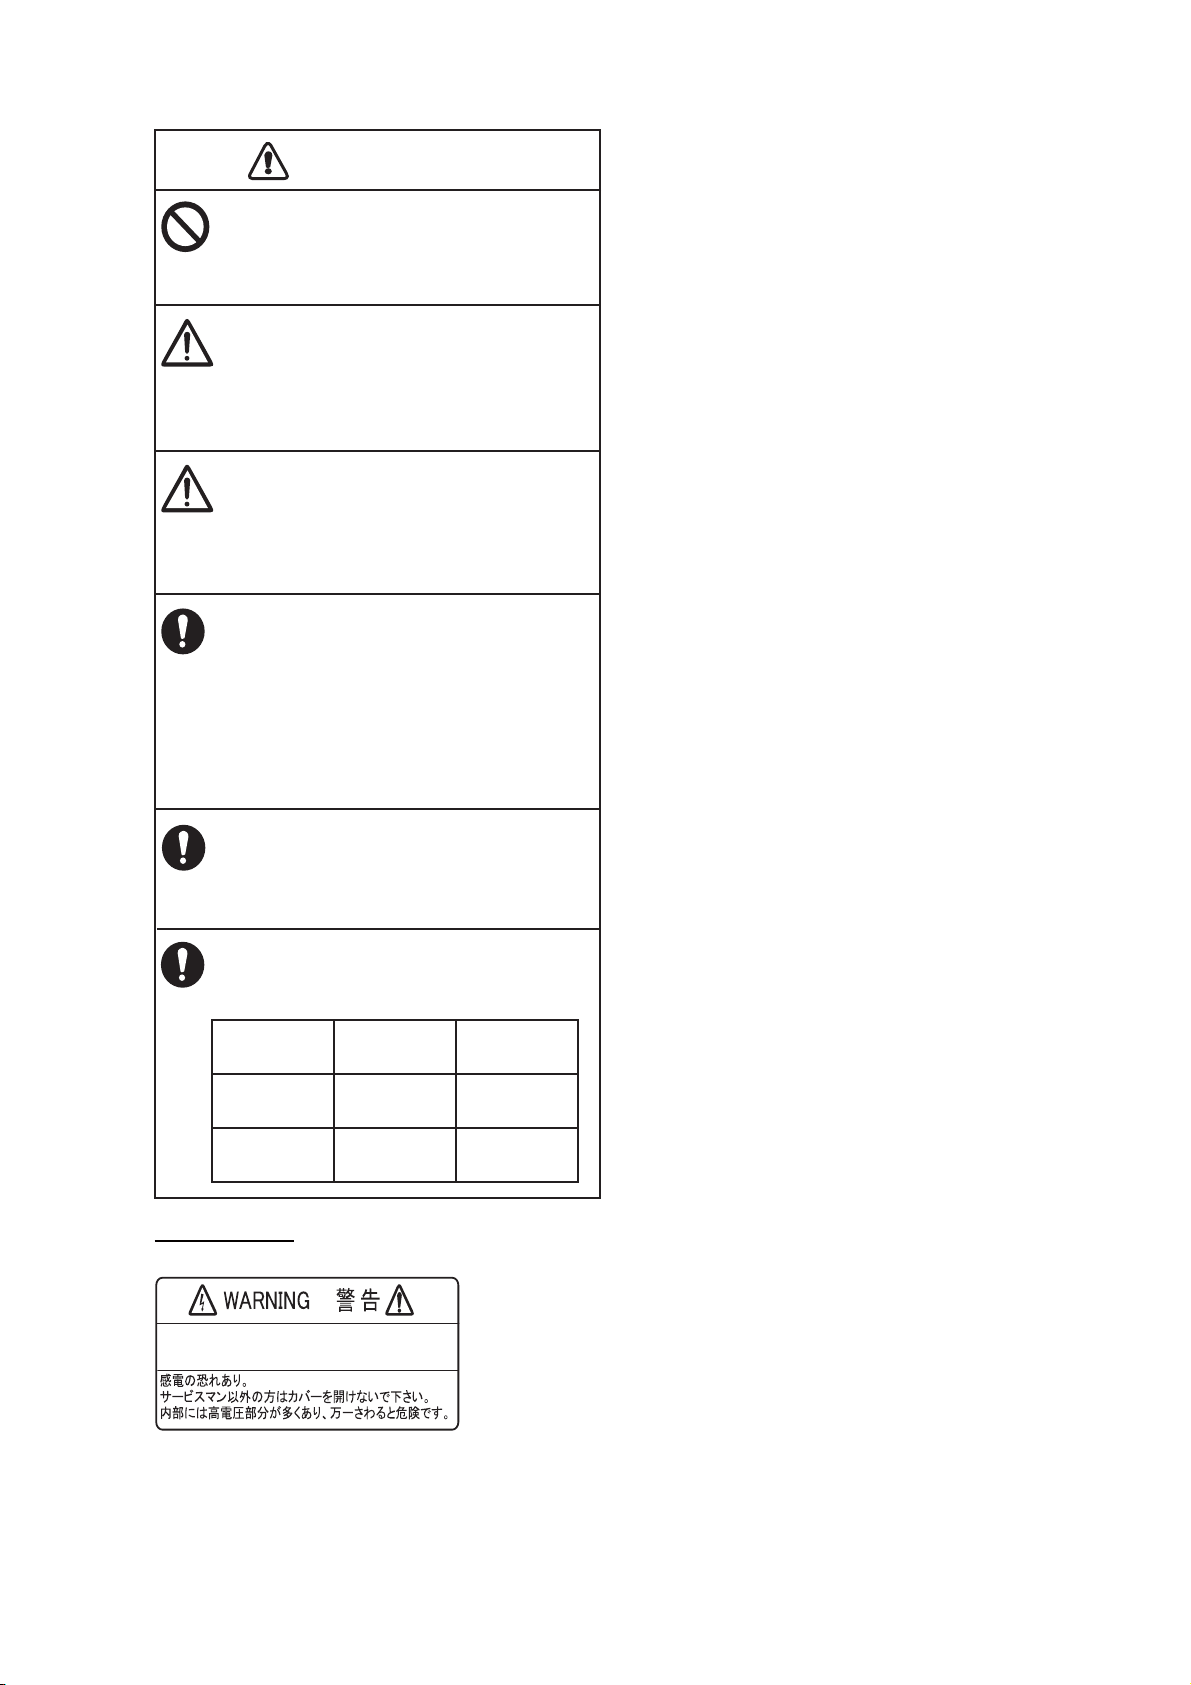
CAUTION
Do no turn on the equipment with the
transducer out of water.
The transducer can be damaged.
The picture is not refreshed when
picture advancement is stopped.
Maneuvering the vessel in this condition
can result in a dangerous situation.
Adjust the gain correctly.
Incorrect gain may give a wrong depth
indication, which could result in a
dangerous situation.
The data presented by this equipment
is intended as a source of navigation
information.
SAFETY INSTRUCTIONS
The prudent navigator never relies
exclusively on any one source of
navigation information, for safety of
vessel and crew.
The LCD panel is made of glass.
Handle it with care.
Injury can result if the glass breaks.
Follow the compass safe distances
shown below to prevent interference
to a magnetic compass.
Standard
compass
GP-1670F
GP-1870F
Warning Label
Do not remove the label.
0.30 m
0.30 m
Steering
compass
0.30 m
0.30 m
To avoid electrical shock,do not remove
cover. No user-serviceable parts inside.
Warning Label
iii
Page 6

TABLE OF CONTENTS
FOREWORD ...................................................................................................................ix
SYSTEM CONFIGURATION ..........................................................................................xi
EQUIPMENT LISTS.......................................................................................................xii
1. OPERATIONAL OVERVIEW .................................................................................1-1
1.1 Controls......................................................................................................................1-1
1.1.1 Control description .........................................................................................1-1
1.2 RotoKey
1.3 How to Turn the Power On or Off...............................................................................1-6
1.4 How to Adjust the Display Brilliance...........................................................................1-6
1.5 2D Plotter Displays.....................................................................................................1-6
1.6 The Cursor ................................................................................................................. 1-9
1.7 Navigation Data Boxes.............................................................................................1-10
1.7.1 How to select the data to display in a box.................................................... 1-10
1.8 Home Screen (Display Selection) ............................................................................1-11
1.8.1 How to select a display ................................................................................1-11
1.8.2 How to switch the active screen................................................................... 1-11
1.8.3 How to customize the home screen.............................................................1-12
1.8.4 Description of home screen displays ...........................................................1-14
1.9 Display Range..........................................................................................................1-18
1.10 Orientation Mode......................................................................................................1-18
1.11 How to Move the Chart ............................................................................................1-19
1.12 Menu Operation .......................................................................................................1-20
1.13 Object Information....................................................................................................1-21
1.13.1 Simple information .......................................................................................1-21
1.13.2 Detailed information .....................................................................................1-21
1.14 Context-Sensitive Menus .........................................................................................1-22
1.15 Man Overboard (MOB).............................................................................................1-24
1.15.1 How to mark MOB position ..........................................................................1-24
1.15.2 How to stop navigating to a MOB mark........................................................1-24
1.15.3 How to erase an MOB mark......................................................................... 1-24
1.16 How to Take a Screenshot.......................................................................................1-24
1.17 Tide Information .......................................................................................................1-25
1.17.1 Tide height information.................................................................................1-25
1.17.2 Tide stream information ............................................................................... 1-26
TM
and Soft Controls .................................................................................... 1-5
2. TRACK ...................................................................................................................2-1
2.1 How to Show, Hide all Track ...................................................................................... 2-1
2.2 How to Stop Recording Track ....................................................................................2-1
2.3 How to Select Recording Method, Recording In-terval ..............................................2-1
2.4 How to Change the Color of Your Boat’s Track .........................................................2-2
2.5 How to Change the Color of Your Boat’s Track with Sea Surface Temperature ....... 2-2
2.6 How to Hide, Show Track by Color ............................................................................2-2
2.7 How to Delete Track by Color ....................................................................................2-3
2.8 How to Find Track Information ................................................................................... 2-3
3. POINTS ..................................................................................................................3-1
3.1 What is a Point? ......................................................................................................... 3-1
3.2 How to Enter a Point ..................................................................................................3-1
3.2.1 How to enter a point at the current position ...................................................3-1
3.2.2 How to enter a point at the cursor position..................................................... 3-2
iv
Page 7

TABLE OF CONTENTS
3.2.3 How to enter a position manually on the plotter screen .................................3-3
3.2.4 How to enter a point from the Points List .......................................................3-3
3.3 How to Find Detailed Point Information......................................................................3-4
3.4 How to Move a Point ..................................................................................................3-4
3.4.1 How to move a point on the screen................................................................3-4
3.4.2 How to move a point from the Points List.......................................................3-4
3.5 How to Select Visibility for Points ...............................................................................3-5
3.6 How to Search, Sort Points on the Points List............................................................3-5
3.6.1 How to search points......................................................................................3-5
3.6.2 How to sort points...........................................................................................3-5
3.7 How to Filter Points by Shape on the Points List........................................................3-6
3.8 How to Delete Points..................................................................................................3-6
3.8.1 How to delete a point from the screen............................................................3-6
3.8.2 How to delete points from the Points List.......................................................3-6
4. ROUTES ................................................................................................................4-1
4.1 What is a Route?........................................................................................................4-1
4.2 How to Create a Route...............................................................................................4-1
4.2.1 How to create a route from the RotoKey menu ..............................................4-1
4.2.2 How to create a route from the Routes List....................................................4-2
4.2.3 How to create a route with the Easy Routing feature .....................................4-3
4.3 How to Extend a Route on the Screen .......................................................................4-6
4.4 How to Insert a Point on a Route on the Screen ........................................................4-7
4.5 How to Move a Point in a Route on the Screen..........................................................4-7
4.6 How to Delete a Point From a Route on the Screen ..................................................4-7
4.7 Routes List..................................................................................................................4-8
4.7.1 How to display the Routes List.......................................................................4-8
4.7.2 Functions available in the Routes List............................................................4-9
4.8 Route Report, Route Calculator ...............................................................................4-10
4.9 How to Display a Route on the Screen.....................................................................4-11
4.10 How to Connect Two Routes....................................................................................4-11
4.11 Simple Route Information .........................................................................................4-11
4.12 How to Rename a Route on the Screen...................................................................4-12
4.13 How to Delete Routes...............................................................................................4-12
4.13.1 How to delete a route on the screen ............................................................4-12
4.13.2 How to delete routes from the Routes List ...................................................4-12
5. NAVIGATION.........................................................................................................5-1
5.1 How to Navigate to a Quick Point...............................................................................5-1
5.2 How to Navigate to a Saved Point..............................................................................5-2
5.2.1 How to navigate to a saved point selected on the screen..............................5-2
5.2.2 How to navigate to a point selected from the Points List................................5-2
5.3 How to Select a Route for Navigation.........................................................................5-2
5.3.1 On-screen route .............................................................................................5-2
5.3.2 Route selected from the Routes List ..............................................................5-3
5.3.3 How to start navigation from a point on a route..............................................5-3
5.4 Functions Available When You Follow a Route..........................................................5-4
5.4.1 Restart navigation ..........................................................................................5-4
5.4.2 Follow a route in reverse order.......................................................................5-4
5.4.3 Stop following a route.....................................................................................5-4
5.4.4 Skip a leg in a route........................................................................................5-4
6. MAP SETTINGS, 2D PERSPECTIVE/3D DISPLAYS AND
SATELLITE OVERLAY .........................................................................................6-1
6.1 Map Setup ..................................................................................................................6-1
6.2 2D Perspective Dispay ...............................................................................................6-5
v
Page 8

TABLE OF CONTENTS
6.3 3D Display..................................................................................................................6-6
6.3.1 3D display description....................................................................................6-6
6.3.2 How to tilt and rotate the 3D display ..............................................................6-7
6.3.3 How to make the 3D view clearer ..................................................................6-7
6.4 Satellite Photo Overlay...............................................................................................6-8
7. FISH FINDER OPERATIONS ................................................................................7-1
7.1 How the Fish Finder Works........................................................................................7-1
7.2 Fish Finder Display .................................................................................................... 7-2
7.3 How to Activate the Fish Finder .................................................................................7-3
7.4 How to Select a Display .............................................................................................7-3
7.4.1 How to select a single frequency or dual frequency....................................... 7-3
7.4.2 How to select a zoom display......................................................................... 7-4
7.4.3 A-scope display..............................................................................................7-5
7.4.4 Bottom discrimination display......................................................................... 7-6
7.5 Automatic Fish Finder ................................................................................................7-8
7.5.1 How the automatic fish finder works ..............................................................7-8
7.5.2 How to select an automatic fish finder mode ................................................. 7-8
7.5.3 How to adjust the gain in the auto mode........................................................ 7-8
7.6 Manual Fish Finder Operation....................................................................................7-9
7.6.1 How to select a display range ........................................................................7-9
7.6.2 How to shift the range .................................................................................... 7-9
7.6.3 How to adjust the gain.................................................................................. 7-10
7.6.4 How to reduce clutter ................................................................................... 7-10
7.7 Picture Advance Speed............................................................................................7-11
7.8 How to Reduce Interference ....................................................................................7-12
7.9 How to Erase Weak Echoes ....................................................................................7-12
7.10 How to Measure Depth, Time Between Locations ................................................... 7-13
7.11 How to Balance Echo Strength ................................................................................7-13
7.12 White Marker............................................................................................................7-14
7.13 White Line ................................................................................................................ 7-14
7.14 Alarms ......................................................................................................................7-14
7.14.1 How to set an alarm .....................................................................................7-15
7.14.2 How to select the echo signal level that triggers the fish alarm ................... 7-15
7.15 ACCU-FISH
7.15.1 Considerations for ACCU-FISH
7.15.2 How to activate ACCU-FISH
7.15.3 Fish size correction ...................................................................................... 7-17
7.16 Water Temperature Graph ....................................................................................... 7-18
7.17 FISH FINDER Menu.................................................................................................7-19
7.18 Interpreting the Display ............................................................................................7-22
TM
.........................................................................................................7-16
TM
...............................................................7-16
TM
, select display information ......................... 7-17
8. ALARMS ................................................................................................................8-1
8.1 ALARMS Menu ..........................................................................................................8-1
8.2 Audio Alarm Conditions..............................................................................................8-2
8.3 Arrival Alarm...............................................................................................................8-2
8.4 XTE Alarm.................................................................................................................. 8-3
8.5 Temperature Alarm ....................................................................................................8-3
8.6 Shear Alarm ............................................................................................................... 8-4
8.7 Depth Alarm ............................................................................................................... 8-4
8.8 Anchor Alarm .............................................................................................................8-5
8.9 Trip Alarm...................................................................................................................8-5
8.10 Speed Alarm ..............................................................................................................8-5
8.11 Fuel Tank Alarm......................................................................................................... 8-6
8.12 Water Tank Alarm ......................................................................................................8-6
8.13 Black Water Tank Alarm ............................................................................................8-6
vi
Page 9

TABLE OF CONTENTS
9. MEMORY CARD OPERATIONS ...........................................................................9-1
9.1 The Memory Card Screen ..........................................................................................9-1
9.2 How to Initialize SD Cards..........................................................................................9-1
9.3 How to Eject an SD Card............................................................................................9-2
9.4 How to Save Data to an SD Card...............................................................................9-2
9.5 How to Rename Files on an SD Card ........................................................................9-2
9.6 How to Delete Files from an SD Card ........................................................................9-3
9.6.1 How to delete individual files from an SD card...............................................9-3
9.6.2 How to delete all files from an SD card ..........................................................9-3
9.7 How to Import Data from an SD Card.........................................................................9-3
9.8 How to Process Screenshots .....................................................................................9-4
9.8.1 How to select source of screenshots (internal memory or SD card) ..............9-4
9.8.2 How to save screenshots in the internal memory to an SD card....................9-4
9.8.3 How to delete screenshots.............................................................................9-5
10. OTHER FUNCTIONS ..........................................................................................10-1
10.1 AIS Operations .........................................................................................................10-1
10.1.1 AIS target symbols .......................................................................................10-1
10.1.2 How to find AIS target information................................................................10-2
10.1.3 AIS activation range .....................................................................................10-2
10.1.4 CPA and TCPA alarms.................................................................................10-2
10.2 DSC Message Information .......................................................................................10-3
10.2.1 How to select a device for DSC message information .................................10-3
10.2.2 DSC message information ...........................................................................10-3
10.3 Stopwatch, Timer......................................................................................................10-4
10.4 How to Select Input, Output Data.............................................................................10-5
10.4.1 Input data .....................................................................................................10-5
10.4.2 Output data...................................................................................................10-6
10.5 Engine Display Setup (INSTRUMENTS menu)........................................................10-7
11. CUSTOMIZING YOUR UNIT ...............................................................................11-1
11.1 GENERAL Menu ......................................................................................................11-1
11.2 PLOTTER Menu.......................................................................................................11-2
11.3 SYSTEM Menu.........................................................................................................11-3
12. MAINTENANCE, TROUBLESHOOTING ............................................................12-1
12.1 Maintenance.............................................................................................................12-1
12.2 How to Replace the Fuse.........................................................................................12-2
12.3 Troubleshooting........................................................................................................12-2
12.4 GPS Status Display..................................................................................................12-4
12.5 How to Restore Defaults, Clear Memory ..................................................................12-5
12.6 System Information...................................................................................................12-6
13. INSTALLATION ...................................................................................................13-1
13.1 Installation of Display Unit........................................................................................13-1
13.2 Installation of Antenna Unit.......................................................................................13-2
13.3 Installation or Transducers .......................................................................................13-2
13.3.1 How to mount a transducer through the hull ................................................13-2
13.3.2 Transom mount transducer ..........................................................................13-5
13.3.3 How to mount a transducer inside the hull ...................................................13-6
13.3.4 Triducer ........................................................................................................13-7
13.4 Installation of Sensors (option)...............................................................................13-12
13.4.1 Speed/temperature sensors ST-02MSB, ST-02PSB .................................13-12
13.4.2 Temperature sensors .................................................................................13-13
13.5 Wiring .....................................................................................................................13-15
13.6 Initial Settings .........................................................................................................13-19
vii
Page 10

TABLE OF CONTENTS
13.6.1 INSTALLATION SETTINGS menu.............................................................13-19
13.6.2 CAN bus input/output................................................................................. 13-21
APPENDIX 1 MENU TREE .......................................................................................AP-1
APPENDIX 2 ABBREVIATIONS, SYMBOLS ...........................................................AP-6
APPENDIX 3 JIS CABLE GUIDE ...........................................................................AP-11
SPECIFICATIONS .....................................................................................................SP-1
PACKING LISTS..........................................................................................................A-1
OUTLINE DRAWINGS................................................................................................. D-1
INTERCONNECTION DIAGRAM ................................................................................ S-1
INDEX..........................................................................................................................IN-1
viii
Page 11

FOREWORD
A Word to GP-1670F, GP-1870F Owners
Congratulations on your choice of the FURUNO GP-1670F, GP-1870F GPS Plotter/Sounder. We
are confident you will see why the FURUNO name has become synonymous with quality and reliability.
Since 1948, FURUNO Electric Company has enjoyed an enviable reputation for innovative and
dependable marine electronics equipment. This dedication to excellence is furthered by our extensive global network of agents and dealers.
This equipment is designed and constructed to meet the rigorous demands of the marine environment. However, no machine can perform its intended function unless operated and maintained
properly. Please carefully read and follow the recommended procedures for operation and maintenance.
We would appreciate hearing from you, the end user, about whether we are achieving our purposes.
Thank you for considering and purchasing FURUNO equipment.
Features
The GP-1670F and GP-1870F provide a totally integrated GPS receiver, color video plotter and
color fish finder. The built-in GPS receiver provides highly accurate position, course and speed
information. The fish finder presents vivid underwater images on a high quality LCD. The compact
display unit and antenna unit permit installation where space is limited.
The main features are
General
• Bright 5.7-inch (GP-1670F) or 7-inch (GP-1870F) color LCD with brilliance control.
• Excellent viewing angles, even when wearing sunglasses.
• Internal GPS receiver provides highly accurate position information (GPS, within 2.5 m, SBAS,
within 2 m).
• Customizable analog and digital displays show wind angle and speed, engine condition (speed,
temperature, oil pressure, etc.), etc.
• Large internal memory stores 30,000 track points, 30,000 points, 1,000 routes (500 waypoints/
route).
• SD card slot accepts SD and SDHC cards for external storage of data and settings.
• Full range of alarms: Arrival, Anchor Watch, Cross-track Error, Speed, Depth, Temperature,
Fish Alarm, Bottom Alarm, etc.
• Man overboard (MOB) feature records latitude and longitude coordinates at the time of MOB.
• CAN bus interface for the connection of GPS Receiver, Weather Station, FI-50 (instrument series), Satellite Compass, etc.
• Accepts NMEA0183 input with optional NMEA data converter.
• Internal GPS antenna available.
• C-Map 4D charts available.
ix
Page 12

FOREWORD
Fish finder
• Fish finder measures the depth to the bottom and displays underwater conditions in multi-colors* according to echo strength. A monochrome presentation shows the echoes in shades of
gray. (*Number of colors depends on network sounder, color sounder.).
• Automatic and manual fish finder operation. Auto mode automatically adjusts range, gain and
clutter ac-cording to purpose - fishing or cruising.
• Wide variety of zoom modes for detailed observation of fish and bottom.
• ACCU-FISH
TM
provides length and depth of individual fish. Appropriate transducer required.
Other
• AIS function (requires connection to an AIS transponder) provides navigational information from
AIS transponder equipped vessels within 50 nm.
• Instrument displays (steering, engine, weather, and wind) with connection of relevant sensors.
• DSC (Digital Selective Calling) function alerts to DSC messages received and position requests. (Requires DSC capable radiotelephone.)
Open Source Acknowledgement
This product makes use of the following open source software:
FreeType (www.freetype.org)
Portions of this software are copyright ©2009 The FreeType Project
(www.freetype.org). All rights reserved.
libpng (http://www.libpng.org/)
This software is based in part on the work of the Independent JPEG Group.
libjpeg (http://www.ijg.org/)
We would like to thank each developer of the above-mentioned open
source software for their great contribution to the open source community.
x
Page 13

SYSTEM CONFIGURATION
The environmental category of each unit is as follows:
Unit Environmental category
Display unit Protected from the weather
GPS antenna unit Exposed to the weather, or protected from the weather in
case of internal antenna
Transducer, sensor Submerged in water
Other units Protected from the weather
GP-1670F
Antenna Unit
GPA-017 or
Water temp./speed sensor
ST-02MSB, ST-02PSB
Water temp. sensor
T-02MSB, T-02MTB, T-03MSB
Matching Box
MB-1100*
Transducer
520-5PSD, 520-5MSD,
525-5PWD, 525STID-MSD,
525STID-PWD
OR
Internal GPS
antenna
* For connection to 1 kW
transducer (50B-6, 50B-6B,
200B-5S, 50/200-1T,
50/200-12M)
GPA-017S
Display Unit
GP-1670F
Junction Box
FI-5002
NMEA Data
Converter
IF-NMEA2K2
12-24 VDC
Rectifier
PR-62
CAN bus
equipment
NMEA 0183
equipment
100/110/
220/230 VAC,
1ø, 50/60 Hz
GP-1870F
Water temp./speed sensor
ST-02MSB, ST-02PSB
Water temp. sensor
T-02MSB, T-02MTB, T-03MSB
Matching Box
MB-1100*
Transducer
520-5PSD, 520-5MSD,
525-5PWD, 525STID-MSD,
525STID-PWD
Antenna Unit
GPA-017 or
GPA-017S
OR
Internal GPS
antenna
* For connection to 1 kW transducer
(50B-6, 50B-6B, 200B-5S,
50/200-1T, 50/200-12M)
Display Unit
GP-1870F
Junction Box
FI-5002
NMEA Data
Converter
IF-NMEA2K2
12-24 VDC
Rectifier
PR-62
CAN bus
equipment
NMEA 0183
equipment
100/110/
220/230 VAC,
1ø, 50/60 Hz
xi
Page 14

EQUIPMENT LISTS
Standard supply
Name Type Code no. Qty Remarks
Display Unit GP-1670F - Select
Display Unit GP-1870F -
one
Installation
Materials
Spare Parts SP14-03501 001-184-710 1 set
Accessories FP14-03001 001-184-730 1 set For GP-1670F
CP14-07100 000-021-070 1 set w/CP14-07101, MJ-A3SPF0013A-
035C (power cable)
FP14-03201 001-183-120 1 set For GP-1870F
Optional equipment
Name Type Code no. Remarks
Replacement Kit OP14-72 001-184-750
Waterproofing Cap LTWCAP-WBDMMSA1 000-167-169-11
Antenna Unit GPA-017
Antenna Unit GPA-017S
Mast Mtg. Kit CP20-01111 004-365-780
Antenna Cable Set CP20-01700 *30M* 004-372-110
Antenna Cable Set CP20-01710 *50M* 004-372-120
Transducer 520-5PSD 000-015-204 Thru-hull mount, plastic
520-5MSD 000-015-212 Thru-hull mount, metal
525-5PWD 000-146-966-01 Transom mount, plastic
Triducer (transducer
with speed/ temperature sensor)
Transducer (1 Kw) 50B-6 000-015-042 10 m, 1 kW
Speed/ Temperature Sensor
525STID-MSD 000-011-783 Thru-hull mount, metal
525STID-PWD 000-011-784 Transom mount, plastic
50B-6B 000-015-043 15 m, 1 kW
200B-5S 000-015-029 10 m, 1 kW
50/200-1T 000-015-170 10 m, 1 kW
50/200-12M 000-015-171 10 m, 1 kW
ST-02MSB 000-137-986-01 Thru-hull type, metal
ST-02PSB 000-137-987-01 Thru-hull type, plastic
xii
Page 15

EQUIPMENT LISTS
Name Type Code no. Remarks
Temperature Sen-
sor
Matching Box MB-1100 000-041-353 For connection to 1 kW trans-
Rectifier PR-62 000-013-484 100 VAC
Rectifier PR-62 000-013-485 110 VAC
Rectifier PR-62 000-013-486 220 VAC
Rectifier PR-62 000-013-487 230 VAC
Junction Box FI-5002
Right Angle Mount-
ing Base
L-angle Mounting
Base
Handrail Mounting
Base
T-02MTB 000-040-026 Transom mount, 8 m cable
T-02MSB 000-040-040 Thru-hull type
T-03MSB 000-040-027 Thru-hull type, 8 m cable
ducer
No.13QA330 001-111-910-10
No.13-QA310 001-111-900-10
No.13-RC5160 001-111-920-10
Cable Assy. TNC-PS-/PS-3D-L15M-R 001-173-110-10
Cable Assy. M12-05BM+05BF-010 001-105-750-10 w/connectors (light), 1 m
Cable Assy. M12-05BM+05BF-020 001-105-760-10 w/connectors (light), 2 m
Cable Assy. M12-05BM+05BF-060 001-105-770-10 w/connectors (light), 6 m
Cable Assy. M12-05BFFM-010 001-105-780-10 w/connectors (light), 1 m
Cable Assy. M12-05BFFM-020 001-105-790-10 w/connectors (light), 2 m
Cable Assy. M12-05BFFM-060 001-105-800-10 w/connectors (light), 6 m
Cable Assy. CB-05PM+05BF-010 000-167-968-10 w/connectors (heavy), 1 m
Cable Assy. CB-05PM+05BF-020 000-167-969-10 w/connectors (heavy), 2 m
Cable Assy. CB-05PM+05BF-060 000-167-970-10 w/connectors (heavy), 6 m
Cable Assy. CB-05BFFM-010 000-167-971-10 w/connectors (heavy), 1 m
Cable Assy. CB-05BFFM-020 000-167-972-10 w/connectors (heavy), 2 m
Cable Assy. CB-05BFFM-060 000-167-973-10 w/connectors (heavy), 6 m
Micro T-connector SS-050505-FMF-TS001 000-168-603-10 Micro style: 3
Mini/Micro T-con-
nector
NC-050505-FMF-TS001 000-160-507-10 Mini style: 2, micro style: 1
Termination Resis-
torr (Mini)
Termination Resis-
tor (Micro)
LTWMN-05AMMTSL8001
LTWMC-05BMMTSL8001
000-160-508-10 Mini style, male, termination
resistor
000-168-604-10 Micro style, male, termination
resistor
xiii
Page 16
EQUIPMENT LISTS
Name Type Code no. Remarks
Termination Resistor (Mini)
Termination Resistor (Micro)
Inline Terminator FRU-0505-FF-IS 001-077-830-10
Cable Assy. 02S4147-1 000-141-082 For speed/temp. sensor
Inner Hull Kit 22S0191 000-082-598 w/installation instructions,
NMEA Data Converter
LTWMN-05AFFTSL8001
LTWMC-05BFFTSL8001
IF-NMEA2K2
000-160-509-10 Mini style, female, termina-
tion resistor
000-168-605-10 Micro style, female, termina-
tion resistor
not usable with the bottom
discrimination display
xiv
Page 17
1. OPERATIONAL OVERVIEW
1.1 Controls
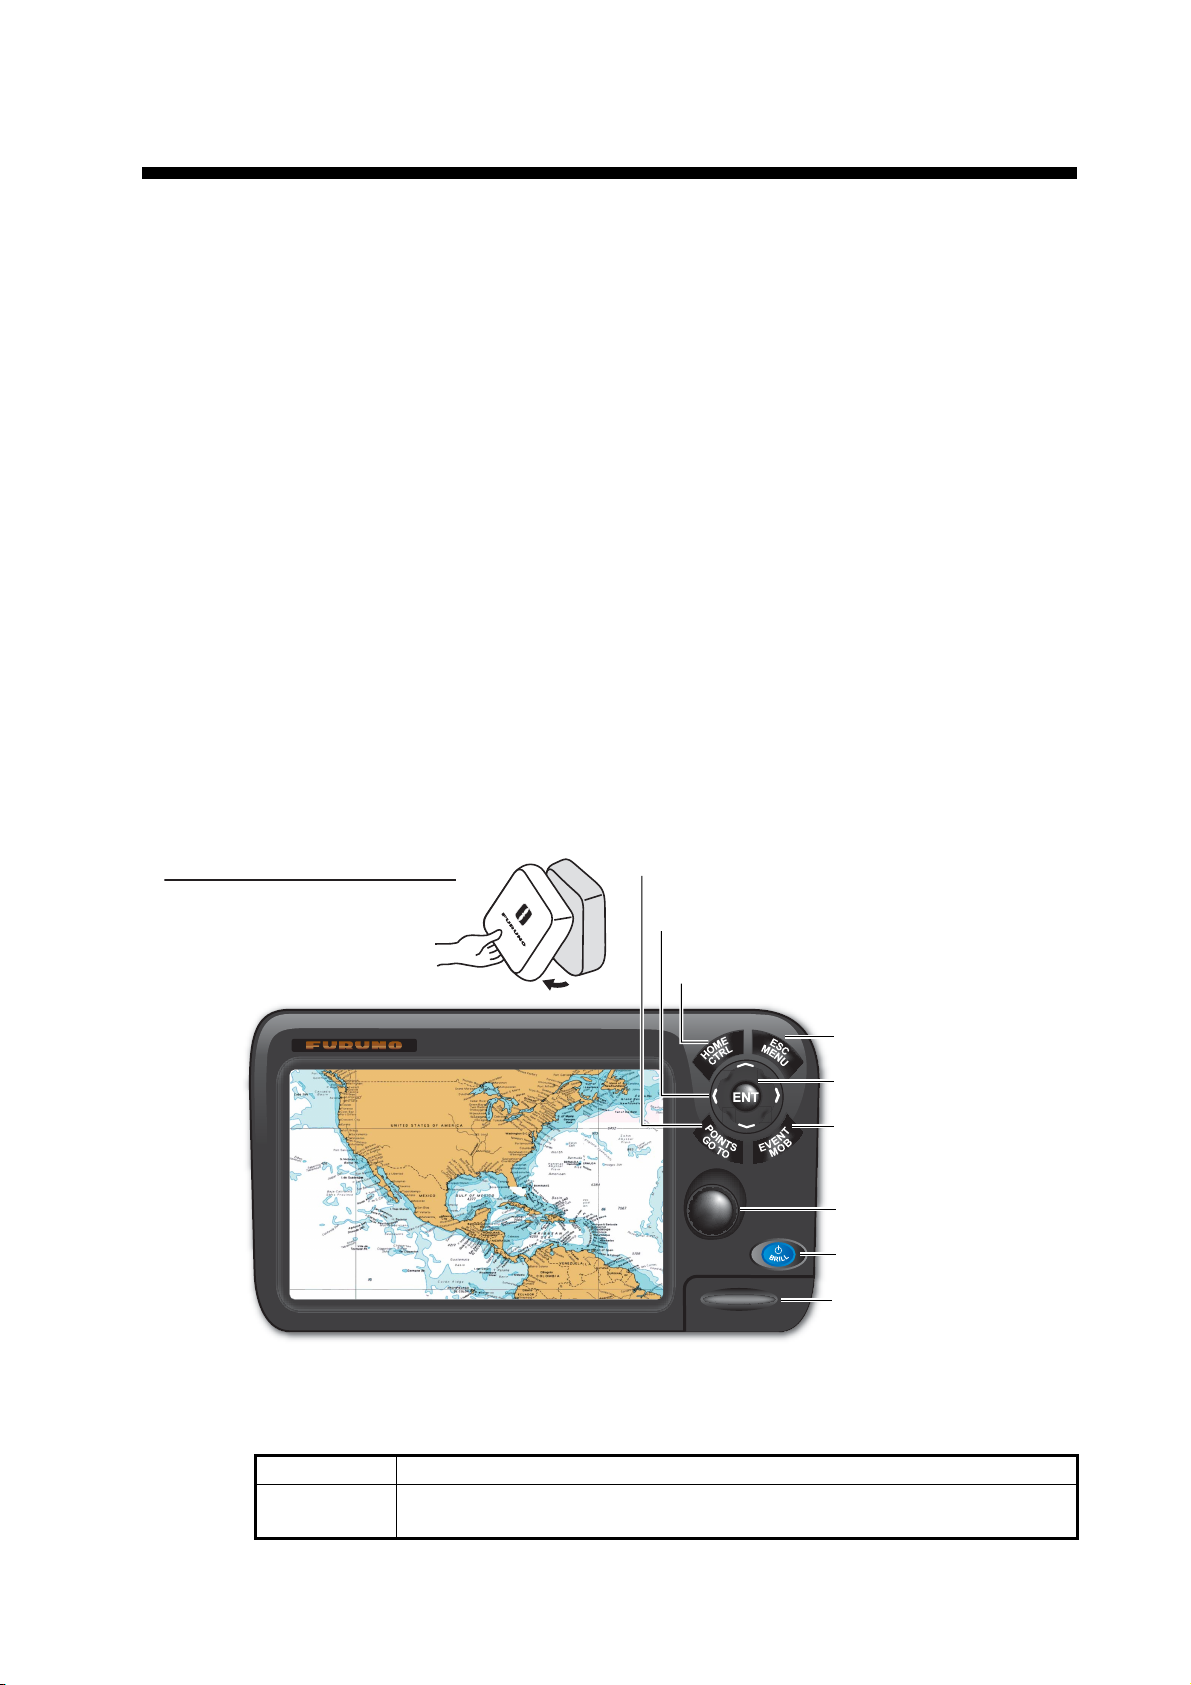
1.1.1 Control description
The controller for this system is either the GP-1670F or the GP-1870F. A key that has
two text labels has two functions. The top label is the main function and the bottom
label is the secondary function. Short-push to access the main function and long-push
(approximately three seconds) to access the secondary function.
You operate the chart plotter with
• Keys
• CursorPad
• RotoKey
• Menus, where you select options
• Context-sensitive menus, where you select options
TM
• Lists, where you can edit items
When you operate a key, a single beep sounds to tell you correct operation. If you do
not need the key beep, you can deactivate it from the menu.
How to remove the hard cover
Put fingers under notch at bottom
of cover and pull toward you.
POINTS/GO TO key
CursorPad
HOME/CTRL key
ESC/MENU key
ENT key
EVENT/MOB key
RotoKey
POWER/BRILL key
Behind cover:
- SD card slot
- USB micro connector
- RESET button
TM
Pictured: GP-1870F
Control Description
POWER/
BRILL key
Short press: Adjust LCD brilliance.
Long press: Turn the power on or off.
1-1
Page 18

1. OPERATIONAL OVERVIEW
Control Description
RotoKey
POINTS/GO
TO key
EVENT/
MOB key
ENT key Confirm current operation.
ESC/MENU
key
HOME/
CTRL key
CursorPad Moves the cursor and scrolls the screen, in the direction of the arrow
SD card slot: Card drive for SD card (chart card and memory card).
Micro USB connector: Connects to a PC for maintenance. (Mouse or USB flash mem-
ory cannot be connected.)
RESET button: Resets the program. Should the screen freeze press this button to restart.
TM
Short push: Display the base RotoKey soft controls for the current
mode.
Long push: Display the full RotoKey soft controls for the current mode.
Rotate: Zoom in or out the display range for the chart. Select a menu
item. Select the display range for the fish finder.
Short press: Put a point at the cursor position.
Long press: Set cursor position as destination.
Short press: Put a point at the current position.
Long press: Put an MOB (ManOverBoard) mark at current position.
Short press: Escape from current operation. Silence an audio alarm.
Long press: Open the menu.
Short press: DIsplay the home screen, to select a display.
Long press: Switch the active display in combination modes.
pressed.
SD cards
The SD cards store ship’s tracks, routes, points, settings, etc. The unit
accepts SD and SDHC (Secure Digital High Capacity) type cards and
the maximum capacity is 32 GB.
To set a card in the slot, insert the card label side up. If the card does not go in easily,
do not use force. Push the card until the card is in position.
To remove a card, Select [Eject SD card] from the full RotoKey menu.
Remove the card (with your fingers) after the message "You can eject SD card safely."
appears.
Care and handling of SD cards
• Handle the cards carefully; rough handling can damage the card and destroy its
contents.
• Make sure the cover is closed at all times. Insert the card fully or remove the
card; the cover cannot be closed if the card is inserted partially.
• Remove a card with only your fingers. Do not use metal instruments (like tweezers)
to remove the card.
• Do not remove a card during the reading of the card or writing to the card, to prevent
damage to the card and loss of the data stored on the card.
1-2
• If water is at the bottom of the cover, DO NOT open the cover. Remove the water
with a dry cloth completely and then open the cover.
Page 19

Tested SD cards
The SD cards tested for use in this equipment are listed in the table below.
Maker, Type Size
2 GB 4 GB 8 GB 16 GB 32 GB
ADTEC
AD-SDH (SD) [AD-SDH2G] Y
BUFFALO
RSDC-S (SD) [RSDC-S2G] Y
RSDC-G Hi-Performance (SD) [RSDC-G2G] Y
Hagiwara System
T series (SD) [PSDB0487A] Y
M series Super High Speed (SD) [PSDB0486A] Y
I-O DATA
1. OPERATIONAL OVERVIEW
I-O DATA (SD) [SD-2G] Y
I-O DATA Super High Speed (SD) [SDP-2G] Y
Kingston
Kingston (SD) [SD/2GBFE] Y
Kingston (SDHC) CLASS 4 [SD4/16GB] Y
Kingston (SDHC) CLASS 4 [SD4/32GB] Y
Panasonic
Panasonic PRO HIGH SPEED (SD) [RP-SDK02GJ1A] Y
Panasonic HIGH SPEED (SD) CLASS 2
[[RP-SDR02GJ1A]
Panasonic HIGH SPEED (SDHC) CLASS 4
[RP-SDM04GK1K]
Panasonic HIGH SPEED (SDHC) CLASS 4
[RP-SDM08GK1K]
Panasonic HIGH SPEED (SDHC) CLASS 4
[RP-SDM16GK1K]
Y
Y
Y
Y
Panasonic (SDHC) CLASS 4 [RP-SDP16GJ1K] Y
Panasonic (SDHC) CLASS 10 [RP-SDW16GJ1K] Y
Panasonic PRO HIGH SPEED (SDHC) CLASS 6
[RP-SDV04GK1K]
Panasonic PRO HIGH SPEED (SDHC) CLASS 6
[RP-SDV08GK1K]
pqi
pqi (SD) [QSDS-2G] Y
Y
Y
1-3
Page 20
1. OPERATIONAL OVERVIEW
Maker, Type Size
2 GB 4 GB 8GB 16 GB 32GB
San Disk
SanDisk (SD) [SDSDB-2048-J60] Y
SanDisk (SDHC) [SDSDBR-4096-J85] Y
SanDisk Ultra II (SDHC) CLASS 4 [SDSDRH-8192-903] Y
SanDisk Ultra II (SD) [SDSDH-2048-903] Y
SanDisk Ultra II (SDHC) [SDSDRH-4096-903] Y
SanDisk Extreme III (SDHC) [SDSDRX3-4096-903] Y
SanDisk Extreme (SDHC) [SDSDX3-016G-J31A] Y
SanDisk Extreme (SDHC) [SDSDX3-032G-J31A] Y
SILICON POWER
(SDHC) [SP016GBSDH006V10] Y
(SDHC) [SP032GBSDH006V10] Y
TOSHIBA
(SD) CLASS 4 [SD-B002GT4] Y
1-4
Page 21
1. OPERATIONAL OVERVIEW
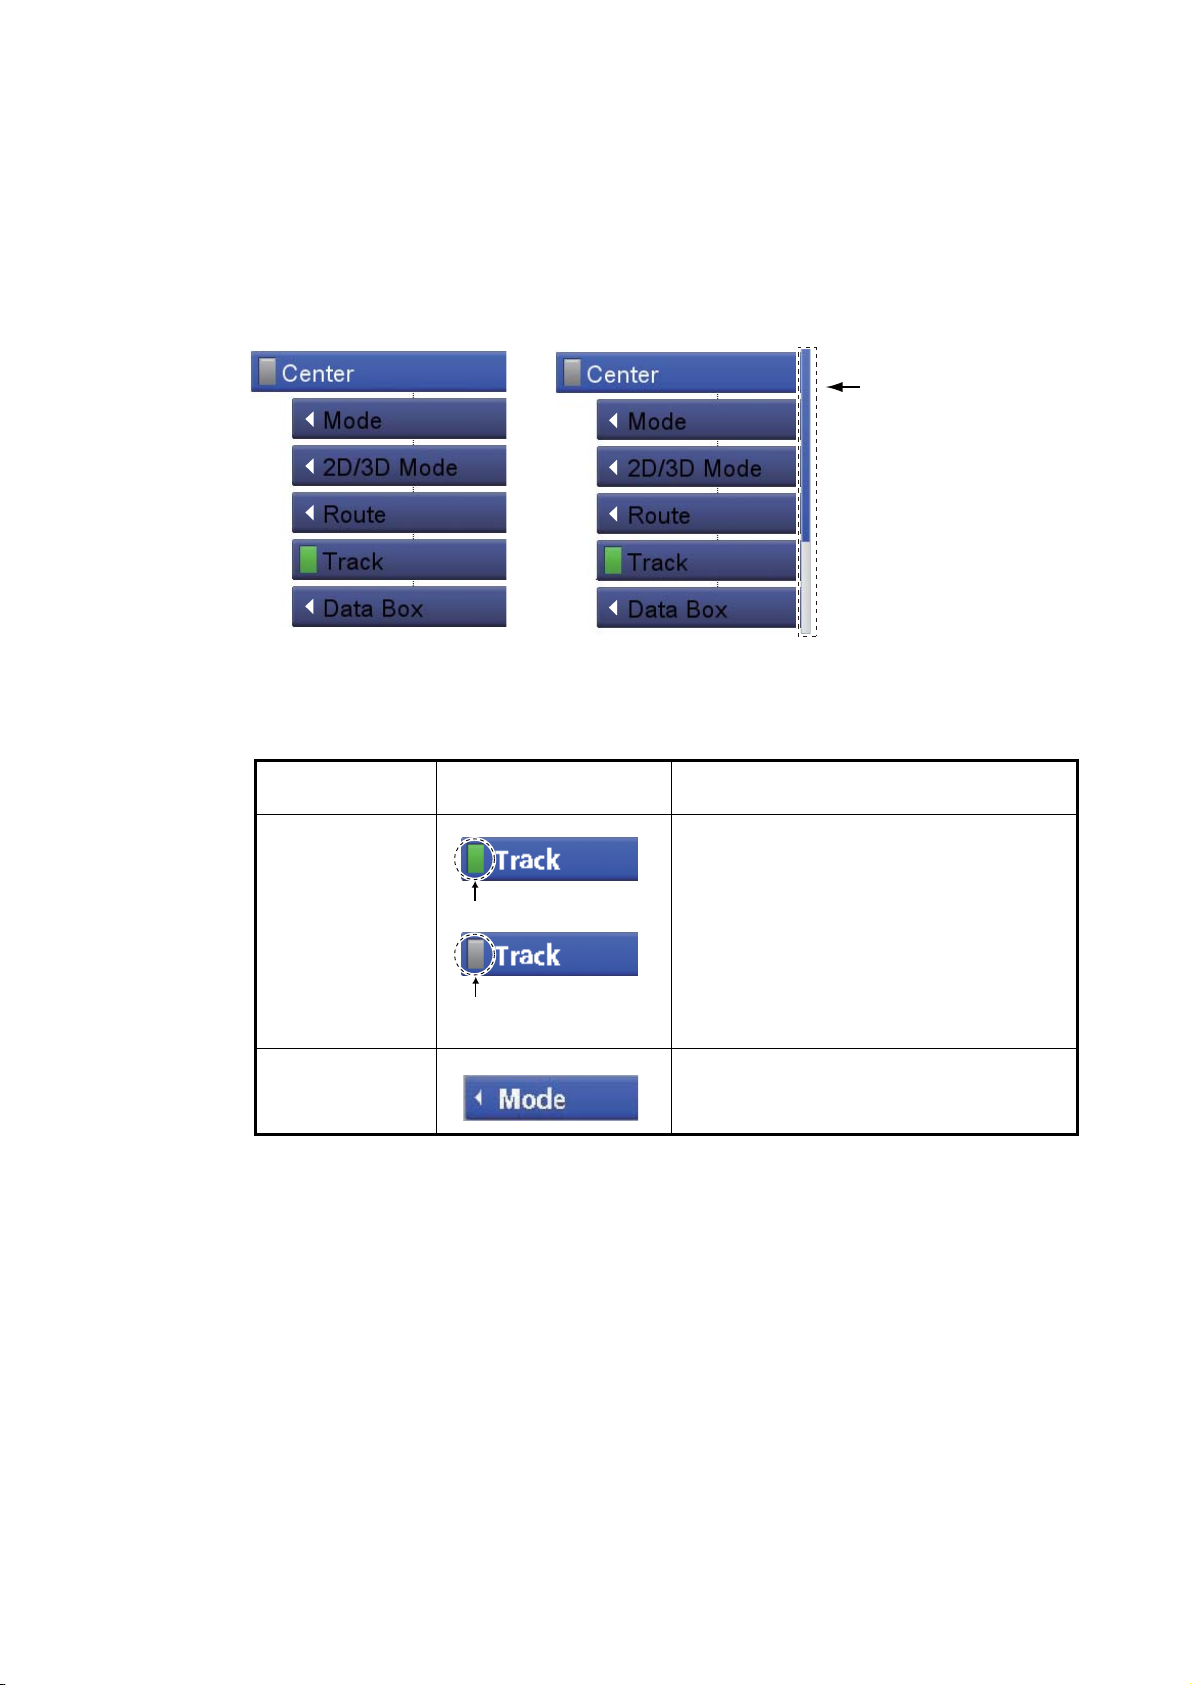
1.2 RotoKey
The main function of the RotoKeyTM is to display the RotoKey menu, a set of revolving
soft controls that change with the operating mode. There are two sets of RotoKey
menus: base and full. A short push of the key shows the base set for the current mode,
and a long push displays the full compliment of soft controls for the current mode.
When the full set is active, a scroll bar appears to show your location in the menu.
Base soft controls
TM
and Soft Controls
Full soft controls
Scroll bar
There are two categories of soft controls, toggle and drop-down list. Category is distinguished by an icon at the left edge of the soft controls.
Soft control
category
Toggle A soft control with a lamp is a toggle con-
Drop-down list A soft control with a left arrow has a drop-
To operate the soft controls, push the RotoKey
the key to select a soft control then push the key to do the function labeled on the soft
control. When you search through the RotoKey menu, the selected soft control is longer than other soft controls, its color is light blue and the soft control name is in white
characters. The soft controls automatically disappear from the screen if not operated
within approx. six seconds. To erase the soft controls manually, press the ESC/MENU
key.
Example Description
trol. The lamp is green when the function
is ON; gray when OFF.
Function ON (green)
Function OFF (gray)
down list that has a set of functions to
choose from.
TM
to show the RotoKey menu. Rotate
Note 1: Hereafter, this manual only implies the use of the RotoKey
operations. We write “Open the RotoKey menu then select [soft control name]” where
you would rotate and push the key to select and do a function.
Note 2: Where “key” is not preceded by a key name, this means the RotoKey
TM
in soft control
TM
.
1-5
Page 22
1. OPERATIONAL OVERVIEW
1.3 How to Turn the Power On or Off
To turn the power ON, press approx two seconds. Release when the FURUNO
logo appears. It takes approx. 25-30 seconds to start the system, in the sequence
shown below.
1) If some data is missing or is out of date, a message states the missing component.
Contact your dealer for details.
2) If a C-MAP chart card is inserted, chart information is checked to see if it is up to
date. If the chart is not up to date, the message "The chart data is out of data, and
may be unsafe for navigation, which could place you and others at risk..." If this
message appears contact your dealer to get up-to-date charts.
3) The unit beeps and shows the “Warnings - Limitations on Use” screen. Read the
information then push the RotoKey
To turn the power OFF, press until the message “Shutting down, please wait...”
appears.
TM
to start operation.
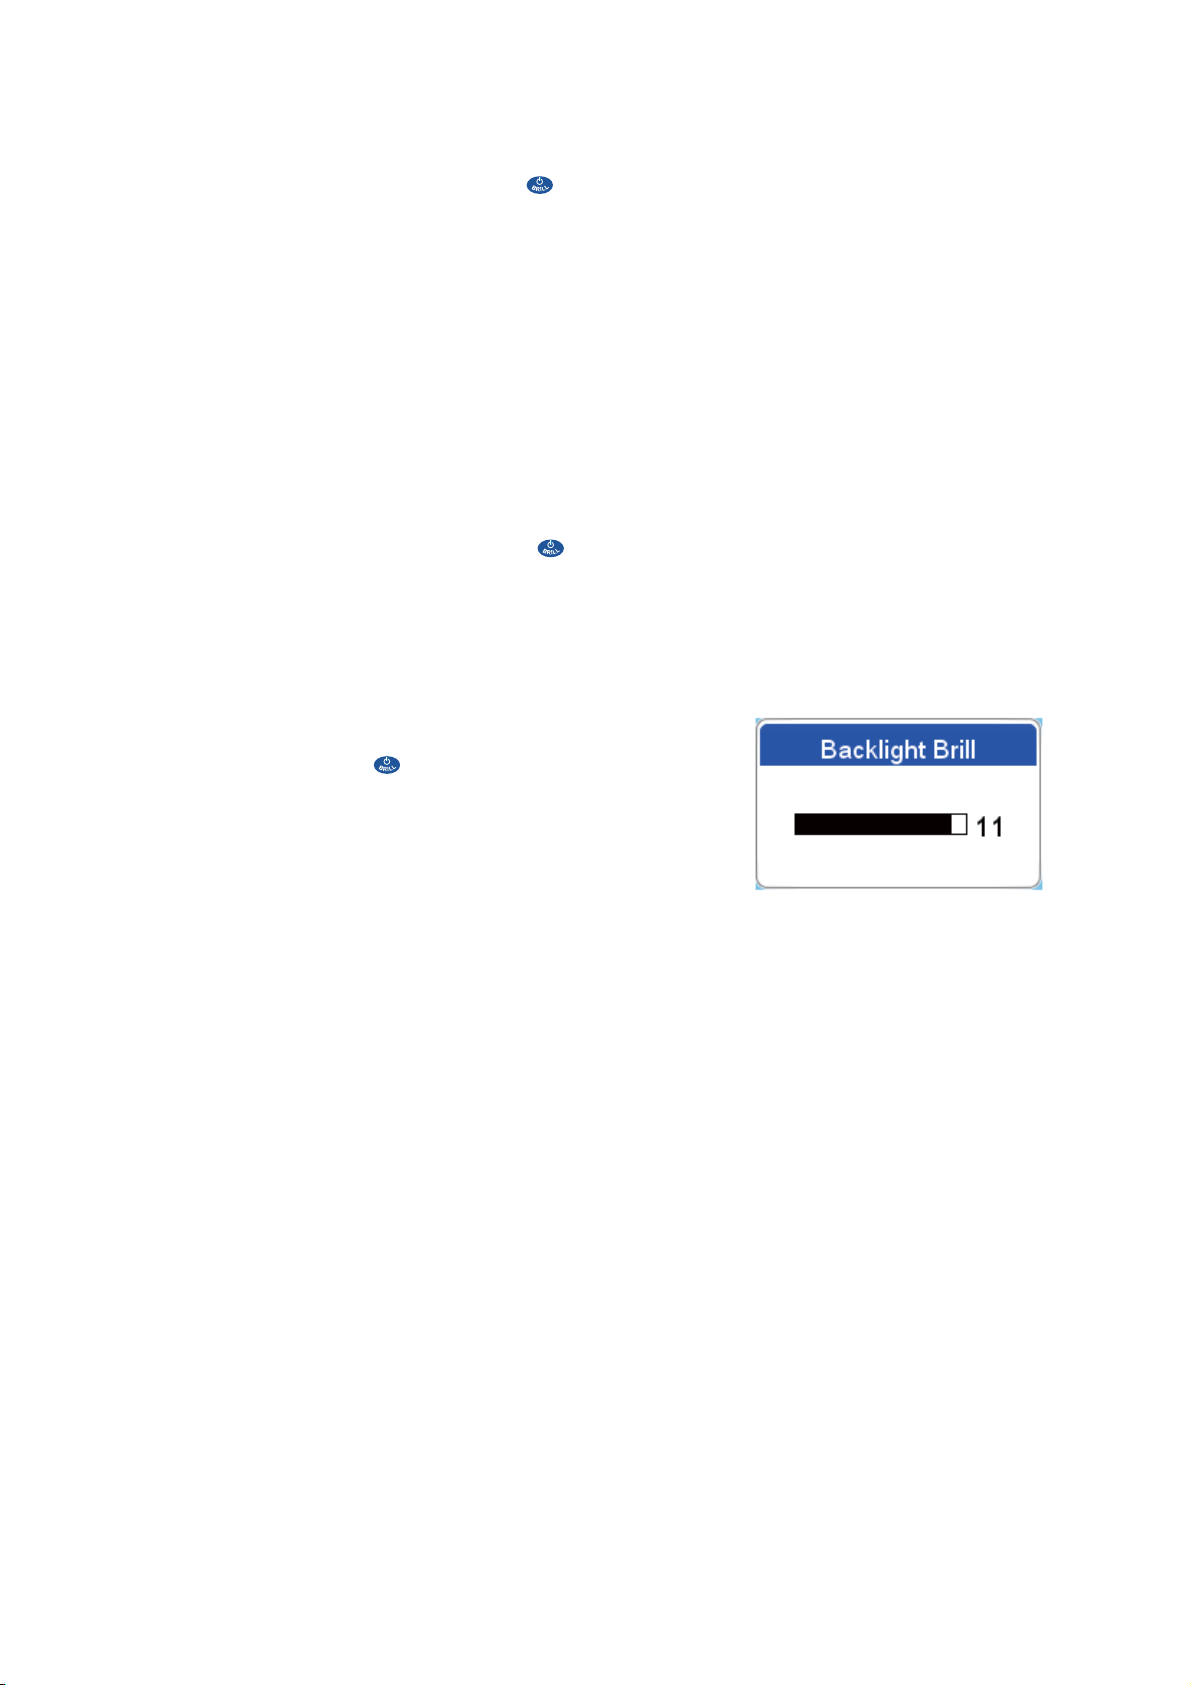
1.4 How to Adjust the Display Brilliance
You can adjust the display brilliance as follows:
1. Press the key to show the [Backlight Brill]
adjustment window.
2. Press the same key again to adjust the brilliance
cyclically. The window shows the current level
with analog and digital displays. The brilliance
can also be adjusted with the RotoKey
tate the key clockwise to increase the brilliance, or counterclockwise to decrease
the brilliance.
3. Press the ESC/MENU key to close the window.
TM
. Ro-
1.5 2D Plotter Displays
The plotter provides a small world map. More detailed charts for your area are optionally available. The plotter section has functions to enter waypoints, and create and
plan routes.
1-6
The plotter receives position information from the internal GPS receiver. Your position
is marked on the screen with the own ship icon. You can change the shape of the icon
from the menu. Waypoints and routes you have entered are shown on the display. You
can move, delete and edit the waypoints and routes from a context-sensitive menu or
through the menu.
The plotter display also
• Plots the track of your boat. • Controls alarm functions.
• Measures distances and bearings. • Follows routes.
• Marks man overboard (MOB) position.
Page 23
Compass
COG line
(black)
1. OPERATIONAL OVERVIEW
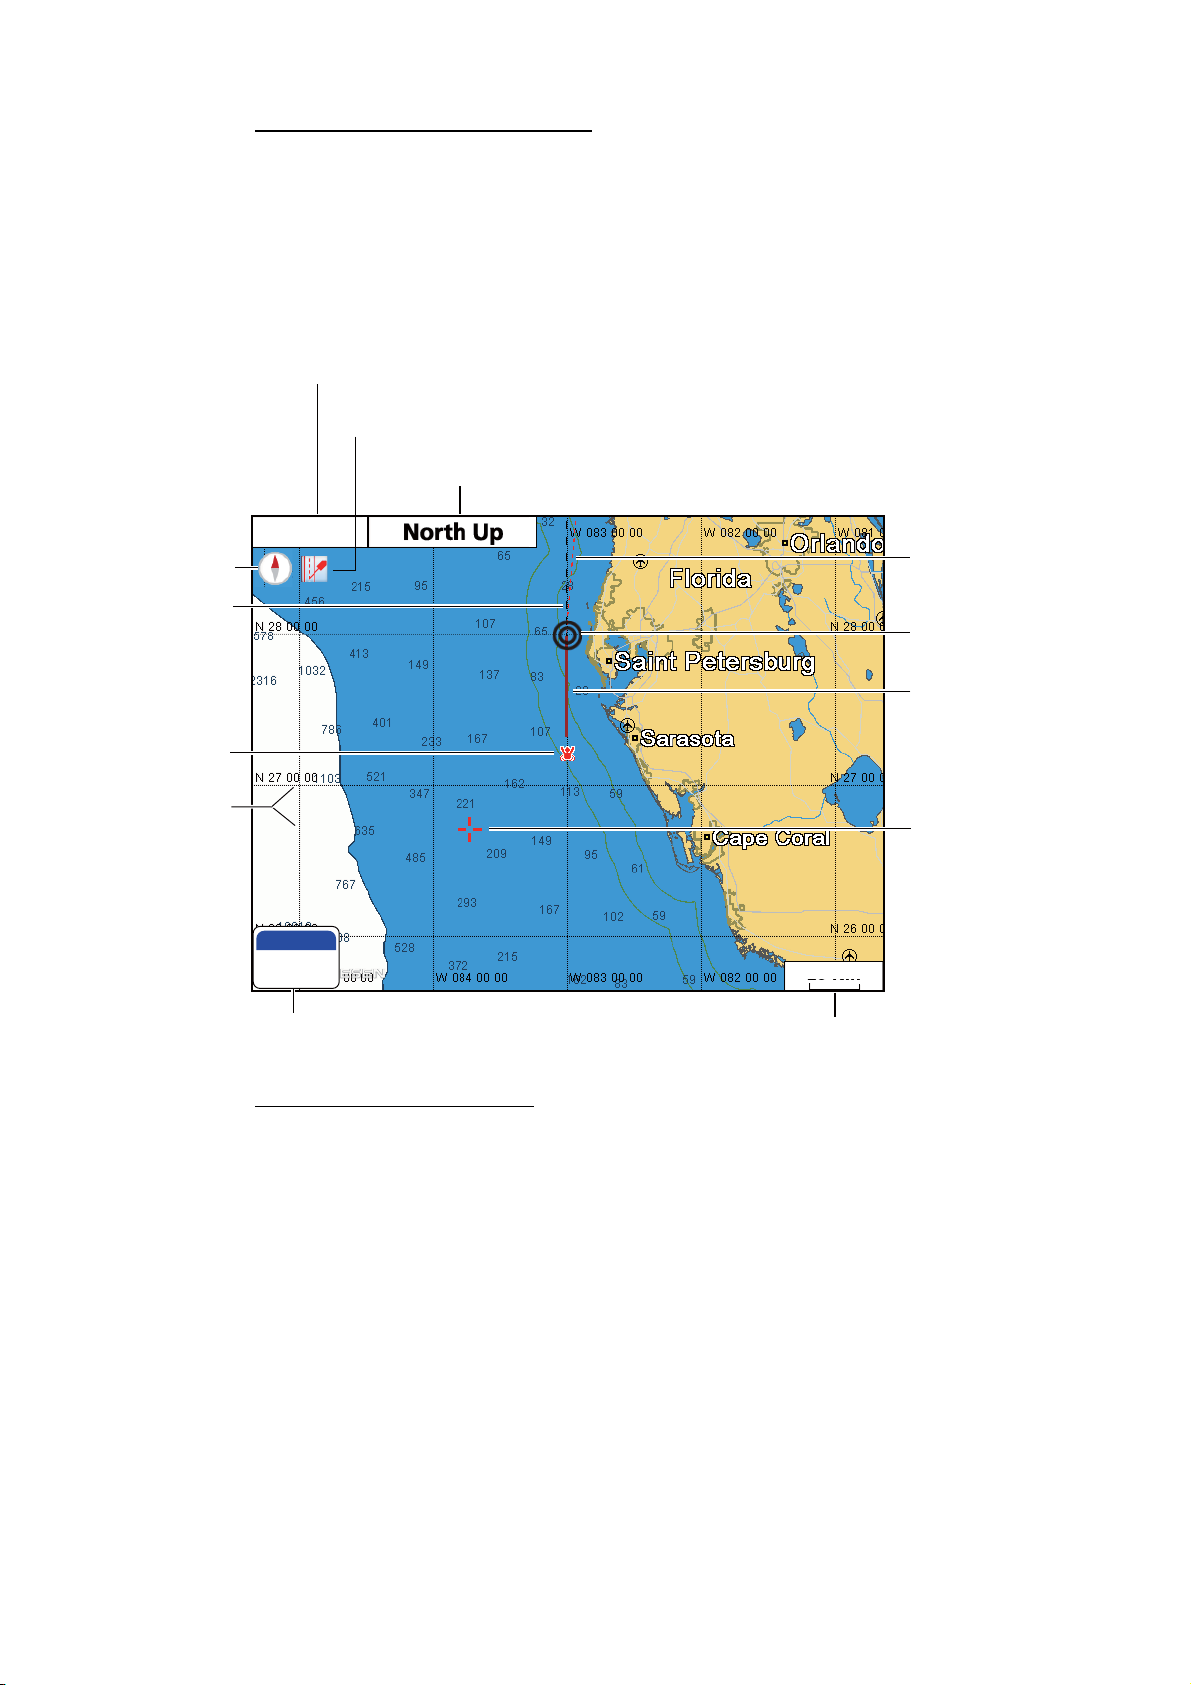
2D plotter display, vector chart
A vector chart is a series of points and lines that make up the features on a chart. Vector charts look computer generated. Details on the chart can be turned on and off. Objects on the chart can be clicked on to learn more details. Depths can be monitored to
warn before grounding. When zooming in and out of a vector chart only the geographical features grow larger or smaller where text keeps it's same size and orientation.
Vector charts lack most topographical features.
Position fix state*
Alarm icon
Orientation mode (North Up, Course Up,
Auto Course Up, Heading Up)
GPS 3D
Headingline
(red dashed line)
Own ship
marker (black)
MOB
mark
L/L grid
MOB
180°T
14.2 NM
MOB box
(Bearing and range to MOB position)
*Position fix state indications
GPS 2D: 2D position fix
GPS 3D: 3D position fix
GPSW2D: WAAS 2D position fix
GPSW3D: WAAS 3D position fix
NO FIX: No position data
SIM: Simulator mode
Track
(default color
is red)
Cursor
(inactive, red)
20 NM
Range scale
1-7
Page 24
1. OPERATIONAL OVERVIEW
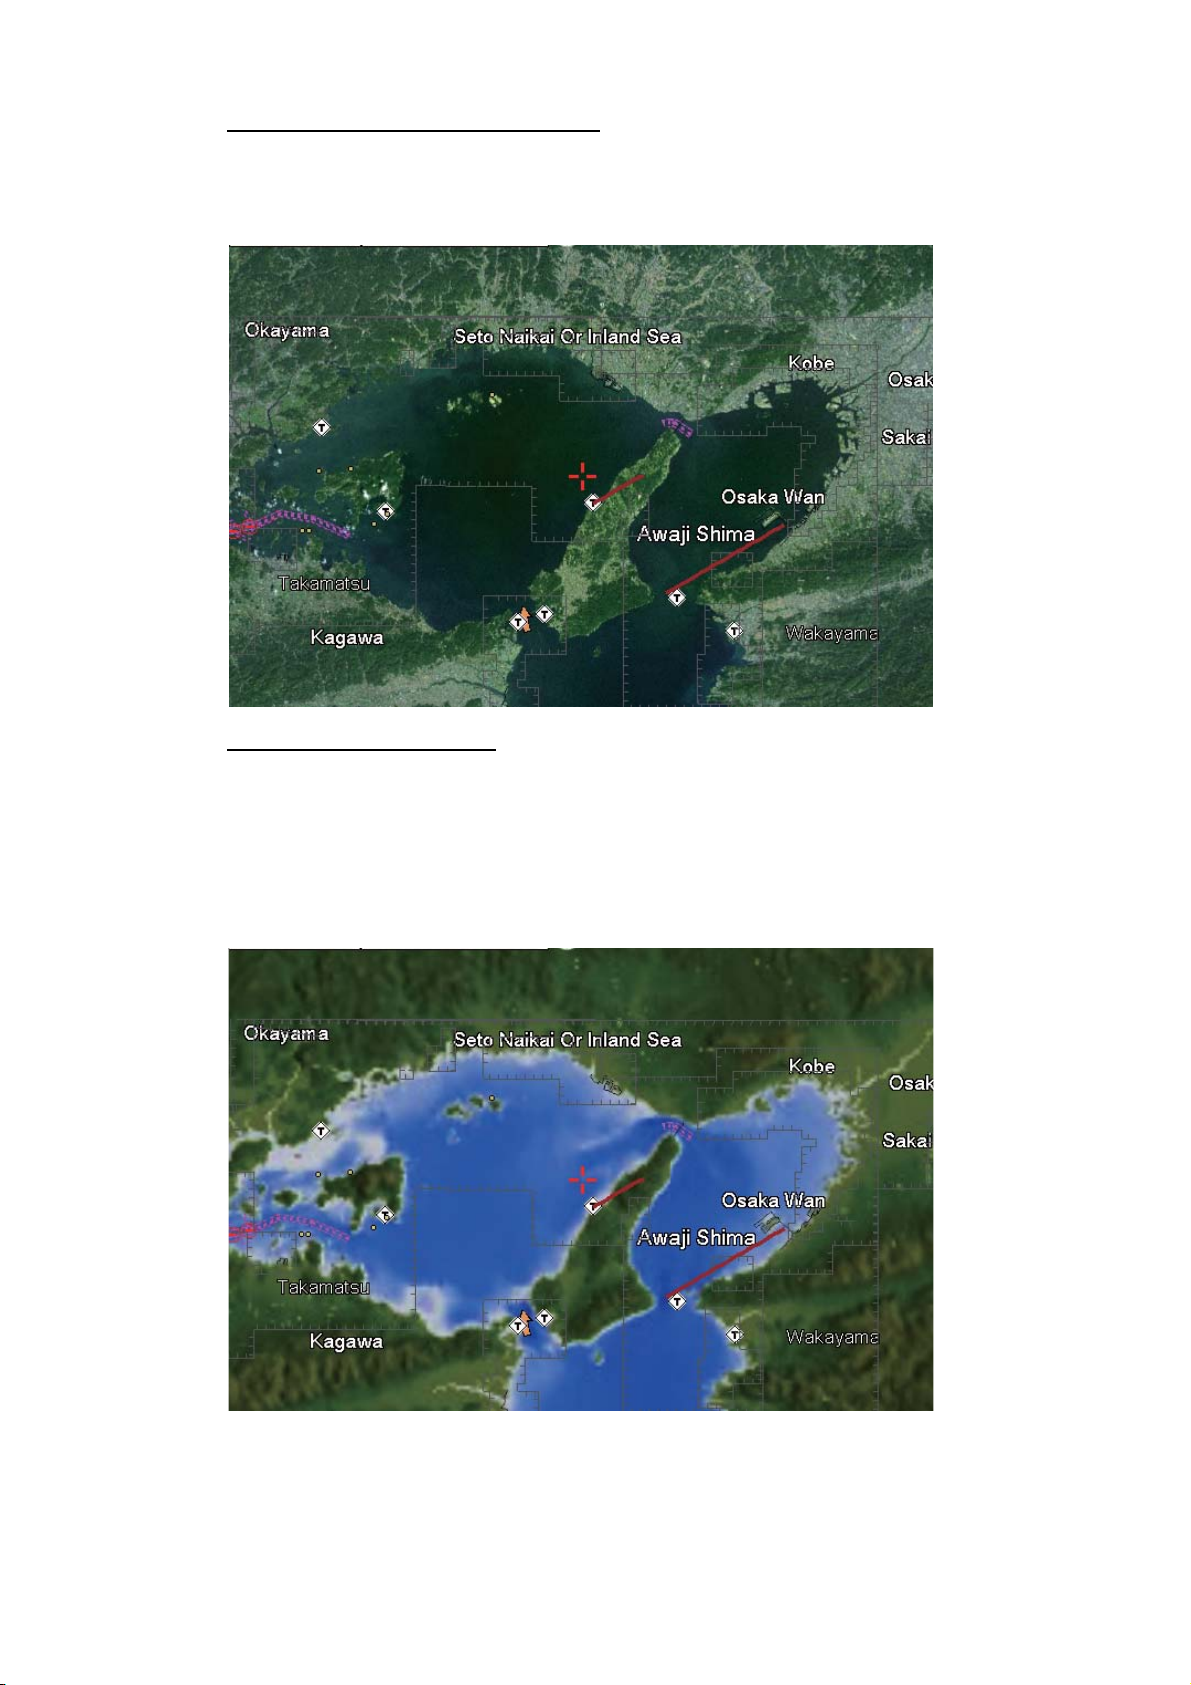
2D plotter display, vector/satellite
The vector chart plus a satellite photo. See chapter 6 for how to adjust the satellite display.
2D plotter display, raster
A raster chart is a direct copy or scan of an existing paper chart. Raster charts look
identical to paper charts. All information contained within the chart is printed directly
on it. What you see is what you get. When zooming in and out of a raster chart everything on the chart grows larger or smaller. When rotating a raster chart every thing on
the chart rotates.
1-8
Page 25
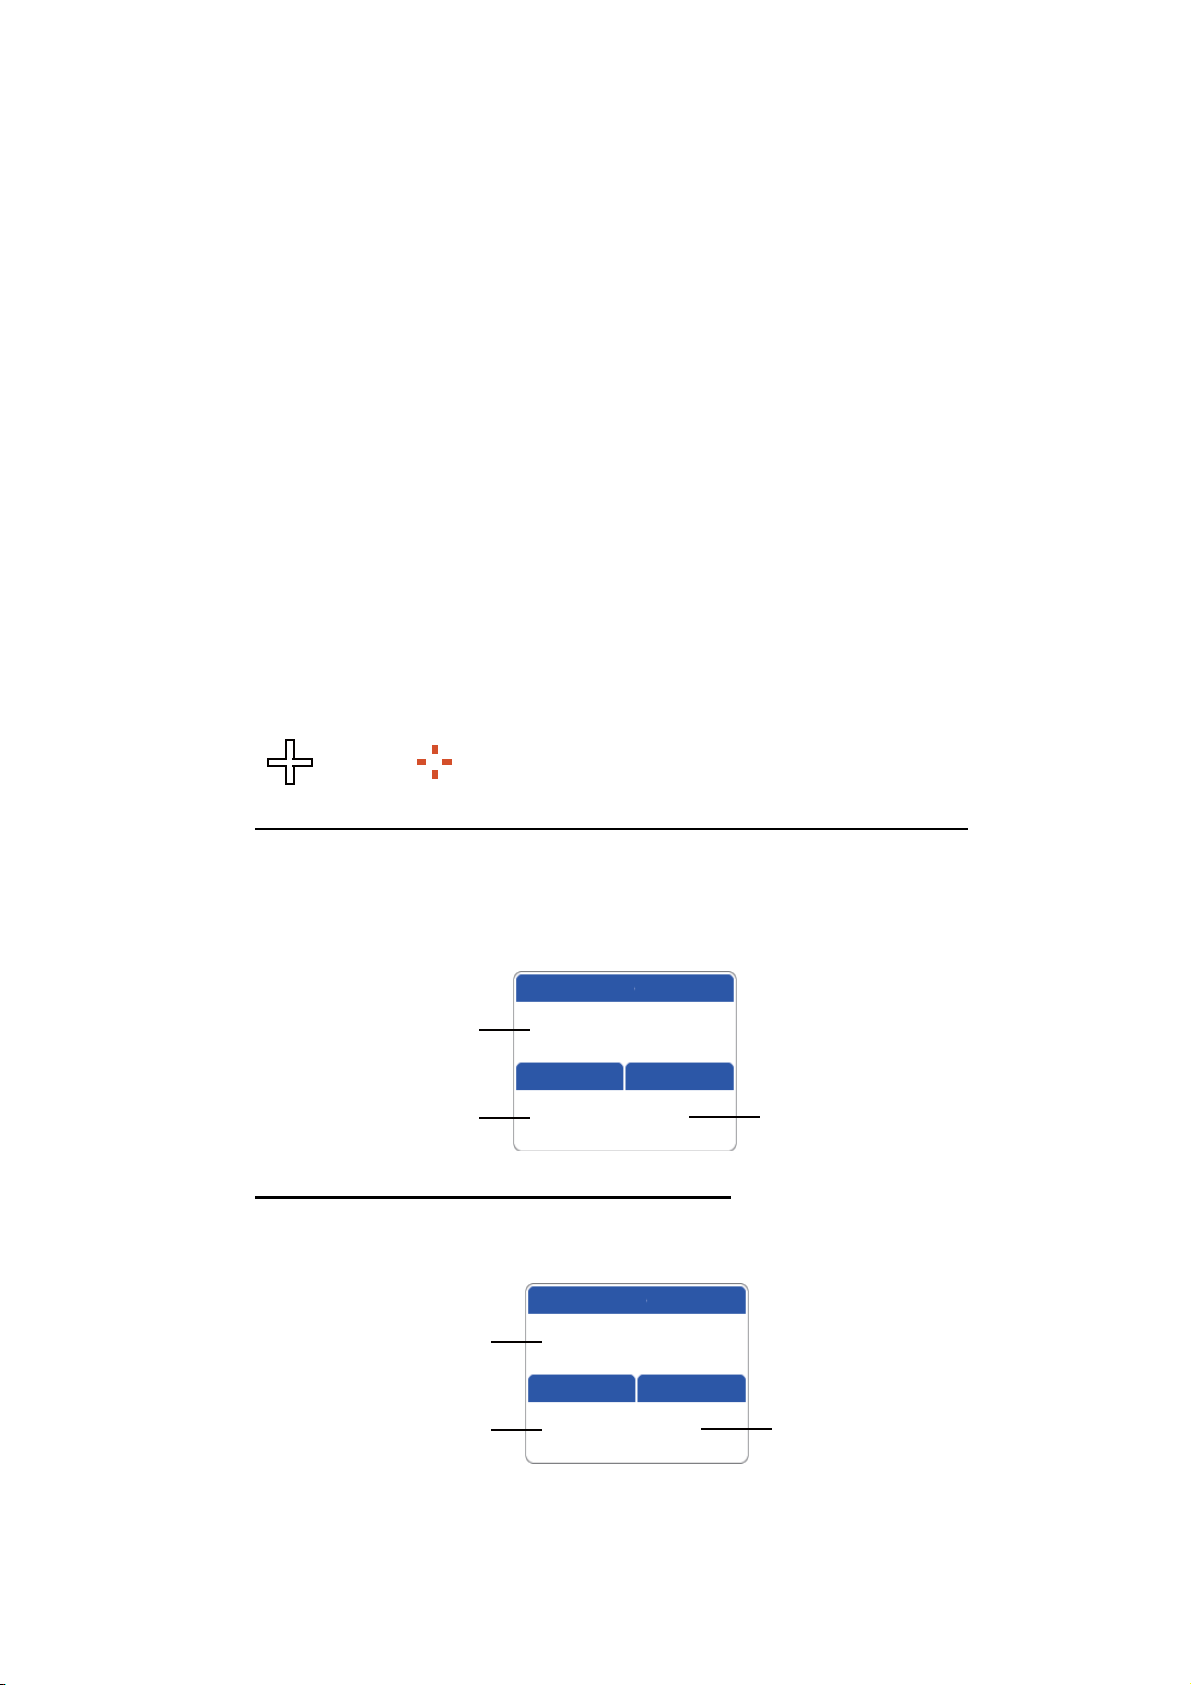
1.6 The Cursor
The cursor has the functions shown below.
• Find, when put on respective item:
• Position, range and bearing to cursor location
• Point information
• Route information
• Track information
• AIS target information
• DSC information
• Tide information
• Object information
• Select a position for a waypoint on the plotter display.
• Select an item. For example, a waypoint on the plotter display.
The appearance of the cursor depends on its state - active or inactive.
1. OPERATIONAL OVERVIEW
To move the cursor, press any of the four arrows on the CursorPad. The cursor
moves in the direction indicated on the pressed arrow.
: Active : Inactive (red)
How to find cursor position, range and bearing to cursor position
Press any of the four arrows on the CursorPad to move the cursor in the direction indicated on the pressed arrow. The cursor position and the distance and bearing from
your boat to the cursor position are displayed.
Position
Cursor position in
latitude and longitude
Distance to
cursor position
43°59.2157'N
135°16.6498'E
DST
NM
BRG T
10.5 185
°
Bearing to
cursor position
How to find current position, SOG and COG
Put the cursor on the own ship icon to find current position, SOG and COG.
Cursor position in
latitude and longitude
Speed over
the ground
Position
43°22.1834'N
134°26.3465'E
SOG kn
COG T
12.2 155
°
Course over
the ground
1-9
Page 26

1. OPERATIONAL OVERVIEW
1.7 Navigation Data Boxes
The navigation data boxes, displayed at the bottom of the screen, show various navigation data fed from the sensors connected to the display unit. Two or four boxes can
be displayed and you can freely change the data shown in each box. The data that
you can show depends on your system configuration. The boxes can be shown or hidden with the [Nav Data] soft control.
kn
Note: Waypoint name, distance to WPT, bearing to WPT, XTE, TTG and ETA are not
available unless you are navigating to a point or route. Bars (--) are shown in the respective box when the data is not available.
1.7.1 How to select the data to display in a box
1. Open the full RotoKey menu then choose [Select Data]. The background color of
all but one of the boxes is grey.
Box not greyed out is
currently selected box.
kn
TM
2. Rotate the RotoKey
to select the data box to change then push the key to show
the [Select Data] (data category) window.
3. Select a data box category, and a window with choices relevant to your selection
appears.
1-10
DST
BRG
Navigation
Speed/
Bearing
4. Select the data desired.
Depth
Environment Wind
Page 27
1. OPERATIONAL OVERVIEW
ACTIVE
ACTIVE
AC IVE
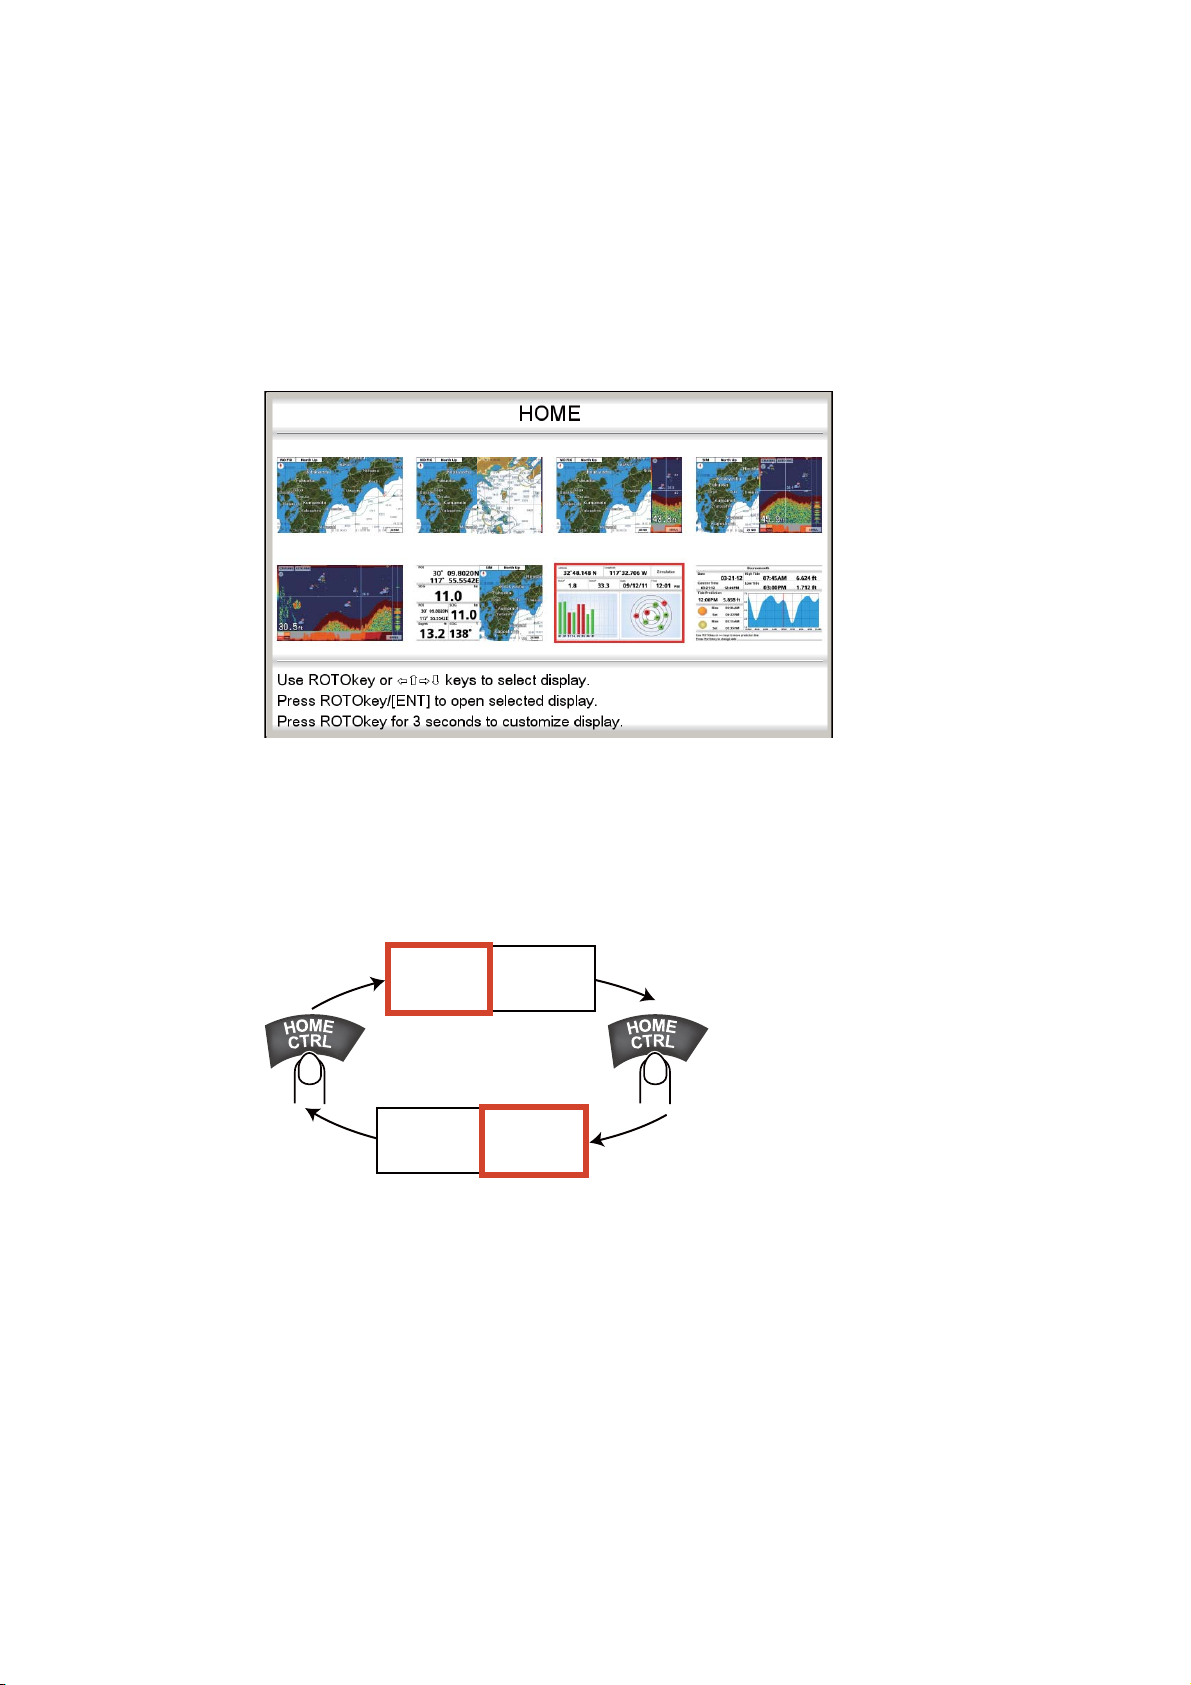
1.8 Home Screen (Display Selection)
1.8.1 How to select a display
The home screen has eight displays from which to choose. Press the HOME/CTRL
key to show the home screen. Operate the CursorPad or rotate the RotoKey
select a display. The current selection is circumscribed with a red rectangle. Press the
RotoKey
TM
or ENT key to confirm your selection.
TM
to
1.8.2 How to switch the active screen
In multi-split screens, you can switch the active screen with the HOME/CTRL key.
Long-press the key to select the screen to make active. The active screen is circumscribed with a red rectangle.
ACTIVE
M
Long
press
CTRL
ACTIVE
CTRL
Long
press
1-11
Page 28
1. OPERATIONAL OVERVIEW
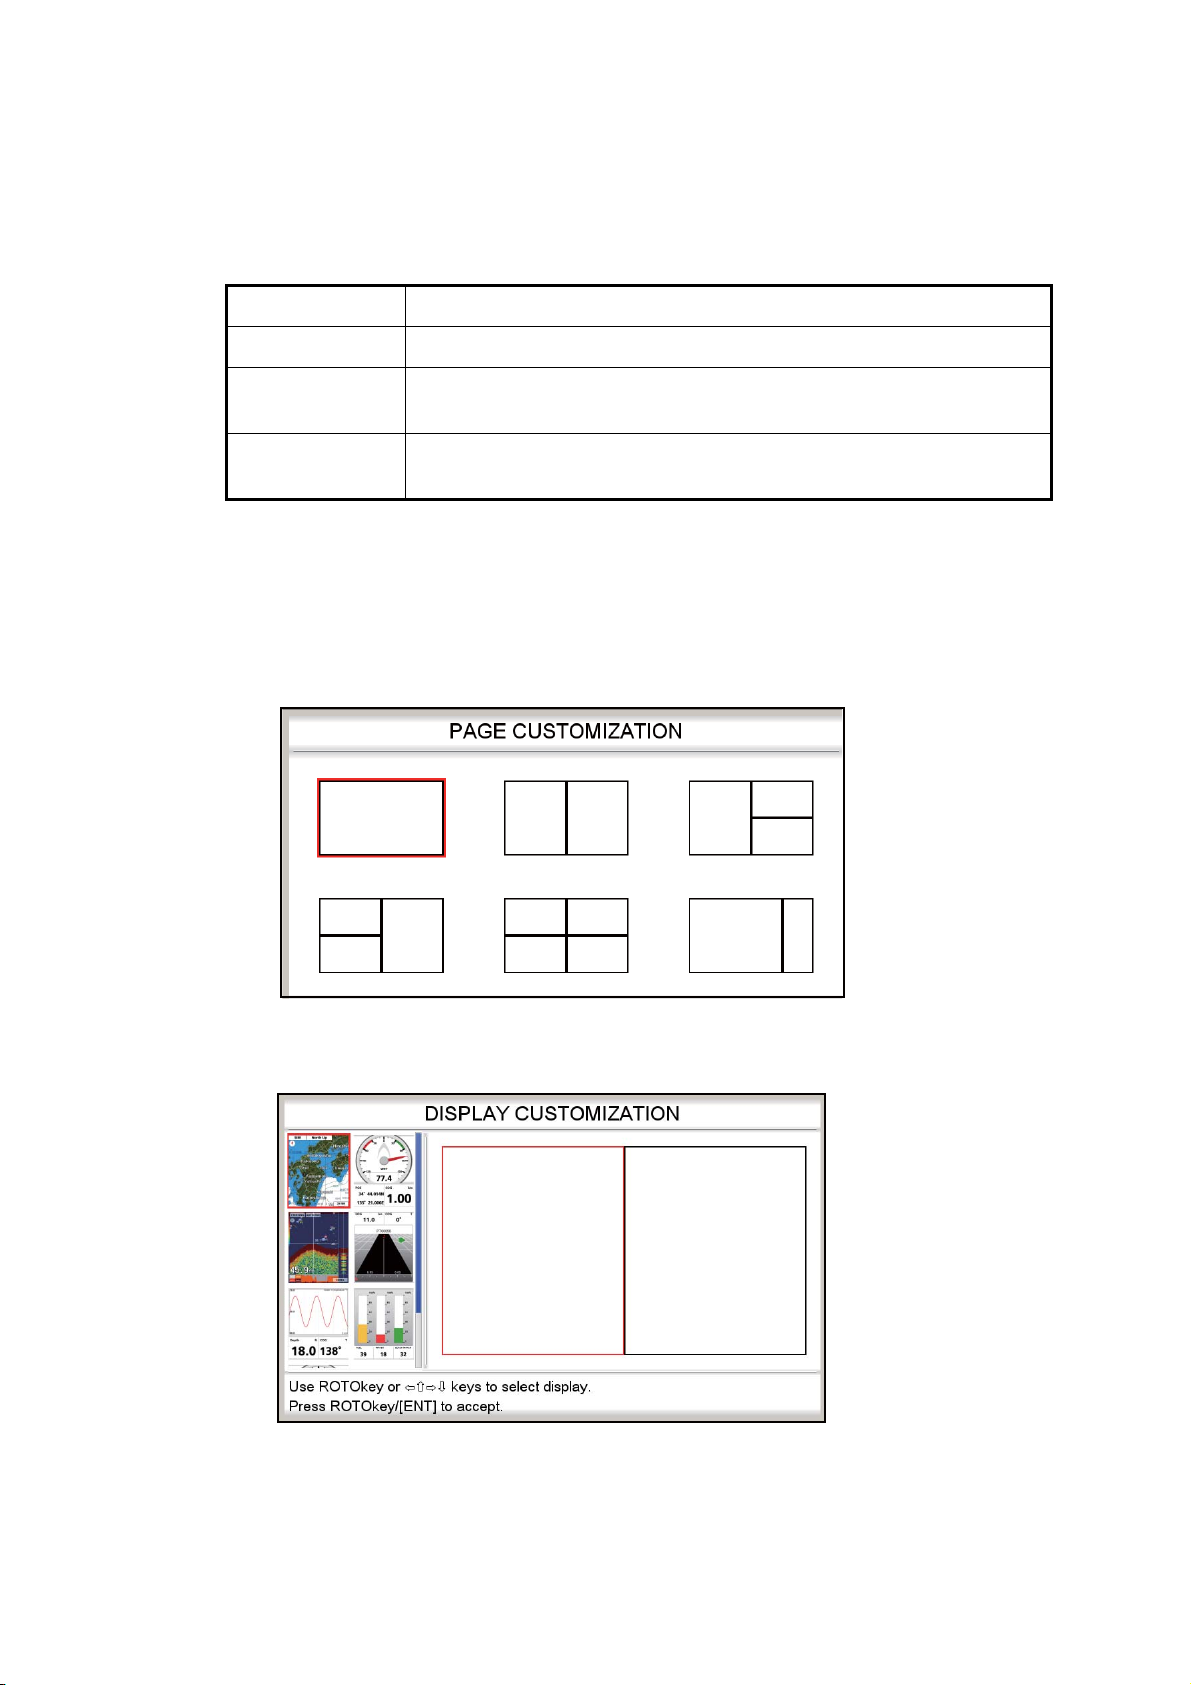
1.8.3 How to customize the home screen
The home screen has seven screens that you can customize. (The full-screen plotter
display cannot be customized. If you try to customize this display, the message “Can’t
customize this display.” appears.) You can split the screen in up to four separate segments. In each segment you can select the following displays:
Screen Displays available
Single screen Plotter, fish finder, tide and celestial, GPS status
Half screen Plotter, fish finder, highway, wind angle meter, meter (speed, water
temperature/temperature, engine), graph, tank
Quarter screen Navigation data, steering, wind angle meter, meter (same choices as
for half screen), graph, tank
Follow the procedure below to customize a home screen. As an example, the procedure shows how to put the plotter display and fish finder display on the halves screen.
1. Press the HOME/CTRL key to show the home screen.
TM
2. Use the RotoKey
3. Long-push the RotoKey
to select the screen to customize.
TM
to show the [PAGE CUSTOMIZATION] screen.
TM
4. Select the division desired then push the RotoKey
. For example, select the
halves screen. The [DISPLAY CUSTOMIZATION] screen appears.
The rectangle cursor (red) in the screen selection area circumscribes the screen
division currently selected. If necessary, use the RotoKey
TM
to select a screen
division.
1-12
Page 29
1. OPERATIONAL OVERVIEW
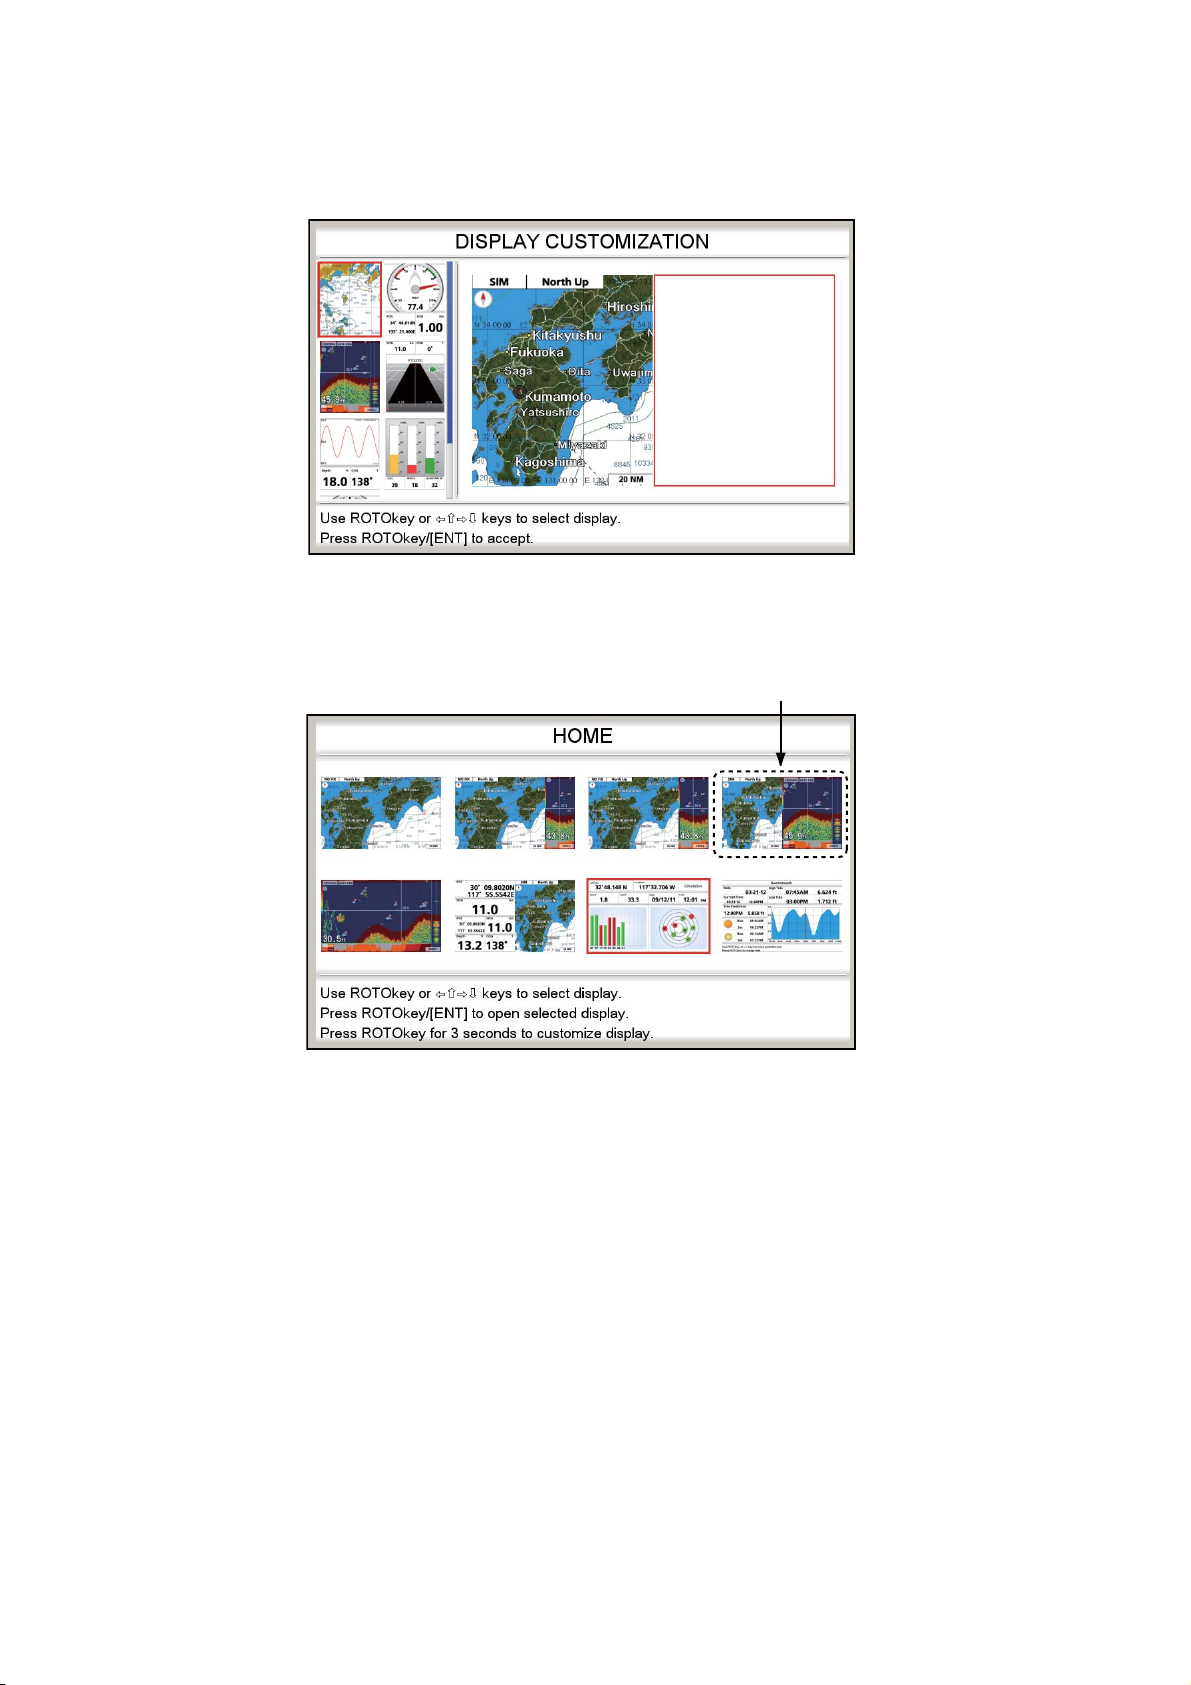
5. Select a display then push the RotoKeyTM. For example, select the plotter display. The chosen display appears at the location selected and the rectangle cursor moves to the adjacent screen.
6. Select a display for the right half then push the RotoKey
TM
. For example, select
the fish finder display. Control is returned to the home screen, where you can see
the result of your selection.
Plotter, fish finder display
1-13
Page 30
1. OPERATIONAL OVERVIEW
1.8.4 Description of home screen displays
Full screen displays
Plotter: See page 1-7.
Fish finder: See chapter 7.
Tide & Celestial: Your plotter provides for calculation of the tide heights for any date.
Additionally this display shows the time of sunrise, sunset, moonrise and moonset.
See section 1.17.
GPS status display: The GPS status display shows the location and RX signal
strength of each satellite being received. See section 12.4.
Half screen displays
The half screen displays provide the plotter display, highway display, navigation data,
and navigation data plus a graphic display (graph or meter). In most displays the data
can be changed. See the end of this section for how to change data.
Plotter: See page 1-7.
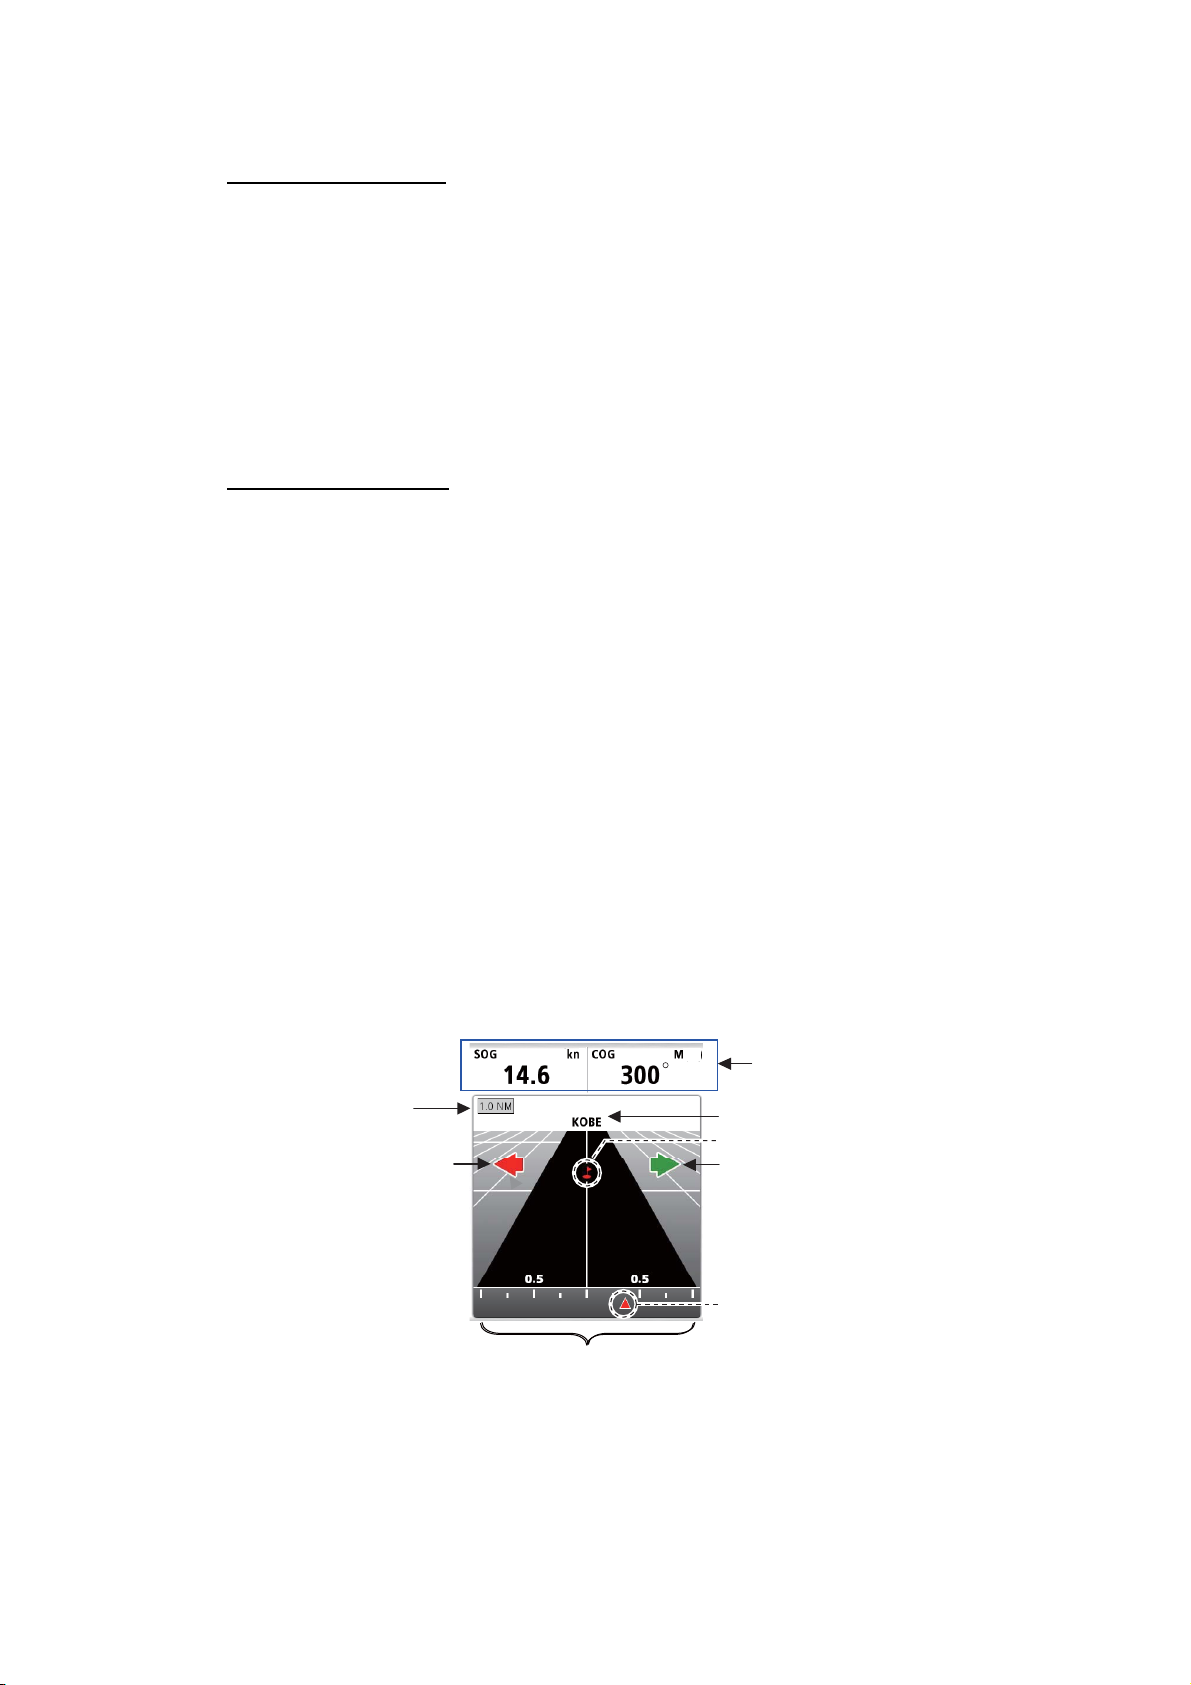
Highway: The highway display provides a graphic presentation of your boat’s track
along intended course, and is useful for monitoring ship's progress toward a waypoint.
TM
You can zoom in and zoom out the display by rotating the RotoKey
. The vertical
line at the center of the screen is your intended course and the name of the waypoint
you are steering to is at top of the line. Steer your boat so that the own ship marker in
the XTE scale stays near zero. If you go off course, the direction to steer to return to
your course is indicated with the color-coded steer direction arrow. The arrow is red
when you should steer to port; green when you should steer to starboard. The width
of the navigation lane (black area in the figure below) and the XTE (cross-track error)
range scale are equal to the XTE alarm setting. In the example illustration, the boat is
off course to the starboard side by approx 0.3 nm. Rotate the RotoKey
TM
the display range.
Navigation data
Display range
Steer direction arrow (red)
(Steer left to keep course.)
Note: Both steer direction
arrows are not displayed at the
same time in actual operation.
They are displayed here for
demonstration purpose.
XTE range scale
(equal to XTE alarm range)
(selectable)
WPT name
Waypoint (red)
Steer direction arrow (green)
(Steer right to keep course.)
Own ship marker (red)
to change
1-14
Page 31

1. OPERATIONAL OVERVIEW
Wind meter+navigation data x2: The wind meter provides
analog and digital indications of wind angle. The wind meter
is fixed; however, the two boxes of navigation data can be
changed.
Meter+navigation data x2: This display provides a meter
plus two navigation data boxes. The meter and boxes can be
changed. The example at right shows the appearance of the
SOG meter.
kn
kn
kn
Graph+navigation data x2: The graph (depth, water temperature, air temperature, atmospheric pressure, SOG, wind
speed) plots selected data in a five-minute period. The navigation data indications can be changed freely.
Tank level: The tank level of fuel, water and black water are
shown in both analog and digital formats. The analog indication is colored according to tank level as follows:
Tank level
Color
Fuel, water Black water
Green Equal to or greater
than 40%
Equal to or less
than 60%
Yellow Between 20% and
39%
Between 61% and
80%
Red Less than 20% Greater than 80%
1-15
Page 32

1. OPERATIONAL OVERVIEW
Quarter screens
The figure below shows the available quarter screens. Like with the half screens you
can select the navigation data to display in a quarter screen.
㫂㫅
㫂㫅
㫂㫅
Navigation data x1 Navigation data x2 Navigation data x3
㫂㫅
㫄
㫂㫅
㪫
Navigation data x4 Steering Wind angle
㫂㫅
Meter x4
㪚
GraphMeter x1 (ex. SOG)
㫄
㪚
Graph, navigation data x2
㪚
Navigation data x2, graph Tank
1-16
Page 33

1. OPERATIONAL OVERVIEW
How to select the data to display in a quarter screen, half screen navigation data
1. Display a home screen that has a quarter screen or a half
screen with navigation data.
2. Long press the HOME/CTRL key to select the data display to
change. The selected indication is circumscribed with a red
rectangle.
3. Choose [Select Data] from the RotoKey menu.
4. Rotate the RotoKey
push the RotoKey
TM
to select the indication to change then
TM
. The [Select Data] window shows the
data categories available.
5. Rotate the RotoKey
TM
to select a category then push the key.
The right figure shows the choices available with [Navigation].
6. Select desired data.
Engine indications
The following engine indications are available, in the quarter screen.
• Engine boost pressure • Engine trim
• Engine coolant pressure • Fuel pressure
• Engine load • Fuel rate
• Engine oil pressure • Total engine hours
• Engine oil temperature • Transmission oil pressure
• Engine speed • Transmission temperature
• Engine temperature
DST
DST-E
BRG
Engine instance number
The engine instance number appears on all engine-related indications.
Engine Instance No.
E-SPD 2 RPM
0: Single engine, or PORT engine with 2 or 3 engines
1: STARBOARD engine with 2 engines,
or CENTER engine with 3 engines
2: STARBOARD engine with 3 engines
Note: This is the standard numbering method,
Different methods can be applied.
1-17
Page 34

1. OPERATIONAL OVERVIEW
1.9 Display Range
You can change the chart scale to change the amount of information shown, or zoom in or out at the location you select,
in the plotter and steering displays. The selected chart scale
appears at the bottom right-hand position on the screen. The
available ranges depends on latitude and chart area.
20 NM
To select a display range, rotate the RotoKey
to increase the range; counterclockwise to decrease the
range.
1.10 Orientation Mode
The chart can be shown in head-up, north-up, courseup and auto course-up. Select an orientation mode
from the RotoKey menu: Select [Mode] followed by
[Head Up], [North Up], [Course Up] or [Auto Course
Up]. The selected mode appears at the top right-hand
position.
Description of orientation modes
Head-up: Displays the chart with the current compass heading of your boat at the top
of the screen. The heading data from a compass is required. When the heading
changes, the ship icon remains fixed, and the chart picture rotates according to heading.
North-up: North is at the top of the screen. When your heading changes, the ship icon
moves according to heading. This mode is for long-range navigation.
TM
. Clockwise
Range scale
Orientation mode
GPS 3D
Course-up: The chart picture is stabilized, and shown with your current course (over
ground) at the top of the screen. The ship icon moves with the heading. If you select
a new course, the picture resets to display the new course at the top of the screen. If
no destination is set, the course is upward on the screen at the moment course-up is
selected.
PT00001
5 NM
1-18
Page 35

1. OPERATIONAL OVERVIEW
Auto course-up: The course or heading is at the top of screen at the moment the auto
course-up mode is selected.
PT00001
1.11 How to Move the Chart
Move the chart in the following conditions.
• Your boat is not in the current area.
• Take a look at another area.
• Enter a point at another location.
To move the chart, press and hold down the CursorPad to move it to an edge of the
display. The chart shifts in the direction opposite to the arrow pressed.
To return your boat to the screen center, select [Center] from the RotoKey menu.
5 NM
1-19
Page 36

1. OPERATIONAL OVERVIEW
1.12 Menu Operation
This section shows you how to operate the menu. There are eight menus, [General],
[Map], [Plotter], [Alarms], [System], [Fish Finder], [Instruments] and [Interface].
1. Long-push the ESC/MENU key to show the main menu.
TM
2. Rotate the RotoKey
play that menu. (A menu can also be selected with the CursorPad.) For example,
select the [General] menu.
3. Rotate the RotoKey
the corresponding options window. For example, select [Font Size] and
the options window shown right appears.
4. Rotate the RotoKey
Some menu items require entry of alphanumeric data. See the procedure below.
to select a menu then push the key or the ENT key to dis-
TM
to select a menu item then push the key to show
TM
to select an option then push the key to confirm setting.
Large
Small
1-20
How to enter alphanumeric data
1) Use the right and left arrows on the CursorPad to select the digit or character
to change.
2) Use the up and down arrows on the CursorPad to select a numeric value.
3) Repeat steps 1) and 2) to enter remaining numeric data.
Page 37

4) Press the ENT key to save the data.
5. Press the ESC/MENU key to close the menu. (Several presses may be required
depending on your location in the menu.)
Note: Hereafter, this manual only implies the use of the RotoKey
tions. We write “Select [menu name, menu item or menu option]” where you would rotate and push the key to select and set a menu item.
1.13 Object Information
1.13.1 Simple information
Simple information is available for points, track, routes, objects, AIS targets, DSC
marker and tide. Simply put the cursor on the item for which you want to find information. The figure below shows simple information for a point, track, route and chart object.
1. OPERATIONAL OVERVIEW
TM
in menu opera-
PT00011
43°59.2157'N
135°16.6498'E
DST NM BRG
T
Track Information
Time 02-24-12 12:46PM
Temp 11.3ºF
Depth 85.7 m
Fish size 21, 18, 15, 07 cm
Bottom type Mud 60%
10.5 185°
Point information
Name
Comment
Route information
1.13.2 Detailed information
Detailed information is available for points, routes and chart objects. Put the cursor on
the item for which you want to find detailed information then press the ENT key to
show the context-sensitive menu. Select one of the following depending on your selection:
• Point: [DETAILED]
Track information
RT0001
12:20PM 03-16-12
Tower White 85 Feet
Flashing(1) White. 15 Seconds
85 Feet 24 Miles
Object information
(chart object)
• Route: [INFO]
• Chart object: [FULL INFO]
The right figure shows detailed information for a
point.
Name PT0001
Position 34º41.006N
135º41.629E
Time 02-24-12 12:46PM
Temp 11.3º
Depth 85.7 m
Fish size 21, 18, 15, 07 cm
Bottom type Mud 60%
Comment FURUNO
Detailed point information
1-21
Page 38

1. OPERATIONAL OVERVIEW
1.14 Context-Sensitive Menus
The context-sensitive menus let you quickly access the functions related to the cursorselected item. Select an applicable item then press the ENT key to show the related
context-sensitive menu. Use the RotoKey
shows the context-sensitive menus available in each category.
Item Context-sensitive menu Description
Point [MOVE]: Move the point selected.
MOVE
DELETE
EDIT
GOTO
DETAILED
EASY ROUTING
[DELETE]: Delete the point selected.
[EDIT]: Edit the point selected.
[GOTO]: Go to the point selected.
[DETAILED]: Find detailed information about the
point selected.
[EASY ROUTING]: Get easy routing calculations
to the point selected.
TM
to select a function. The table below
Point (set as
destination)
STOP
RESTART
DETAILED
[STOP]: Stop navigating to the point selected.
[RESTART]: Restart navigation to the point se-
lected.
[DETAILED]: Get detailed information about the
point selected.
Point in
Route (active route)
Point in
Route (inactive route
MOVE
SKIP
ACTIVATE FROM
MOVE
DELETE
GOTO
EASY ROUTING
[MOVE]: Move the point selected.
[SKIP]: Skip the point selected.
[ACTIVATE FROM]: Start navigating from the
point selected.
[MOVE]: Move the point selected.
[DELETE]: Delete the point selected.
[GOTO]: Start navigating from the point selected.
[EASY ROUTING]: Get easy routing calculations
for the route selected.
Chart Object [FULL INFO]: Get full information about the chart
FULL INFO
LAT/LON
EASY ROUTING
object selected.
[LAT/LON]: Save the position selected as a point.
[EASY ROUTING]: Get easy routing calculations
to the chart object selected.
Own Boat [COG LINE]: Show or hide the COG vector.
COG LINE
HEADING LINE
RECORD TRACK
SHIP ICON
EASY ROUTING
Infinite
Off
On
Icon 1
[HEADING LINE]: Show or hide the heading line.
[RECORD TRACK]: Stop or start recording your
boat’s track.
[SHIP ICON]: Change the ship icon.
[EASY ROUTING]: Get easy routing calcula-
tions.
1-22
Page 39

1. OPERATIONAL OVERVIEW
Item Context-sensitive menu Description
Route (active)
STOP
RESTART
REVERSE
INSERT
EXTEND
INFO
[STOP]: Stop navigating the active route.
[RESTART]: Restart navigating the active route.
[REVERSE]: Follow the points in the active route
in reverse order.
[INSERT]: Add a new point to the cursor position
of the active route.
[EXTEND]: Add a new point to the end of the active route.
[INFO]. Get information about the active route.
Route (inactive)
GOTO
REVERSE
INSERT
EXTEND
RENAME
DELETE
INFO
EASY ROUTING
[GOTO]: Activate the route selected.
[REVERSE]: Follow the points in the route in re-
verse order.
[INSERT]: Add a new point to the cursor position
of the route selected.
[EXTEND]: Add a new point to the end of the route
selected.
[RENAME]: Rename the route selected.
[DELETE]: Delete the route selected.
[INFO]: Get information about the route selected.
[EASY ROUTING]: Get easy routing calculations
for the route selected.
Track [HIDE]: Hide the track in the selected color.
HIDE
DELETE
EASY ROUTING
[DELETE]: Delete the track in the selected color.
[EASY ROUTING]: Get easy routing calculations
for the track.
Points List [EDIT]: Edit the point selected.
EDIT
DELETE
PLOT
MODE
GOTO
[DELETE]: Delete the point selected.
[PLOT]: Show the point selected on the plotter
display.
[MODE]: Select the visibility for the point selected.
[GOTO]: Go to the point selected.
Routes List [EDIT]: Edit the route selected.
EDIT
DELETE
PLOT
REVERSE
REPORT
GOTO
[DELETE]: Delete the route selected.
[PLOT]: Show the route selected on the plotter
display.
[REVERSE]: Follow the points of the route selected in reverse order.
[REPORT]: Display the route report for the route
selected.
[GOTO]: Go to the route selected.
MOB mark
(on screen)
MOB mark
(on Points
List)
START
DELETE
PLOT
DELETE
GOTO
[START]: Go to the MOB mark selected.
[DELETE]: Delete the MOB mark selected.
[PLOT]: Show the MOB mark selected on the plot-
ter display.
[DELETE]: Delete the MOB mark selected.
[GOTO]: Go to the MOB mark selected.
1-23
Page 40

1. OPERATIONAL OVERVIEW
Item Context-sensitive menu Description
Screenshots (INTERNAL)
Screenshots (SD
CARD)
SAVE
DELETE
RENAME
PREVIEW
LOAD
DELETE
RENAME
PREVIEW
[SAVE]: Copy the screenshots in the internal
memory to the SD card.
[DELETE]: Delete the screenshots.
[RENAME]: Give the file a new name.
[PREVIEW]: Show the screenshots selected on
the screen.
[LOAD]: Copy the screenshots in the SD card to
the internal memory.
[DELETE]: Delete the screenshots.
[RENAME]: Give the file a new name.
[PREVIEW]: Show the screenshots selected on
the screen.
1.15 Man Overboard (MOB)
The MOB mark denotes man overboard position. Enter the mark when someone falls
overboard, to automatically create a route to the man overboard position. Only one
mark can be displayed.
1.15.1 How to mark MOB position
Long-push the EVENT/MOB key on any screen. The plotter display appears if you are
using a different screen. The MOB mark is put at the latitude and longitude position of
your boat at the moment the key is pressed. The [MOB] box at the bottom left of the
screen shows the bearing and range to the MOB mark.
MOB mark
MOB
180°T
14.2 NM
MOB box
Bearing to MOB position
Range to MOB position
1.15.2 How to stop navigating to a MOB mark
Put the cursor on the MOB mark then press the ENT key. “STOP” appears at the bottom left corner. Press the ENT key to stop navigation. The message "Stop navigating
to MOB. Are you sure?" appears. [YES] is selected; press the ENT key.
1.15.3 How to erase an MOB mark
Put the cursor on the mark then press the ENT key to show the context-sensitive
menu. Select [DELETE] then press the ENT key. The message "Delete MOB. Are you
sure?" appears. [YES] is selected; press the ENT key. (The MOB mark set as desti-
nation cannot be erased. You must cancel navigation to the mark before you can
erase it.)
1.16 How to Take a Screenshot
You can take a screenshot at any time and save it to the internal memory, in PNG format. Open the full RotoKey menu then select [Screenshot]. For how to process
screenshots, see section 9.8.
1-24
Page 41

1.17 Tide Information
Your chart contains worldwide tide height and tidal current information.
1.17.1 Tide height information
The tide station symbol appears at the locations of tide height recording stations.
1. OPERATIONAL OVERVIEW
To get tide information from a tide station, put the cursor on the tide station symbol,
press the ENT key then select [FULL INFO] from the context-sensitive menu to show
the [OBJECTS] menu. The cursor is selecting [Tide height station]; push the ENT key
to get tide height information.
TOMOGA SHIMA
06:30AM 4.981 ft
03-23-12 12:06 PM
12:04PM 0.404 ft
12:45PM 0.134 ft
5.0
4.0
3.0
2.0
1.0
If several tide stations overlap one another on the screen, information for each station
is presented when [FULL INFO] is selected from the context-sensitive menu. Select
desired station to find tide information.
• The information is mostly accurate under moderate weather conditions. However,
storms and weather fronts can influence forecasted tide times and heights.
• To change the [Date], push the RotoKey
• To change the [Tide Prediction] time, rotate the RotoKey
TM
then use the CursorPad to set.
TM
or operate the right and
left arrows on the CursorPad. The vertical red line moves with knob rotation/arrow
operation.
• To quit the display and return to the plotter display, press the ESC/MENU key.
1-25
Page 42

1. OPERATIONAL OVERVIEW
1.17.2 Tide stream information
This page is intentionally left blank.
The tidal stream information is made from the tide stream data received from tide
stream station.
Tidal streams are marked with arrows. The size and color of the arrow indicate tide
stream speed, Yellow, slow; orange, medium, and red, fast.
Simple and detailed tide stream information are available. For simple information, put
the cursor on a tide stream marker. The [Object Information] box shows the date, time
and direction and speed of the tide stream.
23-03-12 12:03:50 PM
DIR=302°T SPD=3.7 kn
Simple tide stream information
For detailed information, press the ENT key then select [FULL INFO] from the context
sensitive menu. [Tide stream station] is selected; see the information at the bottom of
the screen.
Tide stream station
3d Height meters: 0
Name: 34°37.40’N, 135°01.73’ E
Time zone: 9
1-26
Page 43

2. TRACK
Your boat’s track is plotted on the display with position information fed from the internal GPS navigator. This section shows you how to process track, from how to show
or hide the track to how to change its color.
2.1 How to Show, Hide all Track
By soft control: Open the RotoKey menu then select [Track] to toggle the track dis-
play ON and OFF.
By context-sensitive menu: Put the cursor on any part of the track then press the
ENT key to show the context-sensitive menu. Select [HIDE] to hide the track.
2.2 How to Stop Recording Track
1. Open the [PLOTTER] menu then select [TRACK] and [RECORD TRACK].
2. Select [Off] then press the ENT key.
3. Press the ESC/MENU key to close the menu.
To resume recording, select [On] at step 2.
2.3 How to Select Recording Method, Recording Interval
To trace your boat’s track, your boat’s position is stored into the memory at an interval
of time or distance. For distance, a shorter interval provides better reconstruction of
the track, but the storage time of the track is shorten. When the track memory becomes full, the oldest track is erased to make room for the latest.
1. Open the [PLOTTER] menu then select [TRACK] and
[TRACK RECORDING METHOD].
2. Select [Time] or [Distance] as appropriate.
3. Select the menu item [Time] or [Distance] according to the
item selected at step 2. The options for those menu items
are shown in the right figure.
4. Select desired recording interval then press the ESC/
MENU key to close the menu.
0.01 NM
0.05 NM
0.1 NM
0.5 NM
1.0 NM
2.0 NM
5.0 NM
10.0 NM
Distance Time
2-1
Page 44

2. TRACK
2.4 How to Change the Color of Your Boat’s Track
You can select the color for your boat’s track among red, green, light green, yellow,
purple, orange, brown, and black. It is useful to change the color at regular intervals
to distinguish tracks at different times of a day, for example.
1. Open the [PLOTTER] menu then select [TRACK] and [ACTIVE TRACK] to show
the track color options.
2. Select a color then press the ESC/MENU key to close the menu.
2.5 How to Change the Color of Your Boat’s Track with Sea Surface Temperature
You can have the track painted in a different color when the sea surface temperature
changes by the amount set.
1. Open the [PLOTTER] menu then select [TRACK] and [TRACK COLOR BY TEM-
PERATURE].
2. Select [0.2] or [2.0] as appropriate.
0.2 2.0
Red: -1.0°F to 0.8°F 0 to 0.2°F, 1.0°F to
1.2°F
Orange: -0.8°F to -0.6°F, 0.2°F to 0.4°F,
1.2°F to 1.4°F
Yellow: -0.6°F to -0.4°F, 0.4°F to 0.6°F,
1.4°C to 1.6°F
Green: -0.4°F to -0.2°F, 0.6°F to 0.8°F,
1.6°F to 1.8°F
Blue: -0.2°F to 0°F, 0.8°F to 1.0°F, 1.8°F
to 2.0°F
3. Press the ESC/MENU key to close the menu.
Red: -10°F to -8.0°F, 0°C to 2.0°F, 10°F to
12°F
Orange: -8.0°F to -6.0°F, 2.0°F to 4.0°F,
12°F to 14°F
Yellow: -6.0°F to -4.0°F, 4.0°F to 6.0°F,
14°F to 16°F
Green: -4.0°F to -2.0°F, 6.0°F to 8.0°F,
16°F to 18°F
Blue: -2.0°F to 0°F, 8.0°F to 10°F, 18°F to
20°F
2.6 How to Hide, Show Track by Color
When the screen becomes cluttered with many different colors of track you may want
to show only a certain color to clear up the screen.
How to show, hide track from the menu
1. Open the [PLOTTER] menu then select [TRACK] and [SHOW TRACK BY COL-
OR].
2-2
2. Select the color to display then press the ENT key.
3. Select [On]. Select [On] in [All] to display all colors.
4. Press the ESC/MENU key to close the menu.
How to hide track with the context-sensitive menu
Put the cursor on the track color to hide then press the ENT key to show the contextsensitive menu. Select [HIDE] to hide the track color selected.
Page 45

2.7 How to Delete Track by Color
When the screen becomes cluttered with track, you may want to delete some track to
clear up the display. You can delete track from the context-sensitive menu or the
menu.
How to delete track color from the menu
1. Open the [PLOTTER] menu then select [TRACK] and [DELETE TRACK BY COLOR].
2. Select the color to delete then press the ENT key. The message "Delete track. Are
you sure?" appears.
3. Select [YES] then press the ENT key.
4. Press the ESC/MENU key to close the menu.
How to delete track color with the context-sensitive menu
Put the cursor on the track color that you want to delete then press the ENT key to
show the context-sensitive menu. Select [DELETE] then press the ENT key. The message "Delete track. Are you sure?" appears. Select [YES] then press the ENT key.
2. TRACK
2.8 How to Find Track Information
Put the cursor on the track to find track information.
Track Information
Time 02-24-12 12:46PM
Temp 11.3ºF
Depth 85.7 m
Fish size 21, 18, 15, 07 cm
Bottom type Mud 60%
2-3
Page 46

2. TRACK
This page is intentionally left blank.
2-4
Page 47

3. POINTS
3.1 What is a Point?
In navigation terminology, a point is any location you mark on the plotter display. A
point can be a fishing spot, reference point and other important locations. You can use
a point you have entered to set a destination and create a route.
This unit has 30,000 points into which you can enter position information. There are
four methods that you can use to mark a point:
• At your current position
• At cursor position
• Enter position from the [Points List]
• Enter position manually on the screen
When you enter a point, the point is put on the screen with the point symbol selected
as the default point symbol, with the youngest empty point number. The position of the
point, symbol and navigation information (range, bearing, etc.) are saved to the [Points
List]. You can show or hide the points, and the default setting shows all points.
Default point symbol
(default configuration
is a yellow circle)
You can edit a point on the screen or on the [Points List].
PT00001
Point name
(default color: yellow)
3.2 How to Enter a Point
3.2.1 How to enter a point at the current position
A point may be entered at current position even when the menu is open. Press the
EVENT/MOB key. The symbol of the point is marked at the position at the time the
EVENT/MOB key was pressed. The point is automatically named.
3-1
Page 48

3. POINTS
3.2.2 How to enter a point at the cursor position
1. Operate the CursorPad to put the cursor where desired then press the POINTS/
GOTO key.
The “point” pop-up appears and shows point name, latitude and longitude position
of the point, and distance and bearing to the point. No further operation is necessary to save the point under the assigned point name and the default symbol and
color. To save the point under different conditions, go to step 2.
Symbol
PT00011
Cursor position in
latitude and longitude
Distance to point
2. Press the POINTS/GOTO key again, and a window that looks something like the
one shown below appears.
3. By default, the [Name] field shows the youngest empty point number. You can
change the name, using the CursorPad.
4. The [Position] field shows the position at the time the point was entered. If necessary, you can change the position, using the CursorPad.
5. Select [Shape] to change the icon, from among the choices shown below.
43°59.2157'N
135°16.6498'E
DST
NM
BRG T
10.5 185°
Point name
Bearing to point
3-2
6. Select [Color] to change the color of the icon, from among the choices shown below.
7. [Show] selects the visibility level for the point (icon).
[Show]: Show the icon and the point name.
Page 49

[Hide]: Hide the icon and its name.
[Icon]: Show only the icon.
8. Use [Comment] to enter a comment about the point, with the CursorPad. The default comment is the time and date of entry of the point. A comment may have a
maximum of 64 alphanumeric characters.
9. To save the point, select the [Save] button then push the RotoKey
TM
3.2.3 How to enter a position manually on the plotter screen
Press the ENT key to show the context-sensitive menu. Select [LAT/LON] then press
the ENT key to show the position input box. The position shown in the box is the cursor
position. Enter position using the CursorPad. After you have entered the position, the
[Save] button is automatically selected. Press the ENT key to save the point, under
the youngest empty point number.
3.2.4 How to enter a point from the Points List
Do the following to enter a point on the [Points List].
3. POINTS
key.
1. Open the [PLOTTER] menu and select [POINTS] to show the [Points List].
2. The [New] button (at the bottom of the screen) is selected; push the RotoKey
to show the point entry window.
TM
3. Follow steps 3 to 8 in section 3.2.2.
4. To save the point, select the [Save] button then push the RotoKey
TM
key.
3-3
Page 50

3. POINTS
3.3 How to Find Detailed Point Information
You can find detailed point information with the point information pop-up. Put the cursor on the point then press the ENT key. (A point is correctly selected if the “point” box
appears. See the figure in section 3.2.1.) Select [DETAILED] then press the ENT key.
Name PT0001
Position 34º41.006N
135º41.629E
Time 02-24-12 12:46PM
Temp 11.3º
Depth 85.7 m
Fish size 21, 18, 15, 07 cm
Bottom type Mud 60%
Comment FURUNO
3.4 How to Move a Point
You can move a point two ways: on the screen and from the [Points List].
3.4.1 How to move a point on the screen
Method 1: Drag the point to a new location
1. Select the point with the cursor then push the ENT key to show the context-sen-
sitive menu. (The point is correctly selected if the "point" box appears.)
2. Select [MOVE] from the context-sensitive menu then press the ENT key.
3. Drag the cursor to the new location then press the ENT key. The icon moves to
the selected position.
Method 2: Manual input of latitude and longitude from the Points List
1. Select the point with the cursor then push the ENT key to show the context-sen-
sitive menu. (The point is correctly selected if the “point” box appears.)
2. Select [EDIT] from the context-sensitive menu then press the ENT key to show
the point edit screen.
3. Edit the position.
4. Select the [Save] button to finish.
3.4.2 How to move a point from the Points List
1. Open the [PLOTTER] menu and select [POINTS] to show the [Points List].
2. Select the point to edit.
3. Select [EDIT] from the context-sensitive menu.
4. Select the [Position] field to edit the position.
5. Select the [Save] button then press the ENT key.
3-4
Page 51

3.5 How to Select Visibility for Points
Points can be shown or hidden individually or collectively.
1. Open the [PLOTTER] menu and select [POINTS] to show the [Points List].
2. Select the point to edit then press the ENT key.
Note: If you want to assign visibility globally, select any point.
3. Select [MODE] from the context-sensitive menu.
4. Select the visibility desired.
[SHOW]: Show the selected point’s icon and point name.
[ICON]: Show the icon of the selected point.
[HIDE]: Hide the selected point.
[SHOW ALL]: Show all points’ icon and point names.
[ICON ALL]: Show the icon of all points.
[HIDE ALL]: Hide all points.
3. POINTS
The entry(ies) in the [Mode] column change according to your selection.
3.6 How to Search, Sort Points on the Points List
3.6.1 How to search points
1. Open the [PLOTTER] menu and select [POINTS] to show the [Points List].
2. Select [Search] (at the bottom of the screen).
3. Enter the point name in the text box. The cursor jumps to the applicable position
in the [Points List].
3.6.2 How to sort points
1. Open the [PLOTTER] menu and select [POINTS] to show the [Points List].
2. Select [Sort] (at the bottom of the screen).
3. Select the sort method.
[A-Z ASCENDING]: A-to-Z order
[Z-A DESCENDING]: Z-to-A order
[DISTANCE ASCENDING]: Distance in ascending order
[DISTANCE DESCENDING]: Distance in descending order
3-5
Page 52

3. POINTS
3.7 How to Filter Points by Shape on the Points List
You may filter points on the [Points List] by icon shape. This is useful when you are
looking for points of a specific shape.
1. Open the [PLOTTER] menu and select [POINTS] to show the [Points List].
2. Select [Icon] (at the bottom of the screen).
3. Select [ICON] to show the icon selection window.
4. Select the icon desired.
3.8 How to Delete Points
You can delete individual points directly on the screen and on the [Points List]. All
points can be deleted from the [Points List].
3.8.1 How to delete a point from the screen
1. Select the point with the cursor then push the ENT key to show the context-sen-
sitive menu. (The point is correctly selected if the “point” box appears.)
2. Select [DELETE] then press the ENT key. The message "Delete this point. Are
you sure?" appears.
3. [YES] is selected; push the RotoKey
TM
to delete the point.
3.8.2 How to delete points from the Points List
How to delete a point
1. Open the [PLOTTER] menu and select [POINTS] to show the [Points List].
2. Select the point to delete then press the ENT key to show the context-sensitive
menu.
3. Select [DELETE] then press the ENT key. The message "Delete this point. Are
you sure?" appears.
4. [YES] is selected; push the RotoKey
How to delete all points
1. Open the [PLOTTER] menu and select [POINTS] to show the [Points List].
2. Rotate the RotoKey
screen) then push the key. The message "Delete all points. Are you sure?" appears.
3. [YES] is selected; push the RotoKey
TM
to select the [Delete all] button (at the bottom of the
TM
to delete the point.
TM
to delete all points.
3-6
Page 53

4. ROUTES
4.1 What is a Route?
Often a trip from one place to another involves several course changes, requiring a
series of route points (waypoints) which you navigate to, one after another. The sequence of waypoints leading to the ultimate destination is called a route. The equipment can store 1,000 routes, with a maximum of 50 points per route.
You create a route by pointing and clicking geographical positions on the screen.
These positions are marked with yellow circles.
You can follow a route that you have created, with the GOTO feature. When you follow
a route, the points on the route are yellow circles and a red line with arrows connects
between the points. The arrows show the direction in which to follow the route.
Routes can be edited directly on the screen or through the menu and the editing feature available depends on route status (active or inactive) and method.
• Select a route to follow.
• Select a route to follow and follow it in reverse order.
• Insert a point(s) in a route.
• Add point(s) to the end of a route.
• Rename a route.
• Delete a route.
• Find information about a route.
• Connect two routes.
4.2 How to Create a Route
There are two ways to create a route: soft control ([Routes]→[New]) and menu
([Routes List]).
4.2.1 How to create a route from the RotoKey menu
1. Open the RotoKey menu then select [Route] and [New].
2. Put the cursor on the first point for the route then press the ENT key.
A yellow circle marks the position selected and the point number (QPxxxxx,
xxxxx=point number) appears below the point.
3. Put the cursor on the next point then press the ENT key.
A yellow circle marks the position and a blue line with arrow runs between the 1st
point and this point. The arrow indicates the direction of the route.
Note: You can also add a saved point to the route. Select the point then press the
ENT key.
4. Repeat step 3 to complete the route.
5. The [Save] soft control is selected; push the RotoKey
The route is saved under the next sequential empty route number. The name for the
route is initially assigned as “RTxxxx” (xxxx=route number). The name can be
changed as desired.
TM
to save the route.
4-1
Page 54

4. ROUTES
4.2.2 How to create a route from the Routes List
A route can also be created from the [Routes List], with the points you have entered.
1. Open the [PLOTTER] menu and select [ROUTES] to show the [Routes List].
TM
2. The [New] button is selected; push the RotoKey
.
3. The input box (at the bottom of the screen) is showing the route name, the youngest empty route number. Change the route name if necessary. Finally, press the
ENT key. The screen something like the one shown below appears.
LEG
Route
points
Saved
points
4. Press the ENT key to show the context-sensitive menu then do the following to
enter a route point.
4-2
1) [INSERT] is selected; press the ENT key. The cursor moves to the saved
points column.
2) Use the CursorPad to select a point then press the ENT key. The cursor re-
turns to the route points column.
3) Use the CursorPad to put the cursor on the next route point number then
press the ENT key.
4) Repeat 1) - 3) to continue entering points.
Page 55

4. ROUTES
5) After you have entered all the points you require, press the ESC/MENU key.
The [Routes List] reappears, showing the newly entered route.
4.2.3 How to create a route with the Easy Routing feature
The Easy Routing feature automatically constructs a route between two points, taking
into consideration the preset values for safe depths, safe heights and boat’s width, to
provide you with an estimate of a safe route to your destination. Easy Routing can be
initiated on points, on quick points, on track points, on route legs, on a position fix, on
MOB position, on DSC points, on a cartographic object, and chart.
You simply set a start position and a destination. This can be newly entered points or
any of the points mentioned above that are currently on the screen. (The total distance
can not be longer than 100 NM.) Easy Routing then analyzes the path between the
two points and creates a route, inserting legs in the route when necessary to get you
away from areas which exceed the safety values set on the menu. Easy Routing analyzes each leg for safety in three levels: safe leg, potentially dangerous leg, and unsafe leg, and color codes them accordingly, green for safe, yellow for potentially dangerous and red for unsafe.
Note: A chart card must be inserted to use Easy Routing. Not all chart cards carry
Easy Routing. The message "No charts with Easy Routing data found." appears if a
chart card does not have Easy Routing.
EASY ROUTING DISCLAIMER: The accuracy of Easy Routing is limited by the availability of electronic charts loaded on your navigation system and the accuracy of original source material used in producing such charts. Always remember that you should
navigate with the most detailed and up-to-date chart available from FURUNO, and
new information from National Hydrographic Offices may render your charts obsolete
at any time. Easy Routing is only an aid to navigation and must be used in conjunction
with conventional navigation practices. As the navigator of your boat, you are responsible for reviewing the suggested route against the official nautical publications and situational awareness. You must edit and/or approve the suggested route before using
it for navigation purposes.
4-3
Page 56

4. ROUTES
How to set the safe values for Easy Routing
Follow the procedure below to set the safe values to use in Easy Routing.
1. Open the [PLOTTER] menu and select [EASY ROUTING].
6.6 ft
39.4 ft
0.0022 NM
5.0 min
2. [SAFE DEPTH] is the minimum safe depth, namely, your boat’s draft.
3. [SAFE HEIGHT] is the minimum safe height, namely, the height of your boat.
4. [SAFE CORRIDOR] is the minimum width of the path.
5. [TIMEOUT] is the amount of time to wait before exiting the Easy Routing function,
when it cannot create a route.
6. [SAFE MARGIN] is the minimum distance (300 m) between a dangerous/not navigable area and your boat. This area could be land or a body of water. Turn it on
to honor this distance.
7. Turn off [RESPECT DRAUGHT] if you want to disregard the depths that are shallower than the [SAFE DEPTH] setting.
How to create a route with Easy Routing
1. Put the cursor on the starting point then press the ENT key.
2. Select [EASY ROUTING] followed by [START].
START
DESTINATION
CALCULATE
The starting point is marked with a green flag, labeled [ER START].
4-4
ER START
3. Put the cursor on the destination then press the ENT key.
Page 57

4. ROUTES
4. Select [EASY ROUTING] followed by [DESTINATION].
The destination point is marked with a green flag,
labeled [ER DEST].
ER CALCULATING
Calculating route
Please wait
5. Press the ENT key then select [EASY ROUTING]
followed by [CALCULATE].
A warning about the use of easy routing appears.
EXIT
Read the warning then press the ENT key. Calculation begins and the right figure appears. Calculation progress is indicated with the progress bar.
6. When the calculation is completed, the [EASY ROUTING REPORT] appears.
EASY ROUTING REPORT
Route has been calculated.
Route length:
Total number of legs: 5
0 Unsafe (red)
0 Potentially dangerous (yellow)
0 Safe (green)
Moved 0
OK
DETAILS
7. Click the [OK] button. (To get detailed information about the route, “click” the [DETAILS] button. Press the ESC/MENU key to close the detailed report.)
8. The Easy Routing created route appears.
ER DEST
ER START
“Click” to show
detailed report
EASY ROUTING REPORT
Unsafe legs (red) - This leg crosses dangerous
areas or objects. A specific and accurate
visual check of the leg (and route) is mandatory
and manual correction is absolutely necesary.
Potentionally dangerous legs (yellow) - This leg
crosses some potentionally dangerous areas
or objects. A specific visual check and potential
manual correction of the left has to be performed.
Safe legs (green) - No hazards have been detected
for this route leg. Prudent navigation is
in any case recommended.
Leg
ER DEST
ER START
In the above example, five legs were created. Legs are color coded according to
safety levels, red for unsafe, yellow for potentially dangerous, and green for safe.
In the example, all legs were judged to be safe therefore the line between the start
and destination is completely green. If the route has an unsafe or potentially dangerous leg, retry the calculation, with different locations.
9. Press the ENT key to save the route, or press the ESC/MENU key to escape without saving the route.
The Easy Routing created graphic is removed. If you saved the route, the Start and
Destination flags and the route remain on the screen. If you exited without saving the
route, only the Start and Destination flags remain on the screen. The flags can be removed by selecting [DELETE] at [START POINT] and [DESTINATION POINT] on the
[EASY ROUTING] menu. The flags are also removed when the power is turned off.
4-5
Page 58

4. ROUTES
Error message Meaning Remedy
Error messages in Easy Routing
Latitude of the defined points is
greater than 80°. Route has not
been calculated.
No charts with Easy Routing
data found. Calculation cannot
be started.
Route calculation has been
halted.
Route has not been calculated. Route cannot be calculated in a
Route is too complex, calculation could not complete.
Start and destination points are
too far away. Calculation cannot be stored.
Start and destination points
placed in the same position.
Route has not been calculated.
The latitude of the points is over
80°N/S.
You tried to use Easy Routing
with no chart data.
You canceled route calculation. –
situation other than those mentioned above.
The route is too complex to calculate.
The start and destination points
are more than 100 NM apart.
Start and destination positions
are the same.
Reselect the points.
Insert appropriate chart card.
Reselect points and try the calculation again.
Try to select a slightly different
set of points.
Reduce the distance between
points to 100 NM or less.
Select different positions.
Start or destination point of
route cannot be moved to a
navigable position on water.
Route has not been calculated.
Timeout has been exceed.
Route has not been calculated.
One or both points of the route
are on land or on a forbidden area.
The route could not be generated within the time specified with
[TIMEOUT] in the [EASY
ROUTING] menu.
Reselect the points.
Retry the calculation.
4.3 How to Extend a Route on the Screen
You can extend a route from the last point on the route. This is useful when you want
to travel beyond the last point in a route.
1. Put the cursor on any leg of the route then press the ENT key.
2. Select [EXTEND] from the context-sensitive menu then press the ENT key.
3. Drag the cursor to where you want to extend the route. A dashed line runs between the last point and the cursor.
4. Press the ENT key. The dashed line is replaced with a solid line and the point is
numbered with the next sequential point number of the route.
4-6
Page 59

4. ROUTES
4.4 How to Insert a Point on a Route on the Screen
You can put a point between route legs when you need an additional point along a
route.
1. Put the cursor on a leg of the route.
2. Press the ENT key, select [INSERT] then press the ENT key. A dashed line is
overlaid on the selected leg.
3. Drag the cursor to the location where to put the point then press the ENT key. The
dashed line disappears and the leg is redrawn with a solid line.
4.5 How to Move a Point in a Route on the Screen
You can move a point in a route as follows:
1. Put the cursor on the point to move then press the ENT key.
2. Select [MOVE] then press the ENT key.
3. Drag the cursor to the new location for the point. The color of the point icon and
the point name turn gray.
4. Press the ENT key to anchor the point. The color of the point and point name returns to yellow.
4.6 How to Delete a Point From a Route on the Screen
Unnecessary points in a route can be deleted as shown below. You can also delete a
route point from the [Routes List]. See section 4.7.2.
1. Put the cursor on the point to delete then press the ENT key.
2. Select [DELETE] then press the ENT key. You are asked if you are sure to delete
the point.
3. [YES] is selected; press the ENT key to delete the point.
The route is redrawn omitting the deleted point.
4-7
Page 60

4. ROUTES
4.7 Routes List
4.7.1 How to display the Routes List
The [Routes List] shows all the routes saved to the internal memory. To show the
[Routes List], open the [PLOTTER] menu and select [ROUTES].
Use the up and down arrows on the CursorPad to scroll the list. For multiple pages,
switch between pages with the right and left arrows on the CursorPad.
Function buttons
The three function buttons at the bottom of the [Routes List] do the functions shown
TM
below. Use the RotoKey
[New]: Create a route. See section 4.2 for the procedure.
[Delete all]: Delete all routes. See section 4.13.
[Search]: Search your routes. A text input box appears. Enter the search string then
press the ENT key. The cursor selects the route whose name matches the search
string.
to access the buttons.
4-8
Page 61

4.7.2 Functions available in the Routes List
Context-sensitive menu
Select a route from the list then press the ENT key menu to show the context-sensitive
menu.
[DELETE]: Delete the selected route.
EDIT
DELETE
PLOT
REVERSE
REPORT
GOTO
Route editing function buttons
The route editing function buttons appear at the bottom of the screen when a route is
selected for editing. Select the route from the [Routes List] then press the ENT key to
show the context-sensitive menu. Select [EDIT] from the context-sensitive menu then
press the ENT key.
[PLOT]: Display the selected route on the plotter display.
[REVERSE]: Follow the selected route in reverse order. See the
next chapter.
[REPORT]: Show the route report for the selected route.
[GOTO]: Navigate the route selected. See the next chapter.
4. ROUTES
[Rename]: Rename the route. A text input box appears with the current route name
in the box. Edit the name as appropriate.
[Comment]: Enter a comment for the route, using the CursorPad. A maximum of 64
alphanumeric characters may be used. The comment is the time and date the route
was created.
[Sort]: Sort the list according to the sort options:
[A-Z ASCENDING]: Alphabetical order
[Z-A DESCEDTING]: Reverse alphabetical order
[DISTANCE ASCENDING]: Distance in ascending order
[DISTANCE DESCENDING]: Distance in descending order
[Search]: Enter a search waypoint name then press the ENT key. The cursor selects
the waypoint that matches the name entered.
[Connect]: Connect the selected route to the last point of the route edited. See
section 4.10.
4-9
Page 62

4. ROUTES
[Coord Type]: Select the position display format for points globally, among
ddd’mm’ss, ddd°mm.mmm, ddd°mm.mmmm, ddd.dddddd.
4.8 Route Report, Route Calculator
A route report provides detailed information about a route plus a route navigation calculator. The route navigation calculator lets you see the time necessary to travel to
each leg and the amount of fuel required for each leg with various speeds and fuel
consumption figures.
Route report
To show the route report, select a route on the [Routes List] then press the ENT key.
Select [REPORT] from the context-sensitive menu then press the ENT key. The report
provides the following information:
• The name of each point
• The position of each point
• The bearing to each point
• The distance to each point
• The total distance between points and total distance of the route
• The time required to get to a point using the speed selected
• The amount of fuel required to get to a point and the total amount of fuel required to
run the route.
2.64 gal/h
T
4-10
Note: A route report can also be shown by selecting the route on the screen. Select
the route then press the ENT key. Select [INFO] from the context-sensitive menu.
Route calculator
Use the [Speed] and [Fuel] buttons at the bottom of the [Route Report] to enter speed
and fuel consumption/hour. See how those values affect the [Time] and [Fuel] indications.
Page 63

4.9 How to Display a Route on the Screen
Open the [PLOTTER] menu and select [ROUTES] to show the [Routes List]. Select a
route then press the ENT key. Select [PLOT] from the context-sensitive menu then
press the ENT key.
4.10 How to Connect Two Routes
You can connect two routes from the [Routes List]. In the example below route 1 is
connected to route 2.
1. Open the [PLOTTER] menu and select [ROUTES] to show the [Routes List].
2. Select the starting route then press the ENT key.
3. Select [EDIT] from the context-sensitive menu then press the ENT key.
4. Use the RotoKey
then press the RotoKey
TM
to select the [Connect] button (at the bottom of the screen)
TM
to display the routes list (at right half of the screen).
4. ROUTES
5. Select route 2 then press the ENT key.
The joined route is saved under the name of route 1. If the total number of points exceeds 50, the excess is removed from the end of the route.
4.11 Simple Route Information
You can find simple route information for a route by putting the cursor on a leg of the
route. The name of the route and the date of its creation are shown.
Name
Comment
RT0001
12:20PM 03-16-12
4-11
Page 64

4. ROUTES
4.12 How to Rename a Route on the Screen
The default name for a route is RTXXXX (XXXX=route number). If desired, you can
rename the route with one more descriptive.
1. Put the cursor on the route to rename then press the ENT key.
2. Select [Rename] then press the ENT key. An input box showing current route
name appears.
3. Edit the name as appropriate then press the ENT key.
4.13 How to Delete Routes
Routes can be deleted individually or collectively. A route currently used for navigation
cannot be deleted.
4.13.1 How to delete a route on the screen
1. Put the cursor on a leg of the route to delete then press the ENT key.
2. Select [DELETE] then press the ENT key. You are asked if you are sure to delete
the route.
3. [YES] is selected; press the ENT key to delete the route.
The route is deleted from the screen and the [Routes List].
4.13.2 How to delete routes from the Routes List
Individual route
1. Open the [PLOTTER] menu and select [ROUTES].
2. Select a route then press the ENT key.
3. Select [DELETE] from the menu then press the ENT key.
All routes
You can delete all routes from the list as follows:
1. Open the [PLOTTER] menu and select [ROUTES].
TM
2. Use the RotoKey
the key. You are asked if you are sure to delete all routes.
3. [YES] is selected; press the ENT key to delete all routes.
to select [Delete all] (at the bottom of the screen) then push
4-12
Page 65

5. NAVIGATION
This chapter shows you how to get to a desired destination by using “quick points,”
saved points, and routes.
Before you go to a point or follow a route, make sure the path to the points is clear.
Zoom your chart to check for hazards which appear on a smaller scale.
5.1 How to Navigate to a Quick Point
The advantage of navigating to a quick point, the cursor position, is that you do not
need to save the point to the memory. However, the point is erased when a new quick
point is entered.
Put the cursor on the position to mark as a quick point then long-push the POINTS/
GO TO key. Then,
• A yellow circle appears at the location, with the youngest empty quick point number
below it. The navigation line (red) connects between own ship and the quick point,
your destination. The line shows the shortest path to the destination and the direction to go.
• The arrival area, the radius of which is set with the arrival alarm, is shown with a red dashed circle. When
your boat comes within the circle or your boat moves
through an imaginary perpendicular line that crosses
through the center of the destination point, the audio
alarm sounds and the arrival alarm icon appears at the
top of the screen to alert you. The arrival area and
XTE alarm lines are shown when the related alarms
are active.
• The XTE alarm lines (red dashed lines), show the XTE
alarm range, set with the XTE alarm. When your boat
crosses an XTE line, audible and visual alarms are re-leased to alert you.
5-1
Page 66

5. NAVIGATION
5.2 How to Navigate to a Saved Point
There are two methods by which to navigate to a saved point: select the point on the
screen and select the point from the [Points List].
5.2.1 How to navigate to a saved point selected on the screen
Put the cursor on the saved point then press the ENT key. Select [GOTO] then press
the ENT key. See the description on page 5-1 for the meaning of the symbols and
lines and the sequence of events in navigation to a point.
Arrival area (red)
Point
(yellow by
default)
XTE alarm line
(red)
FURUNO
Point
name
Navigation line
(red)
Ship icon
5.2.2 How to navigate to a point selected from the Points List
1. Open the [PLOTTER] menu and select [POINTS] to show the [Points List].
2. Select a point then press the ENT key to show the context-sensitive menu.
3. Select [GOTO] then press the ENT key.
5.3 How to Select a Route for Navigation
There are two methods to select a route for navigation: select the route on the screen
and select the route from the [Routes List].
5.3.1 On-screen route
Put the cursor on any route leg of the route then press the ENT key to show the context-sensitive menu. Select [GOTO] then press the ENT key.
5-2
Note: If you are currently navigating a route, the message "Destination is already
present. Stop the navigation." appears. Select [YES] to stop navigation on the current
route and switch to the newly selected route, or select [NO] to continue navigation with
the current route.
After you select a route the following occurs:
Page 67

5. NAVIGATION
• A red line runs between the points on the route. The line shows the shortest path
to the destination and the direction to go.
Route point
(yellow by
default)
PT00003
• The arrival area, the radius of which is set with the arrival alarm, is shown with a red
dashed circle. When your boat comes within the circle or your boat moves through
an imaginary perpendicular line that crosses through the center of the destination
point, the audio alarm sounds and the arrival alarm icon appears at the top of the
screen to alert you. See the description on page 5-1.
• After you arrive to a point, the arrival area marker and the dashed line are switched
to the next waypoint.
PT00002
PT00001
Navigation line
Arrival area (red)
XTE alarm line
(red)
5.3.2 Route selected from the Routes List
Open the [PLOTTER] menu and select [ROUTES] to show the [Routes List]. Select a
route and then press the ENT key to show the context-sensitive menu. Select [NAVIGATE] from the menu. See the description and figure in section 5.3.1 for the sequence
of events in route navigation. Note that the route points of a route created from the
[Routes List] are marked as “PTxxxxx”.
5.3.3 How to start navigation from a point on a route
Depending on your position, objective, etc., you may want to skip some route points
on a route and start navigating directly to a specific point. Put the cursor on a route
point then press the ENT key to show the context-sensitive menu. Select [ACTIVATE
FROM] then press the ENT key.
5-3
Page 68

5. NAVIGATION
5.4 Functions Available When You Follow a Route
5.4.1 Restart navigation
When you follow a route, you can restart
the navigation to the next point on the
route from current location.
When you steer to keep away from an obstruction or your boat drifts, you go off
course, like shown with Line 1 in the figure. If you do not need to return to the
original course, you can go to the desired
point from the current position as shown
in Line 2 in the figure.
Put the cursor on a leg in the route then press the ENT key to show the context-sensitive menu. Select [RESTART] then press the ENT key. The route start position
moves to the current position and the XTE is reset to zero.
Original course
Obstacle
Line 2
Line 1
5.4.2 Follow a route in reverse order
You can follow the route points of a route in reverse order. This feature is useful when
you want to retrace a route from the end to the beginning.
Put the cursor on a leg in the route then press the ENT key to show the context-sensitive menu. Select [REVERSE] then press the ENT key. The arrows on the route now
point in the opposite direction.
5.4.3 Stop following a route
Put the cursor on a leg in a route then press the ENT key to show the context-sensitive
menu. Select [STOP] then press the ENT key. The arrival area, XTE alarm lines are
erased and the color of the legs connecting the route points of the route changes to
blue.
5.4.4 Skip a leg in a route
When you don’t need to follow all route legs in a route you can skip an unnecessary
leg. (Multiple legs can be skipped) After you select the leg to skip, the route is redrawn, with the skipped leg removed. Put the cursor on the route point to skip then
press the ENT key to show the context-sensitive menu. Select [SKIP] then press the
ENT key.
5-4
Page 69

6. MAP SETTINGS, 2D PERSPECTIVE/3D DISPLAYS AND
SATELLITE OVERLAY
This chapter shows you how to set up the map display and how to select the 2D perspective and 3D displays.
6.1 Map Setup
All map settings are in the [MAP] menu. On this menu you can
• Change icon size
• Change the size of the place names
• Select nav aids presentation format
• Select chart language
• Predict tide movement
• Configure the information to show
Open the [MAP] menu and set items according to your operating needs.
[ICON SIZE]: Select the size for the icons (buoy, lighthouse, etc.). The choices are
[Standard] or [Large].
[PLACE NAMES SIZE]: Select the size for the place name indications, among [Standard], [Medium] or [Large].
[NAV AIDS PRESENTATION]: Select nav aids presentation format, [US] or [International].
6-1
Page 70

6. MAP SETTINGS, 2D PERSPECTIVE/3D DISPLAYS AND SATELLITE OVERLAY
[CHART LANGUAGE]: Use [Language] to select the chart language to use to show
chart information (place names, etc.), among English and major European and Asian
languages. Use [Mode] to select what language to display chart information in.
[Off]: Chart information is shown in English when it is not available in the chart language selected.
[English]: Chart information is shown in the chart language selected when English is
not available.
[Local]: Chart information is shown in the local language when it is not available in the
chart language selected.
[CURRENTS PREDICTION]: Predict current (tide) movement in the specified time interval.
03-16-12 01:25:32:PM
SPD 1.9 kn
DIR 302°T
Rotate the RotoKey
Push the RotoKey
to enter the date for which to show predicted current movement.
[CHART DISPLAY]: Setup the overlay displays.
[PLOTTER WINDOW]: Select which display to apply the settings of [CHART DISPLAY] in the 2-way split screen for the plotter display. The default setting puts the display on the left half.
[DISPLAY MODE]: Select the chart display mode, among [2D], [2D Perspective] and
[3D].
[OVERLAY]: Select the type of overlay to use, among [Vector], [Satellite], [Raster] and
[Chart Shading] (not available in the 3D display).
[OVERLAY MODE]: Select where to display the overlay, [On Land], [On Sea] or [On
All]. (Available in 2D and 2D perspective modes when [Satellite] or [Chart Shading] is
selected at [Overlay].)
[TRANSPARENCY]: You can set the level of transparency for the satellite photo on
the water. The higher the figure the greater the level of transparency.
[3D EXAGGERATION FACTOR]: Set the level of the 3D exaggeration factor, Level 1
to Level 5, to view topographical features more easily. The higher the number the
greater the exaggeration.
[MAP CONFIGURATION]: Show or hide various objects to set the level of detail for
your maps. [Display Mode] offers four preset levels (full, medium, low and tides) plus
a custom level which you can set according to your needs. The table on the next page
shows the settings for each of the four preset levels. You can zoom in the chart range
over the range which is limited by the chart when setting [Off] in [CHART LOCK]. However, if done the chart can not be displayed correctly.
TM
to set the time for which to show predicted current movement.
TM
for three seconds to enable entry of date. Use the CursorPad
6-2
Page 71

6. MAP SETTINGS, 2D PERSPECTIVE/3D DISPLAYS AND SATELLITE OVERLAY
Item
MARINE SETTINGS
NAMES On On Off On On, Off
HAZARD AREAS LA-
BELS
NAV-AID NAMES On Off Off Off On, Off
PORT NAMES On Off Off Off On, Off
NAV AIDS &LIGHT SEC-
TORS
ATTENTION AREAS On On Off Off On, Off
TIDES & CCURRENTS On Off Off On On, Off
SEABED TYPE On Off Off Off On, Off
PORTS & SERVICES On On Off Off On, Off
TRACKS & ROUTES On Off Off Off On, Off
UNDERWATER OBJECTS SETTINGS
UNDERWATER OBJECTS LIMIT
ROCKS Icon+
OBSTRUCTIONS Icon+
DIFFUSERS Icon+
WRECKS Icon+
DEPTH SETTINGS
DEPTH SHADING
MODE
SAFE DEPTH 15.0 15.0 15.0 15.0 0.0 to 1000.0 ft
DEPTH RANGE MIN 0.0 0.0 0.0 0.0 0.0 to 32804.0 ft
DEPTH RANGE MAX 32804.0 32804.0 32804.0 32804.0 0.0 to 32804.0 ft
CHART SETTINGS
LAT/LON GRID On Off Off Off On, Off
BOUNDARIES MODE AUTO AUTO AUTO AUTO AUTO, Manual
CHART BOUNDARIES On Off Off Off On, Off
VAD BOUNDARIES On Off Off Off On, Off
CHART LOCK On On On On On, Off
Full Medium Low Tides
On Off Off Off On, Off
On No sector No sector Off On, Off, No sector
32.8 32.8 32.8 32.8 0.0 to 1000.0 ft
Depth
Depth
Depth
Depth
Dynamic Dynamic Dynamic Dynamic Safe, Dynamic,
DIsplay Level
Icon Icon Icon Icon, Icon+Depth
Icon Icon Icon Icon, Icon+Depth
Icon Icon Icon Icon, Icon+Depth
Icon Icon Icon Icon, Icon+Depth
Available Settings
Dynamic Inverted
[VAD]: Value Added Data. Show or hide land VAD.
[Standard land VAD]: Select [On], [Off] or [Custom] at [DISPLAY] to show or hide standard land VAD. For [Custom], select which items to show or hide at [CUSTOMIZE].
The choices are [Road] and [Land Elevation].
[Standard marine VAD]: Select [On], [Off] or [Custom] at [DISPLAY] to show or hide
standard marine VAD. For [Custom], select which items to show or hide at [CUSTOMIZE]. The choices are [Tide height station], [Port/Marina] and [Tide stream station].
Note: You can display [VAD] with the RotoKey
open the full RotoKey menu then select [VAD].
TM
. Long-press the RotoKeyTM to
6-3
Page 72

6. MAP SETTINGS, 2D PERSPECTIVE/3D DISPLAYS AND SATELLITE OVERLAY
[FIND]: The find feature helps you locate ports, tide stations, wrecks, obstructions,
and points of interests (attractions, medical service, entertainment, shopping, etc.).
[COORDINATES] puts the cursor on the position you enter.
For example, select [PORT BY DISTANCE] to find the ports closest to your current
position.
PORT BY DISTANCE
NM
TADOTSU - TADOTSU 242 0.096
MARUGAME - MARUGAME 47 2.075
SAKAIDO KO - SAKAIDE 58 6.275
MIZUSHIMA - MIZUSHIMA 1 12.19
HIBI - HIBI 41 14.00
UNO KO - UNO KO 39 16.46
TAKAMATSU - TAKAMATSU 72 16.48
OKAYAMA - OKAYAMA 31 22.71
KOMATSUSHIMA - KOMATSUSHIMA 110 45.25
AIOI - AIOI 50 46.59
The list shows the name, bearing and distance to each port, in ascending distance. To
find the location of a port on the chart, select the port then press the ENT key. The
screen closes and the chart appears, with the port put at the center of the screen.
How to hide the place names
Do the following to hide the place names on the chart.
6-4
1. Select [MAP CONFIGURATION] from the [MAP] menu.
2. Open [DISPLAY MODE] then select [Custom].
3. Open [NAMES] then select [Off].
4. Press the ESC/MENU key to close the menu. To display the place names, select
[On].
Page 73

6. MAP SETTINGS, 2D PERSPECTIVE/3D DISPLAYS AND SATELLITE OVERLAY
6.2 2D Perspective Dispay
The 2D perspective display provides an aerial perspective display. Select [2D/3D]
Mode and [2D Perspective] from the RotoKey menu to show this display.
2D display
2D perspective display
6-5
Page 74

6. MAP SETTINGS, 2D PERSPECTIVE/3D DISPLAYS AND SATELLITE OVERLAY
6.3 3D Display
6.3.1 3D display description
The 3D display has native 3D chart design that allows full time 3D presentation. This
true 3D environment gives you all of the information you require with no restrictions on
the information you can see. You can plan your routes, enter points, etc. like on the
2D chart. To show the 3D display, select [2D/3D Mode] and [3D] from the RotoKey
menu. The 3D icon, whose appearance changes according to display adjustment
state, appears to the right of the orientation mode box.
The 3D display provides a 3D view of land and sea around your boat. Land is shown
in different shades of green according to height above the sea level. Water is shown
in different shades of blue according to depth. The 3D display has most of the same
information as the 2D display. With both presentations available you can see the conditions around your boat from different angles. The 3D display helps you navigate
when you are in waters that you do not know. Also, most functions of the 2D display,
for example, destination setting, are available in the 3D display.
For best results make sure you have accurate position and heading data.
GPS 3D
Course Up
20 NM
6-6
Page 75

6. MAP SETTINGS, 2D PERSPECTIVE/3D DISPLAYS AND SATELLITE OVERLAY
6.3.2 How to tilt and rotate the 3D display
To tilt and rotate the 3D display, first select [Mode] and [Manual] from the RotoKey
menu. [Manual] appears in the orientation mode box. Long-push the ENT key to enable adjustment. The appearance of the 3D icon changes as shown in the illustration
below.
3D adj.
disabled
ENT
ENT
3D adj.
enabled
Tilt the chart: Operate the up and down arrow pads on the CursorPad.
Rotate the chart: Operate the right and left arrow pads on the CursorPad.
After you complete the adjustment, long-push the ENT key to confirm settings. To escape from the manual adjustment mode, select an orientation mode from the RotoKey
menu.
6.3.3 How to make the 3D view clearer
In the 3D display, some topographical features are easier to see if you use the [3D
Exaggeration Factor]. This feature expands both objects on the chart and the underwater vertically so that you can easily see the shape of the objects and position. To
adjust the exaggeration feature, open the [MAP] menu, select the [CHART DISPLAY]
menu and set the level with [3D EXAGGERATION FACTOR]. Five levels are available. The higher the level the greater the degree of exaggeration. The example below
compares the same picture in Level 1 and Level 5 exaggerations.
Land
Level 1 exaggeration Level 5 exaggeration
6-7
Page 76

6. MAP SETTINGS, 2D PERSPECTIVE/3D DISPLAYS AND SATELLITE OVERLAY
6.4 Satellite Photo Overlay
You can overlay the satellite photo for your area on the 2D and 3D displays. Open the
RotoKey menu then select [2D/3D Mode], [2D] or [3D] and [Vector/Satellite] to show
the satellite photo.
The illustration below shows the vector chart with the satellite photo overlay.
How to set the level of transparency
You can select the level of transparency for the parts of the satellite photo that are on
water. Open the [MAP] menu and select [CHART DISPLAY] and [TRANSPARENCY].
Set the level in three digits, from 0 to 100. The higher the number the greater the degree of transparency.
6-8
Page 77

7. FISH FINDER OPERATIONS
7.1 How the Fish Finder Works
The fish finder calculates the distance between its transducer and underwater objects
like fish, lake bottom or seabed. The results are shown in different colors or shades of
gray according to echo strength.
The ultrasonic waves transmitted through water move at a constant speed of approximately 4800 feet (1500 meters) per second. When a sound wave “hits” an underwater
object like fish or sea bottom, part of the sound wave is reflected toward the source.
To find the depth to an object, the fish finder calculates the time difference between
the transmission of a sound wave and the time the reflected sound wave is received.
The picture displayed by the fish finder contains a series of vertical scan lines. Each
line is a "picture" of the objects under your boat. The series of pictures are put sideby-side across the screen to show the contours of the bottom and echoes from fish.
The amount of history of objects that have moved under your boat can be less than a
minute to more than one minute depending on the picture advance speed.
7-1
Page 78

7. FISH FINDER OPERATIONS
7.2 Fish Finder Display
The fish finder screen provides a “picture” of the echoes found by the fish finder. Echoes are scrolled across the screen from the right position to the left position. The number of minutes an echo is displayed on the screen is controlled by the picture advance
speed.
The echoes at the right position are the current echoes. These echoes can be from
individual fish, a school of fish, or the bottom. Depth to the bottom is indicated always,
provided the gain is set correctly.
Both low and high TX frequencies are provided. (Frequencies depend on the transducer connected.) The low frequency has a wide detection area, which is useful for
general detection and understanding bottom conditions. The high frequency has a
narrow beam width that helps you inspect fish.
The range, gain, clutter and TVG can be adjusted automatically according to your purpose (cruising or fishing) to let you do other tasks.
The color bar at the left edge of the display shows the range of colors used to display
different echo strengths. Weaker echoes appear in colors near the bottom of the bar,
and stronger echoes appear in colors near the top.
Frequency
(LF or HF)
Color
bar
Depth
indication
Mode (Fishing,
Cruising or Manual)
VRM
Bottom echo
Auto Range
(No indication for
manual range)
School of
fish
Minute marker
(each bar is equal
to 30 seconds)
Zero
line
Elapsed time,
VRM depth
Range
scale
7-2
Appears when simulation
mode is active.
Note: The depth indication on the fish finder display is the sounding value from the
internal fish finder. The DEPTH indication in the data box is the sounding value from
the equipment selected in the [INTERFACE] - [SELECT INPUT DEVICE] menu. Then,
the depth value in the data box can be different if the data is fed from an external device.
Page 79

7. FISH FINDER OPERATIONS
7.3 How to Activate the Fish Finder
Select a fish finder display at the home screen. See section 1.8.
7.4 How to Select a Display
Your fish finder has these display modes: single frequency (50 kHz or 200 kHz), dual
frequency (50 kHz + 200 kHz), bottom lock, bottom zoom, marker zoom, A-scope, and
bottom discrimination.
7.4.1 How to select a single frequency or dual frequency
Single frequency
The single frequency display shows either
the low-frequency or high-frequency picture
on the full screen. Select a frequency according to your purpose.
• A low frequency gives a wide detection area. Use the low frequency for general
search and to find bottom conditions.
Low
frequency
High
frequency
• A high frequency gives better resolution.
Use the high frequency to inspect a school
of fish.
To select a single frequency display, open
the RotoKey menu, select [Frequency] then [200 kHz] or [50 kHz].
Dual frequency
The dual frequency display provides both low- and high-frequency pictures. Use the
dual frequency display to compare the same picture with two different soundingfrequencies. The low-frequency picture is on the left, and the high-frequency is on the
right.
Low
frequency
High
frequency
Freq.
Beamwidth Resolution
(kHz)
Low
Wide
Low
Detection
range
Deep
Bottom
tail
Long
High
Narrow
High
Shallow
Short
To select a dual frequency display, open the RotoKey menu then select [Frequency] and [Dual].
7-3
Page 80

7. FISH FINDER OPERATIONS
7.4.2 How to select a zoom display
The zoom displays appear on the left-half of the screen and the high or low frequency
display on the right half. Three zoom displays are available: bottom lock, bottom zoom
and marker zoom.
How to activate a zoom display
Open the full RotoKey menu, select [Zoom] then [Btm Lock], [Btm Zoom] or [Mkr
Zoom]. To deactivate the zoom display, select [Off] after selecting [Zoom].
Bottom lock display
The bottom lock display provides a compressed normal picture on the right half and a
7 to 400 feet (3 to 120 meter) wide layer in contact with the bottom is expanded on the
left half. This display helps you distinguish the fish near the bottom from the bottom
echo. You can select the bottom lock range with [BOTTOM LOCK RANGE] in the
[RANGES] menu in the [FISH FINDER] menu.
Bottom lock display Single freq. display
Zoomed
school of fish
Bottom shown as a straight line
School of fish
Zoom marker
This area zoomed
and displayed on
left 1/2 of screen.
Bottom zoom display
The bottom zoom display expands the bottom and the fish near the bottom according
to the zoom range selected with [ZOOM RANGE] in the [RANGES] menu in the [FISH
FINDER] menu. This display helps you find the density of the bottom. A bottom displayed with a short echo tail normally indicates a soft bottom (sand bottom, etc.). A
long echo tail indicates a hard bottom.
Bottom zoom display
Single freq. display
7-4
Bottom
Zoom marker
Zoom marker
automatically
follows change in
depth.
Page 81

7. FISH FINDER OPERATIONS
Marker zoom display
The marker zoom display expands a selected area of the normal fish finder picture to
full vertical size of the screen on the left-half window. You can select the part to expand with the VRM (Variable Range Marker). Move the zoom marker with the Cursor-
Pad. The area between the VRM and zoom marker is expanded. The marker can be
shown or hidden with [ZOOM MARKER] in the [FISH FINDER] menu.
Marker zoom display
Zoomed
fish echo
7.4.3 A-scope display
The A-scope display appears at the right 1/16 of the screen and is available in any fish
finder mode. This display shows the echoes at each transmission with the amplitudes
and tone in balance with their intensities. This display helps you identify possible fish
species and bottom structure. To show or hide the A-scope display, open the full RotoKey menu then select [A-scope] to activate or deactivate the display.
Single freq. display
School of fish
VRM
This area zoomed on
left half of screen
Zoom marker
Weak reflection
(small fish or noise)
Fish echo
Single frequency display
A-scope display
"Peak"
shows past
amplitude
with dots.
Strong
reflection
(bottom)
A-scope peak hold
You can show the "normal" A-scope display plus the peak-hold amplitude picture for
the last five seconds in dots. To show the peak hold display, turn on [A-SCOPE PEAK
HOLD] in the [FISH FINDER] menu.
7-5
Page 82

7. FISH FINDER OPERATIONS
7.4.4 Bottom discrimination display
The bottom discrimination display analyzes the bottom echo to categorize bottom
hardness in one of four types (rocks, gravel, sand, mud) and shows the results in a
colorful graphic display. A transducer or triducer that supports the bottom discrimination display is required.
There are two bottom discrimination displays: graphic and probability.
Graphic display: The most probable material on the bottom (mud, sand, gravel, rock)
is indicated graphically.
Probability
bar
Bottom
discrimination
Hardness legend
display column
Rock Gravel Sand Mud
Probability bar:
Degree of trust for bottom discrimination display
(Green, Normal; Yellow, Caution;
Background color, Abnormal)
Probability display: The most probable bottom material is indicated in proportion.
Probability
bar
Bottom
Hardness
legend
Graph example
Graph example
Mud probability
(Approx. 25%)
Sand probability
(Approx. 25%)
Rock probability
(Approx. 50%)
Mud
Sand
Gravel
Rock
discrimination
display column
7-6
Characteristics of the bottom discrimination display
• The bottom discrimination display provides an estimate of bottom composition. Actual composition may be different.
Page 83

7. FISH FINDER OPERATIONS
• The 600 W transducers and triducers that support the bottom discrimination feature
are 520-5PSD, 520-5MSD, 525-5PWD, 525STID-MSD, 525STID-PWD.
• The 1 kW transducers that support the bottom discrimination feature are 50/200-1T
and 50/200-12M.
• The high and low frequencies are alternately transmitted, regardless of current display selection. The TX interval is slower when this feature is active.
• Operating environment:
- Depth: 16 to 328 ft
- Speed: 10 knots or less
• The bottom discrimination feature uses the distance from your boat’s draft. Be sure
to enter your boat’s draft.
How to set the bottom discrimination display
1. Open the [FISH FINDER] menu and select [BOTTOM].
2. Select [BOTTOM DISCRIMINATION].
3. Select [Graphic], [Probability] or [Off].
[Graphic]: Show the most probable bottom composition in four colors or graph
form.
[Probability]: Show the most probable bottom composition in graph form.
[Off]: Turn off the bottom discrimination display.
4. Select [LEGEND].
5. Select [On] or [Off] to show or hide the hardness legend (at the bottom of the bot-
tom discrimination display).
Graphic legend
6. Press the ESC/MENU key to close the menu.
Probability legend
7-7
Page 84

7. FISH FINDER OPERATIONS
7.5 Automatic Fish Finder
Your fish finder can be adjusted automatically, allowing you to do other tasks.
7.5.1 How the automatic fish finder works
The automatic fish finder function automatically adjusts the gain, clutter, TVG and
echo offset. The main features of the automatic mode are as shown below.
• Gain adjusts the sensitivity of the receiver to show the bottom echo in reddishbrown, the strongest echo (default color arrangement).
• Clutter automatically reduces low-level noise like plankton.
• The TVG function is automatically adjusted.
• The echo offset balances the gain on high and low frequencies.
• Range is adjusted automatically to always show the bottom echo.
7.5.2 How to select an automatic fish finder mode
There are two types of automatic fish finder modes: Cruising and Fishing. Cruising
tracks the bottom, and Fishing searches for schools of fish. Cruising uses a higher
clutter removal setting than Fishing. Do not use Cruising when your purpose is to find
fish, because the clutter removal circuit can erase weak fish echoes.
To select an automatic mode, open the RotoKey menu then select [Auto Mode] followed by [Fishing] or [Cruising].
7.5.3 How to adjust the gain in the auto mode
The gain controls how echoes of different strengths are displayed. Gain is automatically adjusted; however, you can fine tune the gain according to meet local characteristics, etc. Set the gain to show a slight amount of noise on the screen. Increase the
gain for greater depths and lower the gain for shallow waters.
To adjust the gain, open the RotoKey menu then select [Gain 50k] or [Gain 200k] followed by the soft control labeled with the frequency you want to adjust. The corresponding adjustment windows appears. Rotate the key clockwise to increase the gain,
counterclockwise to decrease it.
7-8
Page 85

7.6 Manual Fish Finder Operation
Use the manual operation to see schools of fish and the bottom echo with a fixed gain
setting.
The gain, range and range shift functions let you select the depth you can see on the
screen. The basic range provides a "window" into the water column and range shift
moves the" window" to the depth that you select.
To select the manual mode, open the RotoKey menu then select [Auto Mode] and
[Manual].
7.6.1 How to select a display range
Range can be selected automatically or manually. Open the RotoKey menu then select [Auto Range] and [Auto] or [Manual].
[Auto]: The range is automatically adjusted to always display the bottom echo at the
lower of the screen. When rotate the RotoKey
Range mode. Can’t change Rage.” appears.
TM
in the auto mode, the message “Auto
7. FISH FINDER OPERATIONS
[Manual]: Change the range with the RotoKey
the range and counterclockwise to decrease the range.
Unit
m
ft
fm
HR
pb
2
1
5
5
3
83
Basic Range
3
456 7
2010
40
80
400
200120603015
2010
40
15
30
1005030
100
501053
80
7.6.2 How to shift the range
The basic range and range shift functions let you select the depth you can see on the
screen. This function is not available when the auto range mode is on or the bottom
discrimination feature is active.
300150
1000
150
200
200
TM
. Turn the key clockwise to increase
8
500
1500
300
300
HR=Hiro (Japanese unit of depth)
300
pb=passi/braza
Window can be
shifted up and
down to select
starting depth.
Display
7-9
Page 86

7. FISH FINDER OPERATIONS
To adjust the shift, open the full RotoKey menu then select
[Shift] to show the [Shift] window. Turn the key clockwise to increase the shift, counterclockwise to decrease the shift.
7.6.3 How to adjust the gain
The gain controls how echoes of different strengths are displayed. Set the gain to show a slight amount of noise on the screen. Increase the gain
for greater depths and lower the gain for shallow waters.
CAUTION
Adjust the gain correctly.
Incorrect adjustment can lead to a
dangerous situation if the boat is steered
according to the depth indication.
Gain too high
To set the gain, open the RotoKey menu then select [Gain 50 kHz] or [Gain 200 kHz]
to show the [Gain] window. Turn the key clockwise to increase the gain, counterclockwise to decrease the gain. 100 is the maximum gain.
Gain proper
Gain too low
7.6.4 How to reduce clutter
Low intensity “spots” of noise appear over most of screen like in the illustration shown
below. These spots of noise are caused by sediment in the water or noise.
7-10
To reduce clutter, open the full RotoKey menu then select [Sensitivity] and [Clutter] to
show the [Clutter] window. Turn the key clockwise adjust the clutter. Clockwise rotation increases the clutter reduction.
Page 87

Clutter
7.7 Picture Advance Speed
The picture advance speed controls how quickly the vertical scan lines move across
the screen. A fast advance speed expands the size of a school of fish horizontally on
the screen. A slow advance speed shortens the school of fish. Use a fast advance
speed to see the hard bottom. Use a slow advance speed to see the smooth bottom.
7. FISH FINDER OPERATIONS
Fast
1. Open the [FISH FINDER] menu and select [PICTURE ADVANCE].
2. Select a picture advance speed. The options in the window indicate the
number of scan lines made per transmission. For example, [1/2]
creates one scan line per two transmissions. [1/16] is the slowest advance speed and [2/1] is the fastest speed. [STOP] stops picture advance, and is useful for taking a screenshot or photo.
Slow
CAUTION
The picture is not refreshed when the picture advancement is stopped.
Maneuvering the vessel in this condition can
cause grounding.
7-11
Page 88

7. FISH FINDER OPERATIONS
7.8 How to Reduce Interference
Interference from other fish finders and electrical equipment appears on the screen as
shown in the illustration. When these types of interference appear on the screen, use
the interference rejector to reduce the interference. Three levels are available. Turn
off the interference rejector when there is no interference, so that you do not erase
weak echoes.
Interference from
other fish finder
To reduce interference, open the full RotoKey menu then select [Sensitivity] and [Interference] to show the [Interference] window. Select the level of interference reduction to use. [High] provides the greatest degree of interference reduction.
Interference from
electrical equipment
on your boat
7.9 How to Erase Weak Echoes
Sediment in the water and reflections from plankton
appear on the display in low-intensity colors.
To erase weak echoes, open the full RotoKey menu
then select [Sensitivity] and [Color Erase] to show
the [Color Erase] window. Select a low percentage
to erase weak echoes. Increase the percentage to
erase strong echoes.
Weak
echoes
7-12
Page 89

7. FISH FINDER OPERATIONS
0
20
30
7.10 How to Measure Depth, Time Between Locations
You can measure the depth to an object with the VRM. Also, you can measure the time
from the right edge to a location. For example, you can measure how many minutes
ago the echo appeared.
To measure the depth, press the up and down arrow pads on the CursorPad to put
the VRM on the object to measure the depth. To measure time, press the right and left
arrow pads on the CursorPad.
The VRM cannot be operated when the Gain adjustment window is active.
0
Time elapsed
0’07”
14.2
101010
20
20
VRM depth
30
30
7.11 How to Balance Echo Strength
A school of fish at a depth deeper than a school of equal strength in shallow waterappears in weaker colors. This condition is caused by the attenuation of the ultrasonic
wave. To display the schools of fish in the same colors, use the TVG. The TVG automatically adjusts the gain with depth so that echoes of the same strength and different
depths are shown in the same colors.
Unwanted echoes
from surface
0 ft
300 ft
Unwanted echoes
are erased.
0 ft
300 ft
Echoes of the same size
are displayed in different
sizes and colors
depending on depth.
Echoes of the same size
are displayed in same
sizes and colors.
Do the following to balance echo strength:
1. Open the [FISH FINDER] menu then select [FISH FINDER SETUP].
2. Select [50 kHz TVG] or [200 kHz TVG].
3. Enter TVG value. Lower the TVG setting to decrease the gain for near distance.
7-13
Page 90

7. FISH FINDER OPERATIONS
4. Press the ESC/MENU key to close the menu.
7.12 White Marker
The white marker displays the selected echo strength in white.
Use this feature to distinguish fish near the bottom from the
bottom echo.
Off
Open the full RotoKey menu then select [Sensitivity] and
[White Marker] to show the [White Marker] window. Select
[On]. Select the current the value, push the RotoKey
tate the key to set the echo strength number to display in white then push the key. The
higher the number, the stronger echo is displayed in white. The selected color is
marked in white on the color bar.
7.13 White Line
The white line feature displays the leading edge of the bottom
echo in white to help you distinguish bottom fish from the bottom echo.
Open the full RotoKey menu then select [Sensitivity] and
[White Line] to show the [White Line] window. Select the val-
ue, push the RotoKey
push the key. The larger the number the greater the width of the line. Select [White
Edge On] to show the contour of the bottom in white.
TM
TM
, rotate the key to set the width then
00
, ro-
White Edge Off
0%
7.14 Alarms
There are four types of alarms that produce audio and visual alerts to alert you fish
within an area, fish length, and bottom type.
The fish alarm alerts you to a school of fish in the alarm zone.
The fish alarm (B/L) alerts you when a fish is within the specified distance from the
bottom. Available when the bottom lock display is active.
The fish size alarm alerts you when a fish of the specified length is in the alarm zone.
Available when the ACCU-FISH
The bottom type alarm alerts you when the bottom type (rock, sand, mud, gravel)
matches both the bottom type and probability percentage selected. Available when
the bottom discrimination display is active.
When the conditions of an alarm are met, the buzzer sounds and the applicable alarm
icon appears at the top of the screen. Silence the buzzer by pressing the ESC/MENU
key. The icon remains on the screen until the offending alarm is disabled or the condition that caused the alarm has ended.
TM
feature is active.
7-14
Page 91

7.14.1 How to set an alarm
Alarm
Range
A
R
h
1. Open the [ALARMS] menu and select [FISH ALARM], [FISH ALARM (B/L)], [FISH
SIZE ALARM] or [BOTTOM TYPE ALARM]. An alarm setting window appears.
7. FISH FINDER OPERATIONS
Off
Depth 0.0 ft
Range 5 ft
Fish Alarm,
Fish Alarm (B/L)
Min: 5 inch
Max: 199 inch
Off
Probability 70
Bottom Type Alarm
Fish Size Alarm
2. For the alarms other than [BOTTOM TYPE ALARM], select [On] on the first line
of the alarm setting window.
3. Do one of the following depending on the alarm selected at step 1.
[FISH ALARM], [FISH ALARM (B/L)]: Set the start depth with [Depth]. Set the
alarm range with [Range]. See the figure below for details.
Surface
Alarm Range
larm
Fish Alarm
s
[Depth]
(from sea surface)
[Range]
[Range]
Alarm
Range
Fish Alarm for Bottom Lock
[Depth]
(from bottom)
Bottom
[FISH SIZE ALARM]: Set the minimum and maximum lengths at [Min] and [Max].
[BOTTOM TYPE ALARM]: Set the alarm referring to the illustration shown below.
Select the type of bottom for
which you want to be alerted.
Set the percentage of
probability (50-90%)
that triggers the alarm.
7.14.2 How to select the echo signal level that triggers the fish alarm
You can specify the echo signal level that triggers the fish alarm. Open the [ALARMS]
and [FISH ALARM LEVEL] menus. Select [High], [Medium] or [Low] as appropriate.
7-15
Page 92

7. FISH FINDER OPERATIONS
7.15 ACCU-FISH
The ACCU-FISHTM feature measures the length of individual fish and tags the fish
with a fish symbol whose size is scaled to the length of the fish. The length or depth
of the fish can be indicated digitally. Connection to a transducer that supports ACCU-
TM
FISH
is required.
TM
7.15.1 Considerations for ACCU-FISH
• The fish length calculated by this fish finder is intended for reference purposes; it is
not a completely accurate measurement of fish length.
• The 600 W transducers which support ACCU-FISH
525-5PWD, 525STID-MSD and 525STID-PWD.
• To display fish marks and fish size using a 1 kW transducer, the integrated transducer 50/200-1T or 50/200-12M is recommended.
• Echo intensity depends on fish species. When the fish length differs between the
indicated length and the actual length, you can compensate the difference on the
[FISH FINDER] menu.
• ACCU-FISH
• High and low frequencies are alternately transmitted when ACCU-FISH
regardless of mode selection.
TM
is inoperative when the zero line rejector is active.
TM
TM
are 520-5PSD, 520-5MSD,
TM
is active,
• A fish whose depth is shallower than 2 m or greater than 100 m cannot be measured.
• In a school of fish, echoes overlap one another, so the margin of error will be greater.
• The bottom echo must be present to show the fish symbols.
• The TX pulse length changes according to ACCU-FISH
es a difference in both sensitivity and the echoes viewed.
TM
On/Off state. This caus-
7-16
Page 93

7.15.2 How to activate ACCU-FISH
1. Open the [FISH FINDER] and [ACCU-FISH] menus.
2. Select [FISH INFO] to activate or deactivate ACCU-FISH
mation to display.
[Off]: Deactivate ACCU-FISH
[Fish Size]: Show fish size.
[Depth]: Show depth to the fish.
Fish length or depth
is shown in red.
TM
7. FISH FINDER OPERATIONS
TM
, select display information
TM
and select the infor-
.
Note: You can show the fish info figure alone (without fish symbol) by turning off
[FISH SYMBOLS].
3. Select [INFO SIZE] to choose the size of the fish info indication, [Small] or [Large].
4. Select [FISH SYMBOLS] to choose the style for the fish symbol, [Off], [Solid] or
[Striped]. The size of the symbol is scaled according to fish length.
Striped
Large fish symbol
(more than 50 cm, or
more than 20 inches)
Small fish symbol
(10 to 49 cm, or 4 to
19 inches)
7.15.3 Fish size correction
The fish size shown on the display can be different from the true size. If the size indicated is wrong, add an offset to the measured value to get an accurate indication on
the screen. Open the [FISH FINDER] and [ACCU-FISH] menus and select [FISH SIZE
CORRECTION]. Use the RotoKey
range is -80% to +100%, in intervals of 10%.
Solid
TM
to set a correction percentage. The setting
Setting Revised fish length
+100 Two times
+50 1.5 times
-50 1/2
-65 1/3
-75 1/4
-80 1/5
7-17
Page 94

7. FISH FINDER OPERATIONS
7.16 Water Temperature Graph
The water temperature graph, which requires a temperature sensor, shows the surface water temperature.
The water temperature indication (line) moves across the screen from right to left. The
water temperature scale is available in degrees Celsius or Fahrenheit, one of which
you can select with [TEMPERATURE] in the [UNITS OF MEASURE] menu in the
[SYSTEM] menu.
You can activate or deactivate the graph with [TEMPERATURE GRAPH] in the [FISH
FINDER] menu.
Temperature
scale
Temperature
graph
7-18
Page 95

7.17 FISH FINDER Menu
This section provides the descriptions for the items in the [FISH FINDER] menu that
have not been mentioned previously.
7. FISH FINDER OPERATIONS
Scroll
[BACKGROUND COLOR]: Select the background color, among black, dark blue,
light blue, white and monochrome (echoes appear in tones of gray.)
[COLOR BAR]: Turn the color bar on or off.
[BOTTOM RANGE SHIFT AREA]: Select the area where to show the bottom echo,
when Auto Range is active. For example, setting 75% would place the bottom echo at
a position equivalent to 75% from the top of the display.
[ZERO LINE REJECTION]: Turn the zero line (transmission line) on or off. When
turned on, the transmission line disappears, which allows you to see fish echoes near
the surface clearly. The length of the transmission line changes with transducer used
and installation characteristics. If the width of the transmission line is 4.5 ft (default value) or more, set the transmission line width with [ZERO LINE RANGE].
[ZERO LINE RANGE]: This feature adjusts the transmission line so that the line disappears when the menu item [ZERO LINE REJECTION] is turned on. For a long tail,
increase the value. If the transmission line does not disappear, lower the TX power.
[FULL SCREEN GAIN CONTROL]: The gain setting can be applied to only new echoes or new and existing echoes. Turn this feature on to get the gain setting applied to
both new and existing echoes. The advantage of the full screen gain control is that you
can quickly and easily find the right gain setting for your conditions.
7-19
Page 96

7. FISH FINDER OPERATIONS
[FISH FINDER SETUP]: The [FISH FINDER SETUP] sub menu provides the following
features.
Scroll
Item Function
[TRANSMISSION] Turn transmission on or off.
[TRANSMISSION POWER] Set the transmission power, [High] or [Low]. Interfer-
ence may appear on the screen when an echo sounder
having the same frequency as your own is being operated in the vicinity of your boat. In this case, select low
power and contact the other vessel to request them to reduce their TX power.
[TRANSDUCER] Select the transducer used. If you use the optional triduc-
er 525STID-MSD or 525STID-PWD, you do not need to
select the transducer.
[TRANSMIT RATE] Change pulse repetition rate. Normally, the highest rate
(20) is used. When in shallow waters second re-flection
echoes may appear between the surface and actual bottom echo. In this case, lower the TX transmit. The [[Auto]] setting automatically adjusts the frequency and pulse
length with depth.
[50 kHz ECHO OFFSET],
[200 kHz ECHO OFFSET]
The echo offset feature compensates for too weak or too
strong echo level. If the on-screen echo level appears to
be too weak or too strong and the level cannot be adjusted satisfactorily with the gain controls, apply an offset to
correct the level.
7-20
Page 97

7. FISH FINDER OPERATIONS
Item Function
[50 kHz BOTTOM LEVEL],
[200 kHz BOTTOM LEVEL]
[SMOOTHING] If echoes appear “spotty” adjust smoothing to smooth
[DEPTH INFORMATION] Hide or show the depth indication and select its size,
In the default bottom level setting (0), the equipment
judges consecutive strong echoes to be bottom echoes.
If, in that setting, the depth indication is unstable, adjust
the bottom level. If strong vertical lines extend upward
from the bottom echo in the bottom lock display, lower
the bottom level to weaken the vertical lines. If the level
is too low, however, it may be difficult to distinguish bottom fish from the bottom echo.
echoes. The higher the setting the greater the smoothing.
[Large] or [Small].
[SENSOR SETUP]: The [SENSOR SETUP] sub menu provides the following features.
+0.0 ft
+0%
+0.00°F
+0 m/s
Item Function
[DRAFT] The default depth measurement method is the distance
between the transducer and the bottom. To get the depth
from the sea surface to the bottom, enter the ship’s draft.
Entry of the ship’s draft is required if the bottom discrimination display is used.
[SPEED CALIBRATION] If the speed sensor generated speed is not correct, you
can add an offset to correct the on-screen speed indication. (NMEA format speed cannot be corrected.) For
example, if the indication is +5% faster than the actual
value, enter -5.
[TEMPERATURE
CALIBRATION]
[ACOUSTIC SPEED
CALIBRATION]
If the temperature sensor generated speed is not correct, you can add an offset to correct the on-screen temperature indication. (NMEA format temperature cannot
be corrected.) For example, if the temperature indication
is 2° lower than the actual value, enter +2.
The velocity of the acoustical pulse through water can
vary depending on water conditions, which can affect the
depth indication. Normally, adjustment of this setting is
not necessary. If you feel the depth indication is continuously wrong, contact a FURUNO agent or dealer for advice.
7-21
Page 98

7. FISH FINDER OPERATIONS
[RANGES]: The default range settings are suitable for most applications. However,
you can customize the ranges to suit your needs, with [RANGE 1] - [RANGE 8]. Set
the ranges in descending order. Be sure that each range is higher than its preceding
range.
15 ft
30 ft
60 ft
120 ft
200 ft
400 ft
1000 ft
1500 ft
30 ft
30 ft
7.18 Interpreting the Display
Zero line
The zero line (transmission line) shows
the position of the transducer. The line
disappears from the screen when the
range is shifted.
Bottom echoes
The strongest echoes are from the bottom, and are normally shown in reddish-brown
or red. The colors and the width change with bottom material, depth, sea condition,
installation, frequency, pulse length and sensitivity.
Difference in depth
Zero
line
Range shifted
Difference in sensitivity
7-22
Second
bottom echo
Page 99

7. FISH FINDER OPERATIONS
Large school
Small school
Bottom contour
The tail from a hard bottom is longer than the tail from a soft bottom, because the hard
bottom reflects more of the ultrasonic pulse. An echo from shallow water gives a stronger reflection than the echo received from deep water. A longer bottom tail appears
on slopes, because of the difference in travel time at both edges of the beam angle.
For the rough bottom, echoes are reflected on many different planes, which displays
echoes in many layers, giving a 3D effect.
Soft bottom
Hard bottom
Rough bottom
Nature of a bottom
The nature of a bottom is known from the intensity
and length of the bottom tail. To find the nature of
a bottom, use a long pulse length and normal
gain. For the hard and rough bottom, the bottom
echo is reddish-brown with a long tail. For the mud
or sand bottom, the bottom echo has less red and
with a short tail. A bottom with a lot of small particles can give a long tail on the low frequency picture.
Mud & sand
Rock base
Fish quantity
The size and density of a school of fish are indicators of the quantity of fish.
Large school
Size and density of school of fish
Small school
7-23
Page 100

7. FISH FINDER OPERATIONS
o
g
Sounding time for a shallow school of fish
ho
Size of a school of fish
Usually the size of fish echoes on the screen is proportional to the actual size of the
school of fish. However, if two fish echoes appear at different depths with the same
size, the school of fish at the shallower depth is displayed smaller because the ultrasonic beam widens as it propagates and a school of fish in deep water is displayed
larger.
School depth and sounding time
Sounding time for a shallow school of fish
Sounding time for a deep school of fish
ounding tim
for
school
Density of a school of fish
If two schools appear with the same color at different depths, the one in deeper water
is denser because the ultrasonic wave attenuates as it propagates and the school of
fish in deep water tends to be displayed in a weaker color.
Difference in signal strength
Less reddish
(Sparse echo)
Fish echoes at
the same depth
Reddish
(Dense echo)
Weak echo
ec
Strong echo
Bottom fish
The echoes from the bottom are stronger than
the bottom fish echoes so that you can distin-
Bottom fish echo
guish between them by colors. The bottom echoes are normally shown in reddish-brown or red,
the bottom fish echoes in weaker color.
7-24
 Loading...