

Page 1

User Guide - English
Fujitsu Software ServerView Suite
ServerView Event Manager
ServerView Operations Manager V6.20
Edition June 2013
Page 2

Comments… Suggestions… Corrections…
The User Documentation Department would like to
know your opinion of this manual. Your feedback helps
us optimize our documentation to suit your individual
needs.
Feel free to send us your comments by e-mail to
manuals@ts.fujitsu.com.
Certified documentation
according to DIN EN ISO 9001:2008
To ensure a consistently high quality standard and
user-friendliness, this documentation was created to
meet the regulations of a quality management system
which complies with the requirements of the standard
DIN EN ISO 9001:2008.
cognitas. Gesellschaft für Technik-Dokumentation mbH
www.cognitas.de
Copyright and Trademarks
Copyright © 2013 Fujitsu Technology Solutions GmbH.
All rights reserved.
Delivery subject to availability; right of technical modifications reserved.
All hardware and software names used are trademarks of their respective manufacturers.
Page 3

Contents
1 Introduction . . . . . . . . . . . . . . . . . . . . . . . . . . . . 7
1.1 Changes from the previous version . . . . . . . . . . . . . . . 8
1.2 ServerView Suite link collection . . . . . . . . . . . . . . . . . 9
1.3 Documentation for ServerView Suite . . . . . . . . . . . . . 10
1.4 Notational conventions . . . . . . . . . . . . . . . . . . . . 11
2 Event Manager . . . . . . . . . . . . . . . . . . . . . . . . . 13
2.1 First-time startup . . . . . . . . . . . . . . . . . . . . . . . . 14
2.2 Starting the Event Manager . . . . . . . . . . . . . . . . . . 15
2.3 Icons . . . . . . . . . . . . . . . . . . . . . . . . . . . . . . 16
3 Alarm Monitor . . . . . . . . . . . . . . . . . . . . . . . . . 19
3.1 Viewing alarms . . . . . . . . . . . . . . . . . . . . . . . . . 19
3.2 Viewing alarms for a server . . . . . . . . . . . . . . . . . . 24
3.3 Filtering alarm entries . . . . . . . . . . . . . . . . . . . . . 24
3.4 Processing alarm entries . . . . . . . . . . . . . . . . . . . 25
3.4.1 Acknowledging alarms . . . . . . . . . . . . . . . . . . . . . . 25
3.4.2 Suppressing alarms . . . . . . . . . . . . . . . . . . . . . . . 25
3.4.3 Resetting alarm suppression . . . . . . . . . . . . . . . . . . 26
3.4.4 Deleting alarms . . . . . . . . . . . . . . . . . . . . . . . . . 26
3.5 Testing the connection . . . . . . . . . . . . . . . . . . . . . 27
3.6 Other settings . . . . . . . . . . . . . . . . . . . . . . . . . 28
3.6.1 Editing an alarm note . . . . . . . . . . . . . . . . . . . . . . 28
3.7 iRMC S2/S3 SEL entries relayed as SC2 MIB traps . . . . . 29
ServerView Event Manager
Page 4

Contents
4 Alarm configuration . . . . . . . . . . . . . . . . . . . . . . . 37
4.1 Alarm rules . . . . . . . . . . . . . . . . . . . . . . . . . . . . 39
4.1.1 Managing alarm rules . . . . . . . . . . . . . . . . . . . . . . . 40
4.1.2 Assigning servers . . . . . . . . . . . . . . . . . . . . . . . . . 43
4.1.2.1 Displaying server information . . . . . . . . . . . . . . . . . 45
4.1.3 Assigning alarms . . . . . . . . . . . . . . . . . . . . . . . . . 47
4.1.4 Forwarding alarms . . . . . . . . . . . . . . . . . . . . . . . . 51
4.2 Filter rules . . . . . . . . . . . . . . . . . . . . . . . . . . . . 55
4.2.1 Server filters . . . . . . . . . . . . . . . . . . . . . . . . . . . 55
4.2.2 Filtering alarms . . . . . . . . . . . . . . . . . . . . . . . . . . 56
4.3 Making settings . . . . . . . . . . . . . . . . . . . . . . . . . 58
4.4 Mail forwarding in general . . . . . . . . . . . . . . . . . . . 59
4.5 Mail and Execute forwarding to the service provider . . . . . 63
4.6 Making pop-up settings . . . . . . . . . . . . . . . . . . . . . 67
4.7 Making pager settings
(COM port and modem) . . . . . . . . . . . . . . . . . . . . . 69
4.8 Making execute settings . . . . . . . . . . . . . . . . . . . . 72
I . . . . . . . . . . . . . . . . . . . . . . . . . . . . . . . . . . 74
4.9 Making broadcast settings . . . . . . . . . . . . . . . . . . . 74
4.10 Making trap settings . . . . . . . . . . . . . . . . . . . . . . . 77
4.11 Macros . . . . . . . . . . . . . . . . . . . . . . . . . . . . . . 79
4.12 Alarm configuration example . . . . . . . . . . . . . . . . . . 80
5 Traps . . . . . . . . . . . . . . . . . . . . . . . . . . . . . . . 83
5.1 Displaying trap information . . . . . . . . . . . . . . . . . . . 83
5.2 Displaying traps in the Windows event log . . . . . . . . . . 86
5.3 Trap overview . . . . . . . . . . . . . . . . . . . . . . . . . . 86
5.3.1 Adaptec traps (Duralink.mib) . . . . . . . . . . . . . . . . . . . 92
5.3.2 APC traps (Powernet.mib) . . . . . . . . . . . . . . . . . . . . 92
5.3.3 Blade System traps (s31.mib) . . . . . . . . . . . . . . . . . . 95
5.3.4 Cluster traps (NTCluster.mib) . . . . . . . . . . . . . . . . . . 100
5.3.5 DPT traps (dptscsi.mib) . . . . . . . . . . . . . . . . . . . . . 103
5.3.6 DuplexDataManager traps (Ddm.mib) . . . . . . . . . . . . . 105
ServerView Event Manager
Page 5

Contents
5.3.7 DuplexWrite traps (DW.mib) . . . . . . . . . . . . . . . . . . . 109
5.3.8 Hard disk (S.M.A.R.T.) traps (Hd.mib) . . . . . . . . . . . . . . 111
5.3.9 Generic traps . . . . . . . . . . . . . . . . . . . . . . . . . . 112
5.3.10 MultiPath traps (mp.mib) . . . . . . . . . . . . . . . . . . . . . 113
5.3.11 Mylex traps (Mylex.mib) . . . . . . . . . . . . . . . . . . . . . 114
5.3.12 PCI HotPlug traps (pcihotplug.mib) . . . . . . . . . . . . . . . 118
5.3.13 PRIMEPOWER traps . . . . . . . . . . . . . . . . . . . . . . 119
5.3.14 PXRE traps (dec.mib) . . . . . . . . . . . . . . . . . . . . . . 125
5.3.15 RAID Adapter traps (Megaraid.mib) . . . . . . . . . . . . . . . 129
5.3.16 RomPilot traps (Rompilot.mib) . . . . . . . . . . . . . . . . . . 132
5.3.17 ServerControl traps (SC.mib) . . . . . . . . . . . . . . . . . . 133
5.3.18 ServerControl traps (SC2.mib) . . . . . . . . . . . . . . . . . 139
5.3.19 ServerView traps (ServerView.mib) . . . . . . . . . . . . . . . 145
5.3.20 ServerView status traps (Status.mib) . . . . . . . . . . . . . . 146
5.3.21 Tape drive traps (tapealrt.mib) . . . . . . . . . . . . . . . . . . 147
5.3.22 Team Server traps (Fujitsu) . . . . . . . . . . . . . . . . . . . 160
5.3.23 Threshold traps (Trap.mib) . . . . . . . . . . . . . . . . . . . . 163
5.3.24 UPS traps (Upsman.mib) . . . . . . . . . . . . . . . . . . . . 168
6 MIB integration . . . . . . . . . . . . . . . . . . . . . . . . . 171
ServerView Event Manager
Page 6

Contents
ServerView Event Manager
Page 7

1 Introduction
The ServerView Event Manager (called simply Event Manager below) is a
component of the Event Management of the ServerView Suite. After installation,
this component is available both via the Windows Start Menu and via
ServerView Operations Manager (called simply Operations Manager below).
The Event Manager function has a user-friendly Web-based graphical user
interface (GUI) where you can obtain reliable, secure information about system
faults quickly.
You can define the results and operating states about which you want to receive
alarm messages. The availability of a server in a network is a critical factor and
it therefore makes sense to configure the Event Manager so that you are
informed about all the operating states that could endanger server availability.
On blade systems, the Event Manager can receive and display alarm messages
from the blade system itself and also from individual server blades. Alarms are
assigned to the entire blade system by default. This setting can be changed in
the configuration.
The Event Manager works like this. An agent sends an alarm (trap) over the
SNMP to the Event Manager informing the management station that an
unexpected event has occurred. An unexpected event can be an error report or
a status change caused by tripping of a threshold value.
Traps are assigned the severity levels: critical, major, minor and informational.
Different actions, triggered by traps, can be assigned to each severity level and
to each server. Events at the alarm severity level critical are always recorded in
the alarm log of the log file.
I When you are installing the agents you can also specify that alarm
messages are to be sent to the Windows event log.
ServerView Event Manager 7
Page 8

Changes from the previous version
1.1 Changes from the previous version
This edition is valid for the Event Manager of ServerView V6.20 and replaces
the online manual: “Event Manager“ as of ServerView V6.12 Edition February
2013.
The manual has been updated to reflect the latest software status and includes
the following additions:.
– The Edit Automatic Service Mail Configuration window now also includes the
Exec Settings tab.
– The MAPI is no longer supported.
8 ServerView Event Manager
Page 9

ServerView Suite link collection
1.2 ServerView Suite link collection
Via the link collection, Fujitsu Technology Solutions provides you with numerous
downloads and further information on the ServerView Suite and PRIMERGY
servers.
For ServerView Suite, links are offered on the following topics:
● Forum
● Service Desk
● Manuals
● Product information
● Security information
● Software downloads
● Training
I The downloads include the following:
– Current software versions for the ServerView Suite as well as
additional Readme files.
– Information files and update sets for system software components
(BIOS, firmware, drivers, ServerView agents and ServerView update
agents) for updating the PRIMERGY servers via ServerView Update
Manager or for locally updating individual servers via ServerView
Update Manager Express.
– The current versions of all documentation on the ServerView Suite.
You can retrieve the downloads free of charge from the Fujitsu
Technology Solutions Web server.
For PRIMERGY servers, links are offered on the following topics:
● Service Desk
● Manuals
● Product information
● Spare parts catalogue
ServerView Event Manager 9
Page 10

Documentation for ServerView Suite
Access to the link collection
You can reach the link collection of the ServerView Suite in various ways:
1. Via ServerView Operations Manager.
Ê Select Help – Links on the start page or on the menu bar.
This opens the start page of the ServerView link collection.
2. Via the start page of the online documentation for the ServerView Suite on
the Fujitsu Technology Solutions manual server.
I You access the start page of the online documentation via the
following link:
http://manuals.ts.fujitsu.com
Ê In the selection list on the left, select Industry standard servers.
Ê Click the menu item PRIMERGY ServerView Links.
This opens the start page of the ServerView link collection.
3. Via the ServerView Suite DVD.
Ê In the start window of the ServerView Suite DVD, select the option Select
ServerView Software Products.
Ê Click Start. This takes you to the page with the software products of the
ServerView Suite.
Ê On the menu bar select Links.
This opens the start page of the ServerView link collection.
1.3 Documentation for ServerView Suite
The documentation can be downloaded free of charge from the Internet. You will
find the online documentation at http://manuals.ts.fujitsu.com under the link
Industry standard servers.
For an overview of the documentation to be found under ServerView Suite as well
as the filing structure, see the ServerView Suite sitemap (ServerViewSuite – Site
Overview).
10 ServerView Event Manager
Page 11

Notational conventions
1.4 Notational conventions
The following notational conventions are used in this manual:
V Caution This symbol points out hazards that can lead to personal
injury, loss of data or damage to equipment.
I This symbol highlights important information and tips.
Ê This symbol refers to a step that you must carry out in
order to continue with the procedure.
italic Commands, menu items, names of buttons, options,
variables, file names and path names are shown in italics
in descriptive text.
fixed font System outputs are indicated using a fixed font.
semi-bold
fixed font
[Key symbols] Keys are shown according to their representation on the
Commands to be entered via the keyboard are written in a
semi-bold fixed font.
keyboard. If uppercase letters are to be entered explicitly,
then the Shift key is shown, e.g. [SHIFT] - [A] for A.
If two keys need to be pressed at the same time, this is
shown by placing a hyphen between the two key symbols.
Table 1: Notational conventions
References to text or sections of text in this manual are shown with the chapter
or section heading and the page on which that chapter or section begins.
Screen outputs
Please note that the screen output is dependent in part on the system used and
therefore some details may not correspond exactly to the output you will see on
your system. You may also see system-dependent differences in the menu
items available.
ServerView Event Manager 11
Page 12

Notational conventions
12 ServerView Event Manager
Page 13

2Event Manager
The Event Manager allows you to filter and forward alarm messages and specify
the display.
For monitoring, ServerView agents must be installed on the managed servers
and for servers with VMware vSphere ESXi 5 ServerView ESXi 5 CIM Provider
must be installed. If an unusual operating status occurs, the ServerView agents
automatically send an alarm (trap) to a management station. Which
management stations are to receive traps is defined during installation of the
ServerView agents or ServerView ESXi 5 CIM Provider. While setting up the
SNMP service on the management station, you define the managed servers
from which traps are to be received.
After installing the ServerView Operations Manager you must first configure the
alarm display and alarm handling. You do this by defining alarm rules and filter
rules in the Alarm Configuration component. Using alarm rules, you specify
which alarms are to be forwarded from which servers to which destinations. You
can also specify, via filter rules, which alarms from which servers are to be
filtered out. For a detailed description of this alarm configuration see the chapter
"Alarm configuration" on page 37.
The Alarm Monitor component displays the received alarms, depending on the
configuration set. The Alarm Monitor offers you further functions for editing the
alarm list as well as for additional filtering of the alarm display. You can, for
example, specify which alarms from which servers are not to be shown in the
alarm list. For a detailed description of the Alarm Monitor see the chapter "Alarm
Monitor" on page 19.
ServerView comes with a series of MIBs, which are integrated in the Event
Manager. Traps from these MIBs can be received and processed in the Event
Manager. To supplement the existing MIBs, additional third-party MIBs can be
integrated into the Event Manager. Traps from these MIBs are also displayed in
the Event Manager, once the MIB has been checked.
You integrate the MIBs using the MIB Manager, which is additionally provided
when the Event Manager is installed under Windows or Linux. For more
information on this tool, see the chapter "MIB integration" on page 171.
ServerView Event Manager 13
Page 14

First-time startup
CIM-Indications for VMware vSphere ESXi 5
Events of servers with VMware vSphere ESXi 5 are provided as CIM
indications. The CIM indications are analyzed by the ServerView Event
Manager, which can manage and forward them as usual.
Via Test Connectivity you can test the connection to the VMware vSphere ESXi 5
server (see User Guide „ServerView Operations Manager“ manual).
I The CIM indication provider is provided for the following operating
system:
– VMware vSphere ESXi 5
For more information on ServerView ESXi CIM provider, see the
"Monitoring VMware based PRIMERGY servers with ServerView"
manual.
2.1 First-time startup
The ServerView Base Configuration Wizard includes a step for configuring the
Event Manager (see the Base Configuration Wizard User Guide).
14 ServerView Event Manager
Page 15

Starting the Event Manager
2.2 Starting the Event Manager
You start the Event Manager either via the ServerView Operations Manager
start screen or via the ServerList main window.
1. Start ServerView Operations Manager.
How to do this is described in the documentation for ServerView Operations
Manager.
2. Click the menu item Event Manager either in the ServerView Operations
Manager start screen or in the ServerList main window.
3. Start the individual components of the Event Manager (Alarm Monitor and
Alarm Configuration) by clicking the corresponding link (Alarm Monitor or
Alarm Configuration).
I To start / operate the Event Manager, you need the appropriate
permissions. As the RBAC (Role-based access control) based user
management of the ServerView Suite controls the assignment of
permissions to users by means of user roles, please ensure that your
user role is equipped with the required privileges. For details see the
"User Management in ServerView" user guide.
ServerView Event Manager 15
Page 16
Icons
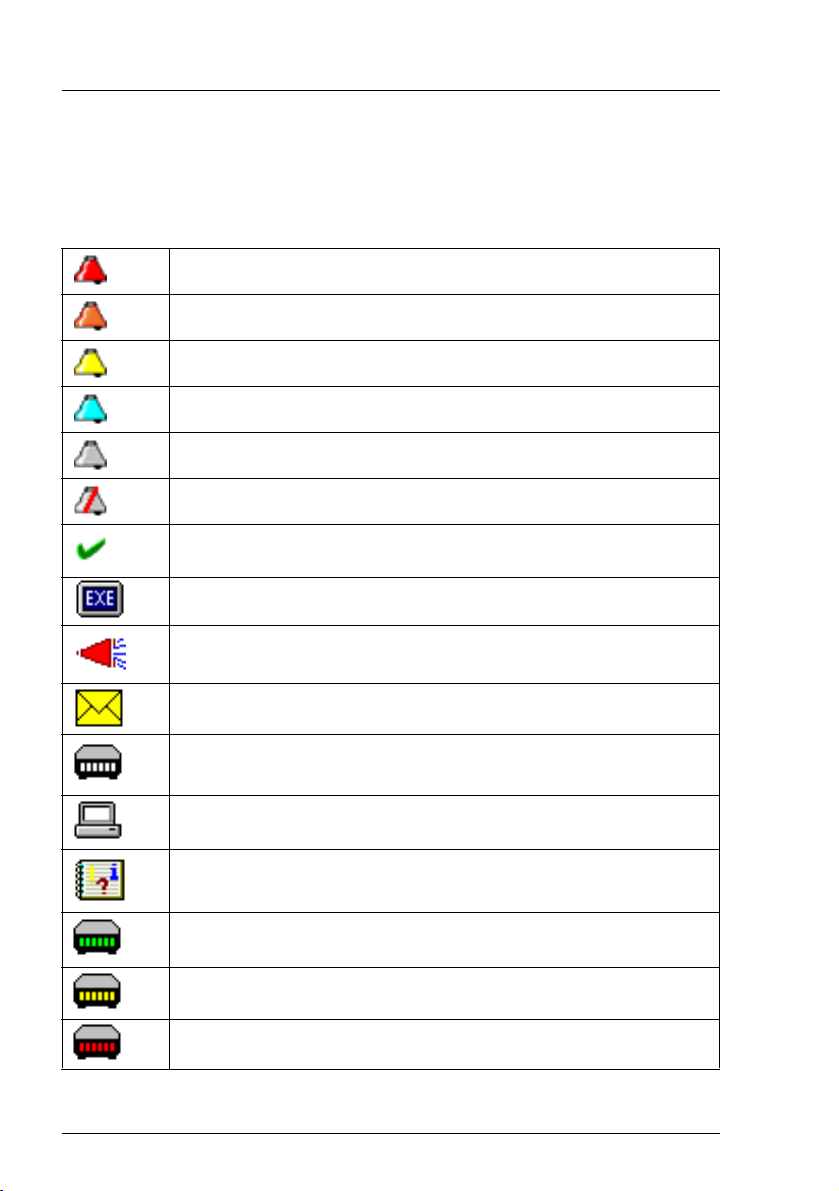
2.3 Icons
You will find a list of the icons in the Alarm Monitor and Alarm Configuration
windows and their meanings in the following.
Red alarm: critical
Orange alarm: major
Yellow alarm: minor
Blue alarm: informational
Gray alarm: unknown
Alarm is ignored
The alarm was confirmed by a user entry.
Some other executable program was triggered by this alarm.
A broadcast message was sent for this alarm.
A mail was sent for this alarm.
This alarm triggered a pager call.
This alarm will be passed on to a management station.
This alarm will be passed on to the local system event log.
Green: Pager confirmed
Yellow: Pager completed
Red: Pager present (still active)
Table 2: Icons in the Alarm Monitor and Alarm Configuration
16 ServerView Event Manager
Page 17

Yellow: Forwarding completed
Red: Forwarding present (still active)
Table columns can be filtered according to different criteria.
Table 2: Icons in the Alarm Monitor and Alarm Configuration
Icons
ServerView Event Manager 17
Page 18

Icons
18 ServerView Event Manager
Page 19
3 Alarm Monitor
The Alarm Monitor component displays all received alarms relating to the
selected servers and server groups in the Operations Manager main window.
3.1 Viewing alarms
You start the Alarm Monitor via the Operations Manager start window by clicking
the Alarm Monitor link under Event Management (see section "Starting the Event
Manager" on page 15). How to start Operations Manager is described in the
ServerView Operations Manager documentation.
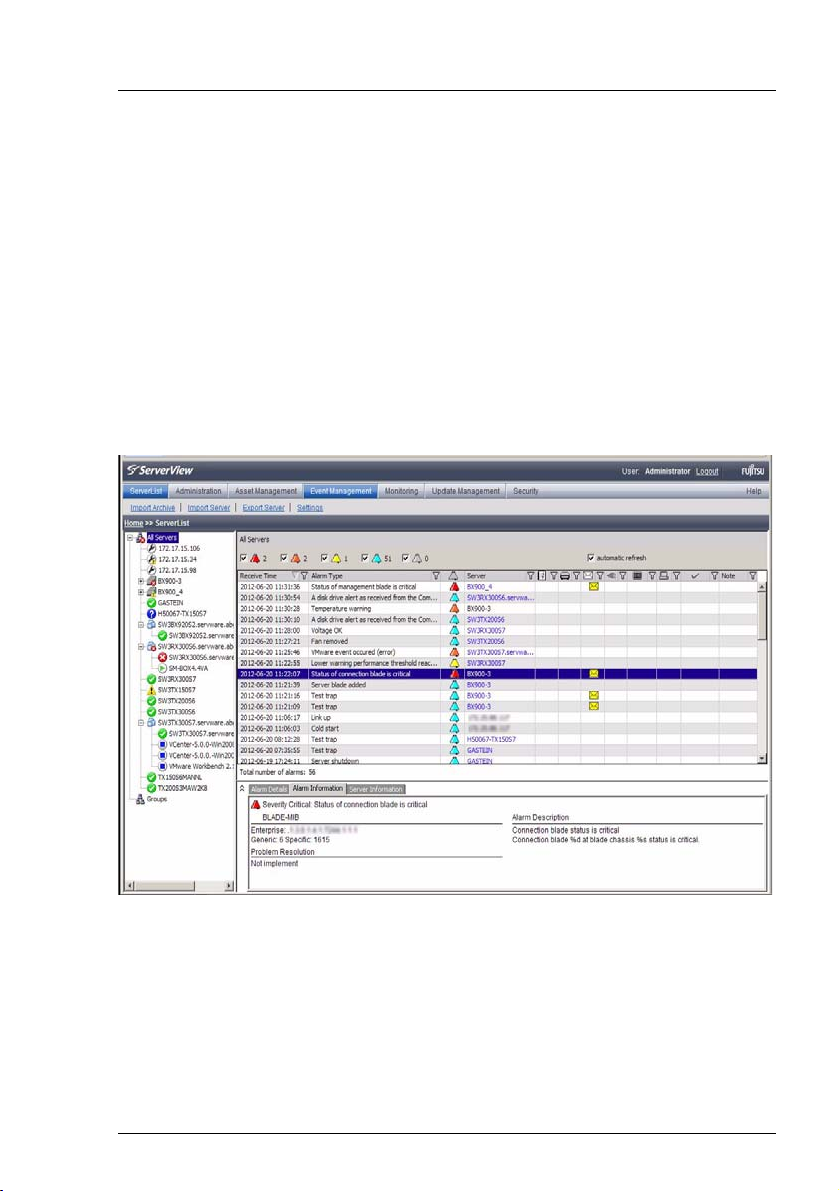
Figure 1: Alarm Monitor
ServerView Event Manager 19
Page 20

Viewing alarms
The window is divided into four sections:
● The menu bar below the title bar allows you to navigate between the
Operations Manager functions:
–Serverlist
– Administration
– Asset Management
– Event Management
– Monitoring
– Update Management
– Security (only if OpenDS is used as directory service)
In the line below the menu bar, the individual menu items are listed,
depending on which menu is selected.
For more information on the menus in the menu bar, see the ServerView
Operations Manager User Guide.
I The menus excepting the Event Management menu are only
available if Operations Manager is also installed on the management
station.
● The left section shows a file tree structure containing the servers and server
groups. This is where you make your selection for the display in the alarm or
server list.
I If you move the mouse pointer over a server in the file tree, a tooltip
appears. The content of the tooltip depends on the length of the
server name. If the server name is truncated in the file tree, the tooltip
shows first the complete server name and below it the server type. If
the server name is not truncated, the tooltip only shows the server
type.
● The top right section of the window contains the alarm entries for the servers
selected in the file tree. The alarm list is structured in pages.
The icons in the header of the right-hand section indicate how many alarm
entries per severity level there are on a page of the alarm list.
You can use these icons to control the alarm list display. Click to select the
alarm levels for which you want to display alarm messages.
The display update in the Alarm Manager can be enabled or disabled via
automatic refresh. If automatic refresh is selected, the display is reloaded
automatically when an alarm is logged. Otherwise, only the display of logged
alarms for Total number of alarms changes.
20 ServerView Event Manager
Page 21

Viewing alarms
Below the status bar the alarm entries are displayed with the following
information:
Receive Time
Time when the alarm was received.
Alarm Type
Brief description of the alarm.
Alarm icon (see table below)
Indicates the severity of the alarm.
Server
Server name. If you click the server name, the ServerView [servername]
window opens, in which you can request detailed information about
the selected server. For more information see the ServerView
Operations Manager manual.
I The ServerView [servername] window only opens if Operations
Manager is also installed on the management station.
Forwarding icons (see table below)
Indicates the type of alarm forwarding.
Ack
Indicates whether the alarm was acknowledged.
Note
Indicates a note entered by the user.
ServerView Event Manager 21
Page 22
Viewing alarms
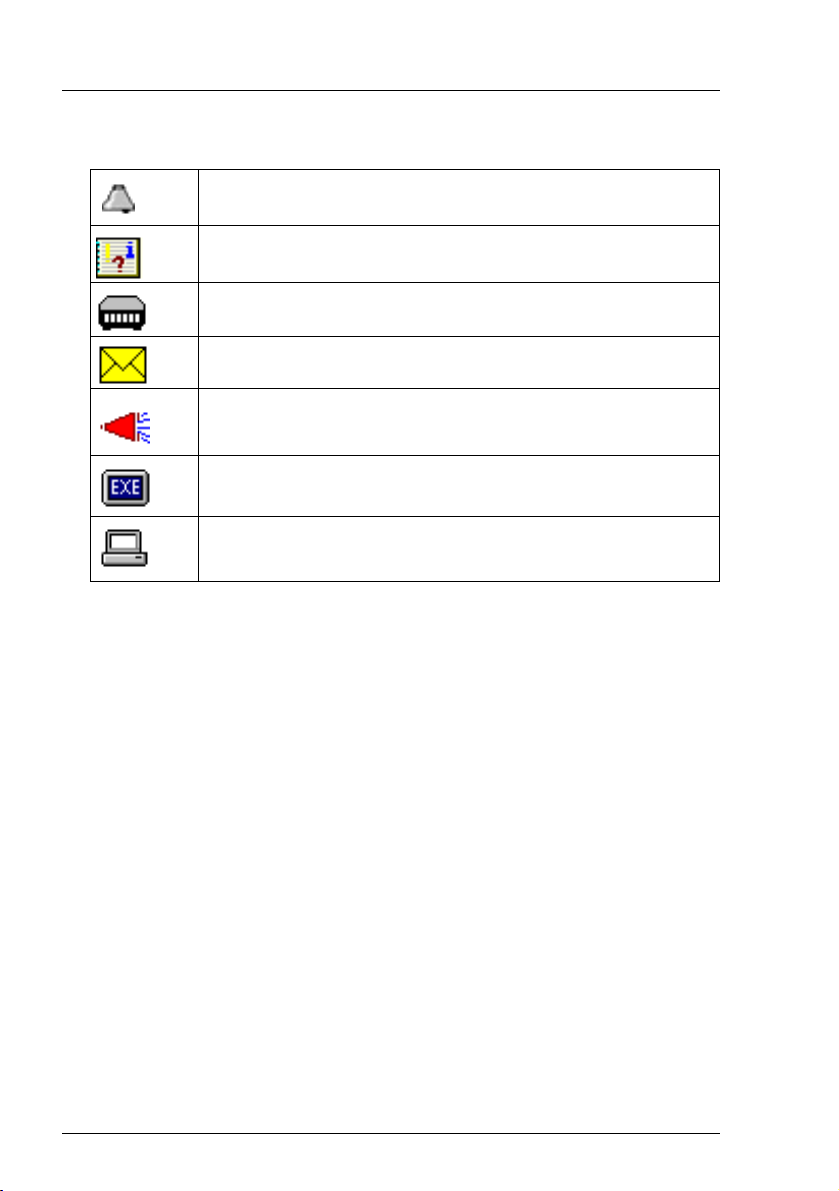
The icons have the following meanings:
Indicates the alarm level.
The alarm was written to the local event log.
This alarm triggered a pager call.
A mail was sent for this alarm.
A broadcast message was sent for this alarm.
An executable program was triggered by this alarm.
This alarm was forwarded to the management station.
Table 3: Icons in the Alarm Monitor
● In the bottom right section of the window you can find out information on the
selected alarm entry in the alarm list via the two or three tabs provided:
– Alarm Details tab - contains a brief description of the selected alarm entry
in the alarm list.
– Alarm Information tab - contains detailed information on the selected
alarm entry as stored in the MIB.
– Server Information tab - provides information on the server from which the
selected alarm entry originates. Under General Information you will see
general information about the server (e.g. system name, IP address,
community name) and under Additional Information you will see additional
information as stored in the Server Properties (e.g. administrator,
location, model).
On this tab you will also find a link, depending on whether the server in
question is entered in the ServerView server list or not.
22 ServerView Event Manager
Page 23

Viewing alarms
If the server is in the server list, you can use the Edit Server Settings link
to open the Server Properties window for this server, via which you can
change the configured values for the server.
If the server is not in the ServerView server list, you can use the Add
Server link to start the Server Browser and add the server to the list. For
more information on the Server Properties and the Server Browser, see
the ServerView Operations Manager User Guide.
I The Server Information tab is only available if both the event
manager and the Operations Manager are installed on the
management station.
ServerView Event Manager 23
Page 24

Viewing alarms for a server
3.2 Viewing alarms for a server
If several alarm messages have been received for a server, the one with the
highest severity level is displayed in the server list. In the bottom display area
you will only see information on the last alarm message received with this
severity.
To get an overview of all alarm messages for this server, you can switch to the
Alarm Monitor function for this server only.
One way of doing this is to select the server in the file tree and start the Alarm
Monitor function via the menu bar in the Operations Manager main window.
A much quicker way is via the alarm icon (the alarm bell) in the server list. If you
click the alarm icon, you switch to the Alarm Monitor function for this server only.
This means that only the alarm messages for this particular server will be visible
in the list section of the Operations Manager main window. Through appropriate
selection of an alarm message in the alarm list, you can retrieve further
information on every alarm message received in the display area.
3.3 Filtering alarm entries
You can filter the alarm entries by clicking the corresponding filter icons in the
header of the alarm list.
Filter icon in the header of the alarm list.
When you click the filter icon, the associated dialog Filtering for Column
<column_name> opens in each case. Make your selection and confirm it with
OK. Then, only the filtered entries will be displayed, depending on what you
have selected. In the standard filter (Standard), all selection elements are
selected via checkboxes. In the customized filter (Customize), you either enter
your selection directly or using an asterisk as a placeholder. An active filter is
indicated by a blue filter icon.
24 ServerView Event Manager
Page 25

Processing alarm entries
3.4 Processing alarm entries
The following functions are available for processing the alarm entries:
– Acknowledge alarms
– Suppress alarms
– Reset alarm suppression
– Delete alarms
3.4.1 Acknowledging alarms
You can acknowledge alarms that have been received.
Proceed as follows:
Ê Select the alarm entries in the list.
Ê Select Ack Alarm from the context menu.
The acknowledgment is indicated in the Ack column with the following icon:
3.4.2 Suppressing alarms
You can suppress individual alarms of a server. This is useful if the management
station is being bombarded with messages from a server that is not running
correctly.
Proceed as follows:
Ê Select the alarm entries in the list.
Ê Select Suppress from the context menu.
You must confirm the alarm suppression. Once you have done this, all alarm
entries will be deleted from the alarm list and no further alarms of this type for
the server in question will be added to the list.
You can reset this setting via Filter Settings, see section "Resetting alarm
suppression" on page 26.
ServerView Event Manager 25
Page 26

Processing alarm entries
I When the server starts up, a RAID manager or Ethernet card, etc. may
issue an alarm (SNMP trap) as a startup notification (e.g.
RFC1157LinkUP). To suppress this kind of alarm, you can configure
alarm suppression. This function must be specified for each server. If
multiple servers are monitored, configure this setting for each server
using the alarm function.
3.4.3 Resetting alarm suppression
You can reset an alarm suppression that has already been set. Proceed as
follows:
Ê Select Filter Settings from the context menu.
The Reset suppressings window opens, in which all previously set alarm
suppressions are listed. To reset a suppression, proceed as follows:
Ê Select the relevant suppression in the list.
Ê Click the Delete button.
Ê To close the window, click the Close button.
The entry is removed from the list and the alarm setting is active again.
3.4.4 Deleting alarms
To delete alarm entries, proceed as follows:
Ê Select the alarm entries in the list.
Ê Select Delete from the context menu.
I Alarms with the severity critical cannot be deleted until they have been
acknowledged.
26 ServerView Event Manager
Page 27

Testing the connection
3.5 Testing the connection
To test the connection to a specific server, you can send a trap. Proceed as
follows:
Ê Select Test Tra p from the context menu.
The Test Trap window opens:
Ê Either select the server from the list under Serverlist,
or
Ê Enter the IP address of the server. If you wish you can specify the server
name.
Ê Either accept the default values for Community and Timeout or enter the
relevant values in these fields.
Ê To test the connection, click the Tes t tr ap button.
A window informs you of the connection status. To close this window, click the
Close button.
I Note for Linux
If you perform a connection test for the local host (127.0.0.1/localhost),
the test trap times out. This is because the system is waiting for a
response from the IP address of the local host to which ServerView
Operations Manager made the request, whereas the actual response
received by the trap comes from the real IP address of the server
specified in the SNMP master agent.
ServerView Event Manager 27
Page 28

Other settings
3.6 Other settings
3.6.1 Editing an alarm note
You can edit the note displayed for an alarm entry:
Ê Click the relevant alarm entry.
Ê Select Edit Note from the context menu.
The Edit Note window opens:
Ê Enter your text.
Ê Confirm your input with OK.
28 ServerView Event Manager
Page 29

iRMC S2/S3 SEL Entries and SC2 MIB Traps
3.7 iRMC S2/S3 SEL entries relayed as
SC2 MIB traps
I The following table applies to PRIMERGY systems manufactured
in 2009 or later.
If the iRMC S2/S3 writes an event to the System Event Log (SEL), in some
cases an SNMP trap is triggered. The following table shows the correlation
between the iRMC S2/S3 entries in the SEL and the traps they trigger.
I Not all iRMC S2/S3 entries made in the SEL trigger an SNMP trap. Some
trigger the same trap.
Error
code
000011 System event log
040000 ’FAN XY’: Fan failed Fan ’FAN XY’ failed
040001 ’FAN XY’: Fan is
040002 ’FAN XY’: Fan
Table 4: iRMC S2/S3 SEL entry - SC2 MIB trap
iRMC S2/S3 SEL
entry
(SEL) warning
threshold exceeded
working
prefailure
Trap text Trap
The System Event
Log for cabinet XY at
server XY has
exceeded XY
percent of its
capacity.
in cabinet XY of
server XY.
Fan ’FAN XY’ was
added into cabinet
XY of server XY.
Fan ’FAN XY’ in
cabinet XY of server
XY is working again.
Fan ’FAN XY’ will fail
in near future in
cabinet XY of server
XY.
Trap name
no.
2101 sc2TrapMessa
geLogWarning
2014 sc2TrapFan
Failed
2010 sc2TrapFan
Added
2012 sc2TrapFanOk
2013 sc2TrapFan
Critical
ServerView Event Manager 29
Page 30

iRMC S2/S3 SEL Entries and SC2 MIB Traps
Error
code
040003 ’FAN XY’: Redundant
iRMC S2/S3 SEL
entry
fan failed
Trap text Trap
The redundant fan
’FAN XY’ failed in
cabinet XY of server
XY. System can
become critical if
another fan in this
group fails.
040004 ’FAN XY’: Fan
removed
Fan ’FAN XY’ was
removed from
cabinet XY of server
XY.
050001 ’Temp XY’:
Temperature OK
Temperature at
sensor ’Temp XY’ in
cabinet XY of server
XY is within normal
range.
050016 ’Temp XY’:
Temperature warning
Temperature at
sensor ’Temp XY’ in
cabinet XY of server
XY has reached the
warning level.
050017 ’Temp XY’:
Temperature critical
Temperature at
sensor ’Temp XY’ in
cabinet XY of server
XY has reached the
critical level.
070000 ’PSU XY’: Power
supply removed
Power supply ’PSU
XY’ in cabinet XY at
server XY was
removed.
Table 4: iRMC S2/S3 SEL entry - SC2 MIB trap
Trap name
no.
2015 sc2Trap
RedundantFan
Failed
2011 sc2TrapFan
Removed
2020 sc2TrapTemp
Ok
2021 sc2TrapTemp
Warning
2022 sc2TrapTemp
Critical
2031 sc2TrapPower
Supply
Removed
30 ServerView Event Manager
Page 31

iRMC S2/S3 SEL Entries and SC2 MIB Traps
Error
code
070001 ’PSU XY’: Power
iRMC S2/S3 SEL
entry
supply OK
Trap text Trap
Power supply ’PSU
XY’ in cabinet XY at
server XY was
added.
Power supply ’PSU
XY’ in cabinet XY at
server XY is working
again.
070002 ’PSU XY’: Power
supply failed
Power supply ’PSU
XY’ in cabinet XY at
server failed.
Redundant power
supply ’PSU XY’ in
cabinet XY at server
XY failed. System
can become critical
if another power
supply fails.
070003 ’PSU XY’: Redundant
power supply AC
AC failure in cabinet
XY of server XY.
failed
070005 Power unit: power
supply redundancy
lost
Power supply
redundancy in
cabinet XY at server
XY lost. System will
become critical if a
power supply fails.
070009 ’PSU XY’: Redundant
power supply DC
failed
070010 ’PSU XY’: Power
supply fan failure
DC power failure in
cabinet XY of server
XY.
Fan failure at power
supply ’PSU XY’ in
cabinet XY of server
XY.
Table 4: iRMC S2/S3 SEL entry - SC2 MIB trap
Trap name
no.
2030 sc2TrapPower
SupplyAdded
2032 sc2TrapPower
SupplyOk
2034 sc2TrapPower
SupplyFailed
2035 sc2Trap
Redundant
PowerSupply
Failed
2040 sc2TrapAcFail
2036 sc2TrapPower
Supply
Redundancy
Lost
2041 sc2TrapDcFail
2039 sc2TrapPower
SupplyFan
Failure
ServerView Event Manager 31
Page 32

iRMC S2/S3 SEL Entries and SC2 MIB Traps
Error
code
07000A ’PSU XY’: Power
iRMC S2/S3 SEL
entry
supply critical
temperature
Trap text Trap
Temperature at
power supply ’PSU
XY’ in cabinet XY of
server XY has
reached the critical
level.
07000F ’PSU XY’: Power
supply fan prefailure
Fan failure is
predicted at power
supply ’PSU XY’ in
cabinet XY of server
XY.
0C0004 ’CPU XY’: CPU
internal error (IERR)
0C0021 ’CPU XY’:
Uncorrected CPU
Internal error (IERR)
occurred on CPU
’CPU XY’ in cabinet
XY of server XY.
Machine Check
Architecture (MCA)
error
0C0007 ’CPU XY’: CPU clock
automatically
throttled
CPU speed at server
XY changed to XY
percent of its
maximum speed.
0C0017 ’CPU XY’: CPU
failure predicted
CPU failure is
predicted for CPU
’CPU XY’ in cabinet
XY.
0C000B ’CPU XY’: CPU
disabled
CPU ’CPU XY’ in
cabinet XY of server
XY is disabled.
Table 4: iRMC S2/S3 SEL entry - SC2 MIB trap
Trap name
no.
2037 sc2TrapPower
SupplyCritical
Temperature
2038 sc2TrapPower
SupplyFan
Failure
Prediction
2082 sc2TrapCpu
Ierr
2080 sc2TrapCpu
Speed
Changed
2081 sc2TrapCpu
Prefail
2083 sc2TrapCpu
Disabled
32 ServerView Event Manager
Page 33

iRMC S2/S3 SEL Entries and SC2 MIB Traps
Error
code
120030 PCI system error
120031 PCI parity error
120034 PCI bus parity error
iRMC S2/S3 SEL
entry
(SERR): Slot 0x%1
(PERR): Slot 0%1
indicated by onboard
device (PERR): Bus:
%1 Device: 0x%2
Trap text Trap
The system wa
restarted after a
severe problem at
cabinet XY of server
XY. See server
management
message log
(recovery log) for
detailed information.
Function: 0x%3
120035 PCI bus system error
indicated by onboard
device (SERR): Bus:
%1 Device: 0x%2
Function: 0x%3
120042 CPU front side bus
(FSB) error
120047 Fatal NMI
150000 ’Voltage XY’: Voltage OKPower supply
voltage ’BATT XY’ in
150030 Battery voltage ’BATT
XY’ OK
150012 ’Voltage XY’: Voltage
low critical: % Volt
150032 Battery voltage ’BATT
XY’ low critical: % Volt
150017 ’Voltage XY’: Voltage
high critical: % Volt
cabinet XY at server
XY is within normal
range again.
Power supply
voltage ’Voltage XY’
in cabinet XY at
server XY is too low.
Power supply
voltage ’Voltage XY’
in cabinet XY at
server XY it too high.
Table 4: iRMC S2/S3 SEL entry - SC2 MIB trap
Trap name
no.
2006 sc2TrapSevere
SystemError
2050 sc2Trap
VoltageOk
2051 sc2Trap
VoltageTooLow
2052 sc2Trap
VoltageToo
High
ServerView Event Manager 33
Page 34

iRMC S2/S3 SEL Entries and SC2 MIB Traps
Error
code
150031 Battery voltage ’BATT
iRMC S2/S3 SEL
entry
XY’ low warning: %
Volt
Trap text Trap
Battery voltage
’BATT XY’ in cabinet
XY at server XY:
Battery is predicted
to fail in near future.
190003 ’DIMM XY’ Memory:
Uncorrectable error
(ECC)
190040 ’DIMM XY’:
Uncorrectable Parity
Uncorrectable
memory error at
module ’DIMM XY’
in cabinet XY of
server XY.
memory error
190007 Memory:
Uncorrectable error
(ECC)
Uncorrectable
memory error in
cabinet XY of server
XY.
190008 Correctable memory
error disabled
Too many
correctable memory
errors in cabinet XY
at server XY. Error
logging was
disabled. If logging
was disabled and
not automatically
enabled again, you
have to reboot your
server to enable
memory error
logging again. If
logging is disabled,
prefailure detection
is also not active!
Table 4: iRMC S2/S3 SEL entry - SC2 MIB trap
Trap name
no.
2054 sc2TrapBattery
VoltagePrefail
2065 sc2Trap
Uncorrectable
MemError
Module
2067 sc2Trap
Uncorrectable
MemError
2071 sc2TrapMem
ErrorLogging
Disabled
34 ServerView Event Manager
Page 35

iRMC S2/S3 SEL Entries and SC2 MIB Traps
Error
code
190017 ’DIMM XY’: Memory
iRMC S2/S3 SEL
entry
replaced by spare
memory
Trap text Trap
Memory module
’DIMM XY’ in cabinet
XY of server XY had
failed and was
replaced by a hotspare module.
19001A ’DIMM XY’: Memory
module failed
predicted
Memory module
failure is predicted
for module ’DIMM
XY’ in cabinet XY of
server XY.
19001F Memory: redundancy
lost
Memory
configuration in
cabinet XY of server
XY has lost
redundancy.
190035 ’DIMM XY’: Memory
module error
190036 ’DIMM XY’: Memory
module failed
(disabled)
Memory module
’DIMM XY’ in cabinet
XY of server XY is
failing. Too many
errors have
occurred.
340002 Housing opened The front door or
housing of cabinet
XY was opened on
server XY.
340003 Housing closed The front door of
housing of cabinet
XY was closed on
server XY.
Table 4: iRMC S2/S3 SEL entry - SC2 MIB trap
Trap name
no.
2070 sc2TrapMem
ErrorModule
Replaced
2068 sc2TrapMem
ErrorModule
Prefail
2074 sc2TrapMem
Error
Redundancy
Lost
2069 sc2Trap
MemError
ModuleFailing
2110 sc2Trap
Intrusion
Assertion
2111 sc2Trap
Intrusion
Deassertion
ServerView Event Manager 35
Page 36

iRMC S2/S3 SEL Entries and SC2 MIB Traps
36 ServerView Event Manager
Page 37

4 Alarm configuration
The Alarm Configuration component in the Event Manager is used to define
settings for alarm handling. You can define alarm rules, filter rules and general
settings. The alarm rules define which alarms are forwarded from which servers
to which destinations (see section "Alarm rules" on page 39). The filter rules
define which types of alarm are filtered out (see section "Filter rules" on
page 55). In the general settings you define the handling of all incoming and
unfiltered alarms (see section "Making settings" on page 58). How to start the
component is described in the section "Starting the Event Manager" on
page 15.
When you select the Alarm Configuration component, the following window
opens:
Figure 2: Alarm Configuration
The menu tree in the left section shows the individual dialog windows for alarm
handling.
ServerView Event Manager 37
Page 38

Alarm configuration
The first time the window opens, the right-hand section shows the
Alarm Rules – Manage Alarm Rules dialog window. The Previous and Next buttons
take you step by step through the individual screens for setting the alarm
parameters. You can also call up the individual screens directly by clicking the
entries in the menu tree.
Buttons
The various screens contain the following buttons:
Add
Define a new setting.
Edit
Edit an existing setting.
Delete
Delete an existing setting.
Previous
Return to the previous screen.
Apply
Saves your changes to the database. You must click Apply before you quit
the screen in which you have made changes, otherwise a warning
message opens.
Reset
Your changes are reset to the settings stored in the database from the
previous Apply.
Next
Go to the next screen.
OK
The new settings are saved and the screen is closed.
Cancel
The changes you have made are not applied and the screen is closed.
Help
Calls up a help text.
38 ServerView Event Manager
Page 39

Alarm rules
4.1 Alarm rules
An alarm rule forwards alarms from various servers to one or more destinations.
A complete definition of a new alarm rule consists of the following four steps:
– Defining the name of the new alarm rule (see section "Managing alarm
rules" on page 40).
– Assigning one or more servers to the alarm rule (see section "Assigning
servers" on page 43). The alarm rule then only applies to alarms from these
servers.
– Assigning one or more alarms to the alarm rule (see section "Assigning
alarms" on page 47).
– Defining the response to the incoming alarms (see section "Forwarding
alarms" on page 51). Here you can use the standard destinations or define
your own (e.g. Execute forwarding, Mail forwarding or Mobile forwarding).
When defining a new alarm rule, you will be guided step by step through the
individual screens for setting the alarm parameters. If you are changing an
existing alarm rule you can also call up the individual dialog screens directly via
the menu tree.
ServerView Event Manager 39
Page 40

Alarm rules
4.1.1 Managing alarm rules
The Alarm Rules – Manage Alarm Rules screen provides an overview of all defined
alarm rules. The tabs Alarm Rules, Alarms, Servers and Destinations allow different
views of the defined alarm rules, depending on which tab is selected.
The Add button allows you to add new alarm rules. It opens a window in which
you can enter the name of the new alarm rule. You can also copy settings of an
existing alarm rule over to the new one. To do this, select an existing alarm from
the drop-down list. All settings of the existing alarm rule visible on the Alarms,
Servers, Destinations tabs and from the drop-down list marked with Copy settings
from rule will then be taken over by default. If you do not want to take over the
settings from every tab, you can disable the individual tabs by clicking the
selected checkbox directly. The assigned settings will then not be taken over for
the new alarm rule.
If you do not want to take over any settings, select the empty field in the dropdown list.
The Edit button lets you modify existing alarm rules. With the Delete button you
can delete a selected alarm rule.
Figure 3: Alarm Rules - Manage Alarm Rules
40 ServerView Event Manager
Page 41

Alarm Rules tab
The Alarm Rules tab is used to assign alarm rules to alarms, servers and
alarm destinations.
The first column lists all known alarm rules. The enabled column indicates
which alarm rules are activated (checkmark) and which are deactivated.
By clicking in the enabled column you can set or remove a checkmark.
You save the new setting by clicking the Apply button.
The second column lists the alarms that are assigned to the selected
alarm rule. Only alarms assigned to the alarm rule are forwarded.
The third column shows the servers that are assigned to the selected
alarm rule. Only alarms from assigned servers are forwarded by an alarm
rule.
The fourth column shows all destinations of the incoming alarms for the
selected alarm rule.
With the Add button you can define new alarm rules. A window opens for
you to enter the new name of the alarm rule. With the Edit button you can
modify an existing, selected alarm rule, and with the Delete button you
can delete an existing alarm rule.
Alarms tab
The Alarms tab provides an overview of which alarms are assigned to
which alarm rules. So you can quickly check which, if any, destination is
assigned to an alarm.
Alarm rules
The first column lists all known alarms in alphabetical order. Because the
alarms are defined by many different manufacturers, the same name can
be used twice.
The second column lists all the alarm rules to which the selected alarm
is assigned.
The third column shows the servers that are assigned to the alarm rule
selected in column two. Only alarms from assigned servers are
forwarded by an alarm rule.
The fourth column shows all destinations of incoming alarms for the
selected alarm rule.
ServerView Event Manager 41
Page 42

Alarm rules
Servers tab
The Servers tab shows you which servers are covered by which alarm
rules. Here you can check whether alarms from a server are at least
being forwarded to one destination.
The first column lists all known and unfiltered servers in alphabetical
order (see section "Server filters" on page 55). You can find out more
about a particular server by clicking its entry in the list.
The second column lists all the alarm rules to which the selected server
is assigned.
The third column shows the alarms which are assigned to the selected
alarm rule.
The fourth column contains all destinations to which the selected alarm
rule forwards the incoming alarms.
Destinations tab
The Destinations tab tells you which destination incoming alarms are
forwarded to with which alarm rules.
The first column lists all known destinations in alphabetical order.
The second column lists all alarm rules which forward the incoming
alarms to the selected destination.
The third column contains the list of servers that are assigned to the
selected alarm rule.
The fourth column shows all alarms that are assigned to the selected
alarm rule.
On the Destinations tab you can use the Add button to define a new
destination, the Edit button to modify an existing destination, and the
Delete button to delete an existing destination. The destinations
Default_Popup and Event_Log cannot be deleted. The destination
Event_Log can also not be changed.
42 ServerView Event Manager
Page 43

Alarm rules
4.1.2 Assigning servers
In the Alarm Rules – Assign Server screen, you define the servers and/or server
groups to be assigned to an alarm rule.
Figure 4: Alarm Rules - Assign Servers
Via the drop-down list, you can select the alarm rule that you want to edit. The
file tree in the Serverlist box contains all known and unfiltered servers. The
Assigned Servers window shows the list of servers and server groups which are
assigned to the alarm rule.
I If you move a server group to Assigned Servers, associated subgroups are
not moved with it and must be moved separately. This restriction does not
apply to All Servers.
ServerView Event Manager 43
Page 44
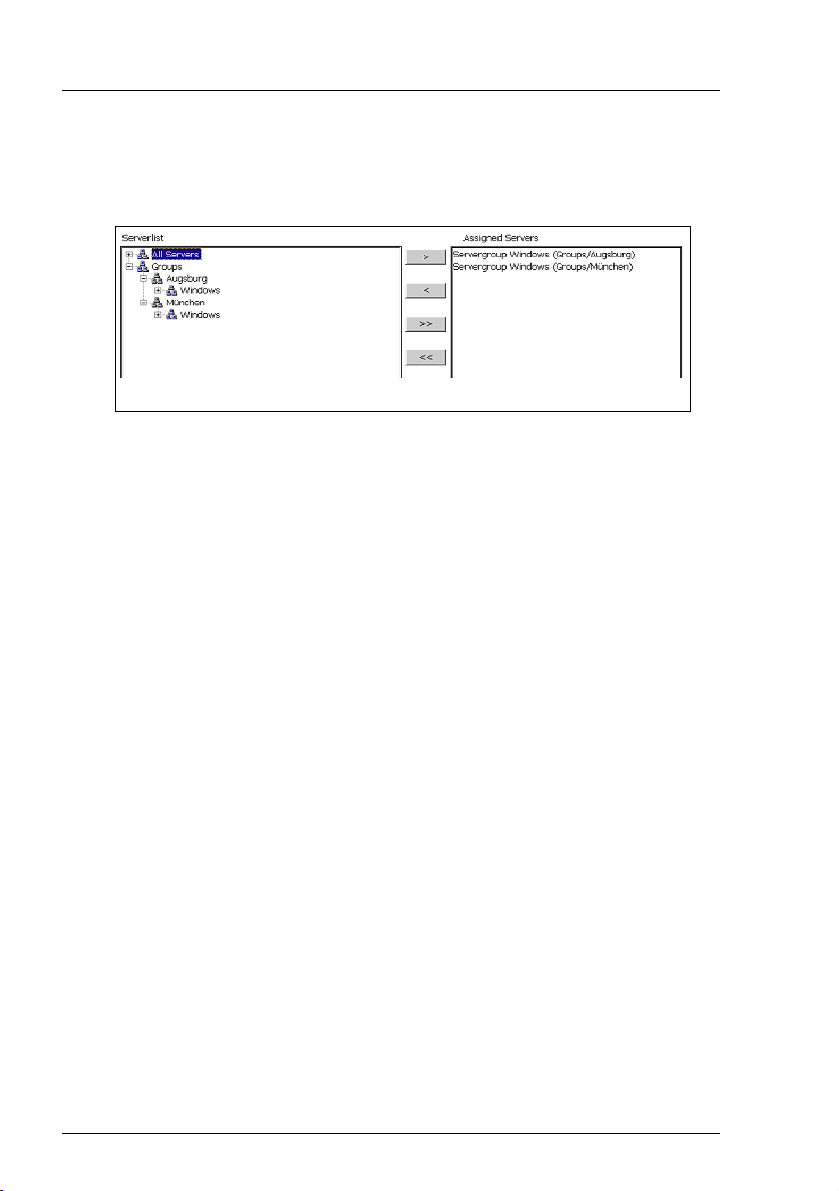
Alarm rules
I Because different server groups can have the same name, they are
displayed in the Alarm Configuration component with their group
hierarchy.
Figure 5: Alarm Rules - Assign Servers group hierarchy
You can use the following buttons to specify which servers are to belong to this
alarm rule:
>
Adds the selected servers to the alarm rule.
<
Removes the selected servers from the alarm rule.
>>
Adds all known servers to the alarm rule.
<<
Removes all servers from the alarm rule.
If you select Show Information about Server from the context menu, additional
information about the selected server is displayed. If you select Show unassigned
servers only, the server list will only contain the servers which are not yet
assigned to an alarm rule. If you select Show all Servers, all servers are shown
again.
Clicking the Apply button saves the new settings. Clicking the Reset button
restores the settings from the last save.
If the window is leaved without applying the changed configuration, or if a
necessary element for the alarm rule is missing, a corresponding warning
message will be issued.
44 ServerView Event Manager
Page 45

Alarm rules
4.1.2.1 Displaying server information
If you select Show Information about Server from the context menu,the Server
information window opens, showing additional information about the selected
server.
Figure 6: Server information
The header gives the server name accompanied by a status icon which
indicates the current server status.
Underneath the status icon there is another icon which indicates whether or not
the server is entered in the server list:
The server is known, i.e. the server is present in the ServerView
server list.
The server is unknown, i.e. the server is not present in the
ServerView server list.
If the server is in the server list, the server information will be displayed. If the
server is not in the server list but has the current status manageable, the Event
Manager will obtain the information directly from the server itself.
ServerView Event Manager 45
Page 46

Alarm rules
I You can start Operations Manager for the selected server in this window.
To do this, click the status icon in the top right-hand corner.
The status display, the server picture and the start command for
Operations Manager are only enabled if Operations Manager is already
installed.
To close the Server information window, click the Close button.
46 ServerView Event Manager
Page 47

Alarm rules
4.1.3 Assigning alarms
In the Alarm Rules – Assign Alarms dialog box you can define in the Individual
Alarms dialog box the alarms for the alarm rule and display all details of the
assigned alarms. In the Type of Alarms dialog box you can define for selected
alarm rules what kind of alarms are to be forwarded.
Figure 7: Alarm Rules - Assign Alarms - Individual Alarms
The Individual Alarms dialog box contains in the top drop-down list the names of
all known alarm rules. Here you can select the alarm rule that you want to edit.
f an unknown alarm occurs, you can assign an alarm rule to it. Make sure that
unknown alarms are not suppressed but are explicitly allowed. You can do this
via the filter settings in the Filter Rules – Alarm Filtering dialog box (see "Filtering
alarms" on page 56). You must also select the appropriate checkbox under
Alarm Rules – Assign Alarms – Type of Alarms
The Assigned counter indicates both the number of alarms that are currently
assigned to this alarm rule and the number of all known alarms.
The Checked counter counts all alarms whose checkboxes are selected,
regardless of whether the alarms were filtered.
The Selected counter shows the number of currently selected alarms in the alarm
list.
ServerView Event Manager 47
Page 48

Alarm rules
The alarm list in the bottom section of the window shows via checkboxes which
alarms are assigned to the alarm rule. It also shows the names of the alarms
(Alarm Name), their severity (Severity), their MIB file (MIB), in which the alarm is
defined, and their trap name (Identifier).
Alarms which are assigned to the selected alarm rule are indicated by selected
checkboxes. You can select or deselect a checkbox by clicking it.
Clicking the Apply button saves the changed settings for the alarm rule. The
value of the Assigned counter then matches the value of the Checked counter.
All alarms in the alarm list can be sorted or filtered according to different criteria.
This allows only certain alarms to be displayed.
You sort the alarms by clicking the relevant column in the header of the alarm
list. You can sort them alphabetically by Alarm Name, Severity, MIB or Identifier.
You filter the alarms by clicking the corresponding filter icons in the header
of the alarm list.
You can filter them according to selected alarms (selected checkboxes), Alarm
Name, Severity or MIB. Clicking the filter icon opens the respective associated
dialog box. If, for example, you have selected Severity, the dialog box shows the
error severities, which you can then select. You make your selection and then
confirm it with OK. Depending on your selection, the window then shows only
the filtered alarms. An active filter is indicated by a blue filter icon.
In the standard filter (Standard), all selection elements are selected via
checkboxes. In the customized filter (Customize) you make your selection either
by entering it directly (e.g. MINOR) or using the asterisk as a wildcard. With
Severity, for example, specifying M* selects the severities Major and Minor.
48 ServerView Event Manager
Page 49

Alarm rules
The alarm list offers a context menu, in which you can select the following items:
Show information about selected Alarm
To see additional information on the selected alarm
Check all alarms
To add all currently known alarms to the alarm rule
Check selected alarm(s)
To add the selected alarms to the alarm rule
Uncheck all alarms
To remove all currently known alarms from the alarm rule
Uncheck selected alarm(s)
To remove the selected alarms from the alarm rule
Clicking the Apply button saves the new settings. If you click the Reset button, the
settings from the last save are restored.
In the Alarm Rules – Assign Alarms – Type of Alarms dialog box you can define for
selected alarm rules what kind of alarms are to be forwarded.
Figure 8: Alarm Rules - Assign Alarms - Type of Alarms
ServerView Event Manager 49
Page 50

Alarm rules
The top drop-down list contains the names of all known alarm rules. Here you
can select the alarm rule that you want to edit. You can activate or deactivate
the following filter settings:
All alarms of severity critical
All alarms of severity critical are handled according to the alarm rule.
All alarms of severity major
All alarms of severity major are handled according to the alarm rule.
All alarms of severity minor
All alarms of severity minor are handled according to the alarm rule.
All alarms of severity informational
All alarms of severity informational are handled according to the alarm
rule.
All unknown alarms
All unknown alarms are handled according to the alarm rule.
50 ServerView Event Manager
Page 51

Alarm rules
4.1.4 Forwarding alarms
In the Alarm Rules – Assign Destinations screen you can make settings relating to
alarm destinations. Select an alarm rule and then define the actions to be
triggered for the servers of this alarm rule in response to certain alarm
messages.
Figure 9: Alarm Rules - Assign Destinations
The top drop-down list contains the names of all known alarm rules. Here you
can select the alarm rule that you want to edit. The List of known Destinations box
contains all known destinations. The Assigned Destinations box contains the list
of destinations assigned to the alarm rule.
With the Add button you can define a new destination, with the Edit button you
can change an existing destination, and with the Delete button you can delete an
existing destination.
The destination Automatic Service Mail can be neither deleted nor moved to the
Assigned Destinations window.
ServerView Event Manager 51
Page 52

Alarm rules
You can use the following buttons to activate or deactivate the forwarding of an
alarm:
>
Activates the selected destinations.
<
Deactivates the selected destinations.
>>
Activates all known destinations.
<<
Deactivates all known destinations.
Clicking the Apply button saves the new settings. Clicking the Reset button
restores the settings from the last save.
You can define the following responses for the alarm rule:
– Send a mail (Mail)
– Output a message (Popup)
– Log the alarm (Event Log)
– Trigger a call to a pager or mobile phone (Pager)
(This feature is not supported in the Japanese market.)
– Trigger an executable program (Execute)
– Trigger a broadcast message (Broadcast)
– Generate a trap which is forwarded to another management station (Station)
– Send a mail to a special service address (Automatic Service Mail)
(This feature is not supported in the Japanese market. For Japan another
forwarding service called FJJ Service Mail is provided.)
52 ServerView Event Manager
Page 53

Alarm rules
By clicking the Add button you can define a new destination. The following
window opens showing the available destinations.
Figure 10: Type of New Destination
Clicking OK opens additional windows, depending on your selection, in which
you must make further settings. There, via different tabs, you can define all the
parameters necessary for forwarding. A detailed description of the various
windows is available via the respective Help buttons. More information on the
individual windows is provided in the later sections describing the respective
forwarding actions and settings on page 59.
ServerView Event Manager 53
Page 54

Alarm rules
I ● Note for SMTP AUTH
For sending mails, SMTP AUTH is supported. The supported
authentication method is: CRAM MD5 / LOGIN / PLAIN. The
authentication method used when you send a mail automatically
switches to the safest method compatible with the authentication
method supported by the destination SMTP server.
If User and Password are left blank, mails will be sent by SMTP
without authentication.
● If you have selected Mail mail forwarding, the character set (charset)
in the mails for Subject und Message is set in the following way:
– on a Windows-based management station charset=Shift-JIS
– on a Linux-based management station charset= UTF-8
54 ServerView Event Manager
Page 55

Filter rules
4.2 Filter rules
The filter rules define the servers or server groups from which you want to filter
out alarms (see section "Server filters" on page 55) and/or which alarms are to
be filtered out (see section "Filtering alarms" on page 56).
I Filter rules take priority over alarm rules. If a alarm is ignored because of
the filter rules, the alarm rule assigned to the alarm is not activated.
4.2.1 Server filters
In the Filter Rules – Server Filtering screen, you define the servers or server
groups whose alarms you want to filter out. If the Event Manager is running on
a server and there are no other servers in the server list, this server is
automatically displayed as the local host. No further settings are necessary for
this.
The Serverlist box contains all servers and server groups in the server list. The
Suppress from handling box contains the servers or server groups whose alarms
are not to be handled.
You can filter the servers with the following buttons:
>
The alarms from the selected servers or server groups are ignored.
<
The alarms from the selected servers or server groups are forwarded.
>>
All alarms from the servers or server groups in the server list are ignored.
<<
All alarms from the servers or server groups in the Suppress from handling
box are handled again. All incoming alarms from the servers or server
groups in the server list are forwarded.
If you select a server in the Serverlist window, you can display additional
information about this server via Show Information about Server on the context
menu.
Clicking the Apply button saves the new settings. Clicking the Reset button
restores the settings from the last save.
ServerView Event Manager 55
Page 56

Filter rules
4.2.2 Filtering alarms
In the Filter Rules – Alarm Filtering dialog box you can activate or deactivate filter
settings for an alarm type.
Figure 11: Filter settings for an alarm type
You can activate or deactivate the following filter settings:
All unknown alarms
Filter out unknown alarms. These are alarms which are not defined in
any of the integrated MIBs.
Alarms from unknown server
Filter out alarms from unknown servers.
Alarms of severity major
Filter according to the severity level major.
Alarms of severity minor
Filter according to severity level minor.
Alarms of severity informational
Filter according to the severity level informational.
56 ServerView Event Manager
Page 57

Filter rules
In the input field Set time for repetition in seconds you can specify the interval after
which the same alarm is allowed through from the same server again. This is
useful to prevent the management station from being bombarded with identical
alarms from a server that is not running correctly.
When you specify, for example, an interval of 30 seconds, filter interval of each
severity are as follows:
Severity of
alarm
Value of
severity
Expression from which
filter interval is requested
Filter interval
Critical 1 30 seconds × 1 30 seconds
Major 2 30 seconds × 2 60 seconds
Minor 3 30 seconds × 3 90 seconds
Informational 4 30 seconds × 4 120 seconds
Table 5: Filter interval of each severity
ServerView Event Manager 57
Page 58

Making settings
4.3 Making settings
In the General Settings screen you can define general settings for alarm handling.
You can define the actions to be executed by default and regardless of the alarm
groups whenever an alarm arrives.
You can define the following actions:
– Alarms relating to failed authentication are suppressed.
– Alarms from server blades are issued with the relevant name of the blade
server.
For different error severities you can specify the following actions. Any
combinations are possible.
– The alarm is to be written to the operating system event-log list.
When you receive alarms with the checked severities, the alarms are
logged in the operating system event log.
– When you receive alarms with the checked severities, a pop-up
notification for each alarm is displayed on the management server.
– The Alarm Monitor window is to move to the foreground.
Every time you receive an alarm with the checked severities, the
AlarmMonitor window is displayed on top of any open windows. For this
to happen, the AlarmMonitor window must be open already.
You can specify when the alarm is to be deleted. You can define whether the
alarm is to be deleted when it reaches a certain age or when the log list contains
a certain number of entries. Once a certain number of entries is reached, the
oldest one in the list is deleted.
Clicking the Apply button saves the new settings. Clicking the Reset button
restores the settings from the last save.
I With general settings, event logs are recorded independently from Alarm
Rules. Depending on the configuration, two event logs may be recorded
for the same alarm.
58 ServerView Event Manager
Page 59

Mail forwarding in general
4.4 Mail forwarding in general
Making mail settings
If you have selected Mail for the forwarding, the following New Mail Configuration
window opens.
Figure 12: New Mail Configuration
In this window you can define all the necessary parameters for forwarding on
the Mail Settings, Mail Properties and Time Model Settings tabs. Fields marked with
* are mandatory, while the other fields are optional.
ServerView Event Manager 59
Page 60

Mail forwarding in general
Mail Settings tab
The Mail Settings tab provides fields for the mail settings, some of which
already contain predefined settings.
The input fields in the Mail Settings window have the following meanings:
Name Meaning
Description Name of the mail settings
If you want to change the mail settings for an existing
mail forwarding (see Edit button, section "Forwarding
alarms" on page 51), this field contains the already
assigned name and is disabled.
Subject Subject of the mail
The mail subject can contain macros (see section
"Macros" on page 79).
If the subject contains characters which cannot be
displayed, they are replaced by displayable ones (e.g.
hex code).
Mail To E-mail address of the person to whom you want to send
the alarm. Multiple addresses must be separated with a
semicolon or comma.
Cc E-mail address of the person to whom you want to send
a copy of the alarm (optional). Multiple addresses must
be separated with a semicolon or comma. Setting two or
more addresses is only possible if the EventManager is
running in a Windows environment.
Time Model Time model indicating when an alarm is to be
forwarded.
Select a predefined time model from the drop-down list.
You can set your own time model via the Time Model
Settings tab.
Additional
Message
Text field for defining the alarm message.
Information about the servers can be inserted via
different macros (see section "Macros" on page 79).
A suggestion is offered here to simplify handling. Delete
or change it if necessary.
Table 6: Input fields in the Mail Settings window
60 ServerView Event Manager
Page 61

Mail forwarding in general
Mail Properties tab
The Mail Properties tab provides fields for the mail server. The mail server
is an SMTP server.
I With alarm forwarding in ServerView V6.20 or later, MAPI is no
longer supported. Only SMTP servers are still used. If during an
upgrade the mail service is addressed via MAPI, a warning is
issued. During the setup, all MAPI destinations are changed to
SMTP. The settings for the SMTP server must then be configured
in the Alarm Configuration component.
The input fields in the Mail Properties window have the following
meanings:
Name Meaning
From Sender (SMTP)
Server SMTP server (SMTP)
User
(optional)
Password
(optional)
Confirm
Password
(optional)
Port Port number (SMTP)
User name (SMTP)
Identification of the mailing system
(optional with SMTP)
Confirm the password
(optional with SMTP)
The default value is Port 25
Table 7: Input fields in the Mail Properties window
ServerView Event Manager 61
Page 62

Mail forwarding in general
Time Model Settings tab
The Time Model Settings tab allows you to select, add or modify a time
model. You can define hour by hour for the whole week when an alarm is
to be forwarded.
If you click the Test Address button, a test mail is sent to check your settings.
If you click OK, your settings will be saved and you will be returned to the
previous window.
Further buttons are offered depending on the type of forwarding and the
selected tab (see "Buttons" on page 38).
McAfee virus scanner
The McAfee virus scanner contains a setting which prevents programs from
sending e-mails if they are not registered.
To register the mail senders, you must enter the corresponding program name:
blat.exe under Windows or smtpm under Linux.
62 ServerView Event Manager
Page 63

Mail and Execute forwarding to the service provider
4.5 Mail and Execute forwarding to the service
provider
The Event Manager allows you to automatically forward alarms to the service
provider by e-mail.
If mail forwarding to the service provider is activated, the service provider is
notified by e-mail whenever certain traps occur. The group of traps that trigger
a mail is defined by the service provider and can only be changed by them.
Activating mail forwarding
You activate mail forwarding to the service provider in the Alarm Rules – Assign
Destinations screen by selecting the alarm group Automatic Service Mail in this
screen.
If you click the Edit button the Edit Automatic Service Mail Configuration window
opens.
In this window you can use the Mail Settings tab to make the necessary settings
for mail forwarding to the service provider.
The input fields in the Mail Settings window have the following meanings:
Name Meaning
Mail To E-mail address of the Service Center
Cc The e-mail address to which a copy of the service mail is to
be sent (optional)
Identnumber Unique ID number of the server
I This number must be agreed with the service
provider.
Name Name of the server administrator
Phone Telephone number of the server administrator
E-mail Address
(optional)
Country ID
(optional)
Customer ID
(optional)
Table 8: Input fields in the Service Mail Settings window
ServerView Event Manager 63
E-mail address to be used by the Service Center for
feedback (optional).
Two-letter ISO code for the country (optional)
(e.g. DE for Germany).
Customer code (optional)
The customer code must be agreed with the provider.
Page 64

Mail and Execute forwarding to the service provider
You can enable or disable this configuration with the Enabled option.
The Mail Properties tab provides fields for the mail server. The mail server is an
SMTP server.
I With alarm forwarding in ServerView V6.20 or later, MAPI is no longer
supported. Only SMTP servers are still used. If during an upgrade the
mail service is addressed via MAPI, a warning is issued. During the
setup, all MAPI destinations are changed to SMTP. The settings for the
SMTP server must then be configured in the Alarm Configuration
component.
The input fields in the Mail Properties window have the following meanings:
Name Meaning
From Sender (SMTP)
Server SMTP server (SMTP)
User (optional) User name (SMTP)
Password
(optional)
Confirm
Password
(optional)
Por t Port number (SMTP)
Identification of the mailing system
(optional with SMTP)
Confirm the password
(optional with SMTP)
The default value is Port 25
Table 9: Input fields in the Mail Properties window
64 ServerView Event Manager
Page 65

Mail and Execute forwarding to the service provider
The Exec Settings tab offers fields for execute settings, some of which already
contain predefined settings.
The input fields in the Exec Settings window have the following meanings:
Name Meaning
Description
(optional)
Name of the execute settings
If you want to change the execute settings for an existing
execute forwarding (see Edit button, section "Forwarding
alarms" on page 51), this field contains the already assigned
name and is disabled.
Command Name of the command to be executed.
The name can be entered with arguments as a command line.
Information about the servers can be inserted into these
arguments via different macros (see section "Macros" on
page 79).
Working
Name of the working directory containing Command.
directory
(optional)
Time Model
(optional)
Indicates whether an alarm is to trigger this command.
Via the drop-down list, you can enable or disable the time
model. If the time model is enabled, an alarm always triggers
this command.
Table 10: Input fields in the Exec Settings window
ServerView Event Manager 65
Page 66

Mail and Execute forwarding to the service provider
If you click the Test A ddress button in the Service Mail Settings window, a test mail
is sent to the service provider. The Service Center sends an automatic e-mail
response to all test mails it receives. In doing so it uses the address specified in
the E-mail input field.
A minimum period of 600 seconds has been specified for the sending of
identical mails. This ensures that redundant messages are not sent.
In the Alarm Monitor, traps that have triggered a service mail are identified as
follows:
This icon identifies a trap that has been forwarded using the
service mail function.
This icon identifies a trap that has been forwarded using both the
normal mail function and the service mail function.
66 ServerView Event Manager
Page 67

Making pop-up settings
4.6 Making pop-up settings
If you have selected Popup for the forwarding, the New Popup Configuration
window opens. In this window you can use the Popup Settings and Time Model
Settings tabs to make all necessary settings for pop-up forwarding.
I Pop-up notifications are only displayed on the local host. They cannot be
displayed on any other host.
Popup Settings tab
The Popup Settings tab offers fields for the pop-up settings, some of which
already contain predefined settings.
The input fields in the Popup Settings window have the following meanings:
Name Meaning
Description Name of the pop-up settings
If you want to change the pop-up settings for an existing
pop-up forwarding (see Edit button, section "Forwarding
alarms" on page 51), this field contains the already
assigned name and is disabled.
Time Model Time model indicating when an alarm is to trigger a pop-
up message.
Select a predefined time model from the drop-down list.
You can set your own time model via the Time Model
Settings tab.
Additional
Message
(optional)
Table 11: Input fields in the Popup Settings window
Time Model Settings tab
The Time Model Settings tab allows you to select, add or modify a time
model. You can define hour by hour for the whole week when an alarm is
to be forwarded.
ServerView Event Manager 67
Text field for defining the message in the pop-up
window.
Information about the servers can be inserted via
different macros (see section "Macros" on page 79).
As of Windows Server 2008, the output is truncated
after 255 characters.
Page 68

Making pop-up settings
I Notes for Linux
1. To receive the forwarded alarm messages, a user must be logged
onto the Linux system console. If no user is logged on, the forwarded
alarm messages are not saved. This means that they will not be
output the next time a user logs onto the system console.
2. Because with Linux systems the user is logged onto a virtual system
console, they can either use graphical interfaces (GUI session, e.g.
Gnome or KDE) or the command line interface (CLI session). The
appearance of the layout depends on this.
With a CLI session, the logged-on user receives the forwarded alarm
message as a plain-text message.
With a GUI session, the forwarded alarm message is output in a (nonmodal) pop-up window.
3. The forwarding service uses the database under /var/run/utmp to
obtain information on the users connected to the system console. The
entries in the database should therefore be correct.
If a graphics session is started on the system console with the startx
program, the necessary entries are not made under /var/run/utmp.
The forwarded alarms are then not output.
To receive the forwarded alarm messages as pop-up messages on
the ServerView management station, the Linux operating system
should begin in graphics mode (runlevel 5) after a system start.
The forwarding service does not forward alarms to Xconsoles.
68 ServerView Event Manager
Page 69

Making pager settings (COM port and modem)
4.7 Making pager settings
(COM port and modem)
If you have selected Pager for the forwarding, the New Pager Configuration window
opens. In this window you can use the Pager Settings and Modem Settings tabs to
make the different settings for the serial interfaces and the modems connected
to them (pager types).
You can define the following values:
– The name of the available interfaces (e.g. COM2 or COM4)
– The maximum transmission speed (baud rate)
– The type of data flow control
– The initialization and reset chain for the modem
The input fields in the New Pager Configuration window have the following
meanings:
Name Meaning
Description Name of the pager settings
Owner Name of the owner
Com Port Name of the serial interfaces.
The drop-down list contains the names of the available
interfaces. You can select a specific interface or the entry Any
Available. If you select the latter, any available interface can be
connected to your COM ports. This is useful if you frequently
change the attached devices.
Pager Number (Telephone) number of the pager
I With a text message the destination number may have
to be preceded by an additional prefix of the relevant
pager service.
For example:
D1 service in Germany: 49171XXXXXXX
(XXXXXXX = pager ID)
Must be prefixed by 49171 (without 00)
D2 service in Germany: 0049172XXXXXXX
0049172 is optional
Table 12: Input fields in the Mail Settings window
ServerView Event Manager 69
Page 70

Making pager settings (COM port and modem)
Name Meaning
Time Model Time model indicating when an alarm is to be forwarded.
Select a predefined time model from the drop-down list. You
can set your own time model via the Time Model Settings tab.
Retry Delay Delay in minutes between two pager attempts.
Do not select too short a time, as calls to a pager can be
delayed by a few minutes by the service provider. Also bear in
mind the time required to reach the server management
station. This delay can be around five or more minutes.
Retries Maximum number of attempts to forward an alarm to a pager
before a message appears.
Pager Type Type of the pager (signal/numeric/alpha/SMS1 Service/
SMS2 Service/NTT Service)
I If you select the wrong pager type, the transmission will
be ignored because of an invalid communication
protocol.
Table 12: Input fields in the Mail Settings window
70 ServerView Event Manager
Page 71

Making pager settings (COM port and modem)
You specify the pager service via the Pager, SMS-1 or SMS-2 tabs.
The Server Num tab tells you which server numbers are assigned to which server
name. The server number is sent to the pager type numeric.
You can test your settings by clicking the Tes t button.
For each service number, you make settings for data bits, parity and stop bits
and you define the prompt used by the pager service for messages.
With the SMS1 and SMS2 service, two services with different protocols can be
used to address a GSM mobile. SMS1 uses the TAP protocol, while SMS2 uses
the UDP protocol.
Baud rate 2400 bps, 1200 bps or 300 bps
Data bits 8
Parity none
Stop bits 1
Dialling prefix ATDP0,01691
Table 13: Sample settings for the “Cityruf” pager service from Deutsche Telekom
I If you have defined settings for the serial interfaces, you can define
whether an alarm is to trigger a call to a pager or mobile phone (see also
section "Forwarding alarms" on page 51).
ServerView Event Manager 71
Page 72

Making execute settings
4.8 Making execute settings
If you have selected Execute for the forwarding, the New Execute Configuration
window opens. In this window you can use the Exec Settings and Time Model
Settings tabs to make all necessary settings for the execute forwarding.
Exec Settings tab
The Exec Settings tab offers fields for the execute settings, some of which
already contain predefined settings.
The input fields in the Exec Settings window have the following meanings:
Name Meaning
Description Name of the execute settings
If you want to change the execute settings for an existing
Execute forwarding (see Edit button, section
"Forwarding alarms" on page 51), this field contains the
already assigned name and is disabled.
Command Name of the command to be executed.
The name can be entered with arguments as a
command line. Information about the servers can be
inserted into these arguments via different macros (see
section "Macros" on page 79).
Working
directory
(optional)
Time Model Time model indicating when an alarm is to cause this
Name of the working directory containing Command.
command to be invoked.
Select a predefined time model from the drop-down list.
You can set your own time model via the Time Model
Settings tab.
Table 14: Input fields in the Exec Settings window
72 ServerView Event Manager
Page 73

Making execute settings
Time Model Settings tab
The Time Model Settings tab allows you to select, add or modify a time
model. You can define hour by hour for the whole week when an alarm is
to be forwarded.
I For Windows Server 2008, the CUI command is the only command that
can be used for the program execution.
ServerView Event Manager 73
Page 74

4.9 Making broadcast settings
Broadcast is a type of transmission whereby a pop-up window or a message is
displayed on multiple servers or server groups simultaneously.
If you have selected for the forwarding, the New Broadcast Configuration window
opens. In this window you can use the Broadcast Settings and Time Model Settings
tabs to make all necessary settings for broadcast forwarding.
Broadcast Settings tab
The Broadcast Settings tab offers fields for the broadcast settings, some of
which already contain predefined settings.
The input fields in the Broadcast Settings window have the following
meanings:
Name Meaning
Description Name of the broadcast settings
If you want to modify the broadcast settings for an
existing broadcast forwarding (see Edit button, section
"Forwarding alarms" on page 51), this field contains the
already assigned name and is disabled.
Time Model Time model indicating when an alarm is to be
forwarded.
Select a predefined time model from the drop-down list.
You can set your own time model via the Time Model
Settings tab.
Table 15: Input fields in the Broadcast Settings window
74 ServerView Event Manager
Page 75

Name Meaning
Mode
Mode for the broadcast forwarding
Making broadcast settings
Special user
Only one user is notified, whose name must be entered
here.
All users of
domain
All users belonging to the same domain for the
forwarding are notified. (Valid only with Windows,
default.)
As of Windows Server 2008, domain is no longer
supported.
All users with
session
All users who are associated with the forwarding
through any session are notified (default with Linux).
Additional
Message
(optional)
Text field for defining the message for the broadcast
window
Information about the servers can be inserted via
different macros (see section "Macros" on page 79).
As of Windows Server 2008, the output is truncated
after 255 characters.
Table 15: Input fields in the Broadcast Settings window
Time Model Settings tab
The Time Model Settings tab allows you to select, add or modify a time
model. You can define hour by hour for the whole week when an alarm is
to be forwarded.
ServerView Event Manager 75
Page 76

Making broadcast settings
I Notes for Linux
The forwarding service uses the database under /var/run/utmp (utmp(5))
to obtain information on the connected users and the type of the session
(GUI or CLI). All sessions (local or remote) should therefore be correctly
registered in the utmp database.
With SuSE Linux and RedHat Linux, the KDE session does not make any
utmp entries via the console or the emulation that is started with it.
Forwarded alarm messages are therefore not output in these windows.
These restrictions do not apply to the GNOME sessions with SuSE Linux
and RedHat Linux, or for KDE sessions with Caldera OpenLinux.
Notes for Windows
Forwarding with broadcast can fail on account of disruptions to the
Windows Messenger Service used. You can check this with the net send
command.
76 ServerView Event Manager
Page 77

Making trap settings
4.10 Making trap settings
If you have selected Station for the forwarding, the New Station Configuration
window opens. In this window you can use the Station Settings and Time Model
Settings tabs to make all necessary settings for trap forwarding.
Station Settings tab
The Station Settings tab offers fields for the trap settings, some of which
already contain predefined settings.
The input fields in the Station Settings window have the following
meanings:
Name Meaning
Station Name Name of the station to which the traps are to be
forwarded.
If you want to modify the trap settings for an existing trap
forwarding (see Edit button, section "Forwarding
alarms" on page 51), this field contains the already
assigned name and is disabled.
Community Name of the community to which the traps are to be
forwarded.
The default value is public.
Time Model Time model indicating when an alarm is to be
forwarded.
Select a predefined time model from the drop-down list.
You can set your own time model via the Time Model
Settings tab.
IP Address Internet protocol address
Table 16: Input fields in the Station Settings window
ServerView Event Manager 77
Page 78

Making trap settings
Name Meaning
Forwarding
Mode
The mode for the forwarding.
Normal
This mode evaluates the alarm and forwards it to the
management station.
Pass
Through
This mode is available in an original variant and in the
variant Transparent.
The original variant passes the alarm directly through to
the management station. The alarm appears there as if
it is coming directly from the server. In this mode the trap
is only forwarded once.
Transparent
The Transparent variant forwards the trap to the
management station exactly as it was received. It is not
possible to determine whether the trap was sent by the
agent or forwarded by the Event Manager.
Table 16: Input fields in the Station Settings window
Time Model Settings tab
The Time Model Settings tab allows you to select, add or modify a time
model. You can define hour by hour for the whole week when an alarm is
to be forwarded.
78 ServerView Event Manager
Page 79

Macros
4.11 Macros
Below is a list of macros that can be used for the forwarding of alarms (e.g. Mail,
Pager).
These macros are replaced by the corresponding information about the servers
which are reporting the alarm.
Name Meaning
$_SRV Name of the server
$_TRP Text of the alarm message
$_TYP Brief description of the alarm
$_IPA IP address of the server
$_CTY Community
$_SEV Severity of the alarm
(critical, major, minor, informational, unknown)
$_TIM Time model (format: yyyy-mm-dd-hh.mm.ss)
Local time schedule of the management station according to
which an alarm is forwarded.
$_IDN ID number of the server
$_OMS Name of management station
$_MIB MIB file name of the received alarm
$_SPC Specific number of the received alarm
$_MDL Fujitsu REMCS ID of a hardware which is reporting the alarm
Table 17: Macros
ServerView Event Manager 79
Page 80

Alarm configuration example
4.12 Alarm configuration example
This section explains a typical example of alarm configuration.
Purpose
When an event whose severity is critical occurs on the ALARMTEST server, a
mail is sent to the administrator (admin@test.co.jp).
Requirements
– ServerView agent is running on the server, and the server is registered as a
management target in ServerView Operations Manager on the same
network.
– Test traps from the ServerView agent to ServerView Operations Manager
are functioning normally.
– ServerView Operations Manager can access the SMTP server
(111.222.3.20) while it is in operation.
Setting procedure
Ê Perform one of the following operations.
– When operating from the ServerView Operations Manager start window:
Click Alarm Configuration.
– When operating from the individual function windows:
Click Event Management – Alarm Configuration in the menu bar at the top
of the window.
The Manage Alarm Rules window opens.
Ê Click Add.
The New Name dialog box opens.
Ê Enter e.g. CriticalMail in the New Name dialog box and click OK.
Ê Click Apply, then click Next.
The Assign Servers window opens.
Ê Select the ALARMTEST server in the server list, and click the > button.
80 ServerView Event Manager
Page 81

Alarm configuration example
Ê Click Apply, then click Next.
The Assign Alarms - Individual Alarms window opens.
Ê Click Next again.
The Assign Alarms - Type of Alarms window opens.
Ê Check All alarms of severity critical.
Ê Click Apply, then click Next.
The Assign Destinations window opens.
Ê Click Add.
The Type of new Destination dialog box opens.
Ê Select Mail and click OK.
The New Mail Configuration window opens.
Ê Enter the required item in each field on the Mail Settings tab.
Description
In this example: MailSet as the destination name
Subject
In this example: Critical Error occurred
Mail to
In this example: admin@test.co.jp as the administrator
Time Model
In this example: always
From
In this example: ALARMTEST
Server
In this example: 111.222.3.20
Configure settings for mail to the administrator (admin@test.co.jp) from the
ALARMTEST server.
ServerView Event Manager 81
Page 82

Alarm configuration example
Ê Click Apply, then click Tes t Addres s.
Ê Once the test mail is sent successfully, click OK. This returns you to the
Assign Destinations window.
Ê Select the created MailSet, then click the > button.
Ê Click Apply.
82 ServerView Event Manager
Page 83

5Traps
If a special event occurs in a network component, then the SNMP agent can
send a message to one or more managers to inform them of the event. Such
messages are called traps in SNMP. The manager can react to events in the
network based on the incoming trap. A trap can be uniquely identified with the
trap ID and MIB OID.
I In WBEM (Web-Based Enterprise Management) environments CIM
providers send events as CIM indications. CIM indications largely
correspond to the traps defined in the SC2.MIB. However, depending on
the CIM providers installed in a management environment, there may be
some events (traps) defined in the SC2.MIB for which no corresponding
indications are sent.
5.1 Displaying trap information
The Event Manager help system provides detailed information on the default
MIBs and traps supported by the Event Manager.
You open the relevant overview window either via the Event Manager start
window or via the Alarm Monitor window.
– Trap information via Event Manager start window:
Ê Start the Event Manager.
Ê Under Help, select On Suite.
Ê Then under Event Management, select Alarm Monitor.
Ê In the window that opens, click the Event Manager link.
Ê Under Alarms, select the Agent Alarm Information option.
– Trap information via Alarm Monitor window:
Ê Start the Event Manager.
Ê Under Event Management, select Alarm Monitor.
Ê In the Alarm Monitor window, select Help – On Alarm Monitor from the
menu bar.
Ê In the window that opens, click the Event Manager link.
ServerView Event Manager 83
Page 84
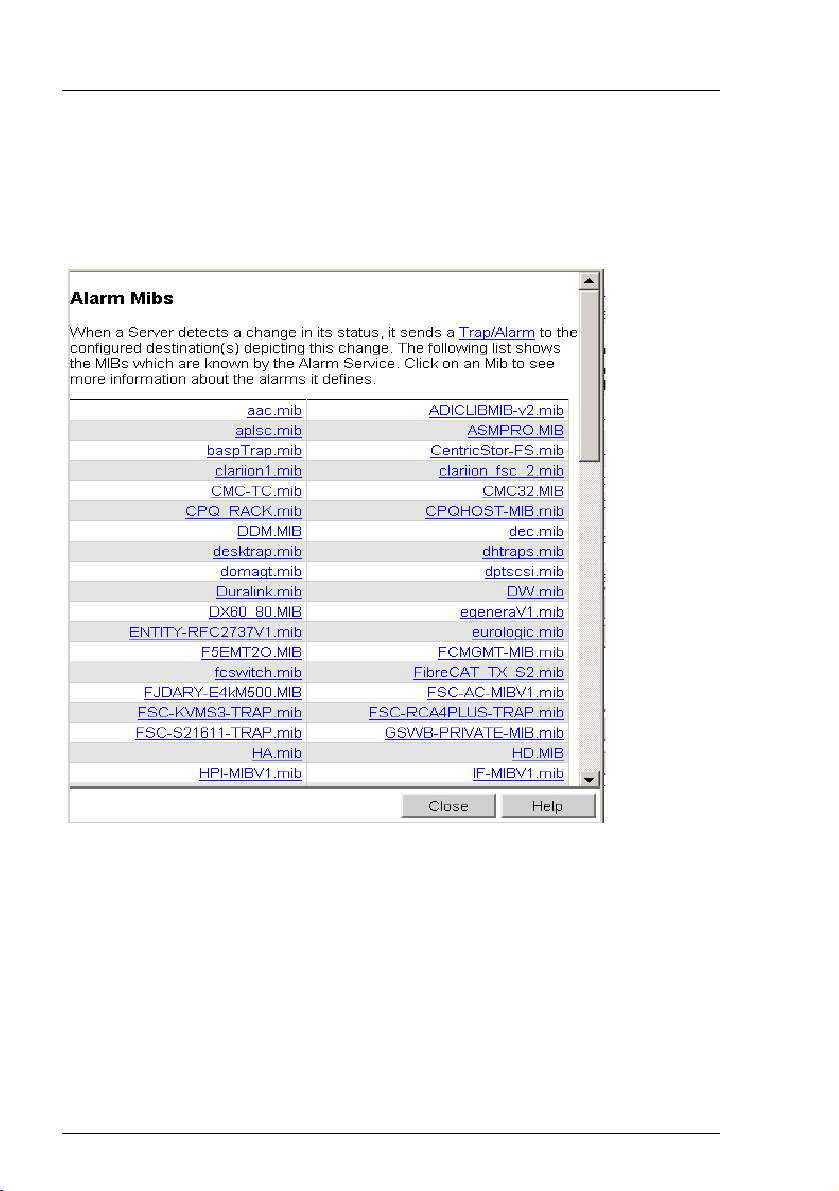
Displaying trap information
Ê Under Alarms, select the Agent Alarm Information option.
I The trap information can also be called up in the same way via the start
window of ServerView Operations Manager.
The Alarm Mibs window is displayed:
Figure 13: MIB overview in the Event Manager - example
84 ServerView Event Manager
Page 85

Displaying trap information
When you select a MIB, a window with detailed trap information will open; the
window will look like this:
Figure 14: Detailed information about the traps from a MIB (example)
If you want to print out this information, select the Print button in the window.
ServerView Event Manager 85
Page 86

Displaying traps in the Windows event log
5.2 Displaying traps in the Windows event log
When you install the Windows agents, you can specify whether the traps from
the Fujitsu MIB (e.g. HD.MIB, Mylex.MIB) are also to be written to the Windows
event log. The trap ID in the event log is shown increased by 10000 and not as
in the subsequent trap descriptions (e.g. the trap mylexBBUFound with the trap
number 275 is shown in the event log with the trap number 10275).
I With the Event Manager you can use alarm forwarding (logging) to
specify that traps are to be written to the Windows or LINUX event log.
The source name of the events in the event log is ServerView Services in
both Windows and Linux.
The event type of the log of UnknownTrap becomes an Information level.
5.3 Trap overview
The table below provides an overview of the MIBs which are integrated in the
Event Manager. Because these contents are frequently updated, this table and
the following trap lists are only a snapshot and do not claim to be complete. You
can find out which MIBs are currently integrated in the Event Manager via the
Alarm Configuration window (in the MIB column of the Alarm Rules - Assign Alarms
dialog box) or via the Event Manager online help.
The sections after the table provide an overview of the main types of trap. In
later sections of this chapter, the traps are ordered alphabetically by category.
Inside each category the traps are ordered alphabetically by name.
The Comments column indicates the number of the page on which the traps are
listed. You can also use the Event Manager to print out the trap lists. For more
information, see the section "Displaying trap information" on page 83.
MIB Traps from Comments
aac.mib Adaptec controller
ADICLIBMIB-v2.mib see page 119
adptinfo.mib
Asmpro.mib ASM PRIVATE COMMIB traps see page 160
baspCfg.mib
baspStat.mib
Table 18: MIB overview
86 ServerView Event Manager
Page 87

Trap overview
MIB Traps from Comments
baspTrap.mib Broadcom Advanced Server traps
BIOS.mib
BUS.mib
clariion1.mib FibreCat
clariion_fsc_2.mib FibreCat
Cmc32.mib Rittal rack monitor
CMS-TC.mib
Ddm.mib DuplexDataManager traps see page 105
dec.mib Compaq StorageWorks Enterprise Array
Manager
desktrap.mib DeskView traps
dhtraps.mib
domagt.mib
dptscsi.mib DPT SCSI traps see page 103
Duralink.mib ADAPTEC Duralink traps see page 92
DW.mib DuplexWrite traps see page 109
egeneraV1.mib
Ether.mib
eurologic.mib FibreCat
F5emt2o.mib HP OpenView Network Node Manager
fcswitch.mib Fibre Channel switch
FSC-AC-MIBV1.mib
FSC-KVMS3-
TRAP.mib
FSC-RCA4PLUS-
TRAP.mib
FSC-S21611-
TRAP.mib
Hd.mib ServerView agent: disks see page 111
HPI-MIBV1.mib
INTELLAN_V1.mib
INVENT.mib
iommib.mib Adaptec
Table 18: MIB overview
see page 125
ServerView Event Manager 87
Page 88

Trap overview
MIB Traps from Comments
Ldcm.mib LAN Desk Client Manager from Intel traps see page 162
Ldsm.MIB LAN Desk Server Manager from Intel traps see page 162
log3v1.mib PRIMEPOWER log entries see page 120
Lsi1030.mib
LSIRAID-IDE.mib
Megaraid.mib RAID adapter from American Mega Trends
MIxraid.mib MylexDiskArrayController traps
MMB-COM-MIB.mib
MMB-ComTrap-
MIB.mib
mp.mib MultiPath traps see page 113
Mylex.mib RAID controller (Mylex DAC 960) see page 114
net-snmp.mib
netapp.mib Network Appliance traps
NT.mib
NTCluster.MIB Microsoft Cluster see page 100
NW.mib
OS2.mib
pcihotplug.mib SCSI device hot-plug traps see page 118
Powernet.mib American Power Conversion traps see page 92
Ppc.mib UPS traps 2 see page 169
primepower_xscf.mib PRIMEPOWER hardware diagnostics see page 119
promiseraid.mib
promisev1.mib Promise RAID controller traps
PSA-COM-MIB.mib PRIMEQUEST traps
PSA-ComTrap-
MIB.mib
PSA-
ExternalFileUnitTrapMIB.mib
PSA-LIN-MIB.mib PRIMEQUEST traps
Table 18: MIB overview
Inc.
PRIMEQUEST traps
PRIMEQUEST traps
see page 129
88 ServerView Event Manager
Page 89

Trap overview
MIB Traps from Comments
PSALinBcm5700TrapMIB.mib
PSA-LinEmulexTrapMIB.mib
PSA-LinGdsTrapMIB.mib
PSA-LinGlsTrapMIB.mib
PSA-LinGrmpdTrapMIB.mib
PSALinIntelE1000TrapMIB.mib
PSALinIntelE100TrapMIB.mib
PSALinLanComTrapMIB.mib
PSALinLsiLogicTrapMIB.mib
PSALinScsiComTrapMIB.mib
PSA-LinTg3TrapMIB.mib
PSA-WIN-MIB.mib PRIMEQUEST traps
PSA-
WinBcm5700TrapMIB.mib
PSAWinEmulexTrapMIB.mib
PSAWinIntelE1000TrapMIB.mib
Table 18: MIB overview
PRIMEQUEST traps
PRIMEQUEST traps
PRIMEQUEST traps
PRIMEQUEST traps
PRIMEQUEST traps
PRIMEQUEST traps
PRIMEQUEST traps
PRIMEQUEST traps
PRIMEQUEST traps
PRIMEQUEST traps
PRIMEQUEST traps
PRIMEQUEST traps
PRIMEQUEST traps
PRIMEQUEST traps
ServerView Event Manager 89
Page 90

Trap overview
MIB Traps from Comments
PSAWinIntelE100TrapMIB.mib
PSAWinLsiLogicTrapMIB.mib
RAID.mib
RFC1157.mib
RFC1213.mib
RFC1285.mib
RFC1628.mib
RMS-
C_SNMPv1_contact.
mib
RMSC_SNMPv1_humid1.
mib
RMSC_SNMPv1_humid2.
mib
RMSC_SNMPv1_main.mi
b
RMSC_SNMPv1_output.
mib
RMSC_SNMPv1_temp2.
mib
Rompilot.mib RomPilot traps see page 132
S31.mib Blade server traps
SANMgrV1.mib Pathlight SAN Data Gateway
SC.mib ServerControl traps see page 133
SC2.mib
SECURITY.mib
Servervi.mib FUJITSU ServerVisor traps
Table 18: MIB overview
PRIMEQUEST traps
PRIMEQUEST traps
90 ServerView Event Manager
Page 91

Trap overview
MIB Traps from Comments
ServerView.mib ServerView traps see page 145
Status.mib ServerView status traps see page 146
tapealrt.mib Tape driver traps see page 147
Threshold.mib
TOK.mib
Trap.mib ServerView traps see page 163
trap1493.mib Switch traps
trap1757.mib Switch traps
unicorn-trap.mib
uniserv.mib PRIMEPOWER Enterprise Server see page 121
UNIX.mib
Upsman.mib Enterprise Specific Top Level MIB by Quazar
GmbH, UPS traps 1
v1_fscHaCI.mib PRIMECLUSTER traps
VMWARE-TRAPS-
MIB.mib
VV.mib
WFM.mib Wired-for-Management traps
wsatrap.mib PRIMEPOWER hardware
Table 18: MIB overview
see page 168
ServerView Event Manager 91
Page 92

Trap overview
5.3.1 Adaptec traps (Duralink.mib)
MIB-OID: 1.3.6.1.4.1.795.3.1.2.3
This section lists Adaptec traps in alphabetical order.
Trap name ID Meaning Error class
duralinkStatusTrap 1 The link status has
changed.
failoverStatusTrap 1 The failover status has
changed.
Table 19: Adaptec traps
informational
informational
5.3.2 APC traps (Powernet.mib)
MIB-OID: 1.3.6.1.4.1.318
This section lists the APC traps in alphabetical order.
Trap name ID Meaning Error class
baseFanFailure 25 The base module bypass
power supply is defective.
batteryPackComm
Established
batteryPackCommLost 26 Communication with external
bypassPowerSupply
Failure
calibrationStart 28 A test to determine the battery
codeAuthentication
Done
Table 20: APC traps
27 The UPS can communicate
with the external battery pack.
battery packs interrupted.
24 The base module bypass
power supply is defective.
strength has been initiated by
the UPS.
32 Authentication based on the
agent code image has been
completed.
major
informational
major
major
informational
informational
92 ServerView Event Manager
Page 93

Trap overview
Trap name ID Meaning Error class
communication
Established
8 Communication is established
between the agent and power
informational
supply.
communicationLost 1 Communication between the
major
agent and power supply was
interrupted.
contactFault 18 One of the contacts on the
major
Measure UPS has changed
from its default position.
contactFaultResolved 19 An error on one of the
informational
Measure UPS contacts has
been resolved.
hardwareFailure
Bypass
lowBattery 7 The UPS system batteries are
20 The UPS is on bypass due to a
hardware failure.
major
major
low and will soon be
exhausted. If utility power is not
restored the UPS will put itself
to sleep and immediately cut
power to the load.
powerRestored 9 Utility power has been restored
informational
after the occurrence of an
upsOnBattery condition.
restartAgent 29 The agent was restarted on the
informational
command of the manager.
returnFromBypass 23 The UPS has returned from
informational
bypass mode.
returnFromLowBattery 11 The UPS has returned from a
informational
lowBattery condition.
smartAvrReducing 31 The UPS has enabled
minor
SmartAVR voltage reduction.
smartBoostOn 6 The UPS has enabled
minor
SmartBoost.
Table 20: APC traps
ServerView Event Manager 93
Page 94

Trap overview
Trap name ID Meaning Error class
softwareBypass 21 The UPS has been set to
minor
bypass by a user via software
or via the UPS front panel.
switchedBypass 22 The UPS has been set to
minor
bypass by a user via the switch
on the back.
upsBatteryNeeds
Replacement
17 The UPS batteries require
immediate replacement.
upsDiagnosticsFailed 3 Internal UPS self-test failed.
upsDiagnosticsPassed 10 Internal UPS self-test passed.
upsDipSwitchChanged 16 The UPS DIP switch settings
major
major
informational
minor
have been changed.
upsDischarged 4 The UPS batteries are
major
discharged. If utility power fails
an immediate low battery
condition will exist. Sufficient
runtime for necessary action
cannot be guaranteed.
upsOnBattery 5 The UPS is now providing
minor
battery backup power.
upsOverload 2 The UPS has sensed a load
major
greater than 100% of its rated
capacity.
upsRebootStarted 15 The UPS has started the
minor
reboot sequence. The UPS will
reboot itself at this time.
upsSleeping 13 The UPS is entering sleep
minor
mode.
upsTurnedOff 12 The UPS has been switched off
minor
by a management station.
upsTurnedOn 30 The UPS is turned on.
upsWokeUp 14 The UPS has woken up from
informational
informational
sleep mode. Power to the load
has been restored.
Table 20: APC traps
94 ServerView Event Manager
Page 95

Trap overview
5.3.3 Blade System traps (s31.mib)
MIB-OID: 1.3.6.1.4.1.7244.1.1.1
This section lists the blade system traps in alphabetical order.
Trap name ID Meaning Error class
s31LivetimeError 1644 The lifetime of the blade
system has exceeded the
limited count.
s31MgmtBladeAdded 1601 A management blade was
added to the blade
system.
s31MgmtBladeCriticalError 1605 The management blade
status at the blade system
is critical.
s31MgmtBladeError 1604 The management blade
status at the blade system
is error.
s31MgmtBladeOk 1603 The management blade
status at the blade system
is ok.
s31MgmtBladeRemoved 1602 A management blade was
removed from the blade
system.
s31NicDetectionFail 1646 The management blade
NIC detection has failed.
s31PowerOverBudget 1645 The server blade at the
blade system power on
failed because of over
power budget.
s31ServerBladeAdded 1606 A server blade was added
to the blade system.
s31ServerBladeCritical
Error
1610 The server blade status at
the blade system is
critical.
Table 21: Blade System Traps
informational
informational
critical
major
informational
informational
informational
informational
informational
critical
ServerView Event Manager 95
Page 96

Trap overview
Trap name ID Meaning Error class
s31ServerBladeError 1609 The server blade status at
critical
the blade system is error.
s31ServerBladeHot
Replace
s31ServerBladeNewAdd 1639 A server blade was added
1640 A server blade was added
by hot replace.
informational
informational
on an empty slot of the
blade system.
s31ServerBladeOk 1608 The server blade status at
informational
the blade system is ok.
s31ServerBladeRemoved 1607 A server blade was
informational
removed from the blade
system.
s31ServerBootError 1633 No bootable operating
informational
system is found at the
server blade of the blade
system.
s31ServerBootWatchdog
Expired
1636 Boot watchdog at the
server blade of the blade
informational
system was expired.
s31ServerPostError 1632 The Power On Self Test
informational
status of the server blade
at the blade system is
error.
s31ServerPowerOff 1641 The server blade was
informational
powered off.
s31ServerPowerOn 1631 The server blade at the
informational
blade system is powered
on.
s31ServerShutdown 1634 The server blade at the
informational
blade system is shut
down.
s31ServerSoftware
WatchdogExpired
1635 Software watchdog at the
server blade of the blade
informational
system was expired.
Table 21: Blade System Traps
96 ServerView Event Manager
Page 97

Trap overview
Trap name ID Meaning Error class
s31SwitchBladeAdded 1611 A switch blade was added
informational
to the blade system.
s31SwitchBladeCritical
Error
1615 The switch blade status at
the blade system is
critical
critical.
s31SwitchBladeError 1614 The switch blade status at
major
the blade system is error.
s31SwitchBladeOk 1613 The switch blade status at
informational
the blade system is ok.
s31SwitchBladeRemoved 1612 A switch blade was
informational
removed from the blade
system.
s31SysFanAdded 1616 A system fan was added
informational
to the blade system.
s31SysFanCriticalError 1620 The system fan status at
critical
the blade system is
critical.
s31SysFanError 1619 The system fan status at
major
the blade system is error.
s31SysFanOk 1618 The system fan status at
informational
the blade system is ok.
s31SysFanRemoved 1617 A system fan was
informational
removed from the blade
system.
s31SysPowerSupplyAdded 1626 A power supply unit was
informational
added to the blade
system.
s31SysPowerSupplyCritical
Error
s31SysPowerSupplyError 1629 The power supply unit at
1630 The power supply unit
status is critical.
critical
major
the blade system failed.
s31SysPowerSupplyOk 1628 The power supply unit at
informational
the blade system is
working again.
Table 21: Blade System Traps
ServerView Event Manager 97
Page 98

Trap overview
Trap name ID Meaning Error class
s31SysPowerSupplyRemo
ved
1627 A power supply unit was
removed from the blade
informational
system.
s31SysTempCriticalError 1623 The temperature at the
critical
system temperature
sensor of the blade server
has reached the critical
level.
s31SysTempError 1622 The temperature at the
major
system temperature
sensor of the blade server
is out of normal range.
s31SysTempOk 1621 The temperature at the
informational
system temperature
sensor of the blade server
is within normal range.
s31SysTempSensorAdded 1642 A system temperature
informational
sensor was added to the
blade system.
s31SysTempSensorBroken 1625 The system temperature
major
sensor of the blade server
is broken or not
connected.
s31SysTempSensorOK 1624 The system temperature
informational
sensor of the blade server
is working again.
s31SysTempSensor
Removed
1643 A system temperature
sensor was removed from
informational
the blade system.
s31TestTrap 1600 A test trap was sent from
informational
the blade system (no
error).
Table 21: Blade System Traps
98 ServerView Event Manager
Page 99

Trap overview
Trap name ID Meaning Error class
s31TrapEventLog 1638 An error was recorded on
major
the blade system. See the
server management event
error log (Recovery) for
detailed information.
s31UserAuthentication
Failure
1637 An user authentication
failure was detected at the
major
blade system. Performing
the protocol.
Table 21: Blade System Traps
ServerView Event Manager 99
Page 100

Trap overview
5.3.4 Cluster traps (NTCluster.mib)
MIB-OID: 1.3.6.1.4.1.231
This section lists cluster traps in alphabetical order.^
Trap name ID Meaning Error class
sniWpChange
ClusterActiveAgain
sniWpChange
ClusterNoLonger
Active
sniWpChange
ClusterNotFound
Active
sniWpChange
GroupAdded
sniWpChange
GroupDeleted
sniWpChange
GroupProperty
sniWpChange
GroupState
sniWpChange
NetInterfaceAdded
sniWpChange
NetInterfaceDeleted
sniWpChange
NetInterfaceProperty
sniWpChange
NetInterfaceState
sniWpChange
NetworkAdded
Table 22: Cluster traps
811 The SNMP agent has
established the connection
with the cluster service.
812 The SNMP agent has lost the
connection with the cluster
service.
810 The SNMP agent has started
the cluster service but could
not communicate with it.
851 A new resource group was
created.
850 A resource group was
deleted.
853 The settings for a resource
group have been changed.
852 A resource group has
changed its status.
921 A new network interface was
created.
920 A network interface was
deleted.
923 The settings for a network
interface have been
changed.
922 A network interface has
changed its status.
911 A network was added to the
cluster.
informational
critical
critical
informational
critical
major
major
informational
critical
major
major
informational
100 ServerView Event Manager
 Loading...