

Page 1

FortiVoice™ Gateway GO08 5.3.6
Administration Guide
Page 2

FortiVoice™ Gateway GO08 5.3.6 Administration Guide
April 13, 2017
1st Edition
Copyright© 2017 Fortinet, Inc. All rights reserved. Fortinet®, FortiGate®, FortiCare® and
FortiGuard®, and certain other marks are registered trademarks of Fortinet, Inc., in the U.S. and
other jurisdictions, and other Fortinet names herein may also be registered and/or common law
trademarks of Fortinet. All other product or company names may be trademarks of their
respective owners. Performance and other metrics contained herein were attained in internal
lab tests under ideal conditions, and actual performance and other results may vary. Network
variables, different network environments and other conditions may affect performance results.
Nothing herein represents any binding commitment by Fortinet, and Fortinet disclaims all
warranties, whether express or implied, except to the extent Fortinet enters a binding written
contract, signed by Fortinet's General Counsel, with a purchaser that expressly warrants that
the identified product will perform according to certain expressly-identified performance metrics
and, in such event, only the specific performance metrics expressly identified in such binding
written contract shall be binding on Fortinet. For absolute clarity, any such warranty will be
limited to performance in the same ideal conditions as in Fortinet's internal lab tests. In no event
does Fortinet make any commitment related to future deliverables, features or development,
and circumstances may change such that any forward-looking statements herein are not
accurate. Fortinet disclaims in full any covenants, representations, and guarantees pursuant
hereto, whether express or implied. Fortinet reserves the right to change, modify, transfer, or
otherwise revise this publication without notice, and the most current version of the publication
shall be applicable.
Technical Documentation docs.fortinet.com
Knowledge Base kb.fortinet.com
Customer Service & Support support.fortinet.com
Training Services training.fortinet.com
FortiGuard fortiguard.com
Document Feedback techdocs@fortinet.com
Page 3

Table of Contents
Introduction....................................................................................................... 5
Registering your Fortinet product............................................................................ 5
Customer service & technical support............................................................... 5
Training .................................................................................................................... 5
Documentation ....................................................................................................... 6
Fortinet Tools & Documentation CD .................................................................. 6
Fortinet Knowledge Base .................................................................................. 6
Comments on Fortinet technical documentation .............................................. 6
Scope....................................................................................................................... 6
Conventions............................................................................................................. 6
IP addresses ...................................................................................................... 6
Cautions and notes............................................................................................ 7
Typographical conventions................................................................................ 7
Command syntax conventions .......................................................................... 8
Connecting to the FortiVoice Gateway System........................................... 11
Connecting to the web-based manager or CLI ..................................................... 11
Connecting to the web-based manager .......................................................... 12
Connecting to the CLI...................................................................................... 13
Monitoring the FortiVoice Gateway System ................................................ 16
Viewing overall system status................................................................................ 16
Viewing the dashboard .................................................................................... 16
Viewing the Call Statistics................................................................................ 18
Using the CLI Console ..................................................................................... 18
Viewing system status ........................................................................................... 18
Viewing active calls.......................................................................................... 18
Viewing trunk status......................................................................................... 19
Viewing call records............................................................................................... 19
Viewing log messages ........................................................................................... 19
Displaying and arranging log columns............................................................. 21
Using the right-click pop-up menus ................................................................ 21
Searching log messages.................................................................................. 22
Configuring System Settings......................................................................... 24
Configuring network settings................................................................................. 24
About FortiVoice Gateway logical interfaces ................................................... 24
Configuring the network interfaces.................................................................. 25
Configuring static routes.................................................................................. 29
Configuring DNS .............................................................................................. 30
Capturing voice and fax packets ..................................................................... 30
Configuring administrator accounts ...................................................................... 32
Configuring administrator accounts................................................................. 32
Fortinet Technologies Inc. Page 3 FortiVoice Gateway 5.3.6 Administration Guide
Page 4

Configuring system time, system options, and GUI appearance .......................... 33
Configuring the time and date ......................................................................... 34
Configuring system options ............................................................................. 38
Customizing the GUI appearance.................................................................... 38
Configuring advanced system settings ................................................................. 39
Setting FortiVoice Gateway location and contact information ........................ 39
Configuring SIP settings .................................................................................. 40
Maintaining the system.......................................................................................... 41
Maintaining the system configuration .............................................................. 41
Downloading a trace file .................................................................................. 42
Configuring FortiVoice Gateway ................................................................... 43
Creating SIP peer for IP-PBX ................................................................................ 43
Testing SIP trunks............................................................................................ 47
Configuring SIP profiles ......................................................................................... 47
Modifying analog trunks ........................................................................................ 48
Mapping a SIP peer with the FortiVoice Gateway ................................................. 50
Configuring Logs ............................................................................................ 51
About FortiVoice Gateway logging ........................................................................ 51
FortiVoice Gateway log types .......................................................................... 51
Log message severity levels ............................................................................ 52
Configuring logging................................................................................................ 52
Configuring logging to the hard disk................................................................ 52
Choosing which events to log.......................................................................... 53
Installing firmware.......................................................................................... 54
Testing firmware before installing it ....................................................................... 54
Installing firmware.................................................................................................. 56
Reconnecting to the FortiVoice Gateway ........................................................ 58
Restoring the configuration.............................................................................. 59
Verifying the configuration ............................................................................... 60
Upgrading ........................................................................................................ 60
Clean installing firmware........................................................................................ 61
Index ................................................................................................................ 63
Fortinet Technologies Inc. Page 4 FortiVoice Gateway 5.3.6 Administration Guide
Page 5

Introduction
Welcome, and thank you for selecting Fortinet products.
The FortiVoice Gateway is a simple solution for adding analog phone lines to your SIP server
enabled PBX. With the easy to use and intuitive web interface, you can quickly create rules that
allow calls from analog lines, connected to the FortiVoice Gateway FXO ports, to communicate
directly to your SIP server enabled PBX. The FortiVoice Gateway also offers various usage
tracking options, such as call statistics and call detail records, so you can monitor the calls
coming through the system.
This document describes how to configure and use the FortiVoice Gateway through the
web-based manager.
This topic includes:
• Registering your Fortinet product
• Training
• Documentation
• Scope
• Conventions
Registering your Fortinet product
Customer service & technical support
Training
Before you begin, take a moment to register your Fortinet product at the Fortinet Technical
Support web site, https://support.fortinet.com.
Many Fortinet customer services, such as firmware updates and technical support,
require product registration.
For more information, see the Fortinet Knowledge Base article Registration Frequently Asked
Questions.
Fortinet Technical Support provides services designed to make sure that you can install your
Fortinet products quickly, configure them easily, and operate them reliably in your network.
To learn about the technical support services that Fortinet provides, visit the Fortinet Technical
Support web site at https://support.fortinet.com.
You can dramatically improve the time that it takes to resolve your technical support ticket by
providing your configuration file, a network diagram, and other specific information. For a list of
required information, see the Fortinet Knowledge Base article Technical Support Requirements.
Fortinet Training Services provides classes that orient you quickly to your new equipment, and
certifications to verify your knowledge level. Fortinet provides a variety of training programs to
serve the needs of our customers and partners world-wide.
To learn about the training services that Fortinet provides, visit the Fortinet Training Services
web site at http://training.fortinet.com, or email them at training@fortinet.com.
Fortinet Technologies Inc. Page 5 FortiVoice Gateway 5.3.6 Administration Guide
Page 6

Documentation
The Fortinet Technical Documentation web site, http://docs.fortinet.com, provides the most
up-to-date versions of Fortinet publications, as well as additional technical documentation such
as technical notes.
In addition to the Fortinet Technical Documentation web site, you can find Fortinet technical
documentation on the Fortinet Tools and Documentation CD, and on the Fortinet Knowledge
Base.
Fortinet Tools & Documentation CD
Many Fortinet publications are available on the Fortinet Tools and Documentation CD shipped
with your Fortinet product. The documents on this CD are current at shipping time. For current
versions of Fortinet documentation, visit the Fortinet Technical Documentation web site,
http://docs.fortinet.com.
Fortinet Knowledge Base
The Fortinet Knowledge Base provides additional Fortinet technical documentation, such as
troubleshooting and how-to-articles, examples, FAQs, technical notes, a glossary, and more.
Visit the Fortinet Knowledge Base at http://kb.fortinet.com.
Comments on Fortinet technical documentation
Please send information about any errors or omissions in this document to
techdoc@fortinet.com.
Scope
This document describes how to connect the FortiVoice Gateway to its web-based manager
and CLI and use the web-based manager to configure the FortiVocieGateway unit.
This document does not cover commands for the command line interface (CLI).
Conventions
Fortinet technical documentation uses the following conventions:
• IP addresses
• Cautions and notes
• Typographical conventions
• Command syntax conventions
IP addresses
To avoid publication of public IP addresses that belong to Fortinet or any other organization, the
IP addresses used in Fortinet technical documentation are fictional and follow the
documentation guidelines specific to Fortinet. The addresses used are from the private IP
address ranges defined in RFC 1918: Address Allocation for Private Internets, available at
http://ietf.org/rfc/rfc1918.txt?number-1918.
Fortinet Technologies Inc. Page 6 FortiVoice Gateway 5.3.6 Administration Guide
Page 7

Cautions and notes
Fortinet technical documentation uses the following guidance and styles for cautions and notes.
Warns you about commands or procedures that could have unexpected or undesirable results
including loss of data or damage to equipment.
Highlights useful additional information, often tailored to your workplace activity.
Typographical conventions
Fortinet documentation uses the following typographical conventions:
Table 1: Typographical conventions in Fortinet technical documentation
Convention Example
Button, menu, text
box, field, or check
box label
CLI input config system dns
CLI output FGT-602803030703 # get system settings
Emphasis HTTP connections are not secure and can be
File content <HTML><HEAD><TITLE>Firewall
Hyperlink Visit the Fortinet Technical Support web site,
From Minimum log level, select Notification.
set primary <address_ipv4>
end
comments : (null)
opmode : nat
intercepted by a third party.
Authentication</TITLE></HEAD>
<BODY><H4>You must authenticate to use
this service.</H4>
https://support.fortinet.com.
Keyboard entry Type a name for the remote VPN peer or client, such as
Central_Office_1.
Fortinet Technologies Inc. Page 7 FortiVoice Gateway 5.3.6 Administration Guide
Page 8

Table 1: Typographical conventions in Fortinet technical documentation
Navigation Go to Monitor > Status > DHCP.
Publication For details, see the FortiGate Administration Guide.
Command syntax conventions
The command line interface (CLI) requires that you use valid syntax, and conform to expected
input constraints. It will reject invalid commands.
Brackets, braces, and pipes are used to denote valid permutations of the syntax. Constraint
notations, such as <address_ipv4>, indicate which data types or string patterns are
acceptable value input.
Table 2: Command syntax notation
Convention Description
Square brackets [ ] A non-required word or series of words. For example:
[verbose {1 | 2 | 3}]
indicates that you may either omit or type both the verbose
word and its accompanying option, such as:
verbose 3
Fortinet Technologies Inc. Page 8 FortiVoice Gateway 5.3.6 Administration Guide
Page 9

Table 2: Command syntax notation
Angle brackets < > A word constrained by data type.
To define acceptable input, the angled brackets contain a
descriptive name followed by an underscore ( _ ) and suffix
that indicates the valid data type. For example:
<retries_int>
indicates that you should enter a number of retries, such as 5.
Data types include:
• <xxx_name>: A name referring to another part of the
configuration, such as policy_A.
• <xxx_index>: An index number referring to another part
of the configuration, such as 0 for the first static route.
• <xxx_pattern>: A regular expression or word with wild
cards that matches possible variations, such as
*@example.com to match all email addresses ending in
@example.com.
• <xxx_fqdn>: A fully qualified domain name (FQDN), such
as mail.example.com.
• <xxx_email>: An email address, such as
admin@mail.example.com.
• <xxx_url>: A uniform resource locator (URL) and its
associated protocol and host name prefix, which together
form a uniform resource identifier (URI), such as
http://www.fortinet.com/.
• <xxx_ipv4>: An IPv4 address, such as 192.168.1.99.
• <xxx_v4mask>: A dotted decimal IPv4 netmask, such as
255.255.255.0.
• <xxx_ipv4mask>: A dotted decimal IPv4 address and
netmask separated by a space, such as
192.168.1.99 255.255.255.0.
• <xxx_ipv4/mask>: A dotted decimal IPv4 address and
CIDR-notation netmask separated by a slash, such as such
as 192.168.1.99/24.
• <xxx_ipv6>: A colon( : )-delimited hexadecimal IPv6
address, such as
3f2e:6a8b:78a3:0d82:1725:6a2f:0370:6234.
• <xxx_v6mask>: An IPv6 netmask, such as /96.
• <xxx_ipv6mask>: An IPv6 address and netmask
separated by a space.
• <xxx_str>: A string of characters that is not another data
type, such as P@ssw0rd. Strings containing spaces or
special characters must be surrounded in quotes or use
escape sequences.
• <xxx_int>: An integer number that is not another data
type, such as 15 for the number of minutes.
Fortinet Technologies Inc. Page 9 FortiVoice Gateway 5.3.6 Administration Guide
Page 10

Table 2: Command syntax notation
Curly braces { } A word or series of words that is constrained to a set of
options delimited by either vertical bars or spaces.
You must enter at least one of the options, unless the set of
options is surrounded by square brackets [ ].
Options
delimited by
vertical bars |
Options
delimited by
spaces
Mutually exclusive options. For example:
{enable | disable}
indicates that you must enter either enable or disable, but
must not enter both.
Non-mutually exclusive options. For example:
{http https ping snmp ssh telnet}
indicates that you may enter all or a subset of those options, in
any order, in a space-delimited list, such as:
ping https ssh
To change the options, you must re-type the entire list. For
example, to add snmp to the previous example, you would
type:
ping https snmp ssh
If the option adds to or subtracts from the existing list of
options, instead of replacing it, or if the list is
comma-delimited, the exception will be noted.
Fortinet Technologies Inc. Page 10 FortiVoice Gateway 5.3.6 Administration Guide
Page 11

Connecting to the FortiVoice Gateway System
After physically installing the FortiVoice Gateway, you need to connect to its management tools
to configure, maintain, and administer the unit.
This topic includes:
• Connecting to the web-based manager or CLI
Connecting to the web-based manager or CLI
There are two methods to connect to the FortiVoice Gateway:
• use the web-based manager, a graphical user interface (GUI), from within a web browser
• use the command line interface (CLI), an interface similar to DOS or UNIX commands, from a
Secure Shell (SSH), Telnet terminal, or serial connection
Access to the CLI and/or web-based manager is not yet configured if:
• you are connecting for the first time
• you have just reset the configuration to its default state
• you have just restored the firmware
In these cases, you must access either interface using the default settings.
If the above conditions do not apply, access the web UI using the IP address, administrative
access protocol, administrator account and password already configured, instead of the
default settings.
After you connect, you can use the web-based manager or CLI to configure basic network
settings and access the CLI and/or web-based manager through your network. However, if you
want to update the firmware, you may want to do so before continuing. See “System
Information widget” on page 17.
Until the FortiVoice Gateway is configured with an IP address and connected to your network,
you may prefer to connect the FortiVoice Gateway directly to your management computer, or
through a switch, in a peer network that is isolated from your overall network. However,
isolation is not required.
This topic includes:
• Connecting to the web-based manager
• Connecting to the CLI
Fortinet Technologies Inc. Page 11 FortiVoice Gateway 5.3.6 Administration Guide
Page 12

Connecting to the web-based manager
To connect to the web-based manager using its default settings, you must have:
• a computer with an RJ-45 Ethernet network port
• a web browser such as Microsoft Internet Explorer version 6.0 or greater, or a recent version
of Mozilla Firefox
• a crossover network cable
Table 3: Default settings for connecting to the web-based manager
Network Interface port1
URL https://192.168.1.99/admin
Administrator Account admin
Password (none)
To connect to the web-based manager
1. On your management computer, configure the Ethernet port with the static IP address
192.168.1.2 with a netmask of 255.255.255.0.
2. Using the Ethernet cable, connect your computer’s Ethernet port to the FortiVoice’s port1.
3. Start your browser and enter the URL https://192.168.1.99/admin. (Remember to include the
“s” in https://.)
To support HTTPS authentication, the FortiVoice Gateway ships with a self-signed security
certificate, which it presents to clients whenever they initiate an HTTPS connection to the
FortiVoice. When you connect, depending on your web browser and prior access of the
FortiVoice, your browser might display two security warnings related to this certificate:
• The certificate is not automatically trusted because it is self-signed, rather than being
signed by a valid certificate authority (CA). Self-signed certificates cannot be verified with
a proper CA, and therefore might be fraudulent. You must manually indicate whether or
not to trust the certificate.
• The certificate might belong to another web site. The common name (CN) field in the
certificate, which usually contains the host name of the web site, does not exactly match
the URL you requested. This could indicate server identity theft, but could also simply
indicate that the certificate contains a domain name while you have entered an IP
address. You must manually indicate whether this mismatch is normal or not.
Both warnings are normal for the default certificate.
4. Verify and accept the certificate, either permanently (the web browser will not display the
self-signing warning again) or temporarily. You cannot log in until you accept the certificate.
For details on accepting the certificate, see the documentation for your web browser.
5. In the Name field, type admin, then click Login. (In its default state, there is no password for
this account.)
Login credentials entered are encrypted before they are sent to the FortiVoice. If your login is
successful, the web UI appears. To continue by updating the firmware, see “System
Information widget” on page 17. Otherwise, to continue by following the configuration
wizard.
Fortinet Technologies Inc. Page 12 FortiVoice Gateway 5.3.6 Administration Guide
Page 13

Connecting to the CLI
Using its default settings, you can access the CLI from your management computer in two
ways:
• a local serial console connection
• an SSH connection, either local or through the network
To connect to the CLI using a local serial console connection, you must have:
• a computer with a serial communications (COM) port
• the RJ-45-to-DB-9 serial or null modem cable included in your FortiVoice package
• terminal emulation software, such as HyperTerminal for Microsoft Windows
To connect to the CLI using an SSH connection, you must have:
• a computer with an RJ-45 Ethernet port
• a crossover Ethernet cable
• an SSH client, such as PuTTY
Table 4: Default settings for connecting to the CLI by SSH
Network Interface port1
IP Address 192.168.1.99
SSH Port Number 22
Administrator Account admin
Password (none)
If you are not connecting for the first time, nor have you just reset the configuration to its
default state or restored the firmware, administrative access settings may have already been
configured. In this case, access the CLI using the IP address, administrative access protocol,
administrator account and password already configured, instead of the default settings.
The following procedure uses Microsoft HyperTerminal. Steps may vary with other terminal
emulators.
To connect to the CLI using a local serial console connection
1. Using the RJ-45-to-DB-9 or null modem cable, connect your computer’s serial
communications (COM) port to the FortiVoice’s console port.
2. Verify that the FortiVoice is powered on.
3. On your management computer, start HyperTerminal.
4. On Connection Description, enter a Name for the connection and select OK.
5. On Connect To, from Connect using, select the communications (COM) port where you
connected the FortiVoice.
6. Select OK.
7. Select the following Port settings and select OK.
Fortinet Technologies Inc. Page 13 FortiVoice Gateway 5.3.6 Administration Guide
Page 14

Bits per second 115200
Data bits 8
Parity None
Stop bits 1
Flow control None
8. Press Enter.
The terminal emulator connects to the CLI and the CLI displays a login prompt.
9. Type admin and press Enter twice. (In its default state, there is no password for this
account.)
The CLI displays a prompt, such as:
FortiVoice #
10.Type admin and press Enter twice. (In its default state, there is no password for this
account.)
The CLI displays the following text:
Type ? for a list of commands.
You can now enter commands.
The following procedure uses PuTTY. Steps may vary with other SSH clients.
To connect to the CLI using an SSH connection
1. On your management computer, configure the Ethernet port with the static IP address
192.168.1.2 with a netmask of 255.255.255.0.
2. Using the Ethernet cable, connect your computer’s Ethernet port to the FortiVoice’s port1.
3. Verify that the FortiVoice is powered on.
4. On your management computer, start your SSH client.
5. In Host Name (or IP Address), type 192.168.1.99.
6. In Port, type 22.
7. From Connection type, select SSH.
8. Select Open.
The SSH client connects to the FortiVoice.
The SSH client may display a warning if this is the first time you are connecting to the
FortiVoice and its SSH key is not yet recognized by your SSH client, or if you have previously
connected to the FortiVoice but it used a different IP address or SSH key. If your
management computer is directly connected to the FortiVoice with no network hosts
between them, this is normal.
9. Click Yes to verify the fingerprint and accept the FortiVoice’s SSH key. You cannot log in until
you accept the key.
The CLI displays a login prompt.
Fortinet Technologies Inc. Page 14 FortiVoice Gateway 5.3.6 Administration Guide
Page 15

10.Type admin and press Enter twice. (In its default state, there is no password for this
account.)
The CLI displays the following text:
Type ? for a list of commands.
You can now enter commands.
Fortinet Technologies Inc. Page 15 FortiVoice Gateway 5.3.6 Administration Guide
Page 16
Monitoring the FortiVoice Gateway System
The Status menu displays system usage, log messages, and other status-indicating items.
This topic includes:
• Viewing overall system status
• Viewing system status
• Viewing call records
• Viewing log messages
Viewing overall system status
The Status menu displays system status, most of which pertain to the entire system, such as
service status and system resource.
This topic includes:
• Viewing the dashboard
• Viewing the Call Statistics
• Using the CLI Console
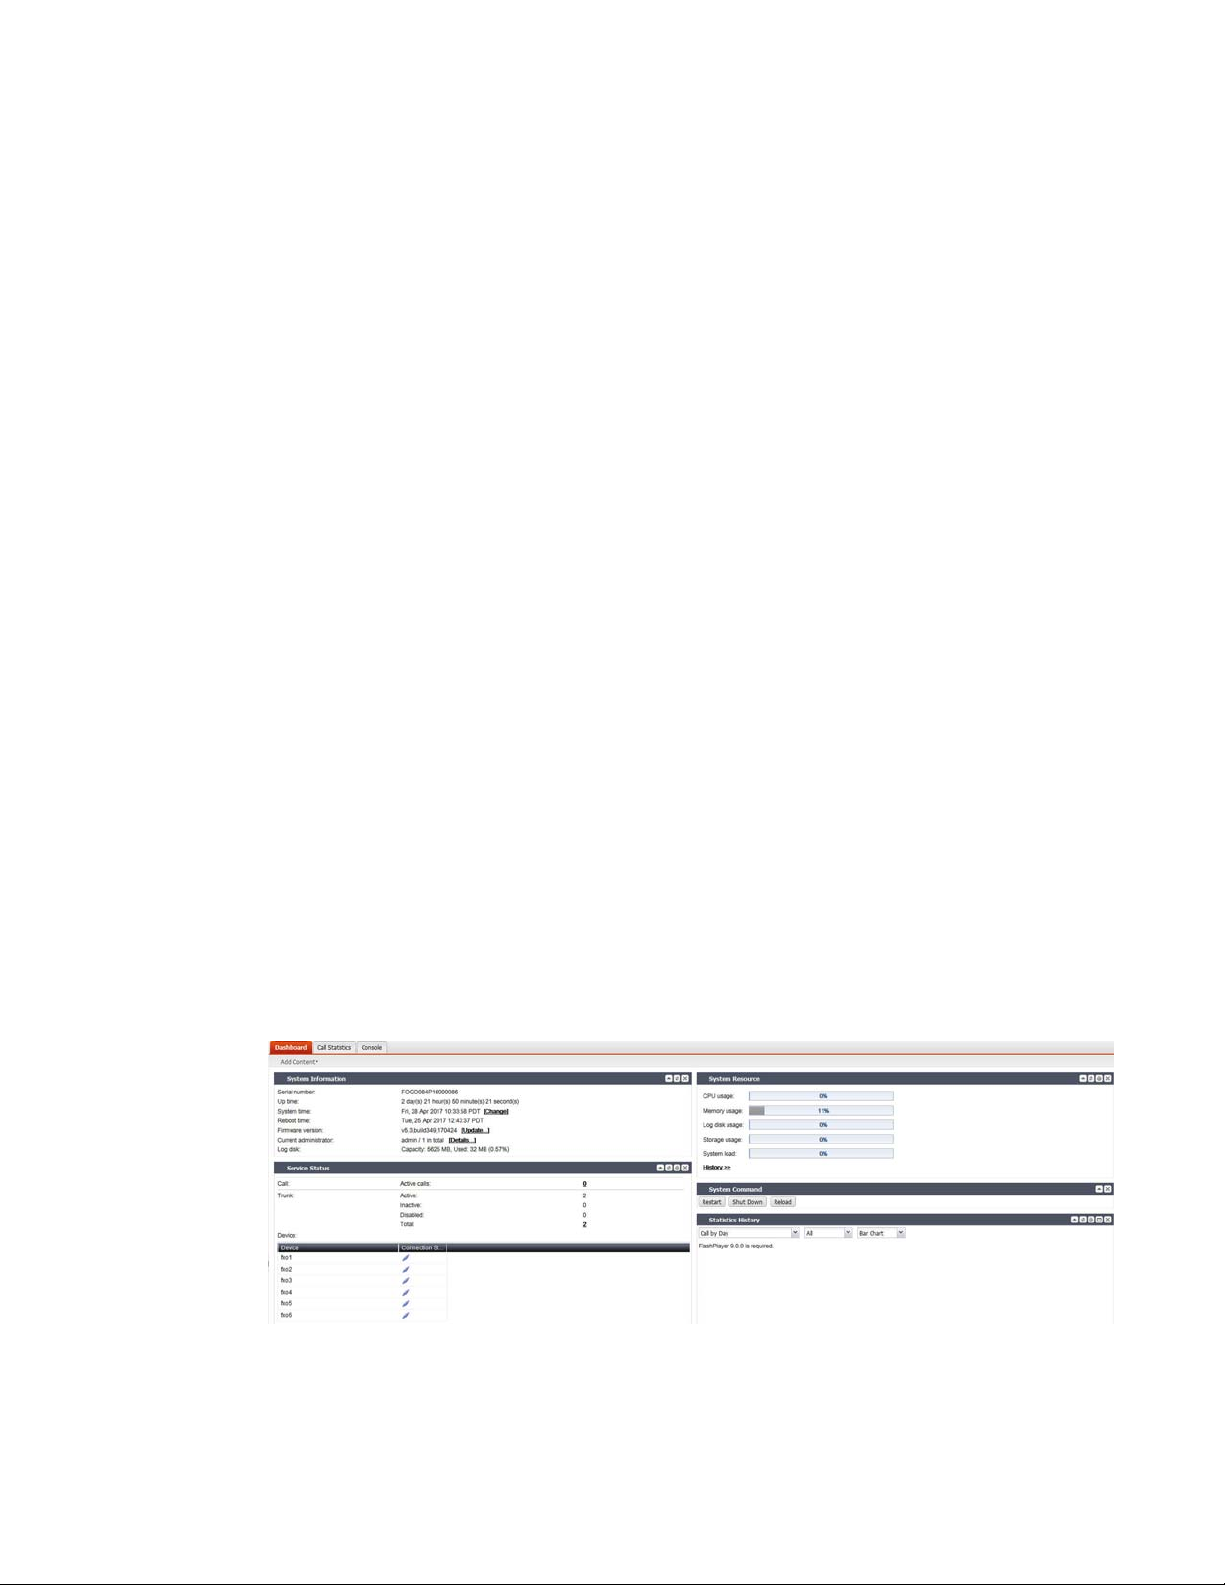
Viewing the dashboard
Status > Dashboard displays first after you log in to the web-based manager. It contains a
dashboard with widgets that each indicates performance level or other statistics.
By default, widgets display the serial number and current system status of the FortiVoice
Gateway, including uptime, system resource usage, service status, firmware version, system
time, and statistics history.
To view the dashboard, go to Status > Dashboard > Dashboard.
Figure 1: Monitor system status
The dashboard is customizable. You can select which widgets to display, where they are
located on the tab, and whether they are minimized or maximized.
To move a widget, position your mouse cursor on the widget’s title bar, then click and drag the
widget to its new location.
Fortinet Technologies Inc. Page 16 FortiVoice Gateway 5.3.6 Administration Guide
Page 17

To show or hide a widget, in the upper left-hand corner, click Add Content, then mark the check
boxes of widgets that you want to show.
Options vary slightly from widget to widget, but always include options to close or
minimize/maximize the widget.
Figure 2: A minimized widget on the dashboard
Disclosure arrow
Widget title
Refresh
Close
System Information widget
The System Information widget displays the serial number and basic system statuses such as
the firmware version, system time, and up time.
In addition to displaying basic system information, the System Information widget lets you
change the firmware. To change the firmware, click Update for Firmware version. For more
information, see “Installing firmware” on page 54.
To view the widget, go to Status > Dashboard. If the widget is not currently shown, click Add
Content, and mark the check box for the widget.
Service Status widget
The Service Status widget displays the number of current calls, extension status, trunk status,
and device connection status.
To view the widget, go to Status > Dashboard. If the widget is not currently shown, click Add
Content, and mark the check box for the widget.
Following is the connection status of the FXO ports:
• Connected: The port is connected to a device.
• Disconnected: The port is not connected to any device and is ready for use.
• Alarmed: The port has an error and is not usable.
• Occupied: The port is being used.
System Resource widget
The System Resource widget displays the CPU, memory, and disk space usage. It also displays
the system load and current number of IP sessions.
To view the widget, go to Status > Dashboard. If the widget is not currently shown, click Add
Content, and mark the check box for the widget.
The system resources history can also be viewed in this widget by clicking History. The system
resources history contains four graphs. Each graph displays readings of one of the system
resources: CPU, memory, IP sessions, and network bandwidth usage. Each graph is divided by
a grid.
Statistics History widget
The Statistics History widget contains charts that summarize the number of calls in each time
period that the FortiVoice Gateway unit recorded.
Fortinet Technologies Inc. Page 17 FortiVoice Gateway 5.3.6 Administration Guide
Page 18

To view the widget, go to Status > Dashboard. If the widget is not currently shown, click Add
Content, and mark the check box for the widget.
Also see “Viewing the Call Statistics” on page 18.
System Command widget
The System Command widget lets you restart, shut down, or reload the configuration of the
FortiVoice Gateway unit.
To view the widget, go to Status > Dashboard. If the widget is not currently shown, click Add
Content, and mark the check box for the widget.
Before rebooting or halting the FortiVoice Gateway unit, consider notifying your phone users, as
it could result in temporary interruptions to connectivity.
Reloading allows the FortiVoice Gateway to reload its configuration from its last saved version,
and log you out. Any changes that were in progress but not yet saved, such as GUI pages that
were not applied or CLI commands where you had not yet entered next or end, are lost. If you
want to continue configuring the FortiVoice Gateway, refresh your browser and log in again.
Viewing the Call Statistics
The Call Statistics tab contains summaries of the number of calls by time and direction that the
FortiVoice Gateway recorded.
To view call statistics, go to Status > Dashboard > Call Statistics.
Using the CLI Console
Go to Status > Dashboard > Console to access the CLI without exiting from the web-based
manager.
You can click the Open in New Window at the bottom of the page to move the CLI Console into
a pop-up window that you can resize and reposition.
Viewing system status
Status > System displays all the ongoing phone calls and trunks.
This topic includes:
• Viewing active calls
• Viewing trunk status
Viewing active calls
Status > System > Active Calls displays all the ongoing phone calls in realtime, including the
callers and receivers, the trunks through which phone calls are connected, the call status, and
the call duration.
You can stop a phone call by clicking the Hang up icon.
The call statuses include:
• Ringing: The receiver’s phone is ringing.
• Connected: Callers are connected. The voice channel is established.
• Voicemail: The call goes to the voicemail.
Fortinet Technologies Inc. Page 18 FortiVoice Gateway 5.3.6 Administration Guide
Page 19

Viewing trunk status
Status > System > Trunks displays all the trunks in realtime, including their names, IP
addresses, types, status, and registration/connection status with the VoIP or PSTN service
provider.
The trunk statuses include:
• Not registered: The trunk is not registered with the VoIP or PSTN service provider and is not
in service.
• In service: The trunk is registered with the VoIP or PSTN service provider and is in service.
• Unavailable: The trunk is not reachable.
• Alarm detected: There is a problem with the trunk.
• Admin down: The trunk is disabled.
• Unmonitored: The trunk is not monitored.
When you click the IP address of a SIP extension, you can interface with the extension and
configure it remotely.
Registration/Connection indicates if a trunk has been registered with or connected to the VoIP
or PSTN service provider.
You can stop a phone call by clicking the Hang up icon.
For more information, see “Configuring FortiVoice Gateway” on page 43.
Viewing call records
Status > Call Detail Records (CDR) displays all the phone calls made during a certain time
period, including time of the call, caller and receiver, call duration, call status, and call direction.
Double-clicking a record displays the detailed call information, including the CDR flow.
You can filter the call records display by clicking the Search button and enter criteria that
records must match in order to be visible. You can also save the call records by clicking the
Download button.
Viewing log messages
The Logs submenu displays locally stored log files. If you configured the FortiVoice Gateway to
store log messages locally (that is, to the hard disk), you can view the log messages currently
stored in each log file.
Logs stored remotely cannot be viewed from the web-based manager of the FortiVoice
Gateway. If you want to view logs from the web-based manager, also enable local storage. For
details, see “Configuring Logs” on page 51.
Status > Logs displays the logs of administrator activities and system events as well as voice.
To view the list of log files and their contents
1. Go to Status > Logs > Event/Voice.
The list of log files appears with the beginning and end of a log file’s time range and the size
of a log file in bytes. The queue log files display more information.
Fortinet Technologies Inc. Page 19 FortiVoice Gateway 5.3.6 Administration Guide
Page 20
2. To download an event, voice, fax, and call center log file, select it and click Download to
save it in one of the three formats:
• Normal Format for a log file that can be viewed with a plain text editor such as Microsoft
Notepad.
• CSV Format for a comma-separated value (.csv) file that can be viewed in a spreadsheet
application such as Microsoft Excel or OpenOffice Calc.
• Compressed Format for a plain text log file like Normal Format, except that it is
compressed and stored within a .gz archive.
3. To search the log files, click the Search button and enter criteria that records must match in
order to be visible.
Unlike the search when viewing the contents of an individual log file, this search displays
results regardless of which log file contains them. For more information, see “Searching log
messages” on page 22.
4. To view messages contained in logs, double-click a log file.
To view the current page’s worth of the log messages as an HTML table, right-click and
select Export to Table. The table appears in a new tab. To download the table, click and drag
to select the whole table, then copy and paste it into a rich text editor such as Microsoft
Word or OpenOffice Writer.
Log messages can appear in either raw or formatted views.
• Raw view displays log messages exactly as they appear in the plain text log file.
• Formatted view displays log messages in a columnar format. Each log field in a log
message appears in its own column, aligned with the same field in other log messages,
for rapid visual comparison.
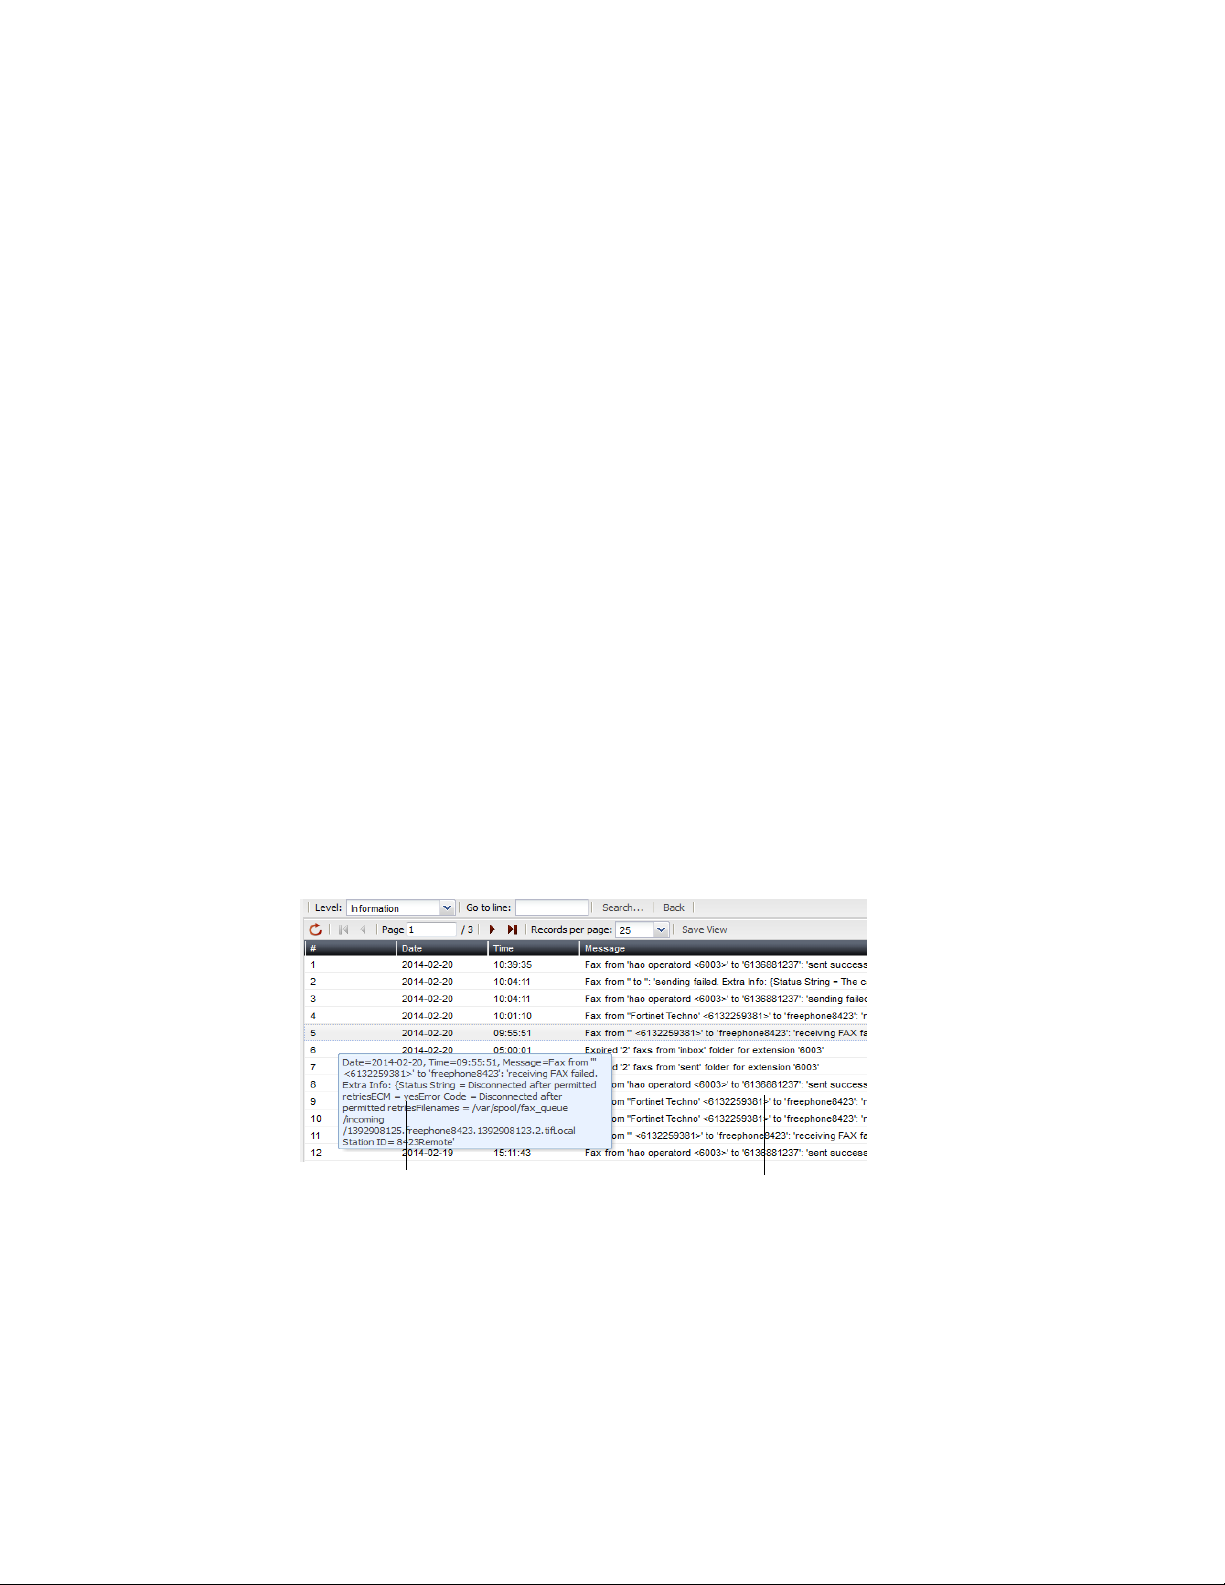
By default, log messages always appear in columnar format, with one log field per column.
However, when viewing this columnar display, you can also view the log message in raw
format by hovering your mouse over the index number of the log message, in the # column,
as shown in Figure 3.
Figure 3: Log message view
Log message in raw format
Log message in columnar format
The log messages vary by levels. For more information, see “Configuring Logs” on page 51.
The log messages are also filtered by subtypes:
• Configuration: Display only log messages containing subtype=config.
• Administration: Display only log messages containing subtype=admin.
• System: Display only log messages containing subtype=system.
You can click the Save View button to save the customized view. Future log message reports
appear in this view.
Fortinet Technologies Inc. Page 20 FortiVoice Gateway 5.3.6 Administration Guide
Page 21

Displaying and arranging log columns
When viewing logs, you can display, hide, sort and re-order columns.
For most columns, you can also filter data within the columns to include or exclude log
messages which contain your specified text in that column. For more information, see
“Searching log messages” on page 22.
By default, each page’s worth of log messages is listed with the log message with the lowest
index number towards the top.
To sort the page’s entries in ascending or descending order
1. Click the column heading by which you want to sort.
The log messages are sorted in ascending order.
2. To sort in descending order, click the column heading again.
Depending on your currently selected theme:
• the column heading may darken in color to indicate which column is being used to sort
the page
• a small upwards-or downwards-pointing arrow may appear in the column heading next to
its name to indicate the current sort order.
To display or hide columns
1. Go to Status > Logs > Event/Voice.
2. Double-click the row corresponding to time period whose log messages you want to view.
3. Position your mouse cursor over a column heading to display the down arrow on its
right-hand side, click the down arrow and move your cursor over Columns to display the list
of available columns, then mark the check boxes of columns that you want to display.
Figure 4: Hiding and showing log columns
4. Click Save View.
To change the order of the columns
1. Go to Status > Logs > Event/Voice.
2. Double-click the row corresponding to time period whose log messages you want to view.
3. For each column whose order you want to change, click and drag its column heading to the
left or right.
4. Click Save View.
Using the right-click pop-up menus
Make visible
Make invisible
When you right-click on a log message, a context menu appears.
Fortinet Technologies Inc. Page 21 FortiVoice Gateway 5.3.6 Administration Guide
Page 22

Figure 5: Using the right-click menus on log reports
Right-click pop-up menus
Table 5: Log report right-click menu options
Select All Select to select all log messages in the current page, so that you can
export all messages to a table.
Clear Selection Select to deselect one or multiple log messages.
Export to Table Select to export the selected log messages to a table format. A new tab
named Exported Table appears, displaying the exported information.
The table format allows you to copy the information and paste it
elsewhere.
Searching log messages
You can search logs to quickly find specific log messages in a log file, rather than browsing the
entire contents of the log file.
To search log messages
1. Go to Status > Logs > Event/Voice.
2. To search all log files, click Search.
3. To search one of the log files, first double-click the name of a log file to display the contents
of the log file, then click Search.
Fortinet Technologies Inc. Page 22 FortiVoice Gateway 5.3.6 Administration Guide
Page 23

Figure 6: Log search dialog
4. Enter your search criteria by configuring one or more of the following:
GUI field Description
Keyword Enter any word or words to search for within the log messages.
For example, you might enter GUI session to locate all log messages
containing that exact phrase in any log field.
Message Enter all or part of the Message log field.
Log ID Enter all or part of the log ID in the log message.
Time Select the time span of log messages to include in the search
results.
For example, you might want to search only log messages that were
recorded during the two weeks and 8 hours previous to the current
date. In that case, you would specify the current date, and also
specify the size of the span of time (two weeks and 8 hours) before
that date.
Match condition • Contain: searches for the exact match.
• Wildcard: supports wildcards in the entered search criteria.
5. Click Apply.
The FortiVoice Gateway unit searches your currently selected log file for log messages that
match your search criteria, and displays any matching log messages.
Fortinet Technologies Inc. Page 23 FortiVoice Gateway 5.3.6 Administration Guide
Page 24

Configuring System Settings
The System menu lets you set up configurations of the FortiVoice Gateway operation system,
including administrator accounts, network settings, system time, SIP settings, system
maintenance, and more.
This topic includes:
• Configuring network settings
• Configuring administrator accounts
• Configuring system time, system options, and GUI appearance
• Configuring advanced system settings
• Maintaining the system
Configuring network settings
The Network submenu provides options to configure network connectivity and administrative
access to the web-based manager or CLI of the FortiVoice Gateway through each network
interface.
This topic includes:
• About FortiVoice Gateway logical interfaces
• Configuring the network interfaces
• Configuring static routes
• Configuring DNS
• Capturing voice and fax packets
About FortiVoice Gateway logical interfaces
In addition to the physical interfaces, you can create the following types of logical interfaces on
the FortiVoice Gateway:
• VLAN subinterfaces
• Redundant interfaces
• Loopback interfaces
VLAN subinterfaces
A Virtual LAN (VLAN) subinterface, also called a VLAN, is a virtual interface on a physical
interface. The subinterface allows forwarding of VLAN tagged packets using that physical
interface, but it is separate from any other traffic on the physical interface.
Virtual LANs (VLANs) use ID tags to logically separate devices on a network into smaller
broadcast domains. These smaller domains forward packets only to devices that are part of that
VLAN domain. This reduces traffic and increases network security.
One example of an application of VLANs is a company’s accounting department. Accounting
computers may be located at both main and branch offices. However, accounting computers
need to communicate with each other frequently and require increased security. VLANs allow
the accounting network traffic to be sent only to accounting computers and to connect
accounting computers in different locations as if they were on the same physical subnet.
Fortinet Technologies Inc. Page 24 FortiVoice Gateway 5.3.6 Administration Guide
Page 25

For information about adding VLAN subinterfaces, see “Configuring the network interfaces” on
page 25.
Redundant interfaces
On the FortiVoice Gateway, you can combine two or more physical interfaces to provide link
redundancy. This feature allows you to connect to two or more switches to ensure connectivity
in the event one physical interface or the equipment on that interface fails.
In a redundant interface, traffic is only going over one interface at any time. This differs from an
aggregated interface where traffic is going over all interfaces for increased bandwidth. This
difference means redundant interfaces can have more robust configurations with fewer possible
points of failure. This is important in a fully-meshed high availability (HA) configuration.
A physical interface is available to be in a redundant interface if:
• it is a physical interface, not a VLAN interface
• it is not already part of a redundant interface
• it has no defined IP address and is not configured for DHCP
• it does not have any VLAN subinterfaces
• it is not monitored by HA
When a physical interface is included in a redundant interface, it is not listed on the System >
Network > Network page. You cannot configure the interface anymore.
For information about adding redundant interfaces, see “Configuring the network interfaces” on
page 25.
Loopback interfaces
A loopback interface is a logical interface that is always up (no physical link dependency) and
the attached subnet is always present in the routing table.
The FortiVoice Gateway’s loopback IP address does not depend on one specific external port,
and is therefore possible to access it through several physical or VLAN interfaces. In the current
release, you can only add one loopback interface on the FortiVoice Gateway.
For information about adding a loopback interface, see “Configuring the network interfaces” on
page 25.
Configuring the network interfaces
The System > Network > Network tab displays the FortiVoice Gateway’s network interfaces.
You must configure at least one network interface for the FortiVoice Gateway to connect to your
network. Depending on your network topology and other considerations, you can connect the
FortiVoice Gateway to your network using two or more of the network interfaces. You can
configure each network interface separately. You can also configure advanced interface
options, including VLAN subinterfaces, redundant interfaces, and loopback interfaces. For more
information, see “About FortiVoice Gateway logical interfaces” on page 24, and “Editing
network interfaces” on page 26.
To view the list of network interfaces, go to System > Network > Network.
Fortinet Technologies Inc. Page 25 FortiVoice Gateway 5.3.6 Administration Guide
Page 26

Figure 7: Network tab
GUI field Description
Name Displays the name of the network interface, such as port1.
Type Displays the interface type: physical, VLAN, redundant, or loopback. For
details, see “About FortiVoice Gateway logical interfaces” on page 24.
IP/Netmask Displays the IP address and netmask of the network interface.
IPv6/Netmask Displays the IPv6 address and netmask of the network interface.
Access Displays the administrative access and phone user access that are
enabled on the network interface, such as HTTPS for the web-based
manager.
Status Indicates the up (available) or down (unavailable) administrative status
for the network interface.
• Green up arrow: The network interface is up and can receive traffic.
• Red down arrow: The network interface is down and cannot receive
traffic.
To change the administrative status (that is, bring up or down a network
interface), see “Editing network interfaces” on page 26.
Editing network interfaces
You can edit FortiVoice Gateway’s physical network interfaces to change their IP addresses,
netmasks, administrative access protocols, and other settings. You can also create or edit
logical interfaces, such as VLANs, redundant interfaces and the loopback interface.
Enable administrative access only on network interfaces connected to trusted private
networks or directly to your management computer. If possible, enable only secure
administrative access protocols such as HTTPS or SSH. Failure to restrict administrative
access could compromise the security of your FortiVoice Gateway.
You can restrict which IP addresses are permitted to log in as a FortiVoice Gateway
administrator through network interfaces. For details, see “Configuring administrator accounts”
on page 32.
To create or edit a network interface
1. Go to System > Network > Network.
2. Double-click a network interface to modify it or select the interface and click Edit. If you want
to create a logical interface, click New.
The Edit Interface dialog appears.
Fortinet Technologies Inc. Page 26 FortiVoice Gateway 5.3.6 Administration Guide
Page 27

3. Configure the following:
Figure 8: Edit Interface dialog
Figure 9: Creating logical interfaces
GUI field Description
Interface Name If you are editing an existing interface, this field displays the name
(such as port2) and media access control (MAC) address for this
network interface.
If you are creating a logical interface, enter a name for the interface.
Fortinet Technologies Inc. Page 27 FortiVoice Gateway 5.3.6 Administration Guide
Page 28

Type If you are creating a logical interface, select which type of interface
you want to create. For information about logical interface types, see
“About FortiVoice Gateway logical interfaces” on page 24.
• VLAN: If you want to create a VLAN subinterface, select the
interface for which you want to create the subinterface. Then
specify a VLAN ID. Valid VLAN ID numbers are from 1 to 4094,
while 0 is used for high priority frames, and 4095 is reserved.
• Redundant: If you want to create a redundant interface, select the
interface members from the available interfaces. Usually, you
need to include two or more interfaces as the redundant interface
members.
• Loopback: If you want to add a loopback interface, select the
Loopback type and the interface name will be automatically reset
to “loopback”. You can only add one loopback interface on the
FortiVoice Gateway.
Addressing Mode • Manual: Select to enter the IP address or IPv6 address and
netmask for the network interface in IP/Netmask or
IPv6/Netmask.
• DHCP: Select and click Update request to retrieve a dynamic IP
address using DHCP.
Access Enable protocols that this network interface should accept for
connections to the FortiVoice Gateway itself. (These options do not
affect connections that will travel through the FortiVoice Gateway.)
• HTTPS: Enable to allow secure HTTPS connections to the
web-based manager, and extension user account through this
network interface.
• HTTP: Enable to allow HTTP connections to the web-based
manager, and extension user account through this network
interface.
• PING: Enable to allow ICMP ECHO (ping) responses from this
network interface.
• SSH: Enable to allow SSH connections to the CLI through this
network interface.
• SNMP: Enable to allow SNMP connections (queries) to this
network interface.
For information on further restricting access, or on configuring the
network interface that will be the source of traps, see
“Configuring the network interfaces” on page 25.
• TELNET: Enable to allow Telnet connections to the CLI through
this network interface.
Caution: HTTP and Telnet connections are not secure, and can
be intercepted by a third party. If possible, enable this option only
for network interfaces connected to a trusted private network, or
directly to your management computer. Failure to restrict
administrative access through this protocol could compromise
the security of your FortiVoice Gateway. For information on
further restricting access of administrative connections, see
“Configuring administrator accounts” on page 32.
Fortinet Technologies Inc. Page 28 FortiVoice Gateway 5.3.6 Administration Guide
Page 29

MTU Override default MTU value (1500): Enable to change the maximum
transmission unit (MTU) value, then enter the maximum packet or
Ethernet frame size in bytes.
If network devices between the FortiVoice Gateway and its traffic
destinations require smaller or larger units of traffic, packets may
require additional processing at each node in the network to
fragment or defragment the units, resulting in reduced network
performance. Adjusting the MTU to match your network can improve
network performance.
The default value is 1500 bytes. The MTU size must be between 576
and 1500 bytes. Change this if you need a lower value; for example,
RFC 2516 prescribes a value of 1492 for the PPPoE protocol.
Administrative
status
Configuring static routes
The System > Network > Routing tab displays a list of routes and lets you configure static
routes and gateways used by the FortiVoice Gateway.
Static routes direct traffic exiting the FortiVoice Gateway. You can specify through which
network interface a packet will leave, and the IP address of a next-hop router that is reachable
from that network interface. The router is aware of which IP addresses are reachable through
various network pathways, and can forward those packets along pathways capable of reaching
the packets’ ultimate destinations.
A default route is a special type of static route. A default route matches all packets, and defines
a gateway router that can receive and route packets if no other, more specific static route is
defined for the packet’s destination IP address.
You should configure at least one static route, a default route, that points to your gateway.
However, you may configure multiple static routes if you have multiple gateway routers, each of
which should receive packets destined for a different subset of IP addresses.
Select either:
• Up: Enable (that is, bring up) the network interface so that it can
send and receive traffic.
• Down: Disable (that is, bring down) the network interface so that
it cannot send or receive traffic.
To determine which route a packet will be subject to, the FortiVoice Gateway compares the
packet’s destination IP address to those of the static routes and forwards the packet to the
route with the large prefix match.
When you add a static route through the web-based manager, the FortiVoice Gateway evaluates
the route to determine if it represents a different route compared to any other route already
present in the list of static routes. If no route having the same destination exists in the list of
static routes, the FortiVoice Gateway adds the static route.
To view or configure static routes
1. Go to System > Network > Routing.
GUI field Description
Destination
IP/Netmask
Fortinet Technologies Inc. Page 29 FortiVoice Gateway 5.3.6 Administration Guide
Displays the destination IP address and subnet of packets subject to
the static route. A setting of 0.0.0.0/0.0.0 indicates that the route
matches all destination IP addresses.
Page 30

Interface The interface that this route applies to.
Gateway Displays the IP address of the next-hop router to which packets
2. Either click New to add a route or double-click a route to modify it.
A dialog appears.
3. In Destination IP/netmask, enter the destination IP address and netmask of packets that will
be subject to this static route.
To create a default route that will match all packets, enter 0.0.0.0/0.0.0.0.
4. Select the interface that this route applies to.
5. In Gateway, type the IP address of the next-hop router to which the FortiVoice Gateway will
forward packets subject to this static route. This router must know how to route packets to
the destination IP addresses that you have specified in Destination IP/netmask. For an
Internet connection, the next hop routing gateway routes traffic to the Internet.
6. Click Create or OK.
Configuring DNS
FortiVoiceGateways require DNS servers for features such as reverse DNS lookups. Your ISP
may supply IP addresses of DNS servers, or you may want to use the IP addresses of your own
DNS servers.
subject to the static route will be forwarded.
For improved FortiVoice Gateway performance, use DNS servers on your local network.
The DNS tab lets you configure the DNS servers that the FortiVoice Gateway queries to resolve
domain names into IP addresses.
To configure the primary and secondary DNS servers
1. Go to System > Network > DNS.
2. In Primary DNS server, enter the IP address of the primary DNS server.
3. In Secondary DNS server, enter the IP address of the secondary DNS server.
4. Click Apply.
Capturing voice and fax packets
When troubleshooting networks, it helps to look inside the contents of the packets. This helps
to determine if the packets, route, and destination are all what you expect. Traffic capture can
also be called packet sniffing, a network tap, or logic analyzing.
Fortinet Technologies Inc. Page 30 FortiVoice Gateway 5.3.6 Administration Guide
Page 31

Packet sniffing tells you what is happening on the network at a low level. This can be very useful
for troubleshooting problems, such as:
• finding missing traffic
• seeing if sessions are setting up properly
• locating ARP problems such as broadcast storm sources and causes
• confirming which address a computer is using on the network if they have multiple
addresses or are on multiple networks
• confirming routing is working as you expect
• intermittent missing PING packets.
If you are running a constant traffic application such as ping, packet sniffing can tell you if the
traffic is reaching the destination, how the port enters and exits the FortiVoice Gateway, if the
ARP resolution is correct, and if the traffic is returning to the source as expected. You can also
use packet switching to verify that NAT or other configuration is translating addresses or routing
traffic the way that you want it to.
Before you start sniffing packets, you need to have a good idea of what you are looking for.
Sniffing is used to confirm or deny your ideas about what is happening on the network. If you try
sniffing without a plan to narrow your search, you could end up with too much data to effectively
analyze. On the other hand, you need to sniff enough packets to really understand all of the
patterns and behavior that you are looking for.
To capture voice and fax packets
1. Go to System > Network > Traffic Capture.
Figure 10: Traffic capture list
GUI field Description
Stop Click to stop the packet capture.
Download When the capture is complete, click Download to save the packet
capture file to your hard disk for further analysis.
Name The name of the packet capture file.
Status The status of the packet capture process, Complete or Running.
Size The size of the packet capture file.
2. Click New.
3. Enter a prefix for the file generated from the captured traffic. This will make it easier to
recognize the files.
4. Enter the time period for performing the packet capture.
5. If you choose SIP or Use protocol for Filter, from the Available peers field, select the
extension or trunk of which you want to capture the voice packets and click -> to move them
into the Selected peers field. You can select up to 3 peers.
Fortinet Technologies Inc. Page 31 FortiVoice Gateway 5.3.6 Administration Guide
Page 32

6. If you want to limit the scope of traffic capture, in the IP/HOST field, enter a maximum of 3 IP
addresses or host names for the extensions and trunks you selected. Only traffic on these IP
addresses or host names is captured.
7. Select the filter for the traffic capture:
• SIP: Only SIP traffic of the peers you select will be captured.
• Use protocol: Only UDP or TCP traffic of the peers you select will be captured.
• Capture all: All network traffic will be captured.
8. For Exclusion, enter the IP addresses/host names and port numbers of which you do not
want to capture voice traffic.
9. Click Create.
Configuring administrator accounts
The Admin submenu configures administrator accounts.
Configuring administrator accounts
The Administrators tab displays a list of the FortiVoice Gateway’s administrator accounts and
the trusted host IP addresses administrators use to log in (if configured).
By default, FortiVoice Gateway has a single administrator account, admin. For more granular
control over administrative access, you can create additional administrator accounts with
restricted permissions.
To view and configure administrator accounts
1. Go to System > Admin > Administrators.
GUI field Description
Name Displays the name of the administrator account.
Trusted Hosts Displays the IP address and netmask from which the administrator
can log in.
2. Either click New to add an account or double-click an account to modify it.
A dialog appears.
3. Configure the following:
GUI field Description
Administrator Enter the name for this administrator account.
The name can contain numbers (0-9), uppercase and lowercase
letters (A-Z, a-z), hyphens ( - ), and underscores ( _ ). Other special
characters and spaces are not allowed.
Fortinet Technologies Inc. Page 32 FortiVoice Gateway 5.3.6 Administration Guide
Page 33

Create password Click to configure account login information.
• Password: Enter this account’s password.
The password can contain any character except spaces.
Caution: Do not enter a FortiVoice Gateway administrator
password less than six characters long. For better security, enter
a longer password with a complex combination of characters and
numbers, and change the password regularly. Failure to provide a
strong password could compromise the security of your
FortiVoice Gateway.
• Confirm password: Enter this account’s password again to
confirm it.
Trusted Hosts Enter an IPv4 or IPv6 address or subnet from which this
administrator can log in.
If you want the administrator to access the FortiVoice Gateway from
any IP address, use 0.0.0.0/0.0.0.0.
Enter the IP address and netmask in dotted decimal format. For
example, you might permit the administrator to log in to the
FortiVoice Gateway from your private network by typing
192.168.1.0/255.255.255.0.
Note: For additional security, restrict all trusted host entries to
administrative hosts on your trusted private network. For example, if
your FortiVoice Gateway administrators log in only from the
10.10.10.10/24 subnet, to prevent possibly fraudulent login attempts
from unauthorized locations, you could configure that subnet in the
Trusted Host #1, Trusted Host #2, and Trusted Host #3 fields.
Note: For information on restricting administrative access protocols
that can be used by these hosts, see “Editing network interfaces” on
page 26.
Click the + sign to add additional IP addresses or subnets from
which the administrator can log in.
Select language Select this administrator account’s preference for the display
language of the web-based manager.
Select theme Select this administrator account’s preference for the display theme
or click Use Current to choose the theme currently in effect.
The administrator may switch the theme at any time during a session
by clicking Next Theme.
Description Enter any notes for this account.
4. Click Create.
Configuring system time, system options, and GUI appearance
The System > Configuration submenu lets you configure the system time, system options, and
GUI appearance.
Fortinet Technologies Inc. Page 33 FortiVoice Gateway 5.3.6 Administration Guide
Page 34

This topic includes:
• Configuring the time and date
• Configuring system options
• Customizing the GUI appearance
Configuring the time and date
The System > Configuration > Time tab lets you configure the system time and date of the
FortiVoice Gateway.
You can either manually set the FortiVoice Gateway system time or configure the FortiVoice
Gateway to automatically keep its system time correct by synchronizing with Network Time
Protocol (NTP) servers.
For many features to work, including scheduling, logging, and certificate-dependent features,
the FortiVoice Gateway system time must be accurate.
FortiVoice Gateway supports daylight savings time (DST), including recent changes in the
USA, Canada and Western Australia.
To configure the system time
1. Go to System > Configuration > Time.
2. Configure the following:
GUI field Description
System time Displays the date and time according to the FortiVoice Gateway’s
clock at the time that this tab was loaded, or when you last selected
the Refresh button.
Time zone Select the time zone in which the FortiVoice Gateway is located.
• Automatically adjust clock for daylight saving time changes:
Enable to adjust the FortiVoice Gateway system clock
automatically when your time zone changes to daylight savings
time (DST) and back to standard time.
When selecting time zone in CLI, use the command config
system time manual and enter the code before the time zone in
Table 6 on page 35.
Fortinet Technologies Inc. Page 34 FortiVoice Gateway 5.3.6 Administration Guide
Page 35

Synchronize with
NTP Server
Select to use a network time protocol (NTP) server to automatically
set the system date and time, then configure Server and Sync
Interval.
• Server: Enter the IP address or domain name of an NTP server.
You can add a maximum of 10 NTP servers. The FortiVoice
Gateway uses the first NTP server based on the selection
mechanism of the NTP protocol.
Click the + sign to add more servers.
Click the - sign to remove servers. Note that you cannot remove
the last server.
To find the NTP servers that you can use, see http://www.ntp.org.
Depending on your network traffic, it may take some time for the
FortiVoice Gateway to synchronize its time with the NTP server.
Set date Select this option to manually set the date and time of the FortiVoice
Gateway’s clock, then select the Year, Month, Day, Hour, Minute, and
Second fields before you click Apply.
Alternatively, configure Synchronize with NTP server.
3. Click Apply.
Table 6: Time zone codes for CLI configuration
Code Time Zone
0 (GMT-12:00) Eniwetok, Kwajalein
1 (GMT-11:00) Midway Island, Samoa
2 (GMT-10:00) Hawaii
3 (GMT-9:00) Alaska
4 (GMT-8:00) Pacific Time (US& Canada)
5 (GMT-7:00) Arizona
6 (GMT-7:00) Mountain Time (US& Canada)
7 (GMT-6:00) Central America
8 (GMT-6:00) Central Time
9 (GMT-6:00) Mexico City
10 (GMT-6:00) Saskatchewan
11 (GMT-5:00) Bogota, Lima, Quito
12 (GMT-5:00) Eastern Time (US & Canada)
13 (GMT-5:00) Indiana (East)
14 (GMT-4:30) Venezuela Standard Time
Fortinet Technologies Inc. Page 35 FortiVoice Gateway 5.3.6 Administration Guide
Page 36

Table 6: Time zone codes for CLI configuration
Code Time Zone
15 (GMT-4:00) Atlantic Time (Canada)
16 (GMT-4:00) Caracas, La Paz
17 (GMT-4:00) Santiago
18 (GMT-3:30) Newfoundland
19 (GMT-3:00) Brasilia
20 (GMT-3:00) Buenos Aires, Georgetown
21 (GMT-3:00) Greenland
22 (GMT-2:00) Mid-Atlantic
23 (GMT-1:00) Azores
24 (GMT-1:00) Cape Verde Is.
25 (GMT) Casablanca, Monrouia
26 (GMT) Greenwich Mean Time: Dublin, Edinburgh, Lisbon, London
27 (GMT+1:00) Amsterdam, Berlia, Bern, Rome, Stockholm, Vienna
28 (GMT+1:00) Belgrade, Bratislava, Budapest, Ljubljana, Prague
29 (GMT+1:00) Brussels, Copenhagen, Madrid, Paris
30 (GMT+1:00) Sarajevo, Skopje, Sofija, Vilnius, Warsaw, Zagreb
31 (GMT+1:00) West Central Africa
32 (GMT+2:00) Athens, Istanbul, Minsk
33 (GMT+2:00) Bucharest
34 (GMT+2:00) Cairo
35 (GMT+2:00) Harare, Pretoria
36 (GMT+2:00) Helsinki, Riga, Tallinn
37 (GMT+2:00) Jerusalem
38 (GMT+3:00) Baghdad
39 (GMT+3:00) Kuwait, Riyadh
40 (GMT+3:00) Moscow, St.Petersburg, Volgograd
41 (GMT+3:00) Nairobi
42 (GMT+3:30) Tehran
43 (GMT+4:00) Abu Dhabi, Muscat
Fortinet Technologies Inc. Page 36 FortiVoice Gateway 5.3.6 Administration Guide
Page 37

Table 6: Time zone codes for CLI configuration
Code Time Zone
44 (GMT+4:00) Baku, Tbilisi, Yerevan
45 (GMT+4:30) Kabul
46 (GMT+5:00) Ekaterinburg
47 (GMT+5:00) Islamabad, Karachi, Tashkent
48 (GMT+5:30) Calcutta, Chennai, Mumbai, New Delhi
49 (GMT+5:45) Kathmandu
50 (GMT+6:00) Almaty, Novosibirsk
51 (GMT+6:00) Astana, Dhaka
52 (GMT+6:00) Sri Jayawardenepara
53 (GMT+6:30) Rangoon
54 (GMT+7:00)B angkok, Hanoi, Jakarta
55 (GMT+7:00) Krasnoyarsk
56 (GMT+8:00) Beijing, Chong Qing, Hong Kong, Urumgi
57 (GMT+8:00) Irkutsk, Ulaan Bataar
58 (GMT+8:00) Kuala Lumpur, Singapore
59 (GMT+8:00) Perth
60 (GMT+8:00) Taipei
61 (GMT+9:00) Osaka, Sapporo, Tokyo, Seoul
62 (GMT+9:00) Yakutsk
63 (GMT+9:30) Adelaide, Darwin
64 (GMT+10:00) Brisbane
65 (GMT+10:00) Canberra, Melbourne, Sydney
66 (GMT+10:00) Guam, Port Moresby, Hobart, Vladivostok
67 (GMT+11:00) Magadan, Solomon Is., New Caledonia
68 (GMT+12:00) Auckland, Wellington
69 (GMT+12:00) Fiji, Kamchatka, Marshall Is.
70 (GMT+13:00) Nuku'alofa
71 (GMT-3:00) Montevideo
72 (GMT+3:00) Minsk
Fortinet Technologies Inc. Page 37 FortiVoice Gateway 5.3.6 Administration Guide
Page 38

Configuring system options
The System > Configuration > Options tab lets you set the following global settings:
• system idle timeout
• password enforcement policy
• administration ports on the interfaces
To view and configure the system options
1. Go to System > Configuration > Options.
2. Configure the following:
GUI field Description
Idle timeout Enter the amount of time that an administrator may be inactive
before the FortiVoice Gateway automatically logs out the
administrator.
For better security, use a low idle timeout value.
Administration
Ports
3. Click Apply.
Specify the TCP ports for administrative access on all interfaces.
Default port numbers:
HTTP: 80
HTTPS: 443
SSH: 22
TELNET: 23
Customizing the GUI appearance
The System > Configuration > Appearance tab lets you customize the default appearance of the
web-based manager and voicemail interface with your own product name, product logo,
corporate logo, and language.
To customize the GUI appearance
1. Go to System > Configuration > Appearance.
2. Click the arrow to expand Administration interface.
3. Configure the following to change appearance:
GUI field Description
Administration interface
Product name Enter the name of the product. This name will precede
Administrator Login in the title on the login page of the
web-based manager.
Product icon Click Change to browse for the product icon. The icon should
be in .ico format, and 16 pixels wide x16 pixels tall in size.
Fortinet Technologies Inc. Page 38 FortiVoice Gateway 5.3.6 Administration Guide
Page 39

Top logo Click Change to upload a graphic that will appear at the top of
all pages in the web-based manager. The image’s dimensions
must be 460 pixels wide by 36 pixels tall.
For best results, use an image with a transparent background.
Non-transparent backgrounds will not blend with the underlying
theme graphic, resulting in a visible rectangle around your logo
graphic.
Note: Uploading a graphic overwrites the current graphic. The
FortiVoice Gateway does not retain previous or default
graphics. If you want to revert to the current graphic, use your
web browser to save a backup copy of the image to your
management computer, enabling you to upload it again at a
later time.
Click Reset to return to the default setting.
Default UI language Select the default language for the display of the web-based
manager.
You can configure a separate language preference for each
administrator account. For details, see “Configuring
administrator accounts” on page 32.
4. Click Apply to save changes or Reset to return to the default settings.
Configuring advanced system settings
The System > Advanced Settings submenu lets you configure the FortiVoice Gateway location
and SIP setting.
This topic includes:
• Setting FortiVoice Gateway location and contact information
• Configuring SIP settings
Setting FortiVoice Gateway location and contact information
Identify the FortiVoice Gateway’s location and its number.
To set the location
1. Go to System > Advanced Setting > Location.
2. Configure the following:
GUI field Description
Country/Region Select the country where the FortiVoice Gateway is in.
Emergency number Click the default number (911) to enter the emergency call number of
the selected country.
Long-distance
prefix
International prefix Click the default number (011) to enter the prefix for dialing
Fortinet Technologies Inc. Page 39 FortiVoice Gateway 5.3.6 Administration Guide
Click the default number (1) to enter the prefix for dialing
long-distance calls.
international calls.
Page 40

Outside line prefix Click the default number (9) to enter the prefix for making outbound
calls.
Area code Click the default number (613) to enter the Area code for the main
number of the FortiVoice Gateway. This code is provided by your
PSTN service provider.
Area code is
required when
dialing local
numbers
Main display name Enter the name displaying on the FortiVoice Gateway. This name is
Main number Enter the main number of the FortiVoice Gateway. This number is
Default prompt
language
3. Click Apply.
Configuring SIP settings
FortiVoice Gateway supports SIP communications.
Select this option if the area code needs to be dialed for local phone
calls.
provided by your PSTN service provider.
provided by your PSTN service provider.
Select a new default prompt language for the FortiVoice Gateway.
The default is English.
To add a prompt language, click New.
In the Upload field, click Browse to upload the language file provided
by Fortinet Technical Support.
Click OK.
To configure SIP settings
1. Go System > Advanced Setting > SIP.
2. Configure the following:
GUI field Description
Transport Setting SIP communication commonly uses TCP or UDP port 5060
and/or 5061. Port 5060 is used for nonencrypted SIP signaling
sessions and port 5061 is typically used for SIP sessions
encrypted with Transport Layer Security (TLS).
Enable the ports as required.
RTP Setting
RTP port start Enter the starting Real-time Transport Protocol (RTP) port that
the FortiVoice Gateway will use for phone call sessions. If the
unit is behind a firewall, these ports should be open. Ensure
there is a reasonable port range so that you have enough ports
for all open calls. The default port is 5000.
Fortinet Technologies Inc. Page 40 FortiVoice Gateway 5.3.6 Administration Guide
Page 41

RTP port end Enter the end RTP port that the FortiVoice Gateway will use for
RTP timeout Enter the amount of time in seconds during an active call that
RTP hold timeout Enter the amount of time in seconds that the extension will
3. Click Apply.
Maintaining the system
The System > Maintenance submenu allows you to perform scheduled maintenance.
This topic includes:
• Maintaining the system configuration
• Downloading a trace file
phone call sessions. Ensure there is a reasonable port range
so that you have enough ports for all open calls. The default
port is 30000.
the extension will wait for RTP packets before hanging up the
call. 0 means no time limit. The default is 60.
wait on hold for RTP packets before hanging up the call. 0
means no time limit. The default is 300.
Maintaining the system configuration
The System > Maintenance > Configuration tab contains features for use during scheduled
system maintenance: updates, backups, restoration, and centralized administration.
Backing up configuration
Before installing FortiVoice Gateway firmware or making significant configuration changes, back
up your FortiVoice Gateway configuration. Backups let you revert to your previous configuration
if the new configuration does not function correctly. Backups let you compare changes in
configuration.
You can back up system configuration or user configuration. System configuration includes the
configurations that make the FortiVoice Gateway work. User configuration includes
user-configured settings, such as voicemail greetings, in addition to system configuration.
In addition to backing up your configuration manually, you can also configure a schedule to
back up the configuration automatically to the FortiVoice Gateway local hard drive or a remote
FTP/SFTP server.
To back up the configuration file
1. Go to System > Maintenance > Configuration.
2. In the Backup Configuration area, select System configuration or User data.
If you choose to back up user data and the user data files are not updated, select the files to
be updated and click Prepare first before proceeding to the next step.
3. Click Backup.
Your management computer downloads the configuration file. Time required varies by the
size of the file and the speed of your network connection. You can restore the backup
configuration later when required. For details, see “Restoring the configuration” on page 42.
Fortinet Technologies Inc. Page 41 FortiVoice Gateway 5.3.6 Administration Guide
Page 42

To schedule a configuration backup
1. Go to System > Maintenance > Configuration.
2. Under Scheduled Backup, configure the schedule time and the maximum backup number.
When the maximum number is reached, the oldest version will be overwritten.
3. Enable Local backup if you want to back up locally.
4. Enable Remote backup and configure the FTP/SFTP server credentials if you want to back
up remotely.
5. Click Apply.
Restoring the configuration
In the Restore Configuration area under System > Maintenance > Configuration, you can restore
the backup FortiVoice Gateway configuration from your local PC. For details, see “Restoring the
configuration” on page 59.
Restoring the firmware
In the Restore Firmware area under System > Maintenance > Configuration, you can install a
FortiVoice Gateway firmware from your local PC. For details, see “Installing firmware” on
page 56.
Downloading a trace file
If Fortinet Technical Support requests a trace log for system analysis purposes, you can
download one using the web-based manager.
Trace logs are compressed into an archive (.gz), and contain information that is supplementary
to debug-level log files.
To download a trace file
1. Go to System > Maintenance > Configuration.
2. At the bottom of the tab, click Download trace log.
Your web browser downloads trace.log.gz.
Fortinet Technologies Inc. Page 42 FortiVoice Gateway 5.3.6 Administration Guide
Page 43

Configuring FortiVoice Gateway
Configure the FortiVoice Gateway to connect your PSTN circuits to the outside world.
This topic includes:
• Creating SIP peer for IP-PBX
• Configuring SIP profiles
• Modifying analog trunks
• Mapping a SIP peer with the FortiVoice Gateway
Creating SIP peer for IP-PBX
You can add one or more VoIP service providers to the FortiVoice Gateway trunk configuration.
The VoIP service providers deliver your telephone services to customers equipped with
SIP-based PBX (IP-PBX).
To view the list of VoIP service providers, go to Gateway > SIP > SIP.
GUI field Description
Test Select to test if the trunk is created successfully.
For more information, see “Testing SIP trunks” on page 47.
Enabled Select to activate this trunk.
Name The name of the VoIP service provider.
Server The VoIP provider’s domain name or IP address. For example,
172.20.120.11 or voip.example.com.
Port The port for SIP sessions.
SIP Setting The SIP profile applied to this trunk.
Status The status of the SIP trunk.
• Not registered: The trunk is not registered with the VoIP service
provider and is not in service.
• In service: The trunk is registered with the VoIP service provider and
is in service.
• Unavailable: The trunk is not reachable.
• Alarm detected: There is a problem with the phone line.
• Admin down: The trunk is disabled.
• Unmonitored: The trunk is unknown.
To create a VoIP trunk
1. Go to Gateway > SIP > SIP.
2. Click New.
Fortinet Technologies Inc. Page 43 FortiVoice Gateway 5.3.6 Administration Guide
Page 44

3. Configure the following:
GUI field Description
SIP
Name Enter the name of the VoIP service provider.
Enabled Select to activate the SIP trunk.
Display name Enter your caller ID that will appear on the called phone, such as
Example Company.
Main number Enter the phone number that will appear on the called phone.
SIP Setting
SIP server Enter the VoIP provider’s IP address or domain name. For
example, 172.20.120.11 or voip.example.com.
SIP port Most SIP configurations use TCP or UDP port 5060 for SIP
sessions. If your VoIP service provider uses a different port for
SIP sessions, enter the port number.
If you select the Using DNS record option, this field is greyed
out.
Using SRV record If you entered the VoIP provider’s domain name in the SIP server
field, select this option to translate the domain name and obtain
the SIP port.
You can only select this option if your VoIP provider uses the
same setting.
User name Enter the user name provided by the VoIP service provider for
the FortiVoice Gateway to register with the SIP server.
Password Enter the password provided by the VoIP service provider for the
FortiVoice Gateway to register with the SIP server.
Auth. user name Some VoIP providers may provide you with an authentication
user name that is different from your user name for the
FortiVoice Gateway to register with the SIP server. If tat is the
case, enter the authentication user name here.
Realm/domain Some VoIP service providers’ SIP servers authenticate the
PBXes that register with them by requesting the name of the
host performing the authentication. If this is the case with your
VoIP service provider, enter the name of the host performing the
authentication provided by your VoIP service provider.
SIP setting Select the SIP profile to apply the supported phone features and
codecs for the trunk. To match the information of the VoIP
service provider, you can edit the existing profile or click New to
add a new one. For more information, see “Configuring SIP
profiles” on page 47.
Fortinet Technologies Inc. Page 44 FortiVoice Gateway 5.3.6 Administration Guide
Page 45

Max channel Each trunk contains multiple channels. The number of channels
you can have in a trunk is controlled by your VoIP service
provider.
Consult your VoIP service provider for the maximum of channels
that you can set to limit the number of concurrent calls. For
example, if you want to allow six calls at a time, enter 6.
Max outgoing
channel
With known max channels, if you need to reserve incoming
channels, you may enter the number of outgoing channels
allowed and the remaining channels are for incoming calls.
For example, the max channel number is 10 and you want to
reserve 4 channels for incoming calls, you can enter 6 for Max
outgoing channel.
Fortinet Technologies Inc. Page 45 FortiVoice Gateway 5.3.6 Administration Guide
Page 46

Registration Enter the SIP registration information from the VoIP service
provider by selecting a registration method. You can receive
calls after registering with the SIP server of the VoIP service
provider.
• Enable registration: Select to activate the registration with
the VoIP service provider. This trunk is ready to use.
• Standard: Select to use the standard registration method
which automatically registers with the SIP server of the VoIP
service provider.
• Registrar: Select to enter the registration information from the
VoIP service provider:
• Registrar host/IP: Enter the VoIP service provider’s SIP
registration server domain name or IP address. For
example, 172.20.120.11 or voip.example.com.
• Registrar port: Most SIP configurations use TCP or UDP
port 5060 for SIP sessions. If your VoIP service provider
uses a different port for SIP sessions, enter the port
number.
• Transport protocol: Select the transport protocol used for
the registration.
• Registration URI: Enter the registration string provided by the
VoIP service provider in the Registration URI field.
The string usually has the following formats:
register => user[:secret[:authuser]]@host
[:port][/extension]
or
register => fromuser@fromdomain:secret@host
or
register => fromuser@fromdomain:secret:
authuser@host:port/extension
For example, a string could be: register =>
2345:password@mysipprovider.com/1234
• Registration interval: Enter the time interval in minutes to
register with the SIP server of the VoIP service provider.
Outbound Proxy Some VoIP service providers use proxy servers to direct its
traffic. If this is the case, your registration request will go to the
proxy server first before reaching the registration server.
Configure the following:
• Enable proxy: Select to activate the proxy server settings.
• Proxy host/IP: Enter the proxy server’s domain name or IP
address. For example, 172.20.120.11 or
voip.example.com.
• Proxy port: Enter the port number of the proxy server.
• Transport protocol: Select the transport protocol used for the
registration.
4. Click Create.
Fortinet Technologies Inc. Page 46 FortiVoice Gateway 5.3.6 Administration Guide
Page 47

Testing SIP trunks
After you create a SIP trunk, you can select the trunk and click Test to see if the trunk works.
For more information, see “Test” on page 43.
To test a SIP trunk
1. Go to Gateway > SIP > SIP.
2. Select the trunk that you want to test and click Test.
The System Configuration Test page appears.
3. Configure the following:
GUI field Description
Test Call - Dry Run Run a system SIP trunk test without making a real phone call.
Destination number Enter a destination number to call.
From number Enter the number from which you want to call the destination
Test Click to start the dry run test and check the Test result.
Reset Click to remove the test result in order to start a new test.
number. The FortiVoice Gateway will connect this number
with the destination number for the test.
Test Call Test the SIP trunk by making a real phone call.
Destination number Enter a destination number to call.
After call is
established
Test Click to start the test and check the Test result.
Reset Click to remove the test result in order to start a new test.
Configuring SIP profiles
Configure the SIP related settings and codecs and apply them to SIP trunks.
Communicate with your VoIP service provider because the profile settings are subject to the
capabilities of the VoIP service provider. For example, if some of your features and codecs are
not supported by your VoIP service provider, they will not work even if they are enabled or
selected in the SIP profile.
Select the FortiVoice Gateway action once it calls the
destination number:
• Play welcome message: The FortiVoice Gateway will play a
message to the destination number.
• Connect test call to number: In the Number field, enter the
number from which you want to call the destination
number. The FortiVoice Gateway will connect this number
with the destination number to test the trunk.
The default SIP profiles can be edited but not be deleted.
Fortinet Technologies Inc. Page 47 FortiVoice Gateway 5.3.6 Administration Guide
Page 48

To configure a SIP profile
1. Go to Gateway > SIP > Profile and click New.
2. Configure the following:
GUI field Description
SIP • Name: Enter a name for this profile.
• DTMF: Select the dual-tone multi-frequency (DTMF) method used
by the VoIP provider. Options are RFC2833, Inband, Info,
Shortinfo, and Auto.
Auto means the VoIP provider’s server and the FortiVoice
Gateway will negotiate to select a DTMF method. You could also
select a specific DTMF method if required.
• NAT: Select if the VoIP service provider supports SIP NAT
translation.
• Video: Select if the service provider supports video calling over
SIP.
• T.38: Select if the VoIP service provider supports fax over VoIP
network.
• Monitor/Keep alive (SIP notify) interval: Enter the time interval in
seconds for the FortiVoice Gateway to talk to the SIP server of
your service provider to keep the connectivity and check its
capability.
0 means no checking by the FortiVoice Gateway.
Transport Transport: SIP commonly uses TCP or UDP port 5060 and/or 5061.
Codec Select the codecs supported by the VoIP service provider. Among
3. Click Create.
Modifying analog trunks
The analog FXO (Foreign eXchange Office) ports connect your FortiVoice Gateway to your
PSTN service providers and through them to the outside world.
Port 5060 is used for non-encrypted SIP signaling sessions and port
5061 is typically used for SIP sessions encrypted with Transport
Layer Security (TLS).
Enable the protocols as required.
Secure RTP: Select to provide encryption, message authentication
and integrity, and replay protection to the FortiVoice Gateway
Real-time Transport Protocol data.
the selected ones, choose the preferred one for the VoIP provider.
The preferred codec is usually the most used one in your area and
provides the best quality of communication.
If your preferred codec is different from that of your VoIP service
provider, the service provider’s codec will be used as long as it is one
of your supported codecs.
Fortinet Technologies Inc. Page 48 FortiVoice Gateway 5.3.6 Administration Guide
Page 49

To view the analog trunks, go to Gateway > Analog.
GUI field Description
Enabled Select to activate the trunk.
Name The name of the trunk.
Status The trunk statuses, including:
• In service: The trunk is currently in use.
• Not activated: The trunk is not enabled.
• Idle: The trunk is not in use.
• Unavailable: The trunk is not reachable.
• Conflict: The trunk conflicts with another one.
• Alarm detected: There is a problem with the trunk.
• Admin down: The trunk is disabled.
Type The trunk type: analog.
To add an analog trunk
1. Go to Gateway > Analog.
2. Click New.
3. Configure the following:
GUI field Description
Trunk Setting
Name The name of this trunk. This is view only.
Display name Enter your caller ID that will appear on the called phone, such as
Example Company.
Number Enter the phone number that will appear on the called phone.
Enabled Select to activate the trunk.
Hardware Property
analog1 Use this option to configure the analog trunk.
Click Edit to configure the PSTN analog settings to match the
same settings of your PSTN service provider. Click OK after
finishing the configuration.
Port Select the FXO ports you want for this trunk and click -> to move
them into the Selected ports field. Each FXO port selected
provides a connection for this particular analog trunk profile.
For example: if 4 FXO ports have been selected, this particular
profile could allow up to 4 PSTN connections.
Max channel Displays the number of FXO ports that have been selected, and
are available to receive incoming and outgoing calls.
Fortinet Technologies Inc. Page 49 FortiVoice Gateway 5.3.6 Administration Guide
Page 50

Max outgoing
channel
Phone Number Click New to add the phone number provided by your PSTN
4. Click Create.
Defines how many of the FXO ports available can be used for
outbound calls at one time.
service provider. Your PSTN service provider will direct calls from
external callers directly to this number. You can add multiple
numbers.
Mapping a SIP peer with the FortiVoice Gateway
Mapping Rule allows for calls to be made from a SIP peer to the FortiVoice Gateway and then
out on an analog trunk. Likewise, calls can come in on an analog trunk and be answered
through the SIP peer. When creating a mapping rule, you are linking the analog trunks to the SIP
peer.
To view the mapping rules, go to Gateway > Mapping Rule.
GUI field Description
ID The ID number of the mapping rule. These are sequential and cannot be
modified.
PSTN trunk The name of the analog trunk being mapped to a SIP peer.
SIP peer The name of the SIP trunk being mapped to the PSTN trunk.
Status Displays whether the mapping rule is enabled. A check mark means
enabled, an X means disabled.
To add a mapping rule
1. Go to Gateway > Mapping Rule.
2. Click New.
3. Configure the following:
GUI field Description
Enabled Select to activate the rule.
PSTN trunk Select the analog trunk profile that you want to map to the SIP peer.
SIP peer Select the SIP trunk profile that you want to map to the PSTN trunk.
Comments Enter any comments you have for this mapping rule.
4. Click Create.
Fortinet Technologies Inc. Page 50 FortiVoice Gateway 5.3.6 Administration Guide
Page 51

Configuring Logs
The Log menu lets you configure FortiVoice Gateway logging.
FortiVoice Gateway provides extensive logging capabilities for voice incidents and system
events. Detailed log information provides analysis of network activity to help you identify
network issues and reduce network misuse and abuse.
Logs are useful when diagnosing problems or when you want to track actions the FortiVoice
Gateway performs as it receives and processes phone calls.
This topic includes:
• About FortiVoice Gateway logging
• Configuring logging
About FortiVoice Gateway logging
FortiVoice Gateway can log:
• system-related events, such as configuration changes and administrator login/logout
• phone call events
You can select which severity level an activity or event must meet in order to be recorded in the
logs. For more information, see “Log message severity levels” on page 52.
A FortiVoice Gateway can save log messages to its hard disk.
This topic includes:
• FortiVoice Gateway log types
• Log message severity levels
FortiVoice Gateway log types
FortiVoice Gateway can record the following types of log messages. You can view and
download these logs from the Logs submenu of the Status tab.
Table 7: Log types
Log type Description
Event Includes system and administration events, such as downloading a backup copy
of the configuration.
Voice Includes phone calls events.
DTMF Includes DTMF (Dual Tone Multi-Frequency) events.
Avoid recording highly frequent log types such as voice logs to the local hard disk for an
extended period of time. Excessive logging frequency can cause undue wear on the hard disk
and may cause premature failure.
Fortinet Technologies Inc. Page 51 FortiVoice Gateway 5.3.6 Administration Guide
Page 52

Log message severity levels
Each log message contains a field that indicates the severity level of the log message, such as
warning.
Table 8: Log severity levels
Levels Description
0 - Emergency Indicates the system has become unusable.
1 - Alert Indicates immediate action is required.
2 - Critical Indicates functionality is affected.
3 - Error Indicates an error condition exists and functionality could be
affected.
4 - Warning Indicates functionality could be affected.
5 - Notification Provides information about normal events.
6 - Information Provides general information about system operations.
6 - Debug Provides information useful to debug a problem.
For each location where the FortiVoice Gateway can store log files, you can define the severity
threshold of the log messages to be stored there.
Avoid recording log messages using low severity thresholds such as Information or
Notification to the local hard disk for an extended period of time. A low log severity threshold
is one possible cause of frequent logging. Excessive logging frequency can cause undue wear
on the hard disk and may cause premature failure.
The FortiVoice Gateway stores all log messages equal to or exceeding the severity level you
select. For example, if you select Error, the FortiVoice Gateway stores log messages whose
severity level is Error, Critical, Alert, or Emergency.
Configuring logging
The Log Settings submenu lets you:
• set the severity level
• configure which types of log messages to record
This section includes the following topics:
• Configuring logging to the hard disk
• Choosing which events to log
Configuring logging to the hard disk
You can store log messages locally on the hard disk of the FortiVoice Gateway.
To ensure that the local hard disk has sufficient disk space to store new log messages and that
it does not overwrite existing logs, you should regularly download backup copies of the oldest
log files to your management computer or other storage, and then delete them from the
FortiVoice Gateway.
You can view and download these logs from the Log submenu of the Monitor tab. For more
information, see “Viewing log messages” on page 19.
Fortinet Technologies Inc. Page 52 FortiVoice Gateway 5.3.6 Administration Guide
Page 53

For logging accuracy, you should also verify that the FortiVoice Gateway’s system time is
accurate. For details, see “Configuring the time and date” on page 34.
To configure logging to the local hard disk
1. Go to Log > Log Settings > Local Log Settings.
2. Select the Enable option to allow logging to the local hard disk.
3. In Log file size, enter the file size limit of the current log file in megabytes (MB). The log file
size limit must be between 10 MB and 1000 MB.
4. In Log time, enter the time (in days) of file age limit.
5. In At hour, enter the hour of the day (24-hour format) when the file rotation should start.
When a log file reaches either the age or size limit, the FortiVoice Gateway rotates the current
log file: that is, it renames the current log file (elog.log) with a file name indicating its
sequential relationship to other log files of that type (elog2.log, and so on), then creates a
new current log file. For example, if you set the log time to 10 days at hour 23, the log file will
be rotated at 23 o’clock of the 10th day.
Large log files may decrease display and search performance.
6. From Log level, select the severity level that a log message must equal or exceed in order to
be recorded to this storage location.
7. From Log options when disk is full, select what the FortiVoice Gateway will do when the local
disk is full and a new log message is caused, either:
• Do not log: Discard all new log messages.
• Overwrite: Delete the oldest log file in order to free disk space, and store the new log
message.
8. In Logging Policy Configuration, click the arrow to review the options and enable the types of
logs that you want to record to this storage location. For details, see “Choosing which
events to log” on page 53.
9. Click Apply.
Choosing which events to log
Select the check boxes of the events you want to log.
Table 9: Events logging options
Event Log Select to include system and administration events, such as
downloading a backup copy of the configuration.
Voice Log Select to log phone call events.
DTMF Log Select to log DTMF (Dual Tone Multi-Frequency) events.
Fortinet Technologies Inc. Page 53 FortiVoice Gateway 5.3.6 Administration Guide
Page 54

Installing firmware
Fortinet periodically releases FortiVoice Gateway firmware updates to include enhancements
and address issues. After you have registered your FortiVoice Gateway, FortiVoice Gateway
firmware is available for download at http://support.fortinet.com.
New firmware can also introduce new features which you must configure for the first time.
For information specific to the firmware release version, see the Release Notes available
with that release.
In addition to major releases that contain new features, Fortinet releases patch releases that
resolve specific issues without containing new features and/or changes to existing features. It
is recommended to download and install patch releases as soon as they are available.
Before you can download firmware updates for your FortiVoice Gateway, you must first
register your FortiVoice Gateway with Fortinet Technical Support. For details, go to
http://support.fortinet.com/ or contact Fortinet Technical Support.
This section includes:
• Testing firmware before installing it
• Installing firmware
• Clean installing firmware
Testing firmware before installing it
You can test a new firmware image by temporarily running it from memory, without saving it to
disk. By keeping your existing firmware on disk, if the evaluation fails, you do not have to
re-install your previous firmware. Instead, you can quickly revert to your existing firmware by
simply rebooting the FortiVoice Gateway.
To test a new firmware image
1. Connect your management computer to the FortiVoice Gateway console port using an
RJ-45 to DB-9 serial cable or a null-modem cable.
2. Initiate a connection from your management computer to the CLI of the FortiVoice Gateway.
3. Connect port1 of the FortiVoice Gateway directly or to the same subnet as a TFTP server.
4. Copy the new firmware image file to the root directory of the TFTP server.
5. Verify that the TFTP server is currently running, and that the FortiVoice Gateway can reach
the TFTP server.
To use the FortiVoice Gateway CLI to verify connectivity, enter the following command:
execute ping 192.168.2.99
where 192.168.2.99 is the IP address of the TFTP server.
Enter the following command to restart the FortiVoice Gateway:
execute reboot
Fortinet Technologies Inc. Page 54 FortiVoice Gateway 5.3.6 Administration Guide
Page 55

6. As the FortiVoice Gateway starts, a series of system startup messages are displayed.
Press any key to display configuration menu........
Immediately press a key to interrupt the system startup.
You have only 3 seconds to press a key. If you do not press a key soon enough, the FortiVoice
Gateway reboots and you must log in and repeat the execute reboot command.
If you successfully interrupt the startup process, the following messages appears:
[G]: Get firmware image from TFTP server.
[F]: Format boot device.
[B]: Boot with backup firmware and set as default.
[I]: Configuration and information.
[Q]: Quit menu and continue to boot with default firmware.
[H]: Display this list of options.
Enter G,F,B,I,Q,or H:
7. Type G to get the firmware image from the TFTP server.
The following message appears:
Enter TFTP server address [192.168.2.99]:
8. Type the IP address of the TFTP server and press Enter.
The following message appears:
Enter Local Address [192.168.2.99]:
9. Type a temporary IP address that can be used by the FortiVoice Gateway to connect to the
TFTP server.
The following message appears:
Enter File Name [image.out]:
10.Type the firmware image file name and press Enter.
The FortiVoice Gateway downloads the firmware image file from the TFTP server and
displays a message similar to the following:
Save as Default firmware/Backup firmware/Run image without
saving:[D/B/R]
Type R.
The FortiVoice Gateway image is loaded into memory and uses the current configuration,
without saving the new firmware image to disk.
11.To verify that the new firmware image has been loaded, log in to the CLI and type:
get system status
12.Test the new firmware image.
• If the new firmware image operates successfully, you can install it to disk, overwriting the
existing firmware, using the procedure “Installing firmware” on page 56.
• If the new firmware image does not operate successfully, reboot the FortiVoice Gateway
to discard the temporary firmware and resume operation using the existing firmware.
Fortinet Technologies Inc. Page 55 FortiVoice Gateway 5.3.6 Administration Guide
Page 56

Installing firmware
You can use either the web-based manager or the CLI to upgrade or downgrade the firmware of
the FortiVoice Gateway.
Administrators whose access profile contains Read-Write access in the Others category, such
as the admin administrator, can change the FortiVoice Gateway firmware.
Firmware changes are either:
• an upgrade to a newer version
• a reversion to an earlier version
To determine if you are upgrading or reverting your firmware image, examine the firmware
version number. For example, if your current firmware version is FortiVoice Gateway
2.00,build0082,120827, changing to FortiVoice Gateway
2.00,build0081,120801, an earlier build number and date, indicates that you are reverting.
Reverting to an earlier version may cause the FortiVoice Gateway to remove parts of the
configuration that are not valid for that earlier version. In some cases, you may lose all call data
and configurations.
When upgrading, there may also be additional considerations. For details, see “Upgrading” on
page 60.
Therefore, no matter if you are upgrading or downgrading, it is always a good practice to back
up the configuration and call data. For details, see “Backing up configuration” on page 41.
To install firmware using the web-based manager
1. Log in to the Fortinet Technical Support web site, https://support.fortinet.com/.
2. Download the firmware image file to your management computer.
3. Log in to the web-based manger as the admin administrator, or an administrator account
that has system configuration read and write privileges.
4. Install firmware in one of two ways:
• Go to Status > Dashboard > Dashboard, and in the System Information widget, in the
Firmware version row, click Update. Click Browse to locate the firmware and then click
Upload.
• Go to System > Maintenance > Configuration, under Restore Firmware, click Browse to
locate the firmware. Then click Restore.
Your web browser uploads the firmware file to the FortiVoice Gateway. The FortiVoice
Gateway installs the firmware and restarts. Time required varies by the size of the file and the
speed of your network connection.
If you are downgrading the firmware to a previous version, the FortiVoice Gateway reverts
the configuration to default values for that version of the firmware. You must either
reconfigure the FortiVoice Gateway or restore the configuration file.
5. Clear the cache of your web browser and restart it to ensure that it reloads the web-based
manager and correctly displays all changes.
6. To verify that the firmware was successfully installed, log in to the web UI and go to Status >
Dashboard > Dashboard. Text appearing in the Firmware version row indicates the currently
installed firmware version.
To install firmware using the CLI
1. Log in to the Fortinet Technical Support web site, https://support.fortinet.com/.
2. Download the firmware image file to your management computer.
Fortinet Technologies Inc. Page 56 FortiVoice Gateway 5.3.6 Administration Guide
Page 57

3. Connect your management computer to the FortiVoice Gateway console port using an
RJ-45 to DB-9 serial cable or a null-modem cable.
4. Initiate a connection from your management computer to the CLI of the FortiVoice Gateway,
and log in as the admin administrator, or an administrator account that has system
configuration read and write privileges.
5. Connect port1 of the FortiVoice Gateway directly or to the same subnet as a TFTP server.
6. Copy the new firmware image file to the root directory of the TFTP server.
7. Verify that the TFTP server is currently running, and that the FortiVoice Gateway can reach
the TFTP server.
To use the FortiVoice Gateway CLI to verify connectivity, enter the following command:
execute ping 192.168.2.99
where 192.168.2.99 is the IP address of the TFTP server.
8. Enter the following command to download the firmware image from the TFTP server to the
FortiVoice Gateway:
execute restore image tftp <name_str> <tftp_ipv4>
where <name_str> is the name of the firmware image file and <tftp_ipv4> is the IP
address of the TFTP server. For example, if the firmware image file name is image.out and
the IP address of the TFTP server is 192.168.2.99, enter:
execute restore image tftp image.out 192.168.2.99
One of the following messages appears:
This operation will replace the current firmware version!
Do you want to continue? (y/n)
or:
Get image from tftp server OK.
Check image OK.
This operation will downgrade the current firmware version!
Do you want to continue? (y/n)
9. Type y.
The FortiVoice Gateway downloads the firmware image file from the TFTP server. The
FortiVoice Gateway installs the firmware and restarts. Time required varies by the size of the
file and the speed of your network connection.
If you are downgrading the firmware to a previous version, the FortiVoice Gateway reverts
the configuration to default values for that version of the firmware. You must either
reconfigure the FortiVoice Gateway or restore the configuration file.
10.If you also use the web-based manager, clear the cache of your web browser and restart it to
ensure that it reloads the web-based manager and correctly displays all tab, button, and
other changes.
11.To verify that the firmware was successfully installed, log in to the CLI and type:
get system status
12.If you have downgraded the firmware version, reconnect to the FortiVoice Gateway using its
default IP address for port1, 192.168.1.99, and restore the configuration file. For details, see
“Reconnecting to the FortiVoice Gateway” on page 58 and “Restoring the configuration” on
page 59.
If you have upgraded the firmware version, to verify the conversion of the configuration file,
see “Verifying the configuration” on page 60. If the upgrade is unsuccessful, you can
downgrade the firmware to a previous version.
Fortinet Technologies Inc. Page 57 FortiVoice Gateway 5.3.6 Administration Guide
Page 58

Reconnecting to the FortiVoice Gateway
After downgrading to a previous firmware version, the FortiVoice Gateway reverts to default
settings for the installed firmware version, including the IP addresses of network interfaces
through which you connect to the FortiVoice Gateway web-based manager and/or CLI.
If your FortiVoice Gateway has not been reset to its default configuration, but you cannot
connect to the web-based manager or CLI, you can restore the firmware, resetting the
FortiVoice Gateway to its default configuration in order to reconnect using the default network
interface IP address. For more information, see “Clean installing firmware” on page 61.
To reconnect using the CLI
1. Connect your management computer to the FortiVoice Gateway console port using an
RJ-45 to DB-9 serial cable or a null-modem cable.
2. Start HyperTerminal, enter a name for the connection and click OK.
3. Configure HyperTerminal to connect directly to the communications (COM) port on your
computer and click OK.
4. Select the following port settings and click OK:
Table 10: Port settings
Bits per second 115200
Data bits 8
Parity None
Stop bits 1
Flow control None
5. Press Enter to connect to the FortiVoice Gateway CLI.
The login prompt appears.
6. Type admin and press Enter twice.
The following prompt appears:
Welcome!
Fortinet Technologies Inc. Page 58 FortiVoice Gateway 5.3.6 Administration Guide
Page 59

7. Enter the following command:
set system interface <interface_str> mode static ip <address_ipv4>
<mask_ipv4>
where:
• <interface_str> is the name of the network interface, such as port1
• <address_ipv4> is the IP address of the network interface, such as 192.168.1.10
• <mask_ipv4> is the netmask of the network interface, such as 255.255.255.0
Enter the following command:
set system interface <interface_str> config allowaccess
<accessmethods_str>
where:
• <interface_str> is the name of the network interface configured in the previous step,
such as port1
• <accessmethods_str> is a space-delimited list of the administrative access protocols
that you want to allow on that network interface, such as ping ssh https
The network interface’s IP address and netmask is saved. You can now reconnect to either
the web UI or CLI through that network interface. For information on restoring the
configuration, see “Restoring the configuration” on page 59.
Restoring the configuration
You can restore a backup copy of the configuration file from your local PC using either the
web-based manager or CLI. For information about configuration backup, see “Backing up
configuration” on page 41.
If you have just downgraded or restored the firmware of the FortiVoice Gateway, restoring the
configuration file can be used to reconfigure the FortiVoice Gateway from its default settings.
To restore the configuration file using the web UI
1. Clear your browser’s cache. If your browser is currently displaying the web-based manager,
also refresh the page.
2. Log in to the web-based manager.
3. Go to System > Maintenance > Configuration.
4. Under Restore Configuration, click Browse to locate and select the configuration file that you
want to restore, then click Restore.
The FortiVoice Gateway restores the configuration file and reboots.Time required varies by
the size of the file and the speed of your network connection.
5. After restoring the configuration file, verify that the settings have been successfully loaded.
For details on verifying the configuration restoration, see “Verifying the configuration” on
page 60.
To restore the configuration file using the CLI
1. Initiate a connection from your management computer to the CLI of the FortiVoice Gateway,
and log in as the admin administrator, or an administrator account that has system
configuration read and write privileges.
2. Connect a network interface of the FortiVoice Gateway directly or to the same subnet as a
TFTP server.
3. Copy the new firmware image file to the root directory of the TFTP server.
Fortinet Technologies Inc. Page 59 FortiVoice Gateway 5.3.6 Administration Guide
Page 60

4. Verify that the TFTP server is currently running, and that the FortiVoice Gateway can reach
the TFTP server.
To use the FortiVoice Gateway CLI to verify connectivity, enter the following command:
execute ping 192.168.2.99
where 192.168.2.99 is the IP address of the TFTP server.
5. Enter the following command:
execute restore config tftp <file_name> <tftp_ipv4>
The following message appears:
This operation will overwrite the current settings!
(The current admin password will be preserved.)
Do you want to continue? (y/n)
6. Enter y.
The FortiVoice Gateway restores the configuration file and reboots. Time required varies by
the size of the file and the speed of your network connection.
7. After restoring the configuration file, verify that the settings have been successfully loaded.
For details on verifying the configuration restoration, see “Verifying the configuration” on
page 60.
Verifying the configuration
After installing a new firmware file, you should verify that the configuration has been
successfully converted to the format required by the new firmware and that no configuration
data has been lost.
In addition to verifying successful conversion, verifying the configuration also provides
familiarity with new and changed features.
To verify the configuration upgrade
1. Clear your browser’s cache and refresh the login page of the web-based manager.
2. Log in to the web-based manager using the admin administrator account.
3. Review the configuration and compare it with your configuration backup to verify that the
Upgrading
If you are upgrading, it is especially important to note that the upgrade process may require a
specific path. Very old versions of the firmware may not be supported by the configuration
upgrade scripts that are used by the newest firmware. As a result, you may need to upgrade to
an intermediate version of the firmware first, before upgrading to your intended version.
Upgrade paths are described in the Release Notes.
Before upgrading the firmware of the FortiVoice Gateway, for the most current upgrade
information, review the Release Notes for the new firmware version. Release Notes are
available from http://support.fortinet.com when downloading the firmware image file.
Release Notes may contain late-breaking information that was not available at the time this
guide was prepared.
Other administrator accounts may not have sufficient privileges to completely review the
configuration.
configuration has been correctly converted.
Fortinet Technologies Inc. Page 60 FortiVoice Gateway 5.3.6 Administration Guide
Page 61

Clean installing firmware
Clean installing the firmware can be useful if:
• you are unable to connect to the FortiVoice Gateway using the web-based manager or the
CLI
• you want to install firmware without preserving any existing configuration
• a firmware version that you want to install requires that you format the boot device (see the
Release Notes accompanying the firmware)
Unlike upgrading or downgrading firmware, clean installing firmware re-images the boot device.
Also, a clean install can only be done during a boot interrupt, before network connectivity is
available, and therefore requires a local console connection to the CLI. A clean install cannot
be done through a network connection.
Back up your configuration before beginning this procedure, if possible. A clean install resets
the configuration, including the IP addresses of network interfaces. For information on
backups, see “Backing up configuration” on page 41. For information on reconnecting to a
FortiVoice Gateway whose network interface configuration has been reset, see “Reconnecting
to the FortiVoice Gateway” on page 58.
If you are reverting to a previous FortiVoice Gateway version, you might not be able to restore
your previous configuration from the backup configuration file.
To clean install the firmware
1. Download the firmware file from the Fortinet Technical Support web site,
https://support.fortinet.com/.
2. Connect your management computer to the FortiVoice Gateway console port using an
RJ-45 to DB-9 serial cable or a null-modem cable.
3. Initiate a local console connection from your management computer to the CLI of the
FortiVoice Gateway, and log in as the admin administrator, or an administrator account that
has system configuration read and write privileges.
4. Connect port1 of the FortiVoice Gateway directly to the same subnet as a TFTP server.
5. Copy the new firmware image file to the root directory of the TFTP server.
6. Verify that the TFTP server is currently running, and that the FortiVoice Gateway can reach
the TFTP server.
To use the FortiVoice Gateway CLI to verify connectivity, if it is responsive, enter the
following command:
execute ping 192.168.2.99
where 192.168.2.99 is the IP address of the TFTP server.
7. Enter the following command to restart the FortiVoice Gateway:
execute reboot
or power off and then power on the FortiVoice Gateway.
8. As the FortiVoice Gateway starts, a series of system startup messages are displayed.
Press any key to display configuration menu........
Fortinet Technologies Inc. Page 61 FortiVoice Gateway 5.3.6 Administration Guide
Page 62

9. Immediately press a key to interrupt the system startup.
You have only 3 seconds to press a key. If you do not press a key soon enough, the FortiVoice
Gateway reboots and you must log in and repeat the execute reboot command.
If you successfully interrupt the startup process, the following messages appear:
[G]: Get firmware image from TFTP server.
[F]: Format boot device.
[B]: Boot with backup firmware and set as default.
[I]: Configuration and information.
[Q]: Quit menu and continue to boot with default firmware.
[H]: Display this list of options.
Enter G,F,B,I,Q,or H:
10.If the firmware version requires that you first format the boot device before installing
firmware, type F. (Format boot device) before continuing.
11.Type G to get the firmware image from the TFTP server.
The following message appears:
Enter TFTP server address [192.168.2.99]:
12.Type the IP address of the TFTP server and press Enter.
The following message appears:
Enter Local Address [192.168.1.188]:
13.Type a temporary IP address that can be used by the FortiVoice Gateway to connect to the
TFTP server.
The following message appears:
Enter File Name [image.out]:
14.Type the firmware image file name and press Enter.
The FortiVoice Gateway downloads the firmware image file from the TFTP server and
displays a message similar to the following:
Save as Default firmware/Backup firmware/Run image without
saving:[D/B/R]
15.Type D.
The FortiVoice Gateway downloads the firmware image file from the TFTP server. The
FortiVoice Gateway installs the firmware and restarts. Time required varies by the size of the
file and the speed of your network connection.
The FortiVoice Gateway reverts the configuration to default values for that version of the
firmware.
16.Clear the cache of your web browser and restart it to ensure that it reloads the web-based
manager and correctly displays all tab, button, and other changes.
17.To verify that the firmware was successfully installed, log in to the CLI and type:
get system status
The firmware version number appears.
18.Either reconfigure the FortiVoice Gateway or restore the configuration file from a backup. For
details, see “Restoring the configuration” on page 59.
Fortinet Technologies Inc. Page 62 FortiVoice Gateway 5.3.6 Administration Guide
Page 63

Index
A
administrative access 26
administrator
"admin" account 12, 13, 56, 57, 59, 60, 61
appearance, web-based manager 38
authentication 12
B
bandwidth 17
boot interrupt 61
browser 11, 12
warnings 12
C
cable
null modem 13
call statistics 18
certificate
default 12
mismatch 12
self-signed 12
warning 12
certificate authority (CA) 12
certification 5
CIDR 9
clean install firmware 61
CLI 28
connecting to 13
column view
logs 21
command line interface (CLI) 6, 8, 11
common name (CN) field 12
communications (COM) port 13
configuration, verifying the 60
connecting
web UI 12
conventions 6
CPU 17
D
dashboard 16
date 34
daylight savings time (DST) 34
default
administrator account 12, 13, 56, 57, 59, 60, 61
certificate 12
gateway 29
password 12, 13, 14, 15
route 29
settings 13
DHCP 28
DNS server 30
documentation 6
conventions 6
Release Notes 61
domain name
certificate 12
DOS 11
dotted decimal 9
downgrade 56
dynamic IP address 28
E
_email 9
Ethernet 12, 13
expected input 8
F
factory default settings 13
FAQ 6
firmware 56
change 17
clean install 61
downgrade 56
upgrade 56
version 16
formatted view
logs 21
formatting the boot device 61
Fortinet
Knowledge Base 6
Technical Documentation 6
conventions 6
Technical Support 5
Technical Support, registering with 5
Technical Support, web site 5
Training Services 5
_fqdn 9
frame size 29
fully qualified domain name (FQDN) 9
G
gateway 29
glossary 6
graphical user interface (GUI) 11
H
halt 18
hard disk
logging to 52
host name 12
how-to 6
HTTP
web-based manager 28
HTTPS 12, 28
HyperTerminal 13
I
ICMP ECHO 28
idle timeout 38
Fortinet Technologies Inc. Page 63 FortiVoice Gateway 5.3.6 Administration Guide
Page 64

_index 9
index number 9
input constraints 8
_int 9
Internet service provider (ISP) 30
IP address 12, 13
private network 6
_ipv4 9
_ipv4/mask 9
_ipv4mask 9
_ipv6 9
_ipv6mask 9
K
Knowledge Base 6
L
language
web-based manager 39
log
column view 21
formatted view 21
rotate 53
search 22
severity level 52
to the hard disk 52
M
maximum transmission unit (MTU) 29
media access control (MAC) 27
memory usage 17
Microsoft
Internet Explorer 12
Mozilla Firefox 12
N
_name 9
network
interface 13
network time protocol (NTP) 34, 35
next-hop router 29, 30
null modem cable 13
P
password 12, 13, 14, 15
administrator 33
_pattern 9
pattern 9
ping 28
port1 13
product registration 5
protocol
administrative access 33
R
reachable 29
read & write
administrator 33
reconnecting to the FortiMail unit 58
registering
with Fortinet Technical Support 5
regular expression 9
Release Notes 61
restart 18
restore
factory defaults 24
previous configuration 59
RFC
1918 6
RJ-45 12, 13
route
default 29
static 29
S
Secure Shell (SSH) 11
secure shell (SSH) 28
security certificate 12
self-signed 12
severity level 52
shut down 18
SNMP 28
static route 29
static routing 29
_str 9
string 9
syntax 8
system options
changing 38
data and time 34
system resource usage 16
system time 16
T
technical
documentation 6
notes 6
Telnet 11
telnet 28
terminal 11, 13
time 34
time zone 34
Training Services 5
trust certificate 12
trusted host 33
U
UNIX 11
update 56
verify 60
uptime 16
URL 12
_url 9
V
_v4mask 9
_v6mask 9
Fortinet Technologies Inc. Page 64 FortiVoice Gateway 5.3.6 Administration Guide
Page 65

value parse error 9
W
web browser 11, 12
warnings 12
web UI 12
web-based manager
customizing appearance 38
HTTP 28
HTTPS 28
language 39
widget 16
wild cards 9
Fortinet Technologies Inc. Page 65 FortiVoice Gateway 5.3.6 Administration Guide
Page 66

 Loading...