

Page 1

VT MOBILE
Gas Flow Analyzer
February 2006
© 2006 Fluke Corporation. All rights reserved.
All product names are trademarks of their respective companies.
Operators Manual
Page 2

Warranty and Product Support
Fluke Biomedical warrants this instrument against defects in materials and workmanship
for one full year from the date of original purchase. During the warranty period, we will
repair or, at our option, replace at no charge a product that proves to be defective,
provided you return the product, shipping prepaid, to Fluke Biomedical. This warranty
does not apply if the product has been damaged by accident or misuse or as the result of
service or modification by other than Fluke Biomedical. IN NO EVENT SHALL FLUKE
BIOMEDICAL BE LIABLE FOR CONSEQUENTIAL DAMAGES.
Only serialized products and their accessory items (those products and items bearing a
distinct serial number tag) are covered under this one–year warranty. PHYSICAL
DAMAGE CAUSED BY MISUSE OR PHYSICAL ABUSE IS NOT COVERED
UNDER THE WARRANTY. Items such as cables and nonserialized modules are not
covered under this warranty.
Recalibration of instruments is not covered under the warranty.
This warranty gives you specific legal rights, and you may also have other rights which
vary from state to state, province to province, or country to country. This warranty is
limited to repairing the instrument to Fluke Biomedical’s specifications.
Warranty Disclaimer
Should you elect to have your instrument serviced and/or calibrated by someone other
than Fluke Biomedical, please be advised that the original warranty covering your
product becomes void when the tamper-resistant Quality Seal is removed or broken
without proper factory authorization. We strongly recommend, therefore, that you send
your instrument to Fluke Biomedical for factory service and calibration, especially during
the original warranty period.
Page 3

Notices
All Rights Reserved
Copyright 2006, Fluke Biomedical. No part of this publication may be reproduced, transmitted, transcribed, stored in a retrieval
system, or translated into any language without the written permission of Fluke Biomedical.
Copyright Release
Fluke Biomedical agrees to a limited copyright release that allows you to reproduce manuals and other printed materials for use in
service training programs and other technical publications. If you would like other reproductions or distributions, submit a written
request to Fluke Biomedical.
Unpacking and Inspection
Follow standard receiving practices upon receipt of the instrument. Check the shipping carton for damage. If damage is found, stop
unpacking the instrument. Notify the carrier and ask for an agent to be present while the instrument is unpacked. There are no special
unpacking instructions, but be careful not to damage the instrument when unpacking it. Inspect the instrument for physical damage such
as bent or broken parts, dents, or scratches.
Technical Support
For application support or answers to technical questions, either email techservices@flukebiomedical.com or call 1-800-648-7942 or
1-425-446-6945.
Claims
Our routine method of shipment is via common carrier, FOB origin. Upon delivery, if physical damage is found, retain all packing
materials in their original condition and contact the carrier immediately to file a claim. If the instrument is delivered in good physical
condition but does not operate within specifications, or if there are any other problems not caused by shipping damage, please contact
Fluke Biomedical or your local sales representative.
Standard Terms and Conditions
Refunds and Credits
Please note that only serialized products and their accessory items (i.e., products and items bearing a distinct serial number
tag) are eligible for partial refund and/or credit. Nonserialized parts and accessory items (e.g., cables, carrying cases,
auxiliary modules, etc.) are not eligible for return or refund. Only products returned within 90 days from the date of original
purchase are eligible for refund/credit. In order to receive a partial refund/credit of a product purchase price on a serialized product, the
product must not have been damaged by the customer or by the carrier chosen by the customer to return the goods, and the product
must be returned complete (meaning with all manuals, cables, accessories, etc.) and in “as new” and resalable condition. Products not
returned within 90 days of purchase, or products which are not in “as new” and resalable condition, are not eligible for credit return and
will be returned to the customer. The Return Procedure (see below) must be followed to assure prompt refund/credit.
Restocking Charges
Products returned within 30 days of original purchase are subject to a minimum restocking fee of 15 %. Products returned in
excess of 30 days after purchase, but prior to 90 days, are subject to a minimum restocking fee of 20 %. Additional charges for
damage and/or missing parts and accessories will be applied to all returns.
Page 4

Return Procedure
All items being returned (including all warranty-claim shipments) must be sent freight-prepaid to our factory location. When you return
an instrument to Fluke Biomedical, we recommend using United Parcel Service, Federal Express, or Air Parcel Post. We also
recommend that you insure your shipment for its actual replacement cost. Fluke Biomedical will not be responsible for lost shipments
or instruments that are received in damaged condition due to improper packaging or handling.
Use the original carton and packaging material for shipment. If they are not available, we recommend the following guide for
repackaging:
Use a double–walled carton of sufficient strength for the weight being shipped.
Use heavy paper or cardboard to protect all instrument surfaces. Use nonabrasive material around all projecting parts.
Use at least four inches of tightly packed, industry-approved, shock-absorbent material around the instrument.
Returns for partial refund/credit:
Every product returned for refund/credit must be accompanied by a Return Material Authorization (RMA) number, obtained from our
Order Entry Group at 1-800-648-7952 or 1-425-446-6945.
Repair and calibration:
To find the nearest service center, goto www.flukebiomedical.com/service
In the U.S.A.:
Cleveland Calibration Lab
Tel: 1-800-850-4606
Email: globalcal@flukebiomedical.com
Everett Calibration Lab
Tel: 1-800-850-4606
Email: service.status@fluke.com
In Europe, Middle East, and Africa:
Eindhoven Calibration Lab
Tel: +31-402-675300
Email: ServiceDesk@fluke.com
In Asia:
Everett Calibration Lab
Tel: +425-446-6945
Email: service.international@fluke.com
or
Certification
This instrument was thoroughly tested and inspected. It was found to meet Fluke Biomedical’s manufacturing specifications when it
was shipped from the factory. Calibration measurements are traceable to the National Institute of Standards and Technology (NIST).
Devices for which there are no NIST calibration standards are measured against in-house performance standards using accepted test
procedures.
WARNING
Unauthorized user modifications or application beyond the published specifications may result in electrical shock hazards or improper
operation. Fluke Biomedical will not be responsible for any injuries sustained due to unauthorized equipment modifications.
Restrictions and Liabilities
Information in this document is subject to change and does not represent a commitment by Fluke Biomedical. Changes made
to the information in this document will be incorporated in new editions of the publication. No responsibility is assumed by
Fluke Biomedical for the use or reliability of software or equipment that is not supplied by Fluke Biomedical, or by its
affiliated dealers.
Manufacturing Location
The VT MOBILE is manufactured in Everett, WA, U.S.A.
Page 5

Symbols
Symbol Description
W
P
)
"
12V DC F
~
M 9V NEDA 1604A
6F22 006P
‚
f
"
'
See Operators Manual.
Manufacturer’s declaration of product compliance with applicable
EU directives
CSA Listing mark
Battery Eliminator input
Do not mix with solid waste stream. Dispose of using a qualified
recycler or hazardous material handler.
9-volt battery
Flow Port
Pressure Port
Temperature and Relative Humidity Port
Oxygen Sensor Port
Battery Eliminator Port
Miniature RS232 Port
Page 6

WXWarning. Read before using Analyzer.
To avoid personal injury, follow these guidelines:
Do not use the VT MOBILE in any manner not specified in the Operator’s
Manual. Otherwise, the protection provided by this product may be impaired.
When measuring oxygen, always keep all components of test setup well away
from open flame or other combustion-starting devices.
Use in well-ventilated space. Be aware that a gas defined with VT for Windows
software as ‘User’ may be unknown while using the VT MOBILE.
For high pressure measurements, always turn off gas source before
connection or disconnection of VT MOBILE. Be aware that there is no pressure
indication on the VT MOBILE screen when VT for Windows software is in
control.
• Always press power off on the VT MOBILE and unplug the battery eliminator
before cleaning the outer surface.
• Inspect the product, if the instrument appears damaged or appears to operate
in a manner not specified in the manual, DO NOT CONTINUE USE. Return the
product for service.
• Avoid spilling liquids on the analyzer; fluid seepage into internal components
creates corrosion and a potential shock hazard. Do not operate the instrument
if internal components are exposed to fluid.
• Do not open this product. There are no user replaceable parts.
WCaution
The VT MOBILE should be calibrated annually. Only qualified technical personnel
should perform troubleshooting and service procedures on the VT MOBILE.
Do not expose the system to temperature extremes. Ambient operating
temperatures should remain between 10 and 40 °C. System performance may be
adversely affected if temperatures fluctuate above or below this range.
Clean only with a damp, lint-free cloth, using a mild detergent, and wipe
down gently.
Page 7

Table of Contents
Chapter Title Page
1 Introducing the VT MOBILE................................................................ 1-1
Introduction........................................................................................................ 1-1
Operation, Storage, and Maintenance................................................................ 1-1
Features.............................................................................................................. 1-2
About This Manual ............................................................................................ 1-2
2 Preparing for Operation...................................................................... 2-1
Unpacking the VT MOBILE ............................................................................. 2-1
Powering Up ...................................................................................................... 2-3
Using the Tilt Bail.............................................................................................. 2-3
Using the Keys................................................................................................... 2-4
Selecting the Operating Mode ........................................................................... 2-4
Setting Up .......................................................................................................... 2-5
Selecting the Gas Type.................................................................................. 2-5
Gas Temperature and Relative Humidity ...................................................... 2-5
Selecting the Correction Mode...................................................................... 2-5
Setting the Breath Detect Threshold.............................................................. 2-6
Setting Zero Warn ON or OFF...................................................................... 2-6
Setting the Time ............................................................................................ 2-7
Setting the Date ............................................................................................. 2-7
Selecting the Date Format ............................................................................. 2-8
Setting the Contrast ....................................................................................... 2-8
Checking Version and Serial Numbers ......................................................... 2-8
Connecting the Analyzer ................................................................................... 2-8
High-Flow Connection .................................................................................. 2-9
Low-Flow Connection................................................................................... 2-9
High-Pressure Connection............................................................................. 2-9
Low-Pressure Connection ............................................................................. 2-9
Ventilator Test Connections .......................................................................... 2-10
3 Using the VT MOBILE.......................................................................... 3-1
Understanding the Controls and Indicators........................................................ 3-1
Screens............................................................................................................... 3-4
Ventilator Parameters Screens....................................................................... 3-4
i
Page 8

VT MOBILE
Operators Manual
Waveform Screens......................................................................................... 3-6
Other Measurements Screens ........................................................................ 3-9
Special Functions Screens ............................................................................. 3-10
Using Trend Test ............................................................................................... 3-12
Making Measurements....................................................................................... 3-14
Working with Memory ...................................................................................... 3-14
Printing .............................................................................................................. 3-14
Making a Measurement More Accurate ............................................................ 3-14
Warm-up and Zeroing ................................................................................... 3-14
Oxygen Sensor............................................................................................... 3-16
Verifying Oxygen Sensor Calibration ........................................................... 3-16
Calibrating the Oxygen Sensor...................................................................... 3-16
Using the Temperature and Relative Humidity Sensor ................................. 3-17
Checking Barometric Pressure ...................................................................... 3-18
Changing Barometric Pressure Units ............................................................ 3-19
Viewing Demo Data .......................................................................................... 3-19
Accessing Help .................................................................................................. 3-19
4 Checking Ventilator Parameters ........................................................ 4-1
Introduction........................................................................................................ 4-1
Checking Ventilator Parameters ........................................................................ 4-1
Understanding the Parameters ........................................................................... 4-3
5 Measuring Pressure ............................................................................ 5-1
Introduction........................................................................................................ 5-1
Measuring Low Pressure ................................................................................... 5-2
Measuring High Pressure................................................................................... 5-3
Measuring Airway Pressure............................................................................... 5-5
6 Measuring Flow and Volume.............................................................. 6-1
Introduction........................................................................................................ 6-1
Gas Settings................................................................................................... 6-1
Balance Gas Settings ..................................................................................... 6-1
Correction Modes .......................................................................................... 6-2
Flow Zeroing ................................................................................................. 6-2
Measuring Low Flow......................................................................................... 6-3
Measuring High Flow ........................................................................................ 6-4
Measuring Volume ............................................................................................ 6-5
7 Maintaining and Troubleshooting the VT MOBILE........................... 7-1
Introduction........................................................................................................ 7-1
Calibration and Service...................................................................................... 7-1
Battery................................................................................................................ 7-1
Cleaning............................................................................................................. 7-2
Verifying Oxygen Sensor Calibration ............................................................... 7-2
Replacing the Oxygen Sensor............................................................................ 7-3
Calibrating the Oxygen Sensor .......................................................................... 7-3
Troubleshooting................................................................................................. 7-4
Appendices
A VT for Windows.......................................................................................... A-1
B Specifications .............................................................................................. B-1
ii
Page 9

List of Tables
Table Title Page
1-1. VT MOBILE Versions........................................................................................... 1-1
2-1. Standard Accessories ............................................................................................. 2-2
2-2. Optional Accessories.............................................................................................. 2-2
2-3. Gas Types............................................................................................................... 2-5
2-4. Correction Modes................................................................................................... 2-6
3-1. Controls and Indicators .......................................................................................... 3-2
3-2. Ventilator Parameters............................................................................................. 3-4
4-1. Ventilator Parameters............................................................................................. 4-3
7-1. Troubleshooting the Analyzer................................................................................ 7-4
iii
Page 10

VT MOBILE
Operators Manual
iv
Page 11

List of Figures
Figure Title Page
2-1. Key Available Accessories..................................................................................... 2-3
2-2. VT MOBILE Tilt Bail............................................................................................ 2-4
2-3. Low-Pressure/High-Flow/Low-Flow Connection.................................................. 2-8
2-4. High-Pressure Connection...................................................................................... 2-9
2-5. Ventilator Test Connections................................................................................... 2-10
3-1. Controls and Indicators .......................................................................................... 3-1
3-2. Flow Sensors and Pressure Adapters Disconnected............................................... 3-15
3-3. Flow Sensors and Pressure Adapters Connected ................................................... 3-15
3-4. Oxygen Sensor Calibration .................................................................................... 3-17
3-5. Measuring Temperature and Relative Humidity .................................................... 3-18
4-1. Ventilator Connections........................................................................................... 4-2
4-2. Accessing Calculated Parameters........................................................................... 4-4
4-3. Accessing Other Parameters................................................................................... 4-4
5-1. Measuring Low Pressure........................................................................................ 5-2
5-2. Accessing Low-Pressure Measurements ................................................................ 5-3
5-3. Measuring High Pressure ....................................................................................... 5-4
5-4. Accessing High-Pressure Measurements ............................................................... 5-4
5-5. Accessing Airway Pressure Measurements............................................................ 5-5
6-1. Measuring Low Flow ............................................................................................. 6-3
6-2. Accessing Low-Flow Measurements ..................................................................... 6-4
6-3. Measuring High Flow ............................................................................................ 6-5
6-4. Accessing High-Flow Measurements..................................................................... 6-5
7-1. Changing the Battery.............................................................................................. 7-2
7-2. Oxygen Sensor Calibration .................................................................................... 7-3
v
Page 12

VT MOBILE
Operators Manual
vi
Page 13

Introduction
This Operators Manual provides complete operating instructions for the Fluke
Biomedical VT MOBILE Gas Flow Analyzer (hereafter referred to as the Analyzer.)
Seven language options support the available factory-set versions of the Analyzer. The
overlay language identifies these.
The Analyzer is a general-purpose, portable gas flow analyzer with special modes
designed specifically for testing mechanical patient ventilators. The Analyzer measures
bi-directional flow in both high and low ranges as well as high- and low-pressure ranges.
The Analyzer is not for use in the patient environment. Table 1-1 identifies Analyzer
language versions.
The Analyzer measures the basic signals of pressure, flow, and oxygen. From these basic
signals, the Analyzer computes other parameters. The Analyzer obtains volume from the
integration, or summation, of the flow signal over a period of time.
Chapter 1
Introducing the VT MOBILE
Table 1-1. VT MOBILE Versions
Version Language Overlay
VT MOBILE US English
VT MOBILE FRA French
VT MOBILE DEU German
VT MOBILE ITAL Italian
VT MOBILE SPAN Spanish
VT MOBILE JPN Japanese
VT MOBILE CHI Chinese
Operation, Storage, and Maintenance
Operate the Analyzer in a dry area within temperature limits of 10 °C to 40 °C. The
maximum operating relative humidity at temperatures up to 31 °C is 80 % noncondensing, decreasing linearly to 50 % non-condensing at 40 °C.
Store the Analyzer at a temperature of -25 °C to 50 °C and at a non-condensing relative
humidity of 0 to 95 %.
The battery is the only user-serviceable part in the Analyzer. For safety reasons, only an
experienced technician should perform maintenance requiring other internal access.
1-1
Page 14

VT MOBILE
Operators Manual
Features
Features include:
• Percent Oxygen Measurement. An oxygen sensor measures the oxygen percent of the
gas in series with the high- or low-flow channel of the Analyzer. Maxtec oxygen
sensor distributed by Fluke Biomedical.
• Breath Parameters. The Analyzer measures 16 parameters on each detected breath.
These parameters include tidal volume, minute volume, inspiratory and expiratory
pressures, etc.
• Selectable Units. The Analyzer allows you to select the desired units for each of the
measured signals. For example, pressures can be displayed in mmHg, kPa, bar, mbar,
atm, inH2O, inHg, cmH2O or mmHg.
• Gas Type. Select the gas type from a pre-defined list, or, using the VT for Windows
software, specify a user-defined gas.
• Trend Testing. The Analyzer provides an automated test to see if a predetermined
parameter deviates from limits you set.
• Evaluations/Troubleshooting. Use the Analyzer for pre-purchase evaluations of
ventilators, incoming and routine performance verification, and troubleshooting
clinical problems, as well as teaching principles of mechanical ventilation.
• Computer Control, Data Logging, and Printing. A miniature RS232 serial port allows
connection to a personal computer for external Analyzer control, data logging of test
results, and printing. The Analyzer is compatible with Fluke Biomedical’s VT for
Windows PC software (version 2.01.00 or higher.)
•
Lung Simulator. The Analyzer operates with or without a test lung attached. Use the
optional Fluke Biomedical ACCU LUNG as a test lung with integrated airway
restrictors that assist you in evaluating intermittent errors.
About This Manual
This manual provides a complete description of the Analyzer and its applications. The
manual contains information for beginners as well as experts in mechanical ventilator
evaluation and separate measurement of pressure, flow, and volume.
Chapters are as follows:
• Chapter 1: Introducing the VT MOBILE. An introduction to the Analyzer
• Chapter 2: Preparing for Operation. Unpacking and setting up the Analyzer
• Chapter 3: Using the VT MOBILE. How to use the keys and interpret the screens
• Chapter 4: Checking Ventilator Parameters. How to access and interpret the 16
ventilator parameters
• Chapter 5: Measuring Pressure. How to measure high and low pressure
• Chapter 6: Measuring Flow and Volume. How to measure high and low flow and
derive volume
• Chapter 7: Maintaining and Troubleshooting the VT MOBILE. How to perform
maintenance and routine troubleshooting
• Appendix A: VT for Windows PC Software
• Appendix B: Specifications
1-2
Page 15

Preparing for Operation
Unpacking the VT MOBILE
Before unpacking the Analyzer, visually inspect the shipping box for damage. If no
damage is evident, unpack the Analyzer and its accessories from the shipping carton.
Table 2-1 lists the standard accessories included in the box. Save the foam inserts and
shipping box. You must use the original packing materials when shipping the Analyzer
for service or re-calibration. If the original shipping carton and packing materials are not
available, call a Fluke Biomedical service representative for assistance.
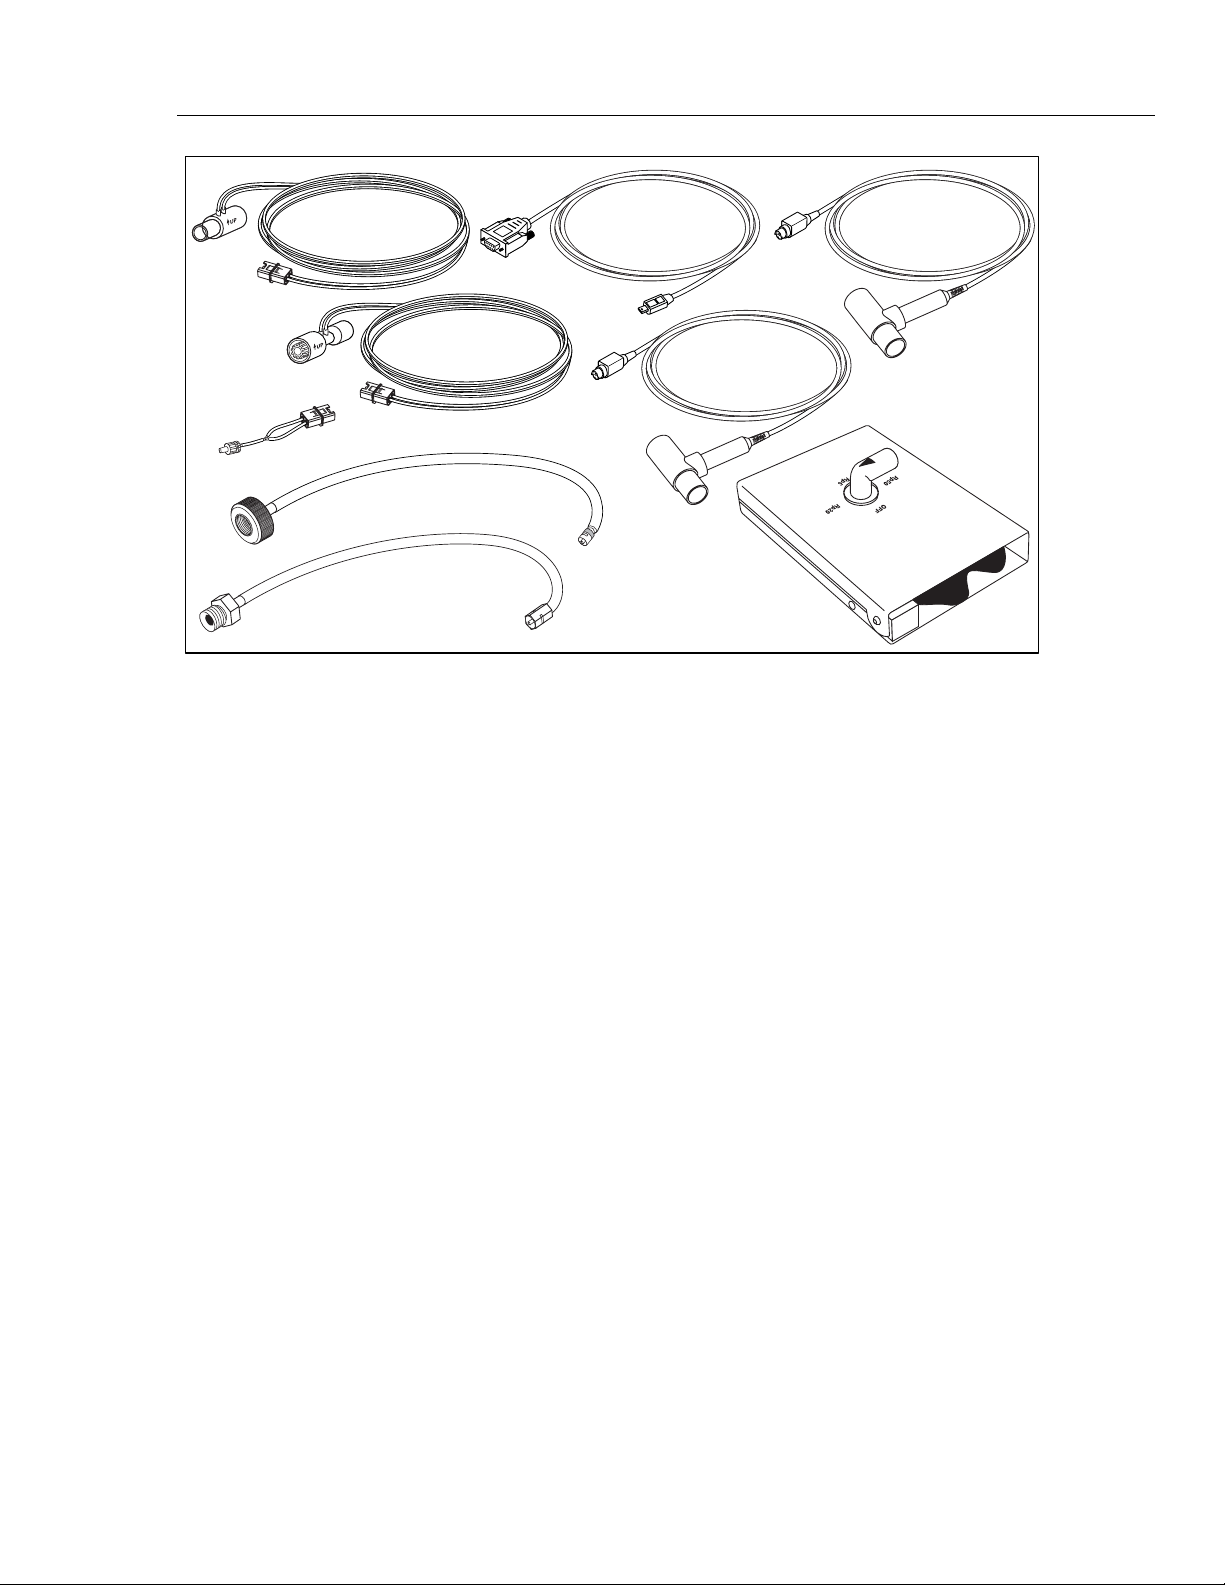
Identify accessories for your Analyzer with the aid of Tables 2-1, 2-2 and Figure 2-1.
Check for missing parts. Carefully inspect the unit for damage such as cracks, dents, or
bent parts. If items are missing or any physical damage is apparent, call Fluke Biomedical
for assistance. For information on ways to contact Fluke Biomedical, see the section in
this manual called “Support.” Also, notify the carrier if the damage appears to be the
result of a shipping mishap.
Chapter 2
2-1
Page 16

VT MOBILE
Operators Manual
Accessory Kit 2548405
High-Flow Sensor 2438334
High-Pressure Adapter (Luer to Male Nut/Nipple D.I.S.S. Oxygen) 2548303
Low-Pressure Adapter 2454175
Oxygen Sensor 2448801
Oxygen Sensor Cable 6 ‘ 2448051
‘T’, 15 mm ID, 22 mm ID, 15 mm ID end 2457028
VT MOBILE RS232 Cable, 6’ 2075257
9 VDC Battery (Alkaline) 614487
Battery Eliminator 2547455
Soft Carrying Case 2523995
Information Packet: Getting Started Manual; Quick Reference Card; CD
with Quick Reference Card, Getting Started Manual, Operators Manual, VT
for Windows (V2.01.00 +)
Table 2-1. Standard Accessories
Item Part Number
2544926
Table 2-2. Optional Accessories
Item Part No.
Low-Flow Sensor 2438352
High-Pressure Adapter (Luer to Female D.I.S.S. Oxygen) 2548315
Temperature and RH Sensor Assembly 2541622
Serial Communications Cable (RS232) DB9F to miniature RS232, 6’ 2075257
Power Adapter, Universal (USA and International) 2118212
ACCU LUNG Portable, Precision Test Lung 2387318
2-2
Page 17
Preparing for Operation
Powering Up
2
High-Flow
Sensor
Low-Pressure
Adapter
Powering Up
RS232
Cable
Low-Flow
Sensor
High-Pressure
Adapters
Figure 2-1. Key Available Accessories
Oxygen
Sensor
Temperature/RH
Sensor
ACCU LUNG
ede03f.eps
1. Press the Power key (H) to power on the Analyzer. The Analyzer displays the power up
screen for several seconds.
2. The Analyzer then prompts you for the zeroing procedure. Place the Analyzer on a flat
surface, and, if necessary, disconnect flow and pressure sensors.
W
Warning
Make sure pressure is set to zero before disconnecting the
High-Pressure Adapter. Exposure to high pressure could cause
personal injury.
3. Press G (Ok). The Analyzer now performs the zeroing procedure. After several seconds,
the Tidal Volume screen appears and the Analyzer is ready for use. If you have pressed R
to initiate the zero procedure, the Analyzer returns to the previous screen displayed.
Note
If the Analyzer encounters a power problem (such as a backwards battery),
thermal overload devices interrupt normal operation. Repair the problem,
wait several seconds, and resume normal operation.
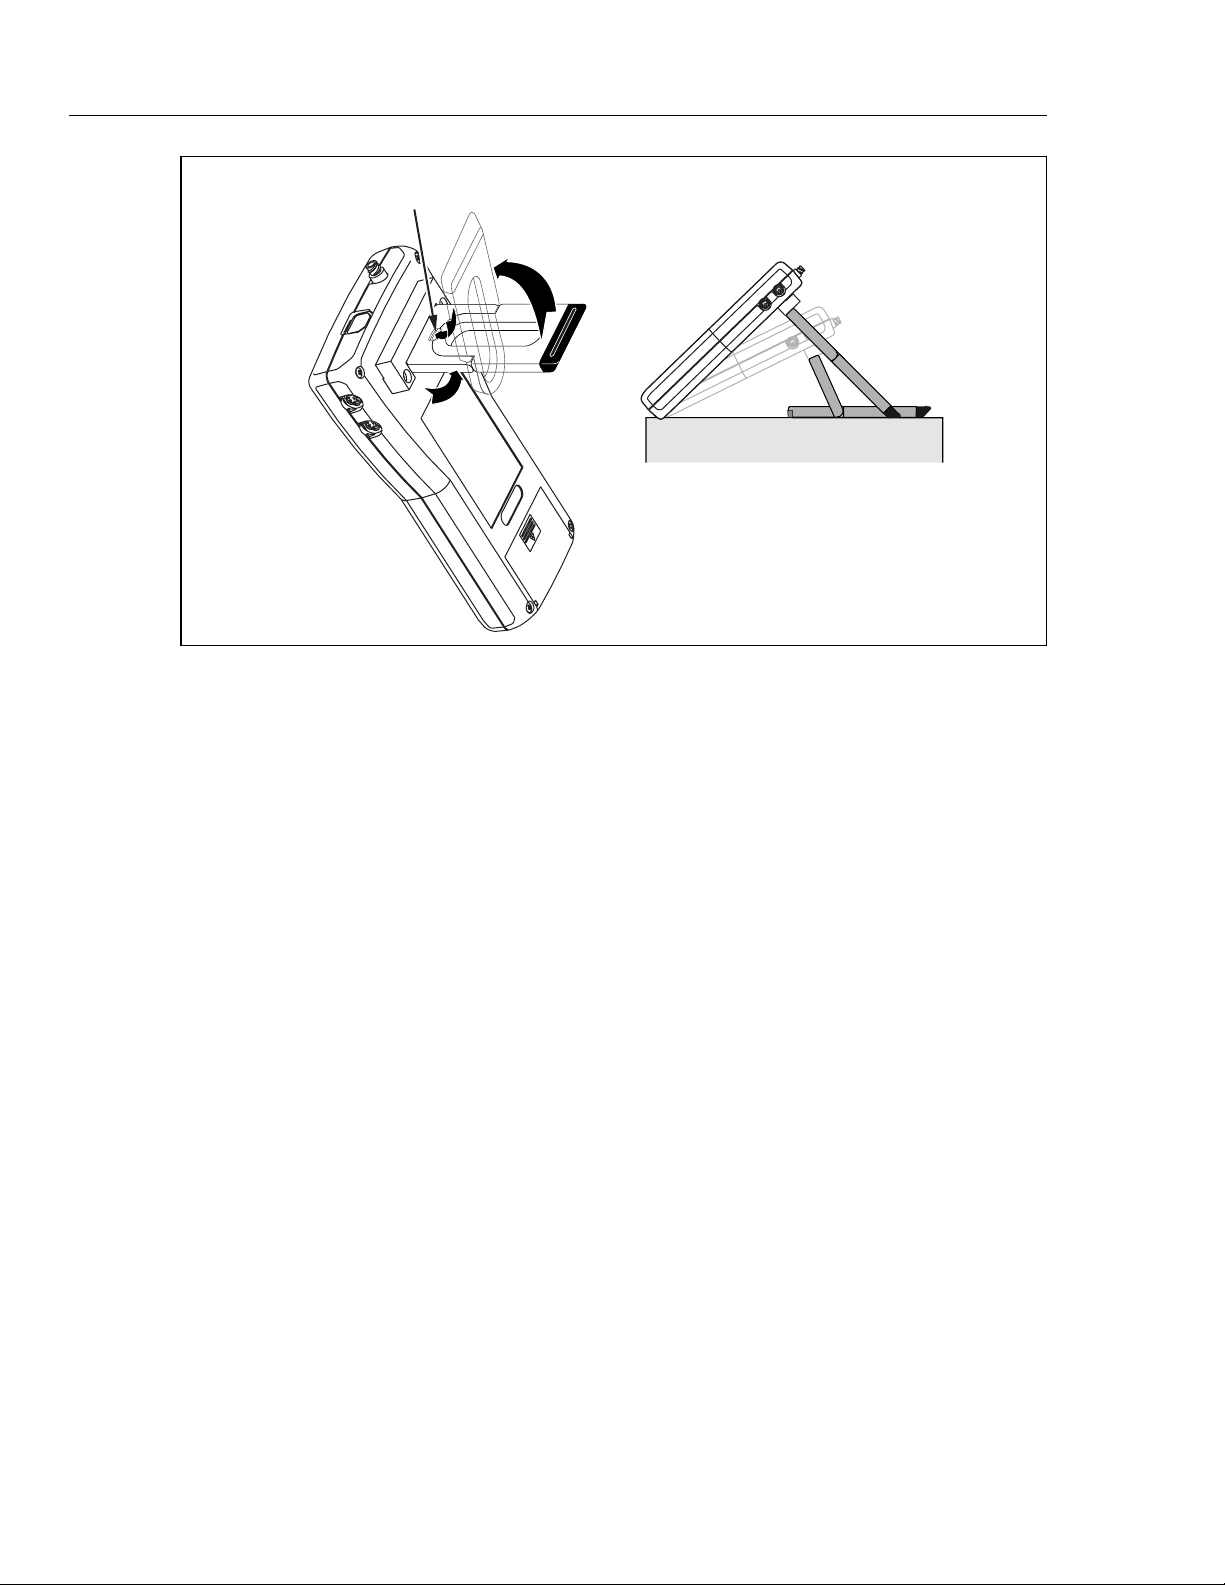
Using the Tilt Bail
As shown in Figure 2-2, you can use the Analyzer in flat or elevated positions. Do not
use the Analyzer by hand or during transport.
2-3
Page 18
VT MOBILE
Operators Manual
RELEASE
HERE
Figure 2-2. VT MOBILE Tilt Bail
edg21f.eps
Using the Keys
Press each key firmly; the Analyzer responds to a recognized key press with a beep.
Generally, you can exit one function by selecting another function. Press the B and
C navigation keys to cycle through multiple functions accessed from one key.
Relevant functions for the two softkeys (F and G) appear in the display
immediately above these keys. When text entry is necessary, quickly press a key to cycle
through the characters it accesses. Pause to accept the present character and move to the
next entry. Think of text entry as text messaging, as you would encounter on a cell phone.
Note
If the Zero warning screen appears at any time, follow on-screen directions
G
and then press
; the interrupted function will continue automatically
after the zeroing procedure.
Selecting the Operating Mode
Local Mode is the default setting upon powering up the Analyzer. In Local Mode, select
functions by pressing keys on the front panel.
To change modes from Local to Remote, first connect the serial cable to both the PC and
the miniature RS-232 serial port on the Analyzer. Launch VT for Windows software
(version 2.01.00 or higher) to activate Remote Mode.
If VT for Windows has remote control, the following appears on the Analyzer display
screen:
2-4
No Graphics Available, While Communications Are Active
Normal local key presses have no effect. Press G (Cancel) to regain local control.
Page 19

Preparing for Operation
Setting Up
Setting Up
Press D to access Analyzer settings. (Press G to return to the measurement screen.)
Selecting the Gas Type
Ensure that you have selected the gas or gas mixture you will be using, as the gas density
will be different for each gas type and mixture. The Analyzer uses this information to
improve the accuracy of the flow calculations. Failure to enter the correct value will
cause the flow and volume calculations to be in error.
2
Select the gas type by pressing
D Æ E Æ E Æ B or C Æ E.
Available selections are: Air, O2, Heliox, CO2, N2, N2O, N2O/O2 (N2O balance O2),
He/O2 (He balance O2), N2/O2 (N2 balance O2), and User. Refer to Table 2-3 for
descriptions of gas types. Only the VT for Windows software can identify a ‘User’ gas.
Table 2-3. Gas Types
Gas Description
Air Standard room air
O2 100% Oxygen
Heliox 30% Oxygen and 70% Helium blend
CO2 100% Carbon Dioxide
N2 100% Nitrogen
N2O 100% Nitrous Oxide
N20 bal O2 Measured Oxygen balance Nitrous Oxide
He bal O2 Measured Oxygen balance Helium
N2 bal O2 Measured Oxygen balance Nitrogen
User User selects custom gas mixture. This option requires the VT for Windows PC software.
Gas Temperature and Relative Humidity
These parameters are not really settings, but are available when the optional Temperature
and Relative Humidity Sensor is connected. The Analyzer measures the gas flowing
through the sensor and uses this information to improve the accuracy of the flow
measurements. All temperatures are in degrees Celsius.
Selecting the Correction Mode
This setting calculates the flow volume of the air flowing through the high or low-flow
ports. Ensure that the correction mode setting matches the one used by the ventilator or
anesthesia machine manufacturer for their display of flow and volume measurements. If
the correction mode is unknown, select “ATP” (Ambient Temperature and Pressure).
Refer to Table 2-4 for descriptions of the correction modes.
The Analyzer can operate with a correction mode of ATP, STPD
, BTPS, or STPD0.
21
Select the mode as follows:
1. Press
D Æ E Æ C (to ‘Corr Mode’)
2. Press E Æ C (to select mode)
3. Press E to activate your selection.
2-5
Page 20

VT MOBILE
Operators Manual
Mode Name Description
Table 2-4. Correction Modes
ATP Ambient Temperature
and Pressure
BTPS Body Temperature and
Pressure Saturated
with water vapor
STPD0 Standard Temperature
and Pressure Dry,
0 °C
STPD21 Standard Temperature
and Pressure Dry,
21 °C
The Analyzer corrects the flow rate (and therefore, volume) such that the
reported flow equals the flow if the gas temperature and pressure are at
ambient (room) temperature and pressure.
The Analyzer corrects the flow rate (and therefore, volume) such that the
reported flow equals the flow if the gas temperature and pressure were
changed to body conditions (37 °C and ambient pressure). Further, the
Analyzer compensates the flow to add the amount of water vapor as if to
make the gas fully saturated (i.e. 100% relative humidity). In this
correction, the Analyzer uses the relative humidity reading to determine
the amount of water vapor that would need to be added.
The Analyzer corrects the flow rate (and therefore, volume) such that the
reported flow equals the flow if the gas temperature and pressure were
changed to standard conditions (0 °C and 760 mmHg). Further, the
Analyzer compensates the flow to subtract the amount of water vapor as
if the gas was dry (i.e. 0% relative humidity). In this correction, the
Analyzer uses the relative humidity reading to determine the amount of
water vapor that would need to be subtracted.
The Analyzer corrects the flow rate (and therefore, volume) such that the
reported flow equals the flow if the gas temperature and pressure were
changed to standard conditions (21°C and 760 mmHg). Further, the
Analyzer compensates the flow to subtract the amount of water vapor as
if the gas was dry (i.e. 0% relative humidity). In this correction, the
Analyzer uses the relative humidity reading to determine the amount of
water vapor that would need to be subtracted.
Setting the Breath Detect Threshold
The Analyzer breath detection algorithm uses a flow rate threshold that the inspiratory
flow must cross to trigger a change in the breath phase. Higher flow rate thresholds yield
less sensitive breath detection. Lower thresholds yield more sensitive breath detection.
The default setting of 2.00 lpm is usually appropriate for the ventilators and anesthesia
machines being tested. This setting tells the Analyzer how to divide the delivered flow
into breaths. If necessary, adjust the Breath Detect Threshold up or down until the breath
rate reported on the Analyzer Timing display matches the ventilator breath rate.
Set the threshold as follows:
1. Press
D Æ E Æ C (to ‘BD Thresh’).
2. Press E Æ C or B (to change threshold in increments of 0.25). You can
also use text entry to enter a new value directly.
3. Press E to activate your selection.
Setting Zero Warn ON or OFF
You need to "zero" (or calibrate) the pressure and differential pressure (flow) sensors in
the Analyzer to a zero reference. This “zero” reminder function can be set to occur
automatically at pre-determined intervals or only when you request the function by
pressing R. The Zero Warn is helpful in reminding you to stop and zero the
transducers from time-to-time during operation. This is especially important during the
40-minute warm-up to full stability. The Analyzer does not calculate breath parameters
for any breath in which a zero occurs. For this reason, it may be desirable to turn off
automatic zeroing for a short while during a critical test.
2-6
Page 21

Preparing for Operation
Setting Up
The Analyzer Zero Warn is set to ON at the factory to remind you to zero out any offset
in the Flow measurements. The Zero Warn screen reminds you at power on, after the first
five minutes, and then after each 30-minute period. After the power-on zero warning, you
can choose to Zero or Cancel when the reminder appears; either action returns the
Analyzer to the same function.
W Caution
Setting Zero Warn to OFF may result in introduction of offset
into the Flow and Volume measurements and cause errors in
the assessment of those measurements against the medical
device under test specification. Fluke Biomedical strongly
recommends that you leave Zero Warn ON.
Turn this warning on or off using the following procedure:
2
1. Press
2. Press E Æ C (to select ON or OFF).
3. Press E to activate your selection.
Setting the Time
You can set hours and minutes. Enter the time in the HHMM or HMM format, where HH
or H is the hours in 12-hour format and MM is the minutes (00 through 59).
To set the time, follow these steps:
1. Press
2. Enter the hour (HH or H) with the text entry keys.
3. Press G.
3. Enter the minutes (MM) with the text entry keys.
4. Press F to select P (PM) or A (AM).
5. Press E.
Setting the Date
To set the date, follow these steps:
1. Press
D Æ C Æ E Æ C Æ E to access the time setting screen.
D Æ CÆEÆ E to access the date setting screen.
D Æ E Æ C (to ‘Zero Warn’).
2. Enter the month (MM) or day (DD), depending on the date format, with the text entry
keys.
3. Press G.
4. Enter the day (DD) or month (MM) with the text entry keys.
5. Press G.
6. Enter the year (YYYY) with the text entry keys.
7. Press E.
The Analyzer displays the date with the following information:
• MM is the number between 1 and 12 corresponding to the month.
• DD is the number between 1 and 31 corresponding to the day of the month.
• YYYY is the year.
2-7
Page 22

VT MOBILE
Operators Manual
Selecting the Date Format
The Analyzer uses either of the following date formats:
• M/D/Y
• D/M/Y
To change the format, follow these steps:
1. Press
2. Press C or C to select ‘M/D/Y’ or ‘D/M/Y’.
3. Press E to activate your choice.
4. Press G to return to the active display screen.
Setting the Contrast
Use the following procedure to change the screen contrast:
1. Press
2. Highlight Contrast by scrolling down with C.
3. Press E and adjust the contrast in either of the following ways:
Checking Version and Serial Numbers
Press
D Æ C Æ E Æ C Æ C Æ E
A Æ C Æ E.
• Press B or C to increment or decrement the contrast in steps of 10.
• Enter any contrast value directly using the text entry keys.
D Æ C Æ C Æ E to check the version and serial numbers.
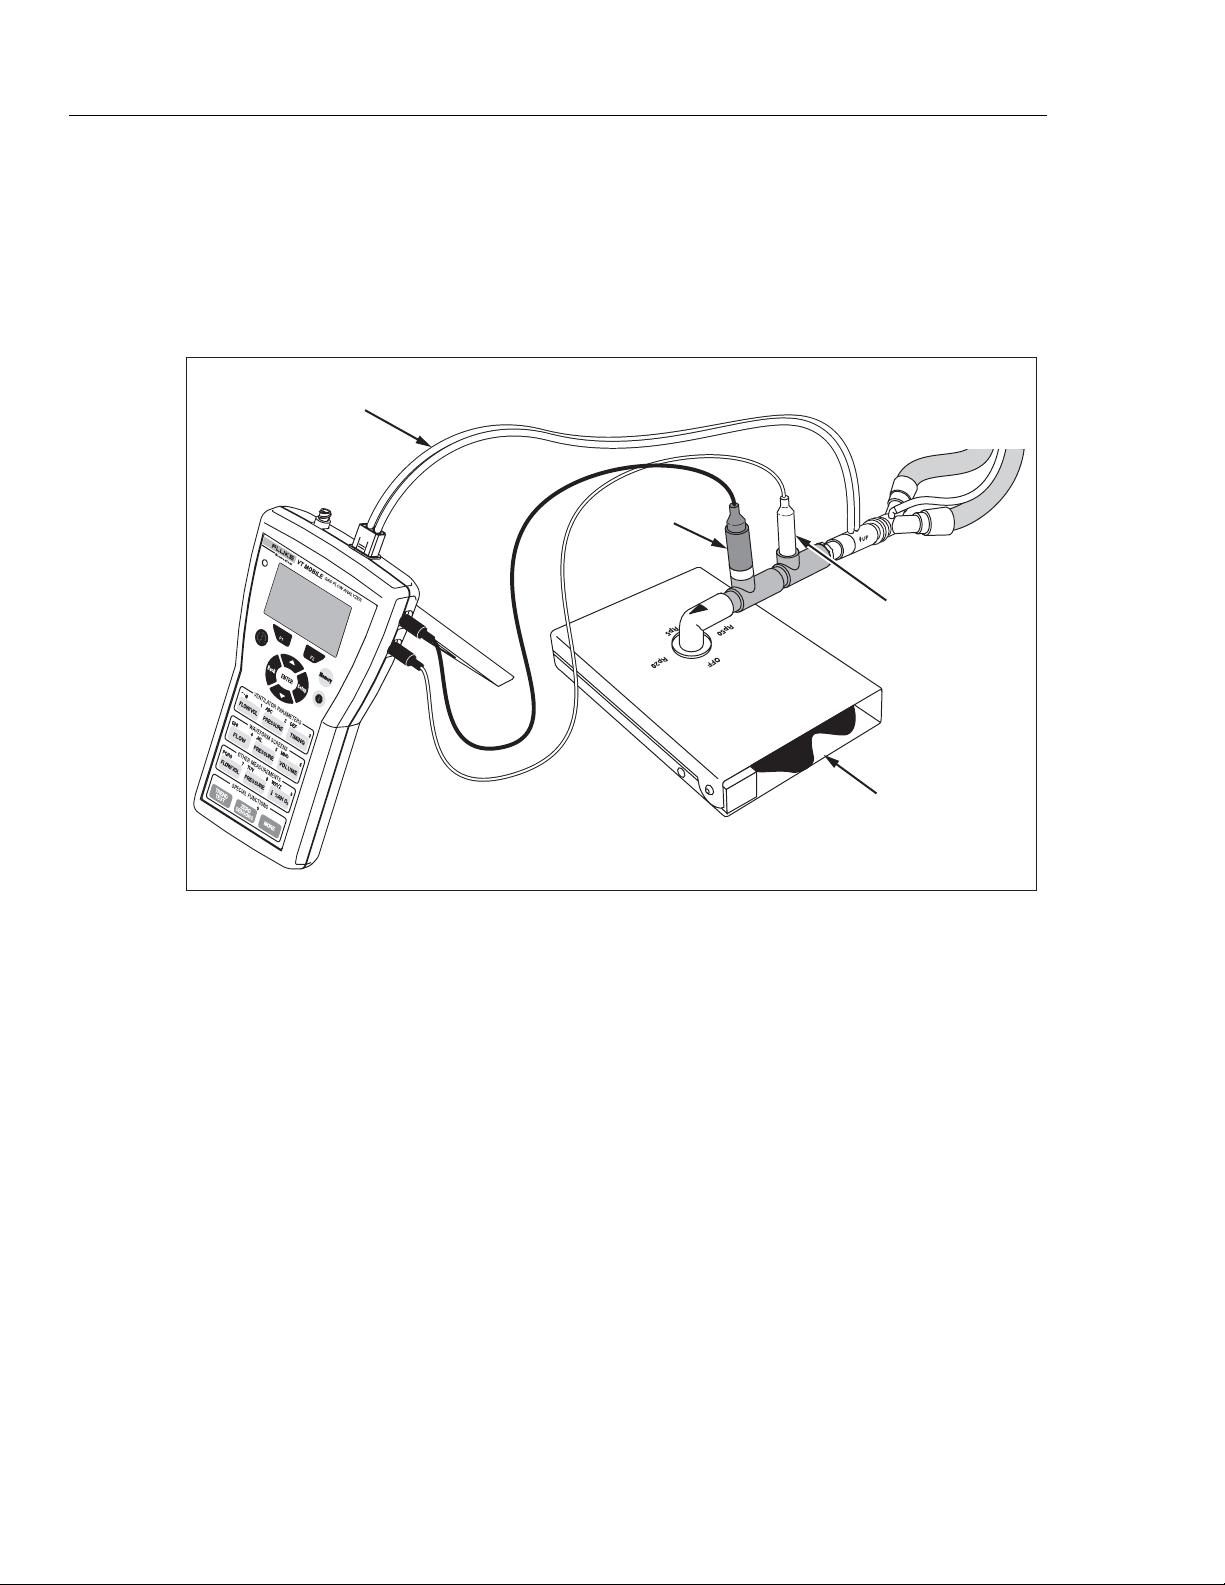
Connecting the Analyzer
Connect the Analyzer for flow and pressure measurements as shown in Figures 2-3 and
2-4.
2-8
Figure 2-3. Low-Pressure/High-Flow/Low-Flow Connection
edg23f.eps
Page 23
Preparing for Operation
Connecting the Analyzer
Figure 2-4. High-Pressure Connection
High-Flow Connection
The High-Flow Sensor connects to the flow/low-pressure port on the top of the Analyzer.
Connect the High-Flow Sensor in line using adapters from the Accessory Kit.
W Caution
Do not exceed a flow of 200 lpm through the high-flow port.
Damage to the Analyzer could otherwise result.
2
edg22f.eps
Measure only dry gases using the high-flow port. Do not use
this port to measure exhaled or artificially humidified gases.
Low-Flow Connection
The Low-Flow Sensor connects to the flow/low-pressure port on the top of the Analyzer.
Connect the Low-Flow Sensor in line using adapters from the Accessory Kit.
Do not exceed a flow of 35 lpm through the low-flow port.
Damage to the Analyzer could otherwise result.
Measure only dry gases using the low-flow port. Do not use this
port to measure exhaled or artificially humidified gases.
High-Pressure Connection
The High-Pressure Adapter connects to the high-pressure port on the top of the Analyzer.
The connector mates to standard oxygen DISS fittings as used on oxygen supply hoses.
Connectors are available with male or female fittings. Do not apply fluid to the highpressure port.
Do not exceed a pressure of 125 psi at the high-pressure port.
Damage to the Analyzer could otherwise result.
W Caution
W Caution
Low-Pressure Connection
The Low-Pressure Adapter connects to the flow/low-pressure port on the top of the
Analyzer. Do not apply fluid to the low-pressure port.
2-9
Page 24
VT MOBILE
Operators Manual
Ventilator Test Connections
W Caution
Do not exceed a pressure of 5 psi at the low-pressure port.
Damage to the Analyzer could otherwise result.
Ventilator testing involves multiple connections as shown in Figure 2-5.
High Flow Sensor
Oxygen
Sensor
Figure 2-5. Ventilator Test Connections
To
Ventilator
Temp./RH Sensor
Fluke Biomedical
ACCU LUNG
ede06f.eps
2-10
Page 25
Using the VT MOBILE
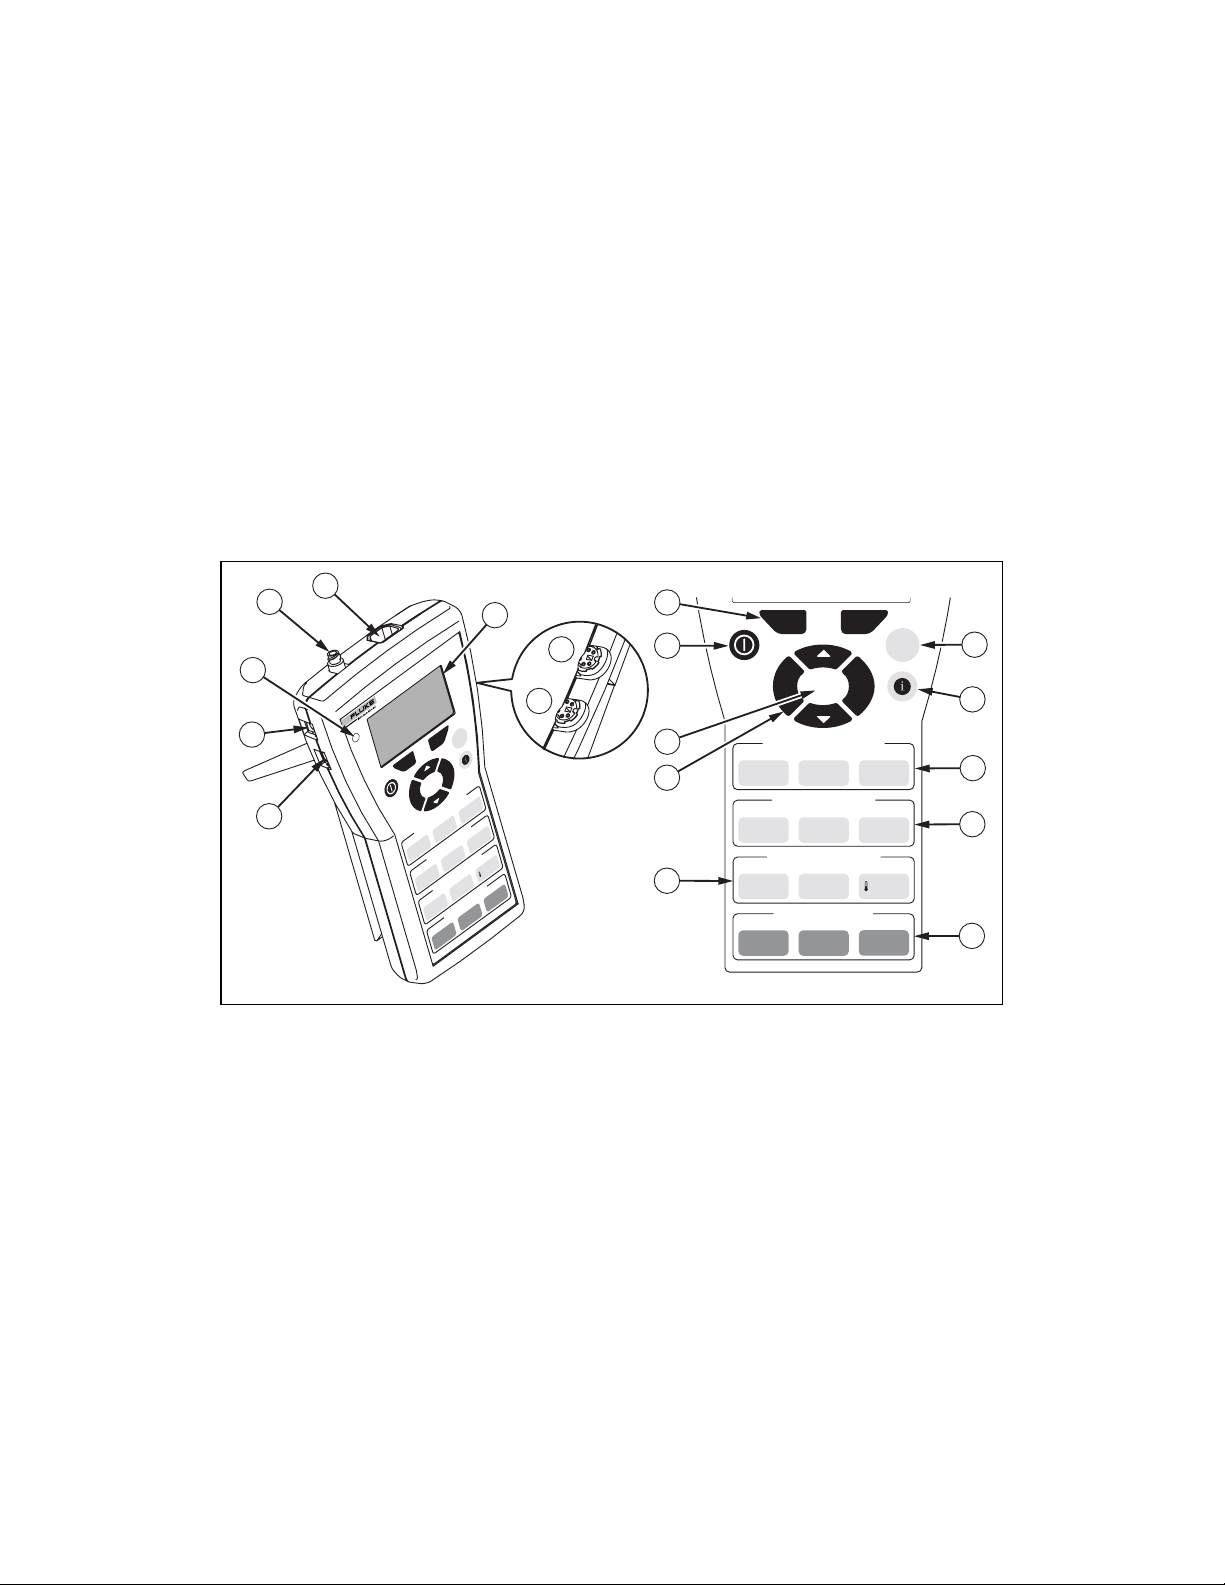
Understanding the Controls and Indicators
Figure 3-1 and Table 3-1 describe the controls and indicators.
5
4
6
7
3
2
1
VT MOBILEVT MOBILE
GAS FLOW ANALYZERGAS FLOW ANALYZER
F1 F2
ENTER
Back
1122ABCABC
VENTILATOR PARAMETERS
PRESSURE
,
,
_
_
@
@
/VOL
FLOW
WAVEFORM SCREENS
44
GHIGHI
FLOW
OTHER MEASUREMENTS
PQRSPQRS
FLOW/VOL
TREND
MemoryMemory
Setup
DEFDEF
TIMING
MNOMNO
55
JKLJKL
PRESSURE
TUVTUV
77
PRESSURE
SPECIAL FUNCTIONS
ZERO
SENSORS
TEST
VOLUME
WXYZWXYZ
88
8
33
66
99
2
O
RH
%
00
MORE
18
17
16
15
9
F1 F2
Back
VENTILATOR PARAMETERS
_
, @_ , @ 1122ABCABC
FLOW/VOL
WAVEFORM SCREENS
OTHER MEASUREMENTS
FLOW/VOL
SPECIAL FUNCTIONS
TREND
TEST
Setup
ENTER
PRESSURE
PRESSURE
TUVTUV77PQRSPQRS 99WXYZWXYZ
TIMING
55JKLJKL44GHIGHI 66MNOMNO
VOLUMEFLOW
88
PRESSURE
00
ZERO
SENSORS
MORE
Chapter 3
MemoryMemory
%RH O
33DEFDEF
2
10
11
12
13
14
ede01f.eps
Figure 3-1. Controls and Indicators
3-1
Page 26

VT MOBILE
Operators Manual
No. Name Description/Use
Table 3-1. Controls and Indicators
A
B
C
D
E
F
G
H
I
Miniature RS-232 Serial
Port
Battery Eliminator
Connector
Battery Eliminator
Indicator
High-Pressure Connector Connect the High-Pressure Adapter here. The Analyzer makes
Flow and Low-Pressure
Connector
Display Screen Shows measurement parameters and statistics (Min, Avg, and
Oxygen Sensor Connector Connect the Oxygen Sensor here. The Analyzer makes O2
Temperature, RH Sensor
Connector
Softkeys
F G
Connect the RS-232 cable here (for use with VT for Windows
software.)
Connect the battery eliminator here. Use the battery eliminator
whenever possible.
Glows green when the battery eliminator is supplying power to the
Analyzer. Note that this power source cannot recharge the
battery.
high-pressure measurements from -2 to 100 psi.
Insert one of three coded modular connectors here; the Analyzer
automatically detects the connector type. The Analyzer use the
High-Flow Sensor to measure up to ± 150 lpm, the Low-Flow
Sensor to measure up to ± 25 lpm, or the Low-Pressure Adapter
to measure from -20 to 120 cmH2O.
Max), waveforms, and setup selections. English only.
measurements from 0 to 100%.
Connect the optional Temperature and Relative Humidity Sensor
here.
Use F and G to access selections identified on the screen
immediately above these keys.
J
K
L
Memory Key
J
Help Key
I
Ventilator Parameters
Keys
K L M
Press J to save, view, or delete memory files. A memory file
contains data to reconstruct all aspects of a stored screen
(reading, statistics, waveform, parameters, etc.)
Press I to access context-sensitive help. If necessary, press
B or C to scroll through additional text. Press
the previous screen.
Press K
parameters. When text entry is required, press K successively
to cycle through 1 Æ - Æ @. Press L to cycle through A Æ B
Æ C Æ 2, and press M to cycle through D Æ E Æ F Æ 3.
, L, or M to display ventilator measurement
A to return to
3-2
Page 27

Using the VT MOBILE
Understanding the Controls and Indicators
Table 3-1. Controls and Indicators (cont.)
No. Name Description/Use
3
M
N
O
P
Q
R
Waveform Screens Keys
N L O
Other Measurements Keys
K L P
Special Functions Keys
Q R S
Navigation Keys
A B C D
Enter Key
E
Power Key
H
Press N, L
For any waveform, press F (Rescale) to optimize the
display or press G (Units) to select new units of
measurement. When text entry is required, press N
successively to cycle through G Æ H Æ I Æ 4. Press L to
cycle through J Æ K Æ L Æ 5, and press O to cycle
through M Æ N Æ O Æ 6.
Press K to access direct readings and statistics of flow
and volume. Press L for readings and statistics of high or
low pressure. Repeated presses of P yield readings of
O2 %, temperature, and relative humidity. When text entry is
required, press K successively to cycle through P Æ Q Æ
R Æ S Æ 7. Press L to cycle through T Æ U Æ V Æ 8,
and press P to cycle through W Æ X Æ Y Æ Z Æ 9.
Press Q to start new or review old trending data. Press
R at any time to initiate the zeroing procedure or, when
keypad entry is required, to enter 0. Press S to access
barometric pressure and battery readings.
Press
A to exit specific screens (Setup, Memory, Help,
More, etc.)
Press B or C to cycle through specific screen
selections (Setup, Memory, More, etc.) or to scroll through
help text. Press
Correction Mode, Breath Detect Threshold, Zero Warning,
Date, Time, and version numbers.)
Press E to activate a menu selection.
Press and briefly hold this key to power on or power off the
Analyzer.
, or O to display specific waveforms.
D to access system settings (Gas Type,
3-3
Page 28

VT MOBILE
Operators Manual
Screens
Ventilator Parameters Screens
The Analyzer calculates 16 parameters for every breath. You can display all parameters
individually or most parameters in groups of four. Parameters update following every
breath. Units of measure for breath parameters are fixed. Table 3-2 shows parameters and
groupings, along with abbreviations and units of measurement.
Table 3-2. Ventilator Parameters
Parameter Units
Inspiratory and Expiratory Tidal Volume (VT) ml
Expiratory Minute Volume (MV) lpm
Peak Inspiratory Flow (PIF) lpm
Peak Expiratory Flow (PEF) lpm
Peak Inspiratory Pressure (PIP) cmH2O
Positive-End Expiratory Pressure (PEEP) cmH2O
Mean Airway Pressure (MAP) cmH2O
Inspiratory Pause Pressure (IPP) cmH2O
Breath Rate (Rate) bpm
Inspiratory Time (Ti) s
Expiratory Time (Te) s
Inspiratory, Expiratory Time (I:E) Ratio s:s
Oxygen Concentration % O2
Temperature (optional) °C (selectable)
Relative Humidity (optional) % RH
Barometric Pressure mmHg (selectable)
3-4
Page 29
Using the VT MOBILE
Screens
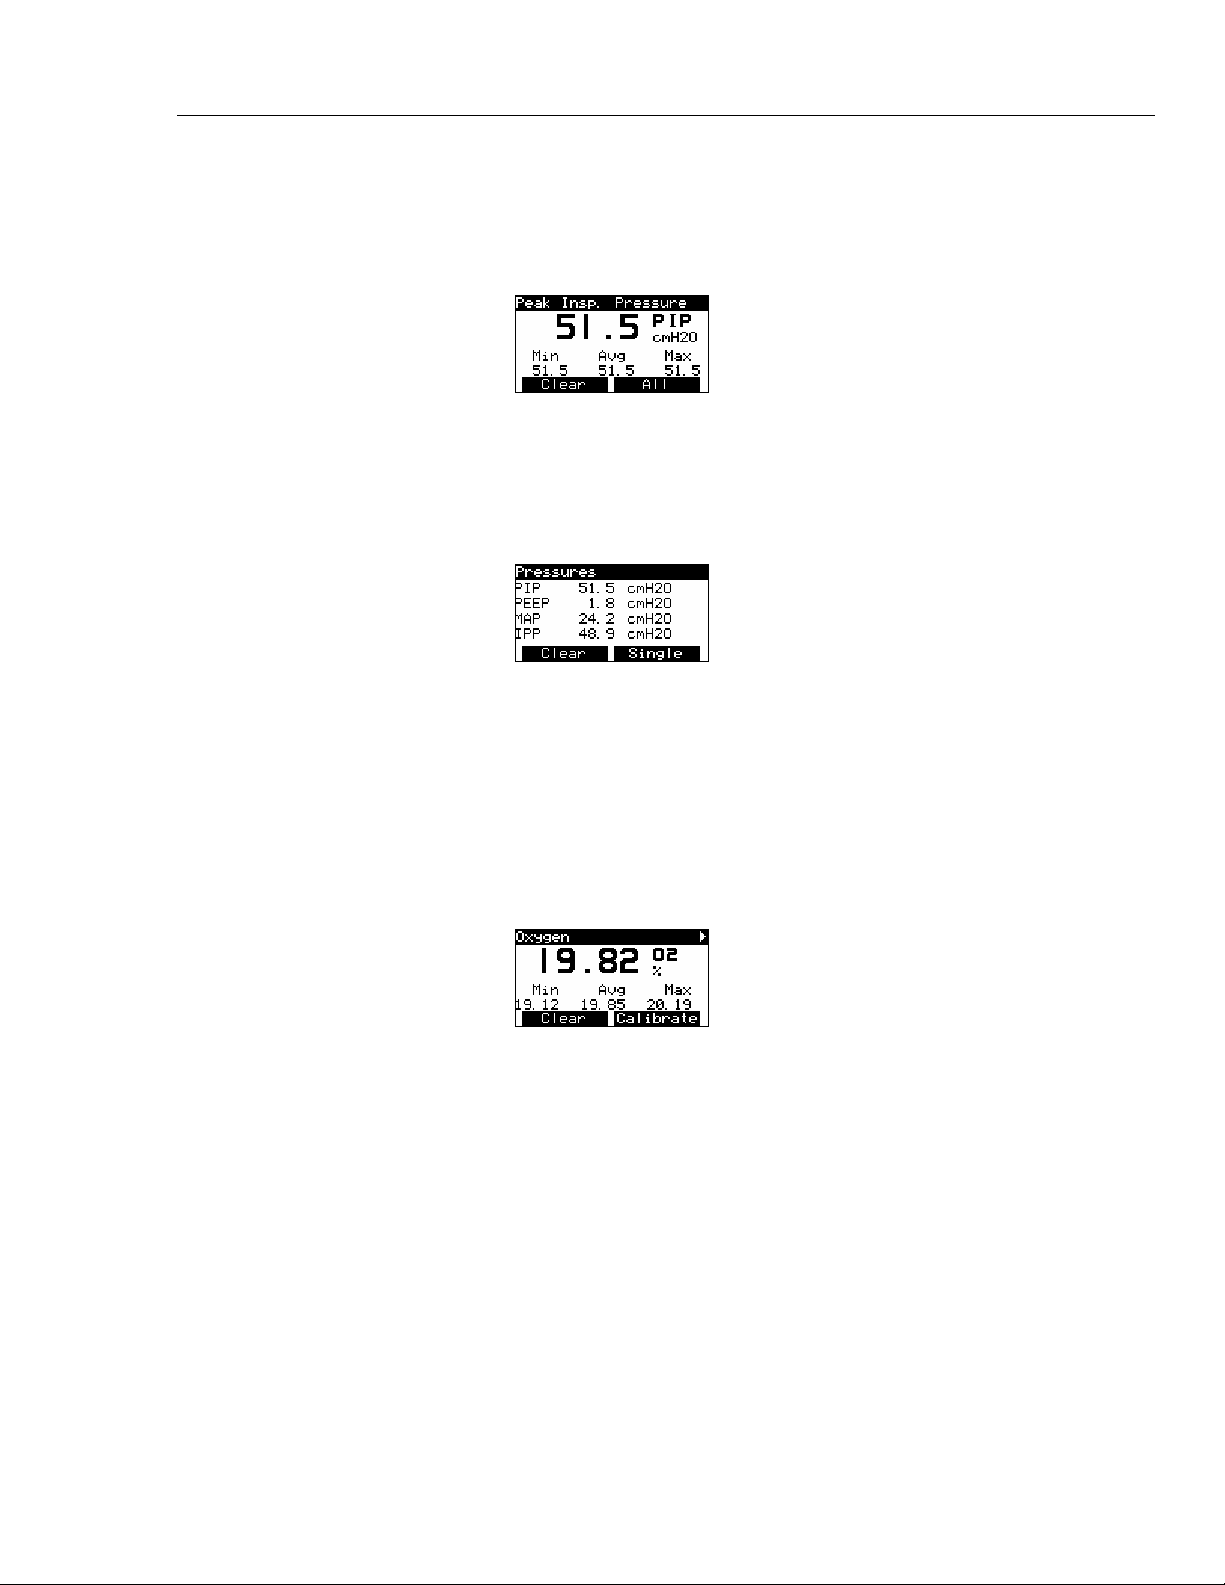
Viewing a Single Parameter
To view single parameters, press K, L, or M repeatedly. If you are already
viewing a multi-parameter screen, press G (Single). The following is an example of
the PIP single parameter screen:
3
Viewing a Group of Parameters
From an individual parameter screen, press G (All) to display the related screen of
four parameters. The groups are Pressures, Vol/Flow, and Timing. The following is an
example of the Pressures multi-parameter screen:
Viewing All Parameters
You can view all 16 parameters on one screen when using the Analyzer connected to a
PC running the VT for Windows software.
Oxygen Screen
Press P to access the Oxygen Screen. The sample oxygen screen shown below
displays the signal and statistics for the oxygen sensor.
ede26s.bmp
ede27s.bmp
ede28s.bmp
Press F (Clear) to reset the statistics and start a new reading.
Press G (Calibrate) to begin the calibration routine for the oxygen sensor; you will
find complete instructions later in this chapter.
3-5
Page 30

VT MOBILE
Operators Manual
Temperature Screen
Press P as required to access the Temperature Screen (available when the optional
Temperature and Relative Humidity Sensor is connected.) The sample temperature screen
shown below represents the gas temperature as measured in series with the High-Flow or
Low-Flow Sensor.
Relative Humidity Screen
Press P as required to access the Relative Humidity Screen (available when the
optional Temperature and Relative Humidity Sensor is connected.) The sample relative
humidity screen shown below represents the gas relative humidity as measured in series
with the High-Flow or Low-Flow Sensor.
Barometric Pressure Screen
Press S Æ E to access the Barometric Pressure Screen. The Analyzer
continuously measures the barometric pressure using an internal sensor. A sample
barometric pressure screen follows:
ede29s.bmp
ede30s.bmp
ede31s.bmp
3-6
Waveform Screens
You can access waveform representations of the reading by pressing keys in the
WAVEFORM SCREENS section of the keypad. The Analyzer provides Flow, Pressure
(high, low, and airway), and Volume waveform screens.
Page 31

Using the VT MOBILE
Screens
Flow Screen
Press N to access the Flow Waveform Screen, which displays the reading and
waveform for flow in the flow/low-pressure port of the Analyzer. The Analyzer
automatically detects whether the High- or Low-Flow Sensor is connected. A sample
flow waveform screen appears below:
3
Press G to change the units of measure for the flow screen. Possible units of measure
for this screen include:
• LPM: Liters per minute
• CFM: Cubic feet per minute
• LPS: Liters per second
• mL/min: Milliliters per minute
• mL/sec: Milliliters per second
Press F to change the scale on the plot of data to a more appropriate window of
values.
Rescale uses the current Min/Max values to determine plot limits.
Pressure Screen
Press L as required to access the Pressure Screen, which displays the reading and
waveform for the pressure signal from the high-pressure or low-pressure/flow port. In
order, sample high-pressure and low-pressure screens appear below:
Note
ede32s.bmp
ede33s.bmp
ede34s.bmp
3-7
Page 32

VT MOBILE
Operators Manual
Press G to change the units of measure for the pressure screen. Possible units of
measure for this screen include:
• mbar: millibar = .001 Bar
• bar: 14.7 PSIG (Barometric)
• mmHg: millimeters of mercury
• inHg: inches of mercury
• cmH
• inH
O: centimeters of water
2
O: inches of water
2
• PSIG: pounds per square inch
• atm: atmospheres
• kPa: kilopascals
Press F (Rescale) to change the scale on the plot of data to a more appropriate
window of values.
Note
Rescale uses the current Min/Max values to determine plot limits.
Airway Pressure Screen
Press L as required to access the Airway Pressure Screen (Paw), which displays the
reading and waveform measured in the high- or low-flow port with the Analyzer
connected between a ventilator and a test lung. The following is a sample Airway
Pressure Screen:
Volume Screen
Press O to access the Volume Screen. The volume screen displays the reading and
waveform for the volume signal. The volume signal is the integral of the flow signal. A
sample volume screen appears below:
Press G (Units) to change the units of measure for the volume screen. Possible units
of measure for this screen include:
ede35s.bmp
ede36s.bmp
3-8
• Liters Liters
• mL Milliliters
• CF Cubic Feet
Page 33

Using the VT MOBILE
Screens
Press F (Rescale) to change the scale on the plot of data to a more appropriate
window of values.
Note
Rescale uses the current Min/Max values to determine plot limits.
Other Measurements Screens
The Flow, Volume, and Pressure screens display the reading at the top of the screen and
the minimum, maximum, and average of the readings at the bottom of the screen. The
Analyzer calculates these statistics continually until you select a new screen or press
F (Clear).
Flow Screen
Press K as required to access the Flow Screen, which displays the reading and
statistics for flow in the flow/low-pressure port of the Analyzer. The Analyzer
automatically detects whether the high- or low-flow sensor is connected. A sample flow
screen appears below:
3
Press G (Units) to change the units of measure for the flow screen. Possible units of
measure for this screen include:
• LPM – Liters per minute
• CFM – Cubic feet per minute
• LPS – Liters per second
• mL/min – Milliliters per minute
• mL/sec – Milliliters per second
Press F (Clear) to reset the statistics and start a new reading.
Volume Screen
Press K as required to access the Volume Screen, which displays the reading and
statistics for the volume signal. The volume signal is the integral of the flow signal. A
sample Volume Screen appears below:
ede37s.bmp
ede38s.bmp
3-9
Page 34

VT MOBILE
Operators Manual
Pressure Screen
Press G (Units) to change the units of measure for the Volume Screen. Possible units
of measure for this screen include:
• Liters Liters
• mL Milliliters
• CF Cubic Feet
Press F (Clear) to reset the statistics and start a new reading.
Press L to access the Pressure Screen, which displays the reading and statistics for the
pressure signal from the high-pressure or low-pressure/flow port. A sample Pressure
Screen appears below:
Press G (Units) to change the units of measure for the Pressure Screen. Possible units
of measure for this screen include:
• PSIG – Pounds per square inch gauge
• kPa – Kilopascals
• bar – 14.7 PSIG
• mbar – millibar = .001 Bar
• atm – Atmosphere
• inH
0 – Inches of water
2
• inHg – Inches of mercury
• cmH
0 – Centimeters of water
2
• mmHg – Millimeters of mercury
Special Functions Screens
Access the Trend Test, Zero Sensors, Barometric Pressure, and Battery screens with the
keys at the bottom of the keypad.
ede39s.bmp
3-10
Page 35

Using the VT MOBILE
Screens
Trend Test Screens
Press Q to access the Trend Test screens, which allow you to record instances (or
events) of a selected ventilator parameter falling outside limits that you establish. The
opening screen in the trend test setup sequence appears below:
3
Zero Sensors Screens
Press R to access the Zero Sensors screens, which allow you to clear the offset
resulting from drift inherent in the differential pressure transducer. The opening screen in
the zero sensors sequence appears below:
This screen also appears automatically at a set interval to remind you to zero the sensors
if Zero Warn is set to ON in the setup procedure.
More Key Screens
Barometric Pressure Screen
Press S Æ E to access the opening Barometric Pressure Screen, which allows
you to view or change the barometric pressure that is automatically measured by an
internal sensor. Under normal operating conditions, barometric pressure should not need
adjustment. The following is a sample of the opening Barometric Pressure Screen:
ede40s.bmp
ede41s.bmp
Battery Screen
ede31s.bmp
Press S Æ C Æ E to access the Battery Screen, which allows you to view the
battery level. A sample of the 9-volt battery reading (when the battery eliminator is not
connected) appears below:
ede43s.bmp
If the battery eliminator is connected, this screen shows approximately 12 volts.
3-11
Page 36

VT MOBILE
Operators Manual
Using Trend Test
Use Trend Test to examine a single breath parameter over an extended period. The
Analyzer checks the parameter for deviations beyond the limits that you set. Set the limits
in the units you are measuring.
Fluke Biomedical recommends that you disable the Zero Warn feature for the duration of
your trend test. Zero warnings would otherwise interrupt the collection of events. Disable
Zero Warn by pressing
A Æ E Æ C Æ C Æ C Æ E Æ C (to Off)
Æ E Æ G.
Use the following steps to advance through the trend test procedure:
1. Press Q to begin the Trend Test setup.
ede45s.bmp
2. Press F (New) to begin a new trend test.
ede44s.bmp
3. Press B or C to select the trend parameter for the test (VT, MV, PIF, PEF, Rate,
Ti, Te, PIP, PEEP, MAP, or IPP.)
4. Press E to activate the parameter selection.
ede40s.bmp
5. Press F (Low) and then set the low limit by either:
3-12
a. Pressing B or C to increment or decrement the displayed value 0.1 units at
a time, or
b. Using the text entry keys to enter a new value directly.
6. Press E to accept this value.
7. Press G to enter the High limit, and repeat the entry procedure.
Page 37

Using the VT MOBILE
Using Trend Test
8. When both Low and High limit values are correct, press E again to advance to
the Start Trend Test screen.
3
ede46s.bmp
9. Before starting the test, ensure that the ventilator is on, has reached steady-state
conditions, and that the displayed breath parameter is as expected. Press G (Start)
to begin the test.
10. The Analyzer displays the Trend Test screen while the trend test is in progress. The
trend test screen shows the parameter being tested, the current value, the upper and
lower limits, and the number of events (readings falling outside the limits.)
ede47s.bmp
11. To terminate the test, press G (Stop). The Trend Summary screen appears. If there
are no events, the Trend Summary screen is not available.
ede48s.bmp
ede49s.bmp
12. Alternatively, press G (More) to display related parameters.
ede50s.bmp
3-13
Page 38

VT MOBILE
Operators Manual
Making Measurements
Working with Memory
This Operators Manual covers specific measurement procedures in the following
chapters:
• Chapter 4: Checking Ventilator Parameters. Learn how to set up and take
measurements for the 16 ventilator parameters.
• Chapter 5: Measuring Pressure. Learn how to set up and take pressure measurements
using the High- and Low-Pressure adapters.
• Chapter 6: Measuring Flow and Volume. Learn how to set up and take flow and
volume measurements using the High- and Low-Flow sensors.
Access Analyzer memory by pressing J. The following screen appears:
Press C or B to highlight an item, and then press E to make the selection.
Store all existing readings by selecting Save New File. The Analyzer prompts you for a
file name to Save As; use the text entry keys to enter a name. Then press E and wait
for a moment while the Analyzer stores the readings to this file.
Retrieve an existing file by selecting View File, scrolling to the file name, and then
pressing E. You can view the DEMO file in this fashion; it provides sample data for
all possible measurements.
Delete a single file by selecting Delete File, scrolling to the file to delete, and pressing
E.
Delete all files by pressing Delete All and then pressing E.
Printing
Print data from the Analyzer using a PC running VT for Windows. This software also
allows you to view all 16 ventilator parameters on one screen and manipulate and graph
data.
Making a Measurement More Accurate
Warm-up and Zeroing
The Analyzer requires a warm-up period. A five-minute warm-up followed by a zero and
immediate measurement is adequate for most applications. A 40-minute warm-up ensures
maximum accuracy and stability.
ede51s.bmp
3-14
The Zero Warn feature reminds you to zero the transducers at predefined intervals. Fluke
Biomedical strongly recommends that you leave Zero Warn ON and, after removing
pressure and flow sources, zero the transducers whenever the Zero Warn message
appears.
Page 39

Using the VT MOBILE
Making a Measurement More Accurate
The Analyzer requires you to zero immediately after power on. If Zero Warn is ON, the
Analyzer prompts you for an optional zero after the first five minutes and then after each
subsequent 30-minute interval. To zero at the prompt, follow these steps:
1. Place the Analyzer on a flat surface with sensors/adapters disconnected at the
Analyzer (Figure 3-2.)
3
Figure 3-2. Flow Sensors and Pressure Adapters Disconnected
edg17f.eps
2. Press G. Press R at any time to initiate an unprompted zero. Generally, it is
appropriate to zero before any pressure or flow measurement.
3. Reconnect the sensors/adapters (Figure 3-3.)
edg18f.eps
Figure 3-3. Flow Sensors and Pressure Adapters Connected
3-15
Page 40

VT MOBILE
Operators Manual
Oxygen Sensor
Verifying Oxygen Sensor Calibration
The Analyzer calculates the oxygen percentage as the fraction of the partial pressure of
oxygen relative to the total pressure. Note that changes in the total pressure (i.e. airway
pressure) result in a change in the partial pressure of the measured oxygen even though
the percentage of oxygen is the same. Since the pressure can change much faster than the
response time of the oxygen sensor, a small transient (1 to 2% of full-scale) error can
occur in the oxygen measurement when there is a fast change in the pressure at the
oxygen sensor.
Whenever you make an oxygen measurement, or when you calibrate or zero the oxygen
sensor, make sure there is sufficient gas flow past the oxygen sensor. The Analyzer needs
only a small flow of gas (e.g., 10 lpm) to ensure that the oxygen concentration at the
oxygen sensor is measured accurately. A small amount of flow must be present to ensure
gas mixing.
Verify the oxygen sensor calibration at the beginning of any day during which you expect
to measure oxygen concentrations. Note that you must calibrate the Oxygen Sensor
before initial verification; the sensor is not calibrated as shipped. The Oxygen Sensor
requires subsequent weekly recalibration at a minimum.
Use the following verification procedure:
1. Connect the Oxygen Sensor as shown in Figure 3-4.
2. Introduce a 10 lpm or greater flow of 100% oxygen through the Oxygen Sensor “T”.
3. Press P to access the O2 display.
4. Ensure that the O2 screen oxygen concentration is 100 % ± 2 % of full scale. If the
concentration is less than 98 %, perform the oxygen sensor calibration as described
below.
5. Replace the oxygen sensor after one year (or longer if no replacement message
appears during calibration.)
The Oxygen Sensor is not calibrated at the factory.
Calibrating the Oxygen Sensor
Calibrating the Oxygen Sensor improves pressure compensation for barometric and
airway pressure changes. Figure 3-4 portrays Oxygen Sensor connections.
Note
3-16
Page 41

Using the VT MOBILE
Making a Measurement More Accurate
Oxygen Sensor
Source
Figure 3-4. Oxygen Sensor Calibration
edg20f.eps
3
1. Press P to display the Oxygen measurement screen.
2. Press G to access the Oxygen calibration screen.
3. Connect the High-Flow Sensor and then apply dry air (20.9 % oxygen) at 10 lpm to
either side of the sensor.
4. Press F twice to access the Calibration screen. Wait for the two-minute timer to
count down.
5. Apply 100 % oxygen at 10 lpm.
6. Press G twice and then press F once to access the Calibration screen.
7. After the two-minute interval, the Oxygen measurement screen appears and the
calibration is complete.
Using the Temperature and Relative Humidity Sensor
Use the optional Temperature and Relative Humidity Sensor to compensate for the
conditions of the gas flowing through the High- or Low-Flow Sensor. The Analyzer uses
the gas temperature to improve the accuracy of the flow measurements. Relative
humidity readings provide a reference point for some correction factors. Connect this
sensor to the Analyzer as shown in Figure 3-5.
ede28s.bmp
3-17
Page 42

VT MOBILE
Operators Manual
Temp/RH Sensor
Source
Figure 3-5. Measuring Temperature and Relative Humidity
ede19f.eps
Press P as required to access the temperature and relative humidity screens shown
below:
Checking Barometric Pressure
Other pressures displayed on the Analyzer (e.g., Airway Pressure, differential pressures
as a basis for Flow, etc.) are relative to the internally-measured barometric pressure
(gauge pressure).
An internal sensor constantly measures barometric pressure. Other pressures displayed on
the Analyzer (e.g., airway pressure or differential pressure as a basis for flow) are relative
to the internally-measured barometric pressure (gauge pressure). You can fine-tune the
barometric pressure measurement by entering your own value. The Analyzer then factors
in the difference between the original measurement and your value as an offset correction
for subsequent measurements. The Analyzer stores the correction factor in non-volatile
memory to be remembered when you turn it off and then back on.
ede29s.bmp
ede30s.bmp
3-18
To enter a barometric pressure value, follow these steps:
1. Disconnect the High-Pressure Adapter at the High-Pressure Port.
2. Press S Æ E to access the barometric pressure screen, shown below.
Page 43

Using the VT MOBILE
Viewing Demo Data
3
3. Press F to access the calibration screen. This screen always appears in mmHg
units even though you may have selected other units.
4. Use the text entry keys to enter the barometric pressure in mmHg.
5. Press E to return to the barometric pressure screen.
Note that the Analyzer accepts barometric pressure values between 0.0 and 999.9 mmHg.
Exercise caution in changing barometric pressure readings; correct
barometric pressure yields more accurate pressure, flow, and volume
readings. Under normal operating conditions, barometric pressure should
not need adjustment.
The Analyzer relies on ambient barometric pressure. Do not set for airport
barometric pressure, which is corrected for altitude.
Changing Barometric Pressure Units
To change the barometric pressure units, follow these steps:
1. Press S Æ E.
2. Press G successively to select a barometric pressure unit. Units available are:
mmHg, PSI, kPa, Bar, mBar, ATM, inH2O, InHg, and cmH2O.
Note
ede31s.bmp
3. Press
A to return to the active display.
Viewing Demo Data
This function allows you to show recorded data on screen without needing to hook up to
a ventilator or do any measurements. The recorded data is for "demonstration" purposes.
To select this function, follow these steps:
1. Press J to access the Files screen.
2. Press C as necessary to highlight ‘View File’.
3. Press E and then press C as necessary to highlight ‘DEMO’.
4. Press E to activate your selection. After a pause, the Analyzer returns to a
measurement screen displaying data from the demo file.
5. To stop the demo data display, press J to access the Files screen, highlight ‘Stop
Playback’, and then press E to exit the demo file. Press any measurement key to
continue with live measurements.
Accessing Help
Use the I key to access context-sensitive help. If additional text is available off screen, a
vertical bar appears on the right side of the help screen. Use B or C to scroll
through the complete text. Press G to exit help.
3-19
Page 44

VT MOBILE
Operators Manual
3-20
Page 45

Introduction
To monitor ventilator parameters, the Analyzer must first determine when a breath occurs
and delineate the various phases of the breath. For example, the breath detection
algorithm determines the beginning and ending of the integration periods for calculating
tidal volumes.
The breath detection algorithm is a state machine. The flow waveform is the input to the
state machine. The Analyzer bases state changes on flow waveform crossings of
predefined thresholds. The breath detection threshold can be set to a high flow rate to
reject noise near zero flow.
You can use the High-Flow or Low-Flow Sensor to sample ventilator parameters.
Generally, the Low-Flow Sensor provides better accuracy at low flow rates (less than 25
lpm). Also, review “Making a Measurement More Accurate” in Chapter 3 for a
discussion of the uses of the Oxygen Sensor, Temperature and Relative Humidity Sensor,
and barometric pressure readings in enhancing measurement accuracy. Chapter 3 also
discusses proper warm-up and zeroing procedures to compensate for sensor drift.
Chapter 4
Checking Ventilator Parameters
Checking Ventilator Parameters
Refer to Figure 4-1 when you are connecting the Analyzer to a ventilator and test lung.
1. Press R and follow on-screen instructions.
2. At the Analyzer, connect the High-Flow Sensor to the Flow/Low-Pressure Port.
3. Connect the Oxygen Sensor to the upper port on the right side of the Analyzer.
4. If available, connect the optional Temperature/RH Sensor to the lower port on the
right side of the Analyzer.
4-1
Page 46

VT MOBILE
Operators Manual
5. Using parts from the Accessory Kit and the connectors provided with the sensors,
make connections between the ventilator and the ACCU LUNG as shown in Figure
4-1. Use the sequence: ventilator Y connector Æ High-Flow Sensor (blue stripe
toward the ACCU LUNG) Æ Temperature/RH Sensor Æ Oxygen Sensor Æ ACCU
LUNG. Vertically align all sensors.
6. Set up the ventilator for a characteristic breath pattern. For example, you could set 10
BPM at 7.5 lpm.
7. Set the ACCU LUNG for C20 compliance (both outer springs engaged) and Rp50
resistance (positioned as shown in Figure 4-1.)
High Flow Sensor
Ventilator
Oxygen
Sensor
Temp./RH Sensor
Fluke Biomedical
ACCU LUNG
Figure 4-1. Ventilator Connections
8. Apply power to all elements of the test setup. For the Analyzer, press H on, wait for
the Zeroing screen, and then press
G. The Analyzer is ready to use once the Tidal
Volume screen appears.
To
ede06f.eps
4-2
9. Press the access keys shown in Table 4-1 to display the various ventilator parameters.
Once you have pressed the first key, you can continue pressing that key to view other
parameters or press
G to view all the parameters.
10. As described in Table 4-1, the Analyzer calculates 16 breath parameters in Local
Mode. Note that you can view all 16 parameters and other information on one screen
in Remote mode when using the VT for Windows software.
11. Figure 4-2 shows the ventilator parameter screens.
12. Figure 4-3 shows additional oxygen, temperature, relative humidity, and barometric
pressure parameter screens.
Page 47

Checking Ventilator Parameters
Understanding the Parameters 4
Understanding the Parameters
Table 4-1 presents a list of parameters calculated by the Analyzer. A breath detection
algorithm determines the various phases of a ventilator breath; the Analyzer then
calculates the first 12 parameters. The Analyzer provides the final four parameters as
direct measurements.
Figure 4-2 shows how to access the 12 calculated parameters, and Figure 4-3 shows how
to access the four direct measurement parameters.
Table 4-1. Ventilator Parameters
Keys Item Name Description
K
G
L
G
M
G
VT Tidal Volume Total volume accumulated over the Inspiratory
Time.
MV Minute Volume The Expiratory Tidal Volume times the respiratory
rate in breaths per minute.
PIF Peak Inspiratory Flow The maximum of the absolute value of the Flow
Rate measured during the Inspiratory Time.
PEF Peak Expiratory Flow The maximum of the absolute value of the Flow
Rate measured during the Expiratory Time.
PIP Peak Inspiratory Pressure The maximum pressure during the Inspiratory Time.
PEEP Positive End-Expiratory
Pressure
MAP Mean Airway Pressure The mean pressure over the entire breath.
IPP Inspiratory Pause Pressure The average pressure during the End Inspiratory
Rate Breath Rate Number of breaths per minute.
Ti Inspiratory Time The time of the inspiratory period including the
Te Expiratory Time The time of the expiratory period including the
The average pressure during the End Expiratory
State.
State.
inspiratory hold time.
expiratory hold time.
P
Æ P
Æ P
S E
I:E Inspiratory to Expiratory
Time Ratio
O2 Oxygen Percentage The percentage of oxygen to total gas.
Temp Temperature The temperature of the gas passing through the
RH Relative Humidity (gas
under test)
Baro Barometric Pressure The absolute barometric pressure as measured
The ratio of the Inspiratory Time to the Expiratory
Time.
Temperature and Relative Humidity Sensor.
The relative humidity of the gas passing through the
Temperature and Relative Humidity Sensor.
internally.
4-3
Page 48

VT MOBILE
Operators Manual
Flow and Volume Pressure Timing
edg52f.eps
Figure 4-2. Accessing Calculated Parameters
Figure 4-3. Accessing Other Parameters
edg12f.eps
4-4
Page 49

Introduction
The Analyzer detects a Low-Pressure Adapter connection to the Flow/Low-Pressure Port.
With the Low-Pressure Adapter disconnected, pressing L under WAVEFORM
SCREENS or OTHER MEASUREMENTS toggles between high pressure and airway
pressure. With the Low-Pressure Adapter connected, pressing L successively selects
high pressure, low pressure, or airway pressure.
With a pressure connection, the measurement is equivalent to a gauge measurement. For
gauge pressures, the measurement is relative to the ambient (barometric) pressure.
Do not use either the High-Pressure or Low-Pressure Adapter for fluid measurement. If
fluid enters into the pressure measurements connections of the Analyzer, evacuate the
fluid before storage and before you make any pressure measurements. You can evacuate
the fluid by connecting a 100 cc syringe directly to the pressure measurement connection
and then pulling back the syringe to create a vacuum.
Review “Making a Measurement More Accurate” in Chapter 3 for a discussion of the
uses of the Oxygen Sensor, Temperature and Relative Humidity Sensor, and barometric
pressure readings in enhancing measurement accuracy. Chapter 3 also discusses proper
warm-up and zeroing procedures to compensate for sensor drift.
Chapter 5
Measuring Pressure
5-1
Page 50

VT MOBILE
Operators Manual
Measuring Low Pressure
Measure low pressure in the range: -20 to 120 cmH2O. Never exceed an absolute
maximum of 5 psi (0.345 bar).
Refer to Figure 5-1 while following these steps:
1. Press R and follow on-screen instructions.
2. At the Analyzer, connect the Low-Pressure Adapter to the Flow/Low-Pressure Port.
3. Press L in the OTHER MEASUREMENTS or WAVEFORM SCREENS section.
4. Verify that the screen displays Low Pressure (Plo) or LPress. If the High-Pressure
Adapter is also connected, you may need to press L a second time.
5. Connect the Low-Pressure Adapter to the source.
6. Apply pressure.
7. Successively press G (Units) to select a pressure unit in the sequence: PSI Æ kPa
Æ Bar Æ mBar Æ ATM Æ inH2O Æ InHg Æ cmH2O Æ mmHg.
If the waveform is too small or too large, press F (Rescale) to view the waveform
within optimized limits.
Low
Pressure
Adapter
T
T
V
V
B
B
O
O
M
M
GAS FLOW ANALYZERGAS FLOW ANALYZER
E
E
IL
IL
F1
Back
VENTILATOR PARAM
,
,
_
_
@
@
FLOW/VOL
I
I
H
H
G
G
FLOW
P
P
F2
Setup
ENTER
22A
C
C
B
B
A
11
PRESSURE
SCREENS
L
L
AVEFORM
K
K
J
J
W
44
PRESSURE
V
V77
U
U
T
T
OTHER MEASUREMENTS
PRESSURE
S
S
R
R
Q
Q
FLOW/VOL
SPECIAL FUNCTIONS
TREND
TEST
MemoryMemory
33
ETERS
F
F
E
E
D
D
ING
TIM
66
O
O
E
N
N
M
M
55
VOLUM
99
Z
Z
2
Y
Y
O
X
X
W
W
88
%RH
00
MORE
ZERO
SENSORS
Figure 5-1. Measuring Low Pressure
edg08f.eps
5-2
Page 51

Measuring Pressure
Measuring High Pressure 5
Figure 5-2 shows some characteristic low-pressure screens.
OTHER
MEASUREMENTS
WAVEFORM
SCREENS
Figure 5-2. Accessing Low-Pressure Measurements
Measuring High Pressure
The Analyzer can measure high pressure from -2 to 100 psi. Be certain of your possible
source pressure before measuring high pressure. For example, normal bulkhead outlet
pressure could be too high. Unregulated cylinder pressure could also be too high.
Refer to Figure 5-3 while following these steps:
1. Press R and follow on-screen instructions.
2. At the Analyzer, connect the High-Pressure Adapter to the high-pressure port.
3. Press L in the OTHER MEASUREMENTS or WAVEFORM SCREENS section.
4. Verify that the screen displays High Pressure (Phi) or HPress. If the Low-Pressure
Adapter is also connected, you may need to press L a second time.
5. With the high-pressure source set to zero output, connect the High-Pressure Adapter
to the source. Note that various connection schemes are available.
6. Apply pressure.
7. Successively press G (Units) to select a pressure unit in the sequence: PSI Æ kPa
Æ Bar Æ mBar Æ ATM Æ inH2O Æ InHg Æ cmH2O Æ mmHg
edg02f.eps
5-3
Page 52

VT MOBILE
Operators Manual
VT MOBILEVT MOBILE
O
O
L
L
F
F
S
S
A
A
G
G
1
F
Back
VENTILATOR PARAM
,
,
_
_
@
@
FLOW/VOL
I
I
H
H
G
G
R
R
E
E
Z
Z
Y
Y
L
L
A
A
N
N
A
A
W
W
2
F
Setup
ENTER
C
C
B
B
A
A
1122
PRESSURE
L
L
K
K
J
J
WAVEFORM SCREENS
44
PRESSURE
W
FLO
OTHER MEASUREMENTS
77
S
S
R
R
Q
Q
P
P
FLOW/VOL
TREND
TEST
ory
ory
em
em
M
M
33
ETERS
F
F
E
E
D
D
TIMING
O
O
N
N
M
M
LUME
55
O
V
W
W
88
V
V
U
U
T
T
PRESSURE
00
SPECIAL FUNCTIONS
ZERO
SENSORS
R
R
E
E
Z
Z
Y
Y
L
L
A
A
N
N
A
A
W
W
O
O
L
L
F
F
S
S
A
A
G
G
E
E
IL
IL
B
B
O
O
M
M
T
T
V
V
y
y
r
r
o
o
m
m
e
e
2
F
M
M
1
F
Setup
R
E
T
N
E
33
S
Back
R
E
T
E
F
F
E
E
G
M
D
D
A
N
I
R
A
22
M
I
P
T
R
O
T
A
66
C
C
IL
B
B
T
A
A
N
S
E
11
V
N
O
O
E
E
E
N
N
PRESSURE
M
R
M
M
C
U
L
55
S
,
,
_
_
@
@
O
M
V
R
O
F
E
99
V
L
L
FLOW/VOL
A
K
K
J
J
S
W
T
44
N
Z
Z
2
E
Y
Y
O
X
X
M
PRESSURE
E
W
W
R
U
88
%RH
I
I
S
H
H
A
G
G
W
E
O
M
L
R
F
V
V
E
U
U
H
T
T
T
O
S
77
N
IO
PRESSURE
T
C
S
S
N
00
R
R
U
MORE
Q
Q
F
P
P
L
IA
C
E
FLOW/VOL
P
S
ZERO
SENSORS
TREND
TEST
High Pressure
66
99
Z
Z
2
Y
Y
X
X
%RH O
MORE
Adapter
Figure 5-3. Measuring High Pressure
edg11f.eps
For waveform pressure readings, press F (Rescale) to optimize waveform viewing.
WWarning
Always turn pressure off at the source prior to disconnecting
either end of the High-Pressure Adapter. Serious injury could
otherwise result.
Figure 5-4 shows some characteristic high-pressure screens.
OTHER
MEASUREMENTS
WAVEFORM
SCREENS
5-4
Figure 5-4. Accessing High-Pressure Measurements
edg04f.eps
Page 53

Measuring Pressure
Measuring Airway Pressure 5
Measuring Airway Pressure
The Analyzer uses the same pressure transducer for low pressure and airway pressure
measurements. It derives airway pressure internally through the connections for high- or
low-flow measurements. Consequently, airway pressure measurements are available with
the High- or Low-Flow Sensor connected during ventilator parameter checks.
Figure 5-5 illustrates ways to view the airway pressure.
OTHER
MEASUREMENTS
WAVEFORM
SCREENS
Figure 5-5. Accessing Airway Pressure Measurements
edg05f.eps
5-5
Page 54

VT MOBILE
Operators Manual
5-6
Page 55

Introduction
The Analyzer makes flow measurements by measuring the differential pressure across a
fixed orifice flow sensor. The resulting differential pressure is nearly linear with respect
to the volumetric flow. The Analyzer applies simple corrections to correct for any nonlinearities.
Also, review “Making a Measurement More Accurate” in Chapter 3 for a discussion of
the uses of the Oxygen Sensor, Temperature and Relative Humidity Sensor, and
barometric pressure readings in enhancing measurement accuracy. Chapter 3 also
discusses proper warm-up and zeroing procedures to compensate for sensor drift.
Gas Settings
The flow measurement sensors in the Analyzer are linearly dependent on the viscosity of
the applied gas. The Analyzer setup options allow you to specify the type of gas in use.
Additional choices are available using the User Defined gas settings available with the
VT for Windows software. The gas calculator in the VT for Windows software can
determine the effective viscosity for a combination of various gases.
Chapter 6
Measuring Flow and Volume
Use of the Temperature and Relative Humidity Sensor increases flow and volume
accuracy. The Analyzer calculates the temperature dependent viscosity for the gas type
selected (except for user-defined gases). Therefore, when the sensor measures a new
flowing gas temperature, the Analyzer calculates the new viscosity. The Analyzer
viscosity calculation for the gas settings assumes the use of dry gas. Increased water
vapor content can slightly affect the flow accuracy.
Never apply humidified gases to the Analyzer flow sensors. Condensation
on the flow sensors causes errors in the flow readings until you dry
condensation from the flow sensors.
Balance Gas Settings
You can use gas combinations with oxygen. For example, the Analyzer can be set to use
Helium balance Oxygen (Heliox.) In this mode, the Analyzer uses the oxygen
measurement to determine the oxygen concentration and then assumes the balance of the
gas concentration is helium. The Analyzer calculates the effective viscosity for the
combination gas at the measured temperature. The oxygen concentration used for the
balance gases updates automatically.
Note
6-1
Page 56

VT MOBILE
Operators Manual
Correction Modes
Mode Name Description
The Analyzer obtains the ambient pressure from the measured barometric pressure. The
optional Temperature and Relative Humidity Sensor supplies the measured gas
temperature and relative humidity. Table 6-1 describes correction modes that are
dependent on these measurements.
Table 6-1. Correction Modes
ATP Ambient Temperature
and Pressure
BTPS Body Temperature and
Pressure Saturated
with water vapor
STPD0 Standard Temperature
and Pressure Dry,
0 °C
STPD21 Standard Temperature
and Pressure Dry,
21 °C
The Analyzer corrects the flow rate (and therefore, volume) such that the
reported flow equals the flow if the gas temperature and pressure are at
ambient (room) temperature and pressure.
The Analyzer corrects the flow rate (and therefore, volume) such that the
reported flow equals the flow if the gas temperature and pressure were
changed to body conditions (37 °C and ambient pressure). Further, the
Analyzer compensates the flow to add the amount of water vapor as if to
make the gas fully saturated (i.e. 100% relative humidity). In this
correction, the Analyzer uses the relative humidity reading to determine
the amount of water vapor that would need to be added.
The Analyzer corrects the flow rate (and therefore, volume) such that the
reported flow equals the flow if the gas temperature and pressure were
changed to standard conditions (0 °C and 760 mmHg). Further, the
Analyzer compensates the flow to subtract the amount of water vapor as
if the gas was dry (i.e. 0% relative humidity). In this correction, the
Analyzer uses the relative humidity reading to determine the amount of
water vapor that would need to be subtracted.
The Analyzer corrects the flow rate (and therefore, volume) such that the
reported flow equals the flow if the gas temperature and pressure were
changed to standard conditions (21°C and 760 mmHg). Further, the
Analyzer compensates the flow to subtract the amount of water vapor as
if the gas was dry (i.e. 0% relative humidity). In this correction, the
Analyzer uses the relative humidity reading to determine the amount of
water vapor that would need to be subtracted.
6-2
Flow Zeroing
The zero function can be set to prompt you automatically at pre-determined intervals or
only when you request the function by pressing R. The Analyzer Zero Warn is set to
ON at the factory to remind you to zero out any offset in the Flow measurements. The
Zero Warn screen reminds you at power on, after the first five minutes, and then after
each 30-minute period. After the power-on zero warning, you can choose to Zero or
Cancel when the reminder appears; either action returns the Analyzer to the same
function.
W Caution
Setting Zero Warn to OFF may result in introduction of offset
into the Flow and Volume measurements and cause errors in
the assessment of those measurements against the medical
device under test specification. Fluke Biomedical strongly
recommends that you leave Zero Warn ON.
The differential pressure transducer used to measure the flow rate is subject to baseline
(offset) drift. You will see this most pronounced during the Analyzer warm-up period.
For maximum accuracy, observe a 40-minute warm-up, followed by the zeroing
procedure.
Page 57

Measuring Flow and Volume
Measuring Low Flow
Measuring Low Flow
Measure low flow in the range: +/- 25 lpm. Never exceed an absolute maximum of 35
lpm. Refer to Figure 6-1 while following these steps:
1. At the Analyzer, connect the Low-Flow Sensor to the Flow/Low-Pressure Port.
2. Press R and follow on-screen instructions.
3. Press K (in OTHER MEASUREMENTS) or N (in WAVEFORM SCREENS.)
4. Connect the Low-Flow Sensor to the source.
5. Apply flow.
6. Successively press G (Units) to select a flow unit in the sequence: LPM Æ CFM
Æ LPS Æ ml/min Æ ml/sec.
If the waveform is too small or too large, press F (Rescale) to view the waveform
within optimized limits.
Low Flow
Sensor
6
GAS FLOW ANALYZERGAS FLOW ANALYZER
OBILE
OBILE
VT M
VT M
ry
ry
o
o
m
m
e
e
F2
M
M
F1
Setup
ENTER
33
Back
ETERS
G
DEFDEF
IN
TIM
66
ABCABC
1122
VENTILATOR PARAM
E
PRESSURE
MNOMNO
LUM
55
,
,
_
_
@
@
VO
/VOL
99
FLOW
AVEFORM SCREENS
JKLJKL44
W
2
ENTS
O
PRESSURE
WXYZWXYZ
RH
88
%
GHIGHI
EASUREM
FLOW
TUVTUV
OTHER M
77
PRESSURE
E
OR
00
M
PQRSPQRS
/VOL
W
O
FLO
SPECIAL FUNCTIONS
RS
ZER
SENSO
END
TR
TEST
Figure 6-1. Measuring Low Flow
Figure 6-2 shows some characteristic low-flow screens.
edg13f.eps
6-3
Page 58

VT MOBILE
Operators Manual
OTHER
MEASUREMENTS
WAVEFORM
SCREENS
Figure 6-2. Accessing Low-Flow Measurements
Measuring High Flow
Measure high flow in the range: ± 150 lpm. Never exceed an absolute maximum of 200
lpm. For flow rates below 25 lpm, use the Low-Flow Sensor. Refer to Figure 6-3 while
following these steps:
1. At the Analyzer, connect the High-Flow Sensor to the Flow/Low-Pressure Port.
2. Press R and follow on-screen instructions.
3. Press K (in OTHER MEASUREMENTS) or N (in WAVEFORM SCREENS.)
4. Connect the High-Flow Sensor to the source.
5. Apply flow.
6. Successively press G (Units) to select a flow unit in the sequence: LPM Æ CFM
Æ LPS Æ ml/min Æ ml/sec.
If the waveform is too small or too large, press F (Rescale) to view the waveform
within optimized limits. Refer to Figure 6-4 for sample screens.
edg15f.eps
6-4
Page 59

Measuring Flow and Volume
Measuring Volume
6
High Flow Sensor
Figure 6-3. Measuring High Flow
To Ventilator
edg24f.eps
OTHER
MEASUREMENTS
WAVEFORM
SCREENS
Figure 6-4. Accessing High-Flow Measurements
Measuring Volume
The Analyzer integrates (sums) the high- or low-flow signal over a period of time to
obtain volume. The Analyzer measures volume in units of Liters, CF (cubic feet), or mL
(milliliters). Maximum low-flow volume is ± 60 l, and maximum high-flow volume is >
± 60 l. All correction modes and other measurement accuracy considerations applicable
to flow measurement apply for volume measurements. To make a volume measurement,
follow these steps:
1. Connect the Analyzer for low-flow or high-flow measurement as shown in Figure 6-1
or 6-3, respectively.
edg25f.eps
6-5
Page 60

VT MOBILE
Operators Manual
2. Press K under OTHER MEASUREMENTS until the volume screen shown below
appears.
ede38s.bmp
Note
Tidal Volume and Minute Volume calculated parameters are also available
K
by pressing
under VENTILATOR PARAMETERS.
6-6
Page 61

Chapter 7
Maintaining and Troubleshooting the VT
MOBILE
Introduction
This chapter provides enough information to help you troubleshoot possible Analyzer
failures and perform diagnostics.
Leave service of the Analyzer to qualified Service personnel. Leave calibration of the
Analyzer to qualified Fluke Biomedical Service personnel to ensure that the Analyzer
remains under warranty.
Calibration and Service
Have a qualified technician calibrate the Analyzer once a year. We recommend that you
send the Analyzer to a Fluke service center for calibration or service.
Battery
The Analyzer uses a 9-volt, non-rechargeable alkaline battery. Refer to Figure 7-1 for
battery replacement instructions.
If battery voltage drops too low, the message “Warning Your Battery Is Low” appears
on the screen. Press G (Ok) to resume viewing the previous display. The Analyzer
will now occasionally beep and eventually display the warning screen again, allowing
you to repeat the process. However, to maintain accurate measurements, replace the
battery as soon as possible after the first warning you notice.
Press S Æ C Æ E to check the battery level.
7-1
Page 62

VT MOBILE
Operators Manual
Cleaning
1 2
Figure 7-1. Changing the Battery
Clean the Analyzer with a damp cloth on the exterior only. Use a solution of 70%
isopropyl alcohol. Fluke Biomedical does not recommend other solvents.
ede09f.eps
Verifying Oxygen Sensor Calibration
Verify the oxygen sensor calibration at the beginning of any day during which you expect
to measure oxygen concentrations. Use the following verification procedure:
1. Connect the Oxygen Sensor as shown in Figure 7-2.
2. Introduce a 10 lpm or greater flow of 100% oxygen through the Oxygen Sensor “T”.
3. Press P to access the O2 display.
4. Ensure that the O2 screen oxygen concentration is 100 % ± 2 % of full scale. If the
concentration is less than 98 %, perform the oxygen sensor calibration as described
below.
5. Replace the oxygen sensor after one year (or longer if no replacement message
appears during calibration.)
Note
The Oxygen Sensor is not calibrated at the factory.
7-2
Page 63

Maintaining and Troubleshooting the VT MOBILE
Replacing the Oxygen SensorReplacing the Oxygen Sensor
Oxygen Sensor
Source
Figure 7-2. Oxygen Sensor Calibration
edg20f.eps
7
Replacing the Oxygen Sensor
The Analyzer uses a galvanic oxygen sensor warranted for 12 months. Replace the
oxygen sensor cell when you cannot successfully complete the oxygen sensor
verification. The oxygen sensor may operate for longer than 12 months depending on use.
To replace the oxygen sensor, unscrew the cable and pull the sensor cell out of its T
connector.
Follow the oxygen sensor manufacturer's unpacking and installation instructions. You
may need to expose oxygen sensors to room air for 24 hours prior to installation or
calibration.
Calibrating the Oxygen Sensor
Calibrating the Oxygen Sensor improves pressure compensation for barometric and
airway pressure changes.
1. Press P to display the Oxygen measurement screen.
2. Press G to access the Oxygen calibration screen.
3. Connect the High-Flow Sensor and then apply dry air (20.9 % oxygen) at 10 lpm to
either side of the sensor.
4. Press F twice to access the Calibration screen. Wait for the two-minute timer to
count down.
5. Apply 100 % oxygen at 10 lpm.
6. Press G twice and then press F once to access the Calibration screen.
7. After the two-minute interval, the Oxygen measurement screen appears and the
calibration is complete.
7-3
Page 64

VT MOBILE
Operators Manual
Troubleshooting
Refer to Table 7-1 for troubleshooting procedures.
Table 7-1. Troubleshooting the Analyzer
Problem Possible Cause Corrective Action
Analyzer does not turn on Screen is dark
Screen contrast not set Adjust screen contrast.
Analyzer screen turns on but
displays nothing. Splash may or
may not appear before screen
goes blank
Flash memory or boot memory
Screen contrast not set Adjust screen contrast
Screen is difficult to read Screen contrast not set Adjust screen contrast
"Out of Range" messages
appear
Unit calibration is incorrect If problem persists, call Service.
Tidal Volumes are erratic Breath detection threshold set
Tidal volumes different than
expected.
Flow baseline drifts, causing a
Analyzer is out of calibration. Contact Service.
Gas settings are incorrect. Review Analyzer gas settings.
Correction mode is set to BTPS
BTPS or STPD correction
No power or dead battery Plug battery eliminator into an AC
mains outlet or install a new battery.
Press the Power key on.
Flash program memory not
loaded
resulted in incorrect checksum.
Measured signals out of
specified range
too low. Noise from ventilator is
causing "false" breaths.
Your expected value was
incorrect.
false non-zero flow reading
when flow was actually zero.
or STPD instead of ATP.
method on the Analyzer is
different that the method used
by the ventilator manufacturer.
If problem persists, call Service.
If problem persists, call Service.
Ensure that all pressures and flow
rates are within the Analyzer specified
limits.
Set the breath detection threshold to a
higher value.
Review expectations.
Zero the flow reading.
Set gas mode to appropriate setting for
your application. Most applications may
require the ATP mode.
Corrections for BTPS and STPD may
vary among different ventilator
manufactures. The biggest difference
is in the water vapor volume correction.
The Analyzer uses the setting for
relative humidity and temperature to
determine the actual volume of water
vapor in the flowing gas. The Analyzer
subtracts this volume from the total
volume for "dry" gas corrections. For
"saturated" gas correction, the
Analyzer computes a make-up volume
of water vapor and adds it to the
measured volume.
7-4
Page 65

Maintaining and Troubleshooting the VT MOBILE
Troubleshooting
Table 7-1. Troubleshooting the Analyzer (cont.)
Problem Possible Cause Corrective Action
7
Compliance of breathing
circuit tubing is causing a
compressible volume loss.
You are using the
Analyzer with humidified
gases. Condensation on
the flow sensors causes a
calibration error on the
flow measurement.
Flow or pressure
measurement is not equal to
zero when zero flow or
pressure is applied.
Zeroing flow results in
unexpected flow readings or
an error message.
Barometric pressure is
incorrect
You observe no flow
measurement with flow
applied.
No observable airway
pressure.
Baseline drift of pressure
transducer
Flow was not zero. Ensure that there is no flow when zeroing the
Barometric pressure offset
drift
Wrong flow sensor is
connected
Wrong flow sensor
connected.
Determine the breathing circuit compliance to
calculate the expected volume loss due to
compressibility of the gas and expansion of
the hose.
Run dry air through the flow sensor for 10 to
30 minutes to allow the screen mesh to dry.
Do not use the Analyzer with condensing
humidified gases.
Zero the affected signal by using R while
the affected signal is displayed. For example,
you can zero low pressure while the Analyzer
displays the low-pressure screen.
flow sensor.
Enter correct barometric pressure.
Connect the right flow sensor. See
Specifications.
Connect the right flow sensor.
Ventilator parameters seem
incorrect.
Analyzer takes a long time to
establish communications
with PC software.
Make sure no other device is trying to use the
Analyzer in circuit
backwards
This is normal. If the Analyzer does not eventually
Ensure the inlet is near to the Y piece.
communicate with the PC software, ensure the
cable is correctly connected and that the PC
hardware can support the communication port
selected.
serial port on your PC. Close any software that
may be using the serial port. Make sure that
Windows recognizes the serial port in the
Control Panel. Restart the VT for Windows
software.
7-5
Page 66

VT MOBILE
Operators Manual
7-6
Page 67

Getting Started
System Requirements
VT for Windows requires the following system capabilities:
Appendix A
VT for Windows
• Microsoft Windows
• 256 MB of RAM required
• 1 GHz Pentium III system required
On slower computers, the VT for Windows software may not be able to display the realtime waveform data. If you are using a slower computer than recommended and a
problem occurs, select Parameters from the Communications menu.
Connecting to the Analyzer
The Analyzer uses a special 9-pin serial cable to connect to a PC. Plug the serial cable
into the miniature RS232 port on the left side of the Analyzer and into an unused serial
(com) port on your PC.
As it launches, the VT for Windows software automatically places the Analyzer into the
computer control mode. No graphics appear on the Analyzer screen during serial
communications; the Analyzer displays:
“
No Graphics Available, While Communications Are Active.”
Installing the Software
Place the VT for Windows CD into the CD drive on your PC. If VT for Windows does
not initiate installation automatically, select Run from the Start menu, and type in “(CD
drive designator):\setup.exe.” Then click OK.
The installation program for VT for Windows asks you several questions before installing
the program. You can specify where you want the program installed on your computer. If
you are installing over a previous version of this software, you must provide a location
for backing up old copies of your files. In addition, you must specify where to put the
icons for the VT for Windows program. Follow the instructions given by the installation
program. If there are no changes to the default installation options, VT for Windows
installs to “C:\Program Files\VTPlus.”
A-1
Page 68

VT MOBILE
Operators Manual
Starting the Software
With the software installed and the Analyzer connected, you are ready to start the
software application. Upon first use, the application attempts to establish communications
with the Analyzer.
The software checks the serial communication ports (also called Comm Ports) listed in
the Windows Registry. If the software cannot find the Analyzer, the screen in Figure A-1
appears, allowing you to set the communication port used for connecting the Analyzer.
Figure A-1. Comm Port Selection
edg53s.bmp
Once the software has established communication with the Analyzer, it creates an
initialization file to read during future use. The software uses the information in the
initialization file to know where to check for the Analyzer.
An error can occur if the communication port is in use by another device and/or software
application. To solve this error, close the application that is using the required
communication port.
Finally, if you need to manually set or change the communication port for the Analyzer,
start VT for Windows and select Communications Æ Comm Port from the pull-down
menu. Select the appropriate communication port. You can tell that VT Mobile has
established communications when it starts displaying waveforms and changing values for
flow and pressure.
A-2
Page 69

Appendices
VT for Windows A
Using VT for Windows
VT for Windows provides a simple interface for recording and playing back data
calculated by the Analyzer. Refer to Figure A-2 and Table A-1. Most functions on the
Analyzer are available using VT for Windows. The Full Test screen presents all
ventilator parameters in one place.
21
9
3
4
5
6
8
Figure A-2. Screen Elements
7
edg70f.eps
A-3
Page 70

VT MOBILE
Operators Manual
Number Name Description
Table A-1. Screen Elements
A
B
C
D
E
F
G
H
Menu Access most functions through the menu.
Toolbar Buttons on the toolbar access commonly used menu functions.
Plot Icons Use to access the Plot menu.
Use
screens.
Statistics Area This area shows the present reading, along with updating
statistics for minimum, maximum, and average of the signals
encountered.
Plot Area The plot area shows the present (or present and previous)
waveform along a selectable time interval.
Screen Tabs The VT for Windows software provides several review and test
screens, accessible through the tab set near the bottom of the
screen. These screens are the Monitor screen, the Single Plot
screen, the Loop Plots screen, and the Full Test screen. In
addition, the Test Settings menu allows access to the Trend
Test, Leak Test, and Stacked Test screens.
Status Bar A status bar (6) appears at the bottom of the screen; this shows
the current status of several user settings, including zeroing
mode, correction mode, and the selected flow port. System
messages such as Zeroing also appear here.
Selected File \ System
Messages
This area shows the path to any displayed and stored signal.
to toggle between the Monitor Plots and Single Plot
I
File Controls and Test
Settings
Panels appear here for File Controls, Trend Test, and Leak
Test functions.
A-4
Page 71

Appendices
VT for Windows A
Using the Menu Bar
VT for Windows provides you with a menu for easy access to the program’s functions. A
brief description of the software’s menu structure follows. Refer to Figure A-3.
Figure A-3. Menu Bar
edg55s.bmp
File
This selection allows you to save, open, print, and close files, along with other functions.
Refer to Figure A-4. Refer to additional file information later in this Appendix.
Communications
The Communications menu (Figure A-5) allows you to select the communications port
and the serial data mode. For a complete description, see the Serial Communications
section in this appendix.
Figure A-4. File Menu
Figure A-5. Communications Menu
edg82s.bmp
edg83s.bmp
A-5
Page 72

VT MOBILE
Operators Manual
VT Mobile
Statistics
This selection allows you to download files from the Analyzer.
The Statistics menu gives access to the clear function for any or all statistics. The Clear
Statistics function clears the statistics for all the signals and the breath parameters at
once. Clear individual signal statistics by selecting the appropriate option. Refer to Figure
A-6.
Figure A-6. Statistics Menu
Zeroing
The Zeroing menu (Figure A-7) allows you to zero all of the signals manually. The Zero
All function zeros all the signals except oxygen. The Oxygen function allows you to zero
sensor drift at 21% oxygen and calibrate at 100% oxygen.
Figure A-7. Zeroing Menu
Setup
The Setup menu (Figure A-8) provides access to some of the user setup features found in
the Analyzer, including:
edg84s.bmp
edg85s.bmp
A-6
• Breath Detect:
Use the Breath Detect menu to switch breath detection modes and set the breath
detect threshold for the current flow port.
• Gas Settings:
Page 73

Appendices
VT for Windows A
The Gas Settings function brings up the Gas Settings dialog box. See the Gas Settings
section later in this appendix.
• Gas Calculator:
This function brings up the Gas Calculator dialog box, where you can enter gas
percentages, temperature, and relative humidity.
• Barometric Pressure:
This function brings up the Barometric Pressure dialog box. Enter the local
barometric pressure in mmHg and click OK to calibrate the barometric pressure
sensor.
• Units:
The Units function brings up a dialog box for entering the desired units for the
signals.
• Printout Header:
The Printout Header function sets the print header in the Analyzer. See the Printing
section in this appendix.
Test Settings
The Test Settings selection allows you to initiate a Leak or Trend test and adjust settings
for the Stacked test. You can also specify whether the previous monitor plot remains on
the display while VT for Windows displays a new plot. Finally, you can change the time
scale of all monitor plots. Refer to Figure A-9.
Help
The Help menu accesses the VT for Windows About window.
Figure A-8. Setup Menu
Figure A-9. Test Settings Menu
edg86s.bmp
edg87s.bmp
A-7
Page 74

VT MOBILE
Operators Manual
Using the Toolbar
The toolbar (Figure A-10) provides both convenience and speed. It provides a quick and
easy way to call often-used functions. Table A-2 presents descriptions of the buttons and
their functions.
Figure A-10. Toolbar
Table A-2. Toolbar Buttons
Button Name Description
Save As button This button calls up the Save As dialog and allows you to begin
saving your data to a file.
Open file button This button calls the Open dialog that allows you to begin reviewing a
file.
Close file button This button closes any open data files.
Print button This button gives you quick access to the print functions. Click this
button to open the Print dialog box.
File controls
button
Zeroing button This button forces the Analyzer to zero immediately. For more
Clear Statistics
button
This button toggles the File Controls window on or off.
information about zeroing choices with the pull-down menu, see the
Zeroing section.
This button forces the Analyzer to clear either a selected statistic or
all statistics.
edg56s.bmp
A-8
Re-scale button This button forces all the plots to re-scale immediately, rather than
wait for the auto scale to re-scale them. Note that the Re-scale button
only rescales plots that are set to Auto Rescale and does not affect a
plot that is set to manually scale.
(not used) The Analyzer uses the bi-directional breath detect mode.
Breath Detection
Flow Threshold
This button brings up a dialog box for entering the breath detection
flow threshold. For more information, see the Other Setup Functions
section.
Using the Main Screens
You can access four main screens with VT for Windows. Switch among Monitor Plots,
Loop Plots, and Full Test screens by selecting the appropriate file tab on the bottom of
the screen. Select the Single Plot screen by clicking the Plot icon from the Monitor Plots
screen.
Monitor Plots Screen
The Monitor screen (Figure A-11) allows you to observe three of the signals at the same
time. Configure each plot to display any of the signals (flow, volume, airway pressure,
low pressure, high pressure, oxygen, temperature, or relative humidity). You can set each
plot independently to auto-scaling or to manually re-scaling to your specified range of
Page 75

Appendices
VT for Windows A
values. The statistics for the selected signals (min, max, average, and current value)
appear on the right side of the screen. In the upper right corner of each plot, you can
select the
icon to access the Plot menu or the icon to toggle between the Monitor
Plots and Single Plot screens.
Single Plot Screen
Toggle between three-signal and one-signal view by clicking the small screen icon in the
upper right corner of the plot. Figure A-12 shows a Single Plot screen.
Figure A-11. Monitor Screen
edg57s.bmp
edg58s.bmp
Figure A-12. Single Plot Screen
A-9
Page 76

VT MOBILE
Operators Manual
Loop Plots Screen
This screen shows plots of Flow vs. Volume and Volume vs. Airway Pressure. You can
independently rescale these plots either automatically or manually. Refer to Figure A-13.
Use controls accessible from the pull-down menu in the upper right corner of each plot as
follows:
• Rescale: select the Rescale submenu. The Auto Re-scale selection returns the plot to
auto rescaling mode, where the plots rescale automatically based on the minimum
and maximum signals. The Manual Scale selection allows you to select the scales on
which the plots will be shown and disable Auto Re-scale for that plot.
• Clear: erase the present plot and start over.
A-10
Figure A-13. Looped Plots Screen
edg59s.bmp
Page 77

Appendices
VT for Windows A
Full Test Screen
The Full Test screen (Figure A-14) displays the calculated parameters for the last breath.
These parameters update only when a new breath occurs. A "*****" value means that
value is invalid or the software could not calculate the value. Depending on your breathdetect mode, some parameters may not be calculable.
Conducting a Trend Test
Overview
The Trend test monitors a single-breath parameter over an extended period. Each time a
breath occurs, the software compares the chosen breath parameter to an initial value. If it
exceeds the percent limit given for the test, a reported incident occurs. Following the test,
you can print a report detailing all the incidents that occurred during the test.
Starting a Trend Test
Initiate a Trend test by selecting Trend Test from either the Test Settings menu or the Full
Test screen. The Trend Test setup dialog box opens, allowing you to choose the
parameter on which to run the test, the percent limit for the test, and minimum and
maximum limits for the test. Click the OK button to start the test. See Figure A-15.
Running a Trend Test
During a Trend test, you see several values every time a breath occurs. Refer to Figure A-
16.
• Test Parameter
This is the parameter chosen for running this test. This value does not change during
the test.
• Initial Value
This is the initial value for the test parameter. This value does not change during the
test.
• Current Value
This is the current value of the chosen test parameter. Every time a breath occurs, the
software updates and compares the current value against the initial value of the test
parameter.
Figure A-14. Full Test Screen
edg60s.bmp
A-11
Page 78

VT MOBILE
Operators Manual
Ending a Trend Test
• Minimum Limit
This is the minimum value; a reading below this value results in an incident.
• Maximum Limit
This is the maximum value; a reading above this value results in an incident.
• Percent Difference
The software calculates this value each time a breath occurs. If it is greater than the
Percent Limit, a reported incident occurs.
• Test Number
This number increments with each detected breath.
• Number Of Incidents
The number of incidents is incremented each time the percent difference exceeds the
percent limit or the current value falls outside the maximum or minimum limit.
• Elapsed Time
This value updates continuously. It keeps track of the run time of the current Trend
test.
End the Trend test at any time by clicking the End Trend Test button.
When the Trend test stops, the software reports the final values. Clicking the Print button
prints out a copy of the results and the incident reports for the test.
A-12
Figure A-15. Trend Test Window
edg61s.bmp
Page 79

Appendices
VT for Windows A
Conducting a Leak Test
Overview
The Leak test is for measuring the leak rate of a sealed vessel or test lung over a period of
time.
Starting a Leak Test
Start the Leak test by selecting the Leak Test tab (accessed by selecting File Æ View File
Controls). Then select Start Leak Test. (You can also start a Leak test by selecting Leak
Test from a pressure Plot menu on the Monitor Plots or Single Plot screen.) The dialog
box shown in Figure A-17 now appears, giving you the chance to choose the pressure
channel on which you want to run the test. In addition, you can change the displayed
pressure units. If you choose to enter a compliance value for the system under test, the
software calculates the volume lost during the test. Enter the test time to set the length of
time that the Leak test runs. The Leak test automatically stops at the end of that amount
of time. Click the OK button to begin the Leak test.
Running a Leak Test
The Leak test plots the chosen pressure channel (airway, low, or high pressure) over the
chosen length of time. The Leak test also displays several values calculated during the
test. Refer to Figure A-18.
Figure A-16. Trend Test Panel
edg62s.bmp
• Current Pressure
This is the pressure currently measured.
• Initial Pressure
A-13
Page 80

VT MOBILE
Operators Manual
This is the pressure read on the selected pressure channel when the Leak test starts.
The initial value does not change during a Leak test.
• Leak Rate
Pressure is being lost at this rate.
• Elapsed Time
This shows the amount of time that the Leak test has been running.
• Compliance
This is the compliance value entered when starting the Leak test. This value does not
change during a Leak test.
• Volume Lost
If you entered a compliance value at the start of the Leak test, this value is the
amount of volume lost during the Leak test.
Figure A-17. Leak Test Dialog Box
edg63s.bmp
A-14
Page 81

Appendices
VT for Windows A
Ending a Leak Test
The Leak test ends when the time runs out or when you terminate it by clicking the End
Leak Test button.
When the Leak test is over, VT for Windows prepares a report showing the final values
for the calculated parameters. Clicking the Print button prints out a final report for the
Leak test.
Conducting a Stacked Test
Overview
The Stacked test measures breath parameters over a given number of breaths and
calculates the average. Select a breath parameter by clicking the square next to the breath
parameter's name on the Full Test screen.
Starting a Stacked Test
VT for Windows runs Stacked tests for all parameters continuously.
Change the number of breaths by selecting Stacked Test in the Test Settings menu or by
clicking the Stacked Test button in the Full Test screen. With either access method, the
dialog box shown in Figure A-19 now appears. Enter the number of breaths that you want
averaged. Click the OK button to resume testing.
Figure A-18. Leak Test Panel
edg88s.bmp
Running a Stacked Test
The Stacked test reports the values shown in Figure A-20. The current value is the breath
parameter for the last breath. The Stacked Value reflects the total of the breath parameter
calculations for the number of breaths specified.
A-15
Page 82

VT MOBILE
Operators Manual
Resetting a Stacked Test
The test automatically updates the Stacked Value following the number of requested
breaths. If you need to restart a Stacked test manually, select Clear Statistics from the
Statistics menu.
Figure A-20. Stacked Test Portion of Full Test Screen
Using the File Menu
The File menu provides the functions shown in Figure A-21 and detailed below.
Figure A-19. Stacked Dialog Box
edg65s.bmp
edg89s.bmp
A-16
Save Data File
Use this selection to save the open file. You can also use the Save As button on the
toolbar. The file may be either a new or an existing file. If it is an existing file, the
software prompts you to decide if you want to overwrite the existing file.
Figure A-21. File Menu
edg67s.bmp
Page 83

Appendices
VT for Windows A
Note
VT for Windows does not store data in a buffer (temporary file). If a file is
not open and the software is recording, the software saves no data.
Open File
The Open File selection is available to open an existing file for playback. You may also
use the Open File button on the toolbar.
Close File
To close data files, select Close File from the menu or use the Close File button on the
toolbar.
View File Controls
The File Controls panel (Figure A-22) is a sub-screen used for recording, annotating, and
playing back data files. You can bring up the File Controls panel by selecting the File
Controls button on the toolbar or by selecting View File Controls from the File menu.
There are four main sections in the File Controls: Playback Controls, Event Markers, File
Information, and Events.
Figure A-22. File Controls
A-17
edg68s.bmp
Page 84

VT MOBILE
Operators Manual
Playback Controls
Use the controls shown in Table A-3 as aids in data review and recording.
Table A-3. Playback Controls
Button Name Description
Record The Record button initiates writing data to the open data
file. The software places a Time event marker in the
data file, indicating the beginning of recording.
Play The Play button initiates data playback from an open
file.
Stop The Stop button terminates data recording or playback.
The software leaves the data file open.
Pause The Pause button stops data playback temporarily.
Pause files before printing so that the software can
capture the plot for printing.
Start This button rewinds the data file to its beginning. This
only affects data playback. The software performs all
recording at the end of the data file.
Rewind This button backs up the data file during playback to the
previous event marker in the file. Automatic event
markers provide periodic events to which you can
rewind or forward the file.
Continuous
Play On
Fast
Forward
Enable this button during data playback to allow for
continuous play. In continuous play, the data file
automatically rewinds to the beginning as soon as the
end of the file occurs. The button appears red when
enabled and black when disabled.
This button advances the data file during playback to
the next event marker in the file. Automatic event
markers provide periodic events that enable rewinding
or forwarding of the file.
A-18
End This button advances the data file to its end. This only
affects data playback.
Speed
Control
The speed control adjusts the playback speed. The
number shown is the time in milliseconds (ms) between
waveform samples. The data sample rate for the
Analyzer is 20 ms. Therefore, a number larger than 20
results in slower-than-normal playback; smaller
numbers yield a fast playback speed.
Page 85

Appendices
VT for Windows A
Manual Event Markers
Event markers assist you during data collection. You can place two events into the file:
Annotate and Time. During file recording, these events appear in the Events section of
the File Controls panel. See Table A-4.
Table A-4. Event Markers
Button Description
Pressing this button during recording brings up a dialog box where you may
enter notes (text). Upon your pressing OK, the software places your notes and a
time stamp in the data file. Note that the time stamp is the time when you
pushed the
Pressing this button during recording places a time stamp in the data file. A
dialog box appears showing the exact time written to the file.
One use of this function is to correlate data collection in a laboratory notebook or
data collection worksheet with the data in the file.
OK button (not the Annotate button).
Automatic Event Markers
The software places automatic event markers in data files to assist in the Rewind and
Forward functions during playback. Rewind and Forward move the data file from event
to event. In the absence of user events (i.e. Time or Annotate), there would be beginning
and end of file events.
To set the time interval, select Timed Breaks from the File menu. This brings up the
dialog box shown in Figure A-23.
Figure A-23. Timed Events Dialog Box
edg90s.bmp
Use this setting to determine how often to place an automatic event marker in the data
file. Use event markers with the Forward and Reverse functions of the file playback.
Using the pull-down menu, select the desired time interval between automatic event
markers and then select OK. Shorter times allow you to see more of your data during
playback.
The software keeps a timer for the automatic event marker. If you insert an event by
using Time or Annotate, the timer resets. This is to avoid having automatic events too
close to user events.
A-19
Page 86

VT MOBILE
Operators Manual
File Information
Figure A-24 shows the File Information section of the File Controls panel.
The first line in the information box contains the open file name. The next line is the
creation time for the file. The remaining lines contain the information that you provided
at file creation.
Events
During file playback, the software checks for event markers in the data files. The Events
section of the File Controls panel displays information from the data file regarding the
last event played back. VT for Windows displays this information until another event
begins.
Timed Breaks
This selection allows you to specify automatically marked intervals in the data file.
Extract Signal File
A signal file is a data file of raw waveforms. The software generates the .sig files from
the .vtp files using a file conversion program. Initiate this by selecting Extract Signal File
from the File menu. You must close files to enable this option. The .sig files are in ASCII
format; you can easily import them into your favorite spreadsheet. They contain raw
flow, pressure, volume, auxiliary pressure, and differential pressure time series collected
at 20 ms time increments (50 Hz sample rate).
Figure A-24. File Information Section
edg71s.bmp
A-20
Extract Parameter File
Parameter files store the breath-by-breath calculated ventilator parameters. The software
generates the .par files from the .vtp files using a file conversion program. Initiate this by
selecting Extract Parameter File from the File menu. You must close files to enable this
option. The .par files are in ASCII format; you can easily import them into your favorite
spreadsheet.
Page 87

Appendices
VT for Windows A
You can print reports from the VT for Windows software to any printer installed on your
computer.
There are two ways to print from VT for Windows. Selecting Print from the File menu or
clicking the Print button on the toolbar brings up the system Print dialog box. This allows
you to select which printer you want to use and adjust settings on that printer. Clicking
OK sends the report to the printer.
The print header that appears at the top of the reports is stored in the Analyzer. It is
loaded into the VT for Windows software every time it connects to an Analyzer unit.
Change the print header using the Printout Header function in the Setup menu.
Using the Plot Menu
Access plot settings by clicking the arrow icon in the upper right corner of the plot.
Figure A-25 shows the icon and the resulting Plot menu.
Signal Selection
You can set up the three plots on the Monitor screen and the plot on the Single Plot
screen to display any of the signals: flow, volume, airway pressure, low pressure, high
pressure, oxygen, temperature, or relative humidity.
To change the displayed signal on a plot, select the plot's name from the Plot menu and
select the name of the signal you want displayed. See Figure A-26. The desired signal's
name appears on the title of the plot and above the statistics to the right of the plot. The
statistics and the plot now reflect the new signal and appear in the selected units for that
signal.
Figure A-25. Plot Menu
edg95s.bmp
Figure A-26. Selecting a Signal
A-21
edg92s.bmp
Page 88

VT MOBILE
Operators Manual
Units Selection
To change the units for a signal, select
Units from the Plot menu. See Figure A-27. All
statistics and plots reflect the current units for the assigned signal.
Rescaling
This selection allows you to select or deselect auto rescaling, initiate a manual scaling, or
adjust the interval over which the signal appears. See Figure A-28.
Automatically Re-scaling a Plot
By default, the VT for Windows software attempts to re-scale plots so that the entire plot
is visible to you. When a re-scale occurs, the software determines the high- and lowranges on the plots by the min and max statistics for the signal shown on the plot. The
monitor plots and the single plot re-scale every time they reach the end of the plot. The
software re-scales the loop plots on every breath.
Figure A-27. Units Window
Figure A-28. Plot Rescaling
edg93s.bmp
edg94s.bmp
A-22
You may turn off the automatic re-scaling for an individual plot by unchecking the box
next to the plot's name (Plot Æ Rescale Æ Auto Re-scale.) The software automatically
turns auto-scaling off for a plot if you manually re-scale that plot.
Clicking the Re-scale button on the toolbar forces an automatic re-scale of all plots to
occur immediately.
Page 89

Appendices
VT for Windows A
Manually Re-scaling a Plot
You can choose a specific range to view on a plot in the following way.
1. Select Rescale and Manual Scale from the Plot menu. The dialog box shown in
Figure A-29 appears.
2. Set new Y Range High and Low values with the scroll arrows or by directly entering
the values.
3. Click OK.
Setting the Time Scale
The Time Scale selection allows you to change the interval of the displayed plot signal.
Use the scrolling arrows or enter a number directly. Refer to Figure A-30. The minimum
allowable time scale is 10 seconds.
Figure A-29. Manual Rescale
Figure A-30. Time Scale
edg91s.bmp
edg97s.bmp
Start Leak Test
The Start Leak Test selection is available when you have selected a pressure signal
(Airway Pressure, Low Pressure, or High Pressure.)
Clear
The Clear selection erases existing plots; VT for Windows then begins displaying new
plots.
A-23
Page 90

VT MOBILE
Operators Manual
Serial Communications
Selecting the COM Port
Selecting the Serial Communications Mode
The Analyzer communicates with your PC through a serial (COM) port. With the
Analyzer connected to your computer and turned on when the software starts, the
software automatically detects which COM port the Analyzer is on and then initiates
communications between the Analyzer and your PC.
While running VT for Windows you may select Comm Port from the Communications
menu to change the port selection.
The Analyzer allows for four modes for data transmission via the serial port. These are
available from the Communications menu. The currently selected mode shows a check
mark next to its name.
• Both
This selection starts the automatic transmission of both waveform data and parameter
data, as described above.
• Wave Form
This selection starts the continuous transmission of waveform data from the
Analyzer. The software receives flow, volume, airway pressure, auxiliary pressure,
and differential pressure data at a 50 Hz rate.
• Parameters
Start the automatic transmission of parameters calculated at the end of a breath.
These parameters update on a breath-to-breath basis. Please note that no parameters
update for a breath if a zero occurs during that breath.
• None
Use this selection to set no data transmission. This stops all automatic data
transmissions from the Analyzer.
A-24
Data and File Handling
File Structure
VT for Windows files handle three kinds of data: Signals, Parameters, and Events.
Signals are the raw flow, pressure, and volume time-series waveforms. Parameters are the
breath-by-breath ventilator parameters calculated by the Analyzer device. Events are
information placed into the data files by you. VT for Windows provides an interface for
you to mark events during data collection.
VT for Windows can generate three different file types:
• *.vtp
The software generates .vtp files when you select to save data to a file. These files
contain signal, parameters, and event information.
• *.sig
Signal file of raw waveforms. The software generates the .sig files from the .vtp files
using a file conversion program. Do this by selecting Extract Signal File from the VT
for Windows File menu. Close all files to enable this option. The .sig files are in
ASCII format; you can easily import them into your favorite spreadsheet.
• *.par
Breath-by-breath calculated ventilator parameters. The software generates the .par
files from the .vtp files using a file conversion program. Do this by selecting Extract
Page 91

Appendices
VT for Windows A
Parameter File from the VT for Windows File menu. Close all files to enable this
option. The .par files are in ASCII format; you can easily import them into your
favorite spreadsheet.
VT for Windows uses a simple means to annotate data files. Each of the annotations is
marked as an "event" in the data file. When you play data files back, the annotated text
and the time of the event appear on the screen.
Events
VT for Windows supports six different types of events:
1. Start of file
2. Beginning of a recording
3. Time stamp
4. Annotation
5. End of file
6. Automatic event
Each event is marked in the .vtp data file with a time stamp. For the beginning of a
recording and for an annotated event, a dialog box appears with a space provided for you
to enter the text annotation.
Zeroing
Periodically, it is a good idea to zero the signals on the Analyzer to null any offset errors
in the flow and pressure sensors. You can set the Analyzer to zero flow and airway
pressure. This nulls offset errors in the pressure transducers. Do not use this option if
there is flow in a flow port. See Figure A-7.
VT for Windows offers two different ways to perform a zero:
1. Select Zero All from the Zeroing menu.
2. Select Zero All with the Zeroing button on the toolbar.
Figure A-31. Zeroing Menu
edg72s.bmp
The Oxygen selection allows you to zero out any offset for drift when air (21% oxygen)
passes through one of the flow sensors. You can then calibrate the Oxygen Sensor by
applying a flow of 100% oxygen.
A-25
Page 92

VT MOBILE
Operators Manual
Other Setup Functions
Breath Detect
Breath Detect Threshold
Access these settings from the Setup menu.
The Analyzer uses a built-in breath detection algorithm. The algorithm determines the
breath phases, rejecting signal noise and other artifacts.
The Analyzer breath detection algorithm uses a flow rate threshold that the flow must
cross to trigger a change in the breath phase. Higher flow rate thresholds yield less
sensitive breath detection. Lower thresholds yield more sensitive breath detection.
To enter a new threshold, select Threshold from the Breath Detect menu under the Setup
menu, as shown in Figure A-32.
Figure A-32. Breath Detect Threshold Selection
edg96s.bmp
The dialog box shown in Figure A-33 now appears, allowing you to enter your new
value. Change the value by using the scrolling arrows or by entering a number directly.
Figure A-33. Breath Detect Dialog Box
edg73s.bmp
A-26
Page 93

Appendices
VT for Windows A
Gas Settings
The Analyzer can compensate for the effects of gas temperature, viscosity, molecular
weight, and relative humidity on flow measurement, as well as correct flow calculations
to one of several standard conditions. The Gas Settings option gives you access to these
settings.
To change the gas settings, select Gas Settings from the Setup menu. The dialog box
shown in Figure A-34 appears, allowing you to make the changes.
Figure A-34. Gas Settings Dialog Box
edg74s.bmp
When you select the Advanced option, the Gas Settings dialog box lets you adjust the
temperature, viscosity, molecular weight, and relative humidity for both the inhaled and
exhaled gases. In addition, you can adjust the ambient temperature and have the flow
adjusted to one of four standard correction modes (ATP, BTPS, STPD0, and STPD21).
See Figure A-35.
A-27
Page 94

VT MOBILE
Operators Manual
Figure A-35. Advanced Gas Settings Dialog Box
edg75s.bmp
If you do not know the viscosity or molecular weight of the gas you are
using, click the Gas Calculator button.
Gas Calculator
The gas calculator (Figure A-36) allows you to calculate the viscosity and molecular
weight of a gas mixture. One gas serves as a balance gas. This means that the calculator
automatically adjusts the percentage of this gas to insure that the total percentage of gases
totals 100%. To change which gas is the balance gas, click the radio button to the left of
the gas’s name. Use any of the five standard gases as a balance gas.
You can adjust the percentage each gas makes up of your mixture by changing the values
in the two columns to the right of the gas’s name. If you have a gas in your mixture that
is not one of the standard five, you may use one of the user gases. The user gases have
four predefined gas options (halothane, isoflurane, enflurane, and desflurane) and a userdefined option. Select your gas from the list of predefined gases or if the gas you are
using is not one of these predefined gases, select the user-defined option. Enter the
molecular weight, viscosity coefficient, and viscosity intercept into the boxes given.
Clicking the Air button or the Respiration button sets the calculator to the defaults for air
or respiration.
Note
A-28
Page 95

Appendices
VT for Windows A
Figure A-36. Gas Calculator Dialog Box
edg77s.bmp
Enter the temperature and relative humidity for both inspiratory and expiratory gases in
the boxes provided. The software calculates the viscosity and molecular weight every
time you make a change to any of the controls. When you are done, click the OK button
to accept these values. The software places the viscosity, relative humidity, molecular
weight, and temperature in the appropriate boxes in the Gas Settings dialog box.
Click the Custom Gases tab to access the Custom Gases dialog box (Figure A-37). This
dialog box allows you to enter gas information specific to user-defined gases.
A-29
Page 96

VT MOBILE
Operators Manual
Barometric Pressure
The Analyzer automatically calculates the barometric pressure to within 2% of reading.
To give greater accuracy, the Analyzer allows you to calibrate the barometric pressure
offset by entering the local barometric pressure into the system. The Analyzer uses the
entered value to calibrate the system's barometric pressure offset during future use.
Exercise caution in changing barometric pressure readings; correct
barometric pressure yields more accurate pressure, flow, and volume
readings. Under normal operating conditions, barometric pressure should
not need adjustment.
The Analyzer relies on ambient barometric pressure. Do not set for airport
barometric pressure, which is corrected for altitude.
Figure A-37. Custom Gases Window
Note
edg76s.bmp
A-30
Page 97

Appendices
VT for Windows A
To change the barometric pressure, select Barometric Pressure from the Setup menu.
Enter the local barometric pressure in the dialog box provided (Figure A-38), and then
click the OK button.
Figure A-38. Barometric Pressure Dialog Box
Downloading Files from the Analyzer
You can download files stored on the Analyzer by selecting VT Mobile Æ Download
Files. Check the required file(s) in the File Download window, and then click the
Download button. Finally, select or create a destination folder and click OK. VT for
Windows stores downloaded files with the .vtm extension.
edg78s.bmp
A-31
Page 98

VT MOBILE
Operators Manual
A-30
Page 99

Appendix B
Specifications
General Specifications
Size: 8 L x 1.5 H x 4 W inches (20 L x 3.8 H x 10 W cm)
Weight: 1 lb (0.45 kg)
Temperature:
Maximum Humidity, Operating: 80 % relative humidity up to 31 °C (88 °F), decreasing linearly to 50 %
Maximum Humidity, Storage: 95 %
Barometric: 7 to 18 psia, operating; -1000 to 10000 ft (787.9 – 522.7 mmHg), storage
Operating: 10 to 40 °C (50 to 104 °F)
Storage: -25 to 50 °C (-13 to 122 °F)
relative humidity at 40 °C (104 °F).
Battery Power Supply
Voltage: 9 VDC
Power Consumption: < 70 mA
Battery Life: > 7 hours
External Power Supply
Output Voltage: 12 – 15 V
Output Current: 1.2 A
Measurement Specifications
Low-Pressure Port
Maximum Applied Pressure:
Operating Pressure (Differential): -20 to 120 cmH
Operating Pressure (Common Mode):
Span Accuracy:
Frequency Response:
Resolution:
Sample Rate:
Fittings:
Note: Apply no fluid to the port.
5 psi
NA
± 2 % of reading or 1.5 mmHg, whichever is greater
> 10 Hz
0.1 mmHg
100 Hz
Flow Connector with 2 tubes "T" connected to a
single fitting
O
2
B-1
Page 100

VT MOBILE
Operators Manual
High-Pressure Port
Maximum Applied Pressure: 125 psi
Operating Pressure: - 2 psi to 100 psi
Span Accuracy: ± 2 % of reading or ± 0.2 psig, whichever is greater
Frequency Response:
Resolution:
Sample Rate:
Fittings:
Note: Apply no fluid to the port.
Airway Pressure
Maximum Applied Pressure:
Operating Pressure:
Span Accuracy:
Frequency Response:
Resolution:
Sample Rate:
Fittings:
> 10 Hz
0.1 psi
100 Hz
Single port, Luer lock, stainless steel
5 psi
- 20 cmH
± 2 % of reading or ± 2 cmH
> 25 Hz or t
0.1 cmH
O to 120 cmH2O
2
< 40 ms
10-90
O
2
O, whichever is greater
2
100 Hz
Internally connected to flow sensor pressure lines
B-2
 Loading...