

Page 1

VR101S
Voltage Event Recorder
System
Users Manual
®
December 1997, Rev. 4, 06/02
© 1997, 1999, 2002 Fluke Corporation. All rights reserved.
All product names are trademarks of their respective companies.
Page 2

Page 3

LIMITED WARRANTY & LIMITATION OF LIABILITY
Each Fluke product is warranted to be free from defects in material and
workmanship under normal use and service. The warranty period is one
year and begins on the date of shipment. Parts, product repairs and
services are warranted for 90 days. This warranty extends only to the
original buyer or end-user customer of a Fluke authorized reseller, and
does not apply to fuses, disposable batteries or to any product which, in
Fluke’s opinion, has been misused, altered, neglected or damaged by
accident or abnormal conditions of operation or handling. Fluke warrants
that software will operate substantially in accordance with its functional
specifications for 90 days and that it has been properly recorded on nondefective media. Fluke does not warrant that software will be error free or
operate without interruption.
Fluke authorized resellers shall extend this warranty on new and unused
products to end-user customers only but have no authority to extend a
greater or different warranty on behalf of Fluke. Warranty support is
available if product is purchased through a Fluke authorized sales outlet
or Buyer has paid the applicable international price. Fluke reserves the
right to invoice Buyer for importation costs of repair/replacement parts
when product purchased in one country is submitted for repair in another
country.
Fluke’s warranty obligation is limited, at Fluke’s option, to refund of the
purchase price, free of charge repair, or replacement of a defective
product which is returned to a Fluke authorized service center within the
warranty period.
To obtain warranty service, contact your nearest Fluke authorized service
center or send the product, with a description of the difficulty, postage
and insurance prepaid (FOB Destination), to the nearest Fluke authorized
service center. Fluke assumes no risk for damage in transit. Following
warranty repair, the product will be returned to Buyer, transportation
prepaid (FOB Destination). If Fluke determines that the failure was
caused by misuse, alteration, accident or abnormal condition of operation
or handling, Fluke will provide an estimate of repair costs and obtain
authorization before commencing the work. Following repair, the product
will be returned to the Buyer transportation prepaid and the Buyer will be
billed for the repair and return transportation charges (FOB Shipping
Point).
THIS WARRANTY IS BUYER’S SOLE AND EXCLUSIVE REMEDY AND
IS IN LIEU OF ALL OTHER WARRANTI ES, EXPRESS OR IMPLIED,
INCLUDING BUT NOT LIMITED TO ANY IMPLIED WARRANTY OF
i
Page 4

MERCHANTABILITY OR FITNESS FOR A PARTICULAR PURPOSE.
FLUKE SHALL NOT BE LIABLE FOR ANY SPECIAL, INDIRECT,
INCIDENTAL OR CONSEQUENTIAL DAMAGES O R LOSSES,
INCLUDING LOSS OF DATA, WHETHER ARISING FROM BREACH
OF WARRANTY OR BASED ON CONTRACT, TORT, RELIANCE OR
ANY OTHER THEORY.
Since some countries or states do not allow limitation of the term of an
implied warranty, or exclusion or limitation of incidental or consequential
damages, the limitations and exclusions of this warranty may not apply to
every buyer. If any provision of this Warranty is held invalid or
unenforceable by a court of competent jurisdiction, such holding will not
affect the validity or enforceability of any other provision.
Fluke Corporation, P.O. Box 9090, Everett, WA 98206-9090 USA, or
Fluke Industrial B.V., P.O. Box 680, 7600 AR, Almelo, The Netherlands
SERVICE CENTERS
To locate an authorized service center, visit us on the
World Wide Web:
http://www.fluke.com
or call Fluke using any of the phone numbers listed
below:
+1-888-993-5853 in U.S.A. and Canada
+31-402-678-200 in Europe
+1-425-356-5500 from other countries
ii
Page 5

Table of Contents
Chapter 1
Getting Started...............................................................1
Introduction.................................................................1
Features of the Voltage Event Recorder System....1
Safety......................................................................3
Plugging in a recorder.............................................3
Electrical Immunity..................................................4
Safety Inspection ....................................................5
Battery Care............................................................5
Maintenance ...........................................................6
Product Service.......................................................6
What You Need to Run Fluke EventView Software....7
What’s in the VR101S Package..................................7
Installing EventView software.....................................8
Setting the Time and Date ........................................10
Chapter 2
Setting Up the VR101 ..................................................11
Introduction...............................................................11
Connecting the Optical Interface Cable....................11
Starting EventView...................................................11
Selecting a COM Port...........................................12
Opening the Site Report Window..........................12
Setting Thresholds on the Status Tab...................13
Viewing the Default Threshold Settings................15
Choosing and Saving New Default Threshold
Settings.................................................................15
Choosing Operating Options.................................15
Describing the Site ................................................16
Viewing Realtime Readings of the Recorder........16
Viewing Recorder Information...............................16
Sending the Setup to the Recorder.......................17
iii
Page 6

VR101S
Users Manual
Chapter 3
Retrieving and Saving Events......................................19
Retrieving Events from a Recorder...........................19
Saving Events...........................................................20
Opening an Already Saved File.............................21
Chapter 4
Displaying and Printing Events.....................................23
Displaying Events.....................................................23
Viewing the Events Tab.........................................23
Viewing Events as a Bar Graph ............................29
(Quick Summary)...................................................29
Viewing a Single Transient as a Graph.................30
Viewing Events as an Event Distribution Graph....31
Changing Graph Styles.........................................33
Printing Events.......................................................... 34
Chapter 5
Troubleshooting............................................................35
Optical Interface Cable.............................................35
Printers .....................................................................37
Voltage Event Recorder............................................37
Technical Support.....................................................38
Chapter 6
Power Quality Issues....................................................39
Power Quality Background .......................................39
Why Is It Such a Concern?....................................39
Common Questions about Power Quality.............40
Power Quality Definitions and Standards .................41
Power Line Disturbance Definitions ......................41
How Bad is Bad?...................................................42
The CBEMA Curve................................................42
Causes and Effects of Poor Power Quality...............43
Causes of Poor Power Quality..............................43
How Power Line Disturbances Affect Your
Equipment.............................................................44
Performing a Power Quality Study............................45
Developing a Power Quality Monitoring Program..45
Now That I Have This Information, What Do I Do
with It?...................................................................48
iv
Page 7

Chapter 7
VR101 Specifications...................................................51
Equipment Ratings...................................................51
Sag, Swell & Outage Measurement..........................54
Transient Measurement............................................55
Frequency Measurement..........................................55
Time Measurement...................................................56
Approvals..................................................................57
v
Page 8

VR101S
Users Manual
vi
Page 9

Chapter 1
Getting Started
Introduction
Features of the Voltage Event Recorder System
The VR101 Voltage Event Recorder, hereafter referred
to as the recorder, records sags, swells, transients,
outages, and frequency variations on the power line. It
is self powered and easy to use—parameters can be set
by a few easy keyst rokes from your PC equipped with
EventView Software
The recorder can retain 4,000 events. The existence of
recorded events is indicated by the recorder’s flashing
light.
Communication between a PC and the recorder is
carried via the Optical Interface Cable. By using this
optical data transfer, the PC remains electrically
isolated.
TM
.
1
Page 10

VR101S
Users Manual
A Quick Overview
The following steps are discussed in detail throughout
this manual:
1. Read the next five pages on safety and battery
care.
2. Install EventView Software on your PC.
3. Plug the VR101 into the closest wall socket.
4. Connect your computer to the VR101 with the
optical cable.
5. Use EventView to adjust the settings on your
VR101.
6. Disconnect the optical cable and move the VR101
to the receptacle you want to monitor.
7. After monitoring, use EventView to download the
results.
2
Page 11
Getting Started
Introduction
Safety
Attention
Carefully read the following safety
information before using the recorder.
Safety Precautions
Specific warning and caution statements, where they
apply, will be found throughout the manual.
A Caution identifies conditions and actions that
may damage the recorder.
A Warning identifies conditions and actions that
pose hazard(s) to the user.
Symbols used on the VR101 and in this manual are
explained in the next table.
1
See explanation in
manual
Recycling
information
Disposal
information
Double Insulation
(Protection Class)
Warning
The recorder is designed and certified to
work only on single-phase systems.
Attempting to modify the recorder or
operating it improperly may cause circuit
damage which can ultimately result in
property damage, personal injury, or death.
Plugging in a recorder
The recorder is designed to plug into a standard
convenience outlet. As a safety precaution, the unit
should be in a place where it can be easily unplugged.
This will also make it accessible for data retrieval. The
recorder does not require a protective earth connection
for safety since there are no exposed metal parts. The
earth conductor is used to measure neutral to ground
3
Page 12

VR101S
Users Manual
(N-G) events and to measure the recorder’s polarity,
indicated by the LED. Also see below under “Using an
Ungrounded Outlet”. The ground prong may be
electrically disconnected (as long as it is not exposed).
The recorder does not need special ventilation,
however, its ambient temperature should not be allowed
to rise above the operating limit. (See Chapter 7 “VR101
Specifications”.
Using an Ungrounded Outlet
Plugging the recorder into an ungrounded outlet has the
following consequences:
1. Polarity indication by the LED is not valid.
2. Neutral to ground events captured are not valid.
3. If the recorder is plugged in improperly (improper
polarity), hot to neutral events captured are shifted
180 degrees and indicated with the opposite
polarity.
Polarity Indication
In some countries outlets are not polarized. This means
that the recorder can be plugged in improperly (hot and
neutral swapped). Improper polarity connection will not
cause damage to the recorder but events will not be
correctly recorded and the results may cause
misinterpretation.
Note 1:
When plugging in the recorder improperly
(improper polarity connection), the LED will
blink quickly during 8 to 16 seconds (also see
Note 2). When plugging in correctly, the LED
lights steadily during 8 to 16 seconds. Polarity
indication starts from 0 to 8 seconds after
plugging in.
Note 2:
The LED on the recorder also blinks when an
event is captured, but then it blinks slowly.
4
Page 13

Getting Started
Introduction
1
Electrical Immunity
The recorder’s internal circuitry is solid-state with built-in
EMI and RFI protection to ensure reliable readings. The
recorder will withstand exposure to a 3,400V transient
for a duration of 20 ms.
Safety Inspection
We recommend that you inspect the recorder
periodically for visible damage. To ensure that it
operates safely, inspect for missing labels, cracks in the
case, or bent and/or broken blades.
Battery Care
The recorder contains a lithium battery which will, under
normal circumstances, allow it to operate for 7 years.
Exposing the recorder to extreme temperatures for
extended periods of time may reduce battery life by as
much as 50%. The recorder is designed for INDOOR
USE. It should not be exposed to direct sunlight.
Do not store the recorder with the event indicator
flashing. This consumes battery power and reduces
battery life. (See page 17 for information on how to
clear the recorder’s events from memory.)
To extend battery life, keep the recorder plugged into a
standard convenience outlet (even when not in use).
This conserves battery power especially when
frequently downloading stored events.
Warning
Battery poses fire, explosion and severe
burn hazard. Do not recharge, disassemble,
heat above 212 °F (100 °C), incinerate, or
expose contents to water
5
Page 14

VR101S
Users Manual
Note:
The VR101 contains a lithium battery. Do not
dispose of the VR101 with other solid waste.
The VR101 should be disposed of by a
qualified recycler or hazardous materials
handler. Contact your authorized FLUKE
Service Center for recycling information.
Maintenance
The recorder is a maintenance-free product. However, it
is recommended that it be kept clean to allow for easy
visual inspections. To clean the recorder, unplug it from
the outlet and wipe it with a dry, clean cloth.
Product Service
The recorder has no user-serviceable parts inside. The
fuse and battery inside the recorder are NOT
REPLACEABLE. Opening the case, or attempting to do
so, will void the warranty and safety certification.
The Optical Interface Cable is the only replacement part
in the VR101S package.
If you require service, please contact your local dealer
or an authorized Fluke service center. (See under
“Service Centers” in the front of this manual.)
6
Page 15

Getting Started
What You Need to Run Fluke EventView Software
What You Need to Run Fluke
EventView Software
In order to run Fluke EventViewTM software, your
computer system must include:
• IBM PC or 100% compatible, with Windows 3.1 or
Windows 95/98/NT installed and operating
• At least one free serial port, 9-pin
• A pointing device (recommended)
• 2 MB hard drive space
• 4 MB RAM (8 MB for Windows 95/98/NT)
Optional Equipment:
• A printer port with a printer supported by Microsoft
Windows
What’s in the VR101S Package
The VR101S package contains the following items:
• VR101/xxx Voltage Event Recorder unit.
• EventViewTM software and Users Manual, located
on CD
• Optical Interface Cable
• Product Registration Card + return envelope
EventView software enables you to set up the recorder,
download all the stored events and display the stored
information.
1
7
Page 16

VR101S
Users Manual
Installing EventView software
1. Before installing EventView software, close other
applications, or restart Windows.
2. For Windows 3.1, open Program Manager, select
File from the menu bar and choose Run...
Windows 95/98/NT users select Start from the
Taskbar on the desktop and choose Run...
3. Insert EventView Disk 1 of 2 in your computer’s
disk drive. In the Run dialog box, type a:setup for
drive A and press Enter (the Return key on some
keyboards). If you are using drive B, type b:setup.
4. EventView supports several languages. If one of
these languages has been specified in the
Windows control panel, EventView uses the same
language. If any other language is specified in
Windows, the EventView setup procedure displays
a language selection menu. Select the desired
language.
During the following steps, change diskette as
indicated.
“Welcome!”
5. A
click Next if you want to start installing the
EventView Software on your hard drive.
6. An information screen appears to inform you about
some important items for installation and use of
EventView Software. Read this carefully. Click
Next.
7. Select the Destination Directory for the EventView
Software. If you want to install the software in the
default directory, click Next. If you prefer another
directory, click Browse to select this directory, then
click Next.
8. A dialog box appears asking if you would like to
back up replaced files. It is a good idea to do so
(select “Yes”.) Click Next.
8
dialog box will appear asking you to
Page 17

Getting Started
Installing EventView software
9. Specify a backup directory or just click Next to
select the default directory. (Note: The backup
directory will be empty if no files are replaced.)
10. Windows 95/98/NT users click Next to begin
installation.
For Windows 3.1 users a dialog box appears to
select or to create the Windows Program Group to
add the EventView Software to. Click Next to
create the Fluke PQ Tools program group. (PQ
stands for Power Quality.)
Click Next to begin installation.
11. Finally click Finish to exit EventView Software
installation.
1
9
Page 18

VR101S
Users Manual
Setting the Time and Date
It is very important th at your PC system’s time and date
are correct before running the EventView program.
When retrieving data from the recorder, the EventView
program uses the PC’s internal clock for time and date
reference. (See the following note.)
• With Windows running, set the time from the
Control Panel in Program Manager.
• Windows 95/98/NT users open the Control Panel
from the Taskbar by choosing Start, Settings, and
Control Panel.
Information about setting the time can be found in the
Windows User’s Guide.
Note
If your PC’s internal clock switched from
summer time to winter time or vice versa
during the period that the VR101 is capturing
events, you should correct the Start Time and
the End time (if date and time indicated) of the
events that occurred up to the time change by
adding or subtracting one hour. (See “Viewing
the Events Tab on page 23.
10
Page 19
Chapter 2
Setting Up the VR101
Introduction
This chapter explains how to use EventView
to program the internal settings of the recorder.
Connecting the Optical Interface Cable
The EventView program communicates with the
recorder via the Optical Interface Cable.
• Plug this cable into an available 9-pin COM port in
your computer.
If your computer has only a 25-pin COM port, plug a
9- to 25-pin adapter (not included with your interface
package) into your computer, and plug the interface
cable into the adapter.
TM
software
Starting EventView
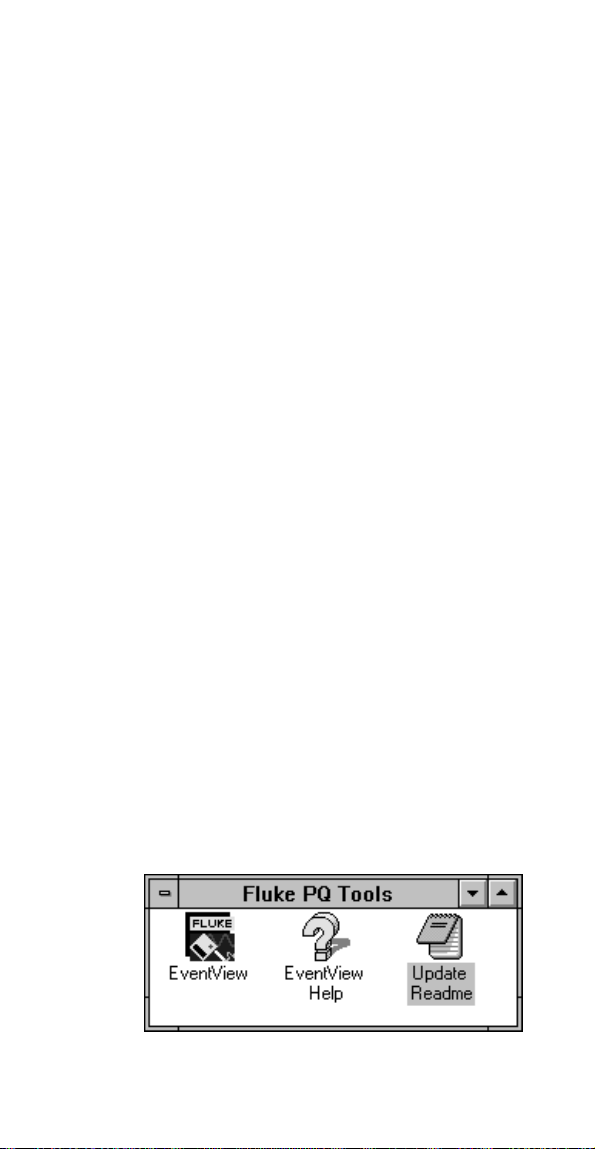
• Windows 3.1 users double-click the Fluke
EventView program icon EV101 in the Fluke PQ
Tools group window.
(Double-click the Update Readme i con to read the latest
information about the VR101S. )
11
Page 20
VR101S
Users Manual
• Windows 95/98/NT users click Start on the
Taskbar, and choose Programs, Fluke PQ Tools
and then EventView.
(Select Update Readme to read the latest information
about the VR101S.)
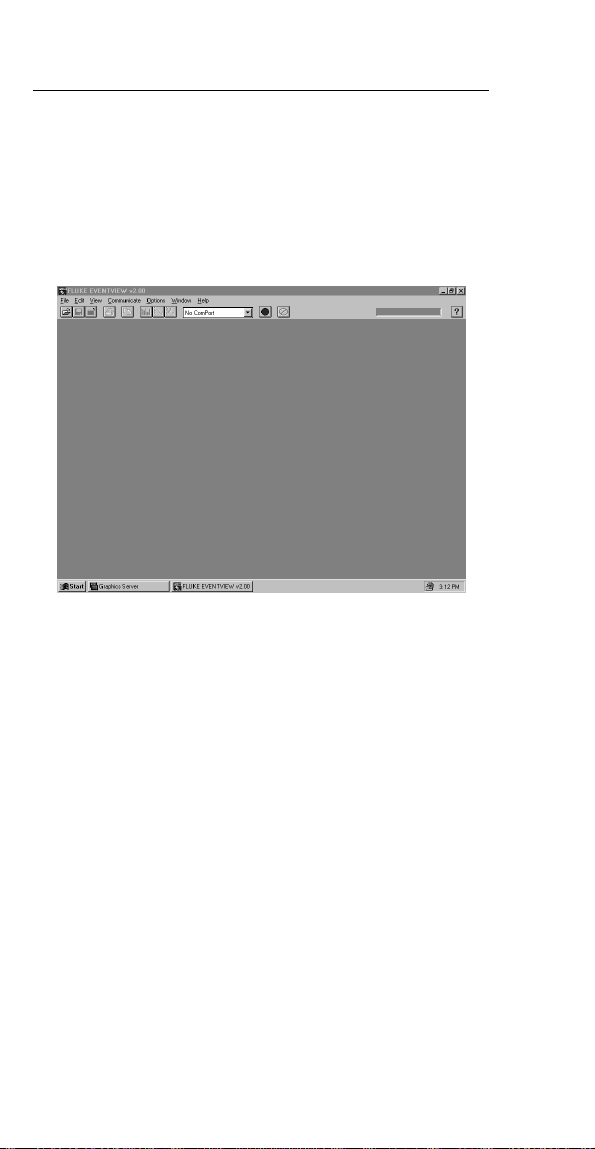
The main FLUKE EVENTVIEW window will open.
Selecting a COM Port
• With the main FLUKE EVENTVIEW window open,
from the Communicate menu choose the COM port
that the Optical Interface Cable is connected to.
The Communicate menu displays the available COM
ports on your computer.
When you have chosen the correct port, the optical
wand and the red scanning button on the ToolBar will
start to flash. When the wand is flashing it is ready to
communicate with the recorder. If the wand doesn’t
flash, please refer to Chapter 5 “Troubleshooting”.
Opening the Site Report Window
1. With the main VR101 window open, the Optical
Interface Cable connected to a COM port, and the
red scan button flashing, point the optical wand at
the optical port of the recorder (from 0.25” away or
closer) or plug the wand directly into the recorder’s
recessed optical port.
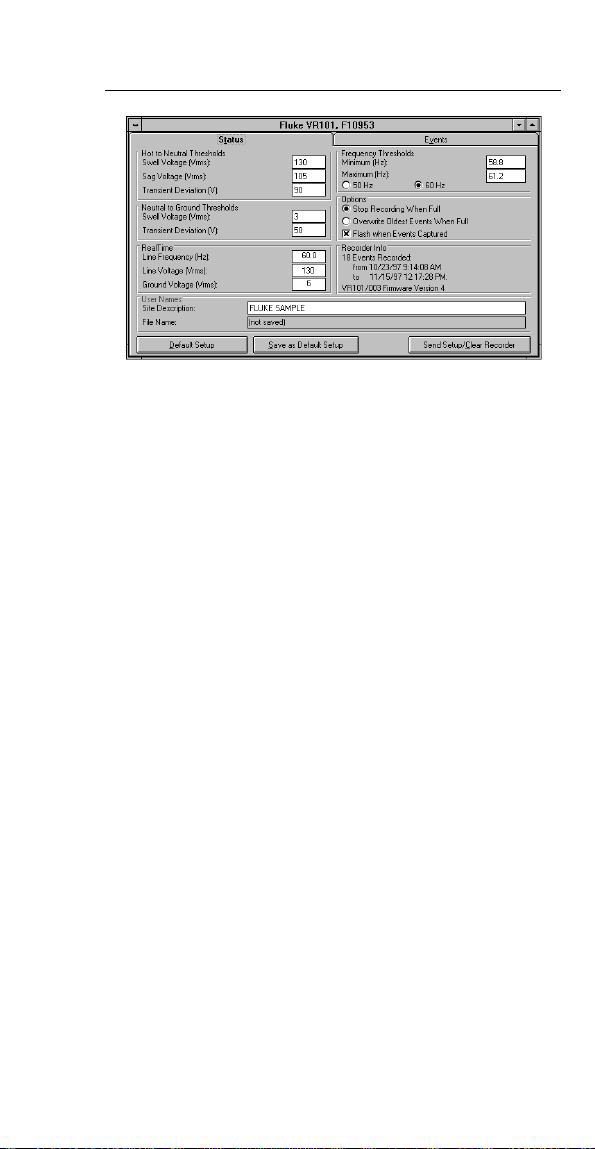
The Site Report Window will open.
12
Page 21
Setting Up the VR101
Starting EventView
2
The Site Report window displays the recorder’s
settings and its recorded events.
If the VR101 is not plugged into a power source, an
information box will appear saying “No voltage
detected on recorder. Realtime halted to conserve
power.” Click OK to continue.
2. Remove the optical wand from the recorder.
Setting Thresholds on the Status Tab
The thresholds are in three categories on the Status
tab: Hot to Neutral, Neutral to Ground, and Frequency.
To change any threshold setting, double-click the
setting and then type in the new value.
Voltage Transients
Transients are fast voltage fluctuations (sometimes
called spikes). They can be positive or negative and can
occur on the hot-neutral line or on the neutral-ground
line. The voltage potential of a transient can be quite
large; hundreds of volts is not uncommon. Transients
typically have a duration far below one cycle and can be
detected down to 1 µs.
The recorder will record as a transient any voltage
deviation of less than one cycle that exceeds the
transient threshold for more than 1 µs.
Voltage Swells
Swells are increases in voltage that last at least ½
cycle. Swells can occur on the hot- neutral lines or on
the neutral-ground lines. Typically, swells are in the
order of tens of volts and last from several cycles to
several seconds.
13
Page 22

VR101S
Users Manual
If the voltage exceeds the swell voltage threshold for
longer than one cycle, a swell e vent will be recorded.
Voltage Sags
Sags are decreases in line voltage lasting for at least ½
cycle. Sags are only measured on the hot-neutral lines.
Typically, a sag will be a few volts or tens of volts below
normal.
If the voltage drops below the sag threshold a sag event
will be recorded. If it drops to below 70Vrms the event
will be recorded as an outage.
Line Frequency Variations
Frequency variations are changes in frequency above
or below the nominal frequency (60Hz in North America,
50Hz in Europe, for example). Variations in frequency
are typical ly a few cycles and can be from seconds to
minutes in duration.
If the frequency drops below the minimum threshold a
low frequency event will be recorded; if it exceeds the
maximum threshold a high frequency event will be
recorded.
For a 120V recorder version the frequency will default to
60Hz.
14
Page 23

Setting Up the VR101
Starting EventView
2
Viewing the Default Threshold Settings
The EventView program has factory-installed default
threshold settings. These settings are adequate for
most applications.
• To see the default threshold settings on the Status
tab, click the Default Setup button.
If you are concerned that some of your electronic
equipment may have particular power quality
requirements, we suggest that you call the equipment
manufacturer for that information. You may discover
that you should alter some of the recorder’s threshold
settings in order to monitor power quality more closely.
Choosing and Saving New Default Threshold Settings
If the factory-installed default threshold settings of the
recorder do not suit your application you may choose
new settings and designate them as the default settings.
1. Make your changes to the settings.
2. Click the Save as Default Setup button.
3. In the dialog box that appears, click OK to confirm
that the default settings will be changed.
These settings are now saved in your computer and
can be sent to any recorder that you communicate
with by clicking Send Setup/Clear Recorder.
Choosing Operating Options
Stop Recording When Full or Overwrite Oldest Events When Full
A recorder can store 4,000 events. You can program it
to either stop recording events or to continue recording
when it is full and record over the oldest events in its
memory.
• Choose either Stop Recording When Full or
Overwrite Oldest Events When Full.
Flash When Data Available
• Check Flash When Data Available if you want the
recorder to blink when it has stored one or more
events (default condition).
15
Page 24

VR101S
Users Manual
Describing the Site
Site Description
the location of the recorder, for instance, if you need to
distinguish between the locations of three recorders in
one office. You may describe the site in your own words
using up to 30 characters. The site description will also
appear as the title of a Quick Summary, a Transient
Graph, and an Event Distribution Graph.
Viewing Realtime Readings of the Recorder
gives you the opportunity of specifying
After establishing communication, leave the wand in the
optical port while the recorder is plugged into an outlet
to see, in real time:
• Line voltage readings (the voltage between the hot
and neutral lines)
• Ground voltage readings (the voltage between the
neutral and ground lines),
• Line frequency readings (the frequency between
the hot and neutral lines)
These readings appear under the
You can turn realtime reading off and on by clicking on
the red Scan button.
RealTime
heading.
Note:
The recorder can NOT record events during
realtime reading. Click the red scan button to
stop realtime reading and to resume event
recording.
Note that if the recorder is not plugged into an outlet
while the wand is in the optical port, real time reading
will stop after a few seconds to conserve power.
Viewing Recorder Information
Under the heading,
see the number of events saved in the recorder and the
time span over which the data was collected.
If no events have been gathered, the words
Stored
will be displayed.
16
Recorder Info
, you will be able to
No Events
Page 25

Setting Up the VR101
Starting EventView
2
Sending the Setup to the Recorder
and as a consequence,
Clearing all events from the recorder
1. Place the wand into the optical port of the recorder.
2. If you have changed threshold settings or you are
leaving the settings the way they are, click Send
Setup/Clear Recorder button.
If you are changing the recorder’s settings to the
default settings, click Default Setup and then click
Send Setup/Clear Logger button.
3. In the dialog box that appears, click Yes to confirm
that all previous events will be cleared from the
recorder.
The new settings will be saved in the recorder.
4. Remove the optical wand from the recorder.
The recorder will begin monitoring as soon as it is
plugged into a standard convenience outlet.
Note:
Plugging in and unplugging the recorder can
cause invalid events being captured.
Starting Event Recording
The VR101 does not start recording until the wand has
been removed from the recorder’s optical port. After
approximately 16 seconds, the VR101 will begin to
record voltage events. Recording can also be initiated
by deactivating the red Scan button on the EventView
toolbar. You may then leave the wand in the recorder’s
optical port.
17
Page 26

VR101S
Users Manual
18
Page 27

Chapter 3
Retrieving and
Saving Events
Retrieving Events from a Recorder
1. With the Main VR101 window open, and with the
Optical Interface Cable connected to your
computer, ensure that the wand is blinking. If it is
not, choose Scan from the Communicate menu
(or, on the ToolBar, click the red scan button so
that it flashes).
2. Place the wand into the recorder’s optical port. The
Site Report window will open at the Status tab.
3. To download the recorder’s stored events to your
computer, click the Events tab.
Downloading will start. During download the Cancel
Download button (to the right of the Scan button)
will become activated enabling you to stop the
download.
4. When all events have been copied to your
computer, you may remove the wand from the
recorder.
19
Page 28

VR101S
Users Manual
Saving Events
1. To save the events that you have downloaded
choose Save from the File menu or click the Save
button on the ToolBar.
The Save As dialog box will appear with the current
file name highlighted in the File Name box.
2. You have two save options:
• Save the file with the existing name—this
means that you will overwrite the previous
file of the same name along with all its
data. To do this, click OK and then click
Yes to replace the previous file.
• Save the file with a new name—this
means that you will type a new name for
the file so that the previous file, along with
its name and its data, will still exist. To do
this:
1. Go to "Save File as Type:"
2. Click the scroll bar and select the
desired file type.
3. Once you have selected the file type,
go back up to "File Name:"
4. Change the file extension to match
that of the file type selected in step 2.
20
Page 29

Retrieving and Saving Events
Saving Events
Opening an Already Saved File
1. From the File menu choose Open Site File.
The Open dialog box will appear.
2. Scroll through the list of site files until you find the
file you want.
3. Double-click the selected file (or click it and then
click OK) to open the Site Report window.
The Site report window will open at the Status tab.
3
On the Status tab you will notice that the items that
cannot be changed are displayed dimmed. Only the site
description and the file name can be changed.
21
Page 30

VR101S
Users Manual
22
Page 31

Chapter 4
Displaying and Printing
Events
Displaying Events
EventView software enables you to view events in
different forms:
• The Events tab in the Site Report window lists all
events that the recorder has gathered.
• Sags, swells and transients can be displayed in a
Quick Summary bar graph.
• A single transient can be displayed as a graph.
• An Event Distribution Graph can be displayed.
Viewing the Events Tab
Having downloaded events from the recorder, and with
the Events tab still open, you can view and analyze the
data that the recorder has gathered since it was last
cleared. The recorder can store up to 4,000 events.
Events are displayed in the order of closing (end time).
An event that is closed (ended) most recently is
displayed at the top of the list.
Note
As events can occur simultaneously while their
duration differ, the display order can differ from
the order of their start times. For example,
during a sag event transients can occur.
Though the start time of the sag is earlier than
that of the transients, the sag event will be
displayed later in the list because its end time
is later.
23
Page 32

VR101S
Users Manual
Event # column
The Event # column displays the number of each event.
The most recent events are displayed first. You may
have to scroll down (use the scroll bar on the right of the
window) to view all the events that the recorder has
recorded. The number 0 is given to an
event that is still in progress at the time that the events
were downloaded from the recorder.
Start Time column
open
event—an
The Start Time column displays the time that an event
started. The resolution of the time stamp in a recorder is
eight seconds. Therefore, if a transient occurred once
every second starting at 12:00:00, the first eight
transients would all be reported to have the same time
of 12:00:00. The next eight transients would be reported
as having the same time of 12:00:08. Also, if identical
information was downloaded twice from a recorder, the
two “identical” site reports could show a time difference
of eight seconds.
Event column
The Event column displays the types of events that
occurred.
24
Page 33

Displaying and Printing Events
Displaying Events
4
Transient Events The recorder can detect both
positive and negative transients down to one 1 µs in
duration on either the H-N and N-G circuits. If the
voltage exceeds the transient deviation threshold for
any given half cycle, a transient event will be recorded.
A transient event can include one or more transients
occurring within the same half cycle. The event column
will display the number of transients that the recorder
was able to count.
An example of a transient event can be seen in the
Event tab shown. Event #8 shows a single transient on
the N-G circuit. The polarity for this transient was
positive, the voltage was 414 volts. The transient was
detected at a phase angle of 330 degrees.
Multiple transients can sometimes occur within a ½
cycle. For example, a large single transient followed b y
several cycle s of high frequency ringing.
Since there are an infinite variety of wave shapes that
can be classified as multiple transients, it is impossible
to determine the accuracy of the reported information
under these conditions.
Event #18 shows an example of a multiple transient
event. This event indicates 9 transients that were
detected starting at a phase angle of 271 degrees. The
detected polarity was negative and the voltages of the
transients were measured as 469 volts.
An important point to note about a multiple transient
event such as #18 above, is that the voltage reading in
the Extreme column will be the maximum voltage
(positive or negative) of any transients that occur more
than 100 µs apart. The degree (in the fourth column) will
be the po sition in the cycle of the first transient. The
angle of neutral-ground transients is referenced to the
start of the hot-neutral sine wave.
If a transient is less than 1 µs in length, the recorder will
indicate the magnitude of the transient but will be
unable to determine the polarity. In this case, the
recorder will show the sign of the transient as “+”.
Sag and Swell Events Sag and swell events are
decreases and increases in line voltage that exceed the
thresholds for at least ½ cycle. Swells can o ccur on the
25
Page 34

VR101S
Users Manual
hot-neutral lines or on the neutral-ground lines. Sags
are only measured on the hot-neutral lines.
Outage Events Outage events less than one second
duration are recorded with half cycle resolut ion. Longer
outages are recorded with 8 second resolution.
Sags and outages are events that are closely related as
far as a VER is concerned. If the sag voltage falls below
the minimum operating voltage for longer than one
second, the event will be recorded as an outage. The
VER will go into a low power mode in order to conserve
battery life under these conditions.
During the low power mode operation, the VER will only
check for adequate line voltage every eight seconds.
When the line voltage is restored, normal logging
operation is resumed. This mode switching can present
confusing event data, especially when sags and
outages occur in a sequence.
The following table shows some examples for a 120V
VER. The minimum operating voltage for a 120V VER is
70Vrms and the settings are as follows:
Hot to Neutral Thresholds
Swell Voltage (Vrms): 128
Sag Voltage (Vrms): 105
Transient Deviation (V): 200
Neutral to Ground Thresholds
Swell Voltage (Vrms): 10
Transient Deviation (Vrms): 100
Frequency Thresholds
Maximum (Hz): 61.2
Minimum (Hz): 58.8
Examples 1 to 6 represent events that are recorded due
to line voltage sags of varying voltages and duration.
Examples 7 to 12 show events that are recorded when
sags and outages occur in sequence.
26
Page 35

Displaying and Printing Events
Displaying Events
4
Hot -
Neutral
Voltage Duration
#
1 100V2 cycles 120V
2 40V
3 100V
4 40V
50V
60V
70V
80V
90V
10 100V
11 100V
12 100V
cycles 120V
seconds 120V
seconds 120V
cycles 120V
seconds 120V
seconds 100V
seconds 100V
cycles 100V
seconds 0V
cycles 0V
cycles 40V
Hot Neutral
Voltage Duration VER Data
Outage, 2 cycles
Outage, 2 cycles and
Sag, 2 seconds
Example #10: Since the VER reports the extreme
value of a sag, the event is recorded as an outage
(extreme value of 0V).
High and Low Frequency Events Frequency events
are recorded when the frequency exceeds the
frequency thresholds.
Extreme Column
The Extreme column displays the maximum value
measured during the event.
End Time/Duration/Degree Column
This column displays the duration of an event, or the
time that the event ended, or (in the case of a single
transient) the event’s position on the sine wave (in
degrees).
The way the information is displayed depends on the
length of the event.
• Events of less than one second are displayed in
numbers of cycles.
• Events of one to 119 seconds are displayed in
seconds.
• Events of between two minutes and 24 hours are
displayed in hours, minutes and seconds (for
example, 07:51:24, which means 7 hours, 51
minutes, and 24 seconds).
27
Page 36

VR101S
Users Manual
• Events that last longer than 24 hours display the
end time (date and time).
If an event was still in progress when data was
downloaded from the recorder, the event will be
designated as an
events are assigned the number zero in the Event #
column.
open event
in this column. Open
28
Page 37

Displaying and Printing Events
Displaying Events
Viewing Events as a Bar Graph
(Quick Summary)
Quick Summary displays the number of sag, swell,
transient, outages, and frequency events as bars on a
graph.
1. With the Site Report window open at the Events
tab, choose Quick Summary from the View menu
(or click the Quick Summary button on the
ToolBar).
2. Make your choices from the following options:
All Data or Selected Data To display all sag,
swell, transient, and frequency events, click All
Data. To display a block of events from the Events
tab, select those events by dragging the pointer
through them to highlight them.
Show Hot to Neutral Events Check this box to
display all hot to neutral events.
Show Neutral to Ground Events Check this box
to display all neutral to ground events.
Sort by Date or Sort into Equal Periods If you
want the horizontal axis divided into 24-hour
periods, click Sort by Date. If you want to divide
the horizontal axis into shorter or longer periods,
click Sort into Equal Periods and type the number
of periods you want to display.
3. When you have finished choosing your options,
click OK to close this dialog box and to open the
Quick Summary.
4
29
Page 38

VR101S
Users Manual
The horizontal axis displays time; the vertical axis
displays the number of events that occurred in each
time period. In the bar graph above, the time periods
are sorted by date.
Note that the thickness of a bar and its position in a time
period is irrelevant—the bar only displays the number of
events and the time period they occurred in.
Viewing a Single Transient as a Graph
A single transient event between hot and neutral or
neutral and ground can be displayed as a graph
enabling you to see if the transient is causing zero
crossings. A transient graph is produced using the
amplitude, direction and position (in degrees) of the
event. The graphical representation is not intended to
show what the wave form looks like nor does it show the
duration of the transient.
To graph a transient you must choose an event that
contains only one transient—it is not possible to graph
an event consisting of multiple transients.
1. With the Site Report window open at the Events
tab, double-click the single-transient event you
want to graph.
(There are two other ways of opening a transient
graph: select the single-transient event you want to
graph by clicking it, and then, either choose Single
Transient... from the View menu, or click the View
Single Transient button on the ToolBar.)
30
Page 39

Displaying and Printing Events
Displaying Events
4
2. To open a dialog box of display options, right-click
the mouse with the pointer in the graph. Also see
under Changing Graph Styles” on page 33.
Viewing Events as an Event Distribution Graph
The Event Distribution Graph plots the magnitude of an
event against duration on a logarithmic scale in order to
determine the importance of the data. For example, a
single random event may not be as significant as a
cluster of recurring events. This information can be
interpreted using the CBEMA Curve found in Chapter 6,
Power Quality Issues,
• With the Site Report window open at the Events
tab, choose Event Distribution Graph from the
View menu (or click the Event Distribution button
on the ToolBar).
in this manual.
The Graph Setup dialog box will appear enabling you to
make your display choices. An explanation of these
choices is given under “Viewing Events as a Bar Graph”
on page 29.
31
Page 40

VR101S
Users Manual
• Click OK to close this dialog box and to display the
Event Distribution Graph.
Since the transients have a duration that is unknown,
they are represented as having a width of 10 µs.
32
Page 41

Displaying and Printing Events
Displaying Events
Changing Graph Styles
The Graph Control dialog box contains a number of edit
features that enable you to change the way a graph
appears. These features include naming and placing
titles, using 3D effects, and saving a graph in different
formats.
• Open the Graph Control dialog box by right clicking
anywhere in a graph. For explanations of the
various features click the Help button.
4
33
Page 42

VR101S
Users Manual
Printing Events
Printing Events from the Events Tab
1. With the Events tab displayed, choose Print from
the File menu (or click the print button on the
ToolBar).
2. Choose the option you want from the Print dialog
box (printing all events, printing one or more pages,
or printing a number of events that you selected).
3. Click OK.
Printing a Graph
1. With a Quick Summary, a Transient Graph, or an
Event Distribution Graph open, choose Print from
the File menu (or click the print button on the
ToolBar).
2. Click Setup from the Print dialog box.
3. If you want the horizontal axis longer than the
vertical axis, choose Landscape orientation from
the Print Setup dialog box.
4. Click OK.
5. Choose the options you want from the Print dialog
box and click OK.
If you are printing a Quick Summary or an Event
Distribution Graph with a color printer, EventView
software gives event types different colors so that you
can distinguish between them. If you do not have a
color printer, the software assigns patterns instead of
colors to different event types.
34
Page 43

Chapter 5
Troubleshooting
Optical Interface Cable
Many manufactures of PC software and hardware use
the COM (serial) port(s). It is difficult to predict potential
COM port conflicts. If the Optical Interface Cable’s wand
tip is not flashing, there are a few steps that can be
taken in order to find the source of the problem.
• Make sure that the Optical Interface Cable is
securely plugged in. The Optical Interface Cable
may appear to be properly connected but only be
partially plugged in.
• Try a different serial port. If the PC has more than
one serial port, try another port to see if the Optical
interface flashes.
• Determine if you have any other Windows
programs using the serial port. PC faxing
programs or other programs that use the COM port
can cause conflicts during data transmission. To
verify that no other programs are running and
causing communication problems, shut down your
computer and restart it before you run EventView
software.
• Verify that your serial port settings are correct.
In Windows 3.1 you can use the Microsoft
Diagnostics program,
number of installed serial ports in your PC, and
their settings. These settings should be the same
as those displayed in the advanced section of
“Ports” in the Windows 3.1 Control Panel. Exit
Windows or restart the computer in MS-DOS mode
before running
MSD.EXE
MSD
. If you have an internal
, to find out the
35
Page 44

VR101S
Users Manual
modem, MSD may detect the modem’s serial port.
This serial port cannot be directly used with the
Optical Interface Cable.
Windows 95/98/NT users verify port settings in
Device Manager. Device Manager is found on the
TaskBar by choosing Start, Settings, Control
Panel, System, and Device Manager.
Common Serial Port Settings:
Port I/O Address IRQ
COM1 3F8h 4
COM2 2F8h 3
COM3 3E8h 4
COM4 2E8h 3
• Verify that your serial port is functioning
properly. You can use any standard Windows
communications program to ensure the port is
functioning. Examples of these are
Windows 3.1
HyperTerminal
Terminal
.
or Windows 95/98/NT
ProComm
Exit all programs (including the EventView
program) and connect the Optical Interface Cable
to the port. Run the communications software and
set the local echo to “off” and hardware flow control
to “none”. If you are using HyperTerminal, choose a
direct connection to the port. Open the port with the
communications software. Any alphanumeric
character you type on the keyboard should cause
the optical interface to flash, and the character to
appear on the screen.
If the optical interface does not flash when you
type, disconnect it and use a piece of wire to
connect serial port pins 2 and 3 together. Any
alphanumeric character you type on the keyboard
should appear on the screen. If no characters
appear, the port may be broken or incorrectly
configured. If characters appear, your Optical
Interface Cable may be broken.
If the optical interface flashes when you type, it
should also work with EventView software. Exit the
communications program, and re-start the
,
36
Page 45

Troubleshooting
Printers
EventView program. If you are unable to make the
optical interface flash when running the program,
re-install EventView software.
• Check your mouse driver. Certain older or inferior
drivers for mice, trackballs and laptop “pointing
sticks” are know n to interfere with serial port
operation. If, after disabling your mouse driver, the
optical interface functions normally, try using a
different mouse driver such as Logitech or
Microsoft.
• Try another computer if you have one. An
alternative to serial port troubleshooting is to use a
different computer. Another computer with its serial
ports set up correctly will confirm that there is an
incorrect setup or software/hardware conflict with
the original PC.
Printers
• Verify that the printer is plugged in, turned on, and
has paper.
• Verify that Windows is set up correctly. Windows
uses its own printer drivers. Setup is done through
the Windows Control Panel. If you need help, follow
the instructions in the Windows 3.1 Guide under
Printers/Setup; in Windows 95/98/NT click Help
and choose Troubleshooting Printers.
• Try printing from another program to eliminate the
possibility of a hardware conflict.
5
Voltage Event Recorder
• The voltage readings of the recorder differ on
different meters. A recorder reads voltage in
average RMS. Some manufacturers’ meters may
have a True RMS display.
• Date and/or time are not correct. The recorder
uses the PC’s internal clock to reference the time of
downloaded data. Set the PC’s internal clock to the
current time. The Windows 3.1 User’s Guide, under
System Time and Date, will explain this procedure;
in Windows 95/98/NT click Help, time, and
changing your computer’s time. Make sure that
the time format is either 24-hour or AM/PM, not
both.
37
Page 46

VR101S
Users Manual
• Two recorders have different transient readings
on the same circuit. Locally generated transients
can carry relatively little power. One recorder can
absorb some of the energy leaving less for the next
one to read.
• VER Records long periods of large NG swell.
The VER is plugged into a convenience outlet that
has been wired with the hot and neutral lines
reversed.
• VER does not record any data. The VER does
not record events while communicating. Make sure
that you stop the realtime display. The VER will be
ready to record events in 8-16 seconds.
Technical Support
If you are experiencing problems with your recorder
system, plea se contact your local dealer or an
authorized Fluke service center. (See under “Service
Centers” in the front of this manual.)
38
Page 47

Chapter 6
Power Quality Issues
Power Quality Background
Why Is It Such a Concern?
Many people blame the power utility for degrading
power when, in most cases, the problem is caused by
poor power distribution within a facility. Equipment such
as computers, TVs, phone systems, alarm systems,
process controls and even the heating, ventilation and
air conditioning system in your building use
microprocessor technology to function. As a result, you
must ensure that your electrical environment has good
power to e nsure reliable system operation.
Studies have found that most power line disturbances
are caused by the equipment being operated inside a
building and that few are utility generated. Lightning,
wildlife, and human contact with transmission lines are
the major contributors to power line disturbances on the
distribution grid.
Major causes of power line disturbances in a building
are:
• Overloaded circuits
• Power factor correction capacitors
• Fast switching of large loads
• Incorrect or poor wiring connections
The Effects of Poor Power Quality within Your Organization
Power line disturbances can cause far more trouble
than just equipment damage. By looking at it from a cost
perspective, one can see that there is a far larger loss
from poor power quality.
39
Page 48

VR101S
Users Manual
For example, more than likely your business uses
microprocessor-based systems. If these devices are
continually affected by voltage disturbances, they can
be damaged and cause a shutdown. The downtime will
result in financial losses.
Power quality monitoring should be considered an
integral part of any maintenance program. Continual
monitoring is an easy way to determine whether your
power quality is adequate. It can also help predict your
future power quality requirements.
Common Questions about Power Quality
Why Not Use a Meter and Check?
Determining whether a power quality problem exists is
very difficult with traditional meters and scopes. The
difficulty is that they cannot tell you what has happened
in the past. In addition, power quality problems occur
faster than the blink of an eye. Many power quality
problems result from various types of incompatible
equipment operating simultaneously. Equipment such
as air conditioning units, heavy machinery and office
equipment are the major culprits. Because buildings are
wired with numerous circuits, traditional methods of
pinpointing the source of power conflicts are almost
useless. Data logging can tell you where your problems
occur, at what time, and how often.
Why Not Buy a Protection Device?
Protection devices such as constant voltage
transformers, UPS’s and transient protection devices
may not provide the correct protection for the types of
problems that are occurring on your power line. The
only way to know what type of protection device is
required is to analyze the nature of the power line
disturbances.
For instance, there are many UPS’s at different price
ranges, each claiming to offer some protection. But
some UPS’s cause more problems than they solve.
Outfitting your entire electrical environment with power
quality enhancing devices could cost a large amount of
money not to mention extended downtime. Data logging
your electrical environment before and after choosing a
correction method is the only way to find out whether
you have chosen the best method.
40
Page 49

Power Quality Issues
Power Quality Definitions and Standards
Power Quality Definitions and
6
Standards
Power Line Disturbance Definitions
Disturbance-Free Voltage
Common Power Line Disturbances
Many terms are used to describe power line
disturbances. Below are some graphic examples of
power line disturbances recorded by a recorder followed
by definitions of the terms.
41
Page 50

VR101S
Users Manual
Sag An operating voltage of 90% of nominal volts or
less
Swell More than one cycle above 10% of nominal
Dropout Power loss of 1 ms to 1 s
Outage More than 1 s of power loss
Positive Transient A momentary overvoltage of 4 ms
or less
Negative Transient A momentary undervoltage of 4
ms or less
Frequency Variation ± 1Hz of the fundamental
frequency (50 or 60Hz)
How Bad is Bad?
Manufacturers of electrical equipment may specify
requirements for power quality. The tolerances below
are general and do not apply to all manufacturers of
sensitive electronic equipment. Generally, sensitive
equipment (computers) can operate within the following
voltage tolerances:
Swells
• Up to 10% above nominal continuously
• Up to 30% above nominal for less than 0.5 seconds
Sags
• Down to 10% below nominal continuously
• Down to 30% below nominal for less than 0.5
seconds
• Down to 0 volts for 4 ms (acceptable but not
recommended)
Transients
• Not to exceed ± 150% of sine voltage for more than
0.2 ms
Frequency Variation
• ± 1Hz
The CBEMA Curve
The Computer Business Equipment Manufacturers
Association (CBEMA) has published a susceptibility
graph detailing how various types of power line
disturbances affect sensitive electronic equipment (see
below).
42
Page 51

Power Quality Issues
Causes and Effects of Poor Power Quality
Although this graph does not apply to all equipment, it
does apply to a vast amount of equipment in the
marketplace.
Causes and Effects of Poor Power
Quality
Causes of Poor Power Quality
Swells
• Shutdown of heavily loaded equipment
• Abrupt power restoration
• Utility switching
Sags
• Abrupt increase in load
• Dropouts/Outages
• Lightning
• Outdoor contact with transmission lines
• Ground Faults
• Equipment failures
• Acts of nature
Transients
• Switching loads on and off
• Utility switching
• Lightning
• Normal computer operation
• Fault clearing
• Power factor correction capacitors
6
43
Page 52

VR101S
Users Manual
Frequency Variation
• Major load increases
• Utility switching
How Power Line Disturbances Affect Your
Equipment
Depending on their degree and frequency, power line
disturbances can cause corrupted data or permanent
damage in sensitive electronic equipment. The following
list shows the effects that power line disturbances can
have on various types of sensitive electronic equipment.
Swells
• Discomfort from flickering lights
• Computer damage
• Degradation of power protection equipment
Sags
• Equipment shutdown
• Power-down circuitry in power supply operates
incorrectly
• Computer lock-ups
• Diminished speed of disk drives (data errors)
Dropouts/Outages
• Data loss
• Equipment downtime
• Computer lock-ups
• Clock timing errors
Transients
• Electronics damage (through bypassing protection
circuitry)
• Insulation breakdown in transformers and motors
• Data errors, data loss
Frequency Variation
• Incorrect clock timing
• Writing errors in any electronic writing device
(magnetic tapes, disk drives)
44
Page 53

Power Quality Issues
Performing a Power Quality Study
Performing a Power Quality Study
Developing a Power Quality Monitoring
6
Program
A power quality monitoring program is a simple, useful
process that helps determine the best method for
assessing an electrical environment’s power quality.
Before you monitor power quality, develop a monitoring
plan. the plan should define the duration and location of
your power quality studies. Here are a few basic steps
to developing a power quality study.
Developing a Power
Quality Monitoring Program
Define Location
Network
Server
Tolerance
Setpoint
Oct.Jan. May Dec.Mar. July Nov.Feb. June
Administration
Area
Tolerance
Setpoint
Sample Power Quality Monitoring Program
Production
Area
Tolerance
Setpoint
DurationDurationDuration
45
Page 54

VR101S
Users Manual
Developing a Location Plan
Depending on the size of the organization, number of
departments, and importance of certain locations, note
the priority locations. The location plan may change
throughout the power quality study as clues may direct
you to a possible problem location.
Developing a Tolerance Plan
Thresholds should reflect the equipment being used.
Even a heavy piece of machinery such as a CNC
machine may be considered sensitive since it has
electronic circuits.
The default settings function in EventView software is
adequate for most sensitive loads. Some equipment
may require tighter tolerances. If so, use the tolerances
provided by the manufacturer of the equipment.
Developing the Study Duration Strategy
In order to determine how long to monitor the site,
determine the organization’s workload cycle. A workload
cycle is the duration of production, whether it is a
product or service. A site should be monitored over the
entire workload cycle.
Another consideration is the workload cycle vs. the time
of day, month or season. At 10:00 AM the organization
may be using all of its equipment at once. Air
conditioners tend to operate more often in the summer
months and space heaters tend to operate in the winter
months. This, in conjunction with your organization’s
workload cycle, can cause equipment conflicts
throughout the year. To determine a workload cycle,
answer the questions that are appropriate for your
study.
Manufacturing How long does it take to produce a run
of your product?
Services How often do you provide your service (daily,
seasonally)?
Administration How does your staffing or workload
vary (monthly, seasonally)?
Finalizing the Power Quality Monitoring Plan
The key to finalizing the power quality monitoring plan is
to publish and assign responsibility for it. The power
46
Page 55

Power Quality Issues
Performing a Power Quality Study
quality monitoring program will help make the
organization more productive and will possibly save
money.
Final Note
This is only one strategy that can verify power quality.
Different situations may call for different strategies in
order to investigate and solve power quality concerns.
6
47
Page 56

VR101S
Users Manual
Now That I Have This Information, What Do I
Do with It?
There are two ways to solve most power line
disturbances: either rewire the electrical system to
separate the sensitive loads from the problem
branches, or place a number of UPS’s or other
protection devices in mission critical areas. The problem
with using a UPS is it may introduce more disturbances
downstrea m of the electrical system as it may use a
switch mode power supply. A UPS is only a temporary
solution. The real problem is probably located
somewhere in your electrical distri bution system. Poor
wiring, poor connections, poor load distribution or
improper grounding may be the problem.
When trying to solve power line disturbances, consider
the following:
• The power requirements of the sensitive electronic
equipment
• The severity of the problem
• The effectiveness of each possible type of power
conditioner
• the performance/price relationship
Repetitive / Cycling Events
These types of events are usually caused by
incompatible loads on a circuit. HVAC systems, laser
printers, and large motors may cause conflicts when
they cycle. These types of conflicts occur because the
building’s electrical demand has increased, and there is
no one responsible for monitoring the load on the
system until there is a problem. Moving sensi tive loads
to a separate circuit may solve this problem.
Unrepetitive / Isolated Events
These types of disturbances are usually caused by the
location of the organization. If you are in an area where
there is lightning, high winds, or if the equipment is
being used only occasionally, simple power line
conditioners and filters may help to protect most of the
equipment. Many power line disturbances are easy and
inexpensive to prevent (depending on their frequency
and magnitude).
48
Page 57

Power Quality Issues
Performing a Power Quality Study
The following power conditioning suggestion chart is
useful for choosing an adequate protection device for
unrepetitive power line disturbances.
6
Transient/
Swell
Protector
Transients X* X X
Swells X* X X
Sags X
Outages X
* Used only when transients and s wel l s are moderate in
quantity or else damage may occur to the power protection
device.
When considering a protection device, make sure that it
covers the entire operating range. It is a waste of money
buying a protection device rated to remove transients of
up to 1000 volts if you have recorded transients of more
than this.
The difference between power line filters and protectors
is that filters can catch fast transients of high
magnitudes. Filters tend to be more expensive than
protectors.
The information you receive from your recorder will
enable you to make an informed decisions about
protection devices.
Please note that this appendix is not a comprehensive
study of power quality, nor does it attempt to provide all
solutions to power quality problems.
Power Line
Filter
Uninterruptible
Power Supply
Power quality is a complex issue. It may be necessary
to make additional measurements such as: line current
levels, harmonic content, and distortion using other
power quality diagnostic equipment.
49
Page 58

VR101S
Users Manual
50
Page 59

Chapter 7
VR101 Specifications
The following specifications are valid only when the
Voltage Event Recorder is plugged into a grounded
standard convenience outlet and when the LED
indicates correct polarity.
Specifications subject to change without notice.
Equipment Ratings
Model number VR101/xx3
Nominal Supply:
Operating Range:
Operating Frequency:
120V
70 to 140V
50/60Hz
Power:
Model numbers VR101/xx1, /xx4, /xx5, and /xx7
Nominal Supply:
Operating Range:
Operating Frequency:
Power:
2W
240V
140 to 270V
50/60Hz
3W
51
Page 60

VR101S
Users Manual
Plug Configurations
Back view of country versions
52
L = LINE
N = NEUTRAL
E = EARTH
Page 61

VR101 Specifications
Equipment Ratings
7
Memory Size:
Storage Method:
Sampling Method:
Alarm Type:
Polarity Detection
Polarity Indication:
Size:
Weight:
Operating Limits:
Battery:
Expected Battery Life:
Fuse:
: Within 8 s after plugging in.
Red LED lights steadily during 8
32kB, 4000 events
First-in First-out, or Fill-then-
stop
Continuous (half cycle
integrated)
Optical; red LED slowly blinks
when there are events stored in
memory.
to 16 seconds if polarity is OK.
Red LED quickly blinks during 8
to 16 seconds if improper
polarity.
85mm x 68mm x 35mm
(3.35 in x 2.65 in x 1.35 in)
120g (4 oz)
-40 to 160 °F (-40 to 70 °C)
(excluding Optical Interface
Cable)
0 to 95% RH (non-condensing)
15,000 feet (4.57 km) altitude.
3.6V Lithium (non-replaceable)
7 years (provided that maximum
battery care is taken, see under
“Battery Care” on page 5)
1/16A Fast-blow (non-
replaceable)
53
Page 62

VR101S
Users Manual
Sag, Swell & Outage Measurement
Hot to Neutral
Model number VR101/xx3
Range:
Accuracy:
Resolution:
Model numbers VR101/xx1, /xx4, /xx5, and /xx7
Range:
Accuracy:
Resolution:
Neutral to ground
Model number VR101/xx3
Range:
0 to 200Vrms
±2Vrms*
1Vrms
0 to 270Vrms
±4Vrms**
2Vrms
3 to 150Vrms
Accuracy:
Resolution:
Model numbers VR101/xx1, /xx4, /xx5, and /xx7
Range:
Accuracy:
Resolution:
* sags less than 70V for > 1s will be report ed as 0V
** sags less than 140V for > 1s will be reported as 0V
±2Vrms
1Vrms
3 to 150Vrms
±2Vrms
1Vrms
54
Page 63

VR101 Specifications
Transient Measurement
Transient Measurement
Range
Hot to Neutral:
100 to 2500Vpeak
7
Neutral to Ground:
Accuracy:
Resolution:
Width Detection:
Phase Angle
Range: 20° to 180°, 200° to 360°
Accuracy: ±1°
Resolution: 1°
50 to 2500Vpeak
±10% of reading + 10V
10V
1 µs minimum
Frequency Measurement
Range: 45 to 65Hz
Accuracy: ±0.1Hz (3 cycles minimum)
Resolution: 0.1Hz
55
Page 64

VR101S
Users Manual
Time Measurement
Events <1 s(econd)
Accuracy
Hot to Neutral:
±0.5 cycle*
Neutral to Ground:
±1 cycle**
Resolution
Hot to Neutral:
Neutral to Ground:
0.5 cycle
1 cycle
Clock accuracy: ±2 s/day
Timer counter capacity 4.25 year (24 bit counter,
resolution 8 seconds)
* Outages are reported with ½ cycle resolution until the
VER goes into low power mode. A VER will go into the
low power mode after approximately one second of an
outage condition. In low power mode, the resolution
becomes 8 seconds.
Swell, sag, and frequency events have ½ cycle
resolution up to approximatel y 10 minutes after which
the resolution becomes 8 s ec onds.
** Neutral to Ground swells have 1 cycle resolution up to
approximately 10 minutes after which the resolution
becomes 8 seconds.
56
Page 65

Approvals
Safety:
VR101 Specifications
Approvals
This device is safety approved by CSA
and CSA(NRTL/C) for measurements on
300V CAT III, Pollution Degree 2, double
insulation, per:
UL3111-1 (1994)
IEC1010-1 (1990)
CSA C22.2 No. 1010.1 (1992)
EN61010-1 (1993)
7
Environmental:
EMC:
MIL-T-28800E, Type III, Class 3
FCC rules part 15.
89/336/EEC
Emission: EN50081.1
Immunity: EN50082.2
(IEC1000-4-2, -3, -4, -5)
57
Page 66

VR101S
Users Manual
Declaration of Conformity
for
Fluke VR101
Voltage Event Recorder
Manufacturer
Fluke Industrial B.V.
Lelyweg 1
7602 EA Almelo
The Netherlands
Statement of Conformity
Based on test results using appropriate standards,
the product is in conformity with
Electromagnetic Compatibility Directive 89/336/EEC
Low Voltage Directive 73/23/EEC
Sample tests
Standards used:
EN 61010.1 (1993)
Safety Requirements for Electrical Equipment for
Measurement, Control, and Laboratory Use
EN 50081-1 (1992)
Electromagnetic Compatibility.
Generic Emission Standard:
EN55022 and EN60555-2
EN 50082-2 (1992)
Electromagnetic Compatibility.
Generic Immunity Standard:
IEC1000-4 -2, -3, -4, -5
The tests have been performed in a
typical configuration.
This Conformity is indicated by the symbol
i.e. “Conformité européenne”.
58
,
Page 67

-A-
Approvals, 57
-B-
Bar graph, 29
Battery care, 5
-C-
CBEMA Curve, 42
Changing graph styles, 33
COM port
selecting, 12
Index
-D-
Date and Time, setting, 10
Declaration of Conformity, 58
Default threshold settings
changing, 15
viewing, 15
Displaying events, 23
-E-
Electromagnetic Compatibility, 58
Equipment Ratings, 51
Event Distribution Graph, 31
Events
displaying, 23
printing, 34
retrieving, 19
saving, 20
59
Page 68

VR101S
Users Manual
Events tab
End Time/Duration/Degree Column, 27
Event column, 24
Events # column, 24
Extreme column, 27
Start Time column, 24
-F-
Flash When Data Available, 15
Frequency Measurement, 55
Frequency variations, 14, 27
-G-
Graph Control dialog box, 33
-L-
Logger Information, viewing, 16
-O-
Opening a saved file, 21
Optical Interface Cable, connecting, 11
Options, choosing operating .., 15
Outages, 26
Overwrite Oldest Events When Full, 15
-P-
Polarity Indication, 4
Power quality, 39
common questions, 40
definitions and standards, 41
performing a study, 45
Printing events, 34
-Q-
Quick Summary, 29
-R-
Realtime Readings, viewing, 16
Retrieving events from a Voltage Event Recorder, 19
-S-
Safety inspection, 5
Safety Precautions, 3
Safety Requirements, 58
Sags, 14, 25
Saving events, 20
60
Page 69

Index (continued)
Scan button, 12, 19
Sending setup to a Voltage Event Recorder, 17
Single Transient Graph, 30
Site Description, 16
Site Report Window, opening, 12
Software
equipment required, 7
installing, 8
setting the time and date, 10
starting the program, 11
Specifications, 51
Stop Recording When Full, 15
Swell, Sag & Outage Measurement, 54
Swells, 13, 25
-T-
Thresholds, setting, 13
Time and Date, setting, 10
Time Measurement, 56
Transient Measurement, 55
Transients, 13, 25
Troubleshooting
Optical Interface Cable, 35
printers, 37
Voltage Event Recorder, 37
-V-
Voltage Event Recorder
battery care, 5
electrical immunity, 5
features, 1
plugging in, 3
specifications, 51
61
Page 70

VR101S
Users Manual
62
 Loading...