

Page 1

Ti30
Thermal Imager
User’s Manual
PN 08100-3
January 2005, Rev C
©2005 Fluke Corporation, All rights reserved.
All product names are trademarks of their respective companies.
Page 2

CONTENTS
Introduction..................................................................................................................... 7
Quick Specifications Table............................................................................................. 8
Chapter 1 Unpacking Your New Imager ................................................... 9
First, the Batteries......................................................................................................... 10
Charging the Rechargeable Battery Pack .....................................................................12
Normal Charge Cycle ............................................................................................... 12
Chapter 2 Getting Started.......................................................................... 14
Attaching the Wrist Strap.............................................................................................. 14
Turning the Unit On...................................................................................................... 15
Displaying Images ........................................................................................................15
Settings and Controls.................................................................................................... 18
Keypad...................................................................................................................... 18
Laser On/Off Toggle Button..................................................................................... 20
Centigrade/Fahrenheit Toggle Button....................................................................... 22
LCD Backlight Illumination Switch......................................................................... 22
Palette Switch............................................................................................................ 22
Measurement Mode Switch...................................................................................... 22
Gain and Level Thumbwheels.................................................................................. 23
Focus Wheel.............................................................................................................. 24
Trigger....................................................................................................................... 24
Man Machine Interface Flow Charts ............................................................................ 25
Main Loop................................................................................................................. 25
Image Recording Procedure...................................................................................... 26
Emissivity Adjustment Procedure............................................................................. 26
Reflected Temperature Compensation Adjustment Procedure................................. 27
Recall Images Procedure........................................................................................... 27
Quick Image Fix Procedure...................................................................................... 28
Array Recalibration Procedure ................................................................................. 28
Recording an Image...................................................................................................... 28
Retrieving an Image......................................................................................................29
Chapter 3 Downloading and Looking at Images Using InsideIR v2.0
Software
Installing the Software.................................................................................................. 31
Connecting the Docking Station to Your Computer..................................................... 39
Hooking Up the Docking Station.............................................................................. 40
Downloading Images.................................................................................................... 49
Saving Images...............................................................................................................51
Setting the Imager Clock .............................................................................................. 52
Jan 31st, 2005 - 2 -
....................................................................................................... 30
Page 3

Field USB Port.............................................................................................................. 55
Looking at Your Downloaded Images.......................................................................... 55
Chapter 4 Obtaining the Best Image ........................................................ 57
The Importance of Focusing......................................................................................... 57
Selecting the Color Palette............................................................................................ 58
Selecting the Measurement Mode................................................................................. 58
Gain and Level Thumbwheels.................................................................................. 61
Chapter 5 Qualitative and Quantitative Temperature Measurements 62
Distance to Target (Spot) Ratio .................................................................................... 62
D:S ratio: D / S = 90 ................................................................................................. 63
Optical Diagram........................................................................................................ 63
Field-of-View................................................................................................................ 63
Environmental Conditions............................................................................................ 64
Ambient Temperatures.................................................................................................. 64
Emissivity ..................................................................................................................... 65
Reflected Temperature Compensation.......................................................................... 65
Chapter 6 Organizing Your Data.............................................................. 67
File Management ..........................................................................................................67
Uploading Data to the Imager................................................................................... 68
Chapter 7 Analyzing Your Data................................................................ 73
The Image View Screen................................................................................................ 73
Isotherms................................................................................................................... 75
Additional Image Analysis Tools............................................................................. 76
The Temperature Table Tab...................................................................................... 77
The Profile Tab......................................................................................................... 77
The Histogram Tab................................................................................................... 78
The Menu Bar........................................................................................................... 79
File ........................................................................................................................ 80
View...................................................................................................................... 81
Image Properties ................................................................................................... 81
Data Analysis........................................................................................................ 82
Report.................................................................................................................... 84
Help....................................................................................................................... 84
Reporting Your Findings .............................................................................................. 84
Appendix A - Technical Reference............................................................ 87
Imager Accuracy Chart................................................................................................. 87
Imager Reading Error vs Source D:S............................................................................ 88
Typical Emissivity Values............................................................................................ 88
Jan 31st, 2005 - 3 -
Page 4

Appendix B – Infrared Theory Q&A........................................................ 92
Glossary ....................................................................................................... 96
Jan 31st, 2005 - 4 -
Page 5

© 2005 Fluke Corporation.
The information contained in this document is subject to change without notice.
Fluke and the Fluke logo are registered trademarks and InsideIR are trademarks of Fluke
Corporation. Windows is a registered trademark of Microsoft Corporation in the United States
and/or other countries. Pentium is a registered trademark of Intel Corporation or its subsidiaries
in the United States and other countries. All other trademarks are the property of their respective
holders.
Warranty Information
LIMITED WARRANTY AND LIMITATION OF LIABILITY
This Fluke product will be free from defects in material and workmanship for one year from the
date of purchase. This warranty does not cover fuses, disposable batteries, or damage from
accident, neglect, misuse, alteration, contamination, or abnormal conditions of operation or
handling. Resellers are not authorized to extend any other warranty on Fluke’s behalf. To obtain
service during the warranty period, contact your nearest Fluke authorized service center to obtain
return authorization information, then send the product to that Service Center with a description
of the problem.
THIS WARRANTY IS YOUR ONLY REMEDY. NO OTHER WARRANTIES, SUCH AS
FITNESS FOR A PARTICULAR PURPOSE, ARE EXPRESSED OR IMPLIED. FLUKE IS
NOT LIABLE FOR ANY SPECIAL, INDIRECT, INCIDENTAL OR CONSEQUENTIAL
DAMAGES OR LOSSES, ARISING FROM ANY CAUSE OR THEORY. Since some states or
countries do not allow the exclusion or limitation of an implied warranty or of incidental or
consequential damages, this limitation of liability may not apply to you.
Jan 31st, 2005 - 5 -
Page 6

United States Export Control Regulations
Destination Control Statement
The Fluke Ti30 Thermal Imager contains an amorphous silicon infrared detector, which is
controlled for export by the United States government. Diversion of this product to locations
outside the US without an export license from the US government is prohibited.
Customer Service Contact Information
Fluke Ti30 Imager Service Headquarters
1201 Shaffer Road
PO Box 1820
Santa Cruz, CA
95061-1820 USA
www.fluke.com/thermography
USA / Canada:
Phone: 1 888 286 1578 Email: Ti30support@fluke.com.
Germany:
Phone: 49 30 4 78 00 88 00 Email: Ti30support.de@fluke.com
France:
Phone: 33 1 64 53 15 40
Other European countries, Africa and Middle East:
Phone: 49 30 4 78 00 88 00 Email: Ti30support.de@fluke.com
China:
Phone: 86 10 6439 2255 Email:
Japan:
Phone: 81 6 4390 1357 Email: Ti30support.jp@fluke.com
Other Asian countries, Australia, New Zealand,
India, Mexico and Central America:
Phone: 1 831 458 1110 Email: Ti30support@fluke.com
Brazil and South American countries:
Phone: 55 15 3217 6046 Email:
Email:
Ti30support.fr@fluke.com
Ti30support.cn@fluke.com
Ti30support.br@fluke.com
Jan 31st, 2005 - 6 -
Page 7

Introduction
The Fluke Ti30 imager is a state-of-the-art, lightweight, pistol-grip style thermal
imaging unit that lets you obtain instant and accurate thermal images and radiometric
readings at a remote distance from your target. Ergonomically designed for either left
or right-handed use, the Ti30 imager captures thermal images and data with a simple
click of the trigger. The unit can store up to 100 images that can then be downloaded
to your personal computer where the images can be stored, evaluated and added to
reports and presentations.
The Ti30 imager docking station allows effortless connection to a host computer,
and offers rapid data downloading and uploading. The docking station also
automatically recharges the rechargeable battery pack when the unit is not in use.
(Caution: do not leave the USB Field Cable connected to the unit when not in use.
This will completely drain the batteries of the Ti30.)
The companion software application, InsideIR, included with the imager lets you
display, examine, and analyze your images and data to discover qualitative and
quantitative trends associated with the target. InsideIR software allows you to define
maintenance databases based on your specific equipment condition, monitoring, and
asset management needs.
The Ti30 imager contains 100 image storage locations that can also be predefined
with unique equipment data and parameters. Notes and comments can also be
included for the technician performing the given maintenance routine. Maintenance
reports and follow-up actions can be created quickly and accurately using
information carried over from image files. Reports can be easily printed or sent
electronically.
Using the Ti30 imager’s structured database, maintenance professionals can ensure
consistent, repeatable measurements over time. They can efficiently and accurately
communicate with co-workers, management, equipment manufacturers, and service
providers by incorporating thermal images in emails and reports. In addition,
customers can easily create permanent inspection records indicating temperature
behavior before and after repairs, and monitor thermal trends over long periods.
The Ti30 imager is an easy-to-use and powerful thermal imaging tool. It will become
a valuable and indispensable tool for your workplace and your professional growth.
Jan 31st, 2005 - 7 -
Page 8

p
Quick Specifications Table
Thermal Measurement Range 0 to 250°C (32 to 482°F)
Accuracy ±2% or ±2°C, whichever is greater
Repeatability ±1% or ±1°C, whichever is greater
NETD 200 mK
Thermal
Temperature Indication Resolution 0.1 (°F or °C)
Spectral Range 7-14 microns
Target Sighting Single Laser Dot (Meets lEC Class 2 & FDA Class II requirements)
Optical Resolution (90% w/ circular
aperture)
Optical Resolution (90% w/ slit response) 225:1
Optical Resolution (50% w/ slit response) 750:1
Minimum Diameter Measurement Spot 7mm (0.27”) at 61cm (24”)
Optical / IR
Image Frame Rate 20Hz
Field of view (FOV) 17° Horizontal x 12.8° Vertical
Instantaneous Field of view (IFOV) 1.9mrad
Focus Focusable, 61 cm / 24” to infinity
Temperature Scale °C or °F selectable
Palettes Gray, Ironbow, or Rainbow selectable
Measurement Modes Automatic, Semi-Automatic, or Manual selectable
Laser On/Off
Controls
Gain Control
Level Control
LCD Backlight Bright, Dim, Off selectable
Adjustable Emissivity
Display Type Liquid Crystal Display - TFT technology optimized for both indoor and
Reflected Background Temperature -50 to 460°C (-58 to 860°F)
Ambient Operating Temperature -10 to 50°C (14 to 122°F)
Relative Humidity 10 to 90% Non-condensing
Storage Temperature without batteries -25 to 70°C (-13 to 158°F)
Storage Capacity
Laser On Icon
Operational
Low Battery Icon
Palette Icon
Measurement Mode Icon
Thermal Analysis Software InsideIR (included)
PC Software Operating Systems Microsoft® Windows® 98, Windows 2000 or Windows XP
Power 6 AA batteries(not included) or rechargeable battery pack (included)
Battery Life Industry leading minimum 5 hours of continuous use
Data Transfer USB interface, total transfer time up to 30s for 100 pictures
Storage Device Flash Memory
Electrical
90:1
9
9
9
0.10 to 1.00 by 0.01
outdoor use
9
9
9
9
Tripod Mount
(6.35 mm (1/4) 20 unc threading)
Weight (includes batteries) 1kg (2.2 lb)
Other
Standard Accessories • Multi-language Interactive Manual (CD ROM) • InsidelR Software •
tions
O
Accessories /
Options NIST Calibration certificate
9
Docking station with Universal Power Adapter and USB Connection •
Hardshell Carry Case • USB Computer Field Cable • Rechargeable
and Non-rechargeable Battery Packs (batteries not included) • Multi
Language Thermography Training Presentation (CD ROM) • Carrying
Pouch • Wrist Strap • Quick Reference Card
Jan 31st, 2005 - 8 -
Page 9
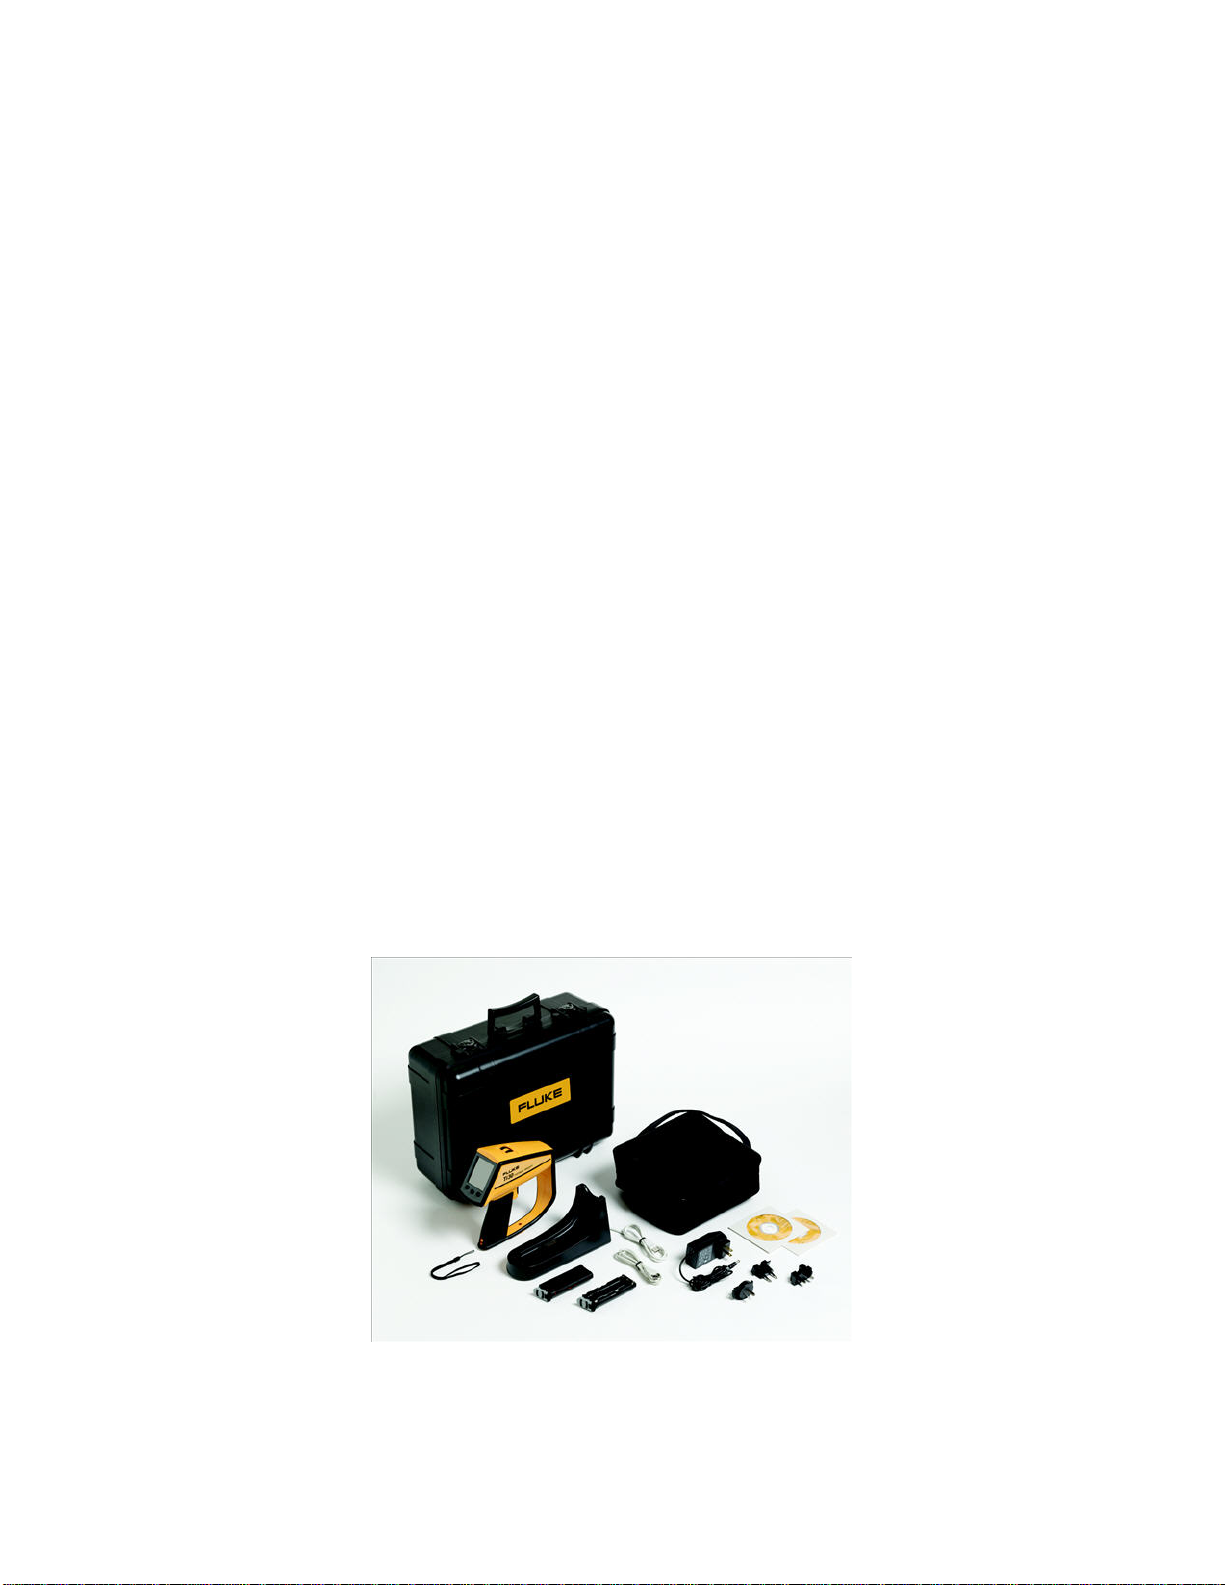
Chapter 1 Unpacking Your New Imager
Begin by opening the shipping box. Be sure to save the box and shipping materials in
the event you need to ship the imager.
In the shipping box, you will find a hard carrying case, containing the following
items:
1 Ti30 imager 1 USB Installation Guide and 1
Quick Reference Guide
1 Ti30 imager docking station 1 carrying pouch and 1 wrist strap
1 universal power supply and plug
adapters
1 CD ROM containing multi-
language training materials
1 CD ROM containing InsideIR
software and multi-language
interactive manual
1 USB Field Cable (Caution: do not
leave field cable connected to unit
while not in use. This will
completely drain the unit’s batteries.)
1 rechargeable battery pack
1 empty battery pack for holding
6 AA non-rechargeable batteries
(batteries not included)
Jan 31st, 2005 - 9 -
Page 10
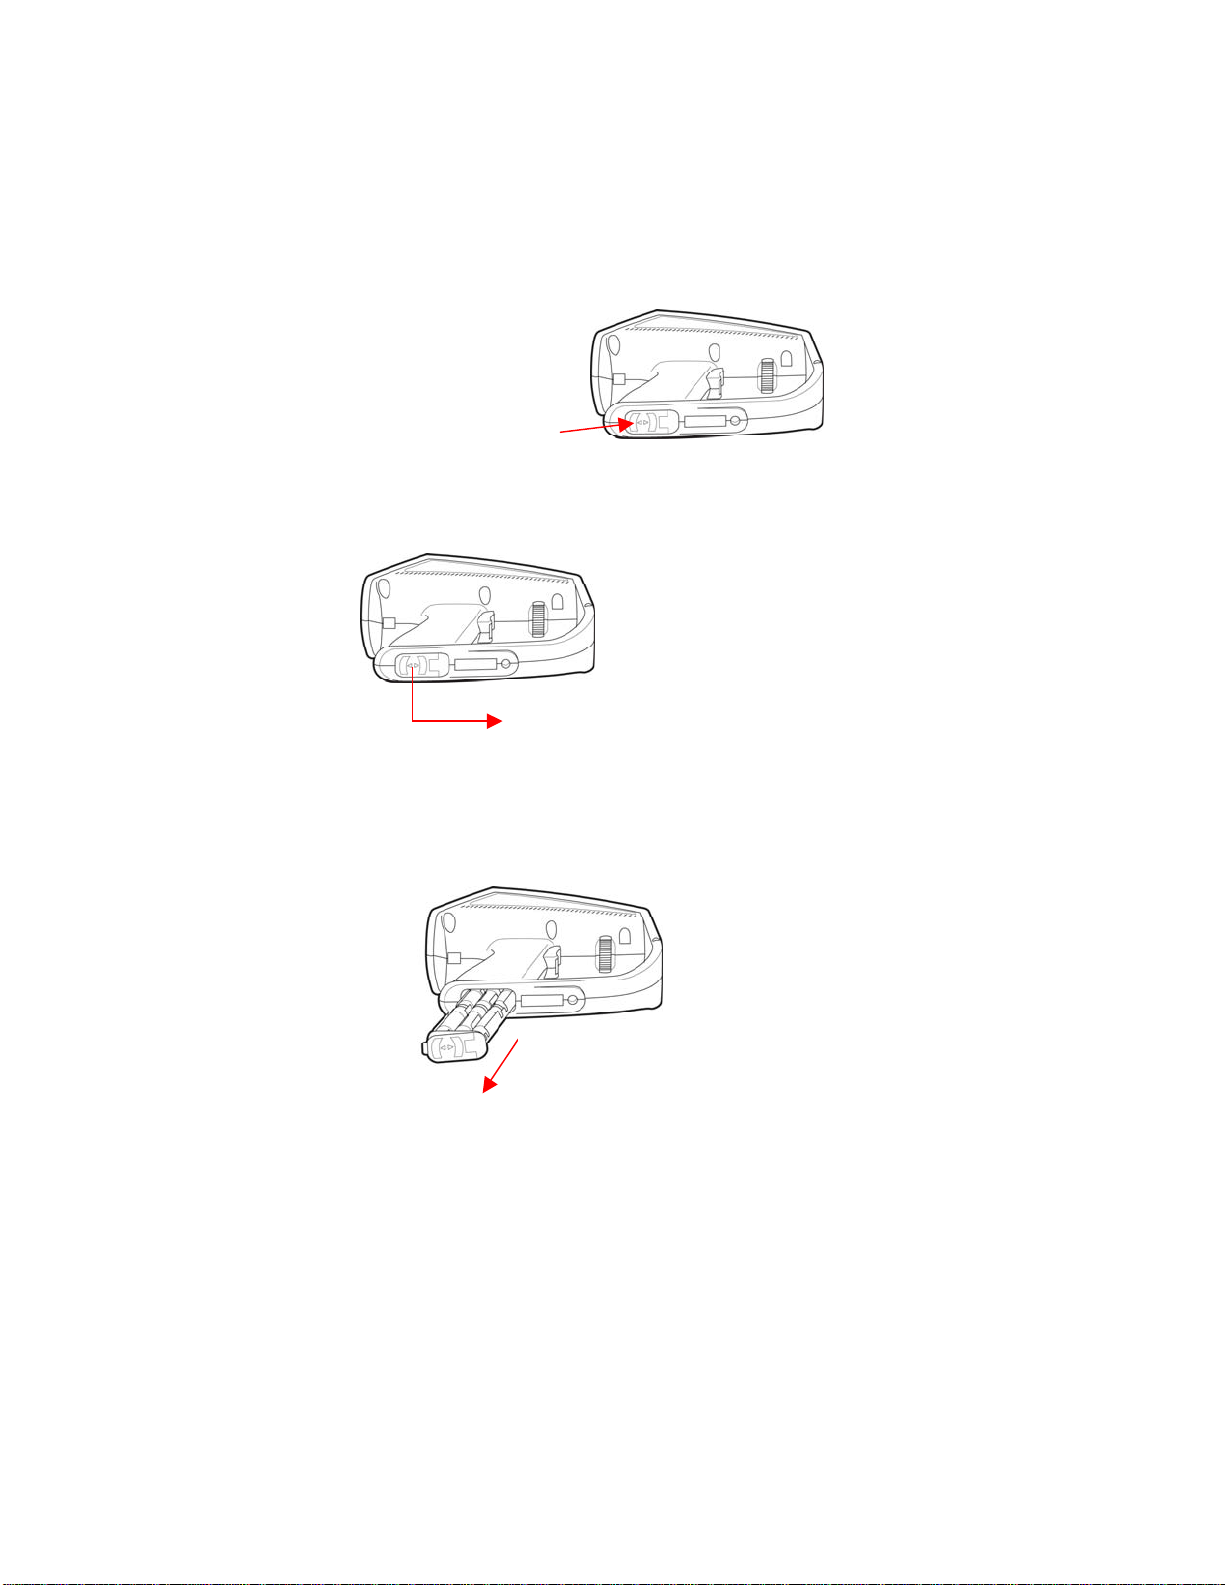
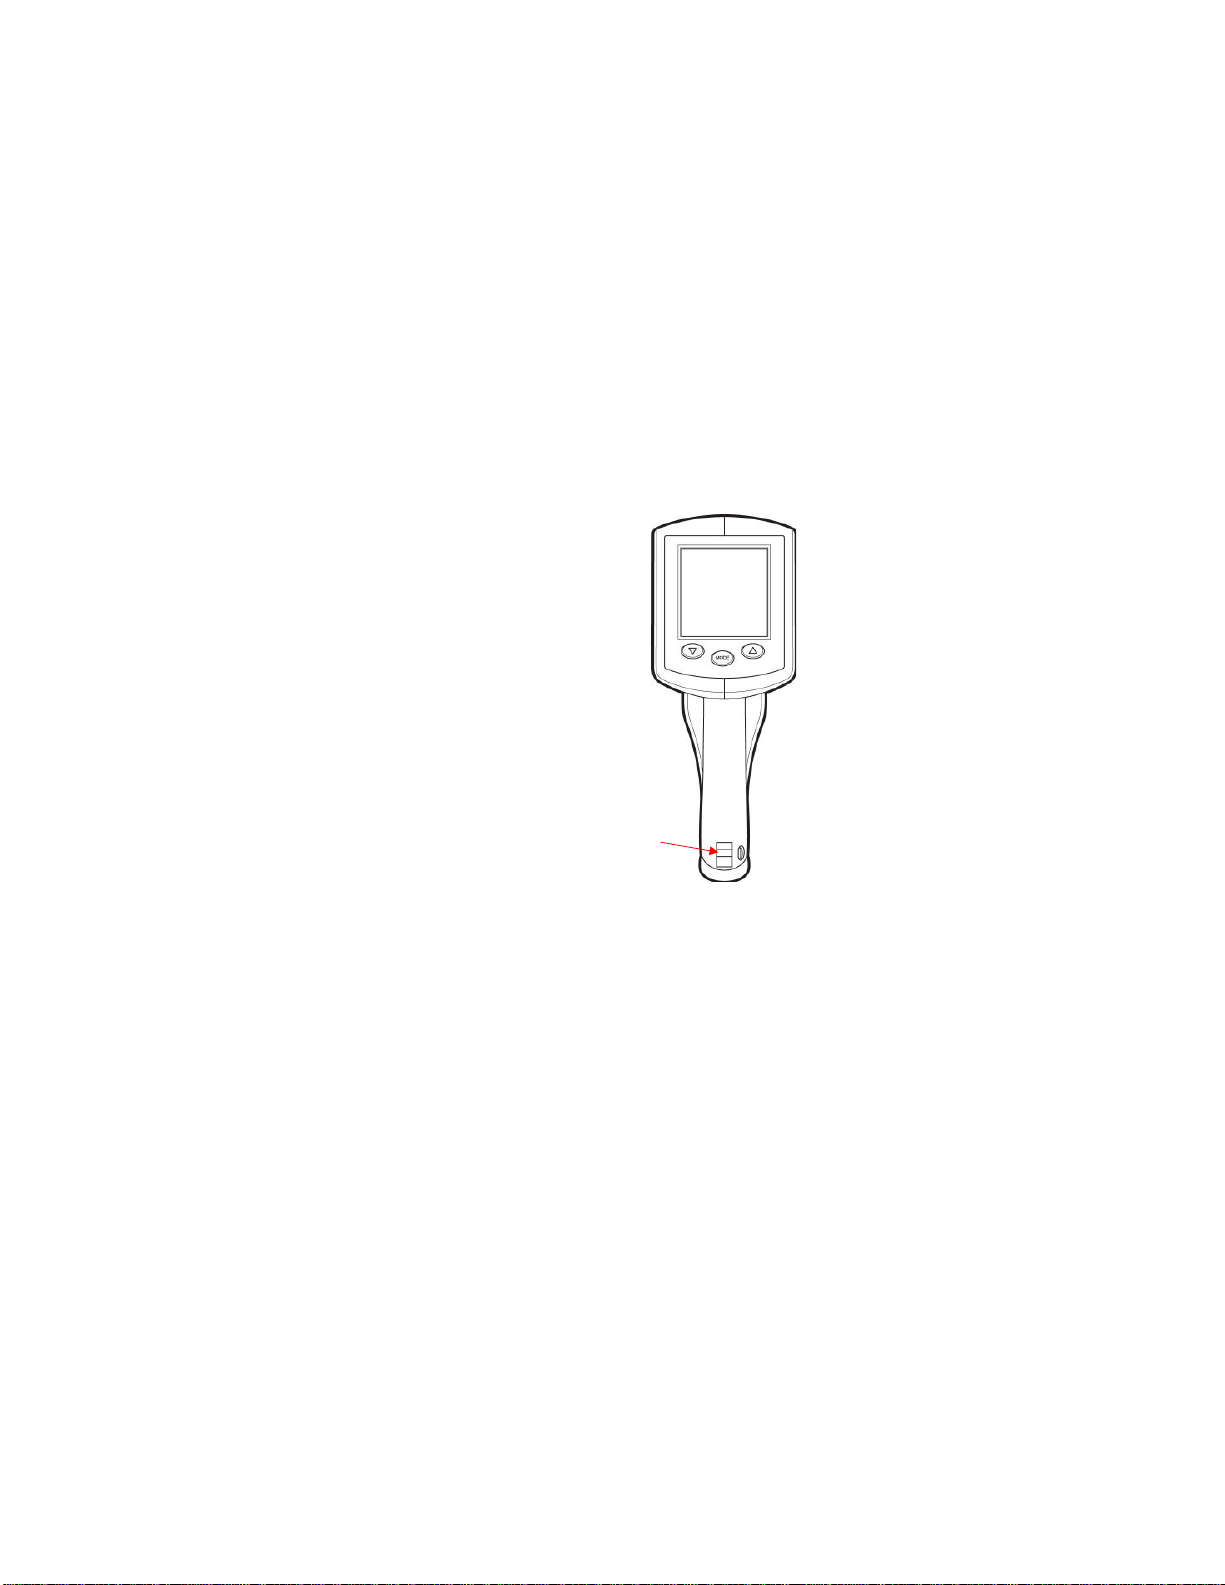
First, the Batteries
The battery compartment is located in the handle of the unit.
The unit is shipped with an empty battery pack for non-rechargeable batteries installed in the
battery compartment.
Battery Lock Tab
Remove the empty battery pack from the battery compartment.
The battery pack can be removed by sliding the lock tab towards the trigger.
Move the lock tab in this direction
Once the lock is released, the battery pack will slide down. Tilt the top of the unit up to slide
the battery pack out.
Battery pack slides out
(AA batteries not included)
Figure 1. Removing the Battery Pack
Jan 31st, 2005 - 10 -
Page 11
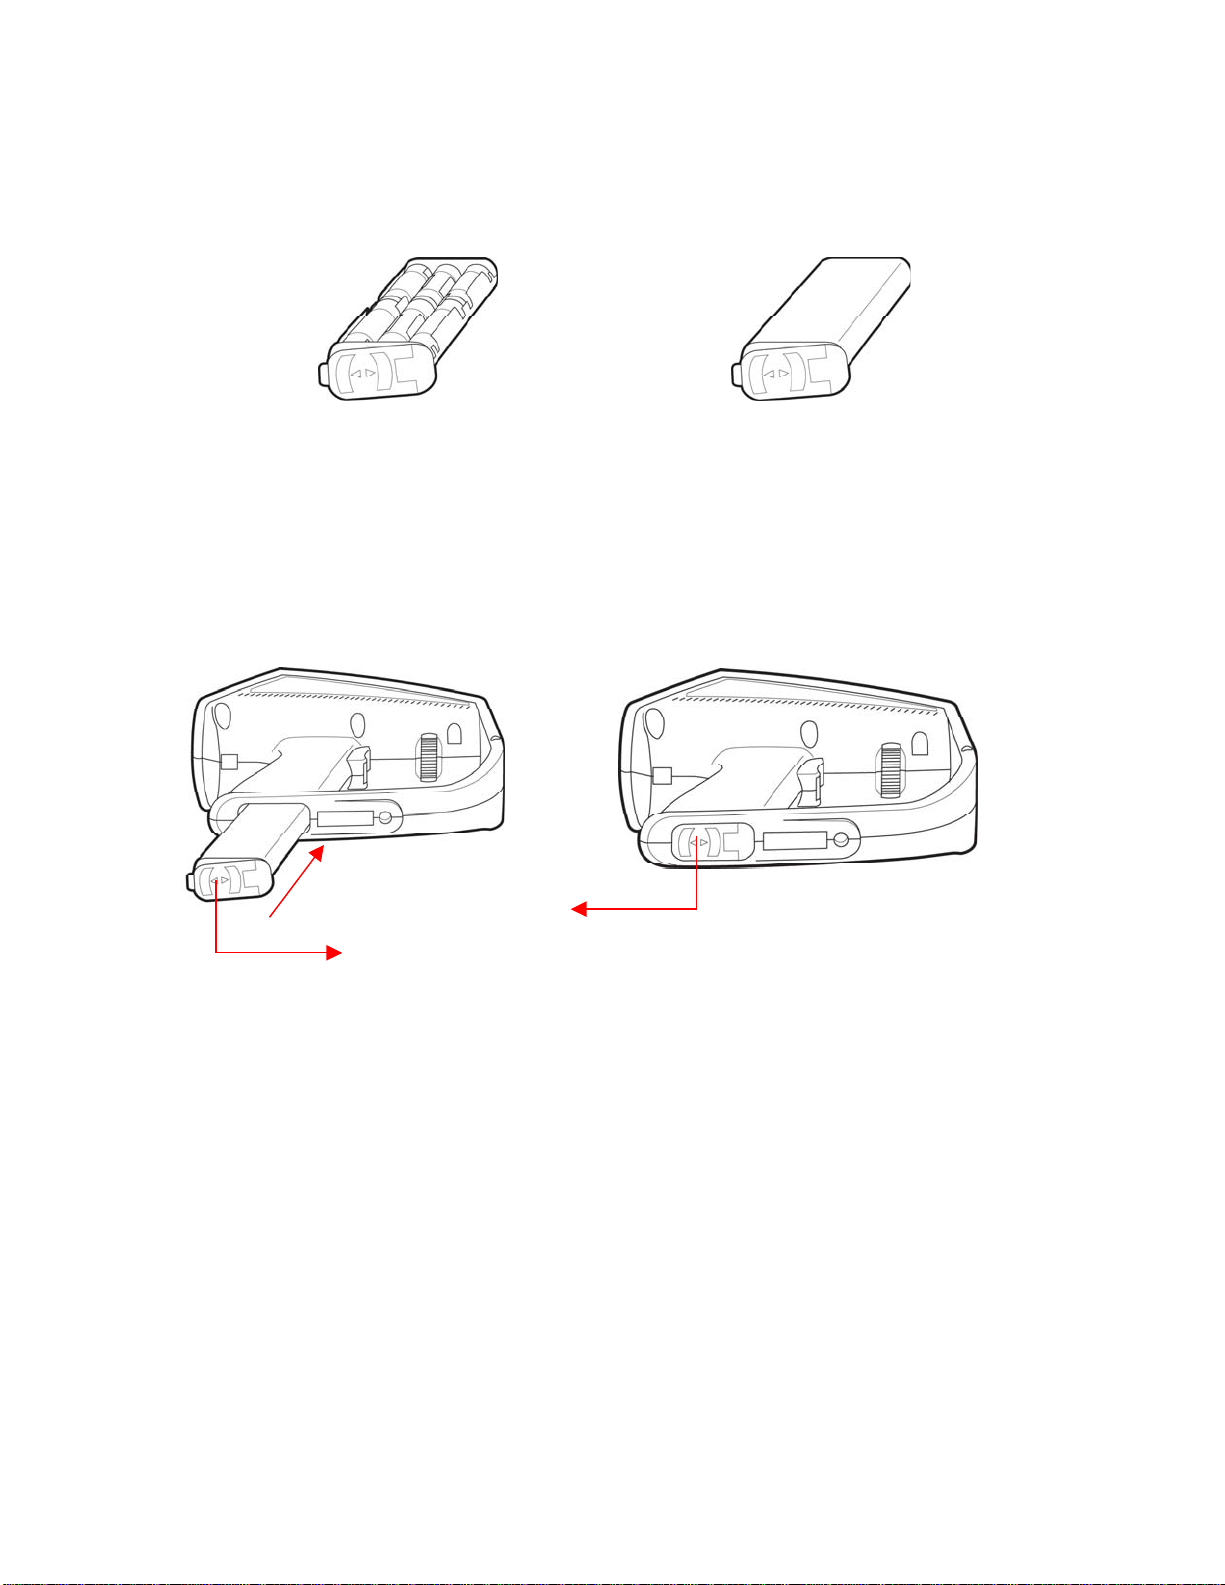
At this point, you have two options: insert six new AA batteries into the empty nonrechargeable batteries pack or replace it with the supplied rechargeable battery pack. You will
notice the difference between the two battery packs as shown in Figure 2 below:
Non-rechargeable battery pack
(batteries not included)
Figure 2. Battery Packs
Rechargeable battery pack
To replace the battery pack just slide it back in, making sure the plastic tab lock is in the
unlocked position (to the right of the pack). Use the rails on battery pack as guides. Once it
is inserted, slide the lock tab back into the locked position as shown below in Figure 3.
Battery pack slides in
Move the lock tab back to the locked position
Keep the lock tab in the unlocked position
Figure 3. Installing Batteries
Jan 31st, 2005 - 11 -
Page 12
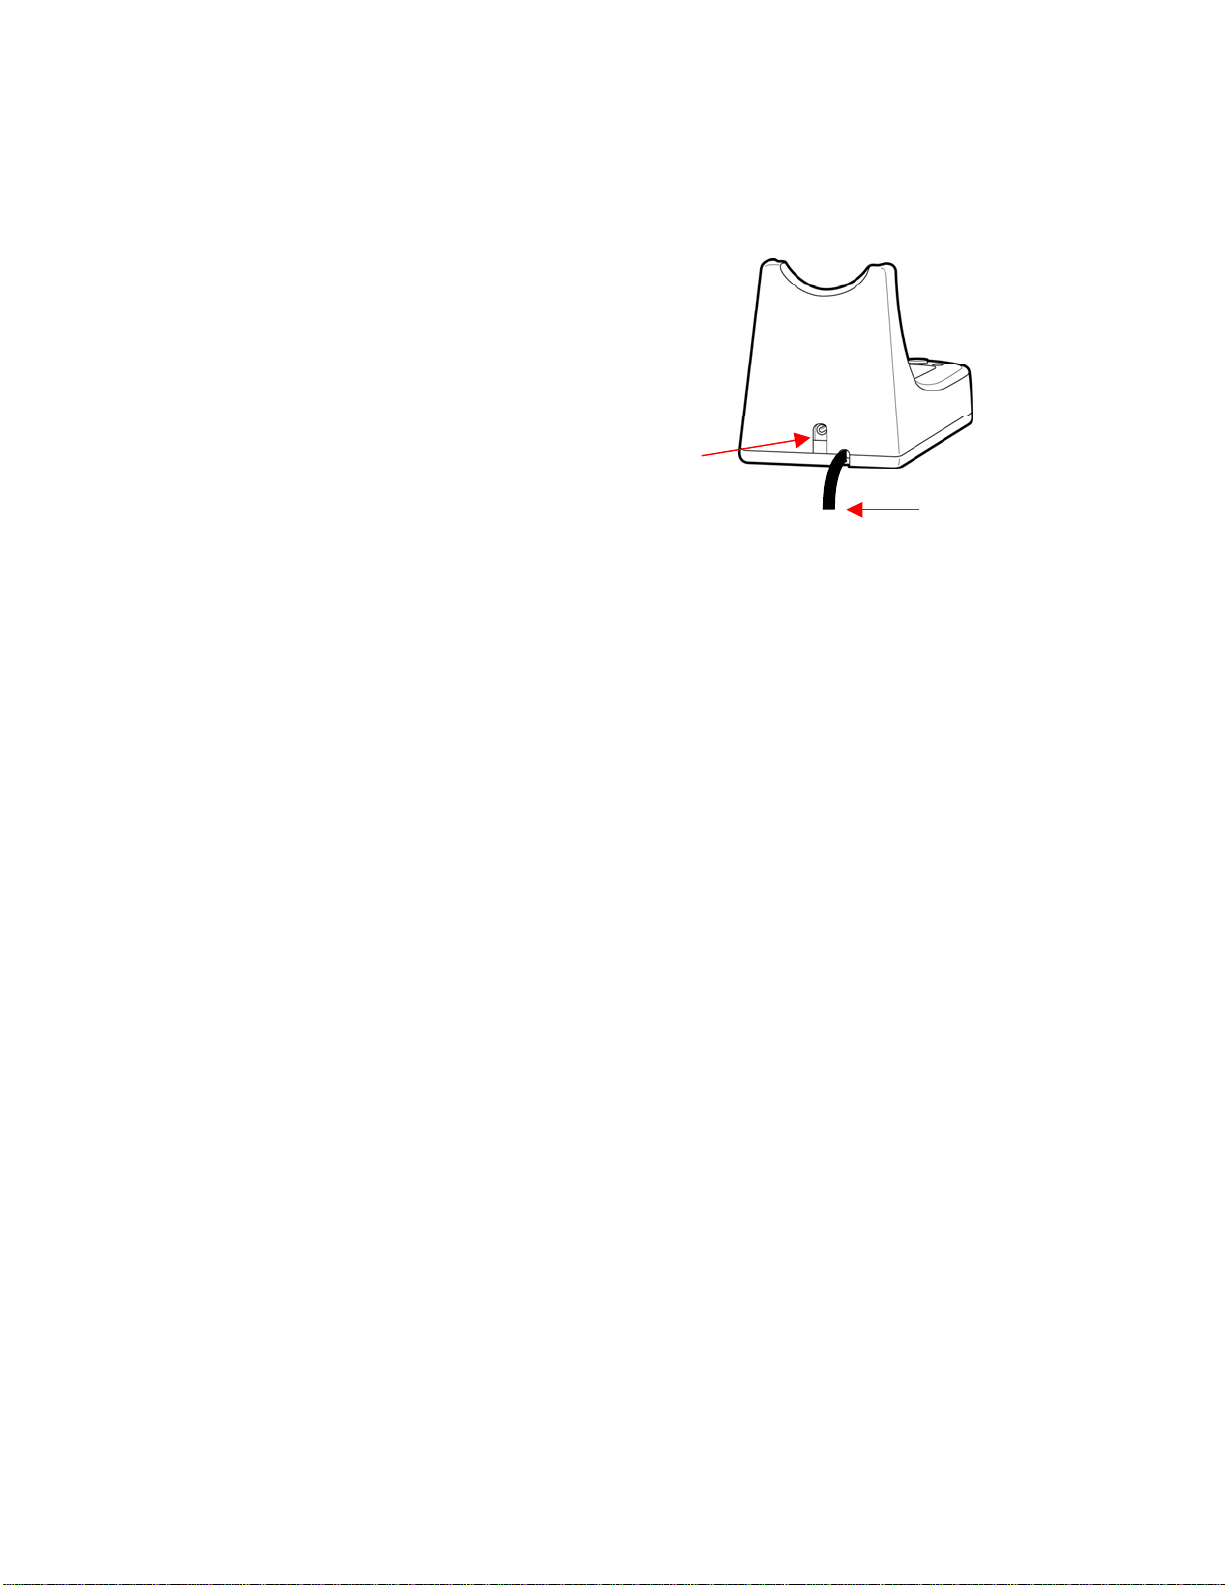
Charging the Rechargeable Battery Pack
Connect the docking station to a power
Docking Station
outlet using the supplied universal
power adapter. Be sure to use the plug
adapter that fits your local electrical
standards. Connect the power jack of
the power adaptor to the DC power
inlet located on the docking station.
DC Power inlet
USB cable
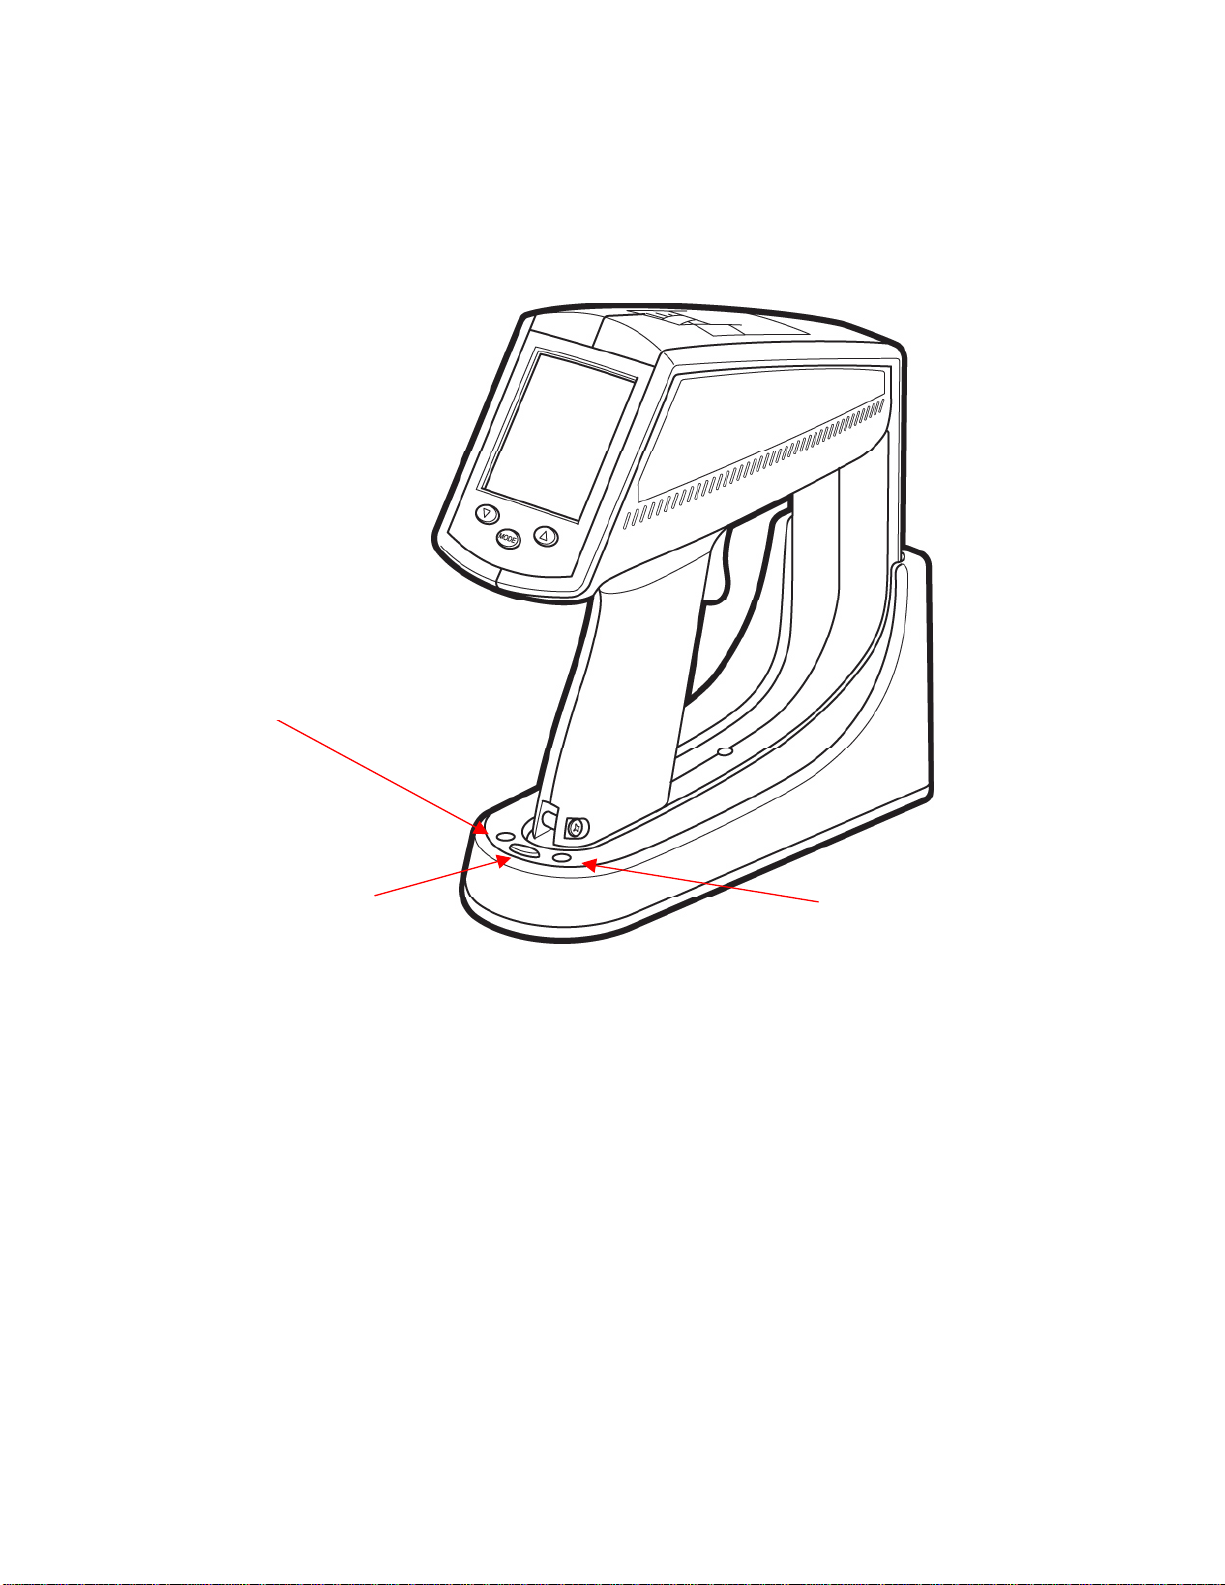
Normal Charge Cycle
With the Ti30 unit powered off, place it on the docking station.
Do not connect the docking stations USB cable to the computer at this point.
The red LED (on the left) will flash several times as the circuit senses a rechargeable
battery pack and determines its state of charge.
Note:
If a non-rechargeable battery pack is sensed by the docking station, neither LED
will blink.
The remaining points assume that the imager contains a sealed, rechargeable battery pack.
The red LED turns on continuously to indicate that charging is in progress. This process
can take from a few minutes to more than an hour.
The red LED turns off once the battery pack is fully charged and the green LED (on the
right) turns on continuously.
Momentarily lifting the Ti30 unit from the docking station for about 5 seconds or longer
interrupts the charging process. The green light will come on and no further charging
will occur. Press the Restart / Sync button between the LEDs to resume charging.
Pressing the button if the batteries are completely charged will have no effect.
The imager may be removed from the docking station before recharging is completed
without harm. However, the imager may not be fully charged and its operating time may
be reduced accordingly.
An imager containing single-use batteries may safely be placed on the docking station for
storage or image transfer. In fact, we recommend the imager always be placed on the
docking station when not in use, regardless of the type of batteries being used.
Jan 31st, 2005 - 12 -
Page 13
A charge cycle takes a rechargeable battery pack from whatever level of charge it presently
has and brings it to a fully charged condition. The charger will not over-charge a battery pack
no matter how many times the button is pushed.
RED
lig ht
Restart / Sync button
Figure 4. Docking Station LED Indicators
Note:
You may download stored images from the Ti30 imager to a personal computer if
GREEN
light
the docking station’s USB cable is connected to a computer running the InsideIR
software. Press the Restart / Sync button to transfer stored images to the
computer (see Chapter 3 Downloading and Looking at Images for details).
Pressing the Restart / Sync button also starts the charging cycle.
Once the batteries are charged, you are ready to begin taking thermal images and
temperature measurements. Take a moment now to read the next section and become
acquainted with the basic features and controls of the imager.
Jan 31st, 2005 - 13 -
Page 14
A
Chapter 2 Getting Started
Your Ti30 imager has settings and capabilities that let you customize its operation
for the task at hand. The following section describes each setting on the imager.
Attaching the Wrist Strap
Your Ti30 imager comes with a wrist strap, which can be attached by clipping the
metal part of the strap to the small metal bar at the base of the imager (see Figure 5
below).
Figure 5. Attaching the Wrist Strap
ttach wrist strap
Jan 31st, 2005 - 14 -
Page 15
Turning the Unit On
Power is switched on or off by opening or closing the lens door. Sliding down the
lens door turns the imager on (see Figure 6 below). Slide the door up to turn off the
imager.
Closed
(Unit
Off
)
Figure 6. Powering the Ti30 Imager On and Off
Note:
The unit is self-protected against excessive levels of infrared radiation and it will
cause the unit to automatically shut down. If that happens, slide the lens door
closed, wait a minute and slide it open again.
Important:
Always dock the imager in the docking station when not in use. By doing so,
you will assure the batteries will be fully charged when using the rechargeable
battery pack. The imager will not show thermal images or respond to controls
while it is in the docking station.
Displaying Images
Open
(Unit On)
The Ti30 imager performs an initial auto-check each time it is activated and then
immediately shows the Information Screen. The Information Screen displays the
following information about the Ti30 imager unit:
Jan 31st, 2005 - 15 -
Page 16
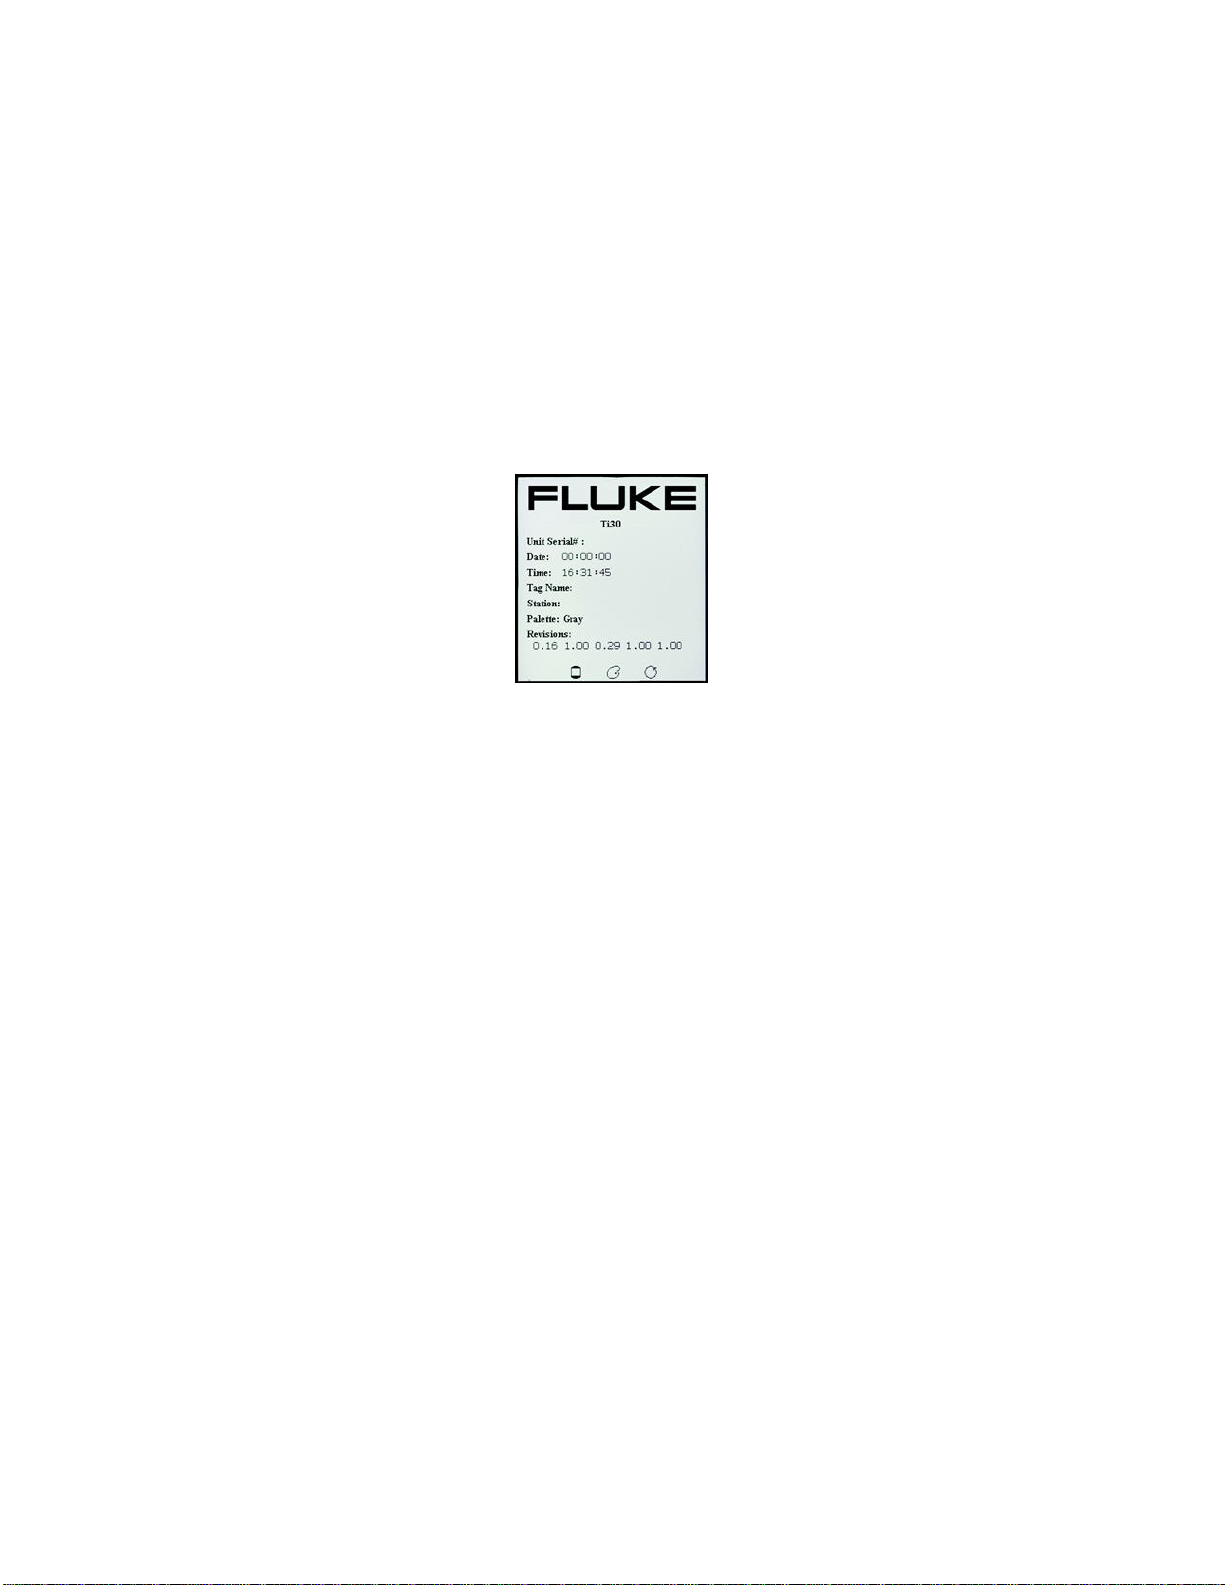
Unit Serial Number
Date and Time (configured by the user through the software)
Tag name is the name of the user-defined folder from which data was uploaded
through the software. Useful tag names are department names or an area associated
with the unit. This space is blank until configured by the user.
Station is the name of the networked computer associated with a specific unit. This
is blank until configured by the user.
Palette is the type of palette currently selected
Firmware revisions
Icons for LCD illumination, palette type, measurement mode and laser status
Figure 7. The Information Screen
Press the MODE button to exit the Information Screen. (Refer to Figure 9, the MODE
button is located center, below the LCD screen.) The Ti30 imager immediately goes into
measurement mode, showing a real time thermal image of what is in front of the lens. A
reticle with a crosshatch at the center of the display shows the temperature spot.
Note:
Do not change any of the settings yet. User configurable parameters will be
explained later in Figure 58.
Jan 31st, 2005 - 16 -
Page 17
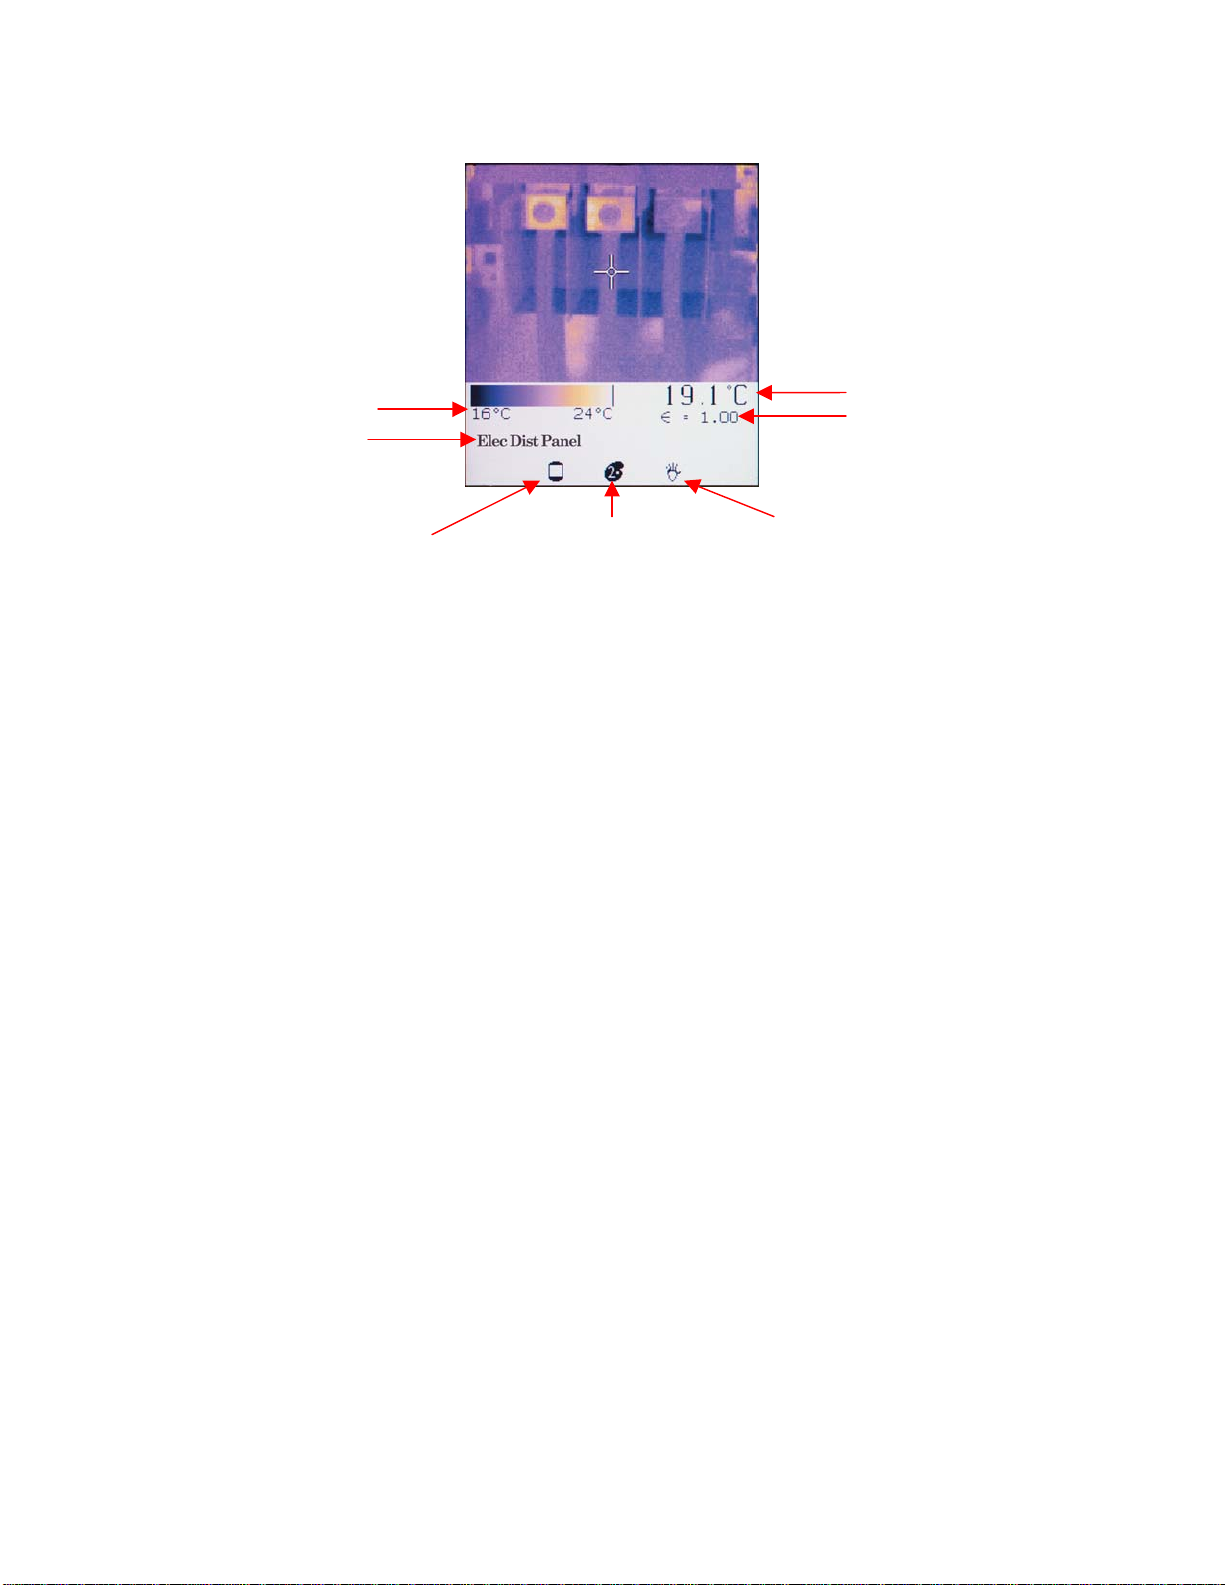
Temperature scale
Location name
Target Temperature
Emissivity value
LCD backlight icon Palette icon Mode icon
Figure 8. Normal Mode
Take time to experiment with the imager and become familiar with how the thermal image is
updated on the display as you aim the imager at different targets with different thermal
patterns. Notice how images display in varying colors, which are related to the different
target temperatures. The color scale at the bottom of the thermal image shows the minimum
and maximum temperature value in the thermal scene at any moment. These values will
change as you point the imager at other targets, or if the temperatures of the current target
change. The sequence or progression of different colors along the color scale indicates the
distribution of the different temperatures on the thermal scene. Notice how the colors along
the beginning of the color scale represent lower temperatures and colors along the end of
the color scale represent higher temperatures.
Note:
At this point you probably have noticed that the image freezes briefly from time to
time while an hourglass icon is briefly displayed. This is a normal process that
happens when the unit momentarily shuts down the optical channel to eliminate
offset errors. This is a recalibration sequence that begins immediately after the unit
is turned on. Recalibration occurs at 5 seconds, then 10 seconds, then 20 seconds,
then 30 seconds and then finally after every two minutes. It is a good idea to keep
the unit On if you are using it constantly over a period of time to avoid resetting
the recalibration procedure counter.
The Ti30 imager settings can be customized for your particular application. The following
sub-section reviews the settings and controls.
Jan 31st, 2005 - 17 -
Page 18
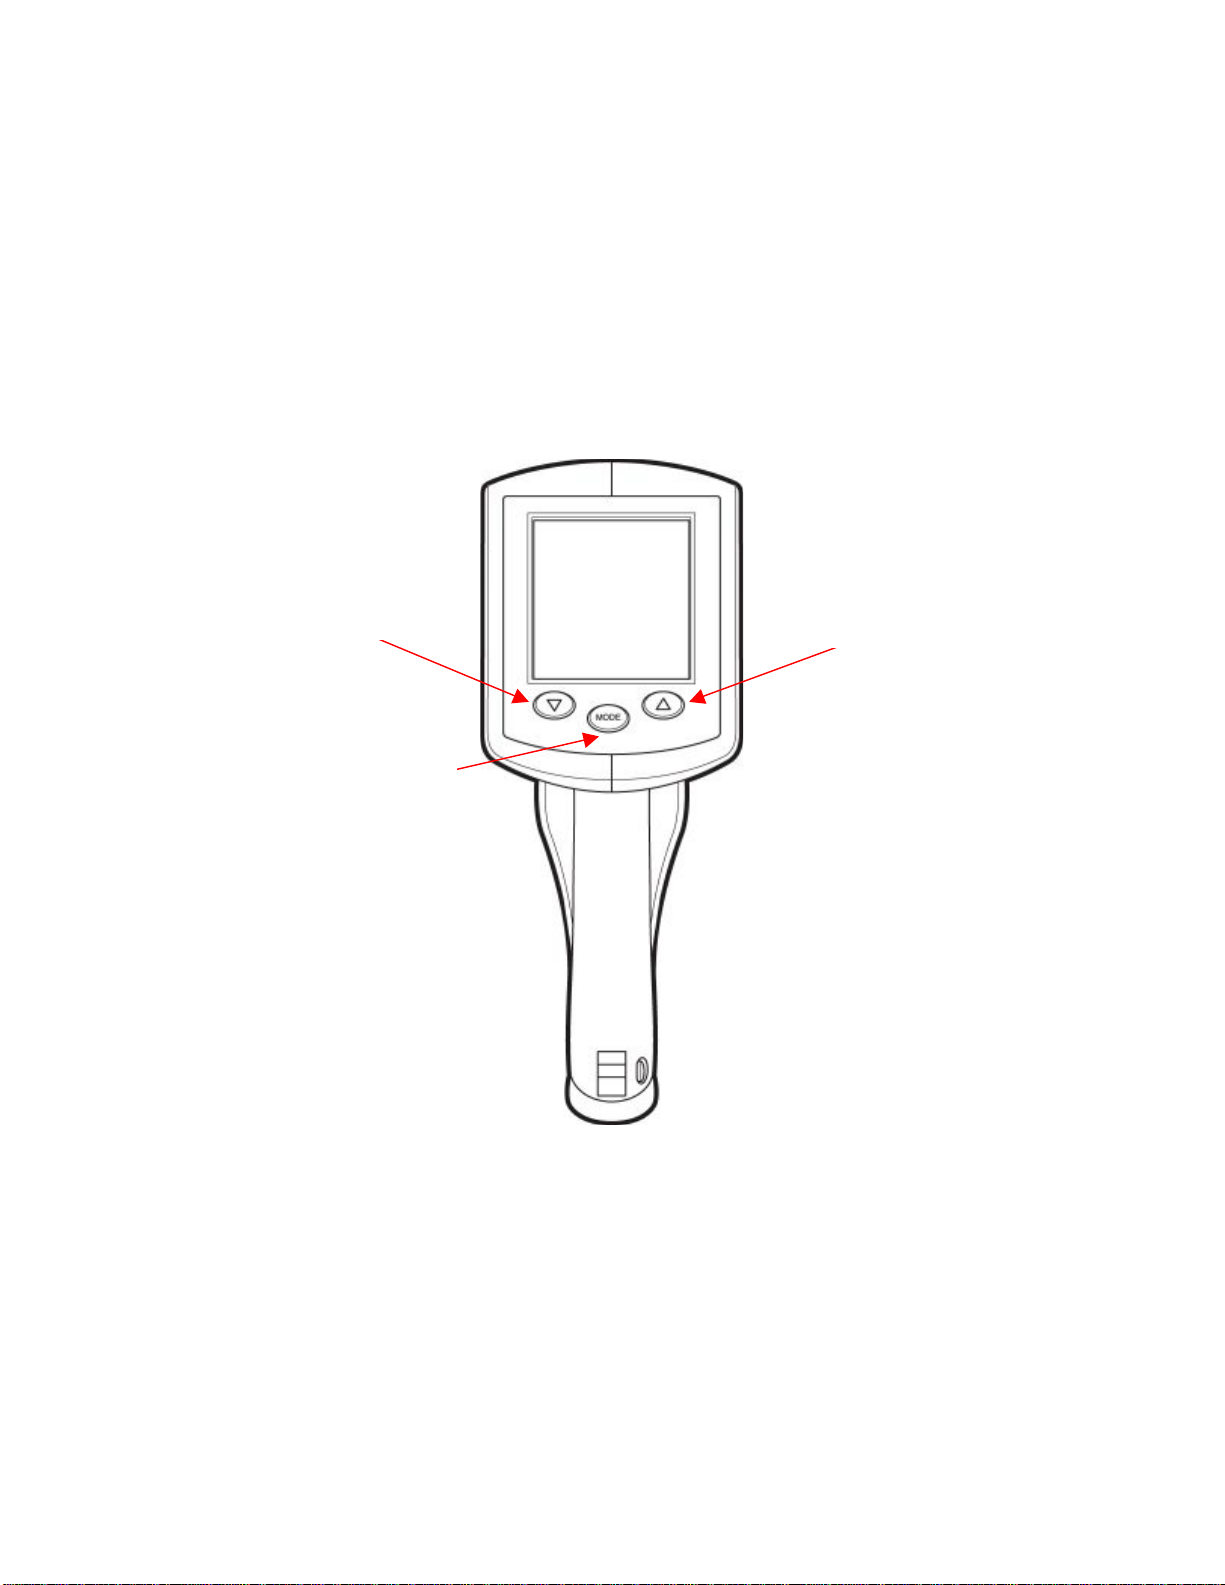
Settings and Controls
Keypad
Three buttons located below the LCD screen allow you to select operation modes and
change parameter values. These buttons are the MODE button, the Up button, and the
Down button. The Up and Down buttons are used mostly to increment and decrement
parameter values. They activate some special functions as well. The MODE button is used
mostly to cycle between the different operations. Details about the function of each button
are discussed later.
Down
button
Up
button
MODE
button
Figure 9. Keypad Controls
Jan 31st, 2005 - 18 -
Page 19
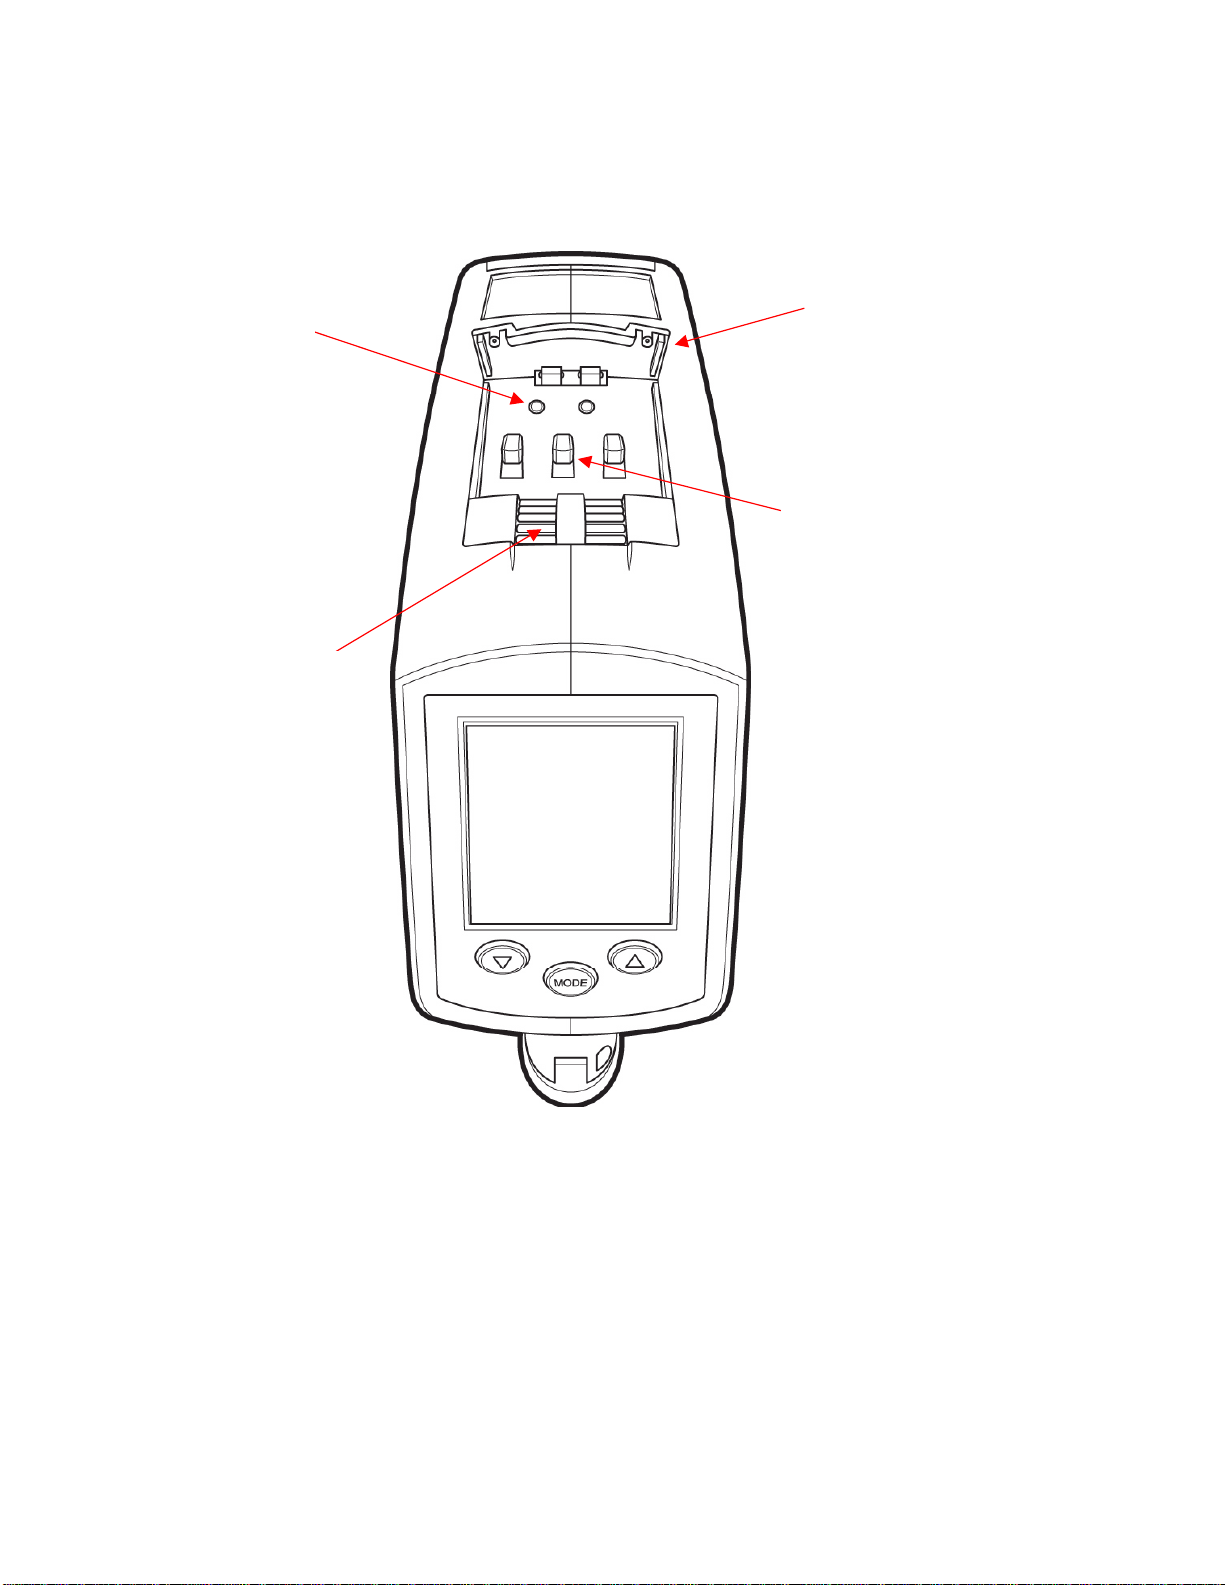
A hinged door on the top surface of the Ti30 imager hides five switches that allow you to
change the basic imager settings. Open the hinged door by lifting it up.
Push buttons
(toggle)
Thumbwheels
Pull door up to
show control
switches
3-position
Switches
Figure 10. Ti30 Imager Settings Switches (icons not shown)
Jan 31st, 2005 - 19 -
Page 20
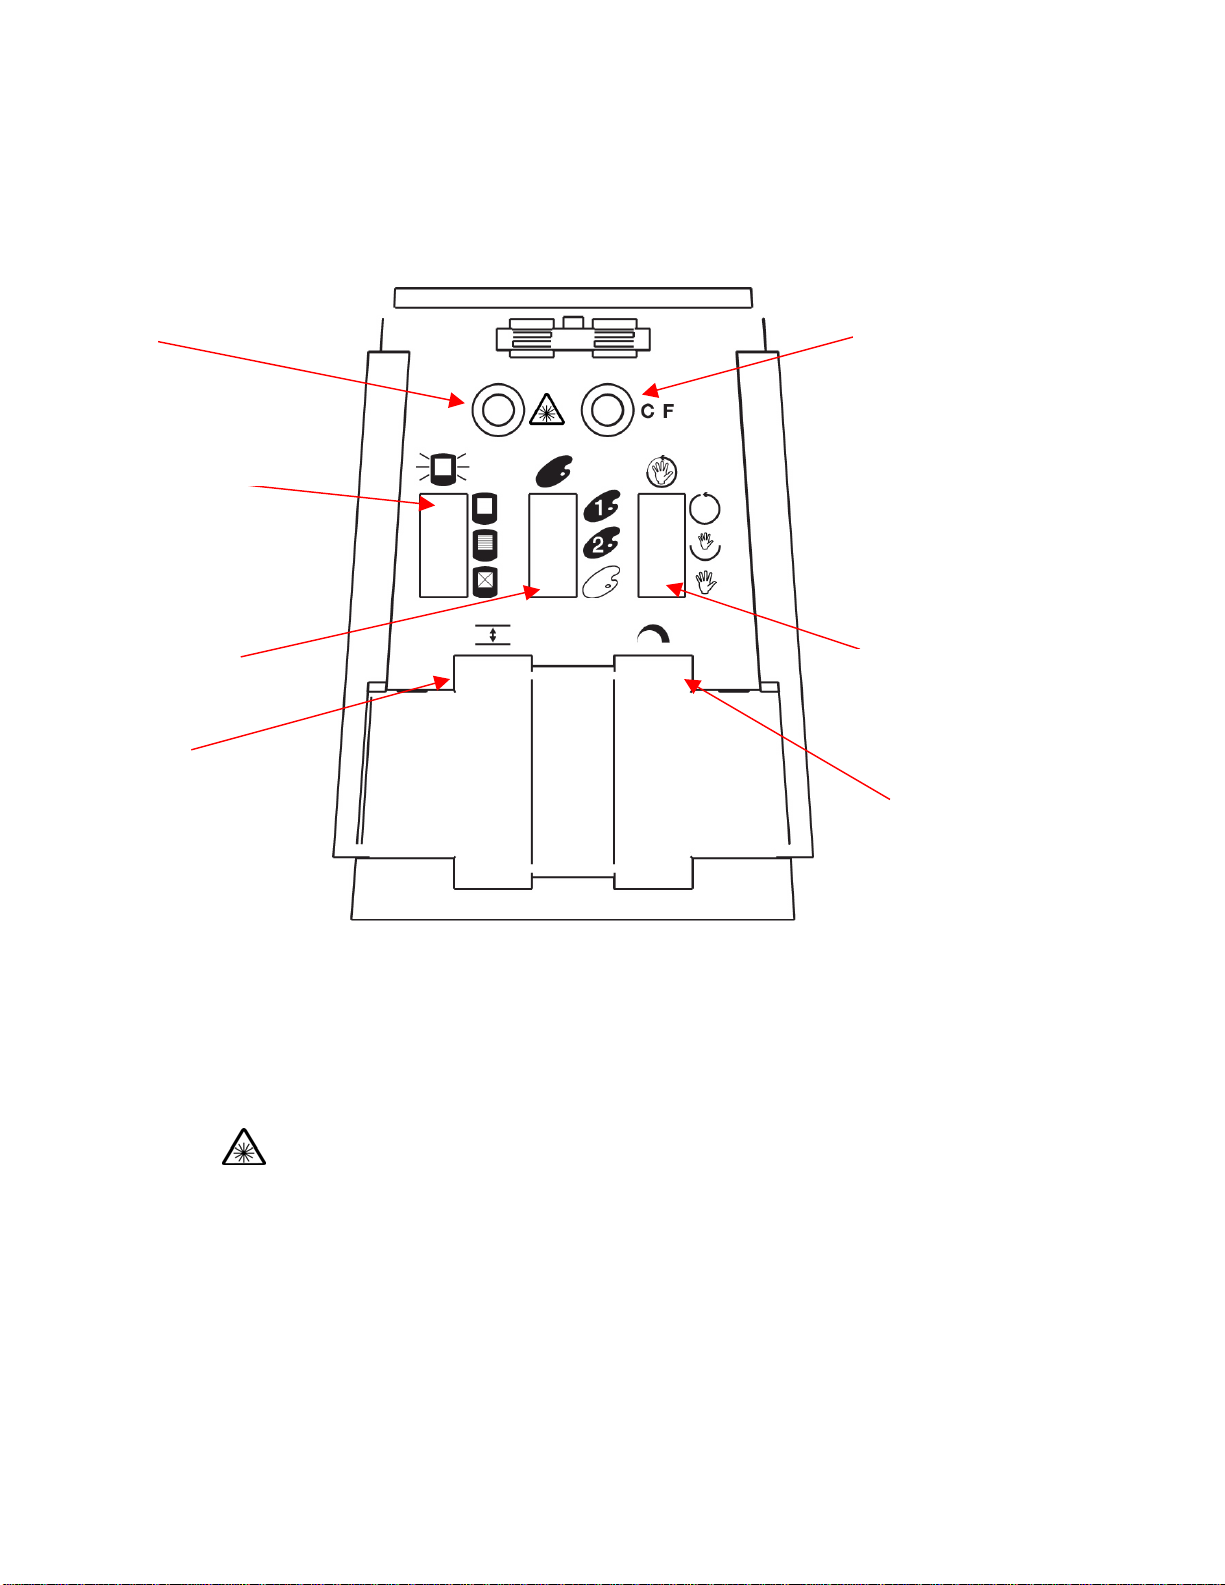
The illustration below shows the top view of the switch bay without the door. There is an
icon printed near each switch and switch position indicating their function. These functions
are explained in the next paragraphs.
Laser ON/OFF
LCD backlight selection
Palette selection
Level adjustment
Centigrade /
Fahrenheit selection
Measurement mode selection
Gain adjustment
Figure 11. Ti30 Imager Settings Switches
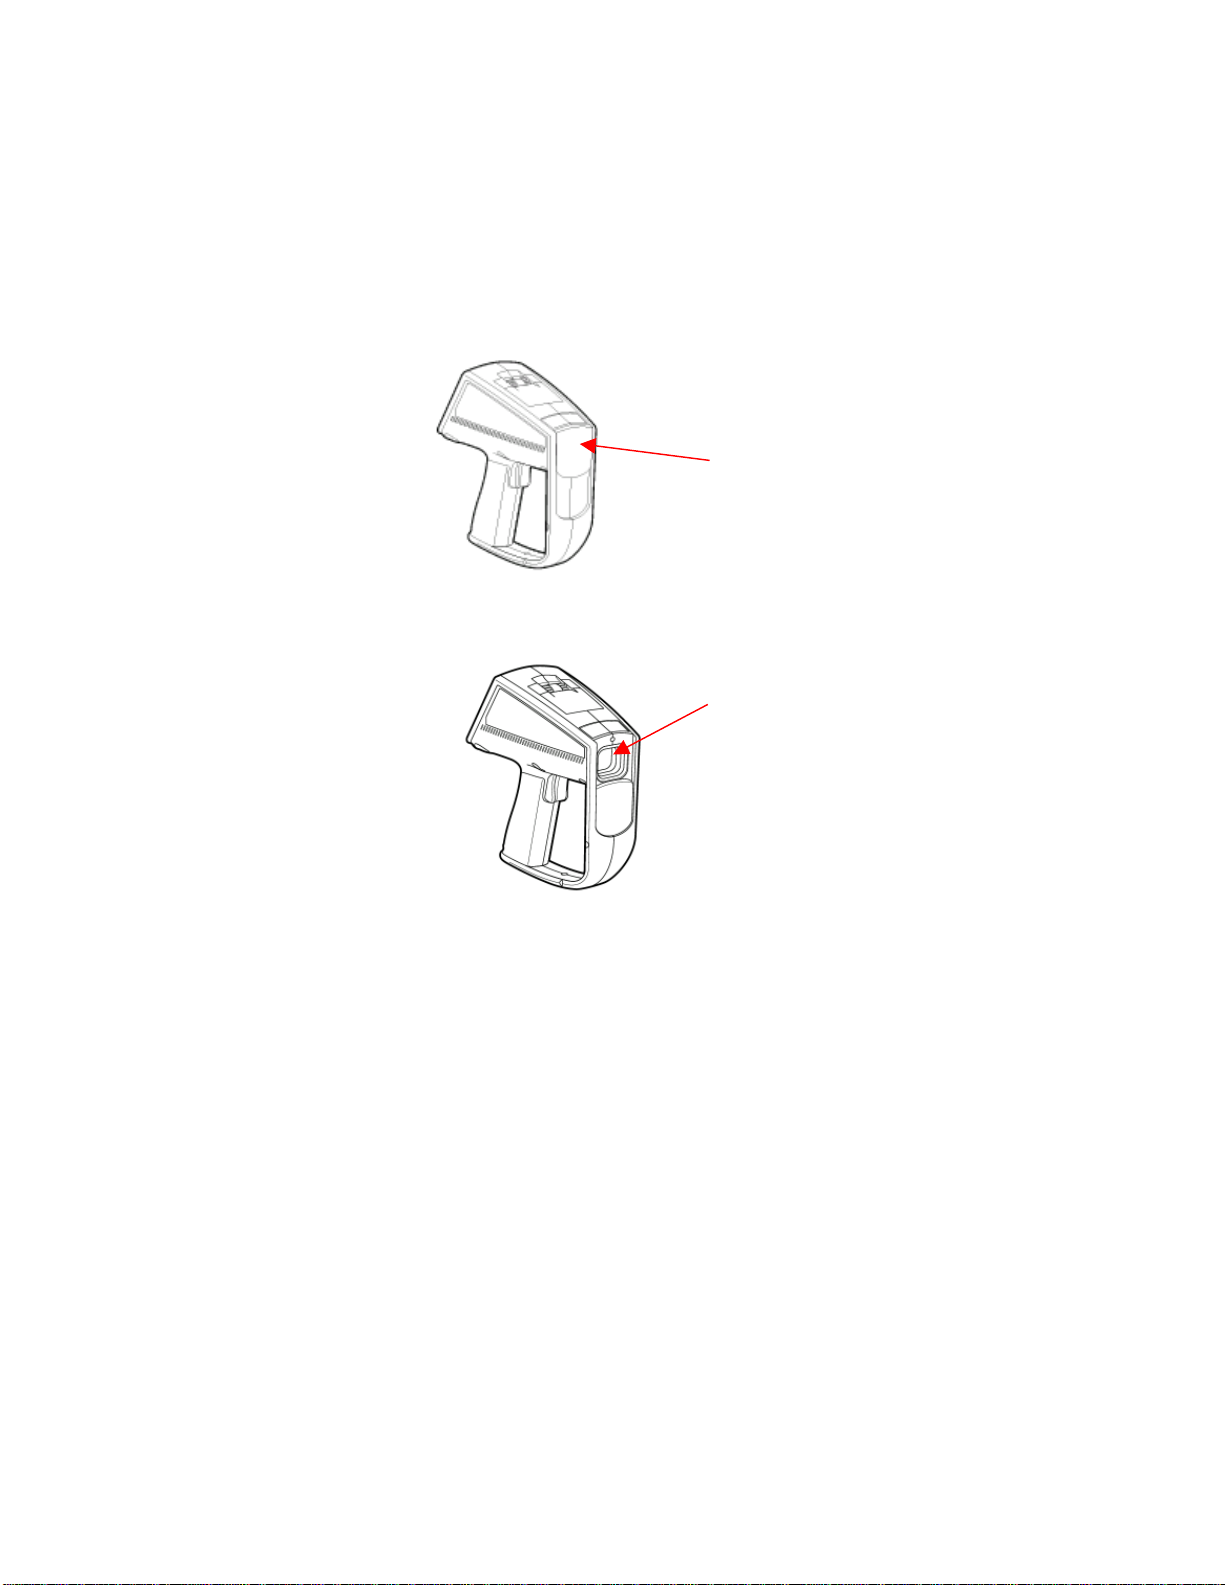
Laser On/Off Toggle Button
The Laser On/Off toggle button switches the laser on and off. By default, the guiding
laser beam is off. Depending on the situation you may or may not need the laser guidance
beam.
Jan 31st, 2005 - 20 -
Page 21
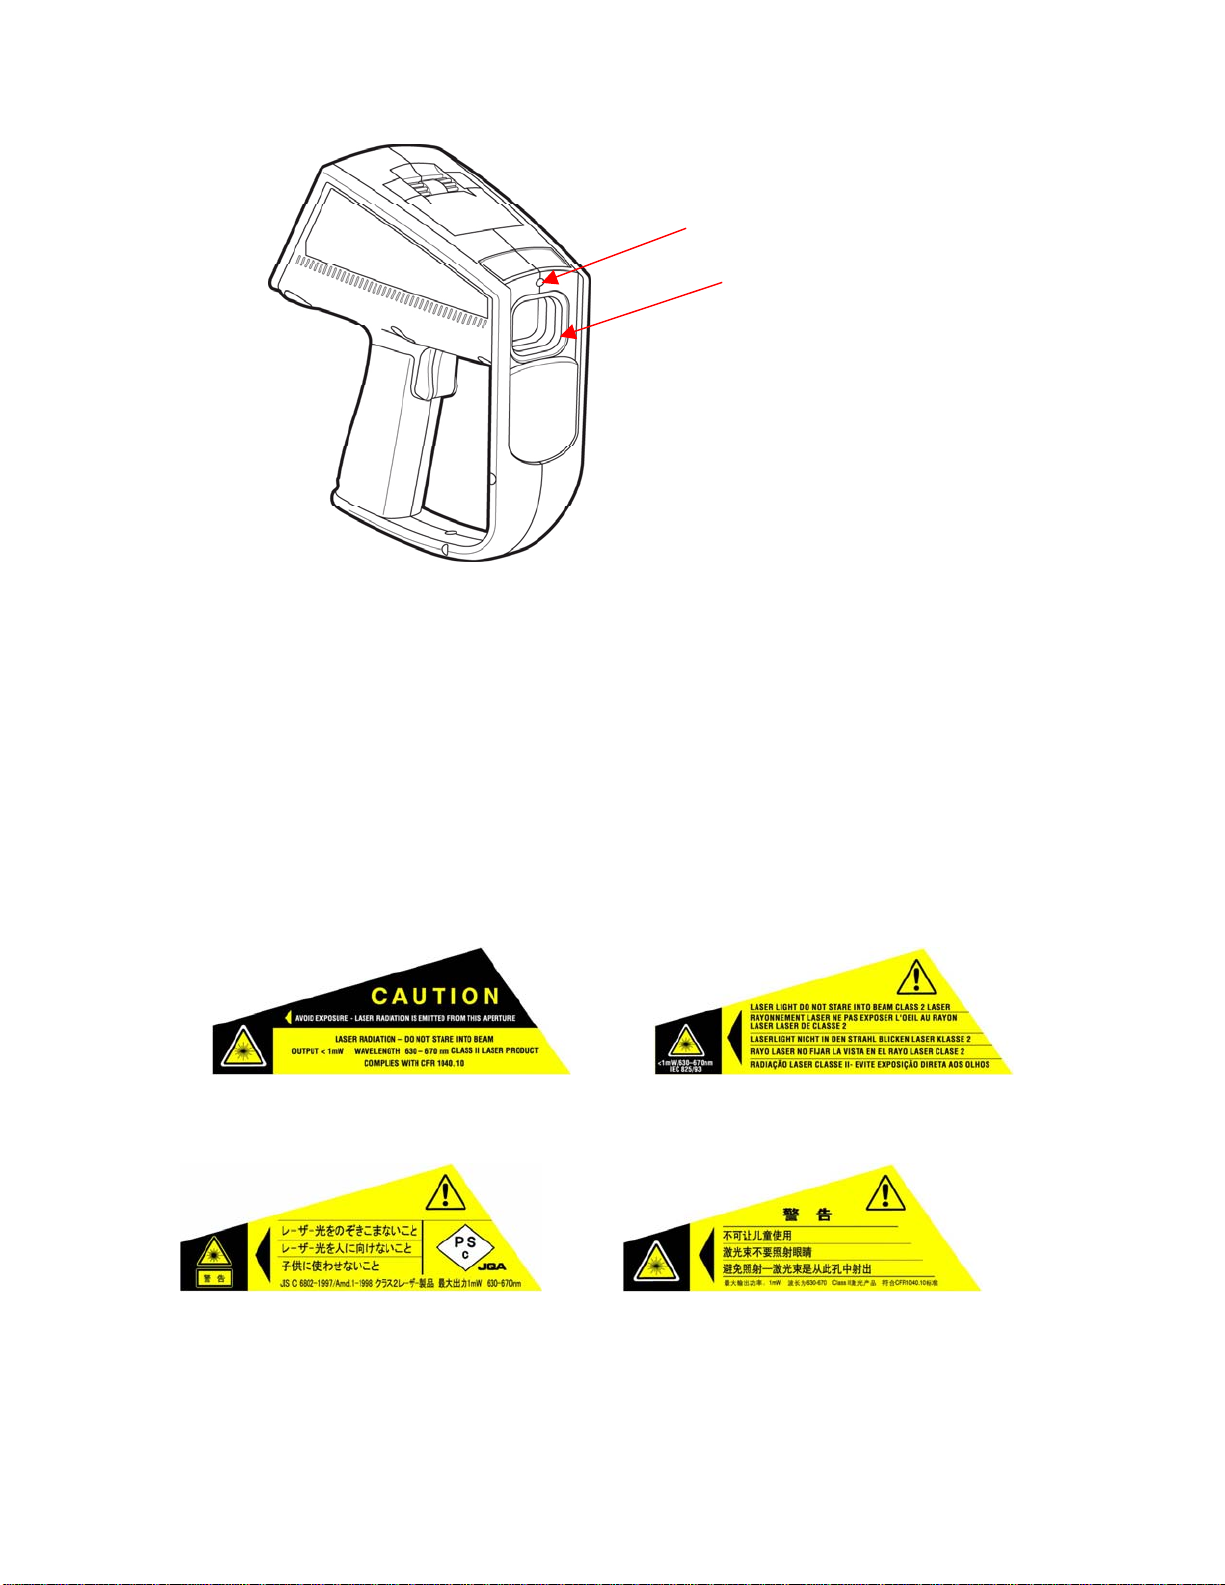
Figure 12. Laser Aperture and Optical Channel
Laser Aperture
Optical Channel
Note:
The laser is only a sighting aid. It is not required to take measurements. The laser is
not coaxial with the infrared channel, thus the laser dot is offset from the center of
the thermal image (the reticle or crosshatch at the center of the display). The laser
dot is not visible in the thermal image.
Important:
Avoid directing the laser to people’s eyes. See important safety information
on the warning laser label located on the side of the unit. There are different
laser warning labels for different geographic regions. These are identified
below.
North America
Europe / Latin America
Japanese Chinese
Figure 13. Laser Warning Labels For Different Geographic Regions
Jan 31st, 2005 - 21 -
Page 22
Centigrade/Fahrenheit Toggle Button
Centigrade/Fahrenheit button toggles the displayed temperature data in either
Centigrade or Fahrenheit temperature scales. The factory default is Centigrade.
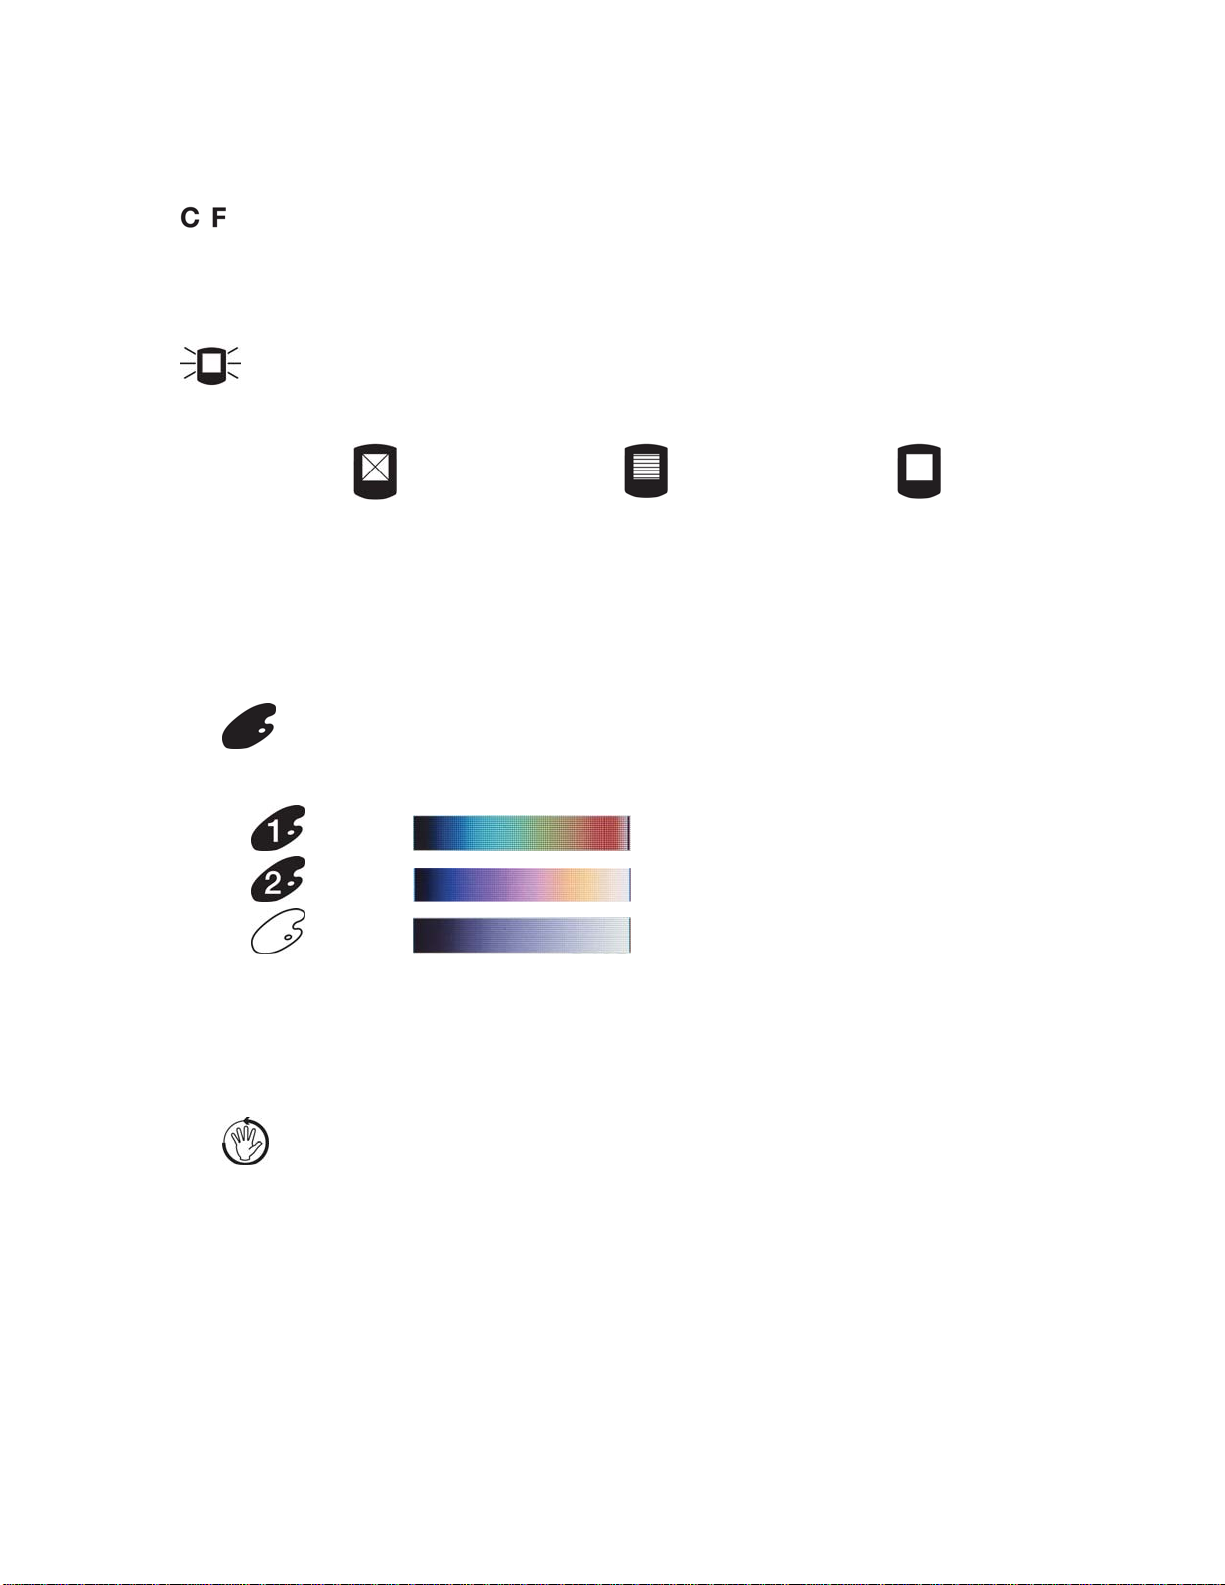
LCD Backlight Illumination Switch
LCD Backlight Illumination switch provides three backlight illumination levels as
shown below.
Off Medium Full
Full brightness is recommended for indoor use; use Medium brightness to save battery life,
and set backlight Off for outdoor applications. The default position is Full brightness.
Palette Switch
The Palette switch allows the Ti30 imager to display temperature patterns in three
different palettes as indicated below:
Rainbow
Ironbow
See Selecting the Color Palette on page 58 for more information. The default position is
Rainbow.
Grayscale
Measurement Mode Switch
The Measurement mode switch permits the user to change the way thermal
information is presented on the display. Depending on the mode you choose, you will have
all temperature points shown on the thermal image, or you may have just a narrow interval
of temperature points being displayed at a time. The decision of which mode to use depends
on each operator’s needs and limitations.
Jan 31st, 2005 - 22 -
Page 23

There are three measurement mode positions associated with this switch:
Automatic Semi Automatic Manual
In Automatic mode the Ti30 imager automatically adjusts the image to show the
lowest temperature value present in the thermal scene (MIN) and the highest temperature
value in the scene (MAX).
In
temperature value on the thermal scene) automatically.
In
See Selecting the Measurement Mode on page 58 for more information. The default position
is automatic mode.
Semi-Automatic mode the Ti30 imager keeps calculating the MIN limit (lowest
Manual mode the user can adjust Gain and Level manually.
Gain and Level Thumbwheels
The Level Thumbwheel control adjusts the median point of a given temperature
scale.
The
median Level point.
See Gain and Level Thumbwheels on page 61 for more information about these controls.
Gain Thumbwheel control adjusts the temperature band or range around the
Jan 31st, 2005 - 23 -
Page 24
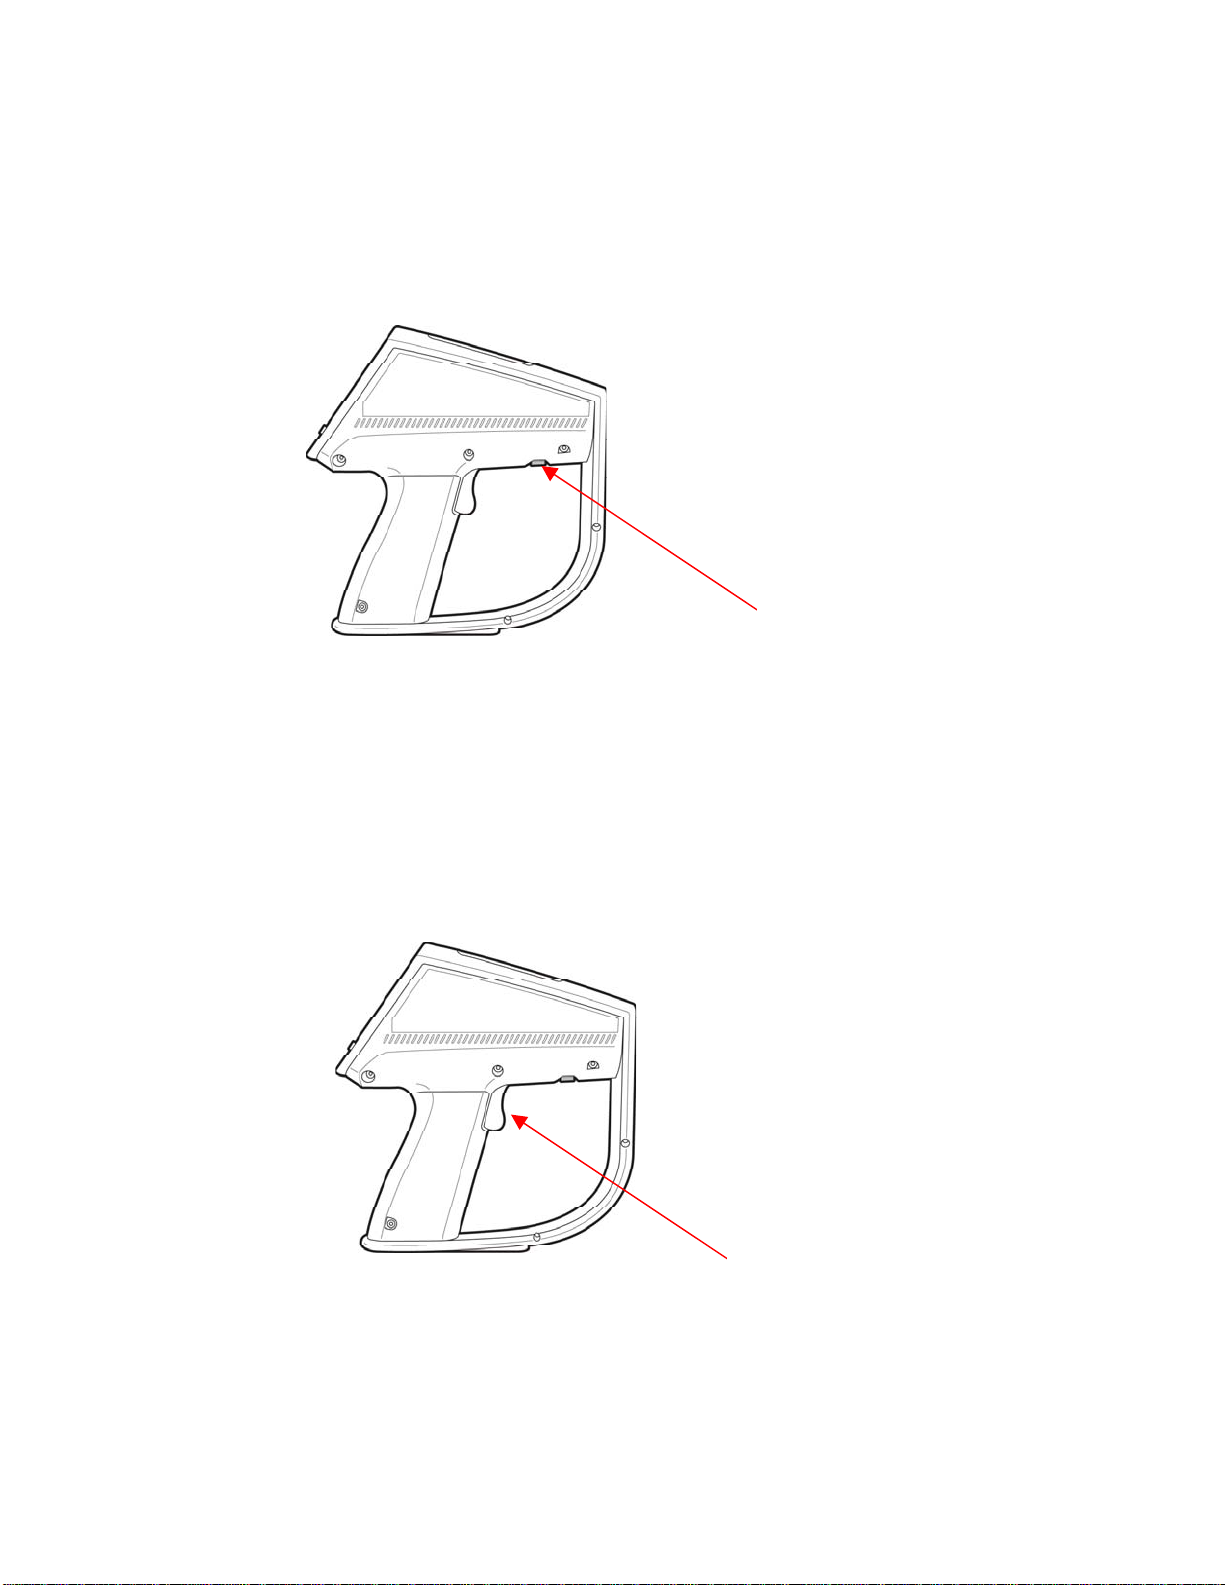
Focus Wheel
The Focus Wheel is located on the bottom of the imager’s housing in front of the trigger as
shown in Figure 14. Adjust the focus by turning the Focus Wheel with your fingers or
thumb.
Focus Wheel
Figure 14. Location of the Focus Wheel
See The Importance of Focusing on page 57 for more details.
Trigger
Actuating the trigger freezes an image prior to storage. While in a regular measurement
mode, pull the trigger momentarily, release it, and the thermal image on the display will be
frozen so you can evaluate it for storage. If you don’t want to store it, simply pull the trigger
again and the unit will go back to measurement mode.
Trigger
Figure 15. Location of the Trigger
Jan 31st, 2005 - 24 -
Page 25
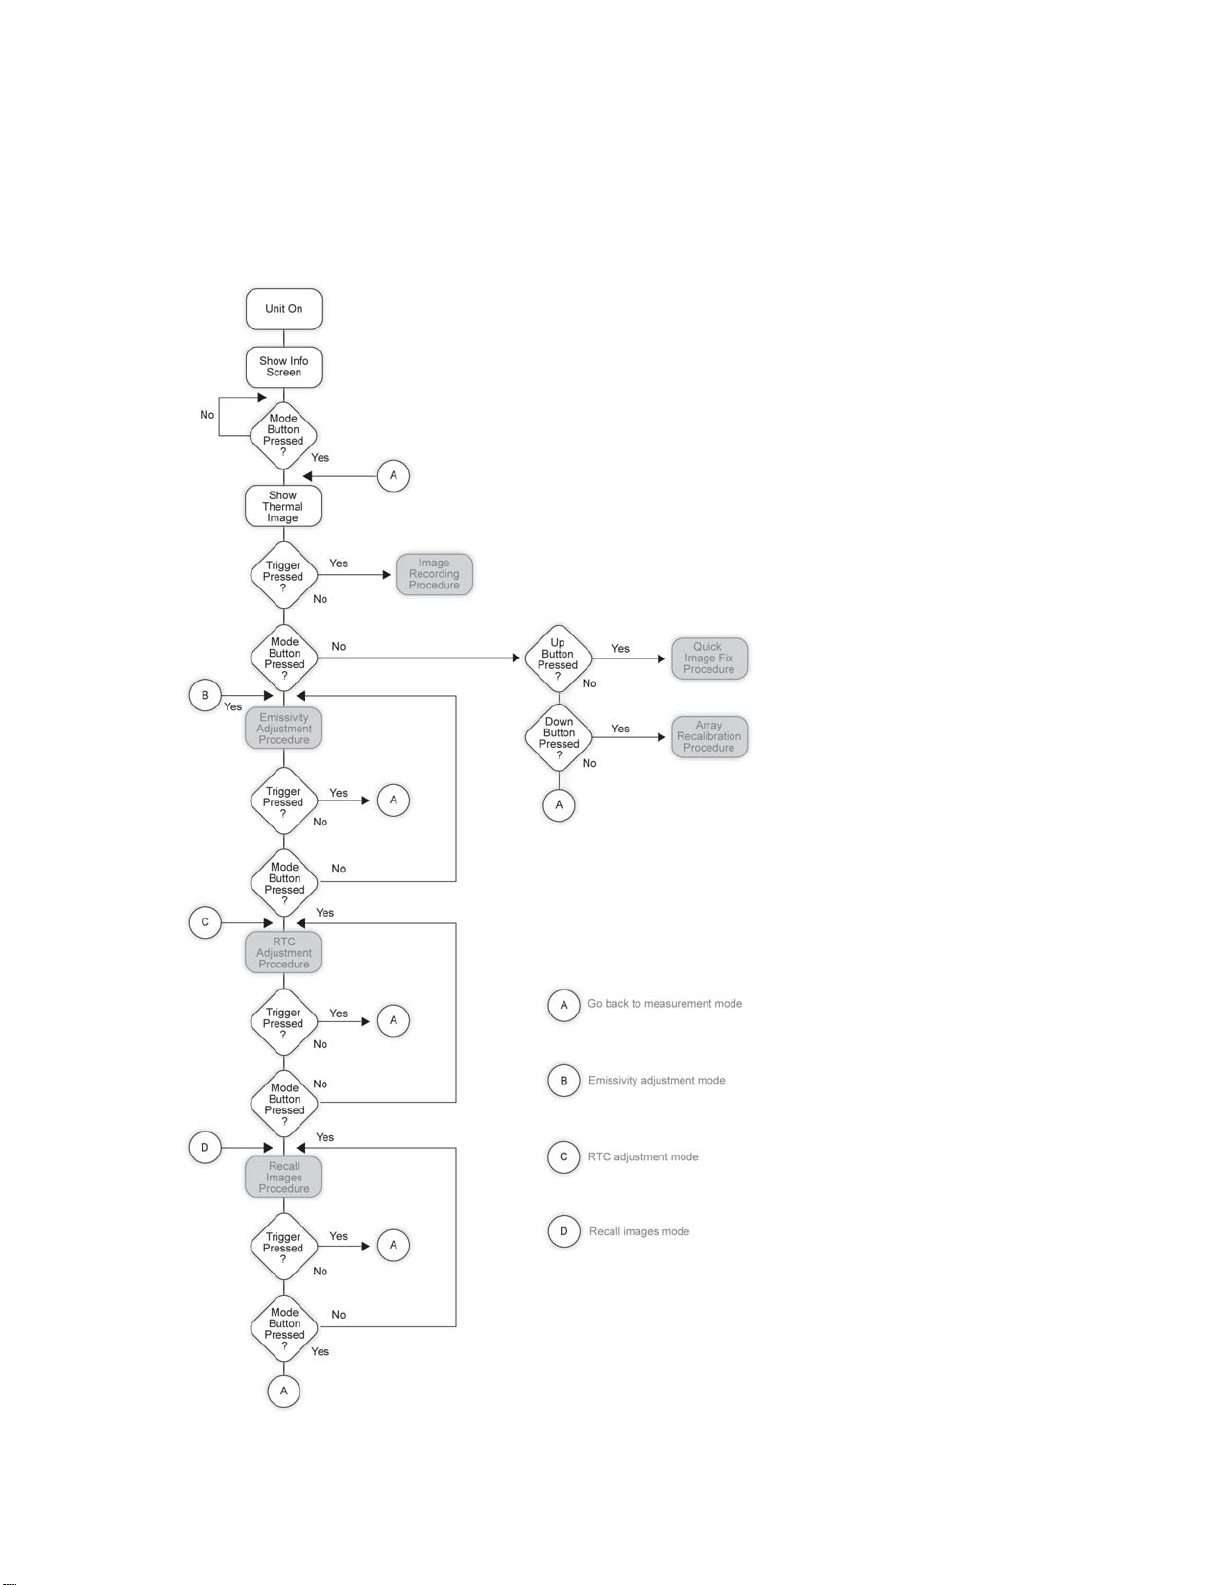
Man Machine Interface Flow Charts
Main Loop
Jan 31st, 2005 - 25 -
Page 26
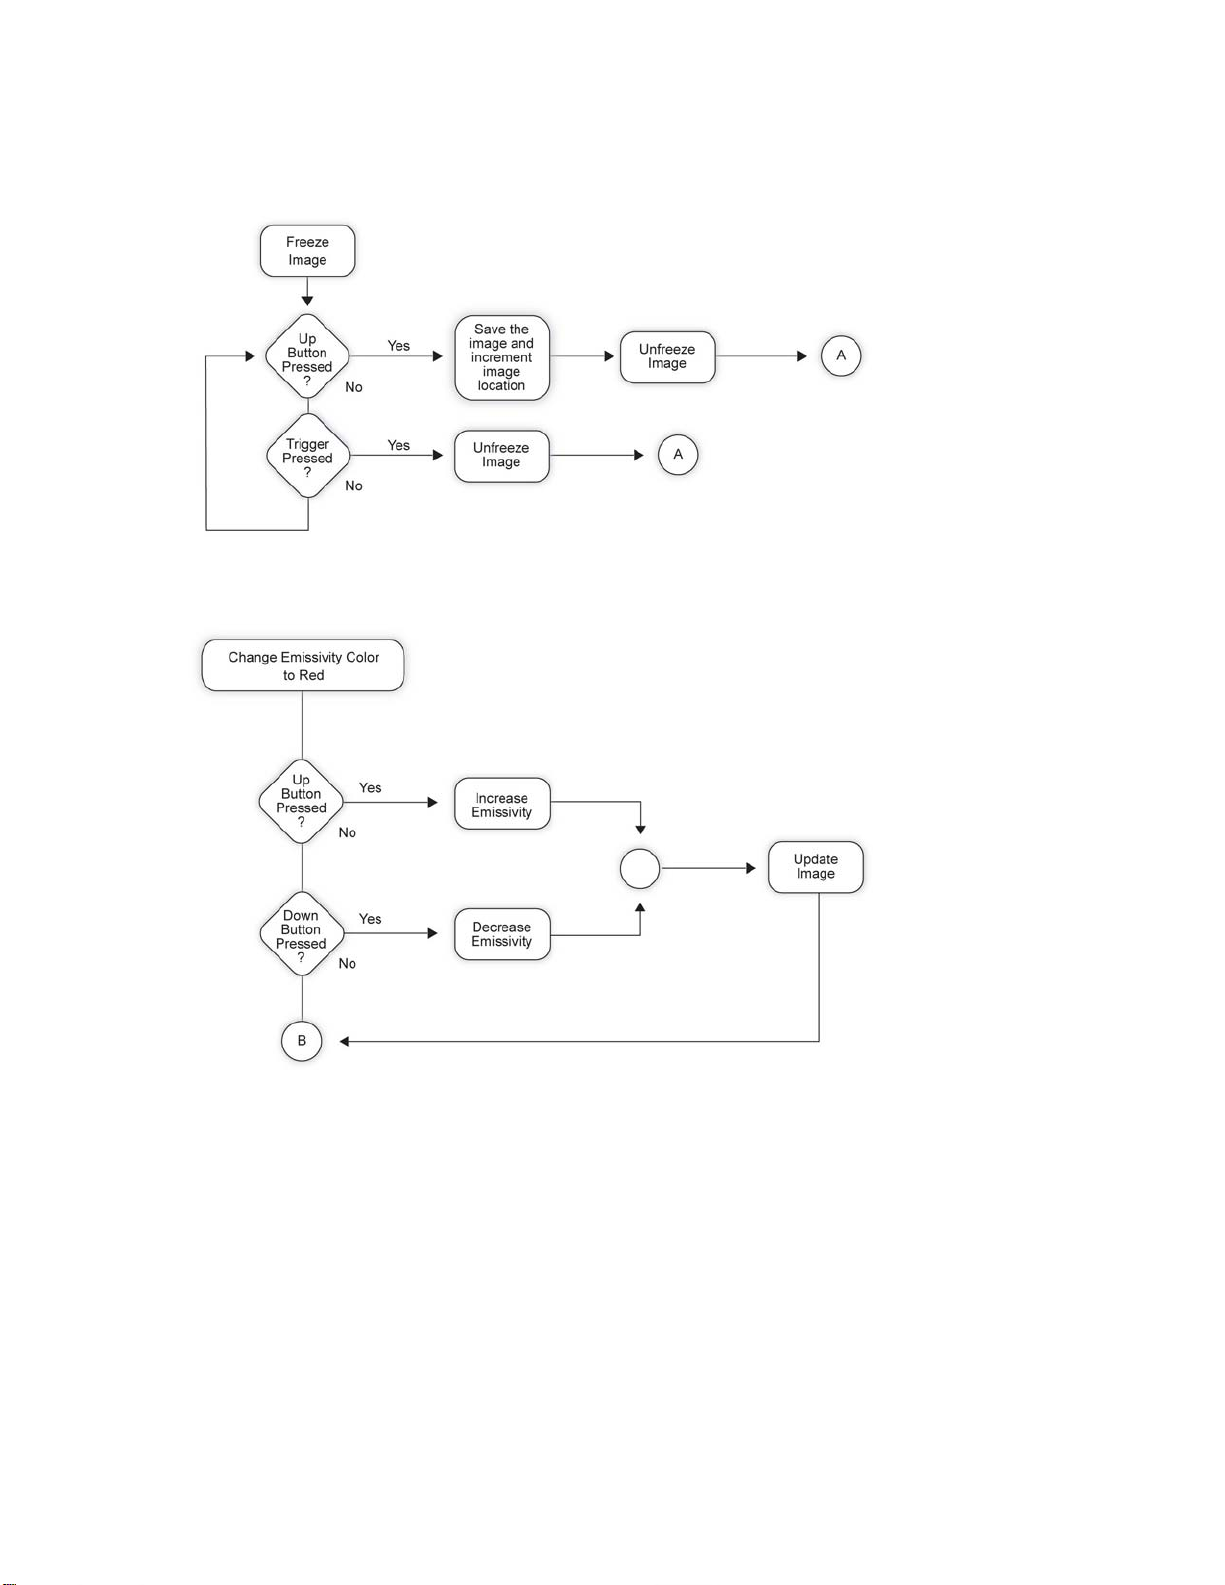
Image Recording Procedure
Emissivity Adjustment Procedure
Jan 31st, 2005 - 26 -
Page 27
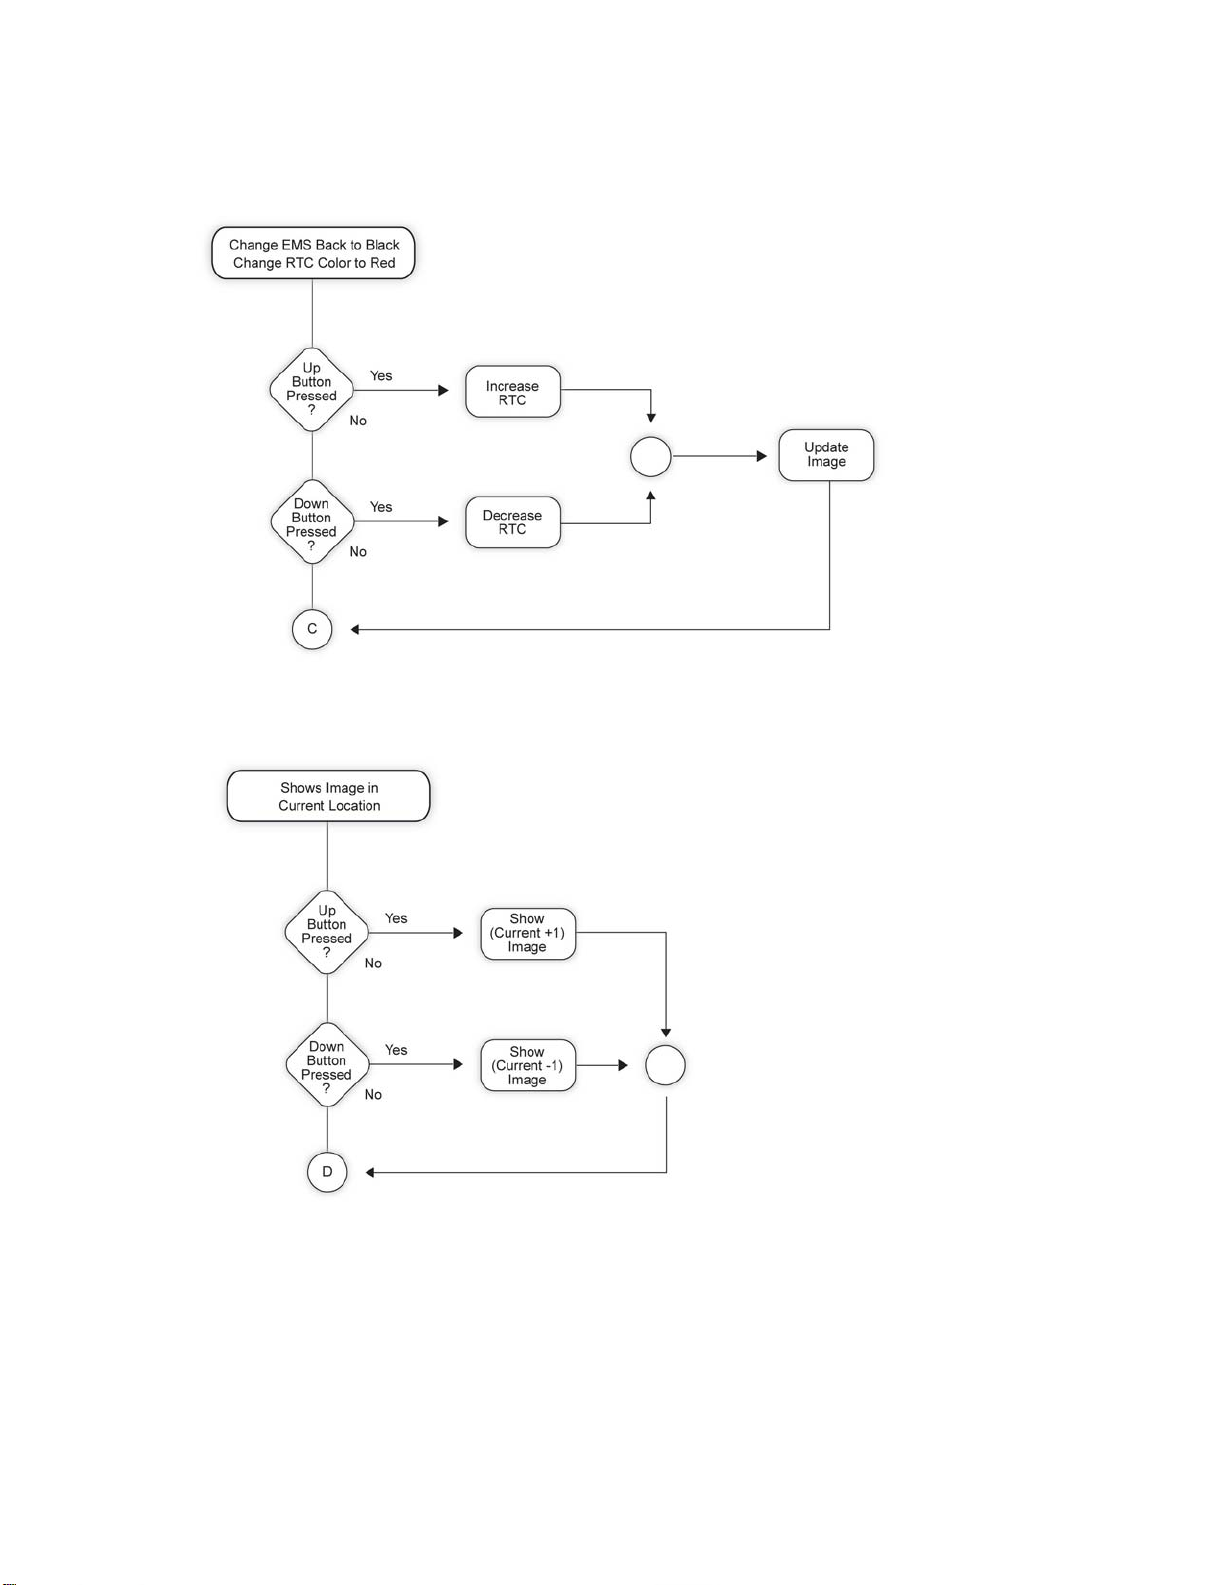
Reflected Temperature Compensation Adjustment Procedure
Recall Images Procedure
Jan 31st, 2005 - 27 -
Page 28
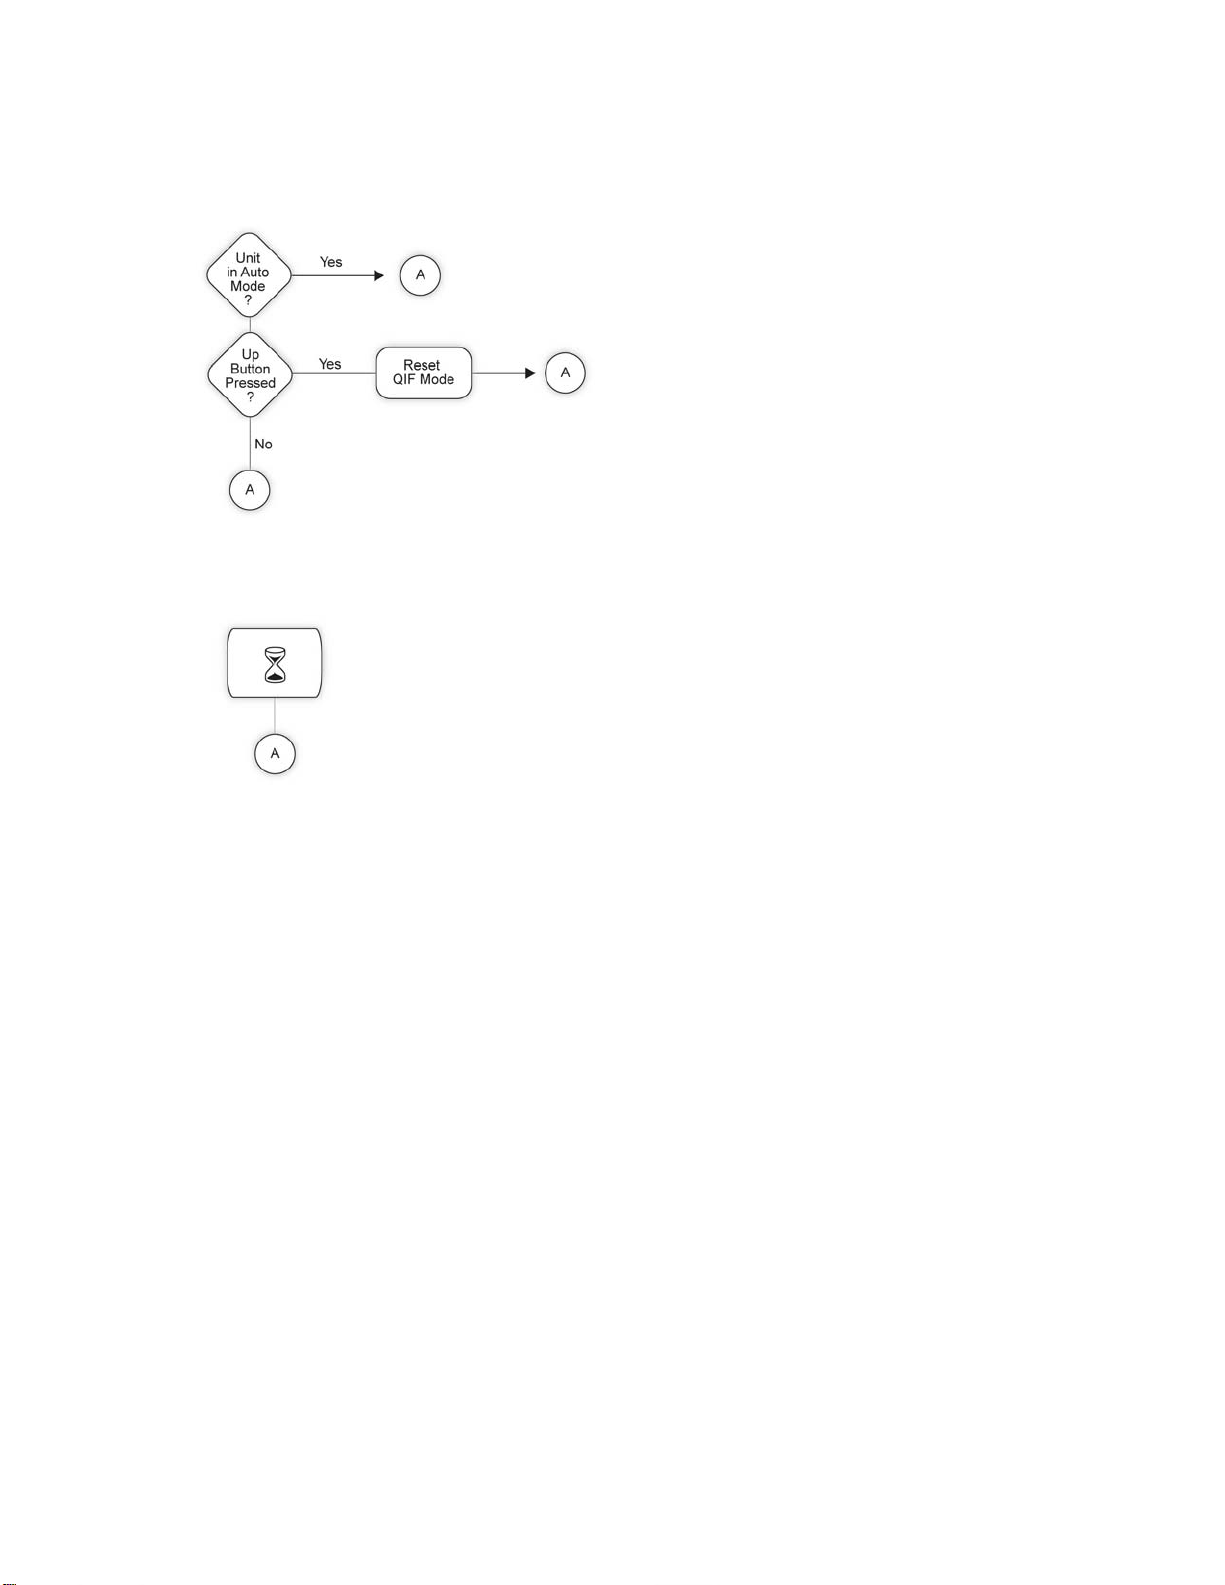
Quick Image Fix Procedure
Array Recalibration Procedure
Recording an Image
Recording images with the Ti30 imager is simple. Repeat the steps below and record as many
images you want until you get familiar with the process.
First, note the number of the current image location. At this point, if you have not
stored any images, the location number should be set at 1 (default) and the location
descriptor will be blank. Similar to a camera, each image is numbered, so you may refer
to images as one, two, three, etc. up to 100 images.
Point the Ti30 imager at the target you want to record. Make sure the crosshatch at the
center of the image pinpoints the spot of interest. Pull the trigger once and release it.
This freezes the displayed image.
Carefully inspect the image: If the result is satisfactory, press the Up button and the
image will be stored at the current location, and the location counter will increment to
next position automatically.
If the image is not satisfactory: Press and release the trigger to discard the frozen image.
Repeat the procedures described above to record more images.
Jan 31st, 2005 - 28 -
Page 29
p
Note:
To erase an image, just store a new image over the one you wish to delete. To do
this, go to Recall Images Procedure, press the Down or Up buttons to find the
image location number you wish to delete, press Mode button or trigger to get back
to measurement mode, and pull trigger again to save a new image in that location.
There is also a procedure to erase an entire session (all images on the Ti30 Imager)
using the “Clear images in imager” button in the InsideIR software.
Retrieving an Image
From Measurement mode, press the MODE button 3 times, browsing through
Emissivity Adjustment and Reflected Temperature Adjustment modes (these
adjustments are explained in Chapter 3 ). The thermal image and related data of the current
location is shown on the display. Use the Up and Down buttons to scroll through the
images you have previously recorded. All stored images can be downloaded to your
computer for analysis using the InsideIR software later. To go back to measurement mode
just pull the trigger or press the MODE button once more.
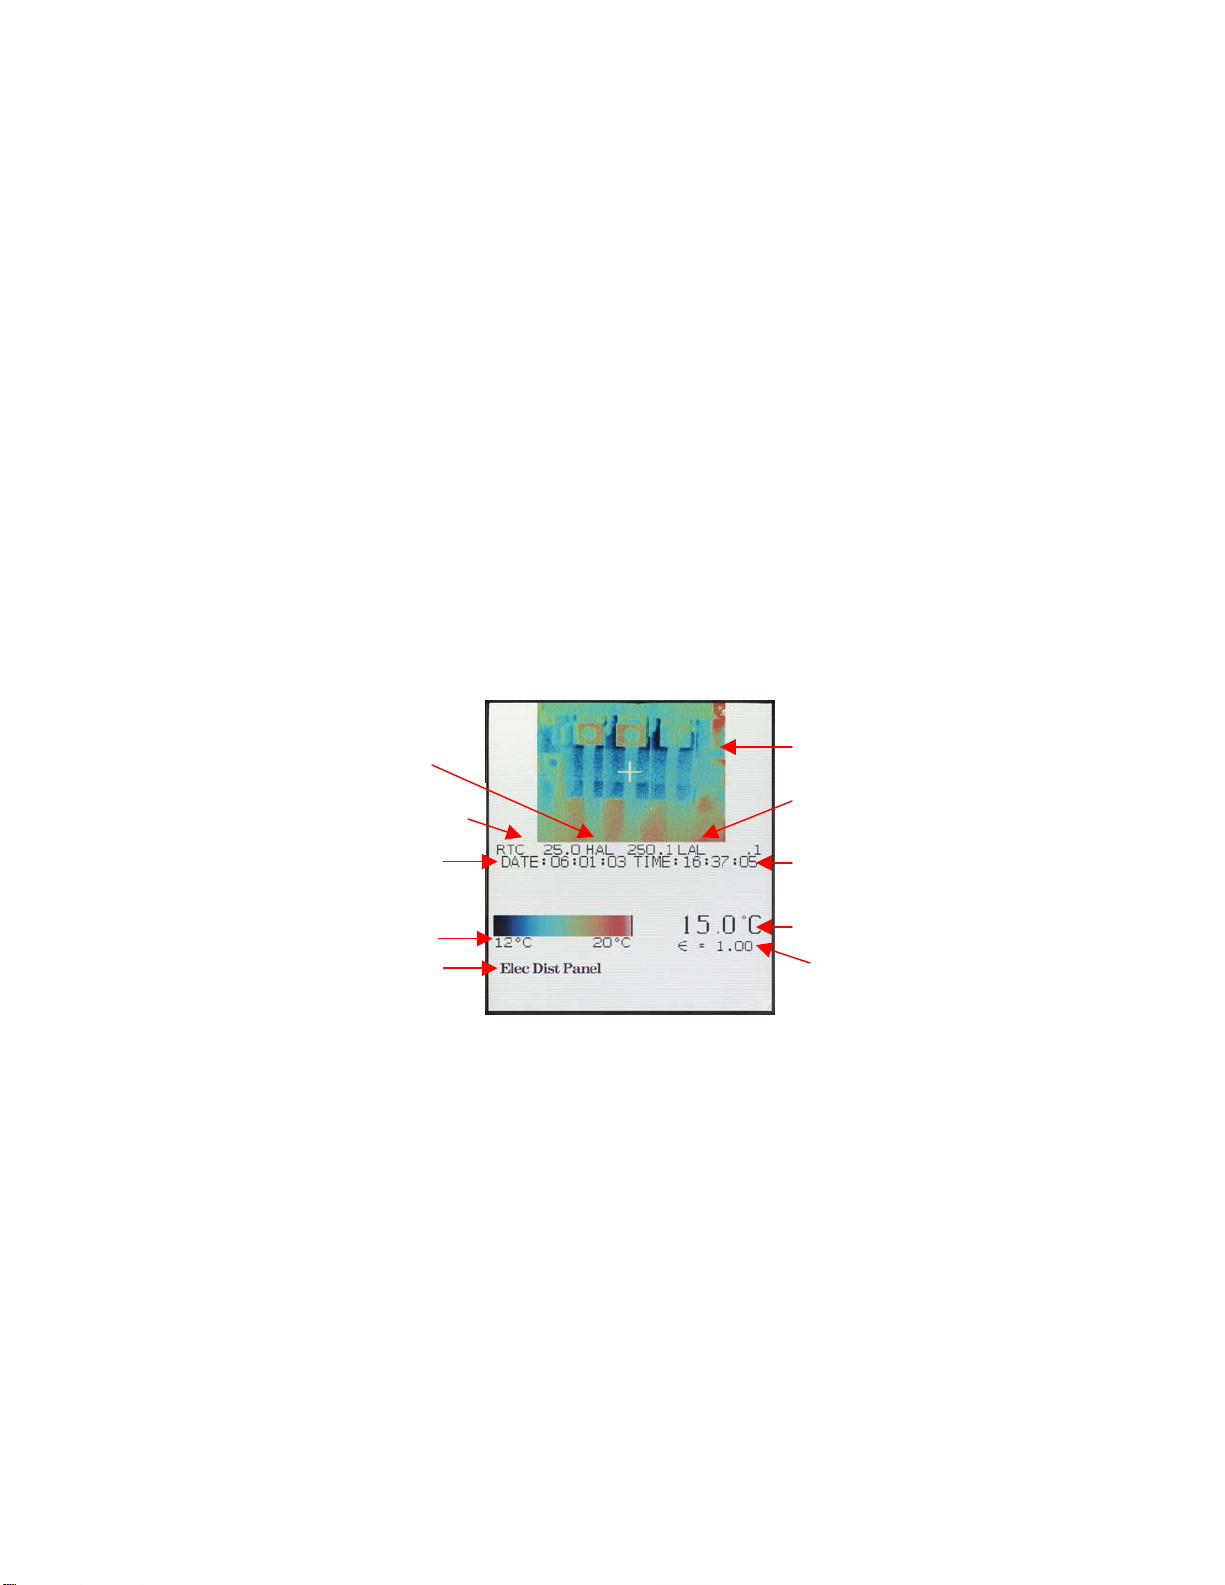
High alarm
Reflected Temperature
Compensation (RTC) value
Date stam
Temperature scale
Location name
Stored image
Low alarm
Time stamp
Stored target temperature
Emissivity value
Figure 16. Retrieve Mode
The next chapter, Downloading and Looking at Images, leads you through installing the
InsideIR software. You may then start downloading your images to your computer.
Jan 31st, 2005 - 29 -
Page 30

Chapter 3 Downloading and Looking at
Images Using InsideIR v2.0 Software
This chapter begins with the InsideIR software installation. Prior to installing the software
however, please take a moment to verify that your computer meets the minimum
requirements shown below:
One of the following operating systems Microsoft
®
Windows® XP, Microsoft®
Windows® 2000 or Microsoft® Windows® 98 SE updated with the latest packages
o Version of Internet Explorer 5.01 or greater for Microsoft
®
Windows® XP,
Microsoft® Windows® 2000 users.
o Version of Internet Explorer 6.0 or greater for Microsoft
®
Windows® 98 SE
users
o Microsoft .NET Framework 1.1 (is included on InsideIR 2.0.0 installation
Package)
o Microsoft Visual J# runtime components 1.1 (is included on InsideIR 2.0.0
installation Package)
o MDAC 2.6 Microsoft Data Access Components (is included on InsideIR
2.0.0 installation Package)
o Microsoft Access 2000 or greater for Windows
®
98 SE users only.
*Note: the latest version of Internet Explorer can be found on Microsoft’s Web site at
http://www.microsoft.com/downloads/details.aspx?FamilyID=1e1550cb-5e5d-48f5-b02b20b602228de6&displaylang=en
Personal computer with a Pentium
processor at 2.80GHz
512 megabytes (MB) of RAM (higher recommended)
500 MB of free hard disk space
SuperVGA monitor with the screen resolution set at 1024 x 768 or greater; small
recommended)
®
III processor, 700 MHz or higher. (Pentium® 4
fonts setting; and true color (32 bits)
CD ROM drive
USB rev. 1.1 port
Mouse or pointing device
Printer, optional for printing reports
Jan 31st, 2005 - 30 -
Page 31

Installing the Software
Before installing the software, make sure you have the version of Internet Explorer 5.01 or
later appropriate to the language/culture settings of the operating system installed on your
computer.
If you have exited your Interactive User's Manual, relaunch it by putting the User's Manual
CD back in your CD-ROM drive. If it doesn’t, browse to your CD ROM drive and doubleclick Ti30_CD.exe.. Once the application launches and you've selected your language, click
the Install InsideIR™ Companion Software button.
The installation wizard will lead you through the installation process.
Do NOT remove the CD until after you have successfully installed the software, rebooted
the machine, and opened the application.
Please note that you will be asked to install the Microsoft .NET 1.1 Framework and
Microsoft Visual J#.NET Redistributable Package 1.1. This is not optional—you MUST
accept the Microsoft License Agreement in order to assure a successful installation.
See the following figures for details.
Figure 17. Preparing to Install
Jan 31st, 2005 - 31 -
Page 32

Figure 18. Will configure Microsoft®.NET Framework
Figure 19. License Agreement for Microsoft®.NET Framework 1.1
Jan 31st, 2005 - 32 -
Page 33

Figure 20. Installing Microsoft®.NET Framework 1.1 (Microsoft interface)
Figure 21. Installation of Microsoft®.NET Framework 1.1 complete
Jan 31st, 2005 - 33 -
Page 34

Figure 22. Installation of Microsoft® Visual J# Redistributable Package 1.1
Figure 23. License Agreement for Microsoft® Visual J# Redistri. Package 1.1
Jan 31st, 2005 - 34 -
Page 35

Figure 24. Developer Agreement for Microsoft® Visual J# Redistri. Package 1.1
Figure 25. Installing Microsoft® Visual J# Redistri. Package 1.1
Jan 31st, 2005 - 35 -
Page 36

Figure 26. Installation of Microsoft® Visual J# Redistri. Package 1.1 complete
Figure 27. Installing InsideIR after installing required components.
Jan 31st, 2005 - 36 -
Page 37

Figure 28. License Agreement for InsideIR.
Figure 29. Customer information, enter your User Name and Company Name
Jan 31st, 2005 - 37 -
Page 38

Figure 30. Choose Destination Location
Figure 31. Configuring and Installing InsideIR
Jan 31st, 2005 - 38 -
Page 39

Figure 32. Installation Complete.
Note:
An icon for the InsideIR application is created and added to your folder during software
installation. Do not launch the program yet. Wait until you have completed the next section,
Connecting the Docking Station to Your Computer.
Please take a few minutes to complete your product registration. You can register
quickly online at http://register.fluke.com (preferred) or you can print the form and
fax it to the number provided on the form.
Product registration is very important since it allows you to get free software
updates from Fluke and helps us provide you with the fastest and most efficient
technical support.
Connecting the Docking Station to Your Computer
The docking station provides a solid and convenient base for the Ti30 imager. The docking
station keeps the Ti30 imager available and connected to the computer or workstation. In
addition, it keeps the batteries charged and ready to go. The docking station connects to
your computer through its USB port. The USB cord should remain connected to the
computer at all times.
Jan 31st, 2005 - 39 -
Page 40

Hooking Up the Docking Station
Connect the power adapter plug into the Docking Station’s power jack.
Connect the power plug to a power outlet. (Depending on the power requirements in
your country you may need to use one of the several adapters provided that matches the
power plug to the local power outlet.)
Figure 33. The Power Cord
Find the USB port on your computer. Look for this symbol on your computer.
Locate the USB communication cord permanently attached to the docking station. (The
USB communication cord is equipped with an USB connector.)
Insert the USB connector on the cord to the USB port on your computer (see Figure
18).
Figure 34. Connecting the USB Connector to the USB Port
Dock the imager in the docking station.
The first time you place the imager in its docking station and press the SYNC button
with the docking station connected, your computer's operating system will detect new
hardware and locate the correct communication driver. Your computer will automatically
launch its own driver installation program. Follow the installation instructions. You will
only have to go through this process once.
Jan 31st, 2005 - 40 -
Page 41

USB DRIVER – INSTALLING IRIMAGER.INF AND IRIMAGER .SYS
The proper USB drivers must be installed in order for the software to communicate with the
imager. The appropriate drivers were copied into the C:\Driver directory during the
software installation, but won't be installed until the unit is connected to your computer for
the first time and the installation wizard is run.
1. Install InsideIR Software (included with your imager)
2. Reboot your computer, if it did not do so automatically.
3. Launch InsideIR
4. Make sure the Ti30 imager is OFF
5. Set the imager carefully on the docking station
6. Connect the docking station’s USB cable to the USB port on your computer.
7. Press the “SYNC” button on the docking station
8. Follow the instructions on your screen as prompted when Windows detects your new
hardware. Specific details for each operating system follow.
WINDOWS XP USERS.
Figure 35. The Found New Hardware Wizard starts. Select “Install the software
automatically” and click “Next >”.
Jan 31st, 2005 - 41 -
Page 42

Figure 36. You will then be prompted for the irimager.sys file located on
C:\Drivers. Click “Browse” and select C:\Drivers\irimager.sys file and click
“Open”.
Figure 37. The Found New Hardware Wizard now confirms that it has installed the
driver. Click “Finish”.
Jan 31st, 2005 - 42 -
Page 43

WINDOWS 2000 USERS.
Figure 38. When asked What do you want the wizard to do?, select "Search for a
suitable driver for my device" and click "Next".
Figure 39. You will then be prompted for the irimager.sys file located on
C:\Drivers. Click “Browse” and select C:\Drivers\irimager.sys file and click
“Open”.
Jan 31st, 2005 - 43 -
Page 44

Figure 40. The Found New Hardware Wizard now confirms that it has installed the
driver. Click “Finish”.
Jan 31st, 2005 - 44 -
Page 45

WINDOWS 98 SE USERS.
Figure 41. New hardware is detected, and the Add New Hardware Wizard is
displayed. Click "Next".
Figure 42. When “asked What do you want Windows to do?”, select "Search for
the best driver for your device" and click "Next".
Jan 31st, 2005 - 45 -
Page 46

Figure 43. The Add New Hardware Wizard tells you it will search for new drivers,
and asks which location(s) you’d like to search. Make sure that only the “Specify a
location” box is checked, and click “Next”. You will then need to browse to the
appropriate file (C:\Drivers).
Figure 44. The Add New Hardware Wizard tells you it ready to install the driver
Jan 31st, 2005 - 46 -
Page 47

Figure 45. Installation Complete.
You are now ready to launch the InsideIR application. Go to your computer desktop and
double-click on the InsideIR program icon to launch it.
The following screen will appear:
Jan 31st, 2005 - 47 -
Page 48

Figure 46. InsideIR Splash Screen
The screen appears momentarily and then the following screen appears:
Figure 47. InsideIR Main Screen at Program Launch
If you wish to view the sample images now, click the plus sign to the right of the Samples
folder to open it. Then double-click on the session name (My collection, in our example
below).
Jan 31st, 2005 - 48 -
Page 49

Figure 48. InsideIR Main Screen With Session Open
Downloading Images
You are now ready to download the images you recorded in your Ti30 imager. Locate the
SYNC button in the docking station. Press the SYNC button once to begin the download
process. (Note: If you are having difficulty getting the SYNC function to work, place the
imager in the docking station and squeeze the imager’s trigger for 1 second. Then press the
SYNC button on the docking station, also for 1 second.)
SYNC button
Figure 49. The SYNC button
When synchronization completes, the following window appears:
Jan 31st, 2005 - 49 -
Page 50

Once all data are downloaded, the information is saved into a temporary area where you may
inspect the data before saving it to the disk. The following dialog window appears (images
and data are for example only):
Figure 50. Download Data Screen
You can browse through the images by clicking and dragging the horizontal and vertical
scroll bars.
Jan 31st, 2005 - 50 -
Page 51

You cannot delete individual images at this stage. You must decide whether to save the
entire collection or not. Click Save Data to save it. By clicking Cancel, the data is not saved
to the disk.
The following window appears when images are saved, signaling a successful operation:
Click on OK.
Saving Images
Following data storage, the application automatically opens the folder called “Images”
showing the newly saved collection of images. (Note: “Images” is the default folder location
for all new sessions downloaded from the Ti30 Imager. Sessions can later be moved to
alternate folders if desired by simply a click and drag procedure.) The collection of images
and their associated data is automatically saved, using the computer’s date / time settings.
You can change the file names by right-clicking on the current name,. It is recommended
you keep the date / time information in the file name so you can keep track of your periodic
inspections.
The screen below shows sample contents of the Images folder, with the newly saved file
highlighted:
Jan 31st, 2005 - 51 -
Page 52

Figure 51. Contents of Images Folder
Your newly recorded images appear as thumbnails as they are downloaded into the program.
Each set of images is in a fixed order starting from Image 1 to 100 (or however many images
you have saved). Use the scroll bars to browse through the thumbnail images.
Setting the Imager Clock
It is very important to set the Imager Clock in your Ti30 imager because it records a time /
date stamp with each stored image. This is important for meaningful reports
and trending.
Jan 31st, 2005 - 52 -
Page 53

The imager’s internal clock can only be set or changed from the computer. You cannot set
or adjust it on the imager. It is very important to have the internal clock set to your local
time / date, since your inspections will be tracked based on time / date information.
To set the time:
1. Press the “Set Date and Time in Imager” button on the lower portion of the Main
menu.
The following window appears:
2. Select the box for matching your imagers date and time to that of your computer.
3. Or click the Date arrow to see the calendar
The following window appears:
Jan 31st, 2005 - 53 -
Page 54

Click on the side arrow buttons to change the current year / month
Click to select the day of the month.
The following windows appears:
To set the current time, click on the hour and min (minute) boxes to enter time
information. Use the 24-hour time format only.
Press the Set button to upload the information to the imager.
Jan 31st, 2005 - 54 -
Page 55

Field USB Port
In the event you need to download your images to a computer without the docking station,
you may use the USB field cable included with your Ti30 imager. Connect the cable to the
Field USB port, under the display. (See Figure 52) Once the cable is connected, follow all
steps previously described.
Field USB Port
Figure 52. Field USB Port
Looking at Your Downloaded Images
Images are automatically organized into directories as they are downloaded into the software
program. All images from your latest download appear in a window that looks like the screen
below. You can look at all image thumbnails by clicking on the two scroll bars.
Jan 31st, 2005 - 55 -
Page 56

Figure 53. Viewing Thumbnail Images
You can view a larger version of a single image by clicking on the thumbnail of the image
you wish to view. When viewing a single image, you may move to the next or the previous
image by clicking on the Previous Image or Next Image button on the left side of the
screen (see Figure 54 below).
Figure 54. Viewing a Single Image
Jan 31st, 2005 - 56 -
Page 57

Chapter 4 Obtaining the Best Image
The Importance of Focusing
The focusing ability of the imager is similar to the one found on regular photographic
cameras, and it is defined as the ability to adjust the optical system to capture the highest
amount of infrared energy from the target, thus allowing the sharpest thermal image of the
target to be displayed.
obtaining a crisp clear image.
thermal image afterwards.
®
Properly focusing the unit is of paramount importance for
There is no way to compensate for an improperly focused
Focus Wheel
Figure 55. Locating the Focus Wheel
Focusing is accomplished by rotating the Focus Wheel in either direction. The minimum
focusing distance is 61cm (24 inches). That means you have to be at least 61cm (24 inches)
away from your target to get it focused.
Rotating the Focus Wheel to the leftmost position (as viewed from operator’s perspective)
will focus the optics to the minimum focus distance of 61cm (24 inches) away from the unit.
Rotating the Focus Wheel to the right, the optical system will gradually focus to longer
distances. Rotating the Focus Wheel to the furthest right position will focus the optics at
infinity.
To make sure your target is in focus, try starting with the Focus Wheel in the leftmost
position, rotate slowly to the right, and stop when the image is at its sharpest. You may need
to go back and forth until reaching the best focus adjustment. Alternately, you may move
closer or farther away from the target while viewing to determine where focus is best.
Jan 31st, 2005 - 57 -
Page 58

Tip:
When focusing an image, look for identifiable patterns or shapes on the object
surface that can help establishing the best image definition. Objects contours,
dividing lines or limits are particularly useful.
Proper focusing is not only
important to the image quality, but also greatly affects the accuracy of
temperature measurements.
to find what focus adjustment produces the highest temperature indication on the
display (keep E and RTC values constant, preferably E set at 1.0 and RTC disabled).
One way to verify if the unit is properly focused is
Selecting the Color Palette
The selected color scheme is mostly a matter of personal preference. In some cases, it makes
sense to use a specific palette for specific applications. The rainbow palette provides more
contrast between areas with close temperature values; on the other hand the ironbow palette
may provide more visual comfort in some cases because the colors blend in smoothly.
However, despite the popularity of color palettes, the gray scale is recommended for most
measurements because it is easier for the human eye to discern subtle thermal changes on
gray tones than colors.
Tip:
Always begin with the gray scale palette while you get a feel for the thermal scene
you are viewing. Then, work with the available measurement modes and the Level
and Gain adjustments before choosing which color palette to use.
Selecting the Measurement Mode
Measurement modes are simply different ways to present thermal information on the
display. Depending on the mode you choose, you may display all temperature points shown
on the thermal image, or you may select a narrow interval of temperature points being
displayed at one time. The decision of which mode to use depends on your needs and
limitations. From a thermal resolution standpoint, you are better off working with a narrow
interval of temperature points, because you will be able to see very subtle temperature
differences, since you have more colors or gray tones to represent fewer temperature points;
on the other hand, if you are just looking for larger temperature differences, you can not
work with a narrow temperature interval because important temperature values might not be
displayed.
There are three measurement mode positions associated with this switch:
Automatic Semi Automatic Manual
In
lowest temperature value present in the thermal scene (MIN) and the highest temperature
Automatic mode the Ti30 imager automatically adjusts the image to show the
Jan 31st, 2005 - 58 -
Page 59

value in the scene (MAX). The MIN and MAX values are displayed at the beginning and at
the end of color scale. This mode does not require any other adjustment (other than
properly focusing the unit). Automatic mode is recommended every time the user first
starts looking at a given target since the temperature limits are unknown. This mode is also
recommended when the user is looking for fairly large temperature differences (such as,
looking for hot spots in electrical devices).
Note:
The Quick Image Fix feature is a sub set of the Automatic mode. This is a
convenient feature that fixes the MIN and MAX temperature values (level and gain)
and thus creates a more stable thermal image for the user to view. To quick fix the
image, simply press the Up button on the keypad once, and the temperature limits
will stop adjusting automatically. Fixing the temperature limits provides a more
comfortable experience for thermal image evaluation. The thermal boundaries
(highest and lowest temperature values) will adjust automatically again when you
record another image (see Recording an Image on page 28 for more information) or
by pressing the Up button again while in the Automatic measurement mode. The
Quick Image Fix feature is active only when the unit is set to Automatic mode.
Different from Automatic mode, Manual and Semi Automatic modes work jointly with
two adjustable parameters: Level and Gain. These two parameters are adjustable by using
the two thumbwheels located on the switch bay (see Figure 11 on page 20).
Level Gain
Level is defined as the median point of a given temperature scale. For example, if the unit is
currently in Automatic mode, and there is a given thermal scene with MIN and MAX
temperature limits, the moment you switch the unit to Manual mode, the Level value is set
by the unit according to the following formula:
MinMax
Level
2
Gain is defined as a temperature band around the median point of the scale (Level). In the
same way described above, if the unit is currently set at Automatic mode, and there is a
given thermal scene with MIN and MAX temperature limits, then switching the unit to
Manual or Semi Automatic mode causes the Gain value to be set according to the
following formula:
MinMax
Gain
2
Jan 31st, 2005 - 59 -
Page 60

Graphically, it would look like this:
The imager automatically calculates Level and Gain when switched
from Automatic to Manual or Semi Automatic modes, thus
providing a smooth and meaningful transition of the thermal
boundaries of the scene.
Once initially set by the Ti30 imager, Gain and Level can then be
adjusted by the user in order to accommodate their specific
requirements.
Of course, in practical terms you can’t actually see the values for
Gain and Level. You will adjust Gain and Level, but you will see
the changes on the MIN and MAX temperature values at each end
of the thermal scale. Since we know how Level and Gain are
calculated by the imager, it is easy to understand how variations in
Gain and Level change the MIN and MAX limit values by solving
the Gain and Level equations for MIN and MAX as follows:
GainLevelMin
GainLevelMax
In summary: you need to adjust Level to get close to temperature level you are interested in
and then adjust Gain to get you more or less resolution as needed around the desired level.
Tip:
Always begin by selecting the Automatic mode. Automatic mode will suffice for
most applications. The unit automatically adjusts the image to show the lowest
temperature value present in the thermal scene (MIN) and the highest temperature
value in the scene (MAX), at all times. This mode does not require any other
adjustment (other than properly focusing the unit). Once you are familiar with the
thermal scene you are looking at just press the Up button to activate the Quick
Image Fix feature, described on the previous pages. When you press the Up
button the imager fixes the MIN and MAX temperature values, thus allowing a
more stable thermal image for the viewer. The next step is to capture the image for
downloading later. To freeze the image, simply pull the trigger once and then press
the Up button to actually save the image.
In
Semi-Automatic mode the Ti30 imager keeps calculating the MIN limit (lowest
temperature value on the thermal scene) automatically. This mode is recommended when
the user is interested in controlling the resolution around a varying temperature level, thus
saving the user a lot of trouble and time trying to constantly adjust Level. The unit keeps
calculating the MIN limit (lowest temperature value on the thermal scene) automatically at
Jan 31st, 2005 - 60 -
Page 61

all times; Once Gain has been initially set as
Gain
MinMax
, the user can then change
2
Gain manually.
In
Manual mode the user can adjust Gain and Level manually. Use this measurement
mode when you need more freedom to define Level and Gain values. This mode provides
the flexibility to bring both MIN and MAX values to the desired cut-off levels and to adjust
the temperature interval to a minimum, thus maximizing color resolution. Using the Manual
mode efficiently requires more experience with both thermal imaging techniques and specific
knowledge of the equipment being inspected. However, Manual mode provides the best
possible image definition as to the specific inspection situation at hand, both from a thermal
resolution and temperature level standpoint.
It is worth noting once again the importance of properly focusing the Ti30 Imager. Once a
properly focused image is stored and downloaded to a computer, you can use the InsideIR
software to adjust the level and gain of an individual image (perfecting the image quality on
the PC in a controlled office environment versus in the field).
Tip:
The minimum temperature interval between the MIN and MAX values is 5 C / 9
F. It is important to remember that by decreasing the difference between MIN and
MAX values increases the likelihood of image noise. Only bring the difference
between MIN and MAX to the minimum when you absolutely need the best
thermal resolution available.
Gain and Level Thumbwheels
The Level Thumbwheel control increases Level by pulling the wheel towards the
back of the imager and decreases Level by pushing the wheel forward towards the front of
the imager. When Level is increased both MIN and MAX values increase accordingly and
when Level is decreased both MIN and MAX values are decreased accordingly.
The Gain Thumbwheel control increases Gain by pulling the wheel towards the back
of the imager and decreases Gain by pushing the wheel toward the front of the imager.
When Gain is increased, MIN value decreases and MAX value increases accordingly. When
Gain is decreased, MIN value increases and MAX value decreases accordingly. Gain can be
decreased up to the point when the difference between MIN and MAX values is 5 C / 9 F.
Note:
Both wheels have endless adjustment action (no détente).
Jan 31st, 2005 - 61 -
Page 62

Chapter 5 Qualitative and Quantitative
Temperature Measurements
Most of the time thermal imager users are measuring apparent temperatures that are inextricably
linked to qualitative inspections. Qualitative inspections focus on temperature differences as opposed
to actual temperatures. The reason is that temperature differences are sufficient to indicate most
abnormalities in electrical and mechanical equipment. In other words, qualitative inspections
do not strive for accurate temperature measurements. Their goal is to capture and identify
different thermal patterns in a given thermal scene, which are indicative of potential failures
and / or equipment malfunctioning. Since there is no intention to measure the actual or
absolute value, the technician has no need to correct for target emissivity (which is set at “1”
on qualitative inspections), reflected temperature from the environment (which is not
enabled in the unit on qualitative inspections) or account for target spot size and distance
from the target (quite often the target of interest is always compared to a similar target in the
same thermal scene). Also, the operator does not need to adjust or account for atmospheric
attenuation, angle of incidence and other interfering factors.
On the other hand, quantitative inspections are intended to accurately measure the actual
temperatures of specific areas in electrical or mechanical equipment. Although less common
than qualitative inspections, quantitative inspections are sometimes required. One good
example would be measuring electric motor temperatures: in this case, the absolute
temperature value is required since it is closely linked to the useful life of the motor. To
accurately measure temperature using infrared temperature measurement technology, the
customer should be aware of the key concepts and factors that can radically interfere with
the quality of the quantitative temperature measurement.
Distance to Target (Spot) Ratio
The optical system of an infrared sensor collects the infrared energy from a circular
measurement spot and focuses it on the detector. Optical resolution is defined by the ratio
of the distance from the instrument to the object, compared to the size of the spot being
measured (D:S ratio). The larger the ratio factor the better the instrument's resolution, and
the smaller the spot size that can be measured from a greater distance.
All non-contact infrared thermometers and thermal imagers have a specific optical
resolution, expressed by the D:S ratio and by the optical diagram, which shows the geometry
of the infrared radiation path as seen by the lenses of the instrument.
See 56 for an illustration of the D:S ratio and the optical chart for the Ti30 unit.
Jan 31st, 2005 - 62 -
Page 63

D:S ratio: D / S = 90
The number “90” means that at a distance D equal to 1 meter the unit will measure a circle
of diameter S equal to 1.1cm (1 meter divided by 90); at distance D equal to 2 meters it will
measure a circle with diameter S equal to 2.2cm and so on in a linear progression.
Optical Diagram
The optical diagram shows the graphical representation of the optical ratio. The optical path
of the infrared radiation is a cone that has its vertex at 61cm (24”) away from the front of
the unit, and progresses at the same ratio towards infinity. The circle diameter can be
calculated by dividing the distance by 90 at any point in the centerline of the cone. Below it
is presented the diameters S for three different distances: 61cm (minimum distance), 2m and
5m. There is no maximum distance. Although, in practical terms, accurately measuring
temperatures of targets a great distance away requires very large objects.
Figure 56. Illustration of Distance to Target / Spot Ratio
The explanation of optical resolution is key for the understanding of the next concept, vital
for accurate temperature measurement in quantitative inspections.
Field-of-View
Make sure that the target is larger than the spot size that the unit is measuring. The
smaller the target, the closer you should be to it.
Jan 31st, 2005 - 63 -
Page 64

Figure 57. Field of View
Tip:
When accuracy is critical it is best to build in a factor of safety and make sure that
the target is at least twice as large as the spot size.
Environmental Conditions
Watch for environmental conditions in the working area. Steam, dust, smoke, etc.,
can prevent accurate measurement by obstructing the path between the target and the unit's
optics. Noise, electromagnetic fields, or vibration are other conditions that can interfere with
temperature measurements, and should be considered before starting temperature
measurements.
Tip:
If interfering factors can not be mitigated try to change your position relative to the
source of interference, or pick a time when interfering factors are not present or at
a smaller level.
Ambient Temperatures
The imager’s operating temperature range is -10 to 50 (14 to 122F). Its calibration is
maintained within this range. The unit will not perform in terms of the accuracy and
repeatability if used outside the stated operating temperature range. Also, if the imager is
exposed to abrupt ambient temperature differences of 10C (18F) or more, allow it to
adjust to the new ambient temperature for at least 20 minutes.
Tip:
Jan 31st, 2005 - 64 -
When inspecting equipment in a plant, plan the sequence of locations to be
inspected so the ambient temperature changes are gradual.
Page 65

Emissivity
Emissivity is the measure of an object's ability to emit infrared energy. Emitted infrared
energy is exponentially proportional to the temperature of the object. Emissivity can have a
value from 0 (shiny mirror, perfect reflector) to 1.0 (blackbody, perfect emitter). Most
organic, painted, or oxidized surfaces have emissivity values close to 0.95. If you are
performing qualitative inspections with your imager, leave the emissivity set at 1.0. If you
need to measure actual temperature values, set the emissivity value according to the
emissivity of the material the object you are measuring is made of. Again, if you need
accuracy, you will need to find the emissivity value of the material before taking the
measurement. See Table 1 on page 89 and Table 2 on page 90 for the emissivity values for
the most common materials.
There are a couple of methods that help you to find the emissivity value of materials:
Tape method: this method requires the usage of the Scotch
(emissivity value 0.97) or equivalent. Cover the surface you want to measure with tape.
Wait some seconds for the temperature to stabilize. Set the emissivity of the imager at
0.97 and measure the temperature. Make a note of the temperature value. Then, remove
the tape and measure the new temperature value. Adjust the emissivity accordingly until
the temperature value found previously is displayed on the unit. This emissivity value is
the one of the material being measured. This method is good for objects that are at low
temperatures (under 100C (212F)), not electrically energized and not in motion.
Contact thermometer method: this method will need a contact probe and good quality
temperature meter. Initially, use the contact probe temperature meter to measure the
temperature of the object you want to know the emissivity value, allowing time for the
contact probe to stabilize (this may take up to a minute). Make a note of the temperature
value. Adjust the emissivity on the imager accordingly until the temperature value found
previously with contact probe temperature meter is displayed on the imager display. This
emissivity value is the one of the material being measured. This method is good for
objects that are at moderately high temperatures (under 250C (482F)), not electrically
energized and not in motion.
To set or change the Emissivity value, complete the following:
1. Put the Ti30 imager in regular Measurement mode.
®
brand PVC tape
2. Press the MODE button once. At this point you will be able to adjust Emissivity.
3. Set the Emissivity value to the proper value, according to the target material, by
pressing the Up and Down buttons.
Reflected Temperature Compensation
Targets that have low emissivities will reflect energy from nearby objects. This additional
reflected energy is added to target’s own emitted energy and may result in inaccurate
readings (see 58 below). In some situations objects near the target (machines, furnaces, or
Jan 31st, 2005 - 65 -
Page 66

other heat sources) have a temperature much higher than that of the target. In these
situations it is necessary to compensate for the reflected energy from those objects.
Note:
The Reflected Temperature Compensation (RTC) feature is disabled if the
emissivity is set to 1.00.
To set or change the RTC feature, complete the following steps:
1. You will need an infrared reflector. Take a piece of aluminum foil. Crumple and re-
flatten the foil and put it on a cardboard plate, shiny side up.
2. Put the Ti30 imager in regular Measurement mode.
3. Press the MODE button once. At this point you will be able to adjust Emissivity.
4. Set the Emissivity value to 1.00.
5. Position the imager at the selected measurement distance from the target to be
measured. Aim and focus the unit on the target.
6. Now, place the infrared reflector in the field-of-view of imager. Position the reflector in
front of and parallel to the target surface.
7. Measure the apparent surface temperature of the surface of the reflector. This
temperature is the reflected temperature of the target. Make a note of this temperature
value.
8. It is a good idea to repeat the steps from 5 to 7 and then average the results. Make a note
of the average.
9. Press the MODE button one more time. At this point you will be able to adjust the
RTC value.
10. Enter the value found on step 8 for RTC, by pressing the Up and Down buttons.
11. To enable the RTC, make sure the set the Emissivity properly, according to the object
material. If set at 1.00, the RTC compensation won’t take place.
Figure 58. Reflected Temperature Compensation
Jan 31st, 2005 - 66 -
Page 67

Chapter 6 Organizing Your Data
The Ti30 imager when used together with the InsideIR software provides a powerful way to
organize and track maintenance data. Different groups of equipment can be inspected and
data specific to different plant areas or departments can be individually named, saved, stored
and retrieved in a straightforward fashion. Because all the records are electronic, they can be
backed up and stored without fear of loss or fading of records.
File Management
You can rename or delete files (“sessions”) or folders from the directories by right-clicking
the icons in the file structure on the left side of the screen and choosing the appropriate
command from the pop-up menu. You may move a file by clicking it and dragging it onto
the destination folder.
Note:
Keep in mind that a file (or “session”), is a collection of images—not a single
image.
Jan 31st, 2005 - 67 -
Page 68

Figure 59. Organizing Your Files
Uploading Data to the Imager
Click the Upload a Session to Imager button on the InsideIR main screen to
upload data to the Ti30 imager. This displays the following screen:
Jan 31st, 2005 - 68 -
Page 69

Select the folder and session you want to upload and press Next.
Figure 60. Uploading Data to Your Ti30 Imager
If you wish to change parameters for different locations such as location name, emissivity,
reflected temperature compensation, low and high alarms, and comments, you can do so by
right-clicking the thumbnail of the image you wish to edit, clicking Edit data in the pop-up
menu, and changing the desired field(s).
Jan 31st, 2005 - 69 -
Page 70

Jan 31st, 2005 - 70 -
Page 71

Figure 61. Editing Data Before Upload
Note
1:
Checking the Lock Emissivity or Lock Reflected Temperature Compensation will
prevent the operator of the imager from changing these values in the field. Pressing
the mode button on the imager from the Measurement mode will go immediately to
stored images in the imager (skipping emissivity and RTC modes completely).
Note
2:
If the need arises to change the order of images in a session (e.g. move the image
and information associated with it in location 31 to location 19), simply select the
image in location 31, click and drag the cursor to location 19 and release. The
image will be moved from location 31 to location 19 and the images between 19
and 30 will all be moved back one location. (Note: if you move an image to a
higher location number, the images between the new and old locations are all
moved forward one location.)
Note
3:
Alarm limits can be set during the image upload procedure for each image. In the
event that exceeding a particular temperature value is of interest (it may indicate
that a piece of equipment is nearing catastrophic failure for example), an alarm limit
can be set (either a high alarm, low alarm or both). If the temperature of the center
Jan 31st, 2005 - 71 -
Page 72

spot exceeds (is higher than the high alarm limit or lower than the low alarm limit)
the limits set, the temperature display on the instrument will appear in BOLD RED
letters.
To upload the data to the imager, press Upload. The imager will begin to load data. Once
the data is loaded, you are ready to perform your inspections. Upon your return, you simply
place the imager in the docking station, and bring up the software. The new data is sent to
the proper destination and is ready for comparison with any earlier data.
Note
1:
Note
2:
It isn’t necessary to upload data to the imager in order to perform inspections.
However, it is recommended in order to keep consistency between inspections by
using the same parameters for each location to be inspected.
If you wish to delete all images currently stored in the imager, press the Clear
images in imager button.
By doing this all 100 locations on the imager will be restored with the factory
parameters. These default parameters are:
Location name: blank
Emissivity: 1.00
RTC: OFF
Low alarm: 0°C / 32° F
High alarm: 250°C / 482° F
Comments: blank
Jan 31st, 2005 - 72 -
Page 73

Chapter 7 Analyzing Your Data
There are many ways to analyze your thermal data now that you have it downloaded and
organized. After clicking on a thumbnail in the Main InsideIR screen, the data for that
specific thermal image is displayed in one of four tabs: Image, Temperature Table, Profile,
and Histogram.
While each of these analytical tools possess unique qualities, they also share many features.
For example, data from any of the tabs may be saved in other formats or cut and pasted into
other applications for your own further analysis or communications needs.
The Image View Screen
Double clicking any of the thumbnail images in the InsideIR Session View screen takes you
to the Image View tab for that image. On this screen, you can view basic data about the
image.
CURSOR OPTIONS:
Point Measurements: Clicking on any part of the image will display the temperature reading
at that spot (indicated by the crosshatch). You may click as many spots as you wish, with
each click adding a reading to the displayed image. Moving your cursor around the image will
momentarily display the temperature reading on points along your path. The pixel
coordinates will be displayed simultaneously as you move your cursor across the image.
Area Measurements: Clicking and dragging on any part of the image will create a rectangular
area. Releasing the mouse button results in the display of the minimum, maximum and
average temperatures for the pixels in the defined area. You may create as many rectangles
as you wish.
Image Data/Time Stamp: Selecting the image data/time stamp button allows you to place a
date and time stamp anywhere on the image. You may add as many date and time stamps as
you wish, but the information will always be the same.
Temperature Grid: By turning on the temperature grid, you will see 300 8 pixel by 8 pixel
squares superimposed over the image. A brightness level bar will appear which allows you
to control the brightness of the grid. Each grid will display a temperature, which is the
average of the 64 pixels in that square.
Text Color: For each of the functions above, you can select various colors of text to
improve the appearance of the data over the image. Multiple colors can be used on the same
image for different information.
Jan 31st, 2005 - 73 -
Page 74

Restore Original Image: This button restores the original image, removing any temperature,
date/time information from the image (with the exception of the temperature grid which
must be turned off to disappear).
The limit bar underneath the image shows the temperature range your Ti30 imager is capable
of measuring. The minimum (-10º C / 14º F) is represented at the far left of the bar, and the
maximum (250º C / 482º F) is represented by the far right of the bar. When the Thermal
Image radio button at the bottom of the Image screen is selected, the red area on the bar
indicates the range of temperatures, within the minimum and maximum limits that are
represented in the thermal scene.
In order to see more detail in narrow ranges of temperature, it is often useful to adjust the
scale limits. In order to do this, make sure the Thermal Image radio button is selected. To
adjust the upper or lower limits, click and drag the appropriate arrow at the edge of the red
portion of the bar. To keep the same range span but change the limits, you can drag the
whole red section of the bar left (colder) or right (warmer).
To go back to the original scale, select the Restore Original Image button.
Figure 62. Sample Image at Original Scale Limits
Jan 31st, 2005 - 74 -
Page 75

Figure 63. Sample Image After Increasing Scale Limits
Isotherms
As indicated in the section above, the limit bar indicates the temperature range your Ti30
imager is capable of measuring. However, when the Isotherm radio button is selected, the
red portion of the bar indicates the temperature range that will be “highlighted” in red in the
thermal scene.
Changing of the limits and the interval is done the same way for isotherms as it is for scale
limits—by moving the limit arrows or the red portion of the limit bar.
Jan 31st, 2005 - 75 -
Page 76

Figure 64. Sample Image at Original Isotherm Setting
Additional Image Analysis Tools
Finally, you can further analyze the image under different Emissivity and Reflected
Temperature conditions by changing those values on the left side of the screen. This does
not affect the emissivity value of the original image.
You can also change the name of the image and add comments in the image view tab. To
return to session view, simply select the Return to Session View button. To look at
additional images with larger location numbers than the current image, select the Next Image
button showing a right hand facing arrow. To look at additional images with smaller
location numbers than the current image, select the Previous Image button showing a left
hand facing arrow.
You can also export the image in various graphical formats by selecting Data Analysis from
the menu, Image and Export Image. Or you can place the cursor over the image; click the
right mouse button and select copy image. You can then paste the image into another
application (e.g. Microsoft Power Point or Word).
Jan 31st, 2005 - 76 -
Page 77

Once you have reviewed the image data at this level, you can proceed to other views of the
data.
The Temperature Table Tab
Clicking on the Temperature Table tab reveals a pixel view of all the data in the image (120
rows x 160 columns or 19,200 pixels. An example is shown below.
Figure 65. The Temperature Table
This data can be saved as a .txt file, for import into a spreadsheet program (tab delimited
format for MS Excel) for your own in-depth analysis. Simply select Data Analysis from the
menu list, Temperature Table and Export Temperature Table.
The Profile Tab
There are four quadrants on the profile tab view: an interactive radiometric thermal image
on the upper left hand corner, to the right – a vertical profile of temperature, below – a
horizontal profile of temperature and in the lower right hand corner - a table of temperature
values for both the horizontal and vertical profiles.
Jan 31st, 2005 - 77 -
Page 78

Click on any portion of the thermal image on the top for the exact temperature reading at
that spot. As you do this, you will see that the graph below changes, reflecting the new x and
y axes as you move around the image.
Under the Data Analysis menu, selecting Temperature Profiles will offer two options. The
first is to export a .txt file for import into a spreadsheet program (tab delimited format for
MS Excel) for your own in-depth analysis. The second option is to export the image and
charts as a .bmp (bitmap) file for insertion into another program.
Figure 66. The Profile Tab
The Histogram Tab
The Histogram tab provides a summary of the pixel data presented on the previous
screens.
The histogram displays temperature values as either a percentage of the all temperature
values captured in a given thermal scene, or by number of representative pixels in the
thermal scene.
Jan 31st, 2005 - 78 -
Page 79

To view a subset of the data, you may select Limits on the Data Analysis > Histogram >
Limits menu, and enter the specific maximum and minimum temperatures for the data you
are interested in graphing.
Figure 67. The Histogram Tab – Changing the Histogram Limits
If you wish to use the chart or chart data in another program, you may select Copy on the
Data Analysis > Histogram > Copy menu. The information will be saved to your Windows
clipboard, and can then be pasted into Microsoft Word or Excel or other compatible
program, using either the Paste or Paste Special command.
The Menu Bar
Now that you’re familiar with the concepts in the four tabs, you’ll quickly understand the
choices offered on the menu bar. Each menu item is briefly described below.
Jan 31st, 2005 - 79 -
Page 80

File
Create a New Folder
Creates a new folder, naming it according to the date and time. The name is highlighted and
editable, so you may rename it according to your own naming conventions.
Note:
You will not see the new folder unless you are in Session View, with the tree
structure found on the left side of the screen.
Download a Session from Imager
With the Ti30 imager connected through the USB connection on the computer, allows for
the download of images from the imager to the computer for storage, analysis and report
creation using InsideIR.
Upload a Session to Imager
Creates a new folder, naming it according to the date and time. The name is highlighted and
editable, so you may rename it according to your own naming conventions.
Set Date and Time in Imager
Creates a new folder, naming it according to the date and time. The name is highlighted and
editable, so you may rename it according to your own naming conventions.
Display Imager Information
Product-specific information about each Ti30 imager you have used with a specific
computer. This is useful when contacting the factory for service information. It is also useful
to use the name of the individual units at the highest level in your directory structure,
keeping all images stored by a single unit in the same folder.
Clear Images in Imager
Creates a new folder, naming it according to the date and time. The name is highlighted and
editable, so you may rename it according to your own naming conventions.
Compact Database
Creates a new folder, naming it according to the date and time. The name is highlighted and
editable, so you may rename it according to your own naming conventions.
Exit
Quits the application.
Jan 31st, 2005 - 80 -
Page 81

View
Image View
From session view, selecting a thumbnail image and choosing image view takes you to
the image view screen for the selected image.
Temperature Table View
From session view, selecting a thumbnail image and choosing temperature table view
takes you to the temperature table for the selected image.
Temperature Profile View
From session view, selecting a thumbnail image and choosing temperature profile view
takes you to the temperature profile screen for the selected image.
Histogram View
From session view, selecting a thumbnail image and choosing histogram view takes you
to the histogram for the selected image.
Image Properties
Temperature Scale
Fahrenheit
Displays temperatures in the Fahrenheit scale.
Celsius
Displays temperatures in the Celsius scale.
Palette
Original
Resets specific image to the palette with which the image was originally captured.
Gray
Displays selected image in gray scale
Rainbow
Displays selected image in the Rainbow palette
Ironbow
Displays selected image in the Ironbow palette
Jan 31st, 2005 - 81 -
Page 82

Data Analysis
Note:
The Data Analysis menu items are only active when in the corresponding View.
Image
Export Image
Allows you to save an image for use with another application in any of the following file
formats:
.bmp
.jpg
.gif
.png
.tiff
.wmf
.exif
.emf
Note:
When using this option, only the image is saved—the data is not.
Temperature Table
Export Temperature Table (.txt file)
Allows you to export the underlying pixel data from a thermal scene to a .txt file for
import into a spreadsheet program, allowing you to do your own in-depth analysis.
Temperature Profiles
Export Temperature Profiles Data (.txt file)
Saves the temperature profile data to a .txt file for import into a spreadsheet
program, allowing you to do your own in-depth analysis.
Export Image and Charts (.bmp file)
Saves the image and charts from the Temperature Profile tab to your Windows
clipboard, and can then be pasted into Word or Excel, using either the Paste or
Paste Special command.
Histogram
Copy Chart
Jan 31st, 2005 - 82 -
Page 83

Saves the chart to your Windows clipboard, and can then be pasted into Word or
Excel, using either the Paste or Paste Special command.
Pixel Data
Displays temperature values as number of representative pixels in the thermal scene.
Percentage Data
Displays temperature values as a percentage of the all temperature values captured in
a given thermal scene.
Limits
Allows you to view a subset of the data by entering the specific maximum and
minimum temperatures for the data you are interested in graphing.
Jan 31st, 2005 - 83 -
Page 84

Report
Create Report
Generates a report form, pre-populating data fields with captured data from the given
location. See Reporting Your Findings below for additional reporting details.
Help
Contents
Displays complete contents of this users manual.
About InsideIR
Displays copyright information and software version number.
Language
Allows you to select your language preference from English, German, French, Spanish,
Portuguese, Japanese, Chinese, Russian, Italian or Swedish.
Note:
If you select a new language, you must quit the application and restart in order for
the change to take effect. A dialog box will appear warning you that the application
will end in order to make this language change. You can choose to proceed or
cancel your selection.
Reporting Your Findings
The Ti30 imager provides report forms for you to use in reporting your findings. To
generate a report, you must first select an image from a given location. Then select Report
from the Menu Bar and choose Create Report from the drop down list.
Jan 31st, 2005 - 84 -
Page 85

Figure 68. The Thermographic Report
The report form is entitled “Thermographic Report.” Some data is filled in for you with
known data from the image file so you don’t have to copy the information into the record.
Other text fields will be populated with the last information entered and saved from the
previous report. In this way, if you are creating multiple, related reports, you don’t have to
keep entering the same information over and over again. If you would like to clear all text
fields and start fresh, simply select the Clear all text fields button at the top of the report.
By default, a Fluke logo appears in the logo field in the upper right hand corner of the
report. If you would prefer to place your own logo in this space, simply select the Delete
Logo button and then select the Insert Logo button and browse for the graphic file
containing your desired logo. You will only have to do this one time, after which your logo
becomes the default logo for this field.
You may also attach an additional visual image (such as a digital photograph) to the report
by clicking the Insert Image button. The Delete Image button removes the selected
image.
Once complete, this report can be previewed by selecting Report > Preview from the menu
bar. A new window will appear displaying the report as it will appear if printed. Several
icons appear at the top of this window, allowing you to print the report, refresh the view,
export the report in either .doc, .xls, .pdf or .rtf formats, zoom and search for text.
Jan 31st, 2005 - 85 -
Page 86

Jan 31st, 2005 - 86 -
Page 87

Appendix A - Technical Reference
Imager Accuracy Chart
The following graph shows the measurement accuracy for a typical instrument over the
measurement range of 0 – 250ºC. The heavy lines show the specified accuracy.
4
2
0
2
READING ERROR [C]
4
0 50 100 150 200 250
SOURCE TEMPERATURE [C]
Specification
Measured Data
Jan 31st, 2005 - 87 -
Page 88

Imager Reading Error vs Source D:S
The following example uses the above Typical Reading Error vs. Source D/S graph:
A 5" diameter source (Size = 5) at a Distance of 50" has D/S = 50/5 = 10.
According to the above graph the imager would read less than 1% low in
temperature (as shown by the dashed line) for this size target.
Typical Emissivity Values
The following tables provide references for estimating emissivity and can be used when the
user does not have the means or the time to determine the emissivity value experimentally.
Emissivity values shown in the tables are only approximate. Any or all of the following
parameters can affect the emissivity of an object:
1. Temperature
2. Angle of measurement
3. Geometry (plane, concave, convex, etc.)
4. Thickness
5. Surface quality (polished, rough, oxidized, sandblasted)
6. Spectral region of measurement
7. Transmissivity (i.e., thin film plastics)
Note
1:
Note
2:
Jan 31st, 2005 - 88 -
These tables are to be used as a guide only, as emissivity changes with temperature,
viewing angle, wavelength, target geometry and surface finish.
Your Ti30 thermal imager measures infrared energy in the 7 – 14 µm range.
Page 89

Table 1. Emissivity Values for Metals
Material Emissivity
1.0µm 1.6µm 8-14µm
Aluminum
Unoxidized 0.1-0.2 0.02-0.2 n.r.
Oxidized 0.4 0.4 0.2-0.4
Alloy A3003,
Oxidized n.r. 0.4 0.3
Roughened 0.2-0.8 0.2-0.6 0.1-0.3
Polished 0.1-0.2 0.02-0.1 n.r.
Brass
Polished 0.8-0.95 0.01-0.05 n.r.
Burnished n.r. n.r. 0.3
Oxidized 0.6 0.6 0.5
Chromium 0.4 0.4 n.r.
Copper
Polished n.r. 0.03 n.r.
Roughened n.r. 0.05-0.2 n.r
Oxidized 0.2-0.8 .2-0.9 0.4-0.8
Electrical Terminal Blocks n.r. n.r. 0.6
Gold 0.3 0.01-0.1 n.r.
Haynes Alloy 0.5-0.9 0.6-0.9 0.3-0.8
Inconel
Oxidized 0.4-0.9 0.6-0.9 0.7-0.95
Sandblasted 0.3-0.4 0.3-0.6 0.3-0.6
Electropolished 0.2-0.5 0.25 0.15
Iron
Oxidized 0.4-0.8 0.5-0.9 0.5-0.9
Unoxidized 0.35 0.1-0.3 n.r.
Rusted n.r. 0.6-0.9 0.5-0.7
Molten 0.35 0.4-0.6 n.r.
Iron, Cast
Oxidized 0.7-0.9 0.7-0.9 0.6-0.95
Unoxidized 0.35 0.3 0.2
Molten 0.35 0.3-0.4 0.2-0.3
Iron, Wrought
Dull 0.9 0.9 0.9
Lead
Polished 0.35 0.05-0.2 n.r.
Rough 0.65 0.6 0.4
Oxidized n.r. 0.3-0.7 0.2-0.6
Magnesium 0.3-0.8 0.05-0.3 n.r.
Mercury n.r. 0.05-0.15 n.r.
Molybdenum
Jan 31st, 2005 - 89 -
Page 90

Material Emissivity
1.0µm 1.6µm 8-14µm
Oxidized 0.5-0.9 0.4-0.9 0.2-0.6
Unoxidized 0.25-0.35 0.1-0.35 0.1
Monel (Ni-Cu) 0.3 0.2-0.6 0.1-0.14
Nickel
Oxidized 0.8-0.9 0.4-0.7 0.2-0.5
Electrolytic 0.2-0.4 0.1-0.3 n.r.
Platinum
Black n.r. 0.95 0.9
Silver n.r. 0.02 n.r.
Steel
Cold-Rolled 0.8-0.9 0.8-0.9 0.7-0.9
Ground Sheet n.r. n.r. 0.4-0.6
Polished Sheet 0.35 0.25 0.1
Molten 0.35 0.25-0.4 n.r.
Oxidized 0.8-0.9 0.8-0.9 0.7-0.9
Stainless 0.35 0.2-0.9 0.1-0.8
Tin (Unoxidized) 0.25 0.1-0.3 n.r.
Titanium
Polished 0.5-0.75 0.3-0.5 n.r.
Oxidized n.r. 0.6-0.8 0.5-0.6
Tungsten n.r. 0.1-0.6 n.r.
Polished 0.35-0.4 0.1-0.3 n.r.
Zinc
Oxidized 0.6 0.15 0.1
Polished 0.5 0.05 n.r.
Table 2. Emissivity Values for Non-Metals
Material Emissivity
1.0µm 1.6µm 8-14µm
Asbestos 0.9 0.9 0.95
Asphalt n.r. 0.95 0.95
Basalt n.r. 0.7 0.7
Carbon
Unoxidized 0.8-0.95 0.8-0.9 0.8-0.9
Graphite 0.8-0.9 0.7-0.9 0.7-0.8
Carborundum n.r. 0.9 0.9
Ceramic 0.4 0.85-0.95 0.95
Clay n.r. 0.85-0.95 0.95
Concrete 0.65 0.9 0.95
Cloth n.r. 0.95 0.95
Glass
Plate n.r. 0.98 0.85
Jan 31st, 2005 - 90 -
Page 91

Material Emissivity
1.0µm 1.6µm 8-14µm
“Gob” n.r. 0.9 n.r.
Gravel n.r. 0.95 0.95
Gypsum n.r. 0.4-0.97 0.8-0.95
Ice n.r. — 0.98
Limestone n.r. 0.4-0.98
Paint (non-Al.) — 0.9-0.95 0.9-0.95
Paper (any color) n.r. 0.95 0.95
Plastic (opaque, over 20 mils) n.r. 0.95 0.95
Rubber n.r. 0.9 0.95
Sand n.r. 0.9 0.9
Snow n.r. — 0.9
Soil n.r. — 0.9-0.98
Water n.r. — 0.93
Wood, Natural n.r. 0.9-0.95
To optimize surface temperature measurement accuracy consider the following:
1. Determine the object emissivity for the spectral range of the instrument to be used for
the measurement.
2. Avoid reflections by shielding object from surrounding high temperature sources.
3. For higher temperature objects use shorter wavelength instruments, whenever possible.
4. For semi-transparent materials such as plastic film and glass, assure that the background
is uniform and lower in temperature than the object.
5. Hold instrument perpendicular to surface whenever emissivity is less than 0.9. In all
cases, do not exceed angles more than 30 degrees from incidence.
Jan 31st, 2005 - 91 -
Page 92

Appendix B – Infrared Theory Q&A
Q. Why use noncontact infrared thermometers?
A. Noncontact infrared (IR) thermometers use infrared technology to quickly and
conveniently measure the surface temperature of objects. They provide fast
temperature readings without physically touching the object. The temperature is
shown on the LCD display.
Lightweight, compact, and easy-to-use, IR thermometers and thermal imagers can
safely measure hot, hazardous, or hard-to-reach surfaces without contaminating or
damaging the object. Also, infrared thermometers can provide several readings per
second, as compared to contact methods where each measurement can take several
minutes.
Q. How does IR work?
A. IR thermometers capture the invisible infrared energy naturally emitted from all
objects. Infrared radiation is part of the electromagnetic spectrum, which includes
radio waves, microwaves, visible light, ultraviolet, gamma, and X-rays.
Infrared falls between the visible light of the spectrum and radio waves. Infrared
wavelengths are usually expressed in microns with the infrared spectrum extending
from 0.7 microns to 1000 microns. In practice, the 0.7 to 14 micron band is used for
IR temperature measurement.
Jan 31st, 2005 - 92 -
Page 93

Q. How to assure accurate temperature measurement?
A. A solid understanding of infrared technology and its principles lies behind
accurate temperature measurement. When the temperature is measured by a noncontact device the IR energy emitted from the measured object passes through the
optical system of the thermometer or thermal imager and is converted to an electrical
signal at the detector. This signal is then displayed as a temperature reading and/ or
thermal image. There are several important factors that determine accurate
measurement. The most important factors are emissivity, distance to spot ratio, and
field- of-view.
Emissivity
All objects reflect, transmit and emit energy. Only the emitted energy indicates the
temperature of the object. When IR thermometers or thermal imagers measure the
surface temperature they sense all three kinds of energy, therefore all thermometers
have to be adjusted to read emitted energy only. Measuring errors are often caused
by IR energy being reflected by light sources.
Some IR thermometers and thermal imagers allow you to change the emissivity in
the unit. The value of emissivity for various materials can be looked up in published
emissivity tables.
Other units have a fixed, pre-set emissivity of 0.95, which is the emissivity value for
most organic materials and painted or oxidized surfaces. If you are using a
thermometer or thermal imager with a fixed emissivity to measure the surface
Jan 31st, 2005 - 93 -
Page 94

temperature of a shiny object you can compensate by covering the surface to be
measured with masking tape or flat black paint. Allow time for the tape or paint to
reach the same temperature as the material underneath. Measure the temperature of
the taped or painted surface. That is the true temperature.
Distance to spot ratio
The optical system of an infrared thermometer collects the infrared energy from a
circular measurement spot and focuses it on the detector. Optical resolution is
defined by the ratio of the distance from instrument to the object compared to the
size of the spot being measured (D:S ratio). The larger the ratio number the better
the instrument’s resolution, and the smaller the spot size that can be measured. The
laser sighting included in some instruments only helps to aim at the measured spot.
A recent innovation in infrared optics is the addition of a Close Focus feature, which
provides accurate measurement of small target areas without including unwanted
background temperatures.
Field-of-view.
Make sure that the target is larger than the spot size the unit is measuring. The
smaller the target, the closer you should be to it. When accuracy is critical make sure
Jan 31st, 2005
- 94 -
Page 95

that the target is at least twice as large as the spot size.
Q. How to take temperature measurement?
A. To take a temperature measurement, just point the unit at the object you wish to
measure. Be sure to consider distance-to-spot size ratio and field of view. There are
important things to keep in mind while using infrared thermometers:
1. Measure surface temperature only. The IR thermometer cannot measure
internal temperatures.
2. Do not take temperature measurement through glass. Glass has very
distinctive reflection and transmission properties that do not allow accurate
infrared temperature reading. Infrared thermometers are not recommended for
use in measuring shiny or polished metal surfaces (stainless steel, aluminum, etc.).
(See Emissivity.)
3. Watch for environmental conditions. Steam, dust, smoke, etc., can prevent
accurate measurement by obstructing the unit’s optics.
4. Watch for ambient temperatures. If the thermometer is exposed to abrupt
ambient temperature differences of 10 degrees or more, allow it to adjust to the
new ambient temperature for at least twenty minutes.
Q. What are the most popular applications?
A. Non-contact thermometers have many uses. The most popular include:
1. Predictive and Preventive Industrial Maintenance: check transformers,
electrical panels, connectors, switchgear, rotating equipment, furnaces and much
more.
2. Automotive: Diagnose cylinder heads and heating/cooling systems.
3. HVAC/R: Monitor air stratification, supply/return registers and furnace
performance.
4. Food Service & Safety: Scan holding, serving, and storage temperatures.
5. Process Control & Monitoring: check process temperature of steel, glass,
plastics, cement, paper, food & beverage.
For additional information on applications for non-contact IR thermometers visit our
website at
www.fluke.com/thermography.
Jan 31st, 2005 - 95 -
Page 96

Glossary
Absolute Zero
The temperature (0 Kelvin) of an object defined by the theoretical condition where the
object has zero energy.
Accuracy
Maximum deviation, expressed in temperature units, or as a percentage of the temperature
reading, or as a percentage of the full scale temperature value, or as a percentage of the target
temperature, indicating the difference between a temperature reading given by an instrument
under ideal operating conditions, and the temperature of a calibration source (per the ASTM
standard test method E 1256-88).
Ambient Derating
Refer to Temperature Coefficient.
Ambient Operating Range
Range of the ambient temperature conditions over which the thermometer is designed to
operate.
Ambient Temperature
Ambient temperature is the room temperature or temperature surrounding the instrument.
Ambient Temperature Compensation (TAMB)
Refer to Reflected Energy Compensation.
ASTM
ASTM is an abbreviation for American Society for Testing and Materials.
Atmospheric Windows
The Atmospheric Windows is the infrared spectral bands in which the atmosphere best
transmits radiant energy. Two pre-dominant windows are located at 2-5 µm and at 8-14 µm.
Jan 31st, 2005 - 96 -
Page 97

Background Temperature
Temperature behind and surrounding the target, as viewed from the instrument.
Blackbody
A perfect emitter; an object that absorbs all the radiant energy incident on it at all
wavelengths and reflects and transmits none. A surface with emissivity of unity (1.00).
°C (Celsius)
Temperature scale based on 0° (zero degrees) as the freezing point of water, and 100° as the
vaporization point of water, at standard pressure.
32F
C
8.1
Calibration
A methodical measurement procedure to determine all the parameters significantly affecting
an instrument’s performance.
Calibration Source
A source (blackbody, hot plate, etc.) of known and traceable temperature and emissivity.
Usually NIST traceable in the USA, with other recognized standards available for
international customers.
Colored Body
See Non-Gray Body.
D:S
Distance to size ratio. See Optical Resolution.
Detector
A transducer which produces a voltage or current proportional to the IR energy incident
upon it. See also thermopile, pyroelectric, and Si detectors.
DIN
Deutsches Institut für Normung (DIN) is the German standard for many instrumentation
products.
Jan 31st, 2005 - 97 -
Page 98

Display Resolution
The level of precision to which a temperature value can be displayed, usually expressed in
degrees or tenths of degrees.
Drift
The change in instrument indication over a long period of time, not caused by external
influences on the device (per the ASTM standard test method E 1256-88).
EMC
Electro-Magnetic Compatibility is the resistance to electrical signal disturbances within IR
thermometers.
Emissivity
Emissivity is the ratio of infrared energy radiated by an object at a given temperature and
spectral band to the energy emitted by a perfect radiator (blackbody) at the same
temperature and spectral band. The emissivity of a perfect blackbody is unity (1.00).
EMI/RFI Noise
Electro-Magnetic Interference/Radio Frequency Interference (EMI and RFI) may cause
disturbances to electrical signals within IR thermometers. EMI and RFI noise is most
commonly caused by devices by switching motors (air conditioners, power tools,
refrigeration systems, etc.).
°F (Fahrenheit)
Temperature scale where
.
67.459R32)8.1C(F
Far Field
A measured distance substantially greater than the focus distance of the instrument; typically
greater than 10 times the focus distance.
Field of View (FOV)
The region, at the target, measured by the IR thermometer. Typically presented by giving the
spot diameter as a function of distance from the instrument. Also presented as the angular
size of the spot at the focus point.
See Optical Resolution.
Jan 31st, 2005 - 98 -
Page 99

Focus Point (or Distance)
The distance from the instrument where the optical resolution is greatest.
Full Scale
The maximum of the temperature range or output signal.
Full Scale Accuracy
A convention for expressing the accuracy as percentage of an instrument’s (highest) fullscale temperature.
Gray Body
A radiating object whose emissivity is in constant ratio (not unity) at all wavelengths to that
of a blackbody at the same temperature, and does not transmit infrared energy.
HAL
High Alarm. Units with this feature can sound an alarm when they sense that a user-defined
high temperature has been reached.
Hertz (Hz)
Units in which frequency is expressed. Synonymous with cycles per second.
Infrared (IR)
The portion of the electromagnetic spectrum extending from the far red visible at
approximately 0.75 µm, out to 1000 µm. However, because of instrument design
considerations and the atmospheric windows, most infrared measurements are made
between 0.75 µm and 20 µm.
Infrared Thermometer
An instrument that converts incoming IR radiation from a spot on a target surface to a
measurement value that can be related to the temperature of that spot.
K (Kelvin)
The unit of absolute or thermodynamic temperature scale where 0 K is absolute zero and
273.15 K is equal to 0° C. There is no (°) symbol used with the Kelvin scale, and
15.273CK
.
Jan 31st, 2005 - 99 -
Page 100

LAL
Low Alarm. Units with this feature can sound an alarm when they sense that a user-defined
low temperature has been reached.
Laser
Single or dual lasers are used in some units for aiming and/or locating the optimum
temperature measurement point.
LOC
Location. Units with the data-logging feature store data in numbered locations, which can be
recalled and reviewed on the display when necessary.
Loop
A cycle of operations within a selected mode. For example, the RUN Loop cycles through
standard running operations; the LOG Loop cycles through data logging operations; and the
RECALL Loop cycles through stored operations and displays the data.
Micron (or µm)
-6
meters (m), or 0.000001 m.
10
Minimum spot size
The smallest spot an instrument can accurately measure.
Mode
Modes are various user-selectable operations within Loops.
NETD
Noise Equivalent Temperature Difference. Peak to peak system electrical noise normally
measured at the output (display or analog) expressed in °F or °C.
NIST Traceability
Calibration in accordance with and against standards traceable to NIST (National Institute of
Standards and Technology, USA). Traceability to NIST is a means of ensuring that reference
standards remain valid and their calibration remains current.
Jan 31st, 2005 - 100 -
 Loading...